Article

Removal of Ciprofloxacin with Aluminum-Pillared Kaolin Sodium Alginate Beads (CA-Al-KABs): Kinetics, Isotherms, and BBD Model

1
School of Civil Engineering and Architecture, East China Jiaotong University, Nanchang 330013, China
2
Jiangxi Province Key Laboratory of Drinking Water Safety, Nanchang 330013, China
*
Author to whom correspondence should be addressed.
Water 2020, 12(3), 905; https://doi.org/10.3390/w12030905
Submission received: 2 March 2020 / Revised: 18 March 2020 / Accepted: 19 March 2020 / Published: 23 March 2020
(This article belongs to the Section Wastewater Treatment and Reuse)

Abstract

:
In recent years, the problem of water pollution caused by antibiotics has attracted wide attention. The common use of antibiotics represents a threat to both human health and environmental safety. The modification of kaolin clay is promising due to its high efficiency, easy operation, and low cost. In this study, a novel material, aluminum-pillared kaolin sodium alginate beads (CA-Al-KABs), was synthesized by gelling and solidification processes. The structure and chemical properties were characterized by various analytical methods. The influencing factors (such as adsorbent dosage, contacting time, pH, ion strength, temperature, and initial concentration) and adsorption mechanism of ciprofloxacin (CIP) were studied. Furthermore, adsorption kinetics, adsorption isotherms, and a Box–Behnken design (BBD) model were conducted. Moreover, CA-Al-KABs’ adsorption efficiency towards other antibiotics were also evaluated. The adsorption experiments showed that the acidic environment (pH = 4) was more favorable for the adsorption of ciprofloxacin. The adsorption kinetics of ciprofloxacin by CA-Al-KABs microspheres were confirmed to be more suitable with the pseudo-first-order kinetics model. The Langmuir isotherm model showed that the maximum adsorption capacity of CA-Al-KABs microspheres to ciprofloxacin was 68.36 mg/g at 308.15 K. The adsorption driving force of CIP near CA-Al-KABs may be the electrostatic attraction. Further, CIP could also form complexes with Ca2+ and Al—Al—OH on CA-Al-KABs, and thus CIP was attracted to the adsorbent. Adsorption thermodynamics showed that the adsorption process was exothermic, feasible, and spontaneous. In addition, the adsorption performance on other antibiotics indicated CA-Al-KABs’ broad application in the treatment of antibiotic wastewater.

Graphical Abstract

1. Introduction

Due to their common utilization in healthcare and animal feeding [1], antibiotics are considered as one of the important emerging pollutants and thus elicit extensive concern. Water and soil environments are easily deteriorated once they are not treated properly, and the presence of various antibiotics in the environment could pose a threat to ecosystem safety. Thus, the proper treatment of antibiotics is in urgent demand.
Chemical oxidation, photocatalytic degradation, membrane filtration, adsorption, and so on were reported to be utilized for the removal of antibiotics [2]. Among them, adsorption was promising in terms of practical application for its high efficiency, easy operation, and low cost. Furthermore, the adsorption of antibiotics on clays was promising due to the low cost, and has attracted increasing attention.
It is widely accepted that clays such as Kaolin have the advantages of economic cost, abundant availability, and environmental friendliness [3]. It is widely accepted that kaolin is abundant in nature. Kaolin is mainly composed of kaolinite with the chemical formula of Al2Si2O5(OH)4 [4]. The kaolinite was reported to be 1:1 type layer silicate with the structure of a tetrahedral sheet of silica (SiO2) linked with an oxygen atom and octahedral sheet of alumina (Al2O3) [5]. Kaolin’s molecular was estimated weight to be 258.071 gm/mol. The cation exchange capacity of kaolin (the soil’s ability to hold cations by electrical attraction) was measured to be 1–10 meq/100 g with the surface area of 7–30 m2/g [5]. In this way, much effort has been put towards the modification of Kaolin clay for enhancing its adsorption ability. Adekola et al. prepared hematite–kaolin composite for CIP adsorption from aqueous solution, the optimum adsorption capacity was obtained at pH of 5 with the adsorption capacity of 5.3 mg/g [6]. Moreover, a magnetically separable adsorbent (chitosan (CTS)/kaolin/Fe3O4 magnetic microspheres) was previously prepared by emulsion cross-linking for the adsorption of CIP. The highest adsorption capacity of 15 mg/g, the adsorption–desorption experiments of this material were also conducted and suggested the material was promising for removing CIP [7].
For example, graphene hybridized polydopamine-kaolin composite was synthesized as an effective adsorbent for the removal of methylene blue, and achieved the adsorption capacity of 39.663 mg/g [3]. Ibrahim et al. [8] prepared zeolites from kaolin, then they investigated its adsorption behavior towards different heavy metals, such as Cu2+, Cd2+, Cr2+, Ni2+, and Zn2+.
Among the modifications, metal pillared interlayered clays are attracting increasing attention. It was noted that the adsorption capacity of such clay was enhanced to a large extent, and the modified material was economical [9]. Zhou et al. [9] prepared a novel nano iron/zirconium-pillared clinoptilolite (nano Fe/Zr-PC) and observed its efficient adsorption performance of ammonium, phosphate, and cadmium (Cd (II)). Further, single and mixed pillared clay have been prepared to adsorb the inorganic pollutant (e.g., the cadmium, cobalt, and copper) in water [10].
Alginate is a kind of natural polysaccharide, produced by brown algae and bacteria [11]. It is composed of both β-D-mannuronic acid and α-L-guluronic acid, and considered to be efficient in pollutants removal. Furthermore, the combination of alginate and clay could form beads, and thus is easier to separate and reuse.
In this study, aluminum-pillared kaolin sodium alginate beads (CA-Al-KABs) was prepared with local kaolin clays. Then, its morphology was characterized by X-ray diffraction analysis (XRD), scanning electron microscope (SEM) attached with energy dispersive X-ray spectroscopy (XPS), elemental composition analysis (EDS), transmission electron microscope (TEM), thermogravimetric (TG) analysis, and Fourier transform infrared spectrometer (FT-IR). Then, its adsorption capacity towards CIP (CIP) was investigated at different environmental conditions (adsorbent dosage, contacting time, pH, ion strength, temperature and initial concentration). A Box–Behnken design (BBD) model was conducted for the optimal condition. Afterward, the adsorbing mechanism of CIP on CA-Al-KABs was analyzed. CA-Al-KABs’ adsorption efficiency to other antibiotics (norfloxacin and tetracycline) were also evaluated.

2. Materials and Methods

2.1. Fabrication of CA-Al-KABs

2.1.1. Preparation of Na-Kaolin

pH value was not specially adjusted during the preparation. The preparation of Na-kaolin was conducted in neutral conditions. Briefly, kaolin with the amount of 20g was dispersed in 100 mL deionized water and shaken for 8 h before being left to stand for 15min. In this way, kaolin suspension was obtained. The kaolin loss proportion in supernatant accounted for about 40%. The suspension was mixed with 50 mL NaCl solution (1.0 mol/L) and stirred for 12 h. After settling, the supernatant was removed. The solid part was washed with ultrapure water 3 times and then dried at 60 °C for 12 h before being ground to 100–200 mesh. In this way, Na-kaolin was obtained.

2.1.2. Preparation of Al-Kaolin

The preparation of Al-kaolin was conducted in alkaline conditions. With vigorous stirring in a water bath at 60 °C, NaOH solution (0.96 mol/L) with the amount of 50mL was slowly added into 50 mL AlCl3·6H2O (0.4 mol/L) solution and stirred for 20 min. The Al column support solution was obtained.
Then, Na-kaolin with the amount of 2.5 g was dispersed in 100 mL deionized water, and dropwise added into 100 mL Al column support solution (0.2 mol/L), stirred for 22 h, and stood for 12 h. The resulting part was washed with ultrapure water for 3 times, then dried at 60 °C for 12 h before grounded to 100–200 mesh to obtain Al-kaolin.

2.1.3. Preparation of CA-Al-KABs

Briefly, 2 g sodium alginate solid was added to 100 ml deionized water and vigorously stirred for 20 min. Afterwards, the suspension was ultrasonicated for 10 min to remove air bubbles from the solution. The sodium alginate solution with the concentration of 20 g/L was obtained.
Then, 2 g Al-Kaolin was added to 100 mL sodium alginate solution (20 g/L). The mixture was stirred for 20 min before then ultrasonicated for 10 min. It was added to 500 ml calcium chloride solution (0.5 mol/L). The beads were formed under stirring and were stood to harden for 20 min. Spherical beads were obtained after being filtered and washed three times with ultrapure water. The beads were then dried at 60 °C for 12 h.

2.2. Characterizations

The surface morphology of the material was characterized by scanning electron microscope (Gemini, Zeiss300, Jena, Germany) attached with energy dispersive X-ray spectroscopy (EDS, Gemini300, Zeiss Company, Jena, Germany). XRD analysis was performed by X-ray diffractometer (D8 ADVANCE, Bruker, Madison, WI, USA). The thermal stability (TG) of microspheres was analyzed with a synchronous thermogravimetric analyzer (TGA55, TA, New Castle, DE, USA). The change of the functional groups in CA-Al-KABs microspheres before and after tetracycline adsorption were investigated by using the Fourier transform infrared spectrometer (FT-IR, Nicolet-6700, Thermo Fisher Scientific, Waltham, MA, USA) XPS was obtained using an electron spectrometer (ESCALAB 250XI, Thermo Fisher, Waltham, MA, USA).

2.3. Adsorption Experiment

The influence factors of CA-Al-KABs’ adsorption capacity towards CIP were systematically studied through batch adsorption experiments. The factors included the dosage of CA-Al-KABs (0.0 –0.1 g/50 mL), the initial pH of the solution (3–11), contact time (0–1440 min), temperature (288.15 K –308.15 K), initial concentration of CIP (20–140 mg/L), and different ionic strengths. In addition, the adsorption performance of CA-Al-KABs on different antibiotics was also studied. Batch adsorption experiments were performed in a vapor-bathing constant temperature shaker. The accurately weighed CA-Al-KABs and 50 mL CIP solution of a certain concentration were transferred into a 100 mL corked conical flask, and the pH of the solution was adjusted by adding 0.1 mol/L NaOH and HNO3. Then, the flasks were placed in a constant temperature oscillating chamber in a gas bath for oscillation (200 rpm). The maximum adsorption wavelength of CIP was determined to be 277 nm by wavelength scanning and the concentration of CIP solution was measured using a UV-visible spectrophotometer at a wavelength of 277 mm. All experiments including blanks were performed in triplicate, and the correlation values in the figure were average values.
Relevant parameters of CIP adsorption process were calculated by the following formula:
q e = C 0 C e V m ,
R e = C 0 C e C 0 × 100 % ,
where qe (mg/g) and Re (%) represent the adsorption capacity and removal efficiency of CIP by CA-Al-KABs respectively. C0 and Ce are the initial and equilibrium concentrations of CIP respectively. V (L) is the volume of CIP solution, and m (g) is the mass of CA-Al-KABs.
In batch adsorption experiments, the optimal pH was obtained by evaluating the adsorption process at different pH (3–11). Further, CA-Al-KABs of different dosage (0.02, 0.04. 0.06, 0.08, 0.1 g/50 mL) were added to 50 mL CIP solution (20 mg/L) at the optimal pH to determine the optimal dosage. The concentration of CIP was also measured after reacted for different times (0−1440 min) at different temperatures (288.15−308.15 K). The adsorption capacity of CA-Al-KABs at different times was calculated using Equation (3). Furthermore, the adsorption isotherm and thermodynamics at different temperatures were studied by controlling the initial concentration of CIP (20–140 mg/L), and the adsorption time was kept for as long as 24 h to ensure that the adsorption process reached adsorption equilibrium.
q t = C 0 C t V m ,
where qt (mg/g) is the adsorption capacity of CA-Al-KABs at time t, and Ct (mg/L) is the concentration of CIP solution at time t.
In addition, the material was immersed in 0.001 M HCl for 4 h. After four adsorption-desorption cycles, the adsorption capacity of the material can reach about 80%.

3. Results and Discussion

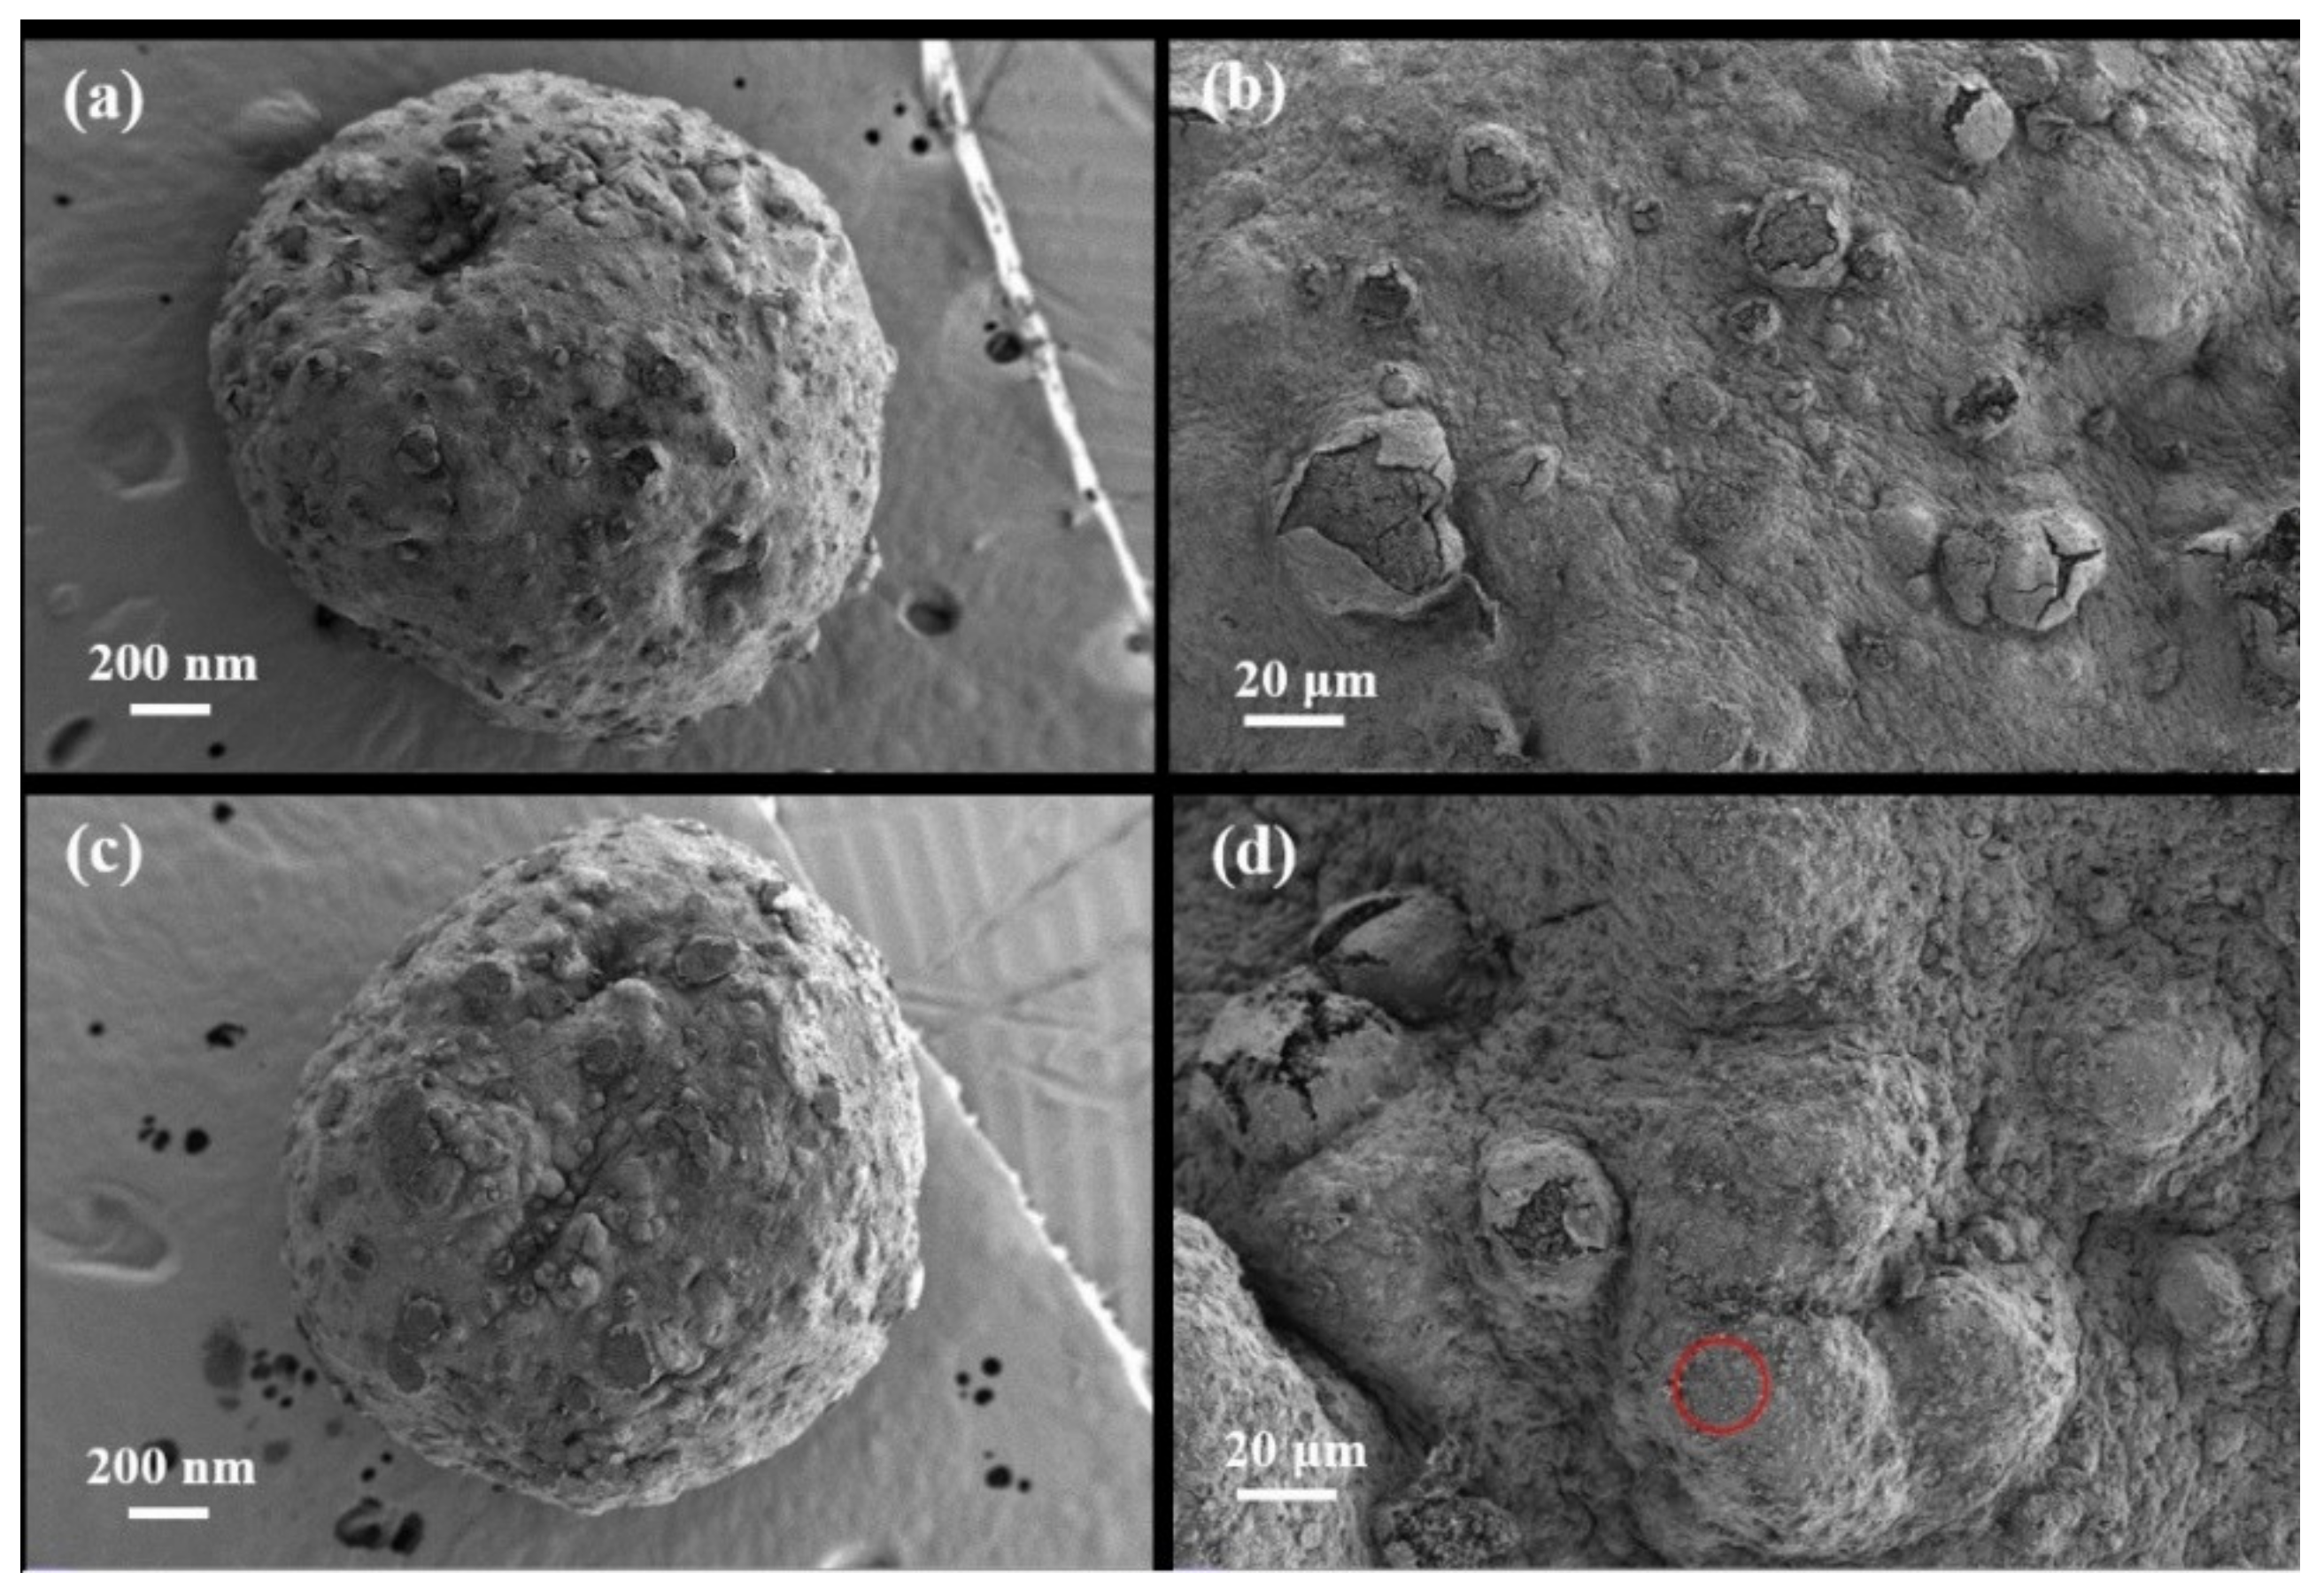
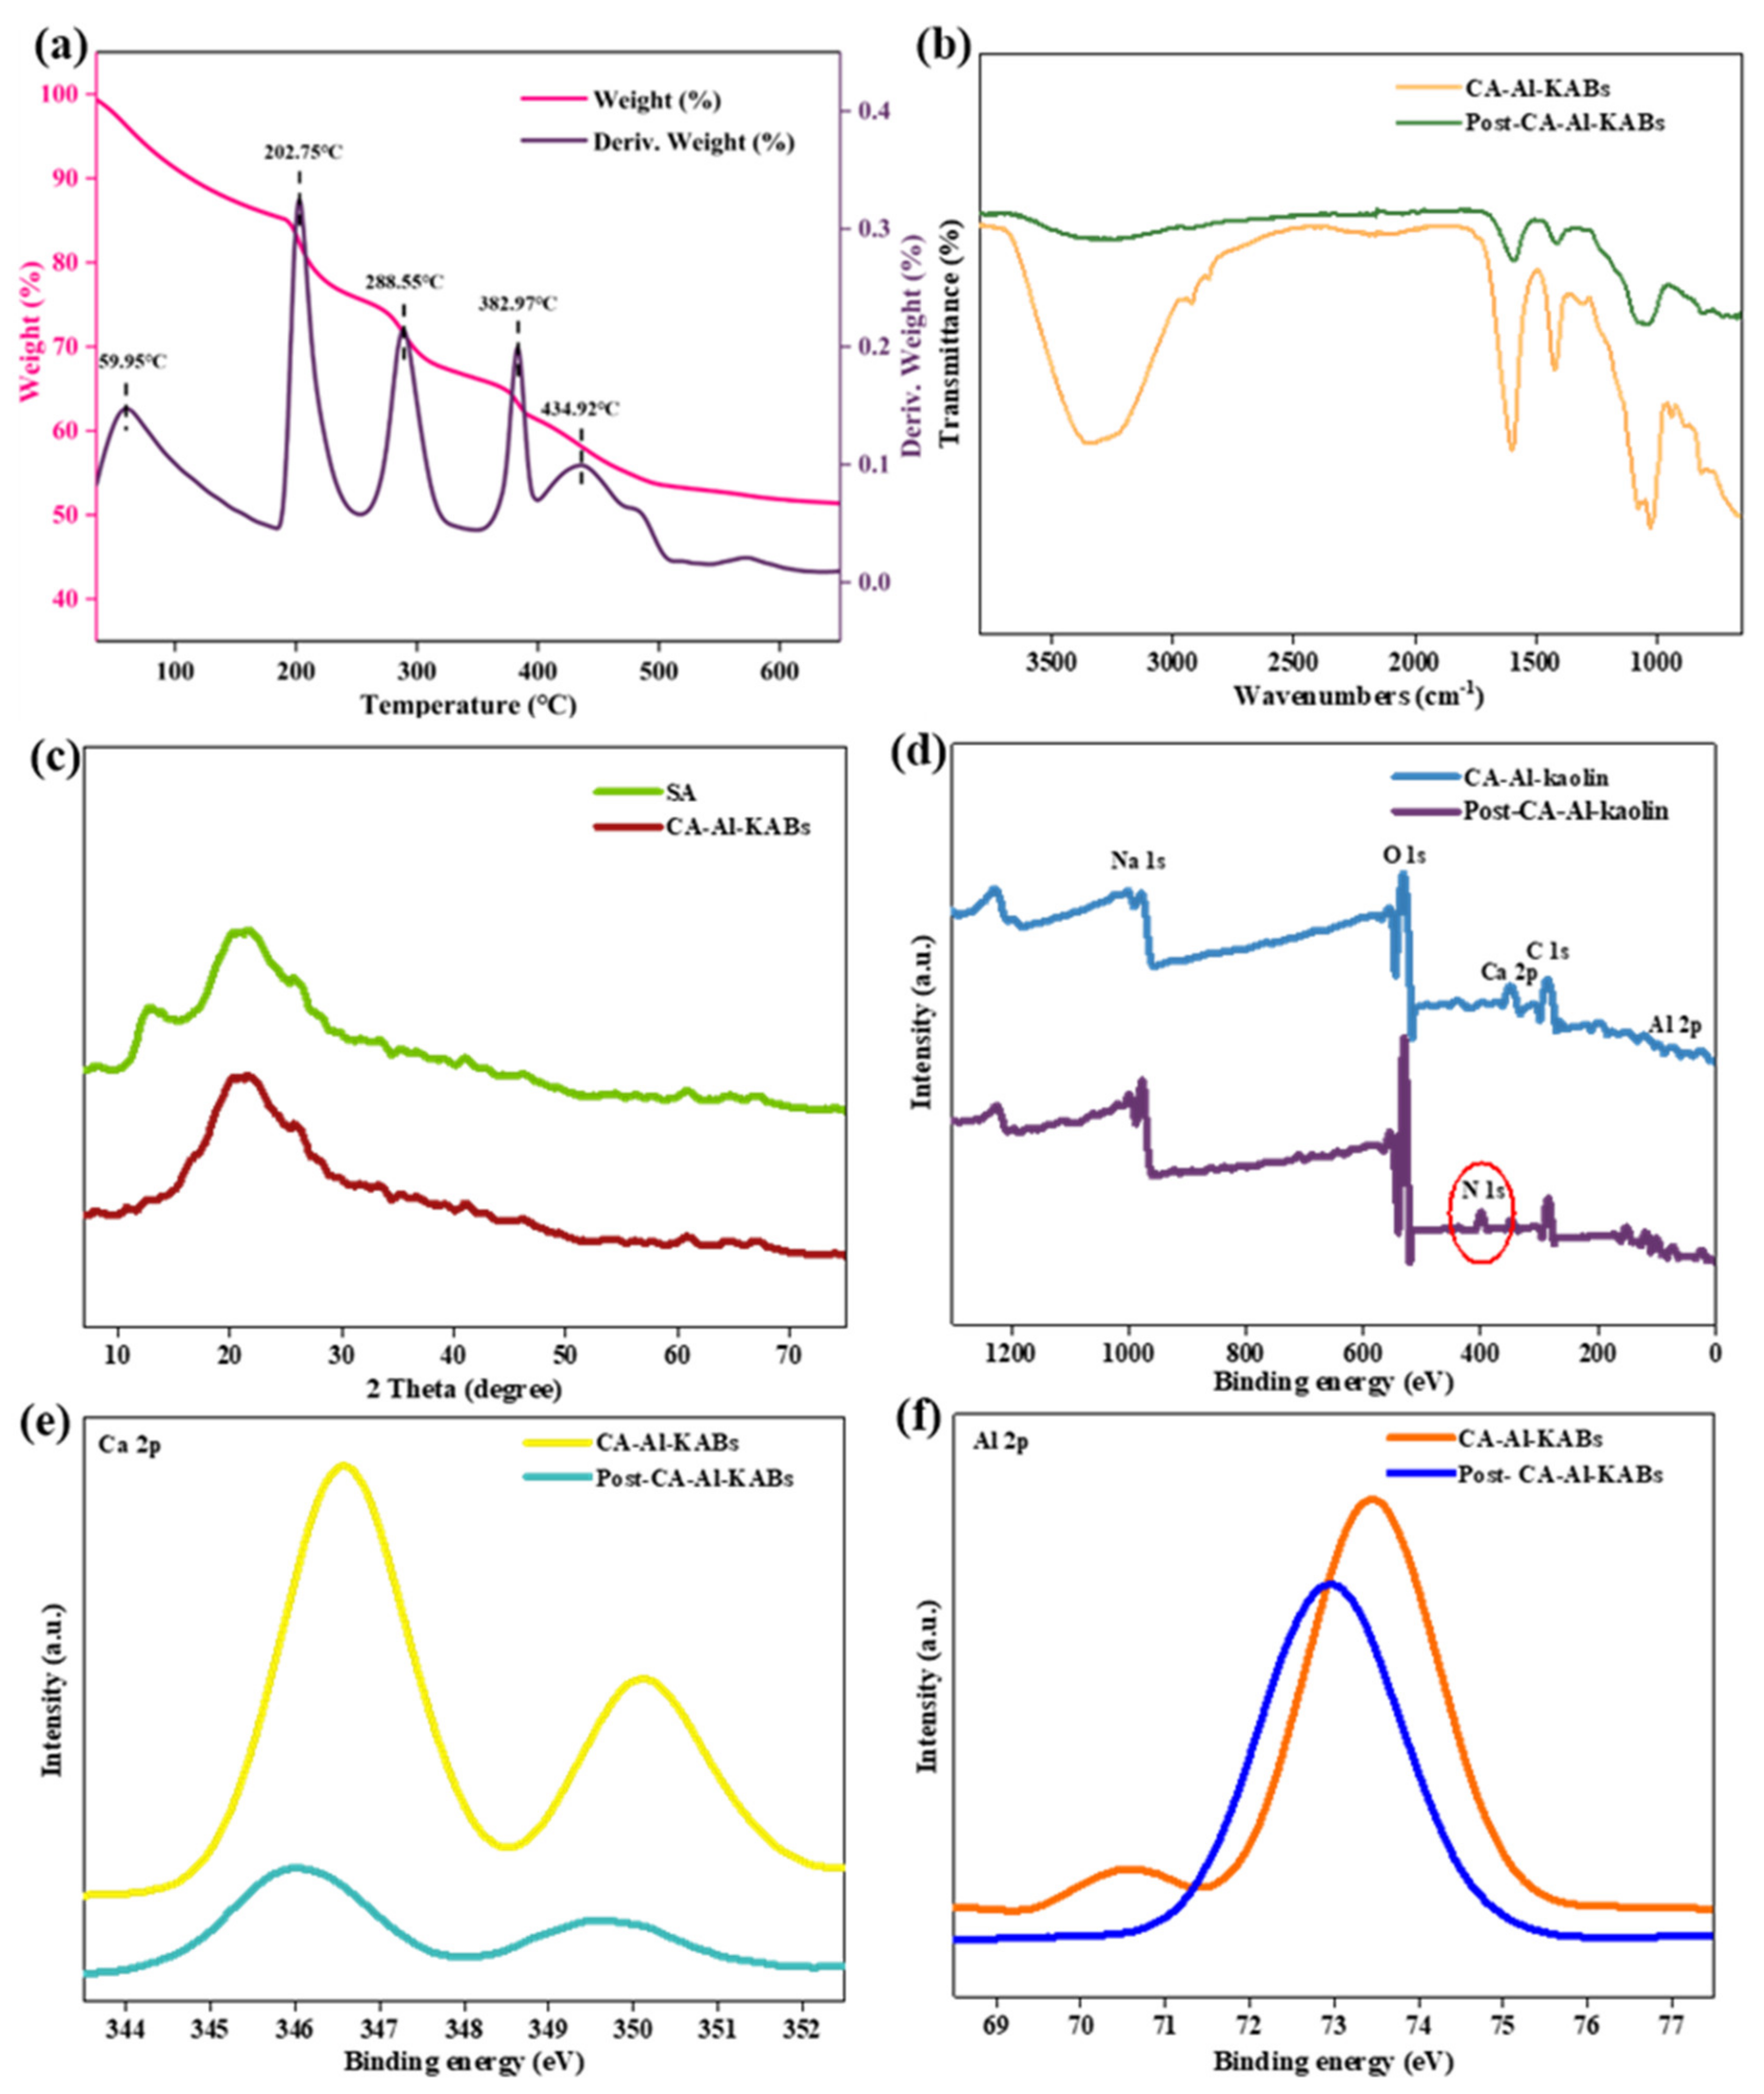
3.1. Characteristics

The overall and partial morphology of CA-Al-KABs before and after CIP adsorption were studied, and the results are shown in Figure 1. It could be observed from Figure 1a that the diameter of the CA-Al-KABs was measured to be around 1.8 mm. The specific surface area of CA-Al-KABs was measured to be 10.595 m2/g. The overall shape of the CA-Al-KABs was regular, and the surface was rough. The uneven surface was covered with countless wrinkles, which led to the increment of the specific surface area. In this way, the contact area and contact opportunity between CIP molecules and CA-Al-KABs were increased. In addition, the pleated voids were filled with a large number of fine particles (Figure 1d), which may be formed by the flocculation of CIP molecules on the surface of CA-Al-KABs by local supersaturation.
EDS was performed on the CA-Al-KABs before and after CIP adsorption, and elemental mapping analysis was also performed. The results are shown in Figure 2. The elemental composition of CA-Al-KABs before adsorption was observed to be C, O, Al, Ca, Na, Si. In spite of C, O, Al, Ca, Na, Si, the unique N element was also observed after the adsorption process, and was closely related to the CIP molecule (molecular formula: C17H18FN3O3). This provided strong evidence for the successful adsorption of CIP on CA-Al-KABs, and further demonstrated the adsorption ability of CA-Al-KABs for CIP molecules.
In order to study the thermal stability of CA-Al-KABs, thermogravimetric (TG) analysis was performed in oxygen. The thermogravimetric curve of CA-Al-KABs was shown in Figure 3a, which reflected the relationship between weight and temperature. It can be seen from Figure 3a that CA-Al-KABs experienced six weightlessness stages as the temperature was increasing. When CA-Al-KABs were thermally decomposed, the first mass loss occurred at 59.95 °C. This was closely related to the evaporation process of surface water and physical adsorption and elimination and volatilization of bound water molecules. Subsequently, some functional groups (such as hydroxyl, carboxyl, ester bonds, etc.) and cation bond bridges had undergone thermal cracking, of which the temperature range was 172.52−233.79 °C. Starting from 412.18 °C, the breaking and decomposition of alginate molecular chain and basic skeleton might occur in the final stage [12,13]. The TG curve reached stability near 511.66 °C and the residual weight was above 51.42%. This was because of the cross-linking of Ca (II) and alginate molecules, indicating the thermal stability of CA-Al-KABs.
The high-resolution FT-IR spectra of CA-Al-KABs before and after adsorption of CIP are shown in Figure 3b. The broad absorption peaks at 3355 cm−1 and 3232 cm−1 corresponded to the O—H tensile vibration (Al—Al—OH) in kaolin and the OH in interlayer water. This was possibly related to the -h characteristic stretching vibration of the alcohol and phenolic hydroxyl groups in the CA-AI-KABs molecular skeleton [14]. It can be seen from Figure 3b that, after the adsorption of CIP by the CA-Al-KABs, the absorption peaks at 3355 cm−1 and 3232 cm−1 significantly decreased and almost disappeared. This was possibly related to the fact that the Al—Al—OH and the layer OH in interstitial water forms a complex with CIP molecules. The absorption peaks of 2932 cm−1 and 2858 cm−1 are mainly derived from the antisymmetric stretching and out-of-plane bending vibration absorption peaks of alkyl C—H in the SA molecular skeleton [15]. The bonds near 1597 cm−1 and 1420 cm−1 corresponded to the strong asymmetric telescopic vibration bond (C=O) and the weakly symmetric telescopic vibration bond (C—O) in the carboxyl group, respectively [16]. Both of the absorption peaks shifted by about 5 cm−1 after the adsorption of CIP, which may be related to the C=O bond in the CIP molecule. The band at 1077 cm−1 is due to the stretching of the ether—C—O, and the band at 1025 cm−1 is due to the stretching of the alcohol—C—O [17].
The XRD pattern was used to verify the crystal structure of the material, and was shown in Figure 3c. The main characteristic peaks of sodium alginate powder appeared near 13.0° and 20.0° [18], while the peak of CA-Al-KABs disappeared at 13.0°. This indicated that sodium alginate was cross-linked with Ca2+ [19].
The change of surface elements in the chemical environment was studied using XPS technology, and the results were shown in Figure 3d. It could be found that, after the adsorption of CIP, a characteristic peak appeared near 400ev in the CA-Al-KABs (Figure 3d), which can be assigned to the characteristic peak of N 1s, indicating that CIP was successfully fixed on the micro-surface of CA-Al-KABs. In order to study the adsorption mechanism of CIP by CA-Al-KABs, the change of Ca element before and after CIP adsorption was studied (Figure 3e). The results showed that after adsorption of CIP, the characteristic peak of Ca 2p significantly decreased and shifted, indicating that Ca2+ was involved in the adsorption process, and the carboxyl and keto groups in CIP may form complexes with Ca2+ [20]. Subsequently, the high-resolution Al 2p spectrum was studied (Figure 3f). It can be seen from the Figure 3f that after adsorption of CIP, the characteristic peak at Al 2p shifted by about 1ev, indicating that Al may also form a complex with CIP [21].

3.2. Effects of Dosage on Adsorption Capacity

Figure 4a shows the influence of different dosages on CIP adsorption of CA-Al-KABs microsphere. It could be seen that with the increase of adsorbent dosage, the adsorption capacity of CA-Al-KABs microsphere to CIP decreased gradually. This might be because increasing the amount of CA-Al-KABs microspheres will lead to an increase in the number of active sites and the total effective specific surface area. However, in the solution of constant concentration, there were too many exposed adsorption sites, such that a large number of adsorption sites did not reach saturation, resulting in the decrease of adsorption capacity per unit mass of adsorbent [22]. However, the removal rate of ciprofloxacin was lower when the dosage of adsorbent was lower. Therefore, in the subsequent experiments, the dosage of adsorbent was 0.04 mg/50 ml, and the removal capacity was also up to (6.93 mg/g).

3.3. Effects of pH on Adsorption Capacity

CIP was an amphoteric organic molecule with weak alkaline dimethylamino and weak acid phenolic hydroxyl. Its acidolysis constants pKa1 and pKa2 were 6.1 and 8.7 respectively [23]. When the pH was less than 6.1, the CIP molecule mainly existed in the form of the cation (CIP+), which was caused by the amine group being protonated [24]. Meanwhile, when the pH was > 8.7, the CIP molecule existed in the form of the anion (CIP) due to the loss of a proton of the carboxyl group. Within the pH range of 6.1−8.7, the pH value of the carboxyl group was higher than pKa1, making the carboxyl group protonated into a negatively charged carboxylate [25]. Therefore, it was necessary to study the effect of initial pH of the solution on CIP adsorption. In order to study the effects of pH on CIP adsorption of CA-Al-KABs, batch adsorption experiments were carried out in the pH range of 3–11. As shown in Figure 4b, the adsorption capacity of CA-Al-KABs to CIP increased slightly and then decreased as the initial pH value of the solution increased. The high adsorption capacity was obtained at low pH of 3 and 4 respectively. This phenomenon could be explained as follows: (1) the zeta potential on the surface of sodium alginate was negative [26], leading to negatively charged CA-Al-KABs’ surface. CIP exists as a cationic form at low pH and thus form electrostatic attraction interaction with CA-Al-KABs. (2) Together with the FT-IR spectral analysis finding that CIP could form complexes with Al−Al−OH in CA-Al-KABs and OH in interlaminar water, CIP in cationic form could better complex with it. (3) COOH groups on CIP could form H-bonding with Al elements of CA-Al-KABs, and the COOH groups on alginate (pKa1 around 4–5) could also interact with the CIP at pH = 4 [27]. When the pH was lower than 4, the zeta potential on the surface of CA-Al-KABs may increase [22], and the negative charge point on the surface decrease, resulting in a slight decrease in the adsorption effect. When pH = 4, the adsorption capacity reached its maximum value (qe = 8.77 mg/g).

3.4. Effects of Iron Strength’s Effect on Adsorption Capacity

A large amount of different salts exist in the actual water environment, leading to the high ionic strength, which affected the adsorption performance of antibiotics. For the purpose of evaluating the anions and cations’ effects on the adsorption performance of CA-Al-KABs to CIP, K+, Na+, Mg2+, Cl, SO42−, and CO32− in the iron strength of 0–0.1 M were investigated in this experiment. As shown in Figure 4c, the adsorption effects of CA-Al-KABs to CIP was inhibited by different cations (K+, Na+, Mg2+). As the concentration of cations in the solution increased, the adsorption capacity of CA-Al-KABs to CIP decreased gradually. Among them, the inhibition of Na+ on the adsorption effect of CIP was the most obvious, and the inhibition of Mg2+ on the adsorption effect of CIP inhibition was the least. Moreover, the low concentration of K+ (0.025 M) promoted the adsorption performance, but as the concentration further increased an inhibition effect was observed. This may be possibly due to the fact that in the structure of CIP, the carboxyl group of the acidic group and the imino group of the basic group adsorbed to the surface of CA-Al-KABs by cation exchange, while the high concentration of cations competed with CIP for the adsorption site. The cations basically occupied the adsorption site of CIP and inhibited the adsorption reaction of CIP. Compared with the influence of the cation strength, the adsorption effect of CA-Al-KABs to CIP changed little under different anion strength (Cl, SO42−, CO32−) (Figure 4d). This suggested that the strength of anion showed fewer significant effects on the adsorption of CIP by CA-Al-KABs.

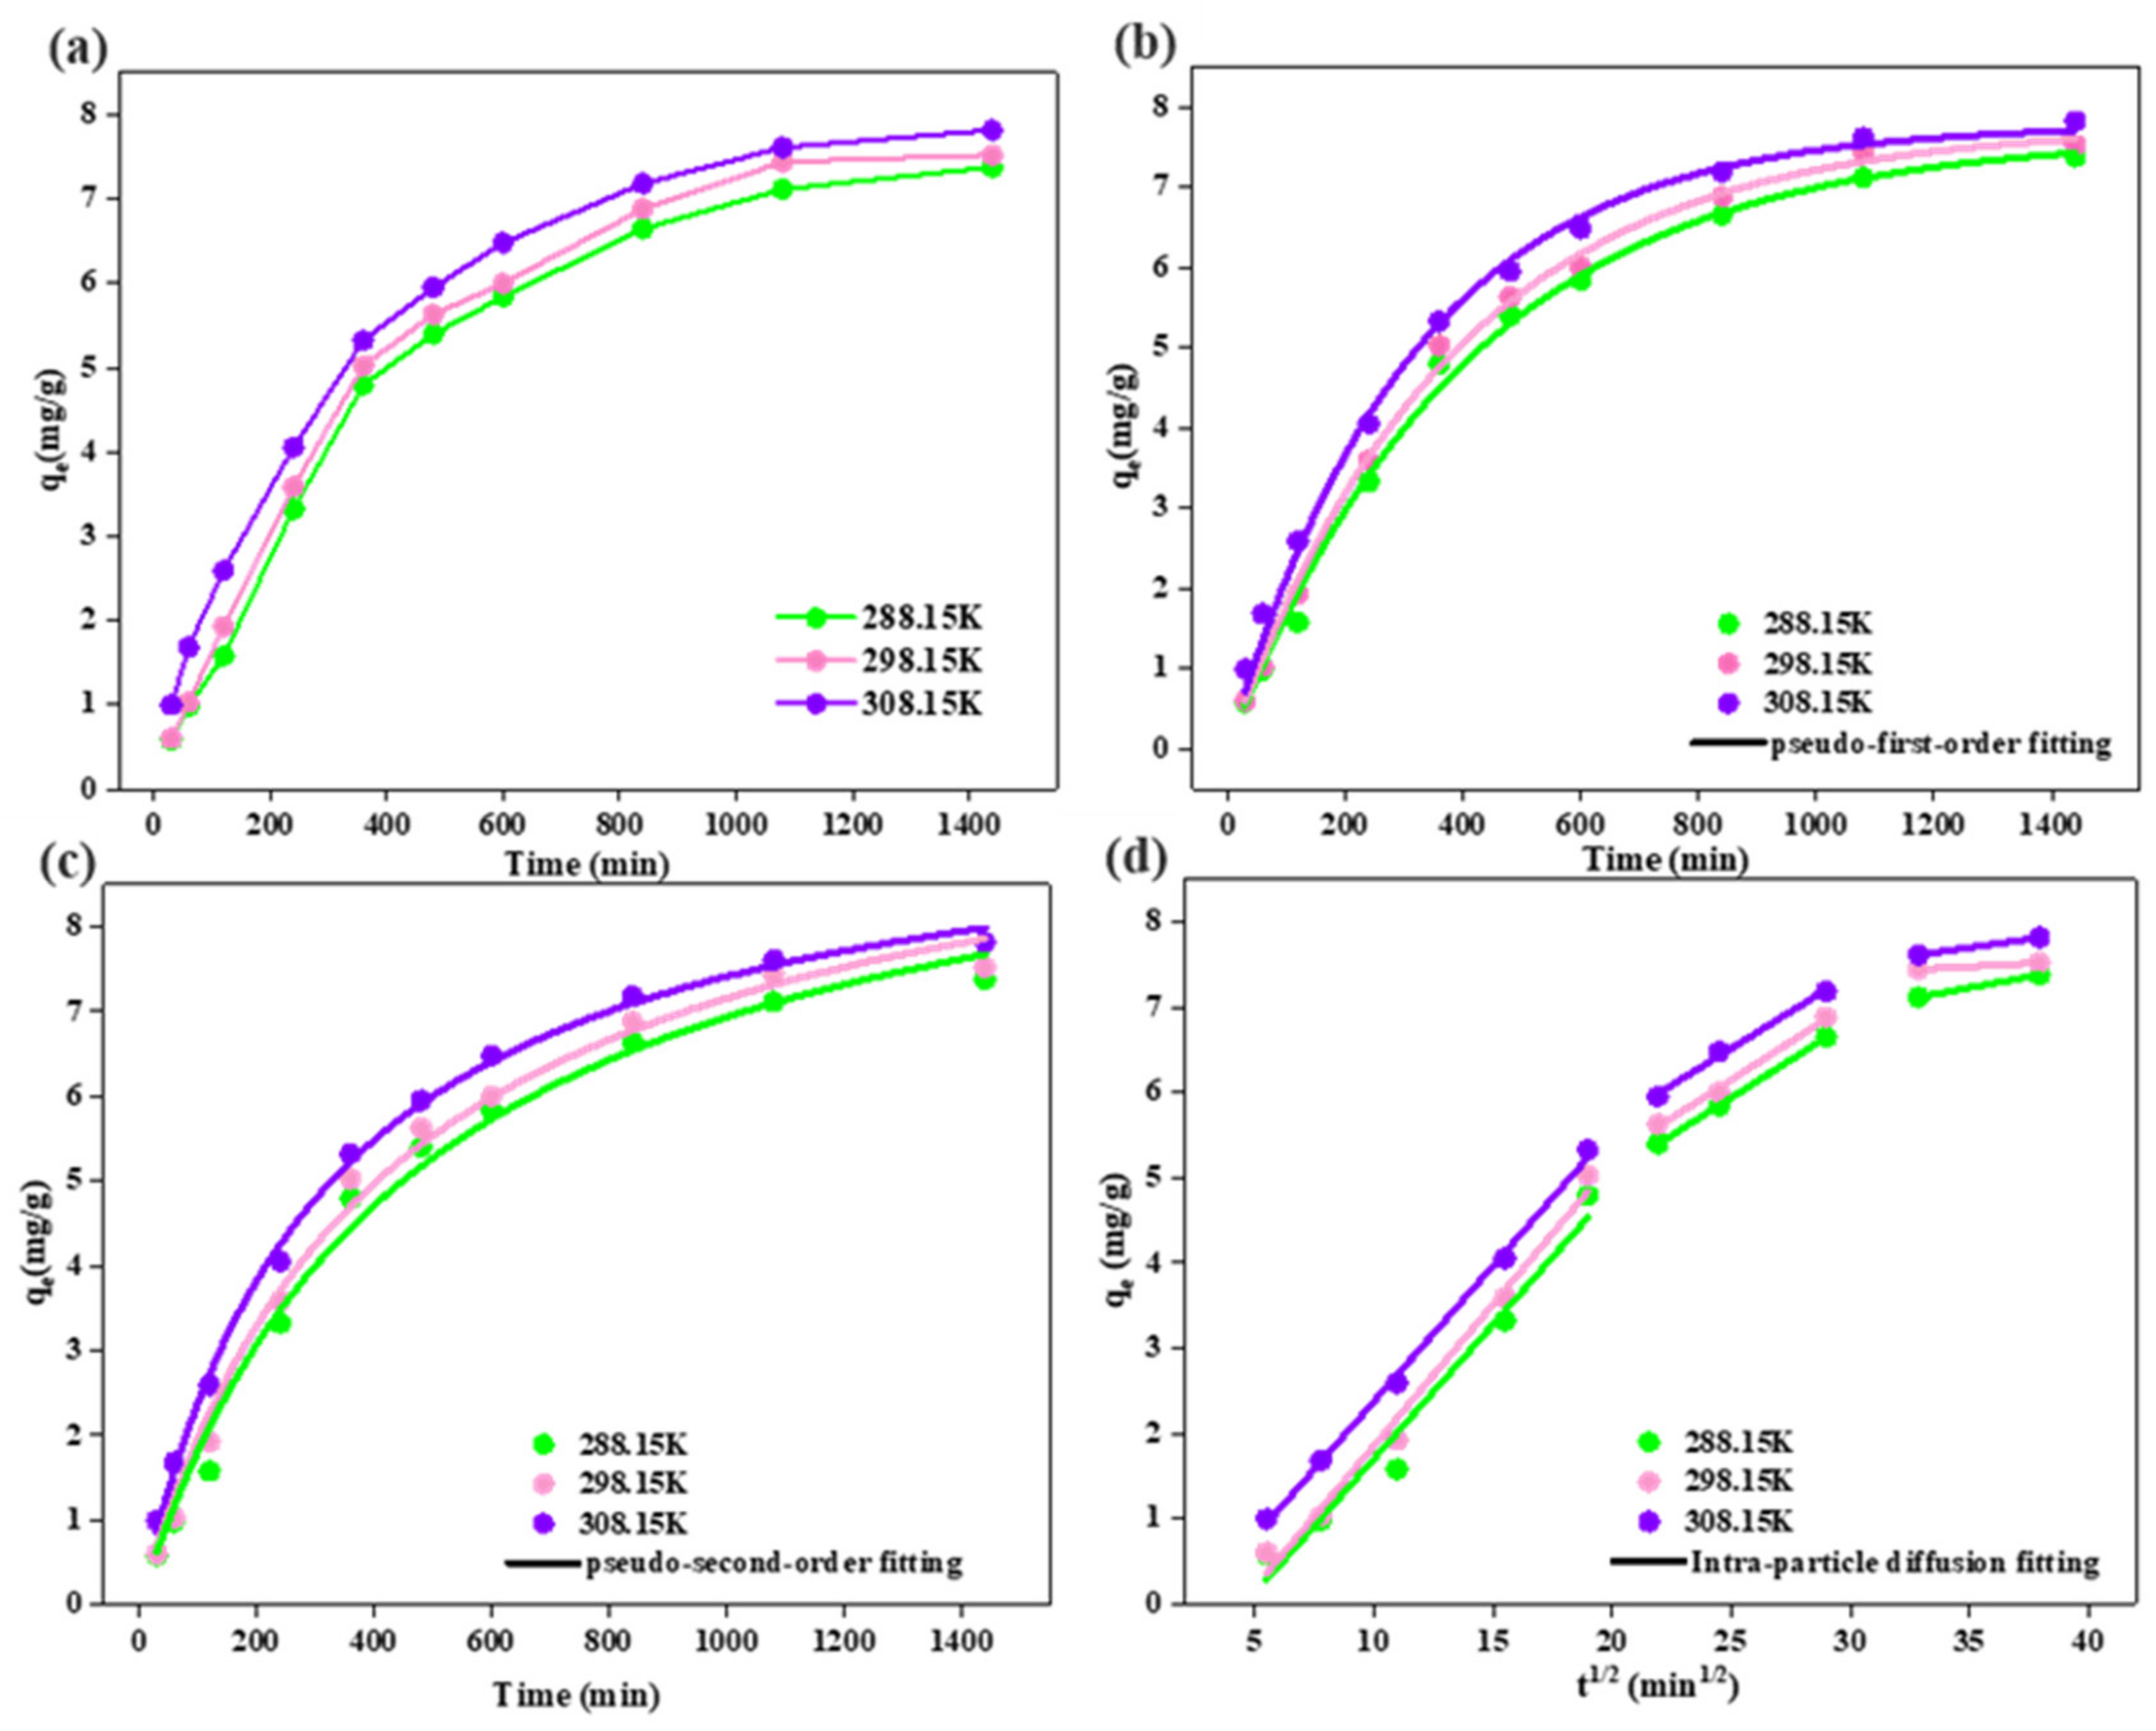
3.5. Adsorption Kinetics

In order to study the effects of contact time on the adsorption of CIP by CA-Al-KABs, Figure 5 demonstrates the relative adsorption capacity at different contact times and temperatures. It can be clearly observed in Figure 5a that the adsorption process of CIP by CA-Al-KABs was strongly time-dependent. The adsorption capacity of CA-Al-KABs to CIP increased gradually with the increase of contact time. The adsorption process was faster in the early stage of the adsorption experiment, and the initial adsorption capacity at 360 min was 4.8 mg·g−1. After 360 min, the adsorption process of CIP by CA-Al-KABs gradually slowed down, reaching an approximate equilibrium state in around 1080 min. The reason for this phenomenon was that the contact time between CIP molecules and the surface active sites of CA-Al-KABs were limited at the beginning of the adsorption process, which led to the insufficient adsorption process. The driving force in the solution transferred CIP molecules to the outer surface of CA-Al-KABs as the contact time increased, which led to good contact between CIP molecules and CA-Al-KABs. Subsequently, CIP attached to the external surface of the adsorbent slowly reached the internal active site of CA-Al-KABs through the intra-particle diffusion mechanism under the driving force of intra-particle mass transfer, and gradually occupied the internal active sites, reaching adsorption equilibrium.
The study of adsorption kinetics was quintessential for the analysis of the adsorption process, and provided a valuable experimental and theoretical reference for the design of the water treatment system. Therefore, to explore the adsorption process and possible adsorption mechanism of CIP by CA-Al-KABs, two frequently-used adsorption kinetic models were used in this study, including the pseudo-first-order model and pseudo-second-order model. The pseudo-first-order and pseudo-second-order adsorption processes represent two different adsorption processes respectively. The pseudo-first-order assumes that physical adsorption dominated the whole adsorption process, while the pseudo-second-order assumes that the whole adsorption process was controlled by chemical adsorption. The formula of the adsorption kinetics model was as follows:
Pseudo-first-order kinetics:
ln q e q t = lnq e k 1 t ,
Pseudo-second-order kinetics:
t q t = 1 k 2 q e 2 + t q e ,
where qe (mg·g−1) is the equilibrium adsorption capacity and qt (mg·g−1) is the variable quantity of CIP adsorbed by unit mass CA-Al-KABs over time. k1 (min−1) and k2 (g·(mg·min)−1) are the rate constants of pseudo-first-order and pseudo-second-order models, respectively.
The fitting results of the kinetic model are shown in Figure 5b,c, and the relevant parameters are shown in Table 1. The R2 values of the two kinetic models were both higher, indicating that the adsorption process of CIP by CA-Al-KABs was a complex process controlled by both physical adsorption and chemical adsorption. It can be seen from the data in Table 1 that at the low temperature, the R2 value of the pseudo-first-order fitting curve was higher than that of the pseudo-second-order fitting curve, indicating physical adsorption played a dominant role at low temperature. However, the R2 value of the pseudo-second-order kinetics was higher than that of the pseudo-first-order kinetics at the temperature of 308.15K, indicating that chemical adsorption played a dominant role at this temperature.
In order to further investigate the adsorption of CIP on CA-Al-KABs at various stages of multi-process control, this experiment studied the Weber and Morris intra-particle diffusion model, and the formula was as follows:
q t = k i t 1 2 + C ,
where qt (mg·g−1) is the adsorption capacity at time t, ki (mg·(g·min1/2)−1) is the Weber and Morris intraparticle diffusion rate constant of step i (i =1, 2, 3) in the adsorption process, and C is a constant associated with the thickness of boundary layer (mg·g−1).
The fitting curve of the intra-particle diffusion model was shown in Figure 5d, and the relevant parameters were shown in Table 1. From Figure 5d, it can be seen that the adsorption process of CIP on CA-Al-KABs can be clearly divided into three stages, and the curve does not go through the origin. This indicated that the intra-particle diffusion was not the only rate-control step. The CIP molecules were first rapidly adsorbed to the outer surface of CA-Al-KABs under the driving force of solution, and then slowly diffused to the inner surface of CA-Al-KABs under the driving force of intramolecular mass transfer. Finally, the CIP molecules in the CA-Al-KABs completed the adsorption process through the internal optimization of coordination and achieved the adsorption equilibrium.

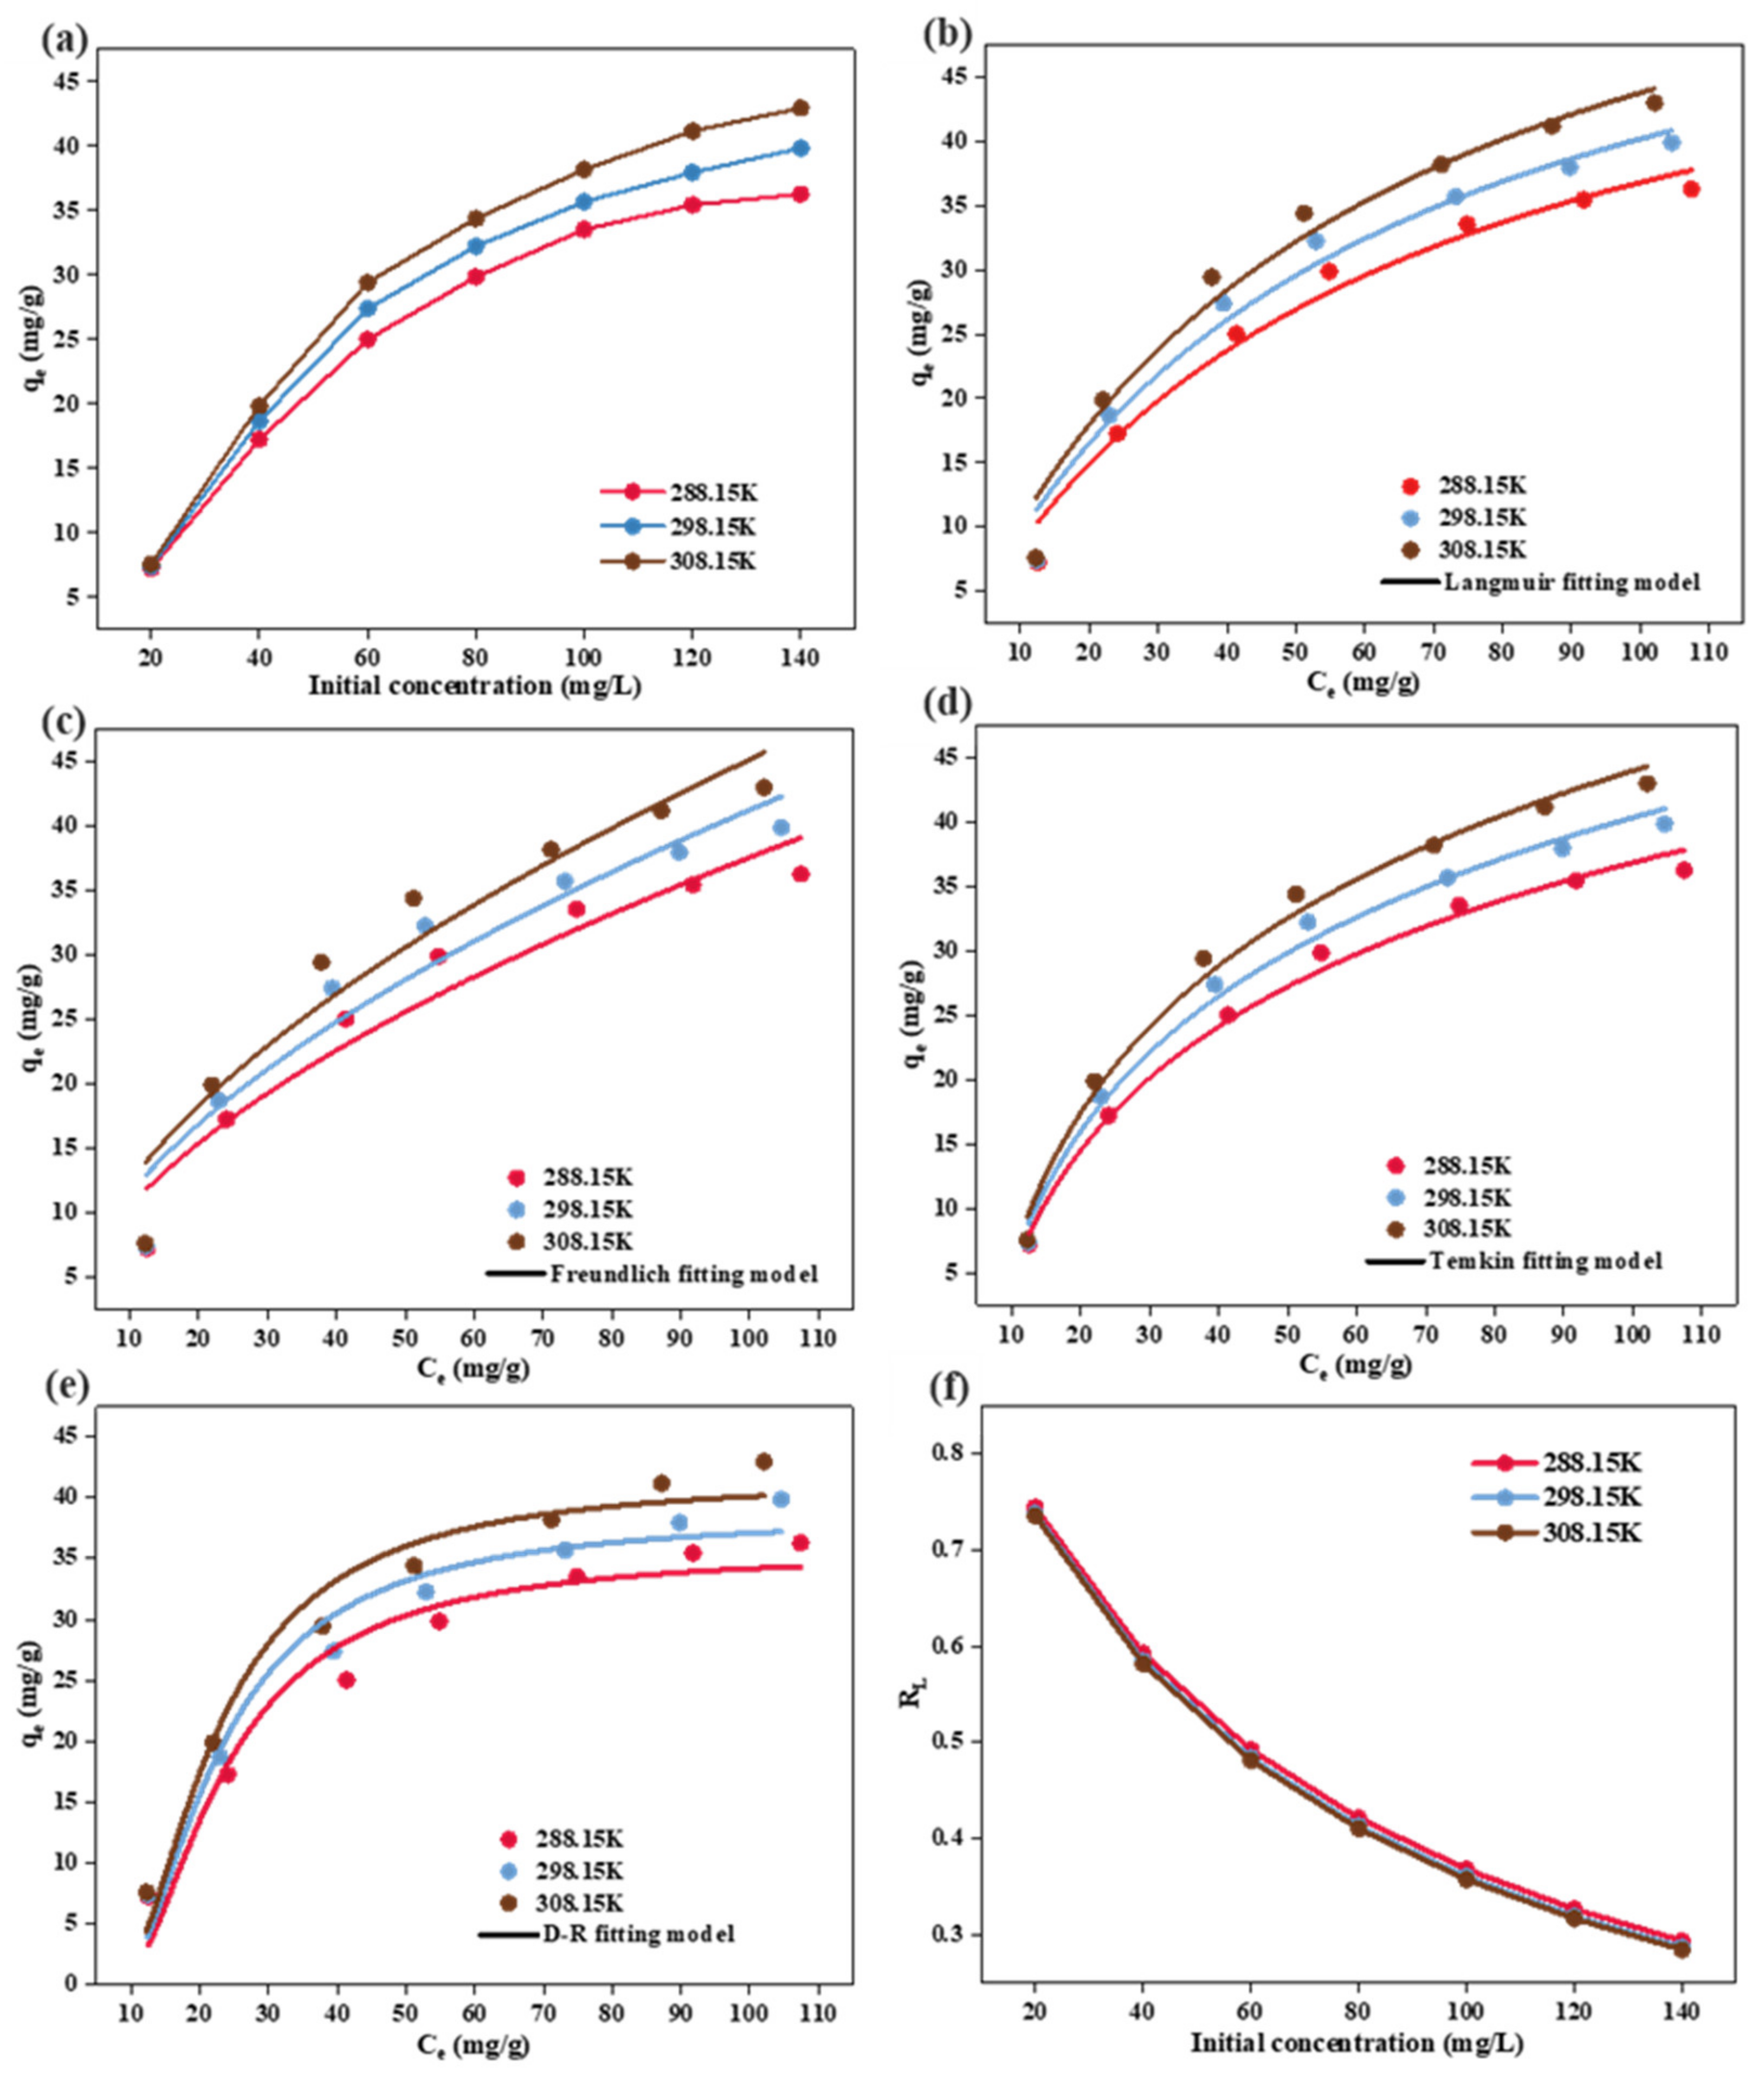
3.6. Adsorption Isotherms

The adsorption isotherm can be used to describe the equilibrium relationship between the adsorption capacity and the concentration of the adsorbate in the liquid phase to maintain adsorption equilibrium. Figure 6 showed the relationship between the adsorption capacity and the initial concentration of CIP. It could be observed that in the temperature range of 288.15−308.15 K, the adsorption capacity of CA-Al-KABs to CIP increased significantly with the increase of the initial concentration of CIP solution. The adsorption process of CIP on CA-Al-KABs was saturated gradually when the initial solution concentration was 120 mg·L−1, and the maximum adsorption capacity was measured to be 42.96 mg·g−1 at 308.15 K. This phenomena may be due to the unsaturation of a large number of active sites on the surface of CA-Al-KABs at low CIP concentration, resulting in the increase of adsorption capacity of CIP as concentration was increased. In addition, the increasing concentration promoted the driving force of mass transfer at the solid-liquid interface, resulting in the increase of the adsorption capacity. As the concentration of CIP continued increased, the surface active sites of CA-Al-KABs were saturated, and the adsorption capacity of CIP was no longer improved.
In order to study the performance and mechanism of CIP adsorption by CA-Al-KABs, Langmuir, Freundlich, Temkin, and Dubinin–Radushkevich (D-R) isotherm models were used to fit and analyze the adsorption equilibrium results. The Langmuir isotherm model assumed that the adsorption process was carried out on homogeneous surfaces without intermolecular interactions and all adsorption sites were equal. The Freundlich model was an empirical model, which assumed that the adsorption process was multilayer adsorption on heterogeneous surfaces. It proposed the hypothesis that ion binding to surface sites would affect adjacent sites. Temkin isotherm model was a chemical adsorption model based on strong electrostatic interaction between positive and negative charges. According to the D-R isotherm model, adsorption was the process of filling adsorbent pores with adsorbate under uniform surface conditions. The expressions of Langmuir, Freundlich, Temkin, and D-R isotherm models were as follows:
Langmuir model:
q e = K L C e q m 1 + K L C e ,
Freundlich model:
q e = K F C e 1 n ,
Temkin model:
q e = K T ln fC e ,
Dubinin-Radushkevich model:
q e = q m exp β ε 2 ,
ε = RT ln 1 + 1 C e ,
where qe (mg·g−1) is the equilibrium adsorption capacity, while qm (mg·g−1) is the theoretical maximum adsorption capacity, Ce (mg·L−1) is the concentration of tetracycline, KL (L·mg−1), KF (mg·g−1) (L·mg−1)1/n, and n are adsorption constants. β (mol2·J−2) was a constant with the adsorption energy and ɛ is Polanyi’s potential. R and T are gas constants (8.314 J·mol−1·K−1) and absolute temperature (K), respectively.
The fitting results and relevant parameters were shown in Figure 6 and Table 2. By contrast, the Langmuir model had the highest fitting degree, indicating that the adsorption of CIP on the adsorbent surface was a monolayer chemical adsorption process. At the same time, according to the model, the maximum adsorption capacity of CA-Al-KABs to CIP was 68.36 mg·g−1 at 308.15 K. In addition, the R2 value of the curve fitted by the Temkin model was relatively high, which further proved the electrostatic attraction between CA-Al-KABs and CIP molecules.
The separation factor RL was used to evaluate the essential characteristics of Langmuir isotherms. The isotherm characteristics indicated by RL value were as follows: RL > 1 or RL < 1 indicated that the reversible reaction was difficult to occur; RL = 1 indicated that the reversible reaction was linear; 0 < RL < 1 indicated that the reaction was a good reversible reaction; RL = 0 indicated that the reaction was irreversible.
R L = 1 1 + K L C 0 , max ,
where KL was Langmuir constant, C0,max was the maximum initial concentrations (mg−1).
Figure 6f shows that all RL values in this study were within the range of (0–1), indicating that the adsorption process was a good reversible process under experimental conditions.

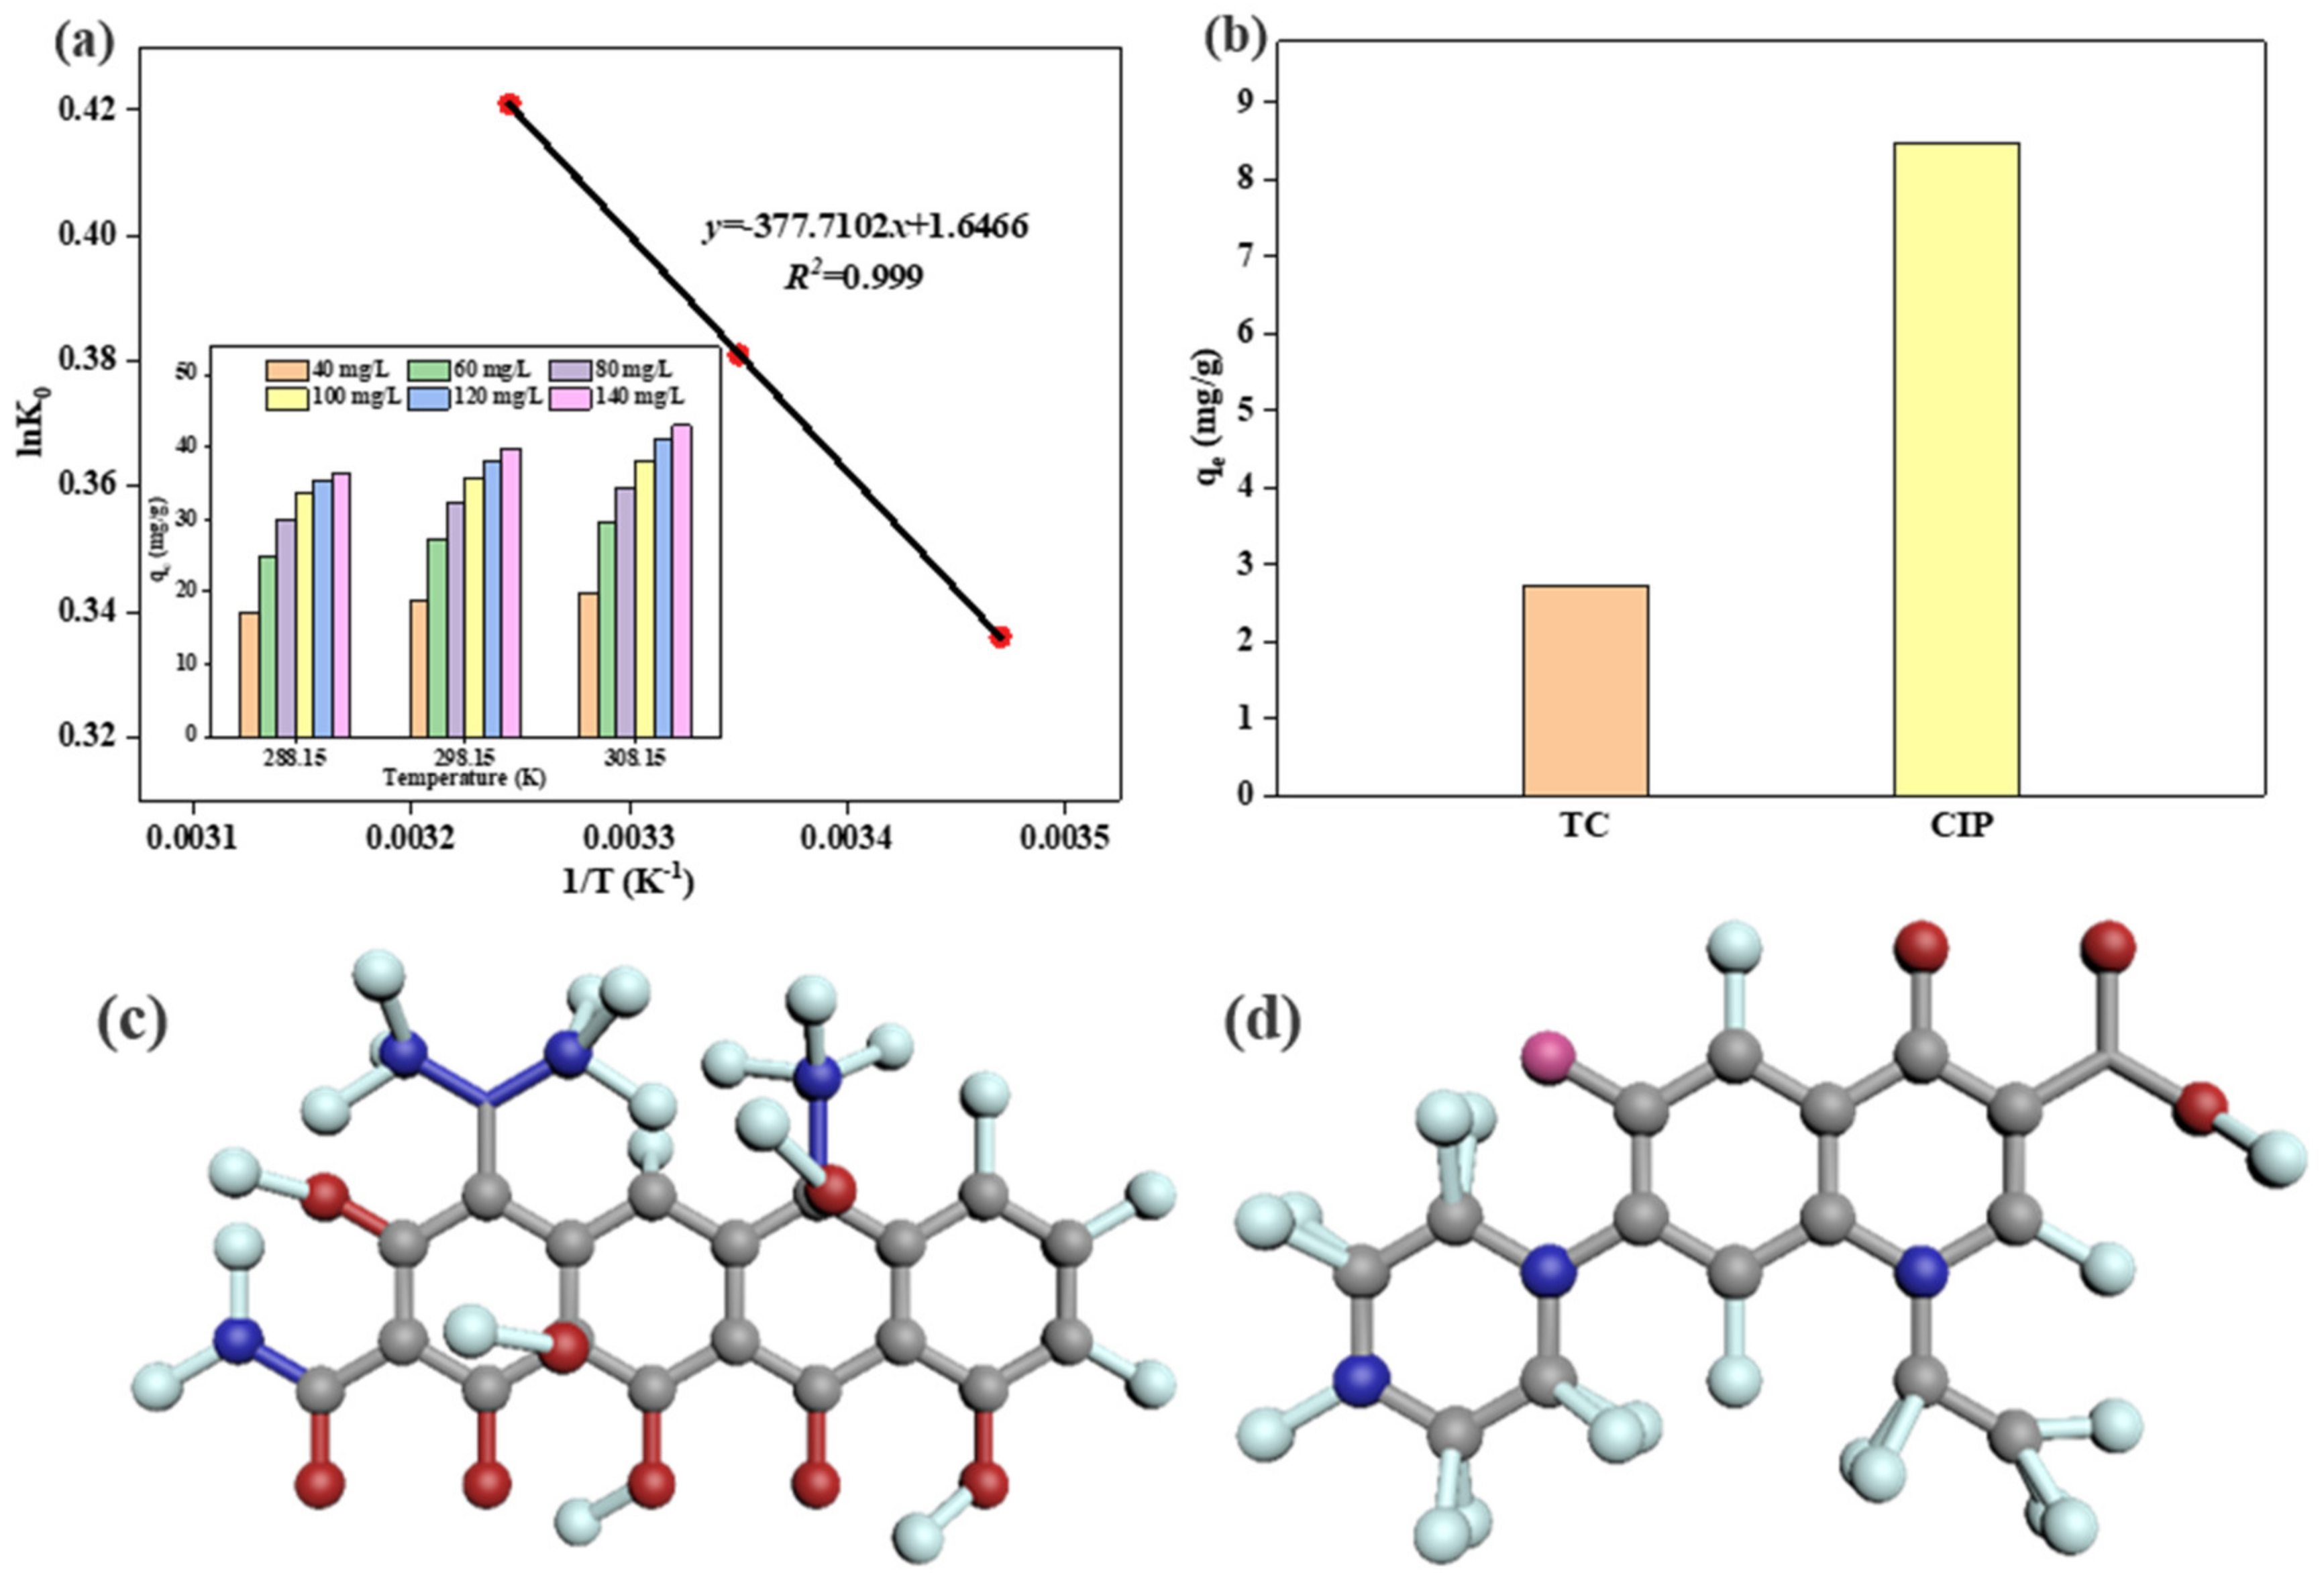
3.7. Adsorption Thermodynamics

Temperature promoted the motion of the adsorbing molecules in the adsorption process and showed an energy-dependent mechanism. Figure 7a shows the relationship between temperature and the adsorption capacity of CA-Al-KABs on CIP. Within the range of 288.15–308.15 K, the adsorption capacity of CA-Al-KABs on CIP increased slightly with the temperature, indicating that a high temperature was more conducive to the adsorption process. This might because the high temperature intensified the motion of CIP molecules, which resulted in full contact with the CA-Al-KABs. Thereby, the adsorption capacity of the CA-Al-KABs on CIP was increased. Adsorption thermodynamics are defined by the widely used thermodynamic parameters related to temperature calculated by the Van Huff equation [22], which was described by the following equation:
ln K 0 = Δ H 0 R × 1 T + Δ S 0 R ,
K 0 = q e C e ,
Δ G 0 = RT ln K 0 ,
where R is the general gas constant (8.314 J·(mol·K)−1) and T is the absolute temperature (K); Δ S0 (J·(mol·K)−1), (H0 (kJ·mol−1) and ΔG0 (kJ·mol−1) are the thermodynamic constants in the adsorption process, which are defined as the changes of entropy, enthalpy, and Gibbs free energy, respectively.
The relationship between temperature and lnK0 was shown in Figure 7a, and the values of various parameters were shown in Table 3. As can be seen from the table, the ΔG0 of the CA-Al-KABs at three temperatures were all negative. This indicated that the adsorption of CIP on the CA-Al-KABs occurred spontaneously. The absolute value of ΔG0 increased with temperature, suggesting that the degree of spontaneity increased with the temperature of the reaction system. ΔS0 < 0 showed that the randomness of CIP adsorption was decreased. ΔH0 < 0 indicated that the adsorption process was an endothermic reaction, and was consistent with the conclusion drawn in the isothermal adsorption process.

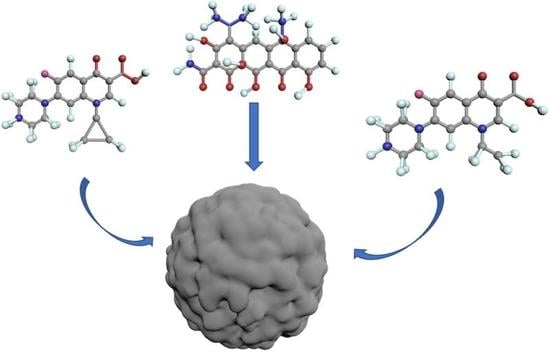
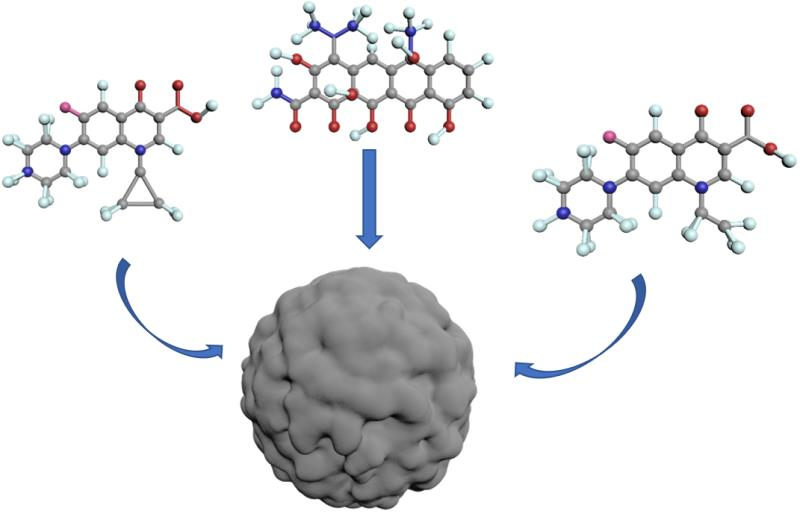
3.8. Adsorption Capacity of Different Antibiotics

For the purpose of investigating CA-Al-KABs’ removal effects on other antibiotics, adsorption experiments were performed on tetracycline and norfloxacin. The results were shown in Figure 7b. It could be observed that CA-Al-KABs’ adsorption efficiency on tetracycline and norfloxacin were obvious. Compared with the adsorption capacity of norfloxacin, the adsorption capacity for tetracycline was lower. This might closely related to the fact that pKa1 of tetracycline was 3.3, while the pKa1 of norfloxacin was 6.34. The adsorption experiment was conducted at pH of 5, norfloxacin existed as cationic form while tetracycline existed as uncharged molecular form. Therefore, CA-Al-KABs had an electrostatic gravitational effect on norfloxacin, while there was no electrostatic effect on tetracycline. In this way, the adsorption effect of tetracycline was lower than that of norfloxacin.

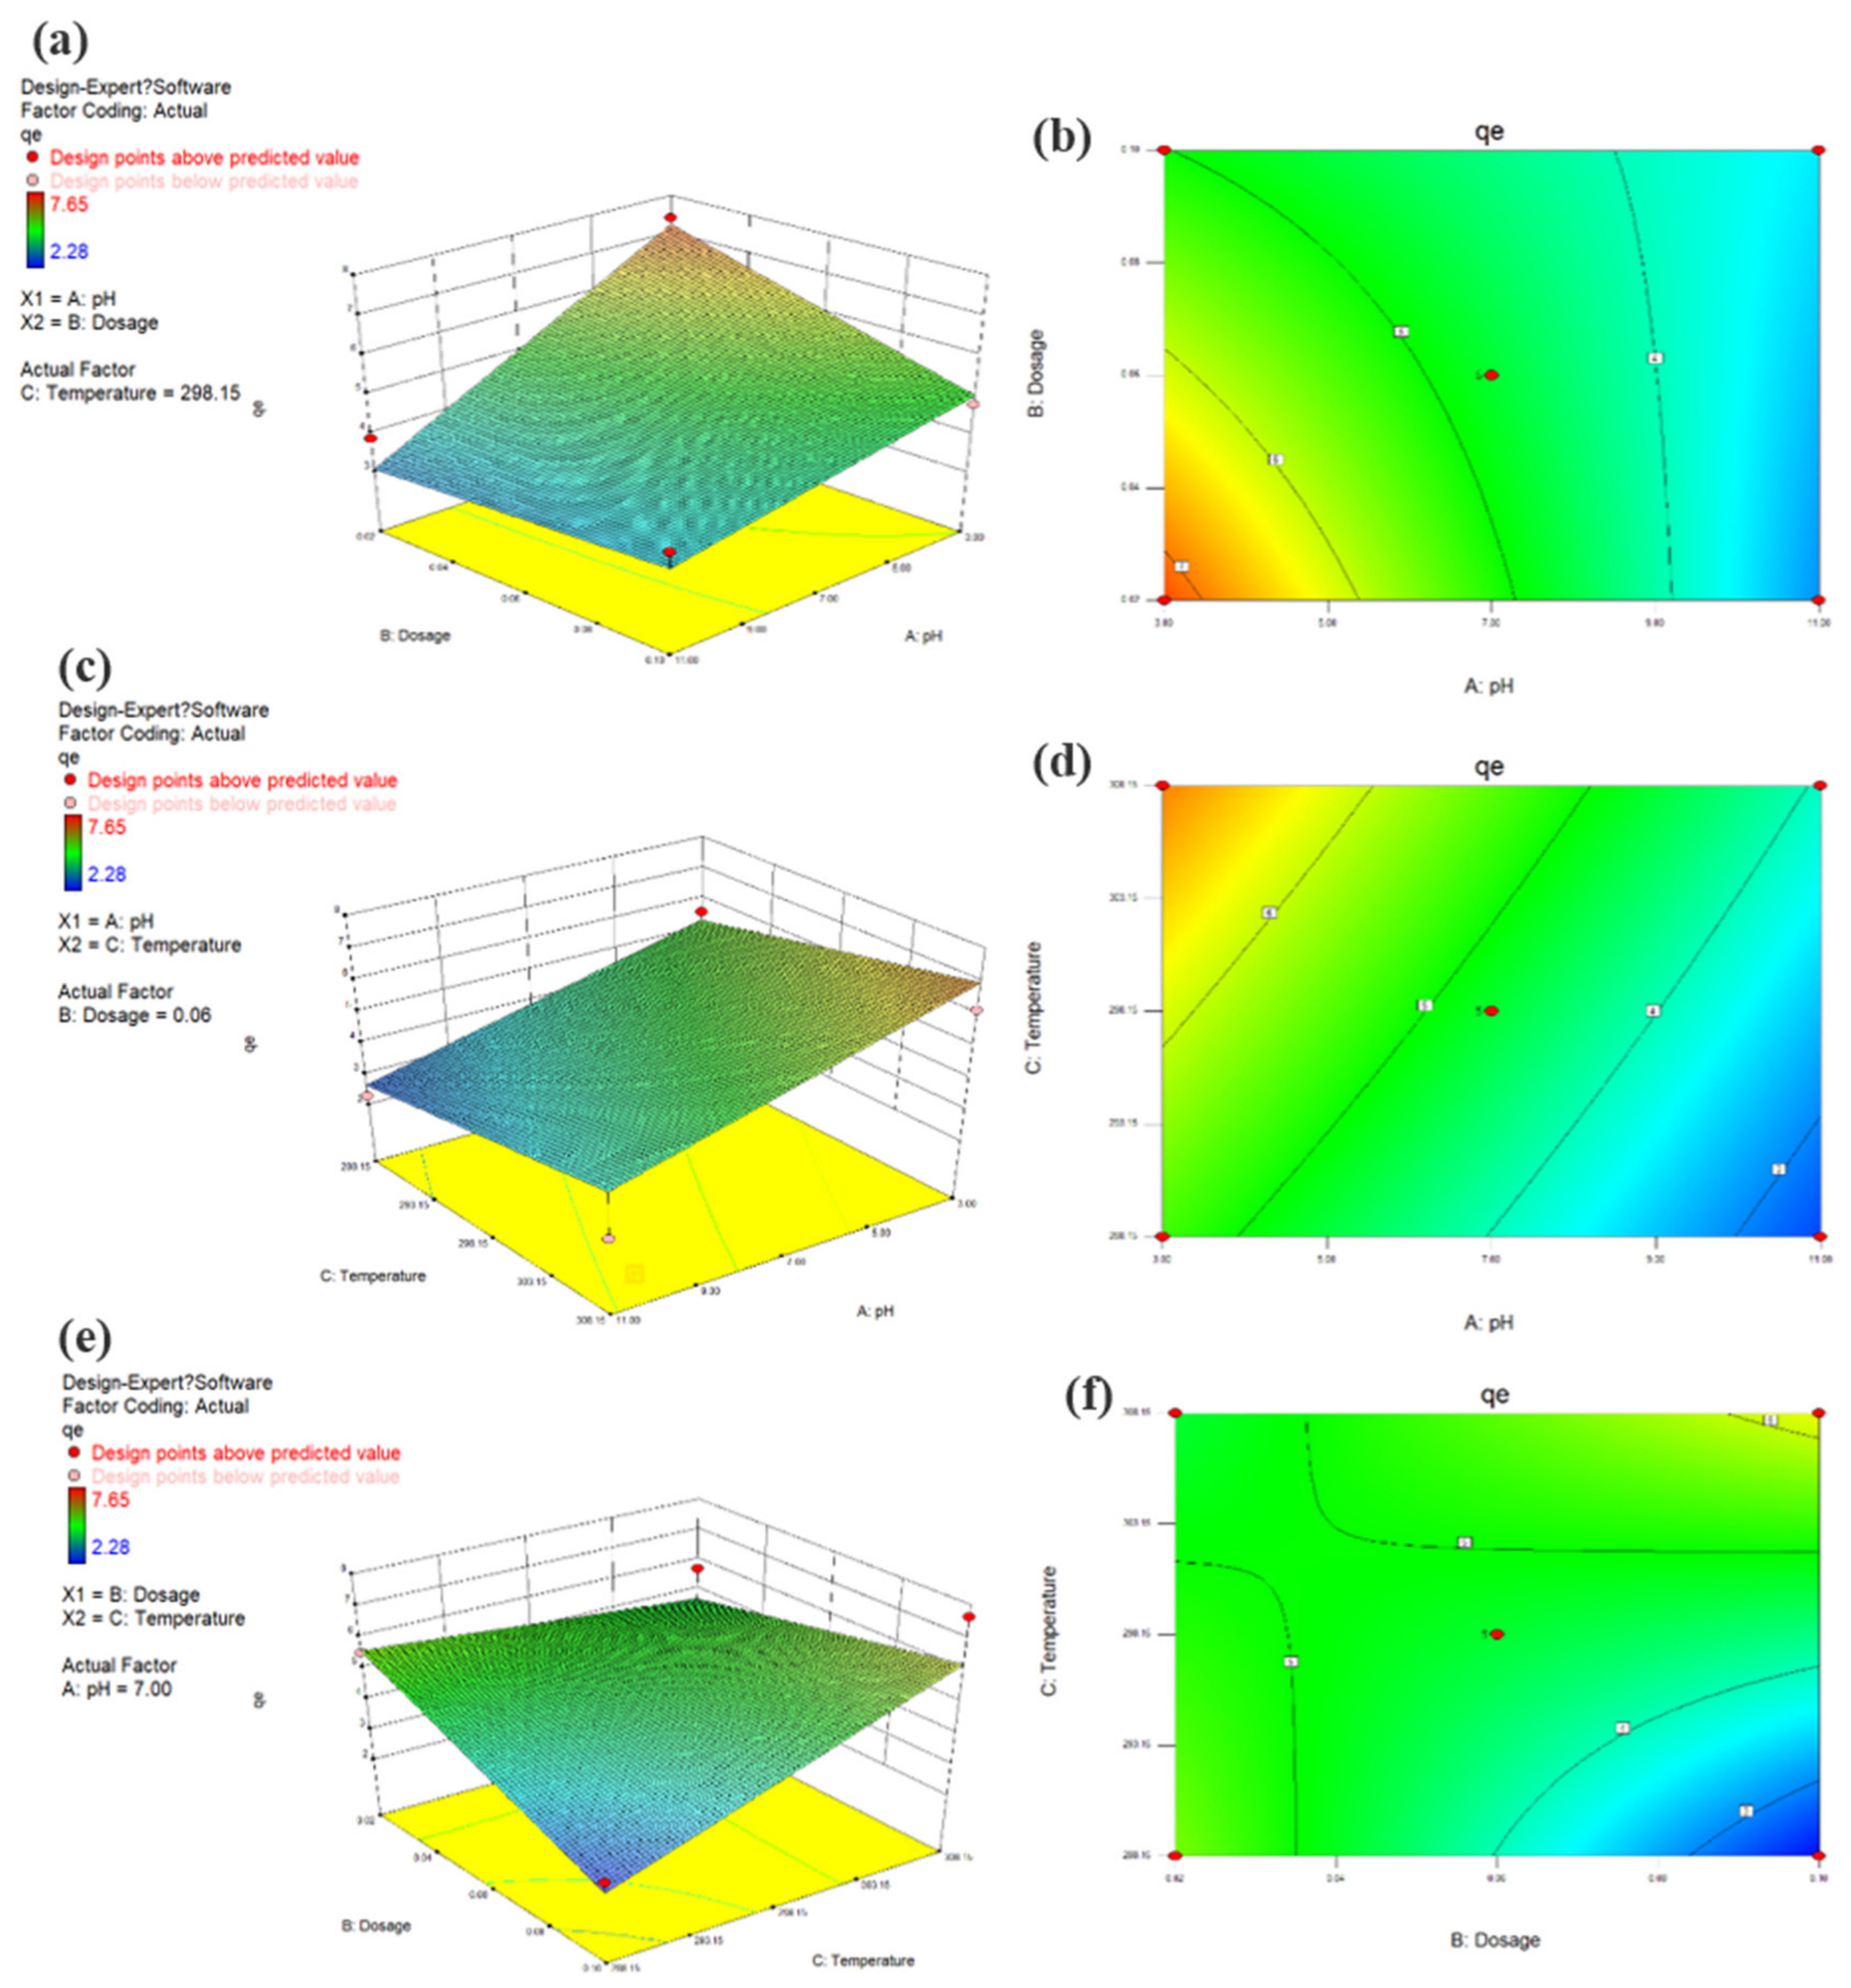
3.9. Adsorption Modeling by RSM

3.9.1. Modeling Set Up

Box–Behnken design (BBD) under the response surface method (RSM) was used to study the optimal adsorption conditions for CIP by CA-Al-KABs. Effects of solution pH, adsorbent dosage and temperature on the adsorption were studied. Seventeen response surface model experiments were carried out by regression, and graphical analysis of the results data was analyzed with the Design-Expertrt software (8.0, Stat-Ease, Minneapolis, MN, USA). The model consisted of three levels, coded values were −1, 0 and 1 (low, medium, high respectively). The response value was the adsorption capacity of CIP by CA-Al-KABs. The experimental design and results were shown in Table 4.

3.9.2. Regression Model Equation Establishment

The quadratic equation was obtained by predicting the optimal BBD and input variables. Then, according to the experimental results, the empirical relationship between output variables and the response of the coding unit was given as follows:
qe = 4.72 − 1.42 × A − 0.44 × B + 0.74 × C + 0.68 × A × B − 0.095 × A × C + 1.20 × B × C,
where A, B, and C are the coding terms of the three independent variables of pH, a dosage of adsorbent, and temperature, respectively.

3.9.3. ANOVA

Analysis of variance (ANOVA) was used to verify the goodness of the model, and the results are shown in Table 5. F value, P value and sum of squares determined the significance of the coefficient. According to the data in Table 5, when F value was 6.46 and P value was less than 0.001, the regression of qe response was significant statistically.

3.9.4. Effect of Model Arguments and Their Interaction

Figure 8 depicts the 3D response diagram and 2D contour lines of the adsorption capacity (qe) with the initial pH, temperature, and adsorbent dosage of the solution. According to the response surface optimization analysis, when the temperature was around 308.15 K, the pH was around 4, and the adsorbent dosage was less than 0.4 g, the qe value is at the highest level.

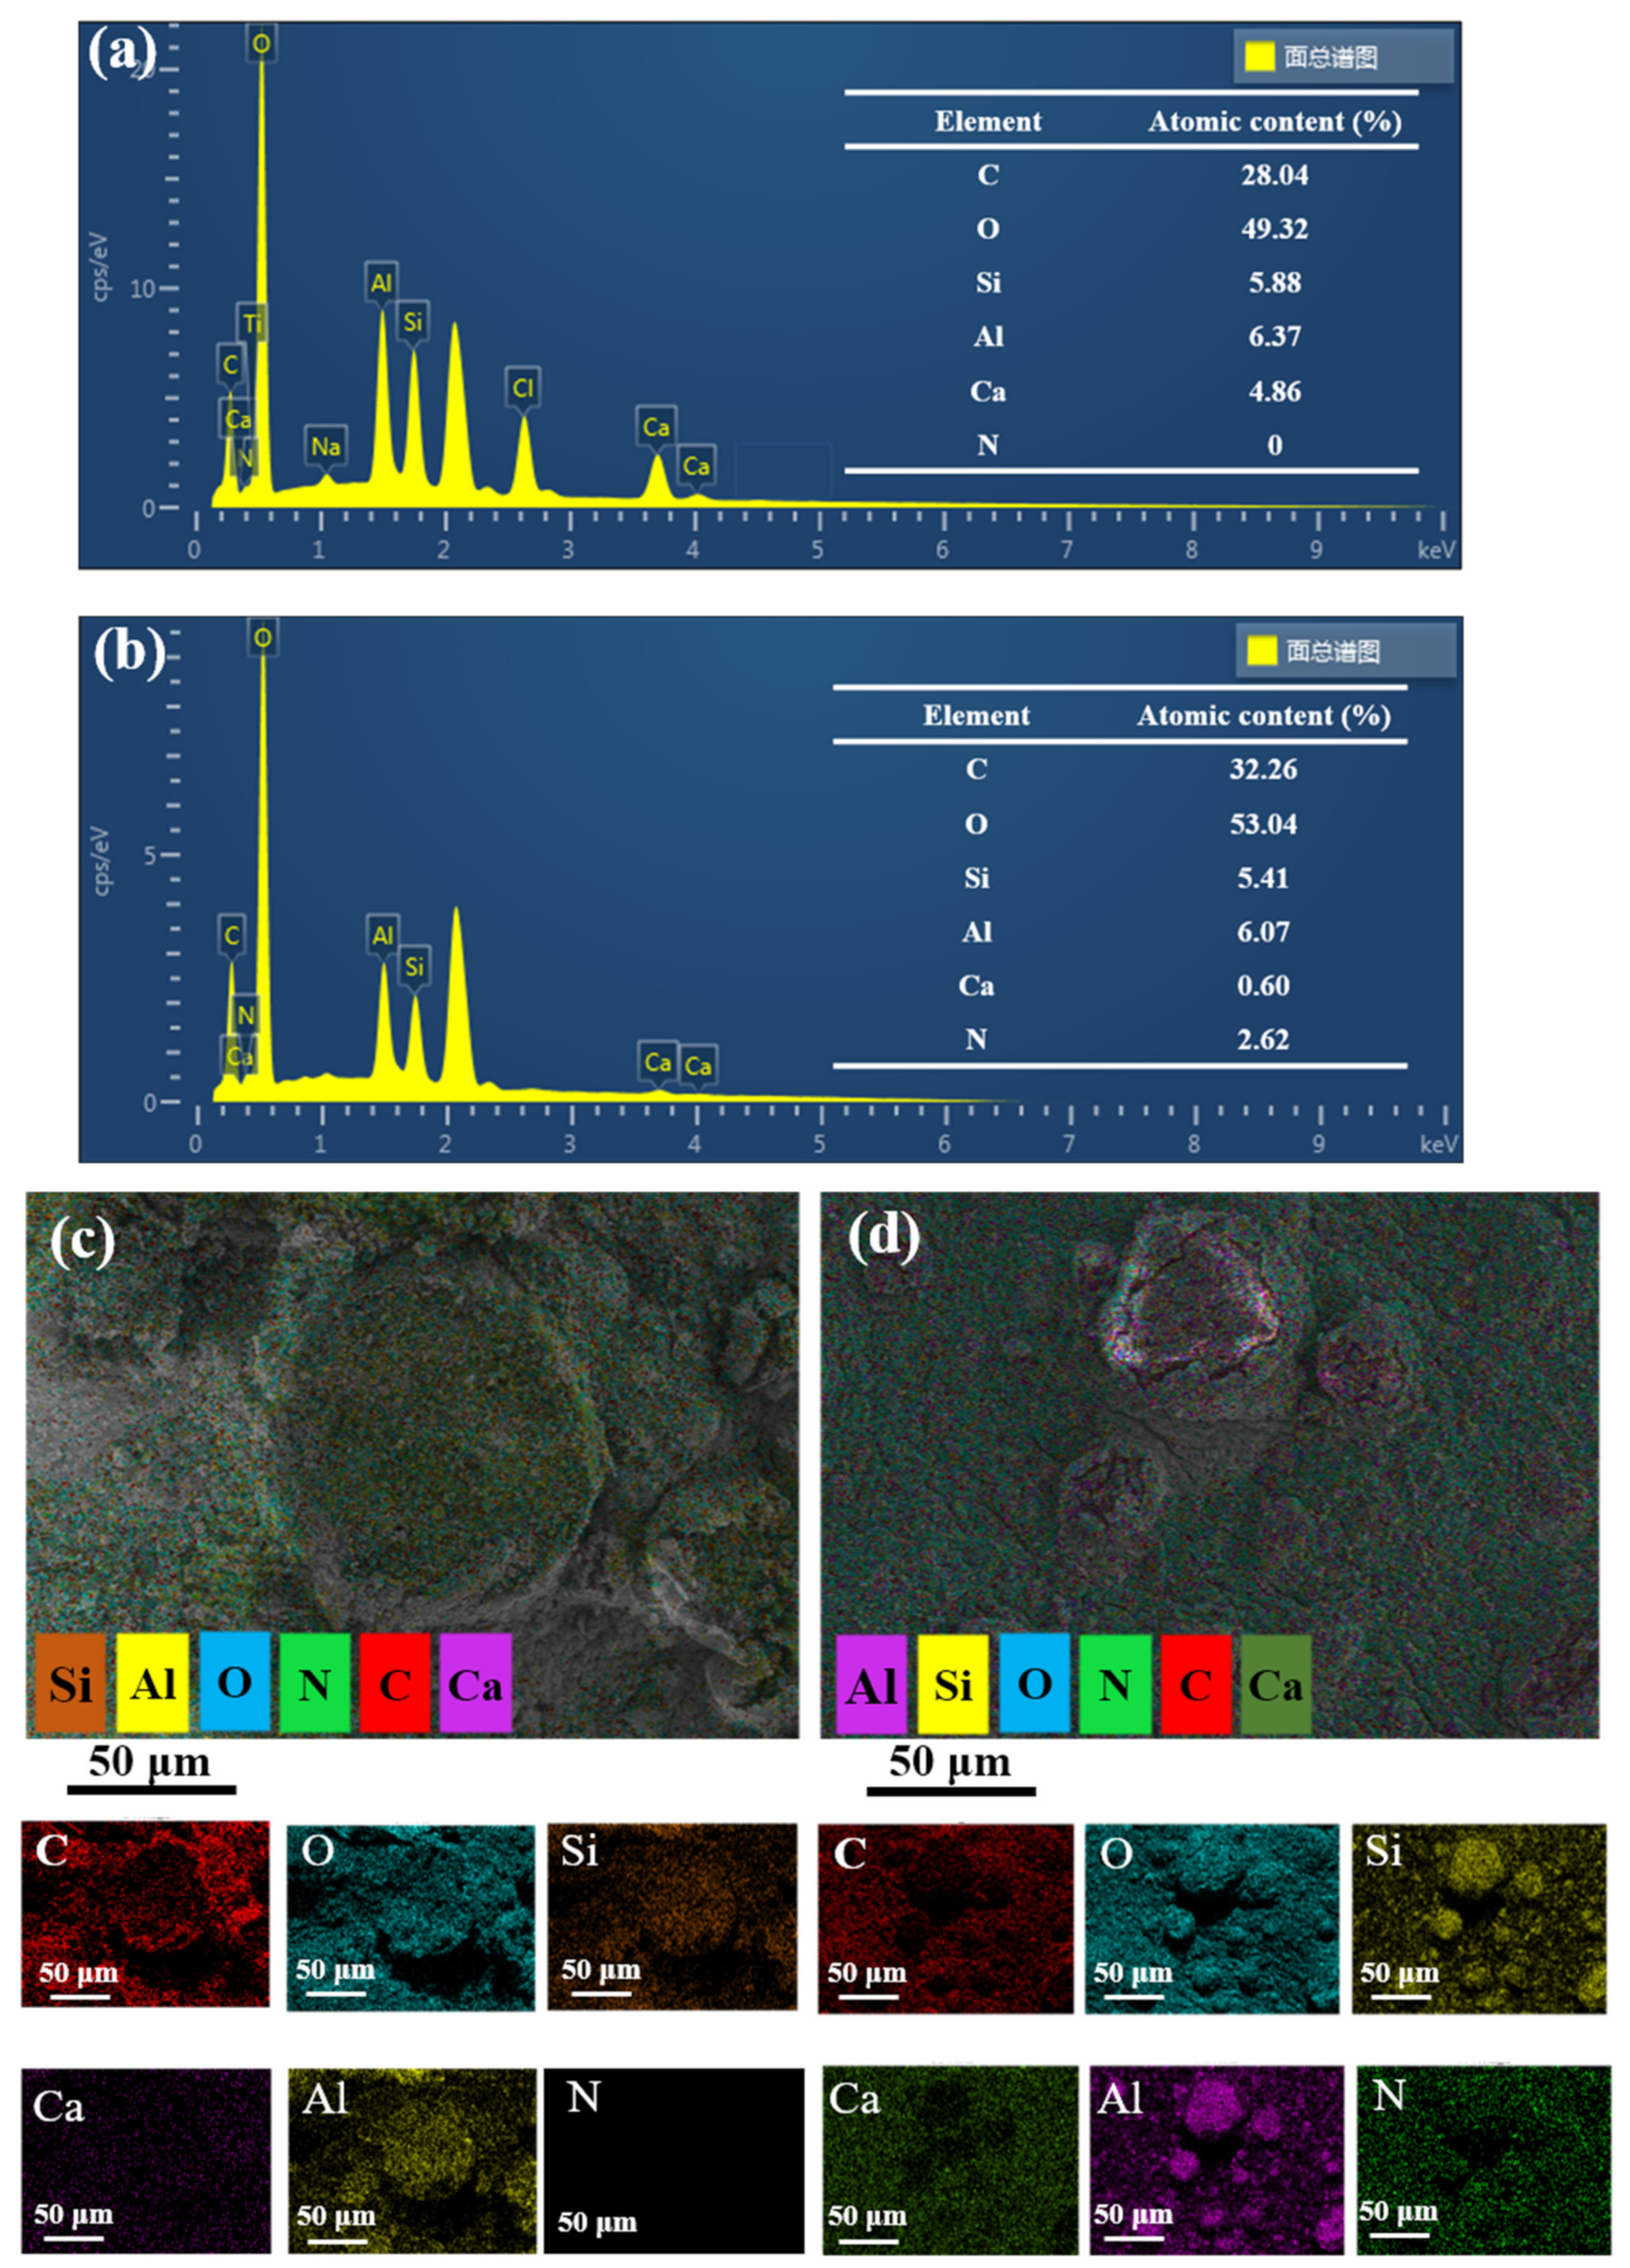
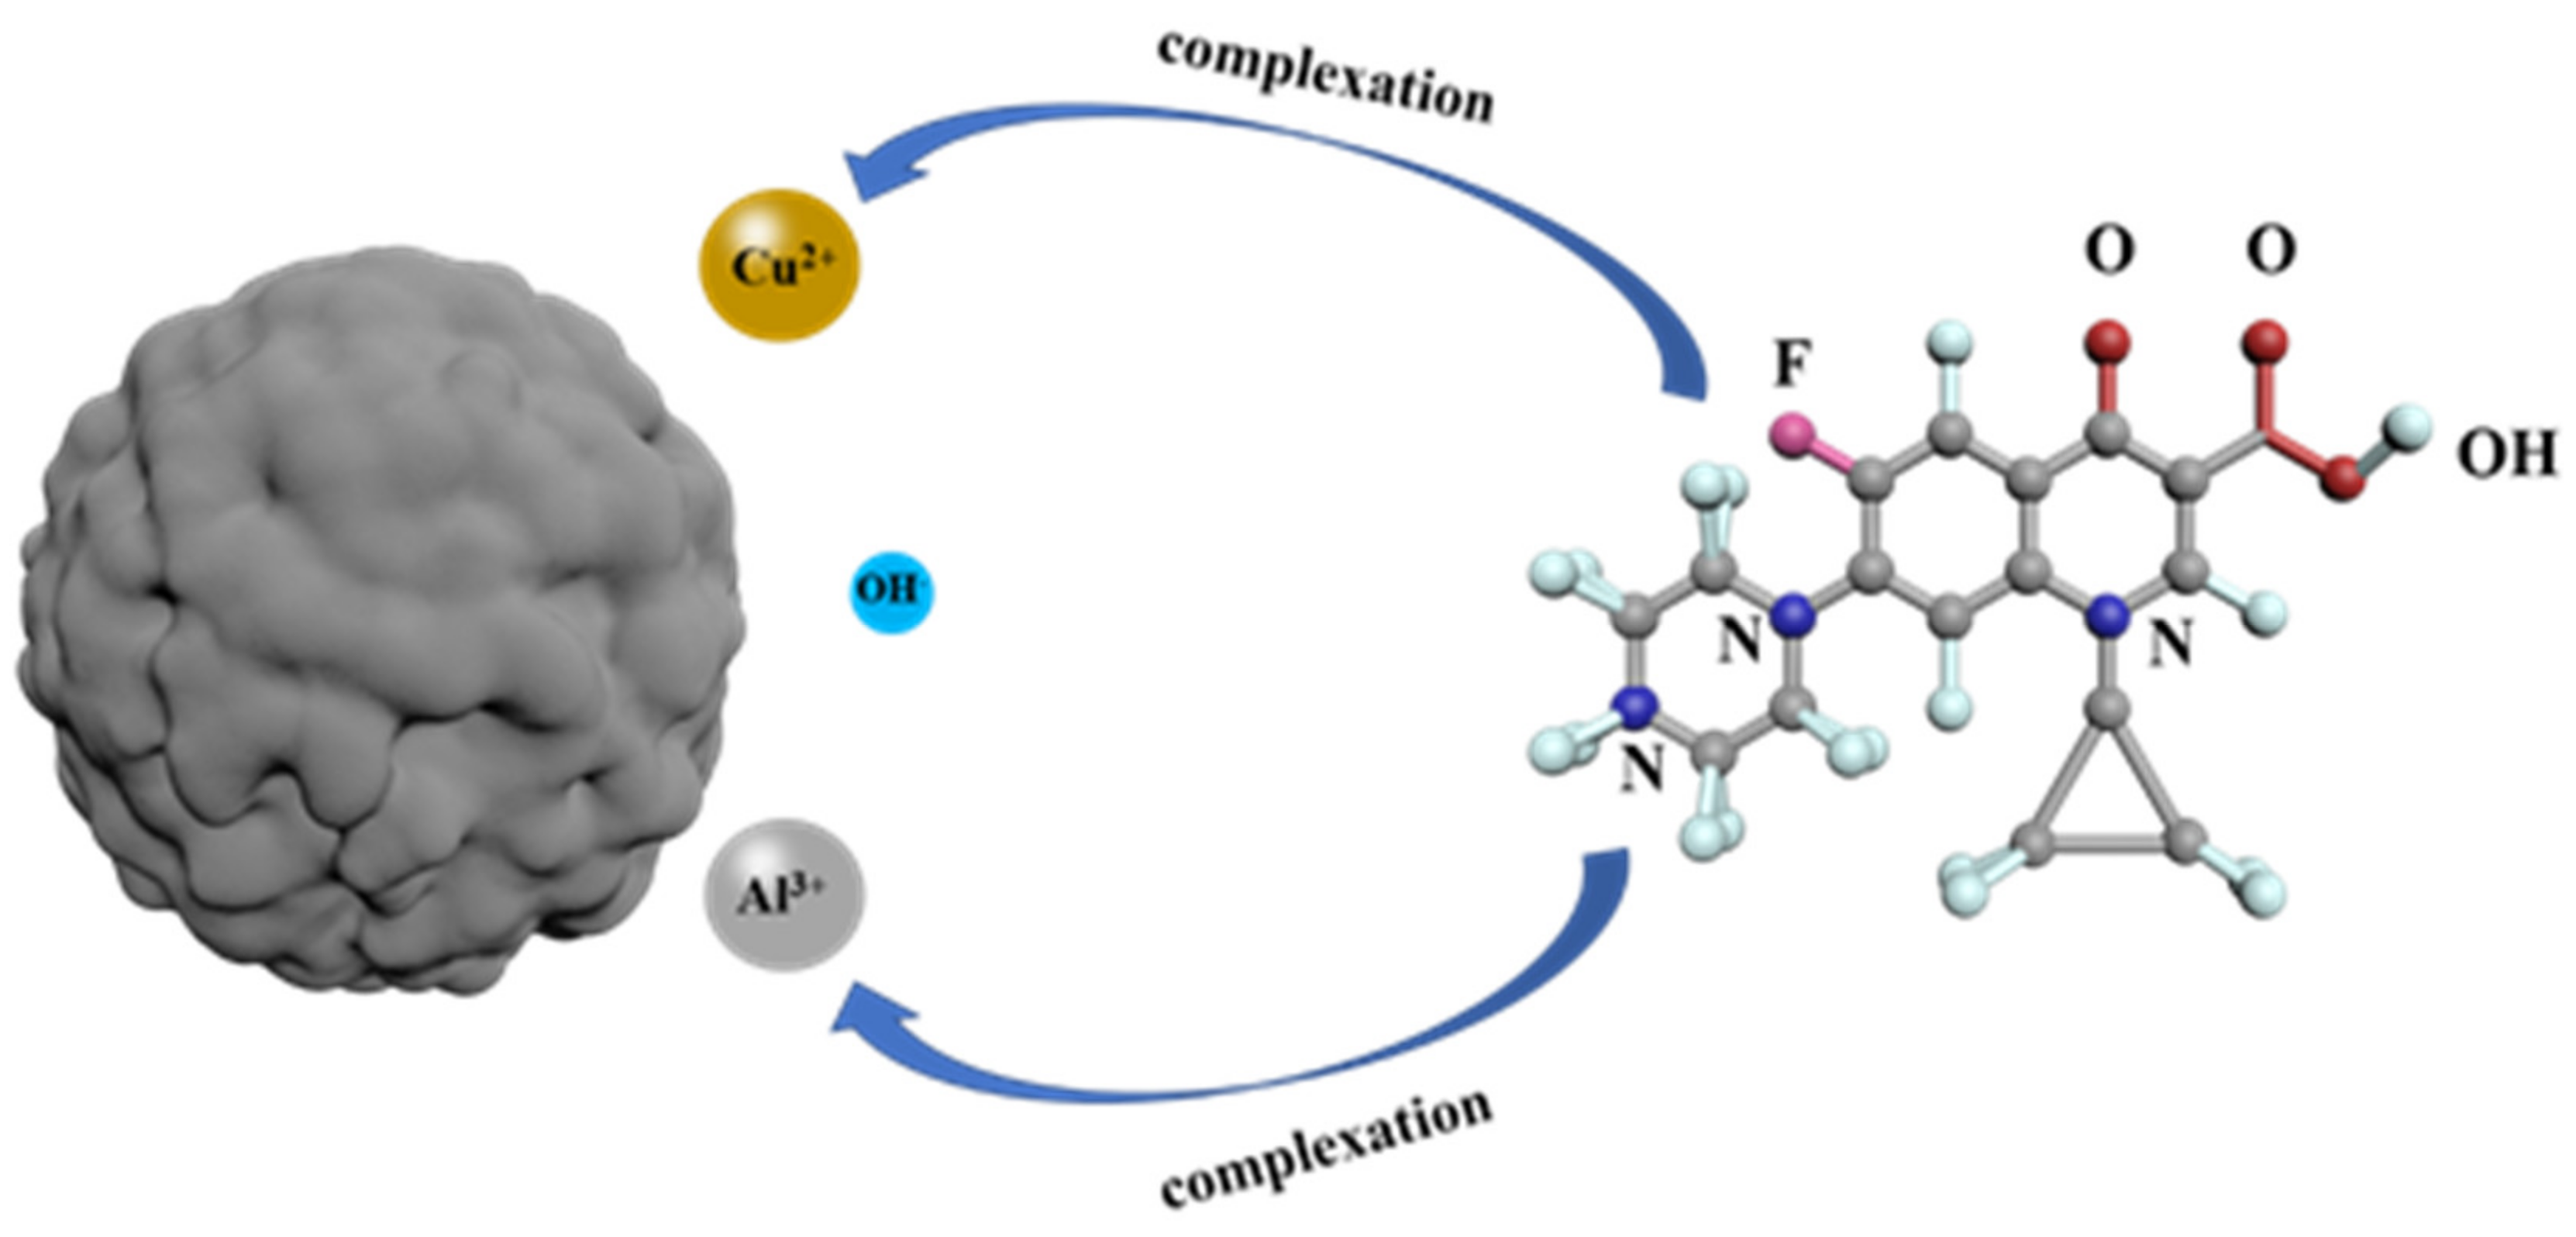
3.10. Adsorbing Mechanism

The mechsnism of CIP loaded on CA-Al-KABs was illustrated in Figure 9. In the initial stages of adsorption, CIP was in the form of cationic first aggregated on the surface of CA-Al-KABs under electrostatic attraction. Then, it slowly diffused into the interior of CA-Al-KABs under the driving force of intramolecular mass transfer. FT-IR spectra of CA-Al-KABs showed that CIP in the form of cationic which could form complexes with Al—Al—OH in CA-Al-KABs with the OH in interlayer water. XPS spectra showed that Ca2+ in CA-Al-KABs could also complex with CIP molecule, thus CIP could be fixed on CA-Al-KABs. The molecular structure of norfloxacin was similar to that of CIP (Figure 8d), so CA-Al-KABs also had a certain similar adsorption effect on norfloxacin, and its adsorption mechanism was similar to that of CIP.

4. Conclusions

In this study, a new type of calcium alginate microsphere adsorbent mixed with aluminum kaolin was synthesized by a simple gel solidification process, and was used to adsorb ciprofloxacin. CA-Al-KABs showed efficient adsorption ability to CIP and norfloxacin, and stable mechanical properties due to mixed Al-Kaolin. The adsorption process of ciprofloxacin on CA-Al-KABs was well described by the pseudo-first-order kinetic model and the Langmuir isotherm model. The maximum adsorption capacity of ciprofloxacin was 68.36 mg/g at pH = 4. In addition, the corresponding thermodynamic parameters showed that the adsorption process was endothermic, feasible, and spontaneous. The adsorption driving force of CIP near CA-Al-KABs may be the electrostatic attraction. Moreover, CIP could also form complexes with Ca2+ and Al—Al—OH on CA-Al-KABs, and thus CIP was attracted to the adsorbent.

Author Contributions

Conceptualization, Y.H. and X.P.; methodology, C.P.; software, C.P.; validation, Y.H., and X.P.; formal analysis, Y.H.; investigation, X.Z. and S.L.; resources, L.X.; data curation, G.X.; writing—original draft preparation, C.P.; writing—review and editing, Y.H.; visualization, C.P.; supervision, Y.H. and F.H.; project administration, Y.H.; funding acquisition, F.H. and L.X. All authors have read and agreed to the published version of the manuscript.

Funding

Financial support for this research was provided by the National Natural Science Foundation of China (NO. 5190083050 and 51908213), Natural Science Foundation of Jiangxi Province (NO. 20192BBH80009, NO. 20192BCD40013, 20192BAB216029 and 20181BAB206037), Science and technology research project of Jiangxi Provincial Department of Education (GJJ180298).

Acknowledgments

Thanks for the support from Jiangxi Province Key Laboratory of Drinking Water Safety.

Conflicts of Interest

There is no conflict of interest.

References

  1. Yue, Y.; Shen, C.; Ge, Y. Biochar accelerates the removal of tetracyclines and their intermediates by altering soil properties. J. Hazard. Mater. 2019, 380, 120821. [Google Scholar] [CrossRef]
  2. Antón-Herrero, R.; García-Delgado, C.; Alonso-Izquierdo, M.; García-Rodríguez, G.; Cuevas, J.; Eymar, E. Comparative adsorption of tetracyclines on biochars and stevensite: Looking for the most effective adsorbent. Appl. Clay Sci. 2018, 160, 162–172. [Google Scholar] [CrossRef]
  3. He, K.; Niu, C.-G.; Chen, A.; Huang, Z.; Peng, M.; Huang, T.; Chen, G. Graphene hybridized polydopamine-kaolin composite as effective adsorbent for methylene blue removal. Compos. Part B Eng. 2019, 161, 141–149. [Google Scholar] [CrossRef]
  4. Mustapha, S.; Ndamitso, M.; Abdulkareem, A.; Tijani, J.; Mohammed, A.; Shuaib, D. Potential of using kaolin as a natural adsorbent for the removal of pollutants from tannery wastewater. Heliyon 2019, 5, 02923. [Google Scholar] [CrossRef] [PubMed]
  5. Kumar, A.; Lingfa, P. Sodium bentonite and kaolin clays: Comparative study on their FT-IR, XRF, and XRD. Mater. Today Proc. 2020, 22, 737–742. [Google Scholar] [CrossRef]
  6. Abdulsalam, I.O.; Adegoke, H.I.; Adekola, F.A. Batch Sorption of Ciprofloxacin on Kaolinitic Clay and nHematite Composite: Equilibrium and Thermodynamics Studies. Moroc. J. Chem. 2016, 4, 384. [Google Scholar]
  7. Ma, W.; Dai, J.; Dai, X.; Yan, Y. Preparation and Characterization of Chitosan/Kaolin/Fe3O4 Magnetic Microspheres and Their Application for the Removal of Ciprofloxacin. Adsorpt. Sci. Technol. 2014, 32, 775–790. [Google Scholar] [CrossRef] [Green Version]
  8. Ibrahim, H.; Jamil, T.; Hegazy, E. Application of zeolite prepared from Egyptian kaolin for the removal of heavy metals: II. Isotherm models. J. Hazard. Mater. 2010, 182, 842–847. [Google Scholar] [CrossRef]
  9. Zhou, K.; Wu, B.; Dai, X.; Chai, X. Development of polymeric iron/zirconium-pillared clinoptilolite for simultaneous removal of multiple inorganic contaminants from wastewater. Chem. Eng. J. 2018, 347, 819–827. [Google Scholar] [CrossRef]
  10. Mnasri-Ghnimi, S.; Frini-Srasra, N. Removal of heavy metals from aqueous solutions by adsorption using single and mixed pillared clays. Appl. Clay Sci. 2019, 179, 105151. [Google Scholar] [CrossRef]
  11. Belhouchat, N.; Zaghouane-Boudiaf, H.; Viseras, C. Removal of anionic and cationic dyes from aqueous solution with activated organo-bentonite/sodium alginate encapsulated beads. Appl. Clay Sci. 2017, 135, 9–15. [Google Scholar] [CrossRef]
  12. Chen, P.-P.; Zhang, H.-P.; Ding, J.; Lin, X.-Y.; Lu, X.; Liu, C.; Tang, Y. Carboxylmethyl konjac glucomannan conjugated polydopamine composites for Pb(II) removal. Carbohydr. Polym. 2017, 162, 62–70. [Google Scholar] [CrossRef] [PubMed]
  13. Filho, E.C.D.S.; Lima, L.C.B.; Silva, F.C.; Sousa, K.S.; Fonseca, M.G.; Santana, S.A. Immobilization of ethylene sulfide in aminated cellulose for removal of the divalent cations. Carbohydr. Polym. 2013, 92, 1203–1210. [Google Scholar] [CrossRef] [PubMed] [Green Version]
  14. Wang, Z.; Kang, H.; Zhang, W.; Zhang, S.; Li, J. Improvement of interfacial interactions using natural polyphenol-inspired tannic acid-coated nanoclay enhancement of soy protein isolate biofilms. Appl. Surf. Sci. 2017, 401, 271–282. [Google Scholar] [CrossRef]
  15. Dambies, L.; Guimon, C.; Yiacoumi, S.; Guibal, E. Characterization of metal ion interactions with chitosan by X-ray photoelectron spectroscopy. Colloids Surfaces A Physicochem. Eng. Asp. 2001, 177, 203–214. [Google Scholar] [CrossRef]
  16. Wu, D.; Zhao, J.; Zhang, L.; Wu, Q.; Yang, Y. Lanthanum adsorption using iron oxide loaded calcium alginate beads. Hydrometallurgy 2010, 101, 76–83. [Google Scholar] [CrossRef]
  17. Lim, S.-F.; Zheng, Y.-M.; Zou, S.-W.; Chen, J.P. Characterization of Copper Adsorption onto an Alginate Encapsulated Magnetic Sorbent by a Combined FT-IR, XPS, and Mathematical Modeling Study. Environ. Sci. Technol. 2008, 42, 2551–2556. [Google Scholar] [CrossRef]
  18. Liu, Y.; Chen, S.; Zhong, L.; Wu, G. Preparation of high-stable silver nanoparticle dispersion by using sodium alginate as a stabilizer under gamma radiation. Radiat. Phys. Chem. 2009, 78, 251–255. [Google Scholar] [CrossRef]
  19. Deng, Z.; Wang, F.; Zhou, B.; Li, J.; Li, B.; Liang, H. Immobilization of pectinases into calcium alginate microspheres for fruit juice application. Food Hydrocoll. 2019, 89, 691–699. [Google Scholar] [CrossRef]
  20. Turel, I.; Bukovec, N.; Farkas, E. Complex formation between some metals and a quinolone family member (ciprofloxacin). Polyhedron 1996, 15, 269–275. [Google Scholar] [CrossRef]
  21. Chen, H.; Ma, L.Q.; Gao, F.; Gu, C. Effects of Cu and Ca cations and Fe/Al coating on ciprofloxacin sorption onto sand media. J. Hazard. Mater. 2013, 252, 375–381. [Google Scholar] [CrossRef] [PubMed]
  22. Zhang, X.; Lin, X.; He, Y.; Luo, X. Phenolic hydroxyl derived copper alginate microspheres as superior adsorbent for effective adsorption of tetracycline. Int. J. Boil. Macromol. 2019, 136, 445–459. [Google Scholar] [CrossRef] [PubMed]
  23. Gu, C.; Karthikeyan, K.G. Sorption of the Antimicrobial Ciprofloxacin To Aluminum and Iron Hydrous Oxides. Environ. Sci. Technol. 2005, 39, 9166–9173. [Google Scholar] [CrossRef] [PubMed]
  24. Wang, C.-J.; Li, Z.; Jiang, W.-T.; Jean, J.-S.; Liu, C.-C. Cation exchange interaction between antibiotic ciprofloxacin and montmorillonite. J. Hazard. Mater. 2010, 183, 309–314. [Google Scholar] [CrossRef] [PubMed]
  25. El-Shafey, E.-S.I.; Al-Lawati, H.A.; Al-Sumri, A.S. Ciprofloxacin adsorption from aqueous solution onto chemically prepared carbon from date palm leaflets. J. Environ. Sci. 2012, 24, 1579–1586. [Google Scholar] [CrossRef]
  26. Patel, S.; Bajpai, A.; Bajpai, J.; Saini, R.K.; Acharya, S. Facile preparation of iron loaded calcium alginate nanocarriers and study of controlled release of iron. J. Environ. Chem. Eng. 2017, 5, 5337–5346. [Google Scholar] [CrossRef]
  27. Lapointe, M.; Barbeau, B. Understanding the roles and characterizing the intrinsic properties of synthetic vs. natural polymers to improve clarification through interparticle Bridging: A review. Sep. Purif. Technol. 2020, 231, 115893. [Google Scholar] [CrossRef]
Figure 1. Morphological characterizations of CA-Al-KABs (aluminum-pillared kaolin sodium alginate beads) ((a) and (b)) and Post-CA-Al-KABs ((c) and (d)).
Water 12 00905 g001
Figure 2. The elemental composition analysis (EDS) (a,b) and elemental mapping spectra of CA-Al-KABs (c), Post-CA-Al-KABs (d).
Water 12 00905 g002
Figure 3. (a) TG (thermogravimetric) analysis of CA-Al-KABs, (b) FT-IR spectra of CA-Al-KABs before and after CIP (ciprofloxacin) adsorption, (c) XRD (X-ray diffraction) patterns of SA and CA-Al-KABs, (d) XPS (X-ray spectroscopy) spectra of wide scan, (e) Ca 2p spectra, (f) Al 2p spectra.
Water 12 00905 g003
Figure 4. (a) Effect of adsorbent dosage on CIP adsorption capacity (initial CIP concentration: 20 mg·L−1, initial pH:7), (b) effect of initial pH on CIP adsorption by CA-Al-KABs (initial CIP concentration: 20 mg·L−1, m/v: 0.04 g/50 mL), (c) and (d) effects of cationic strength (c) and anionic strength (d) on CIP adsorption in binary solution and in multicomponent solution by CA-Al-KABs (initial CIP concentration: 20 mg·L−1, m/v: 0.04 g/50 mL, initial pH:7).
Water 12 00905 g004
Figure 5. (a) Effect of time on CIP adsorption by CA-Al-KABs, (b) the pseudo-first-order fitting plots of adsorption kinetic model, (c) the pseudo-second-order fitting plots of adsorption kinetic model, (d) the fitting plots of intra-particle diffusion model (pH: 4, initial CIP concentration: 20 mg·L−1, m/v: 0.04 g/50 mL). qe, the equilibrium adsorption capacity.
Water 12 00905 g005
Figure 6. (a) Effect of initial CIP concentration on CIP adsorption by CA-Al-KABs, the fitting plots of (b) Langmuir, (c) Freundlich, (d) Temkin, (e) D-R isotherm models, (f) calculated values of RL (pH: 4, contact time: 1440 min, m/v: 0.04cg/50cmL). Ce, the concentration of CIP.
Water 12 00905 g006
Figure 7. (a) The fitting plot of thermodynamic model, (b) Adsorption capacity of CA-Al-KABs to tetracycline and norfloxacin (pH: 4, contact time: 1440 min, m/v: 0.04 g/50 mL), (c) Tetracycline structure, (d) Norfloxacin structure.
Water 12 00905 g007
Figure 8. 3D response surface (a,c,e) and 2D contour lines (b,d,f) for adsorption capacity of CIP by CA-Al-KABs.
Water 12 00905 g008
Figure 9. The mechsnism of CIP loaded on CA-Al-KABs.
Water 12 00905 g009
Table 1. Fitting parameters of adsorption kinetics.
TypeParameterT(K)
288.15298.15308.15
Pseudo-first-order kineticsqe,cal (mg/g)7.6447.7727.779
k1 (min−1)2.46 × 10−32.63 × 10−33.18 × 10⁻³
R20.9950.9960.994
Pseudo-second-order kineticsqe,cal (mg/g)10.11310.1249.686
k2 (g·(mg·min)−1)2.16 × 10−42.38×10−43.37 × 10⁻⁴
R20.9890.9910.997
Intra-particle diffusion modelk1 (mg·(g·min1/2)−1)0.3150.3320.318
R20.9620.9830.997
k2 (mg·(g·min1/2)−1)0.1770.1790.172
R20.9990.9880.989
k3 (mg·(g·min1/2)−1)0.0510.0160.040
R2111
Note: qe,cal, the calculated equilibrium adsorption capacity; T, temperautre; k1 (min−1) and k2 (g·(mg·min)−1) are the rate constants of pseudo-first-order and pseudo-second-order models, respectively; R2 was the R square.
Table 2. Fitting parameters of adsorption isotherm.
TypeParameterT (K)
288.15298.15308.15
Langmuirqm (mg·g−1)58.12462.71268.36
KL (L·mg−1)0.01720.01780.0180
R20.9730.9670.963
FreundlichKF (mg·g−1) (L·mg−1)1/n2.9163.1933.387
1/n0.5550.5550.562
R20.9230.9170.913
TemkinKT (J·mol−1)13.8815.12816.509
f (L·mg−1)0.1420.1440.144
R20.9900.9890.987
Dubinin-Radushkevichqm (mg·g−1)35.57538.48741.564
ε (mol2·J−2)7.1094n−56.1774n−55.5834n−5
R20.9400.9540.959
Note: qm (mg·g−1) was the theoretical maximum adsorption capacity, KL (L·mg−1) was the Langmuir constant, KT (J·mol−1) and f (L·mg−1) were Temkin constant and Temkin binding constant, ɛ was Polanyi’s potential.
Table 3. The fitting thermodynamic parameters for CIP adsorption by CA-Al-KABs.
ΔH0 (kJ·mol−1)ΔS0 (J·(mol·K)−1)ΔG0 ( kJ·mol−1)
288.15 K298.15 K308.15 K
45.430.198−0.805−0.944−1.079
Note: ΔH0; ΔS0; ΔG0 are the changes of entropy, enthalpy, and Gibbs free energy, respectively.
Table 4. Design experiments based on REM and their results.
Standard OrdersIndependent Values(X)Responses (Y)
Real ValuesCoded Values
pHTemperature
(K)
Dosage
(g)
pHTemperature
(K)
Dosage
(g)
qe (mg/g)
17288.150.10−1+12.67
27298.150.060004.42
311308.150.06+1+102.47
47308.150.020+1−15.71
53288.150.06−1−105.57
67298.150.060004.42
77298.150.060004.42
811288.150.06+1−102.28
911298.150.02+10−13.88
107308.150.100+1+17.65
113298.150.10−10+14.78
123298.150.02−10−17.42
137288.150.020−1−15.54
143308.150.06−1106.14
1511298.150.10+10+13.95
167298.150.060004.42
177298.150.060004.42
Table 5. ANOVA (analysis of variance) of quadratic model of qe response.
SourceSum of SquaresDegree of FreedomMean SquareF−ValueP−Value
Model29.6064.936.460.0052
A16.05116.0521.010.0010
B1.5311.532.010.1872
C4.3714.375.720.0379
AB1.8411.842.400.1521
AC0.03610.0360.0470.8323
BC5.7815.787.570.0204
Residual7.64100.76
Lack of Fit7.6461.27
Pure Error0.0040.00
Cor Total37.2416

