Effects of Changing Fertilization since the 1980s on Nitrogen Runoff and Leaching in Rice–Wheat Rotation Systems, Taihu Lake Basin

1
State Key Laboratory of Lake Science and Environment, Nanjing Institute of Geography and Limnology, Chinese Academy of Sciences, Nanjing 210008, China
2
University of Chinese Academy of Sciences, Beijing 100049, China
*
Author to whom correspondence should be addressed.
Water 2020, 12(3), 886; https://doi.org/10.3390/w12030886
Submission received: 7 January 2020
/
Revised: 17 March 2020
/
Accepted: 19 March 2020
/
Published: 21 March 2020
(This article belongs to the Special Issue Nitrogen Removal in Agricultural Watersheds: Through Agricultural Practices and Phytodepuration)
Abstract
:The nitrogen (N) loss associated with intensive agricultural activities is a significant cause of eutrophication and algal blooms in freshwater ecosystems. Taihu Lake has experienced serious surface water quality deterioration and eutrophication problems since the 1980s. The objective of this study is to examine the effect of fertilization changes since the 1980s on the N loss with runoff and leaching in the rice–wheat cropping rotation system. According to the results published in the literature since the 1980s, we set up four fertilization scenarios—N1980s: a fertilization rate of 350 kg N·ha−1·year−1 with 30% in manure fertilization to simulate fertilization in the 1980s; NA1990s: a fertilization rate of 500 kg N·ha−1·year−1 with 10% in manure fertilization to simulate fertilization in the early 1990s; NL1990s: fertilization rate of 600 kg N·ha−1·year−1 with 10% in manure fertilization to simulate fertilization in the late 1990s; and N2000s: fertilization rate of 550 kg N·ha−1·year−1 with all chemicals to simulate fertilization in the 2000s. Then, we calibrated and validated the DNDC (denitrification–decomposition) model through field experiments in two rice–wheat rotation seasons from November 2011 to October 2013 and simulated the N loss with runoff and leaching since the 1980s. The results show that N losses with leaching in the four periods (N 1980s, NA1990s, NL1990s, and N2000s) were 5.2 ± 2.1, 9.4 ± 3.2, 14.4 ± 4.6 and 13.5 ± 4.6 kg N·ha−1·year−1, respectively. N losses with surface runoff were 7.9 ± 3.9, 18.3 ± 7.2, 25.4 ± 10.2, and 26.5 ± 10.6 kg N·ha−1·year−1, respectively. The total N loss through runoff and leaching showed an increasing trend from 1980 to the late 1990s, when it reached its peak. The increase in N export to water due to fertilizer application occurs mainly during the rainy season from March to August, and especially from June to August, when rainfall events and intensive rice fertilization activities are frequent. After the 1990s, when the fertilizer rate was above 500 kg N·ha−1·year−1, the crop yields no longer increased significantly, which indicates that the optimized fertilization rate to balance crop yields and N loss to water is lower than 500 kg N·ha−1·year−1. The increase in fertilizer use has been unnecessary since the early 1990s, and at least about 30% of the N loss could have been prevented without reducing crop yields.
1. Introduction
Non-point N and P export from agricultural lands are important nutrient sources of surface water eutrophication and algae blooms. Understanding the effects of planting patterns on N and P output to water environments is essential because surplus fertilizer application is the primary reason for N and P pollution losses [1,2]. To optimize the fertilizer practice, many scholars studied N and P loss from farmland response to fertilization [3,4,5]. The Taihu region is one of the most developed districts in China, and its water environment has been deteriorating with increasing pollution sources since the 1980s. Recent studies have revealed that Taihu Lake was strong polluted by industrial, domestic, and agricultural activities; among them, agricultural practices account for a substantial proportion of N loads entering rivers. According to Zhang et al. [6], the contributions of agricultural sources to N reached 29% in the Taihu region in 2000s, which exceeded other pollution sources. In the past 30 to 40 years, the application rate of N fertilizer in the Taihu region has almost doubled, and organic fertilizer has been replaced by chemical fertilizer. In current agricultural land practices in the subtropical Taihu Lake region, around 550–600 kg N·ha−1 fertilizer is applied annually, which significantly increases crop yields but leads to about twice as much N lost to the water bodies compared with the knowledge-based optimal N fertilization rate (30%–60% lower) [7]. Tian et al. [8] illustrated that the traditional fertilizer rate far exceeds the demands of crop growth by studying the N loss under three different levels of N application rates varying between 315 and 578 kg·ha−1·year−1 in rice–wheat rotation farmland in the Taihu Lake Watershed. Proper field management practices are equally important for reducing N export to water. Liu et al. [9] showed that N and P loss could be reduced by 7.7% and 8%, respectively, using the straw-returning method. Cherobim et al. [10] reported that a minimum of seven days between post-liquid dairy manure LDM application and a rainfall-runoff event is necessary to provide agronomic benefits while minimizing the potential risk of water pollution. Decreasing the basal fertilizer rate and changing the timing of basal fertilizer application are effective methods to reduce pollution in the early stage of crop growth, given the low nutrient demand [11,12,13].
The combined use of field experiments and models has provided powerful tools for agricultural pollution research. Field experiments are conducted to calibrate model parameters and evaluate simulated results; the models continuously simulate dynamic processes that cannot be achieved by field experiments only. Commonly used non-point models, such as DNDC, EPIC (Environmental Policy-Integrated Climate), WNMM (Water and Nitrogen Management Model), NTRM (Nitrogen Tillage Residue Management), DAISY (Danish Soil-plant-Atmosphere System), and SWAT (Soil and Water Assessment Tool), are generally used to simulate N flux to water environments through transport and biogeochemical processes among the soil, atmosphere, and crops. It is complicated to evaluate the N loss from rice–wheat rotation systems because of the complexity of the N-transformation processes that occur in flooding conditions during rice seasons. To investigate the nitrogen cycle in paddies, a number of models have been developed to rely on the exit model of agricultural drainage. Kim et al. [14] developed CREAMS–PADDY from the Chemicals Runoff and Erosion from Agricultural Management Systems(CREAMS) modelto simulate the physically-based, field-scale chemicals, runoff, and erosion. Chung et al. [15] developed GLEAMS–PADDY from the Groundwater Loading Effects of Agricultural Management Systems (GLEAMS) model to predict nutrient loading of surface waters from paddy rice fields. Aschonitis et al. [16] combined the existing modeling approach in the GLEAMS–PADDY model and an algae growth model for the combined growth of rice and alga in rice fields. Tournebize et al. [17] provided a coupled model ((Pesticide Concentration in Paddy Field)PCPF–(Soil Water Management System)SWMS) to simulate the fate and behavior of pollutants in paddy water and paddy soil. Antonopoulos [18] developed a water and nitrogen balance model for the surface ponded water compartment of rice fields to estimates the daily ponded water depth and the daily losses and the uses of NH4–N and NO3–N in their transformation processes. Nitrogen loss in rice fields has also been studied by modifying existing models. Nishida [19] enhanced the Material Flow Analysis (MFA) model by incorporating a nitrogen cycle model for the paddy system in the Day-Nhue River Basin, Vietnam. Dong et al. [20] modified the DrainMOD and DrainMOD-N to simulate farm drainage and N loss on a field scale in Hubei province, China. All current models require detailed information on the hydraulic properties of paddy soils and nitrogen transformation rate constants, which are not usually readily obtainable. In addition, the application of models initiated abroad in China still needs to be tested in practice. In this study, the DNDC model was selected to estimate changes in N balance related to different fertilization practices in a rice–wheat crop rotation field. The DNDC model has been widely used to model N cycling for cropland and grassland under arranged management practices [21], given easily accessible input parameter data (soil, climate, and agricultural activity) and professional simulation functions available for most parameters at a daily time step [22]. Although it has simpler input parameters than most C and N models, DNDC was built using a detailed process. Most importantly, the DNDC model has a number of features that are lacking in other models, but are important for the Chinese agro-ecosystem, such as paddy rice cultivation, complex multi-cropping systems, and intensive management [23]. The DNDC model research team has completed many field campaigns in China to collect observational data to support the model [24,25]. Earlier versions of the DNDC model focused on greenhouse gas emissions and soil carbon, and later with the coupling of hydrological modules, the model was able to simulate N loss with runoff and leaching [26,27]. In the latest version, DNDC 9.5, new parameters about paddy fields were added to the model to adequately simulate the impact of rice field configurations on the field water dynamics [24,28]. The applicability of the DNDC model to simulate N loss from a flooded paddy field has been verified in recent years. Zhang et al. [21] used the DNDC model to evaluated the general trend of soil organic carbon (SOC) dynamics and N loss from paddy soil under three fertilization practices. Zhao et al. [29] optimized the current fertilization scheme in paddy fields in Shanghai with a combination of field observation and DNDC modeling.
The objective of this study is to examine the effect of fertilization changes since the 1980s on the N loss from runoff and leaching in the rice–wheat rotation system. We conducted the following to study the effects of changing fertilization on N loss: (1) On the basis of a literature review, we investigated the changes in fertilization in rice–wheat rotation fields since the 1980s in the Taihu region. According to the investigation results, we set up four fertilization scenarios—N1980s with a fertilization rate of 350 kg N·ha−1·year−1 to simulate fertilization in the 1980s; NA1990s, with a fertilization rate of 500 kg N·ha−1·year−1 to simulate fertilization in the early 1990s; NL1990s, with a fertilization rate of 600 kg N·ha−1·year−1 to simulate fertilization in the late 1990s; and N2000s with a fertilization rate of 550 kg N·ha−1·year−1 to simulate fertilization in the 2000s in the area. (2) Field plot experiments were conducted according to the N1980s and N2000s fertilizer practices at the Changshu Agro-Ecological Station, which is located in a typical agricultural area, to provide input parameters and validate the DNDC model. (3) The DNDC model was employed to simulate the N loss in runoff and leaching since the 1980s. (4) We analyzed the changing characteristics of N loss in runoff and leaching and identified optimized field management practices.
2. Materials and Methods
2.1. Experimental Site and Treatments
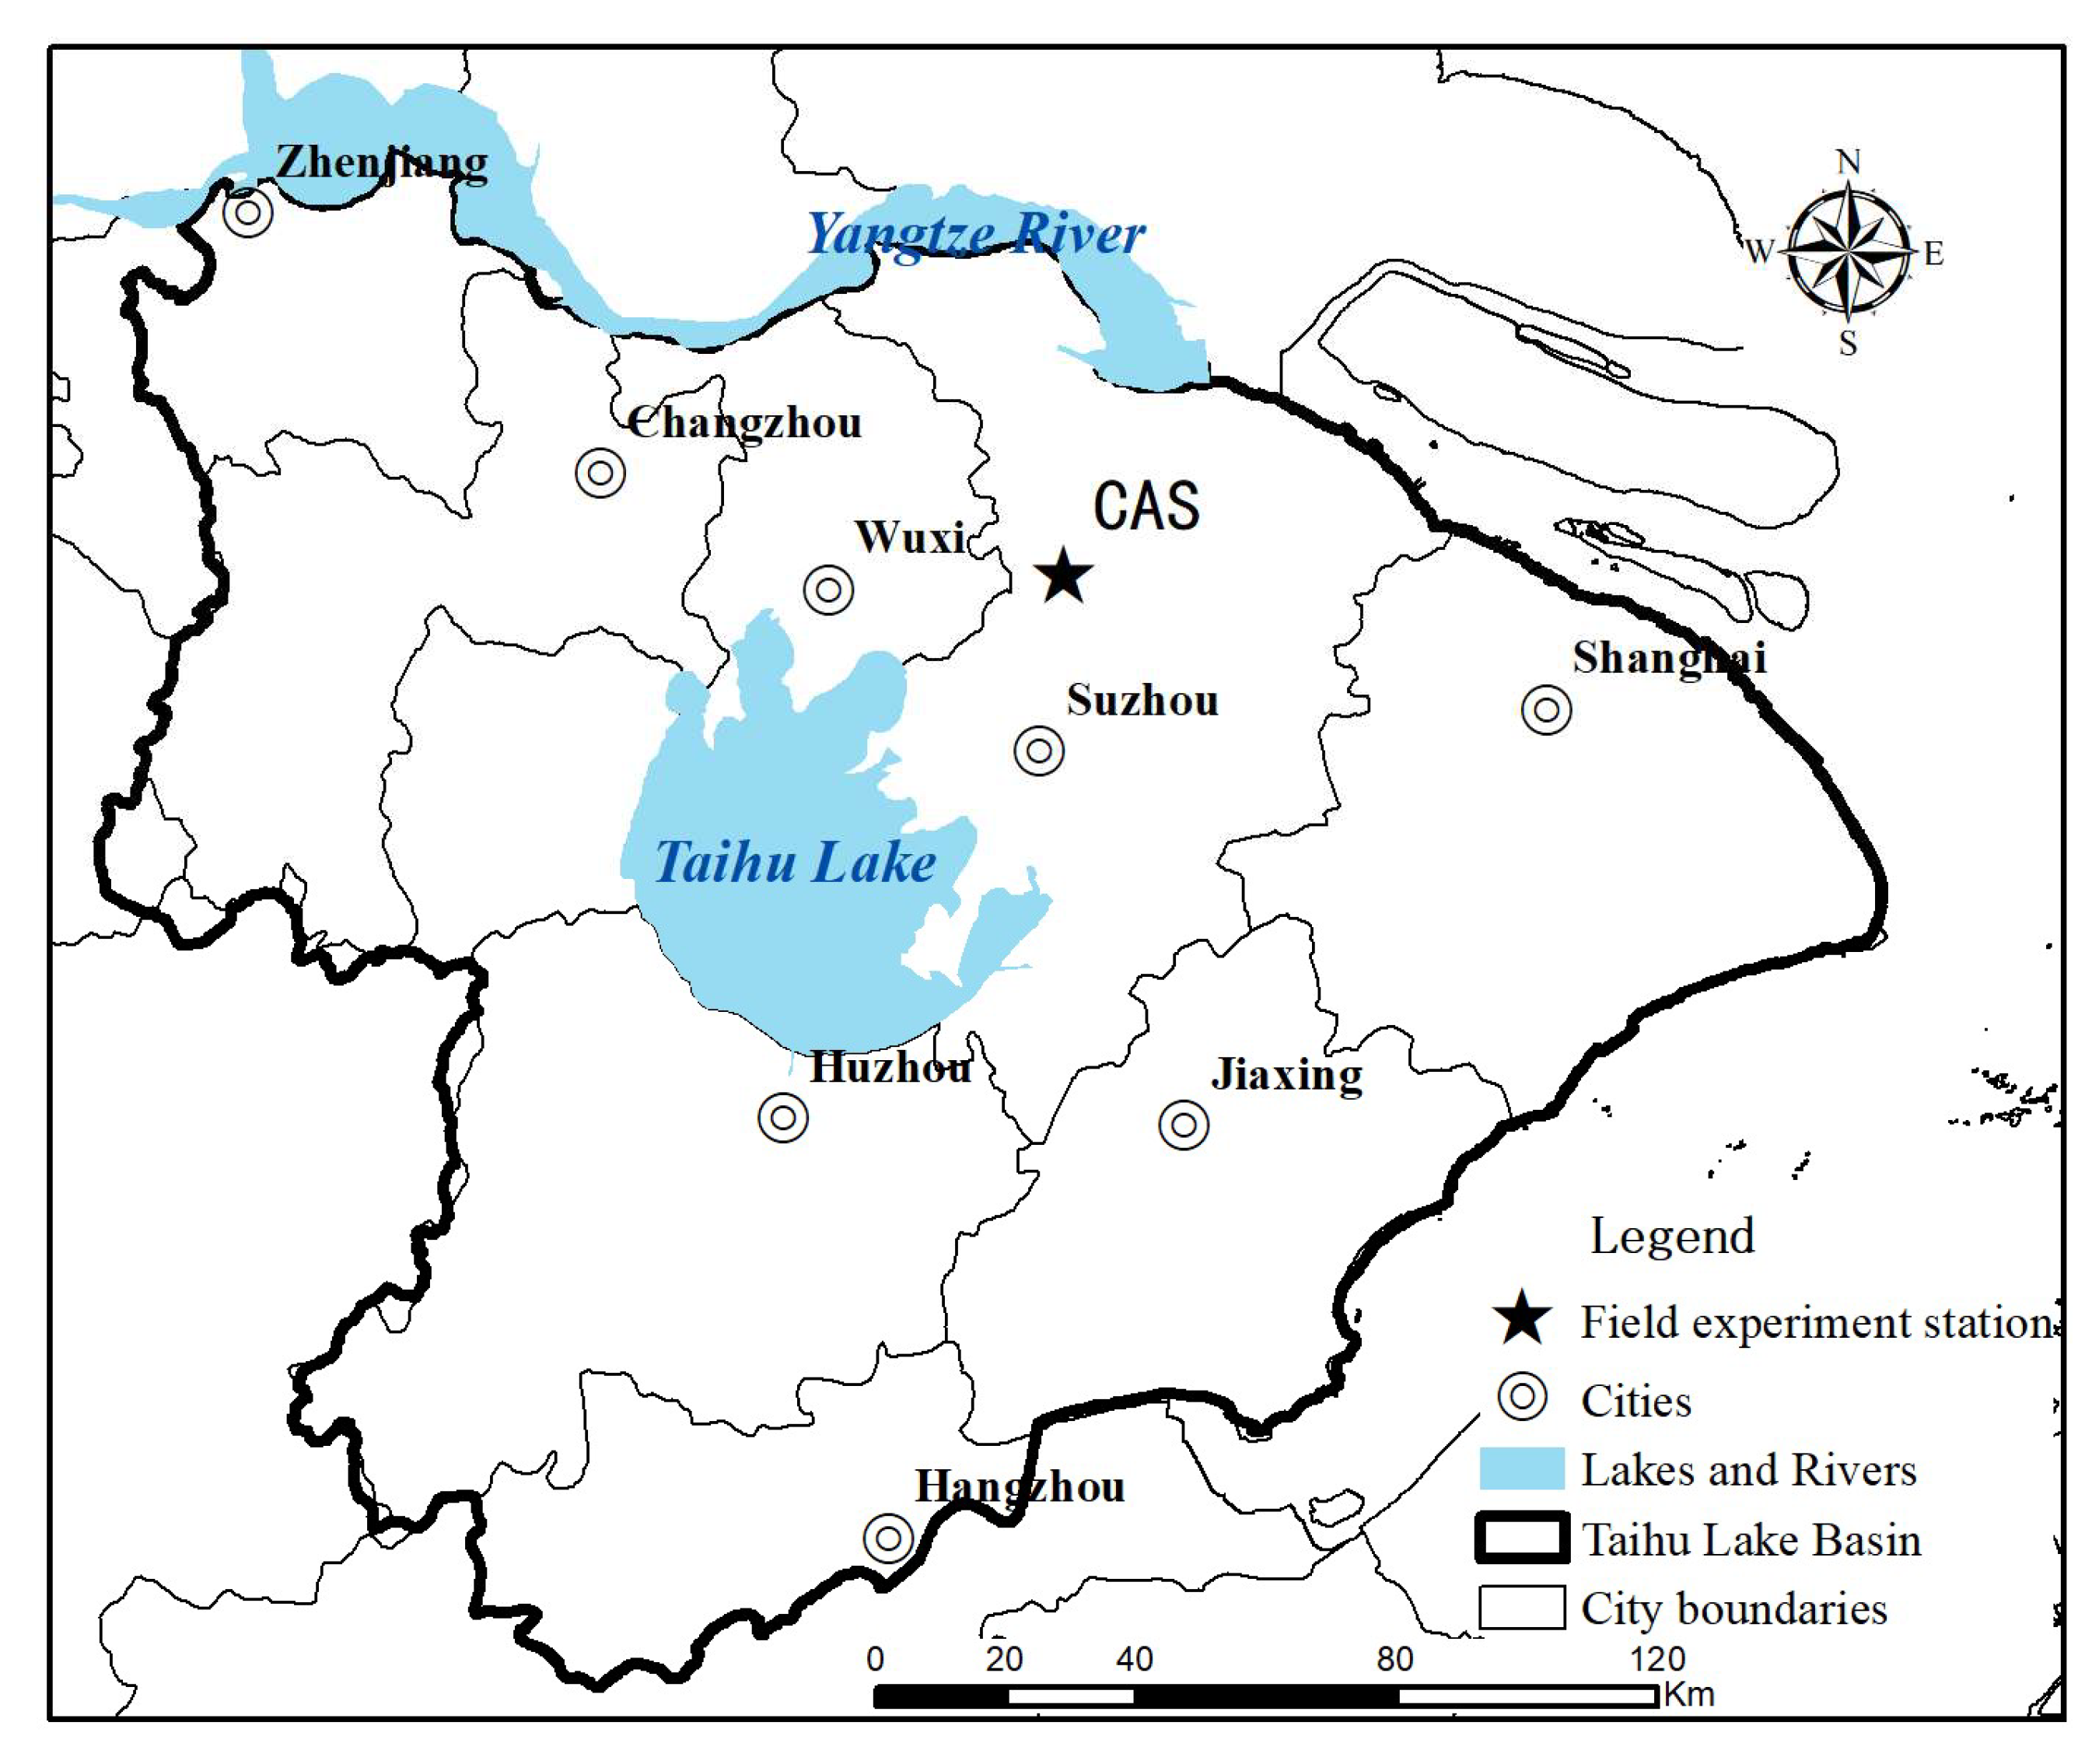
The field experiments (Objective 2) were conducted at the Changshu Agro-Ecological Experimental Station (CAS; 31°32′45″ N, 120°41′57″ E) of the Chinese Academy of Sciences in Jiangsu Province (Figure 1). The station is located in the Taihu Lake region with a dominant cropping system of rice and wheat rotation. It is only 1 km northwest of Taihu Lake and has a subtropical monsoon climate, with an average annual air temperature of 15.8 °C and annual precipitation of 1177 mm. The soil type is a gleyic paddy soil (Gleyic Anthrosols, WRB) with a clay loam texture (clay 14%, silt 76%, and sand 10%). It has a bulk density of 1.19 g·cm−3, pH (H2O) of 7.5, and organic matter (OM) concentration of 20.0 g·kg−1.
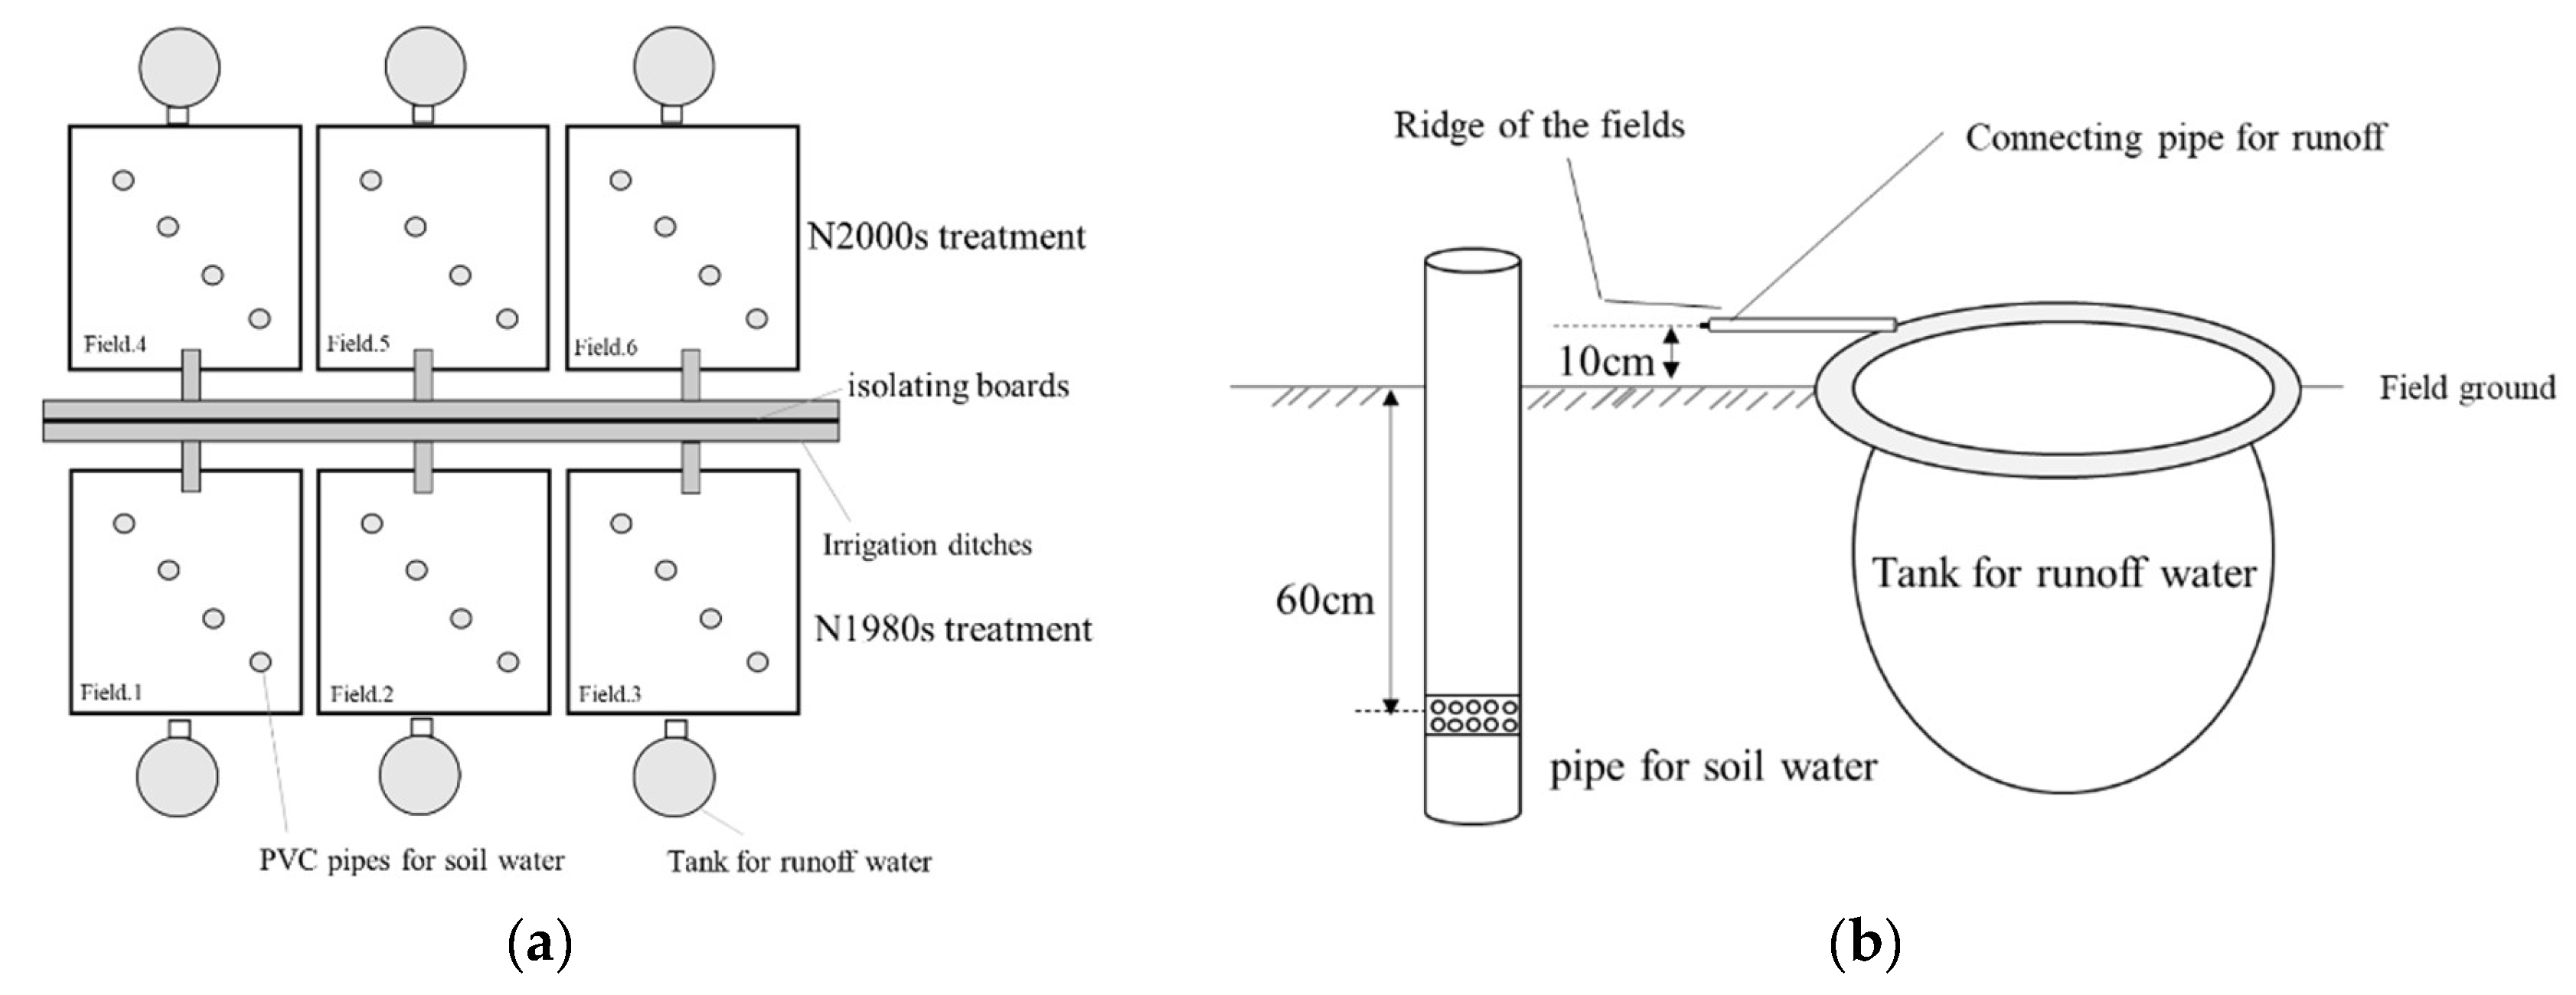
A portion of a paddy field surrounded by larger paddy fields was selected and divided into six experimental plots for observation. The structure of the experimental field system is shown in Figure 2. Each experimental plot had a size of 4 × 4 m and was used for experiments from November 2011 to October 2013, covering two rotation seasons. Each plot was bordered by isolating walls, which were positioned at 1.0 m below and 0.2 m above the soil surface to prevent the lateral flow of water and nutrients. Another large isolation plate divided the six plots into two groups.
Tanks were employed to collect the runoff water, and flow meters were set at the inlet of the tanks to record the volume of water outflow. During the rice seasons, horizontal connecting pipes located about 10 cm above the soil surface channeled the runoff water into nearby tanks (with cover plates to prevent rainwater from entering). In the rice seasons, the dam at the drainage outlets was opened mechanically and runoff flowed directly into the tanks. Polyvinylchloride (PVC) pipes with several holes were installed at 60 cm below the soil surface in the experimental fields to collect the soil water samples (Figure 2b).
N loss was examined at two levels of fertilization, and we used three replicates for each treatment. For the N1980s treatment plots (Fields 1–3 in Figure 2a), the fertilization rate was 200 kg N·ha−1 (140 kg N·ha−1 ammonium bicarbonate and 60 kg N·ha−1 pig manure) for the rice and 150 kg N·ha−1 (105 kg N·ha−1 ammonium bicarbonate and 45 kg N·ha−1 pig manure) for the wheat; for the N2000s treatment plots (Fields 4–6), the fertilization rate was designed at 350 kg N·ha−1 (175 kg N·ha−1 urea, 105 kg N·ha−1 ammonium bicarbonate, 70 kg N·ha−1 synthetic fertilizer) for the rice and 200 kg N·ha−1 (100 kg N·ha−1 urea, 60 kg N·ha−1 ammonium bicarbonate, 40 kg N·ha−1 synthetic fertilizer) for wheat. The wheat seasons began in early November and ended in early June, and no irrigation occurred during the growing seasons. The rice seasons began in late June and ended in late October, and irrigation was applied throughout the whole season except for during the artificially managed aeration period. According to farmers’ planting experience, the aeration period lasts for approximately 7–10 days. The depth of the covering water layer was maintained at approximately 5–8 cm during the flooded period. In the experiment, rice cultivar sū xiāng jīng 2# and wheat cultivar yáng mài 10# were selected for the plots. Normal cultivation and field management practices in the experimental field were controlled by local crop growers employed by the CAS and are shown in Table 1. Conventional plowing was conducted with a depth of 10–20 cm before sowing and partial biomass of the last season, including the root and 10–20 cm of stem left in the field plowed directly into the soil.
2.2. Sampling and Measurements
Soil water, runoff water, and crop biomass were collected regularly during crop growth. The water samples of the surface runoff in each plot were gathered at the end of every month or after heavy rain events. The N losses in surface runoff were calculated by multiplying the N concentrations in the water samples and the volume of the water outflow (recorded by the flow meter). The leached water was gathered with a vacuum hand pump one time before and six times after N fertilizer was applied or after every rain event during the wheat and rice growing periods. Water preexisting in the porous pipe was drained and discarded before sampling to avoid contamination. N concentrations of water samples were analyzed with a continuous-flow N analyzer (Skalar, Netherlands). In addition, in the rice season, samples of irrigation water were collected for N concentration analysis. At harvest, several 0.1 m2 quadrats were randomly selected in each sample plot for root, stems, leaf, and grain subsamples. The subsamples were weighted after heat-processing at 105 °C for 30 min and oven-dried at 70 °C for 24 h. Then, the samples were ground and sieved for C and N analyses. N was determined using the semi-micro Kjeldahl method [30], and C was determined by the CODCr method [31].
2.3. DNDC Model
The DNDC model (version 9.5; http://www.dndc.sr.unh.edu/) was used to simulate N loading in this study. The DNDC model has been applied in China for many years with encouraging results, but few studies have used the original version of the model to simulate N loading. In the recent version, the N loading simulation module was added in response to the serious eutrophication problem in China [32]. The DNDC model is a daily-step process-based ecosystem model involving six interacting sub-models for simulating soil climate, plant growth, decomposition, nitrification, denitrification, and fermentation. The soil climate sub-model calculates soil temperature and moisture fluxes at daily intervals based on soil physical properties, weather, and plant water use. The crop growth sub-model simulates crop biomass accumulation and partitioning by the physiological parameters stored in the crop library files. The decomposition sub-model calculates decomposition, nitrification, NH3 volatilization, and CO2 production [33,34]. The nitrification sub-model tracks the growth of nitrifiers and turnover of NH4+ to NO3−. The denitrification sub-model simulates denitrification and the production of NO, N2O, and N2 [35,36], whereas the fermentation sub-model quantifies CH4 production, oxidation, and transport [37,38,39].
Accurately modeling soil water dynamics is a prerequisite for accurately simulating N turn over in the soil–plant system. The soil water balance is calculated in the soil climate sub-model of DNDC, including all the factors that affect water movements, such as rainfall, irrigation, surface runoff, subsurface leaching, transpiration, infiltration, and evaporation. As soon as NH4+ ions are introduced into the soil through fertilization, atmospheric deposition, irrigation, or biological fixation, the NH4+ released into the soil liquid phase can be quickly converted to NO3− by nitrifiers. Although NO3− can be reused by the soil microbes, the anion does not have the affinity to soil adsorbents. This increases the chance for NO3− to move into the leaching water-flow. To improve the ability to correctly simulate N losses through surface runoff or subsurface leaching in rice paddies, two widely used functions, the SCS curves and the modified universal soil loss equation (MUSLE), were incorporated into the DNDC model.
The crop growth curve is used to estimate crop growth [37]. Driven by climate drivers, soil features, crop parameters, and farming practices, the crop growth sub-model simulates plant growth and its effect on the soil system and passes the litter production and water and N demands to the decomposition sub-model.
Daily meteorological data, the physical and chemical properties of soil, field management practices, and crop parameters observed in the field were entered into the DNDC model to predict N transport and transformation. All input parameters were collected on the basis of the actual paddy field configurations and our field observations to calibrate the DNDC model. We collected daily meteorological data parameters, including minimum temperature, maximum temperature, precipitation, and wind speed from a weather station only tens of meters away, belonging to the CAS. The soil properties during the experiment period were as follows: the texture was silty loam, bulk density was 1.37 g·cm−3, pH was 5.7, soil nitrate concentration was 14.79 mg·kg−1, soil ammonium concentration was 4.50 mg·kg−1, and SOC was 0.022 kg C·kg−1 soil. Details of the field management practices are shown in Table 1. Crop parameters, including maximum yields, biomass partitions, and C/N ratios shown in Table 2, were also calibrated through the collection and determination of rice and wheat harvest biomass samples. Other parameters were as follows: the conventional flooding edge height of the paddy field was 10 cm, the N concentration in flooding water was 4.34 mg·L−1, and the soil water percolation rate was set to 1.6 mm·day−1. Then, DNDC was run on the basis of the revised input dataset, and N losses in surface runoff and subsurface leaching were simulated.
2.4. DNDC Calibration and Validation
The DNDC model was validated for the simulation of biomass, N leaching, and runoff loss under different agricultural management practices in the Taihu region. The model performance was evaluated using the measurements (crop biomass, runoff rate, and N concentrations of soil water runoff) obtained in the experimental field. The statistical criteria consisting of the relative root–mean– square error (rRMSE), mean deviation (MD), coefficient of determination (r2), and efficiency of determination (EF) calculated by Equations (1)–(4) were used to assess model performance:
where n is the total number of field observations; Si and are the simulated and the observed values, respectively; and is the mean of the observed values.
After calibration and validation, the DNDC model was used to estimate the responses of the N emission to water, the atmosphere, and uptake by plant vegetation to changes in fertilization since the 1980s.
2.5. Sensitivity Analysis
Sensitivity analysis was used to evaluate the impacts of input parameters on N loss from the rice–wheat rotation field. The sensitivity index (SI) was adopted to evaluate the impacts of the variation in the selected parameters on the simulated results. The SI is calculated as follows:
where I1, I2, and I12 are the min, max, and average input values of the selected parameters, respectively; and O1, O2, and O12 are the corresponding simulated results, respectively. Positive and negative SI values indicate positive and negative correlations between the selected parameters and simulated results, respectively. When SI = 1, the simulated results change by the same proportion as the input value changes by a certain proportion relative to the average values.
2.6. Fertilization Changes and Scenario Settings
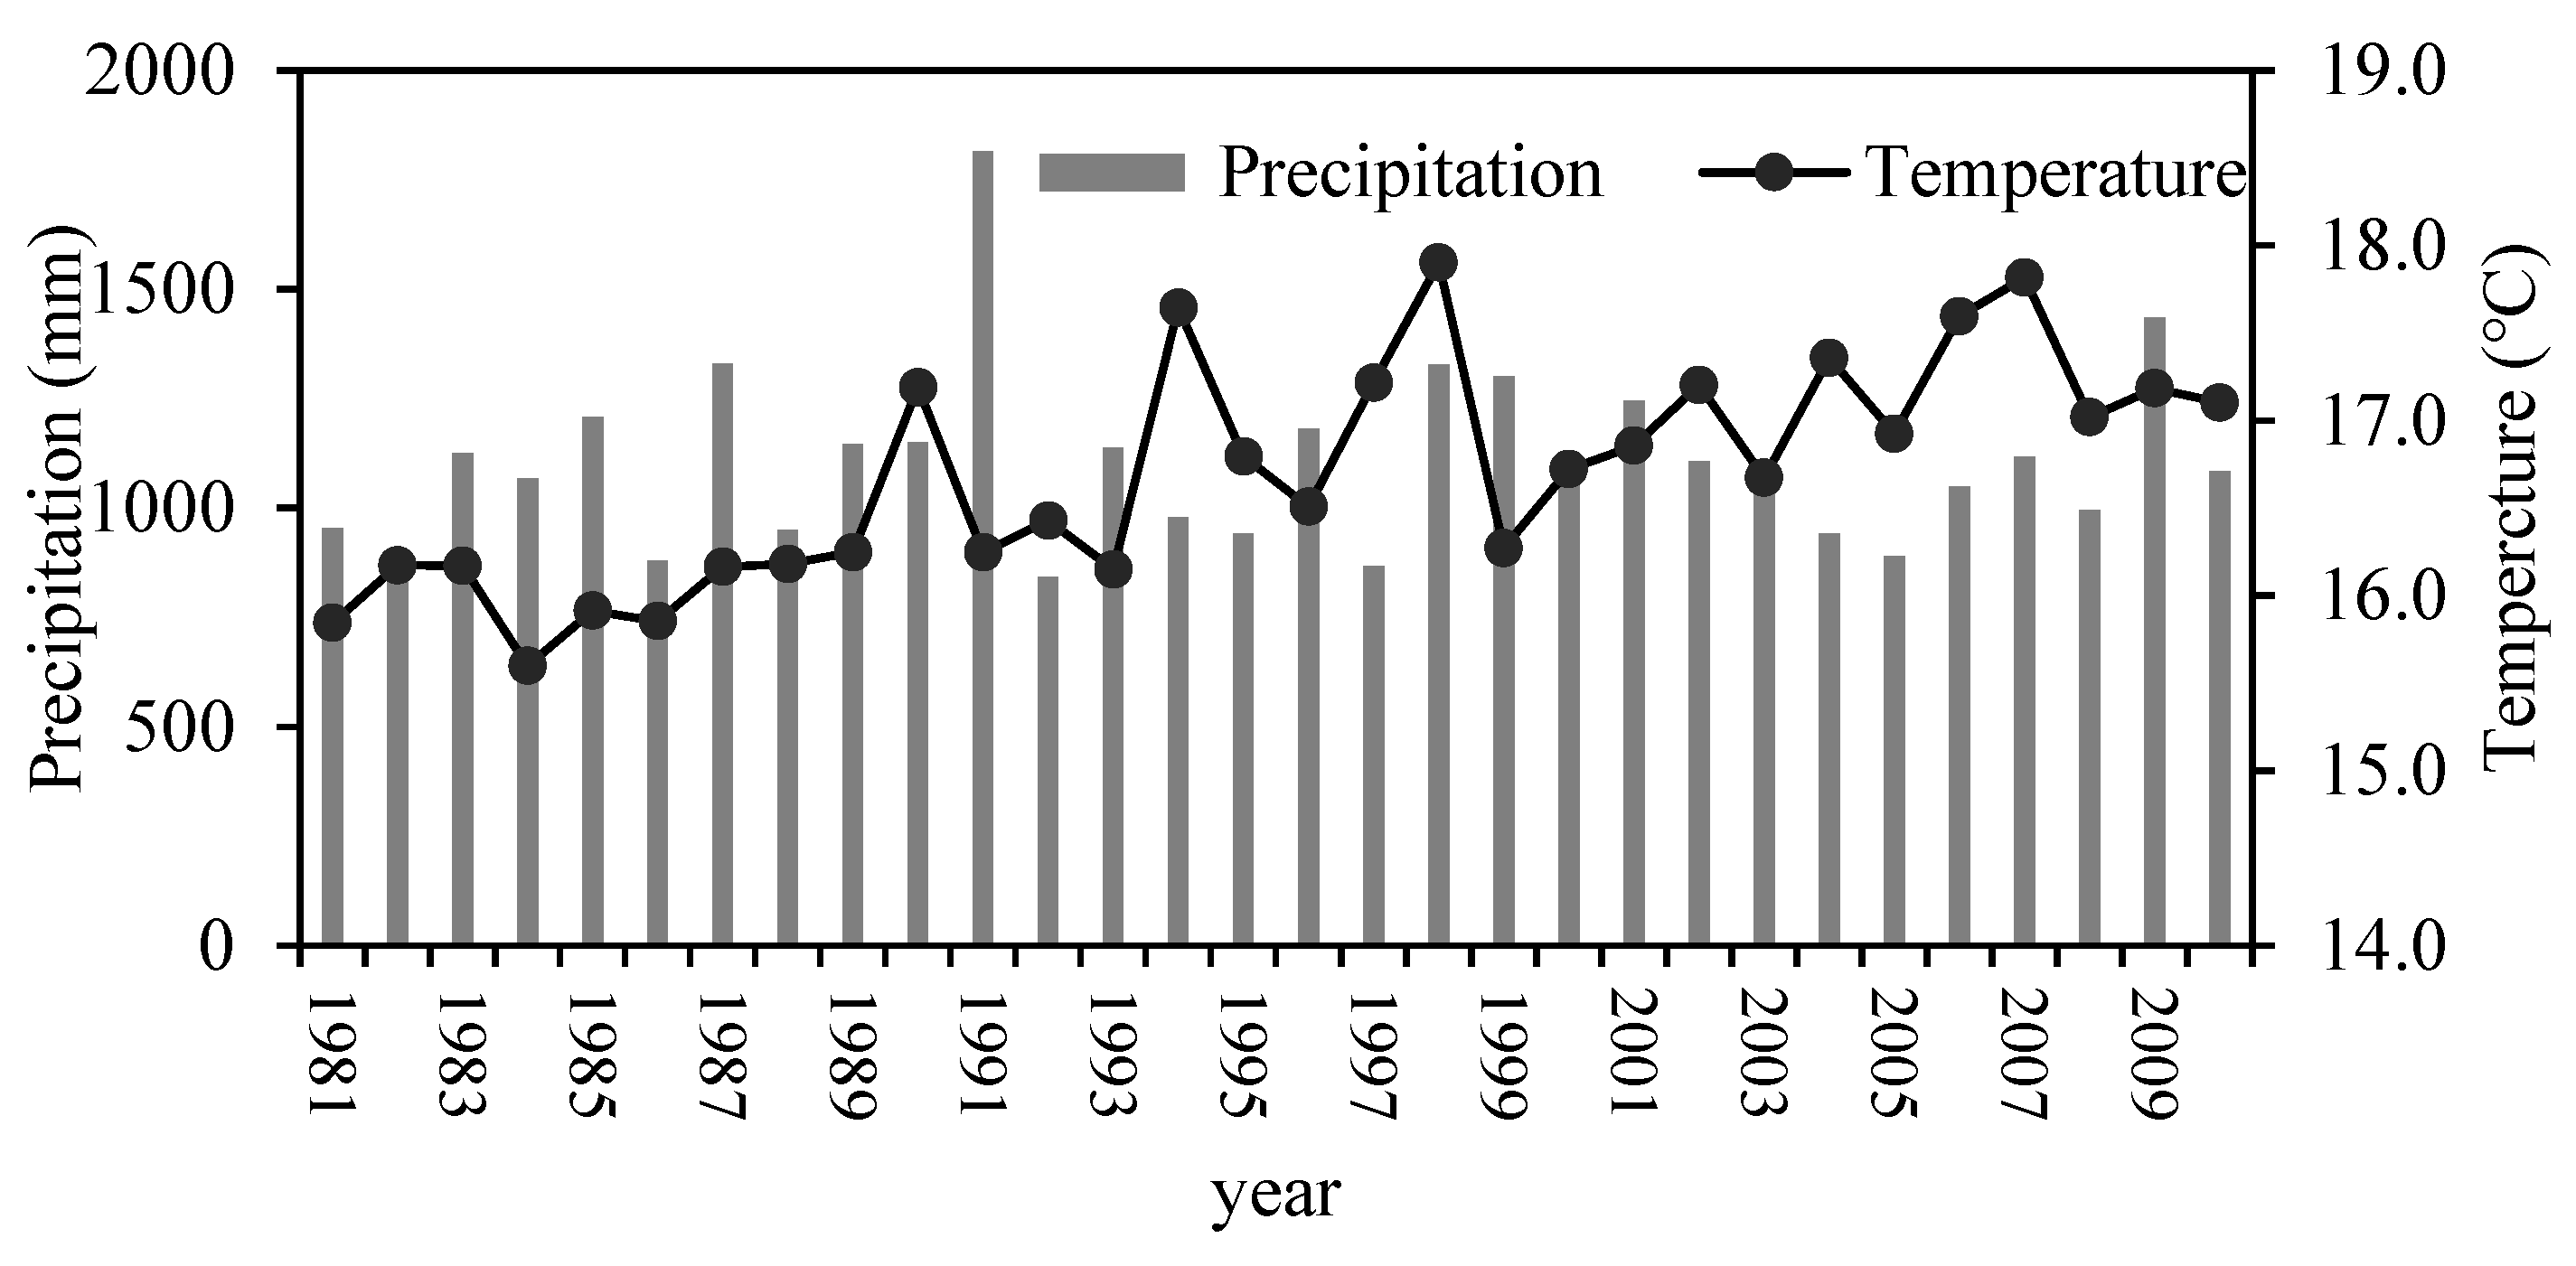
The changes in fertilization practices since the 1980s were organized (Objective 1) according to the literature review and the statistical yearbook, and then four fertilization scenarios (Table 3) were set to simulate and assess the N loss and crop growth process. Scenario N1980s, NA1990s, NL1990s, and N2000s separately represent the fertilization practices in the 1980s, the early 1990s, the later 1990s, and the 2000s. All the input meteorological data were obtained from the nearby Wuxi national weather station for the period from 1980 to 2010 (https://data.cma.cn/). The annual rainfall range was 844–1816 mm, with an average of 1103 mm; the annual average temperature range was 15.6–17.9 °C, with an average of 16.7 °C (Figure 3). For other input items such as soil properties, field management practices, and crop parameters, we referred to observational results from the CAS fields, as shown in Section 2.3.
3. Results
3.1. DNDC Model Validation
According to the validation results, the ability of the DNDC model to simulate N loss in the rice–wheat rotation system was verified.
3.1.1. N in Soil Water
Figure 4 shows a scattergram of observed and simulated soil water N concentration and their distribution along with the 1:1 fitted line. r2, EF, rRMSE, and MD were respectively 0.94, 0.91, 40.97, and 0.32 for the N2000s practice, and 0.90, 0.89, 59.27, and −0.65 for the N1980s practice, respectively. N concentration was lightly underestimated. The underestimated concentration was mostly over 15.0 mg·L−1. The mineralization of organic matter is influenced by soil properties, climate, microorganisms, fertilization treatments, and agricultural practices. Therefore, the simulation of the mineralization process is relatively complex and difficult. Although we observed a deviation in the simulation of the extreme peak value in the mixed fertilization practice, the model was still able to express the seasonal variation characteristics, and it produced good simulation results in the simulation of all chemical fertilizer practices.
3.1.2. N Loss in Runoff
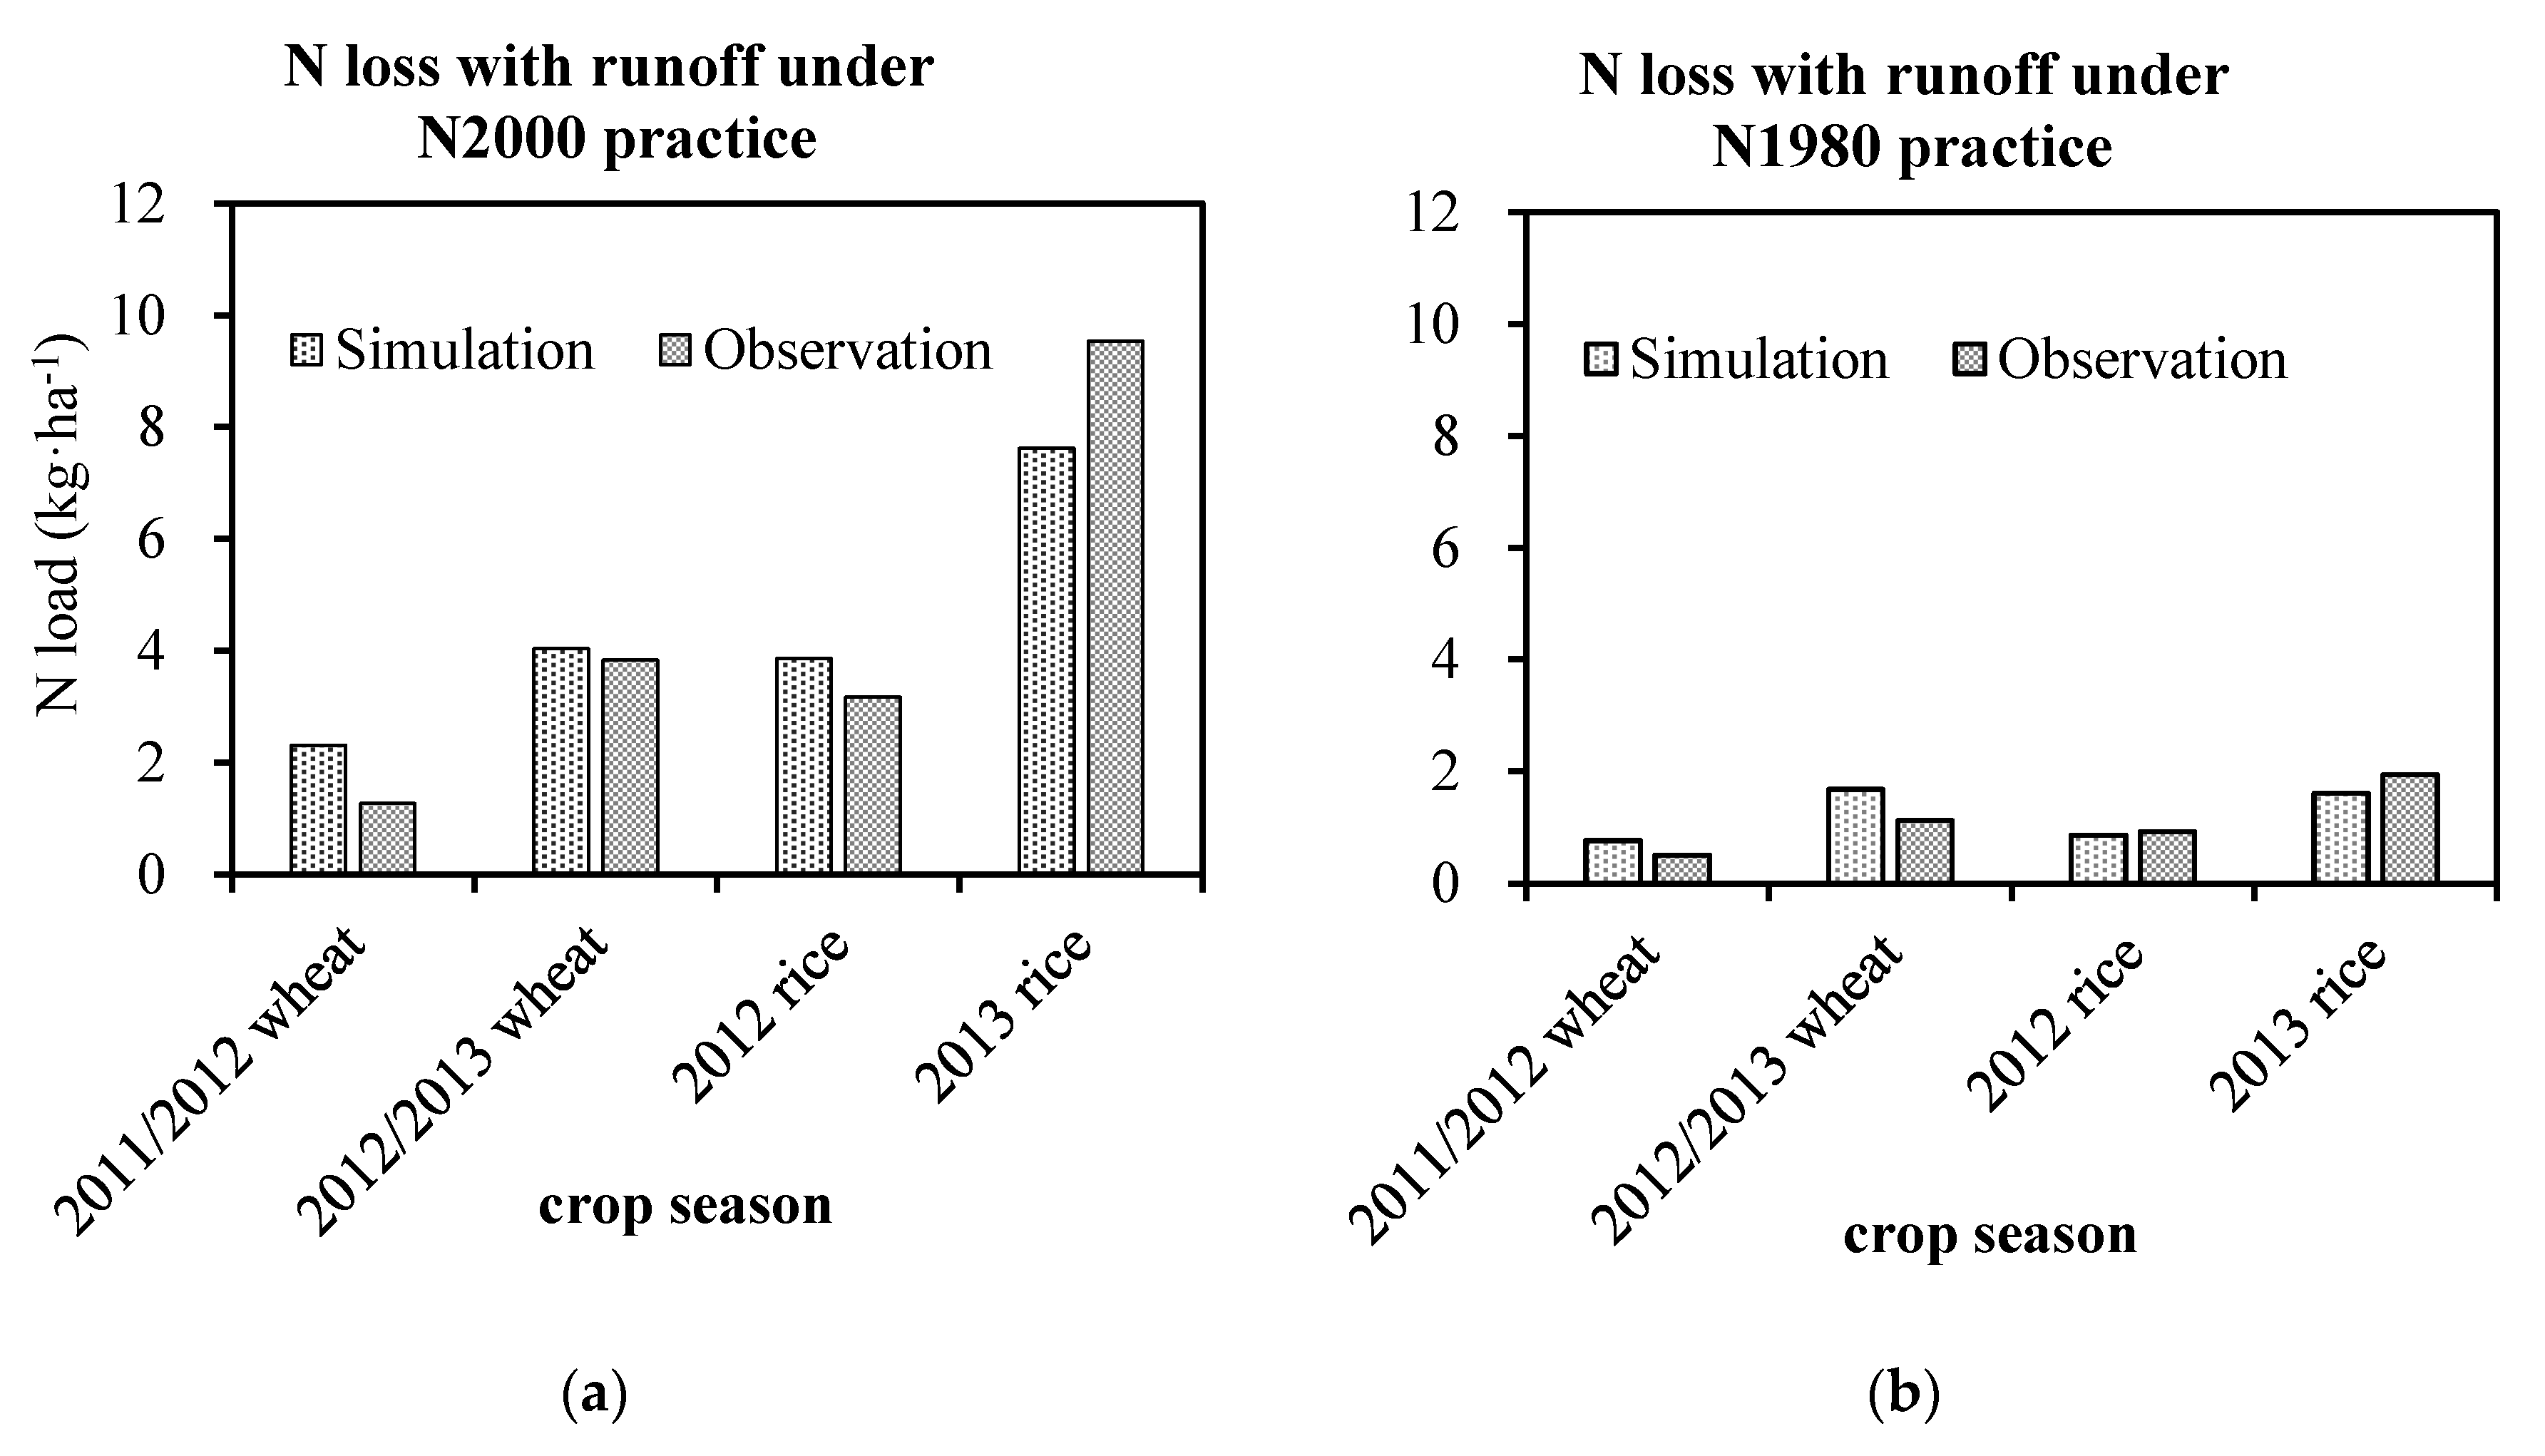
We compared the observed and simulated surface runoff loading based on crop season (Figure 5). The r2, EF, rRMSE and MD were 0.94, 0.91, 30.44, and 0.05, respectively. In cases with less precipitation, the runoff was usually unable to meet the needs for one experiment, which might have increased the error between the monitored value and the simulated value. The observed surface runoff results were generally slightly lower than the simulated results during the wheat seasons, possibly because some trace surface runoff samples were not collected during the dry wheat seasons.
3.1.3. Crop Growth Biomass
Table 4 shows the farmland observation and DNDC simulation crop growth biomass. With r2 = 0.92, EF = 0.84, rRMSE = 25.95, and MD = −248.66, the simulation precision of crop growth was slightly lower than that for surface runoff and soil water. The crop biomass was underestimated in the N1980s practice. This result might be related to the underestimation of soil water N concentration. The simulation precision of crop yield for the N2000s practice and the changes in observed and simulated results were highly consistent for different years and fertilization rates, so DNDC could be used to analyze the effect of the fertilization rate and rainfall on N loss.
3.2. Sensitivity Analysis
A sensitivity analysis was conducted with the validated DNDC model to evaluate the impact of the parameters on simulated results and identify the key factors that affected N loss with runoff and leaching. The SI results shown in Table 5 indicate that N loss in surface runoff was most sensitive to precipitation and the fertilization rate, and it was relatively less sensitive to the ratio of manure fertilizer, SOC content, soil bulk density, and the soil clay fraction. N loss in leaching was most sensitive to soil clay fraction, precipitation, and fertilization, and it was relatively less sensitive to SOC content, soil bulk density, and the ratio of manure fertilizer. N loss in both runoff and leaching occurred independent of soil pH. In addition, rice yields were only sensitive to fertilization at 350–500 kg N·ha−1, which indicates that the optimal fertilization rate for the rice–wheat rotation system is not more than 500 kg N·ha−1.
Fertilization and precipitation were the two most important factors affecting N loss in the rice–wheat rotation system because soil properties were relatively stable, though the soil bulk density was the most sensitive factor to N loss in leaching. The effects of changes in rainfall and fertilization on N loss were thus crucial to understand.
3.3. Annual Dynamics of N Loss
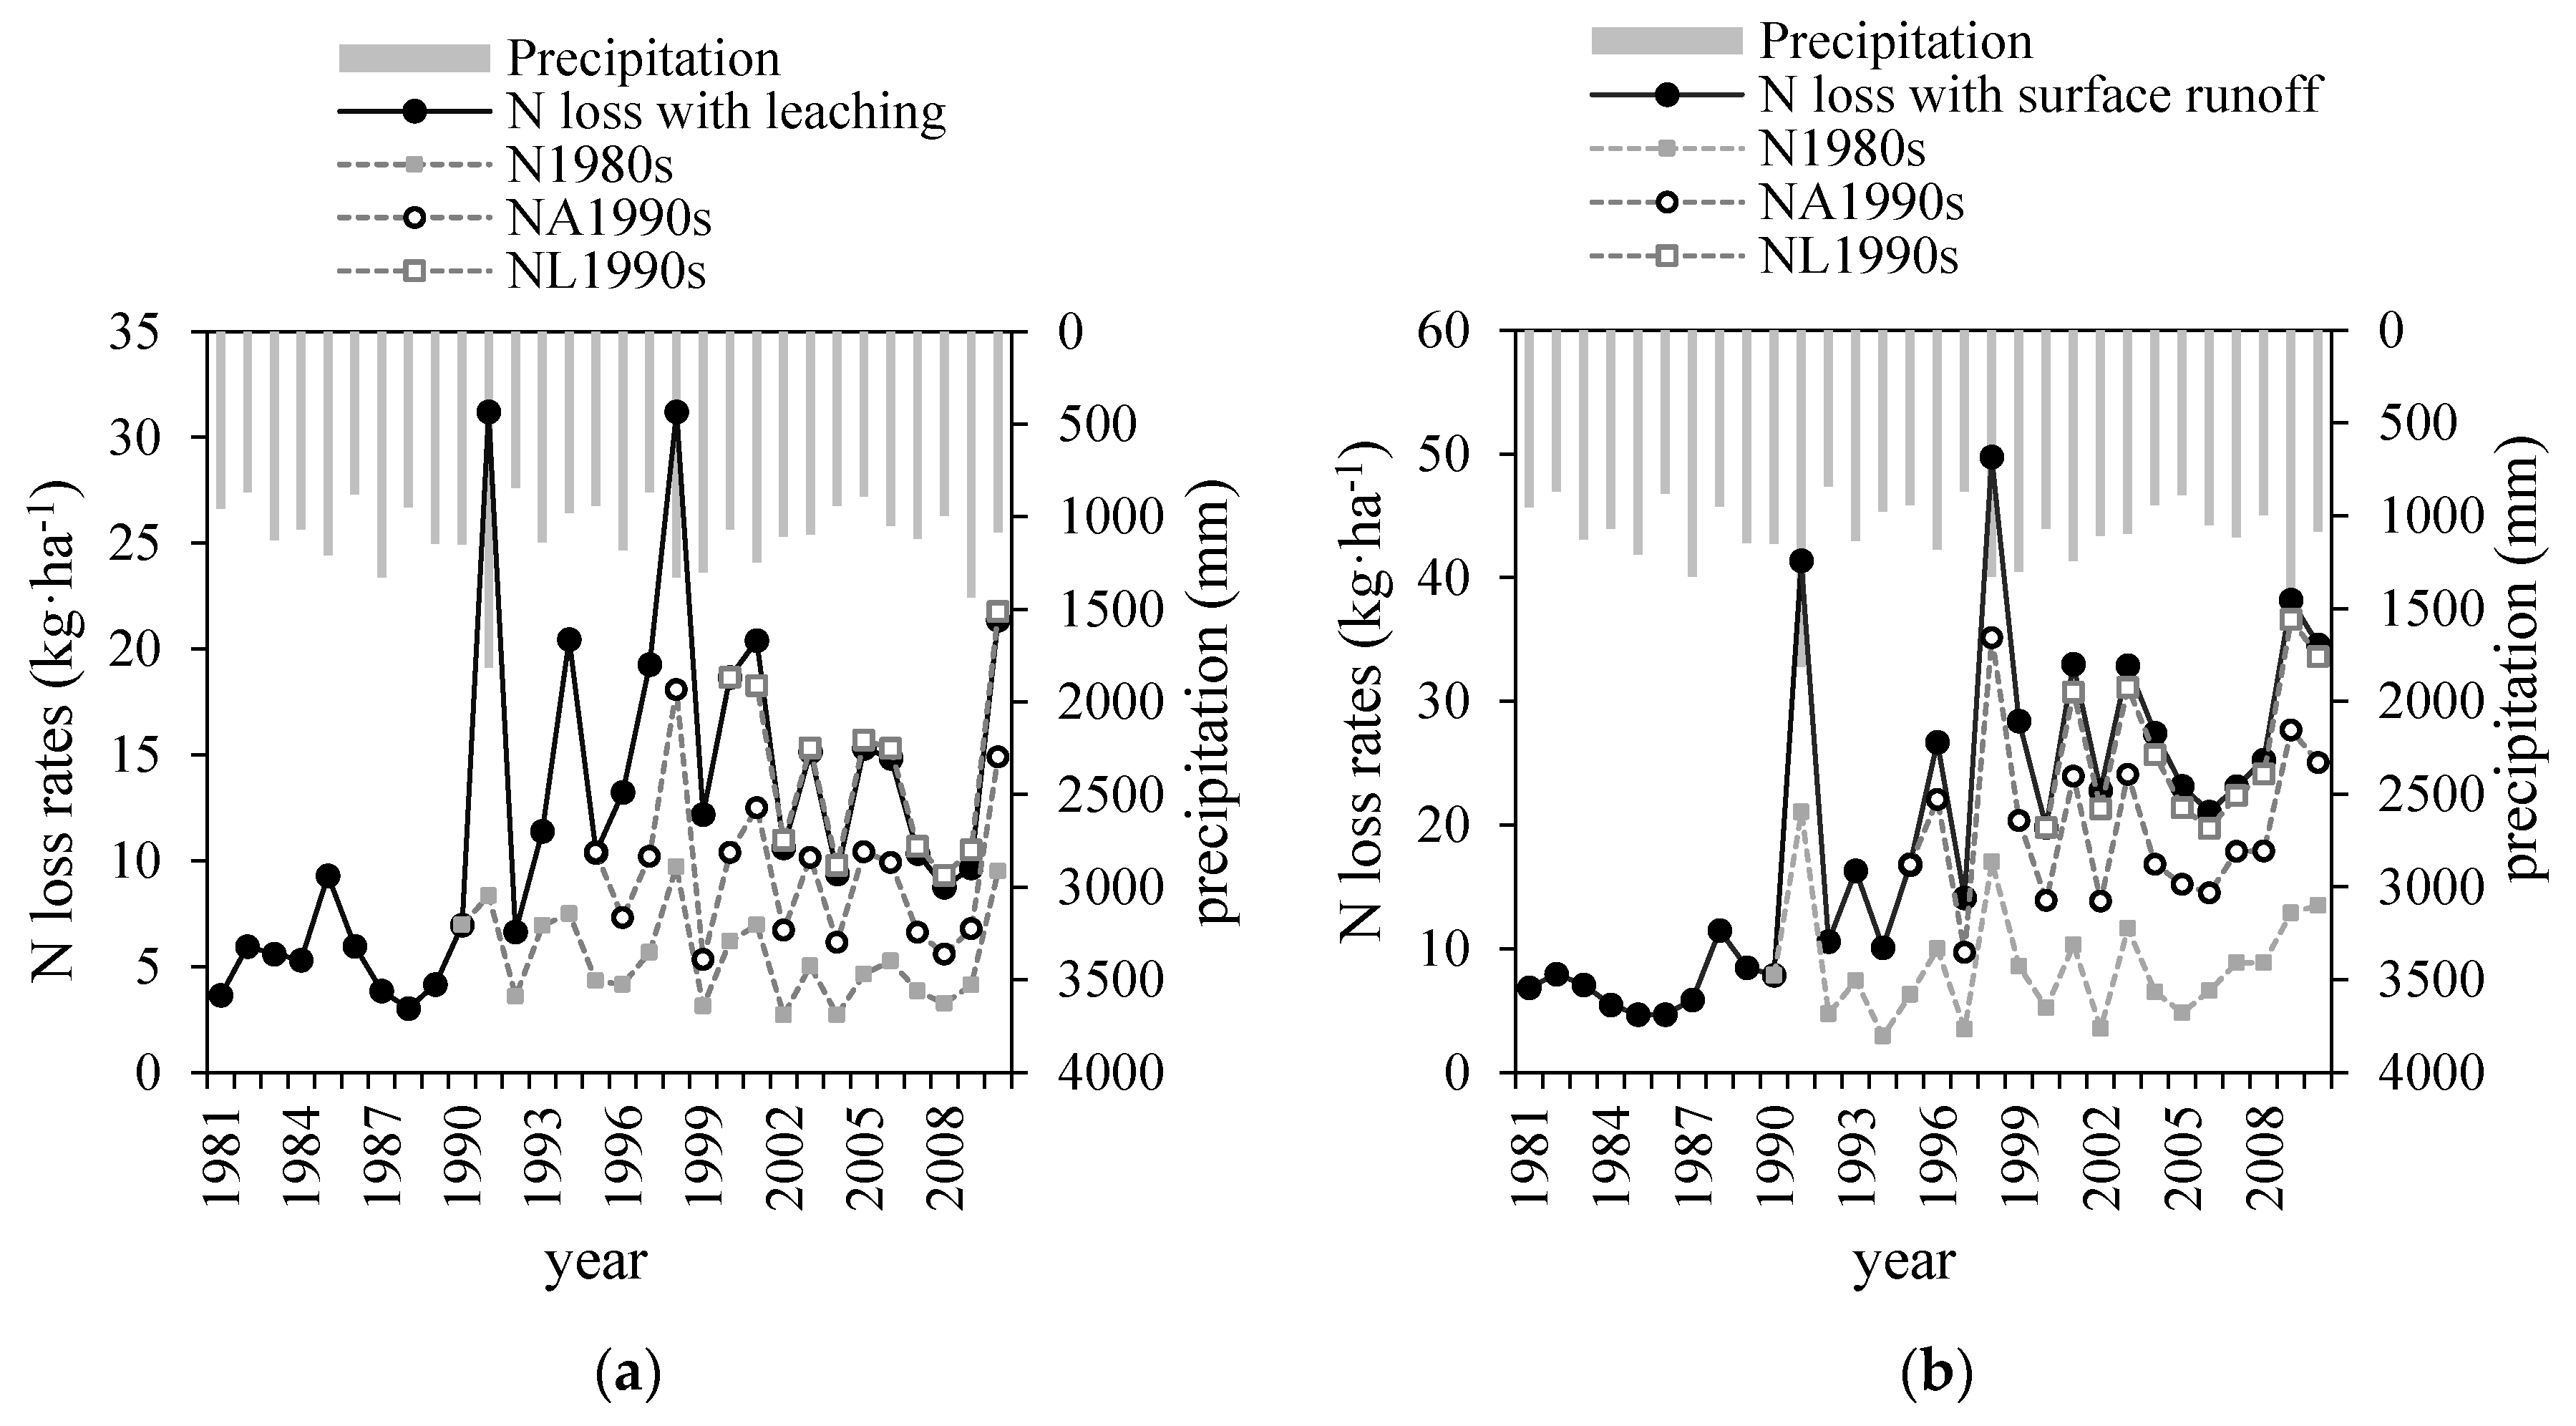
N loss in the rice–wheat rotation system since 1980 was simulated based on the calibrated and validated DNDC model. The results of N loss in leaching and surface runoff from 1980 to 2010 are shown in Figure 6 and the changes in average annual N loss rates are shown in Table 6.
Table 6 shows that in response to the changes in fertilization, the N losses in surface runoff during the four periods (N1980s, NA1990s, NL1990s, and N2000s) were 7.9 ± 3.9, 18.3 ± 7.2, 25.4 ± 10.2, and 26.5 ± 10.6 kg·ha−1·year−1, respectively, and N loss in soil water leaching was 5.2 ± 2.1, 9.4 ± 3.2, 14.4 ± 4.6, and 13.5 ± 4.6 kg·ha−1·year−1 respectively. The total N loss with runoff and leaching showed an increasing trend after 1980 and reached a peak in 2000. Figure 6 shows that compared with NL1990 practice, the N2000 practices did not reduce the nitrogen loss rate after 2000.
The average crop N uptake rates in the four periods were 259.1 ± 13.2, 295.6 ± 26.3, 299.3 ± 27.2, and 298.1 ± 28.3 kg·ha−1·year−1 respectively (Table 6). The values did not increase significantly after the 1990s, which indicated that the optimial fertilization rate that is needed to balance crop yield and N loss to water was less than 500 kg·ha−1·year−1.
3.4. Seasonal Dynamics of N Loss
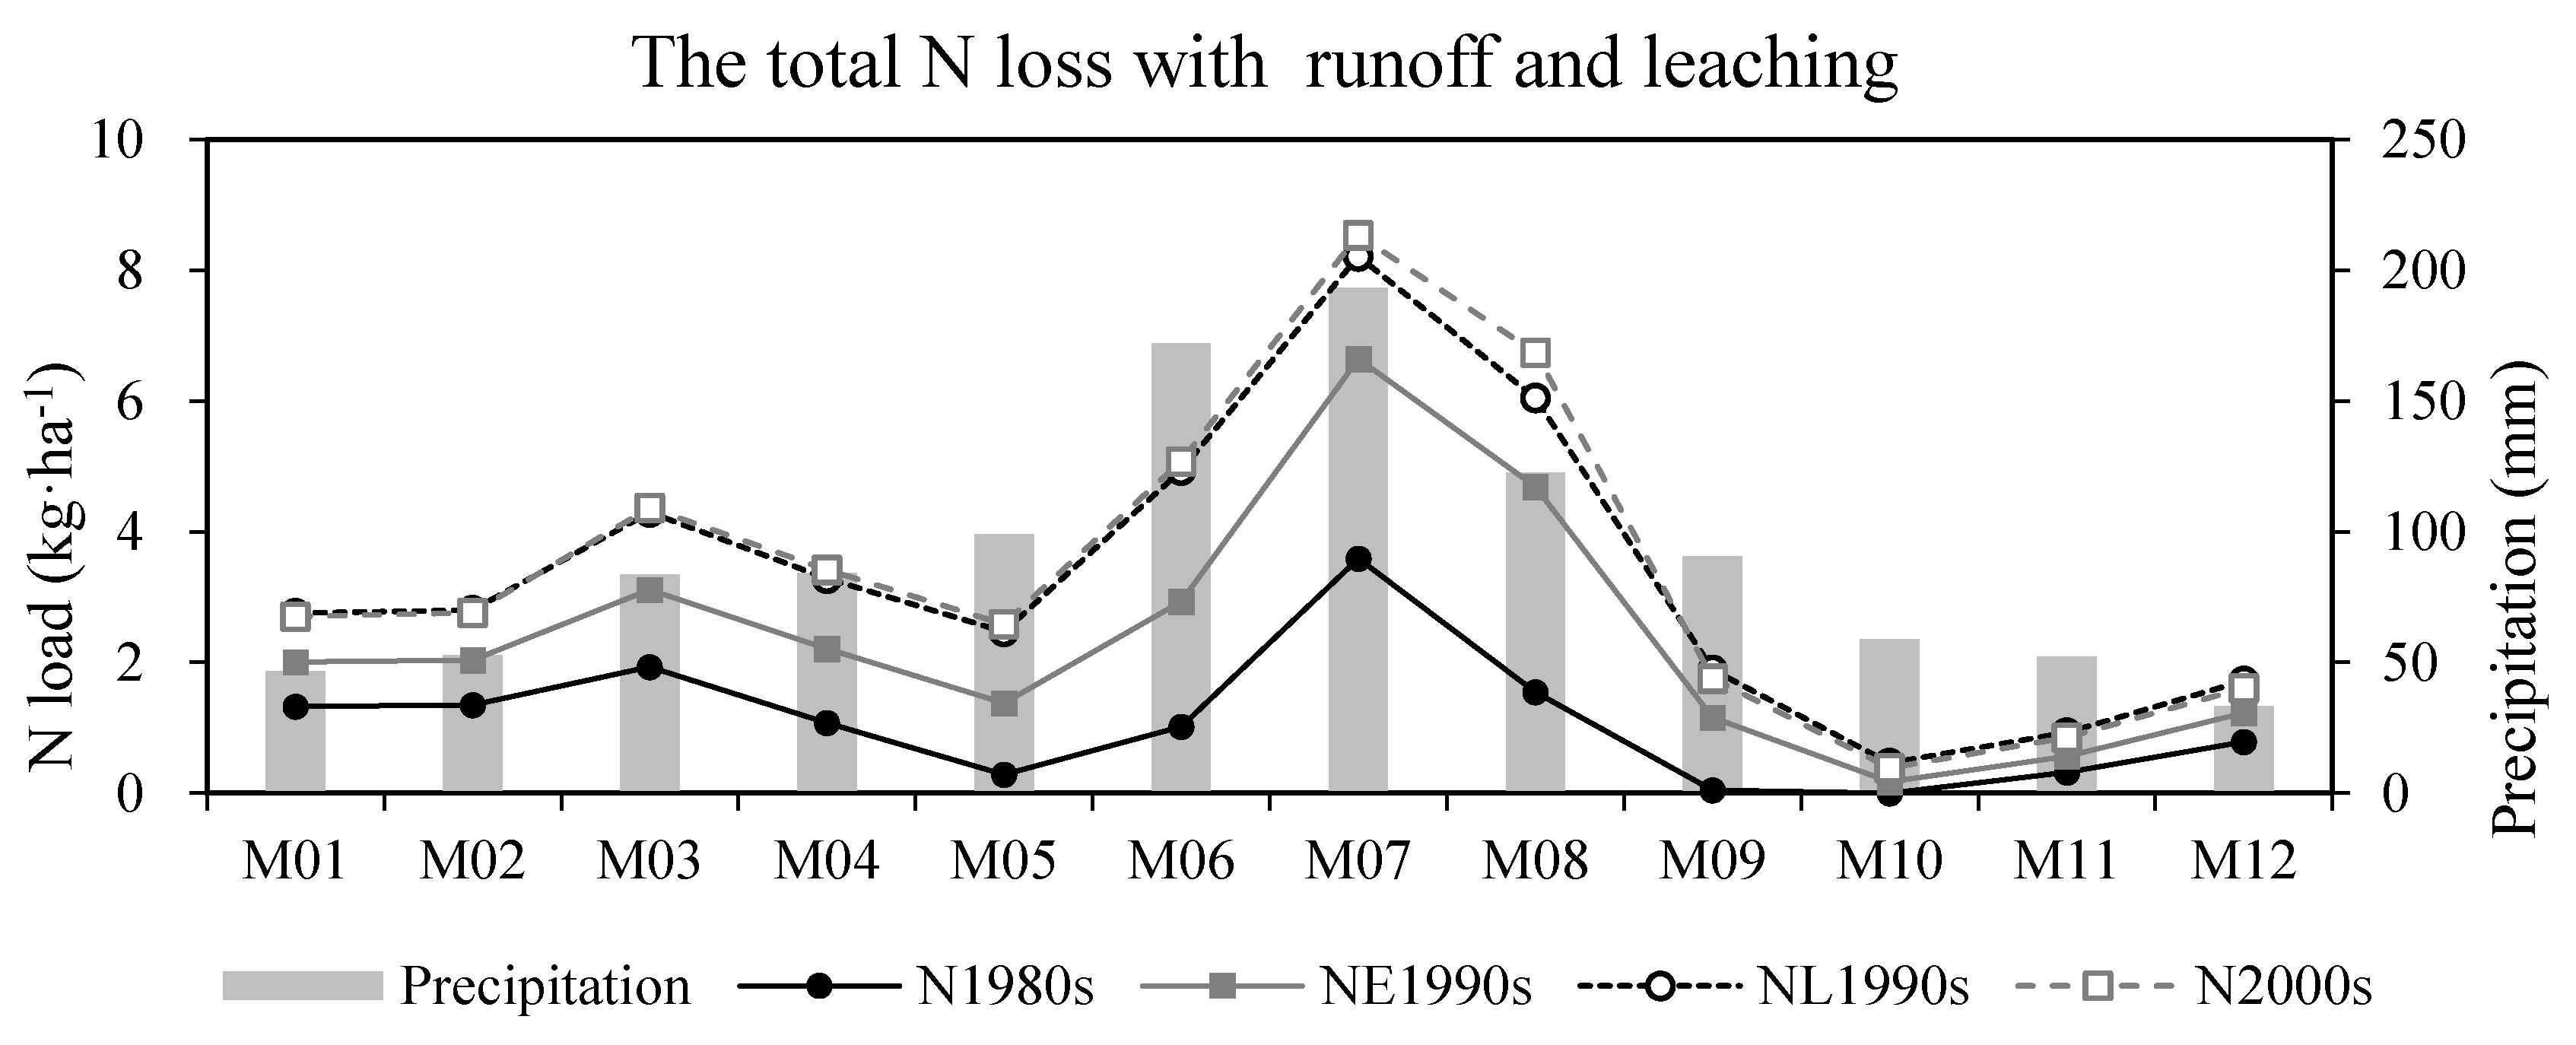
The seasonal dynamics of N loss since 1980 is shown in Figure 7. Figure 7 revealed that the increase in N export to water due to fertilizer application occurred mainly in rainy seasons from March to August. N loading from June to August, a period with both frequent rainfall events and intensive rice fertilization activities, contributed 46.4%–54.5% to the annual increase in N export to water. In these three months, N loss to water mainly occurred in runoff water. N loading occurring from March to May contributed 22.9%–29.0% to the annual increase in N export to water, with losses occurring in both runoff and leaching. Since the late 1990s, almost all the monthly N loads during the rainy season approached or surpassed the maximum monthly N loss that occurred in the 1980s. Thus, since the late 1990s, the increased fertilization rate had increased the N loss risk throughout the rainy seasons.
4. Discussion
4.1. Effect of Fertilization and Rainfall on N Loss in Runoff and Leaching
N loss to water was positively affected by fertilization and rainfall events. Previous studies have shown that the majority of N fertilizer, which is not absorbed by the crops, might accumulate in the cultivated soil layer and be flushed out by runoff or move downward through leaching when a rain event occurs.
Excessive fertilization and the use of pure chemical fertilizer are the main reasons for the increase in agricultural N emission intensity in the Taihu region. According to the results of this study, total N loss in water peaked in the late 1990s, and the N loss rate after 2000 with chemical-only fertilization did not reduce N losses compared with NL1990s, despite the lower fertilizer rate. Too much inorganic N was input from fertilization, which accumulated in the soil and inevitably migrated with runoff and leaching water. Generally, a positive correlation exists between the inorganic N accumulation in topsoil and leaching water [39]. The crop yield no longer increased significantly after the early 1990s, which indicates that the optimal fertilization rate to balance crop yield and N loss to water is less than 500 kg·ha−1·year−1. Cao et al. [11] showed that cutting the N fertilizer rate from 600 to 450 kg·ha−1 led to a reduction in total nitrogen (TN) leaching by more than 20% without decreasing wheat or rice yields in the Taihu region. On the basis of field and experimental results, Hofmeieret al. [40] recommended reducing N fertilizer application rates by 15%–25% for summer rice and by 20%–25% for winter wheat, compared with the present levels in the Taihu region. The combined application of organic and inorganic fertilizers is considered an important method for reducing N exports to soil water and ensure food securing [41,42]. In general, soil with high organic matter content has a strong soil structure, which helps to hold nutrients and reduce loss to water. In the 1980s, the N export load to the water was lower, which was attributed to the strong adsorption and slow release of organic N. When manure fertilizer use decreased after the 1990s, the magnitude of N loss increased. Even with lower fertilizer rates after 2000, the N loss to water was not reduced compared with earlier periods. In an investigation of lettuce fertilization, Ning et al. [41] showed that maintaining a 1:1 ratio between organic and inorganic fertilizer is the best way to balance crop yield and N pollution. In addition to the fertilization rate and application of manual fertilizer, applying fertilization at the appropriate time is also vital for N water export reduction. The fertilizer rate during seeding accounted for 30%–40% of total fertilization. However, researchers found that a small amount of fertilization can meet nutrition needs during the early stages of rice growth [11,12,13].
Precipitation has been determined as one of important driving factors of non-point source pollutions. From 1980 to 2010, annual precipitations highly fluctuated from 844 to 1816 mm. The extreme wet year 1991 has the second-highest amount of N loss, although there was only a 500 kg N·ha−1·year−1 fertilizer application, which underscores that nutrient loss can increase with increased rainfall [43,44,45]. In the wheat season during the winter, when the frequency and intensity of rainfall were small, N originating from fertilization can be accumulated in the cultivated soil layer and be flushed out by runoff or move downward through leaching in the spring seasons. Reports demonstrated that nitrate leaching is most likely to occur following a heavy precipitation event [46], and the annual variation in precipitation results in the variation in N leaching loss [47,48]. In the rice-growing seasons, with frequently fertilizing and precipitation events, runoff tends to occur within a short time after fertilization; thus, the usual high N concentrations were recorded in the runoff water flow. Avoiding fertilization before rainfall is crucial for the reduction of N loss from farmland. When precipitation events occurred after N fertilization for one week or longer times, N concentration can be greatly reduced in the runoff water [49].
4.2. The Changes of Fertilization Rate, N Loss Loading and Water Quality in Taihu Lake since the 1980s
Table 7 shows the evolution of eutrophication in Taihu Lake and growth in the fertilization rate in the Taihu Lake region since the 1950s. In the early 1980s, phytoplankton blooms arose on part of the water surface of Taihu Lake during the summer and autumn seasons. According to our study, the highest seasonal N loads to water were also in the summer with a fertilization rate of 350 kg N·ha−1·year−1 in the 1980s. Taihu Lake entered a eutrophication stage around 1990; then, water quality was characterized by a medium level of nutrition, and algal blooms frequently occurred on large spatial scales. The fertilizer rate has maintained a rapidly increasing trend since the late 1980s, and the increasing fertilization rate has quickly increased N loss to water throughout the rainy season (almost all the monthly N loads during the rainy season approached or surpassed the maximum monthly N loss in the 1980s). Meanwhile, the N concentration in Taihu Lake increased quickly, leading to an increased area extension, duration, and level of eutrophication. A series of pollution reduction measures, including reducing the fertilization rate, and controlling point sources from industry and urban wastewater, were implemented after the occurrence of algal blooms and drinking water safety crises. However, the nutrient export associated with accumulated nutrients in soil caused by long-term and high-intensity fertilization dampened the effects of these measures. The N concentration in Taihu Lake decreased after the algae outbreak in 2007, but remained, on average, above 2.0 mg·L−1 in 2010 [50]. Although the contribution of agricultural N in the Taihu region is increasingly prominent, the contribution of agricultural sources, industrial sources, and living sources is an issue that needs further study.
5. Conclusions
In this study, the N loss in runoff and leaching water from a rice–wheat cropping rotation system from 1980 to 2010 was simulated in the Taihu region in China using a calibrated and validated DNDC model. The results show that the fertilizer rate has increased from about 350 to 550–600 kg N·ha−1·year−1 in agricultural land since the 1980s, with the proportion of manure fertilization decreasing from 30% to 0%. Fertilization and precipitation were the two most important factors affecting N loss in the rice–wheat rotation system because soil properties were relatively stable factors. The trend in total N loss in runoff and leaching has increased since 1980, and it reached a peak in the late 1990s. Compared with the NL1990 practice, the N2000 practice did not reduce the nitrogen loss rate after 2000, although the fertilization rate was lower. The crop yields no longer increased significantly when the fertilizer rate was above 500 kg·ha−1·year−1 after the 1990s, which indicates the optimal fertilization rate to balance crop yields and N loss to water is less than 500 kg·ha−1·year−1.
Author Contributions
Conceptualization, Y.D. and H.L.; methodology, Y.D. and X.L.; validation, Y.D. and X.L.; formal analysis, Y.D. and S.J.; investigation, X.L.; resources, X.L.; writing—original draft preparation, Y.D.; writing—review and editing, Y.D. and S.J.; project administration, H.L.; funding acquisition, H.L. and S.J. All authors have read and agreed to the published version of the manuscript.
Funding
This research was funded by the National Natural Science Foundation of China (Grant No. 41877513), the Natural Science Foundation of Jiangsu Province (Grants No BK20151062), the “135” Key Program in Nanjing Institute of Geography and Limnology, Chinese Academy of Sciences (Grant No. NIGLAS2018GH06), and the Key Research Program of the Chinese Academy of Sciences, grant number KZZD-EW-10-04.
Conflicts of Interest
The authors declare no conflict of interest.
References
- Ma, X.B.; Wang, Z.Y.; Yin, Z.G.; Koenig, A. Nitrogen flow analysis in Huizhou, South China. Environ. Manag. 2008, 41, 378–388. [Google Scholar] [CrossRef]
- Zhang, Q.L.; Chen, Y.X.; Jilani, G.; Shamsi, I.H.; Yu, Q.G. Model AVSWAT apropos of simulating non-point source pollution in Taihu lake basin. J. Hazard. Mater. 2010, 174, 824–830. [Google Scholar] [CrossRef]
- Ma, L.S. Nitrogen pollution from agricultural non-point sources and its control in water system of Taihu Lake. Chin. J. Appl. Ecol. 1992, 3, 58–66. [Google Scholar]
- Wang, Q.R.; Li, J.Y. Fertilizer proper use and sustainable development of soil environment in China. Adv. Environ. Sci. 1999, 7, 116–124. [Google Scholar]
- Wu, L.; Li, P.W. Studies on rainfall process, flow-making and nitrogen and phosphorus losses. Acta Sci. Circumstantiae 1996, 16, 111–116. [Google Scholar]
- Zhang, W.L.; Wu, S.X.; Ji, H.J.; Kolbe, H. Estimation of Agricultural Non-Point Source Pollution in China and the Alleviating Strategies, I. Estimation of Agricultural Non-Point Source Pollution in China in Early 21 Century. Sci. Agric. Sin. 2004, 37, 1008–1017. [Google Scholar]
- Ju, X.T.; Xing, G.X.; Chen, X.P.; Zhu, Z.L. Reducing environmental risk by improving N management in intensive Chinese agricultural systems. PNAS 2009, 106, 3041–3046. [Google Scholar] [CrossRef] [PubMed] [Green Version]
- Tian, Y.H.; Yin, B.; Yang, L.Z.; Yin, S.X.; Zhu, Z.L. Nitrogen Runoff and Leaching Losses during Rice-Wheat Rotations in Taihu Lake Region, China. Pedosphere 2007, 17, 445–456. [Google Scholar] [CrossRef]
- Liu, H.J.; Zheng, J.C.; Chen, L.G.; Xue, X.H. Effects of straw-returning on annual overland runoff NPK loss in farmland. Ecol. Environ. Sci. 2012, 21, 1031–1036. [Google Scholar]
- Cherobima, V.F.; Huang, C.H.; Favaretto, N. Tillage system and time post-liquid dairy manure: Effects on runoff, sediment and nutrients losses. Agric. Water Manag. 2017, 184, 96–103. [Google Scholar] [CrossRef] [Green Version]
- Cao, Y.S.; Tian, Y.H.; Yin, B.; Zhu, Z.L. Improving agronomic practices to reduce nitrate leaching from the rice-wheat rotation system. Agric. Ecosyst. Environ. 2014, 195, 61–67. [Google Scholar] [CrossRef]
- Qiao, J.; Yang, L.Z.; Yan, T.M.; Xue, F.; Zhao, D. Nitrogen fertilizer reduction in rice production for two consecutive years in the Taihu Lake area. Agric. Ecosyst. Environ. 2012, 146, 103–112. [Google Scholar] [CrossRef]
- Datta, S.K. Improving nitrogen fertilizer efficiency in lowland rice in tropical Asia. In Nitrogen Economy of Flooded Rice Soils; Springer: Berlin/Heidelberg, Germany, 1986; Volume 26, ISBN 978-94-010-8471-0. [Google Scholar]
- Kim, S.M.; Park, S.W.; Lee, J.J.; Benham, B.L. Modelling and assessing the impact of reclaimed wastewater irrigation on the nutrient load from an agricultural watershed containing rice paddy fields. J. Environ. Sci. Health 2007, 42, 305–315. [Google Scholar] [CrossRef] [PubMed]
- Chung, S.O.; Kim, H.S.; Kim, J.S. Model development for nutrient loading from paddy rice fields. Agric. Water Manag. 2003, 62, 1–17. [Google Scholar] [CrossRef]
- Aschonitis, V.G.; Lekakis, E.H.; Petridou, Ν.C.; Koukouli, S.G.; Pavlatou-Ve, A. Nutrients fixation by algae and limiting factors of algal growth in flooded rice fields under semi-arid Mediterranean conditions: Case study in Thessaloniki plain in Greece. Nutr. Cycl. Agroecosyst. 2013, 96, 1–13. [Google Scholar] [CrossRef]
- Tournebize, J.; Watanabe, H.; Takagi, K.; Nishimura, T. The development of a coupled model (PCPF-SWMS) to simulate water flow and pollutant transport in Japanese paddy fields. Paddy Water Environ. 2006, 4, 39–51. [Google Scholar] [CrossRef]
- Antonopoulos, V.Z. Modeling of water and nitrogen balance in the ponded water of rice field. Paddy Water Environ. 2008, 6, 387–395. [Google Scholar] [CrossRef]
- Do, T.N.; Nishida, K. A nitrogen cycle model in paddy fields to improve material flow analysis: The Day-Nhue River Basin case study. Nutr. Cycl. Agroecosyst. 2014, 100, 215–226. [Google Scholar] [CrossRef]
- Gao, X.R.; Dong, B.; Qin, D.Y.; Sun, N.N.; Zhang, Z.Y. Simulation of drainage process and nitrogen loss in paddy field using DrainMOD. Trans. CSAE 2011, 27, 52–57. [Google Scholar]
- Congreves, K.A.; Grant, B.B.; Dutta, B.; Smith, W.N.; Chantigny, M.H.; Rochette, P.; Desjardins, R.L. Predicting ammonia volatilization after field application of swine slurry: DNDC model development. Agric. Ecosyst. Environ. 2016, 219, 179–189. [Google Scholar] [CrossRef]
- Zhang, Y.J.; Niu, H.S. The development of the DNDC plant growth sub-model and the application of DNDC in agriculture: A review. Agric. Ecosyst. Environ. 2016, 230, 271–282. [Google Scholar] [CrossRef]
- Zhang, H.X.; Sun, B.; Xie, X.L.; Zhuang, S.Y. Simulating the effects of chemical and non-chemical fertilization practices on carbon sequestration and nitrogen loss in subtropical paddy soils using the DNDC model. Paddy Water Environ. 2015, 13, 495–506. [Google Scholar] [CrossRef]
- Li, H.; Wang, L.G.; Qiu, J.J.; Li, C.S.; Gao, M.F.; Gao, C.Y. Calibration of DNDC model for nitrate leaching from an intensively cultivated region of Northern China. Geoderma 2014, 223, 108–118. [Google Scholar] [CrossRef]
- Gilhespy, S.L.; Anthony, S.; Cardenas, L.; Chadwick, D.; Prado, A.; Li, C.S.; Misselbrook, T.; Rees, R.M.; Salas, W.; Sanz-Cobena, A.; et al. First 20 years of DNDC (DeNitrification DeComposition): Model evolution. Ecol. Model. 2014, 292, 51–62. [Google Scholar] [CrossRef] [Green Version]
- Li, C.; Farahbakhshazad, N.; Jaynes, D.B.; Dinnes, D.L.; Salas, W.; McLaughlin, D. Modeling nitrate leaching with a biogeochemical model modified based on observations in a row-crop field in Iowa. Ecol. Model. 2006, 196, 116–130. [Google Scholar] [CrossRef]
- Deng, J.; Zhou, Z.; Zhu, B.; Zheng, X.; Li, C.; Jian, Z. Modeling nitrogen loading in a small watershed in southwest China using a DNDC model with hydrological enhancements. Biogeosciences 2011, 8, 2999–3009. [Google Scholar] [CrossRef] [Green Version]
- Zhao, Z.; Zhang, H.L.; Li, C.S.; Zhao, Q.; Cao, L.K. Quantifying nitrogen loading from a paddy field in Shanhai, China with modified DNDC model. Agric. Ecosyst. Environ. 2014, 1997, 212–221. [Google Scholar] [CrossRef]
- Zhao, Z.; Cao, L.K.; Sha, Z.M.; Deng, J.; Lv, W.G. Impacts of fertilization optimization on N loss from paddy fields: Observations and DNDC modeling case study in Shanghai, China. Soil Tillage Res. 2020, 199, 104587. [Google Scholar] [CrossRef]
- Rosenfeld, L. The Kjeldahl Method for Nitrogen. In Origins of Clinical Chemistry; Academic Press: Cambridge, MA, USA, 1982; ISBN 978-0-12-597580-3. [Google Scholar]
- Walkley, A.; Armstrong Black, I. An examination of the degtjareff method for determining soil organic matter, and a proposed modification of the chromic acid titration method. Soil Sci. 1934, 37, 29–38. [Google Scholar] [CrossRef]
- Li, H.; Wang, L.G.; Li, J.Z.; Gao, M.F.; Zhang, J.; Zhang, J.; Qiu, J.; Deng, J.; Li, C.; Frolking, S. The development of China-DNDC and review of its applications for sustaining Chinese agriculture. Ecol. Model. 2017, 348, 1–13. [Google Scholar] [CrossRef] [Green Version]
- Li, C.S.; Frolking, S.; Harriss, R.; Butterbach, K. Carbon sequestration in arable soils is likely to increase nitrous oxide emissions, offsetting reductions in climate radiative forcing. Clim. Chang. 2005, 72, 321–338. [Google Scholar] [CrossRef]
- Li, H.; Qiu, J.; Wang, L.; Yang, L. Advance in a terrestrial biogeochemical model-DNDC model. Acta Ecol. Sin. 2011, 31, 91–96. [Google Scholar] [CrossRef]
- Li, C.S.; Salas, W.; Zhang, R.; Krauter, C.; Rotz, A.; Mitloehner, F. Manure-DNDC: A biogeochemical process model for quantifying greenhouse gas and ammo-nia emissions from livestock manure systems. Nutr. Cycl. Agroecosyst. 2012, 93, 163–200. [Google Scholar] [CrossRef]
- Li, C.S.; Frolking, S.; Frolking, T.A. A model of nitrous-oxide evolution from soil driven by rainfall events: 1 model structure and sensitivity. J. Geophys. Res. 1992, 97, 9759–9776. [Google Scholar] [CrossRef]
- Li, C.S.; Frolking, S.; Harriss, R. Modling carbon biogeochemistry in agricultural soils. Glob. Biogeochem. Cycles 1994, 8, 237–254. [Google Scholar] [CrossRef]
- Li, C.S. Modeling trace gas emissions from agricultural ecosystems. Nutr. Cycl. Agroecosyst. 2000, 58, 259–276. [Google Scholar] [CrossRef]
- Xu, Y.C.; Shen, Q.R. Influence of longterm combined application of manure and chemical fertilizer on supplying characteristics of nitrogen on soil and soil particle fractions. Acta Pedol. Sin. 2004, 41, 87–92. [Google Scholar]
- Hofmeier, M.; Roelcke, M.; Han, Y.; Lan, T.; Bergmann, H.; Böhm, D.; Cai, Z.C.; Nieder, R. Nitrogen management in a rice-wheat system in the Taihu Region: Recommendations based on field experiments and surveys. Agric. Ecosyst. Environ. 2015, 209, 60–73. [Google Scholar] [CrossRef]
- Ning, J.F.; Zou, X.Z.; Yang, S.H.; Wei, L.; Wu, J.L. Effects of combined application of organic and inorganic nitrogen fertilizer on the soil nitrogn leaching and the growth of leaf-used lettuce. Trans. CSAE 2007, 23, 95–100. [Google Scholar]
- Singh, U. Integrated nitrogen fertilization for intensive and sustainable agriculture. J. Crop. Improv. 2006, 15, 259–288. [Google Scholar] [CrossRef]
- Kumar, R.; Ambasht, R.S.; Srivastava, A.; Srivastava, N.K.; Sinhab, A. Reduction of nitrogen losses through erosion by Leonotis nepetaefolia and Sida acuta in simulated rain intensities. Ecol. Eng. 1997, 8, 233–239. [Google Scholar] [CrossRef]
- Lv, H.C.; Chen, Y.X.; Fang, Z.F.; Yu, Z.M.; Zhu, S. Effect of sloping land use pattern on nitrogen and phosphorus loss in Qiandaohu Watershed. J. Soil Water Conserv. 2002, 16, 91–92. [Google Scholar]
- Pruski, F.F.; Nearing, M.A. Climate-induced changes in erosion during the 21st century for eight US locations. Water Resour. Res. 2002, 38. [Google Scholar] [CrossRef]
- Zhen, W.; Li, J.; Li, Y. Simulation of nitrate leaching under varying drip system uniformities and precipitation patterns during the growing season of maize in the North China Plain. Agric. Water Manag. 2014, 142, 19–28. [Google Scholar]
- Bergstrom, L.; Brink, N. Effects of differentiated applications of fertilizer N on leaching losses and distribution of inorganic N in the soil. Plant Soil 1986, 93, 333–345. [Google Scholar] [CrossRef]
- Moreno, F.; Cayuela, J.A.; Fermandez-Boy, J.E.; Fernández-Boy, E.; Murillo, J.M.; Cabrera, F. Water balance and nitrate leaching in an irrigation maize crop in SW Spain. Agric. Water Manag. 1996, 32, 71–83. [Google Scholar] [CrossRef]
- Zhao, X.; Zhou, Y.; Min, J.; Wang, S.Q.; Shi, W.M.; Xing, G.X. Nitrogen runoff dominates water nitrogen pollution from rice-wheat rotation in the Taihu Lake region of China. Agric. Ecosyst. Environ. 2012, 156, 1–11. [Google Scholar] [CrossRef]
- Dai, X.L.; Qian, P.Q.; Ye, L.; Song, T. Changes in nitrogen and phosphorus concentrations in Lake Taihu, 1985–2015. J. Lake Sci. 2016, 28, 935–943. [Google Scholar]
- Zhu, S.P.; Yang, G.Y. On Some Physical and Chemical properties of the Water in the northern part of the Lake Taihu. Oceanol. Limnol. Sci. 1959, 2, 146–162. [Google Scholar]
- Su, J.S.; Liu, S.K.; He, S.L. Water quality management in Tai Lake. Shuili Xuebao 1992, 11, 22–36. [Google Scholar]
- Zhu, M. Variational trend and protection steps of water quality in Taihu Lake. J. Lake Sci. 1996, 8, 133–138. [Google Scholar]
Figure 1.
Location of the Changshu Agro-Ecological Experimental Station (CAS) in the Taihu Lake Basin.
Figure 1.
Location of the Changshu Agro-Ecological Experimental Station (CAS) in the Taihu Lake Basin.

Figure 2.
(a) Plane figure of the rice–wheat cropping rotation fields, and (b) subsurface leaching and surface-runoff water-collection devices.
Figure 2.
(a) Plane figure of the rice–wheat cropping rotation fields, and (b) subsurface leaching and surface-runoff water-collection devices.

Figure 3.
The annual rainfall and temperature from 1980 to 2010.

Figure 4.
Scatter diagrams of the simulated and measured soil water N concentrations for (a) the N2000s practice and (b) the N1980s practice.
Figure 4.
Scatter diagrams of the simulated and measured soil water N concentrations for (a) the N2000s practice and (b) the N1980s practice.

Figure 5.
Comparisons of simulated and measured runoff N loads for (a) the N2000s practice and (b) the N1980s practice.
Figure 5.
Comparisons of simulated and measured runoff N loads for (a) the N2000s practice and (b) the N1980s practice.

Figure 6.
N loss in (a) leaching and (b) surface runoff since the 1980s. The solid line represents the N loss in leaching and surface runoff with fertilization changes from 1981 to 2010, and the dotted lines represent the N loss with fertilization practices remaining the same.
Figure 6.
N loss in (a) leaching and (b) surface runoff since the 1980s. The solid line represents the N loss in leaching and surface runoff with fertilization changes from 1981 to 2010, and the dotted lines represent the N loss with fertilization practices remaining the same.

Figure 7.
Monthly total N loss (including runoff and leaching) different fertilization scenarios.


Table 1.
The field management schedule.
| Crop Season | Activity | Date | Crop Season | Activity | Date |
|---|---|---|---|---|---|
| 2011/2012 Wheat | Plowing | 7 November 2011 | 2012/2013 Wheat | Plowing | 7 November 2012 |
| Sowing | 9 November 2011 | Sowing | 7 November 2012 | ||
| Basal fertilization | 9 November 2011 | Basal fertilization | 7 November 2012 | ||
| First top-dressing | 4 December 2011 | First top-dressing | 7 January 2013 | ||
| Second top-dressing | 24 February 2012 | Second top-dressing | 10 March 2013 | ||
| Harvesting | 4 June 2012 | Harvesting | 2 June 2013 | ||
| 2012Rice | Ploughing | 10 June 2012 | 2013Rice | Plouwing | 10 June 2013 |
| Pre-flooding | 20 June 2012 | Pre-flooding | 20 June 2013 | ||
| Basal fertilization | 25 June 2012 | Basal fertilization | 25 June 2013 | ||
| Rice transplanting | 25 June 2012 | Rice transplanting | 25 June 2013 | ||
| First top-dressing | 6 July 2012 | First top-dressing | 10 July 2013 | ||
| Mid-season aeration | 30 July to 5 August 2012 | Mid-season aeration | 1 to 8 August 2013 | ||
| Second-top dressing | 10 August 2012 | Second-top dressing | 15 August 2013 | ||
| Harvesting | 25 October 2012 | Harvesting | 25 October 2013 |
Table 2.
Crop parameters of winter wheat and paddy rice.
| Crops | Parameters | Grain | Leaf | Stem | Root |
|---|---|---|---|---|---|
| Winter wheat | Max biomass production (kg C·ha−1) | 2200 | |||
| Biomass fraction | 0.52 | 0.08 | 0.29 | ||
| Biomass C/N ratio | 22 | 21 | 62 | 19 | |
| Paddy rice | Max biomass production (kg C·ha−1) | 4500 | |||
| Biomass fraction | 0.37 | 0.16 | 0.3 | ||
| Biomass C/N ratio | 39 | 35 | 50 | 85 |
Table 3.
Fertilization patterns in the Taihu Lake region during different periods.
| Fertilizer Regimes | Paddy Rice Seasons (kg N·ha−1·yr−1) | Winter Wheat Seasons (kg N·ha−1·yr−1) | ||||
|---|---|---|---|---|---|---|
| Chemical Fertilizer | Manure Fertilizer | Total Fertilizer | Chemical Fertilizer | Manure Fertilizer | Total Fertilizer | |
| N1980s | 140 | 60 | 200 | 105 | 45 | 150 |
| NE1990s | 265 | 35 | 300 | 175 | 25 | 200 |
| NL1990s | 315 | 35 | 350 | 225 | 25 | 250 |
| N2000s | 300 | 0 | 300 | 250 | 0 | 250 |
Table 4.
Comparison of farmland observations and denitrification–decomposition (DNDC) simulation of crop biomass (kg C·ha−1).
Table 4.
Comparison of farmland observations and denitrification–decomposition (DNDC) simulation of crop biomass (kg C·ha−1).
| Farmland Practices | Season | Stem | Leaf | Grain | |||
|---|---|---|---|---|---|---|---|
| Observation | Simulation | Observation | Simulation | Observation | Simulation | ||
| N2000s | 2011/2012 wheat | 1225 | 1149 | 300 | 634 | 2344 | 2505 |
| 2012 rice | 3441 | 2521 | 1774 | 1345 | 3465 | 3110 | |
| 2012/2013 wheat | 1700 | 1115 | 758 | 615 | 2513 | 2432 | |
| N1980s | 2011/2012 wheat | 1129 | 767 | 346 | 423 | 2076 | 1672 |
| 2012 rice | 2098 | 1771 | 1149 | 944 | 2631 | 2184 | |
| 2012/2013 wheat | 1077 | 757 | 484 | 418 | 1978 | 1651 | |
Table 5.
Sensitivity analysis of the DNDC model.
| Input Parameters | Range | Sensitivity Index | ||
|---|---|---|---|---|
| N Runoff | N Leaching | Crop Uptake | ||
| Precipitation (mm) | 843–1436 | 1.35 | 0.96 | 0.57 |
| Fertilization rate (kg N·ha−1) | 350–500 | 1.88 | 1.87 | 0.27 |
| Fertilization rate (kg N·ha−1) | 500–600 | 1.65 | 1.76 | 0.05 |
| Ratio of manure fertilizer | 0–30% | −0.40 | −0.17 | 0.06 |
| SOC content (g C·ha−1) | 0.8–4.8 | 0.26 | 0.35 | 0.10 |
| Soil bulk density(g·cm−3) | 0.94–1.40 | 0.32 | 0.28 | 0.04 |
| Soil clay fraction | 0.08–0.38 | 0.17 | −3.86 | 0.05 |
| Soil pH | 5.0–8.0 | −0.04 | −0.04 | 0.00 |
Table 6.
The simulated N runoff, leaching and crop uptake loading.
| Leaching Load | Runoff Load | Crop Uptake | ||||
|---|---|---|---|---|---|---|
| Scenarios | Mean | SD | Mean | SD | Mean | SD |
| N1980s | 5.2 | 2.1 | 7.9 | 3.9 | 259.1 | 13.2 |
| NE1990s | 9.4 | 3.2 | 18.3 | 7.2 | 295.3 | 26.4 |
| NL1990s | 14.4 | 4.6 | 25.4 | 10.2 | 299.3 | 27.2 |
| N2000s | 13.5 | 4.6 | 26.5 | 10.6 | 298.1 | 28.3 |
Table 7.
Fertilizer application rate and lake water quality in the Taihu region during different periods.
Table 7.
Fertilizer application rate and lake water quality in the Taihu region during different periods.
| Period | Fertilizer Rate (kg N·ha−1·year−1) | Water Quality | Eutrophication Level |
|---|---|---|---|
| 1950s | <100 | <0.54–0.58 mg·L−1 [51] | Oligotrophic |
| Around the 1980s | <354 | 0.9–2.57 mg·L−1, average 1.54 mg·L−1 | Mesotrophic |
| Around the 1990s | 440–584 | 1.47–1.83 mg·L−1 in 1987–1988 [52]; 1.73–2.87 mg·L−1 in 1992–1994 [53] | Mesotrophic-Eutrophic |
| Around the 2000s | 586–640 | >2.5 mg·L−1 [48] | Eutrophic |
| After 2000 | 513–560 | Average 2.34 mg·L−1 (1.92–2.72 mg·L−1) during 2002–2006 [50] | Eutrophic |
© 2020 by the authors. Licensee MDPI, Basel, Switzerland. This article is an open access article distributed under the terms and conditions of the Creative Commons Attribution (CC BY) license (http://creativecommons.org/licenses/by/4.0/).
Share and Cite
MDPI and ACS Style
Diao, Y.; Li, H.; Jiang, S.; Li, X. Effects of Changing Fertilization since the 1980s on Nitrogen Runoff and Leaching in Rice–Wheat Rotation Systems, Taihu Lake Basin. Water 2020, 12, 886. https://doi.org/10.3390/w12030886
AMA Style
Diao Y, Li H, Jiang S, Li X. Effects of Changing Fertilization since the 1980s on Nitrogen Runoff and Leaching in Rice–Wheat Rotation Systems, Taihu Lake Basin. Water. 2020; 12(3):886. https://doi.org/10.3390/w12030886
Chicago/Turabian StyleDiao, Yaqin, Hengpeng Li, Sanyuan Jiang, and Xinyan Li. 2020. "Effects of Changing Fertilization since the 1980s on Nitrogen Runoff and Leaching in Rice–Wheat Rotation Systems, Taihu Lake Basin" Water 12, no. 3: 886. https://doi.org/10.3390/w12030886
Note that from the first issue of 2016, this journal uses article numbers instead of page numbers. See further details here.