Article

Vegetated Ditch Habitats Provide Net Nitrogen Sink and Phosphorus Storage Capacity in Agricultural Drainage Networks Despite Senescent Plant Leaching

1
Department of Agriculture, Agricultural Research Service, National Sedimentation Lab, Water Quality & Ecology Research Unit, 598 McElroy Drive, Oxford, MS 38655, USA
2
Department of Biological Sciences, University of Notre Dame, 191 Galvin Life Sciences, Notre Dame, IN 46556, USA
*
Author to whom correspondence should be addressed.
Water 2020, 12(3), 875; https://doi.org/10.3390/w12030875
Submission received: 14 February 2020 / Revised: 12 March 2020 / Accepted: 14 March 2020 / Published: 20 March 2020

Abstract

:
The utility of vegetated ditch environments as nutrient sinks in agricultural watersheds is dependent in part on biogeochemical transformations that control plant uptake and release during decomposition. We investigated nitrogen (N) and phosphorus (P) uptake and release across four P enrichment treatments in ditch mesocosms planted with rice cutgrass (Leersia oryzoides) during the summer growing and winter decomposition seasons. Measured N retention and modeled denitrification rates did not vary, but P retention significantly increased with P enrichment. At the end of the growing season, root biomass stored significantly more N and P than aboveground stem and leaf biomass. Decomposition rates were low (<10% organic matter loss) and not affected by P enrichment. Nitrogen and P export during winter did not vary across the P enrichment gradient. Export accounted for <10% of observed summer N uptake (1363 mg m−2), with denitrification potentially accounting for at least 40% of retained N. In contrast, net P retention was dependent on enrichment; in unenriched mesocosms, P uptake and release were balanced (only 25% net retention), whereas net retention increased from 77% to 88% with increasing P enrichment. Our results indicate that vegetated ditch environments have significant potential to serve as denitrification sinks, while also storing excess P in agricultural watersheds.

1. Introduction

Mankind has altered the availability of nitrogen (N) and phosphorus (P) across the globe. Current estimates of industrial N fixation are comparable to natural rates [1], and mining and subsequent spread of limiting P resources continue at an alarming rate [2,3]. While the application of fertilizer is necessary to support increased agricultural production and feed a growing world population, it also represents a significant pathway for limiting nutrients to enter the global biosphere. Fertilizer-based agricultural economies can directly (via surface water runoff) and indirectly (via increased human and animal wastewater effluent) impact the ecological integrity of water resources. Increased inputs of N and P to aquatic ecosystems have extensively reduced the proportion of naturally oligotrophic streams and lakes, resulting in widespread ecosystem consequences, including increased incidence of harmful algal blooms, altered habitat for aquatic organisms, and impacts to economies that rely on the availability of clean water [4]. Balancing anthropogenic demand for food production with demand for clean water, for both humans and the aquatic communities that depend on them, requires management options that reduce the transport of excess nutrients into natural aquatic ecosystems.
There is a large body of literature demonstrating the benefits of using constructed wetlands as a management practice for remediation of nutrients in agricultural runoff [5,6,7,8]. Nitrate (NO3-N) removal efficiency in constructed wetlands ranges from 40% to 90%, though overall N removal is dependent on the size ratio between the constructed wetland and the subsequent catchment area and the system’s hydraulic retention time [7,9]. Nutrient removal in wetlands is facilitated by plant uptake, microbial nitrification and denitrification, and substrate adsorption [10,11,12]. Vegetated ditches support many of these same processes and can be effective at N and P removal in agricultural landscapes [13,14]. However, more research on the different pathways influencing both the uptake and release of excess nutrients in vegetated sediments is needed to understand the utility of vegetated ditches as a best management practice for reducing N and P export from agricultural watersheds.
The dominant mechanism for N removal in small agricultural streams is denitrification [15,16]. Several studies have demonstrated that vegetation can enhance microbially-mediated N transformations, primarily denitrification, in ditches [11,14,17]. For example, in the Po River Basin (Italy), plant uptake accounted for only a minor fraction of N removal, while denitrification was the dominant N removal pathway in vegetated verses unvegetated ditches [11]. Our previous work demonstrated similar patterns in ditch environments vegetated with rice cutgrass (Leersia oryzoides), where as much as 56% of N retention during the first 48 hours of exposure to nutrient enrichment was attributed to denitrification [18,19]. Small-scale experiments combined with landscape-scale modelling suggest that harnessing the denitrification potential of ditch networks by expanding vegetated ditch coverage will reduce the export of excess agricultural N from agricultural river basins [20].
Plant uptake also contributes to N and P retention in wetlands and vegetated ditch environments. The role of direct nutrient assimilation by plants varies across studies ranging from 25% to 56% and 14% to 73% for N and P reductions, respectively [10,13,14]. Mesocosm studies determined L. oryzoides decreased NO3-N and dissolved P loads by 67% and >50%, respectively, compared to the unvegetated control (29 and 36% decrease in NO3-N and P loads) [21,22]. Subsequent studies have demonstrated that significant portions of N removal associated with L. oryzoides are due to denitrification [18,19], but the majority of dissolved P retention is assumed to be associated with plant assimilation in these simple mesocosm studies. While direct assimilation by wetland plants, including L. oryzoides, may represent a storage compartment in vegetated ditch systems, a more robust picture of the true mitigation capacity of such plants should explore potential nutrient loss after plant senescence. Krӧger et al. [23] reported that L. oryzoides increased tissue N and P in aboveground biomass in systems enriched with excess N and P (>2 mg L−1) as compared to non-enriched treatments (<0.05 mg L−1). Subsequent plant biomass senescence from enriched treatments resulted in significantly higher leaching and corresponding higher surface water concentrations of P in site water. Other studies have also suggested that elevated nutrient loss occurs during plant senescence [24,25,26]. Despite uncertainty regarding the long-term storage of excess P by vegetation, P enrichment may also indirectly enhance denitrification potential and net N removal; increased autotrophic production and deposition may enhance sediment organic matter resources available for denitrifying bacteria, as has been demonstrated in lakes [27].
Investing in habitats that serve as short-term nutrient sinks, only to be nutrient sources later in the season, may skew conservation dollars toward practices that have lower net nutrient retention or removal capabilities than expected. Likewise, understanding the influence of interactions between N and P loading on denitrification will enhance our understanding of denitrification potential in agricultural waterways. In the current study, we explored the potential interactions between P enrichment and enhanced N removal and the extent to which ditch vegetation may impact net nutrient retention by serving as a winter nutrient source. We conducted a two-part experiment in mesocosms planted with L. oryzoides to investigate both short-term nutrient mitigation during the summer, as well as potential nutrient release during fall and winter senescence. We hypothesized that: (1) N retention would be positively influenced by P loading rates due to potential indirect interactions with drivers of N retention processes (e.g., denitrification), such as increased organic matter availability; and (2) P loss during winter runoff events would be driven by summer loading rates because excess P retained in plant biomass is lost during senescence and subsequent leaching during the decomposition process.

2. Materials and Methods

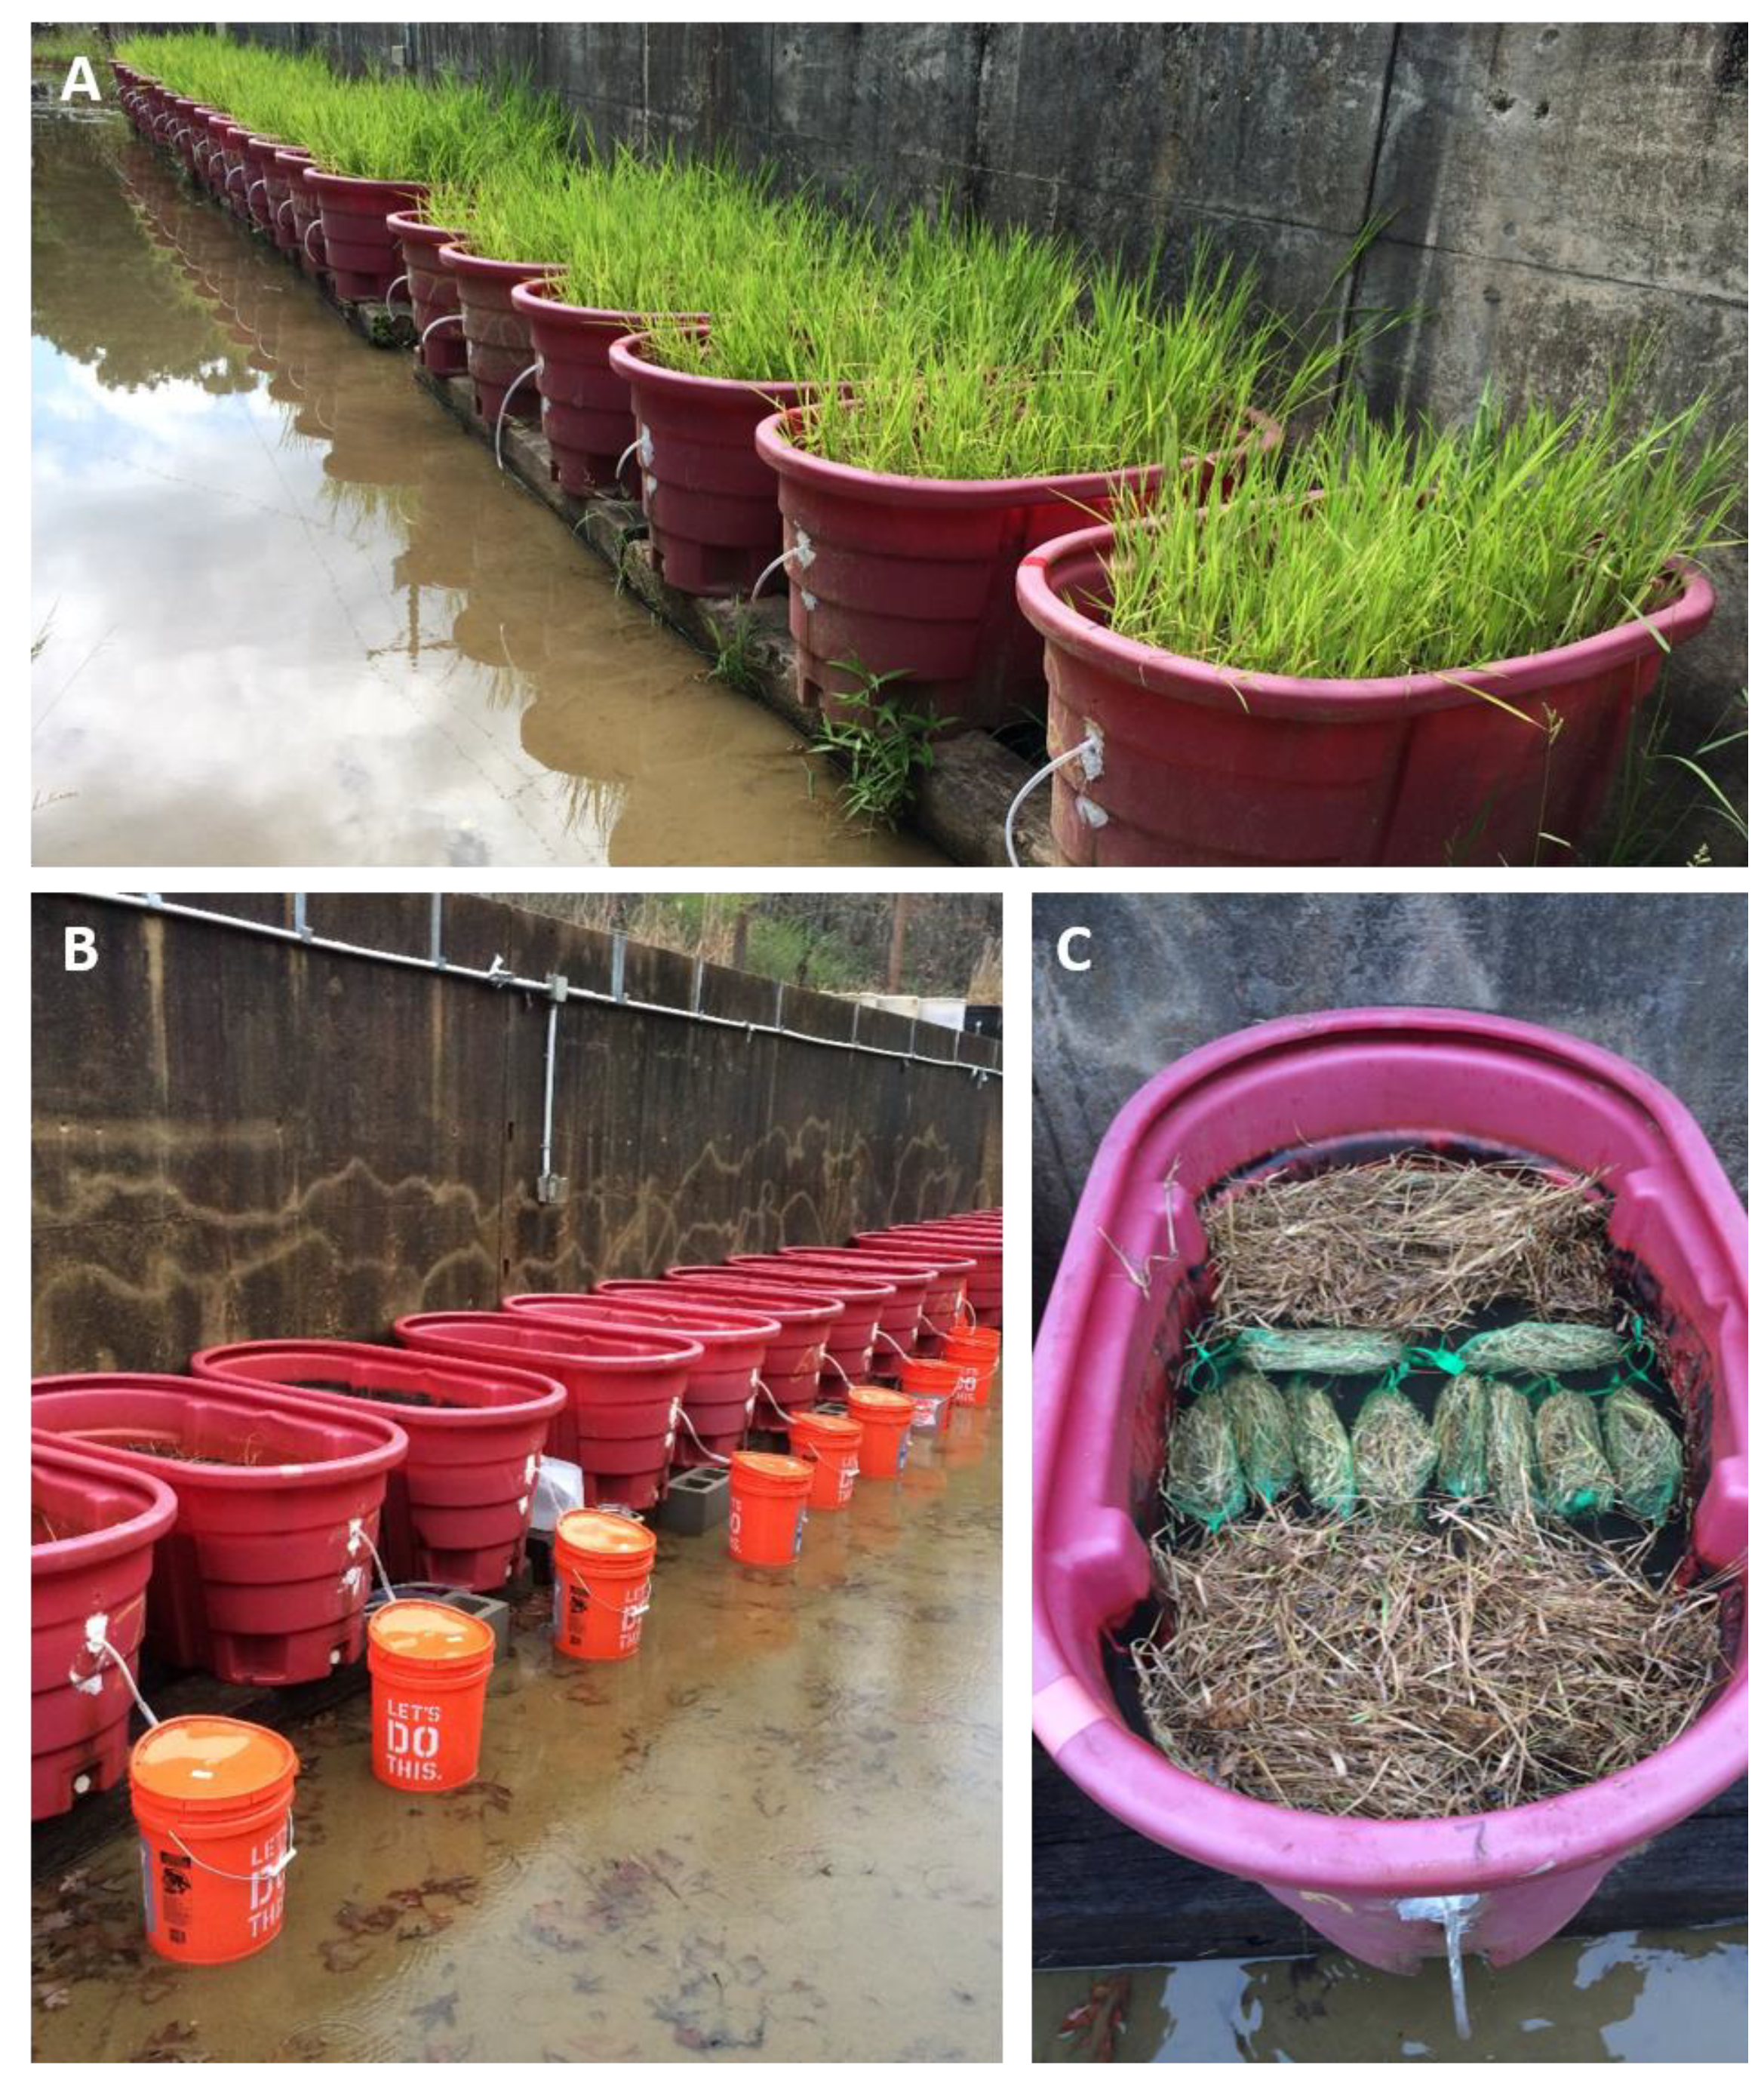
2.1. Experimental Design

We established 20 outdoor mesocosms in Rubbermaid tubs (1.25 by 0.6 by 0.8 m) at the United States Department of Agriculture-Agricultural Research Service (USDA-ARS) National Sedimentation Laboratory (NSL) in Oxford, MS (Figure 1A). All mesocosms were established by filling each tub with 22 cm of sand overlaid with 16 cm of sediment (Lexington silt loam) and planted with 18 clumps of L. oryzoides each. Rice cutgrass is a perennial, obligate wetland plant with a moderate, rhizomatous growth rate that lives in soil pH values ranging from 5.1 to 8.8 [28]. Native to Europe, Asia, and North America, rice cutgrass is ubiquitous across the lower 48 continental United States and Canada and is known to thrive in nutrient-enriched sediment and either slow-moving or stagnant water [29]. Plant stocks were collected from a natural floodplain wetland located at the University of Mississippi Field Station (UMFS) in Abbeville, MS, and were transported and evenly distributed across 20 different mesocosms at the NSL. We collected plants by hand in early April, being careful to collect intact root systems and minimize stress during the transplant process. Overlying water in mesocosms was maintained at approximately 15 cm by rain and supplemental watering from an Oxford municipal water well until the first simulated runoff event on 17 June 2014.

2.2. Experimental Runoff Event

We dosed mesocosms with NO3-N and phosphate (PO4-P)-enriched municipal well water on three consecutive dates (June, July, August) to simulate agricultural runoff events (Figure 1A). A single target NO3-N concentration of 5 mg L−1 was used to dose all 20 mesocosms. We manipulated dissolved PO4-P concentrations to establish control (0.17 mg L−1), low (0.34 mg L−1), moderate (0.68 mg L−1) and high (1.36 mg L−1) P dosing concentrations. Target nutrient concentrations were similar to observed mean N concentrations and the observed range of P concentrations from storm runoff events measured in small agricultural streams and ditches within the Mississippi Delta [30]. Our dosing regimen resulted in N:P ratios of 65, 32, 16, and 8 from the control to high treatments, respectively. The water depth of each mesocosm was drawn down to 2/3 of the original standing water volume prior to dosing to simulate the effect of controlled drainage systems commonly used in the Mississippi Delta [31]. Average depths and area of inundation were used to calculate initial volumes. We used Fluid Metering Inc. (FMI) piston pumps (Models QD-1 and QD-2) fitted with 0.95 cm (o.d) by 0.64 cm (i.d.) vinyl tubing to pump nutrient-enriched water into individual mesocosms. We exposed mesocosms to flowing, nutrient-enriched water for 6 h and adjusted the pump flow rates to target hydraulic retention times of 6 h before water exited mesocosms. This retention time is shorter than recommended for wetland treatment but represents the upper limit of realistic retention times in agricultural ditches.

2.3. Field Sample Collection and Laboratory Analysis

During summer runoff events, we collected water samples in 230 mL polyethylene cups from the discharge outflow at first outflow (mean ± SE; 1.18 ± 0.12 h), and at 2, 3, and 6 h after its initiation. Pre-runoff and post-runoff event water samples (t = 0, 9, 12, 24, and 72 h) were collected by dipping sample cups inside the tubs near the outflow. Water sampling at this frequency resulted in negligible (1–1.6%) loss of total volume. We also collected samples from each mixing chamber to confirm target concentrations and appropriate delivery of NO3-N and PO4-P to each treatment to maintain our experimental N:P gradient and calculate inflow loads of each nutrient. During the winter (5 December 2014 thru 9 March 2015), storm runoff samples were collected by fitting tubes to outflows that directed flow directly into separate covered collection buckets (Figure 1B). Most storm events did not Generate more than 21 L of runoff was generated, but in a few instances, nearly full buckets were replaced during prolonged rain events to allow capture of all runoff. After storm events, the total export volume was recorded for each mesocosm, and runoff water was well mixed, and then sampled for dissolved and total nutrients. All aqueous samples were stored frozen until they could be analyzed on a Lachat QuickChem 8599 autoanalyzer (Lachat Instruments) at the USDA-ARS -NSL. All filtered (0.45 µm) water samples were analyzed for NH4+-N, NO3-N, and PO4-P concentrations using the phenate, cadmium reduction, and molybdate methods, respectively [31]. Total Kjeldahl N and total P were also analyzed with Cd reduction and molybdate methods following digestion [32]. We also measured dissolved organic carbon (DOC) on filtered samples (0.45 µm) using an Apollo 9000 Combustion TOC analyzer (Teledyne Tekmar, Mason, OH, USA).

2.4. Plant Tissue Nutrient Content and Breakdown

At the end of the growing season (19 August 2014), we collected three replicate plant samples from each mesocosm to estimate biomass and tissue nutrient concentrations for root, stem, and leaf biomass. Samples were collected by isolating and removing three sediment core plugs (surface area = 41 cm2) from each mesocosm, rinsing all sediment from plant material, and separating material into root, stem and leaf components. In November, we clipped all remaining plant biomass, dried it to a constant weight at 50 °C and weighed total dry mass for each mesocosm. Litter bags were constructed by placing 10.0 g (SE = 0.04) of air-dried litter material into coarse (5 mm) mesh polypropylene non-wicketed grape bags (Glacier Valley Enterprises, Baraboo, Wisconsin, USA). On 2 December 2014, all harvested plant material, including 10 litter bags, were placed back in their respective mesocosm to simulate decay of plant material after senescence (Figure 1C). Two bags from each mesocosm (N = 40) were immediately retrieved after deployment (Day 0) and taken back to the laboratory to quantify and correct for water content, ash-free dry mass (AFDM), and handling loss [33]. We subsequently retrieved two bags from each mesocosm on days 13, 49, 69, and 97.
Litter bags were processed immediately after retrieval by rinsing over a 1 mm sieve and all litter captured in the sieve was placed in paper bags and dried at 60 °C until mass stabilized. Samples were weighed for dry mass and then converted to AFDM by grinding dry leaves following methods described above and combusting a 250 mg subsample at 500 °C for 1 h in a Thermo Scientific Thermoline muffle furnace (Thermo Fisher Scientific, Waltham, MA USA). We subtracted combusted material mass from dry mass to obtain AFDM and then calculated% OM of each sub-sampled litter pack as:
% OM = ( sample DM sample AFDM sample DM ) × 100
where percent (%) OM was used to covert DM to AFDM for whole litter packs collected from the field and to estimate litter standing stocks in each mesocosm. Initial litter mass for all bags was corrected for handling loss by subtracting the average% handling loss observed across mesocosms.
We measured the nutrient content for all plant samples from harvested material and litter bags. We measured the C and N content of plant tissues using a Vario Max CNS elemental analyzer (Elementar Analysensysteme GmbH, Hanau, Germany). The phosphorus content of plant material was measured by combusting a 4 ± 1 mg sample at 500 °C for 2 h followed by digestion of material in 1 N hydrochloric acid for 30 min at 85 °C [34]. Samples were diluted with deionized water and analyzed with the molybdate method [32] using a Turner Designs Trilogy laboratory fluorometer (Model # 7200-000) equipped with the phosphate absorbance module (Model # 7200-070; Turner Designs, Sunnyvale, California, USA). Percent AFDM remaining, % content for N, P and C, and initial standing stocks were used to estimate standing stocks of aboveground nutrient masses over time.

2.5. Whole-System N and P Budgets Estimates

Results were summarized by estimating 48 h whole-system N and P budgets using measured changes in NO3-N and PO4-P concentrations, denitrification rates, and mass balance equations for comparison among enrichment treatments. Nutrient inputs (mg) during each 6 h experimental runoff event were estimated as follows:
Nutrient input = MT conc × t × Q
where MTconc is mixing tank concentrations, t is number of hours and Q is the flow rate in L h−1. Nutrient outputs (mg) during the experimental runoff event were calculated as:
Nutrient output = Q i = 1 j ( Conc i × t i )
where Conci is the nutrient concentration corresponding to specific time interval (i) and ti is the time in hours corresponding to a specific time interval (i), and j = 6. Hydraulic nutrient retention as either NO3-N or PO4-P retention during the runoff event was estimated as:
Nutrient ret = ( Nutrient input + ( Conc bg × V ) ) Nutrient output
where Concbg is the background NO3-N or PO4-P concentration of the mesocosm prior to dosing in mg L−1 and V is the initial volume in the mesocosm in L before dosing. We estimated the contribution of denitrification to NO3-N removal for each runoff by first estimating N2 fluxes over time using changes in water column NO3-N concentrations over time and Michaelis–Menten models:
N 2 flux = V max [ NO 3 treatment ] K + [ NO 3 treatment ]
where Vmax is the maximum amount of N2 flux, [NO3 treatment] is the concentration of NO3-N in the overlying water (mg L−1), K is the concentration of NO3-N in the overlying water at which the net N2 flux is half of Vmax, and N2 flux is the amount of N2 (mg m−2, h−1) produced at a given NO3-N concentration. We used previously published parameter estimates for Vmax and K based on incubations of sediment cores collected from rice cutgrass mesocosms; the incubation temperature under which the model was developed was comparable to those observed in the current study [19]. Using outputs from the Michaelis–Menten model, we estimated net N2 flux versus time and integrated the area under the resulting curve. This provided an estimate of the total mass of N2 produced over the course of each simulated runoff event during the summer portion of the experiment. We tested the efficacy of modeling whole-system denitrification with these models by comparing estimates from a published mass balance model using sediment core incubations and the approach described above using data from previously published nutrient runoff simulations in similar mesocosms (Supplemental Material, Figures S1 and S2). Short-term denitrification efficiency was estimated as:
DNF efficiency = ( N 2 flux NO 3 N ret ) × 100
and represents the % of retained NO3-N that was denitrified during the simulated runoff events. Winter nutrient runoff exported from mesocosms during storm events was estimated as:
Nutrient export = V export × Conc export
where V is the volume of water collected during storm event (mL) and Conc is the concentration of nutrients in surface water (mg L−1). All estimates in the budget were standardized to 1 m2 to facilitate comparisons with other studies. Values for Nutrientinput, Nutrientoutput, Nutrientret, denitrification, and DNFefficiency were summed across the three simulated runoff events for accounting purposes unless otherwise presented separately to analyze time effects.

2.6. Statistical Analyses

We used a combination of generalized least-square (GLS) and linear mixed-effect (LME) models [35] to compute F statistics and test for differences in nutrient retention, denitrification estimates, plant biomass, breakdown and nutrient content, winter nutrient export, and cumulative nutrient fluxes. We compared P enrichment effects over time in summer and winter experiments using LME models that included a random effect to account for repeated measures within individual mesocosms (random = ~1|mesocosm). For comparisons of net fluxes across treatments, we used simple GLS models with no random effect. The restricted maximum likelihood criterion was used to fit all models and assumptions were assessed visually with normality plots (qqnorm) and standardized residual plots across levels of treatments [35]. In cases where error variances differed across treatment levels, we incorporated this heterogeneity by modeling variance separately among treatments with the VarIdent command [35]. We used least-square means (LSmean) to perform predetermined contrasts of overall factors or of factors within different time segments. We used the nlme package [36] to run LME and GLS models and lsmeans within the lsmeans package for multiple comparison tests within significant factors in R (version 3.2.3; R Development Core Team, Vienna, Austria).

3. Results

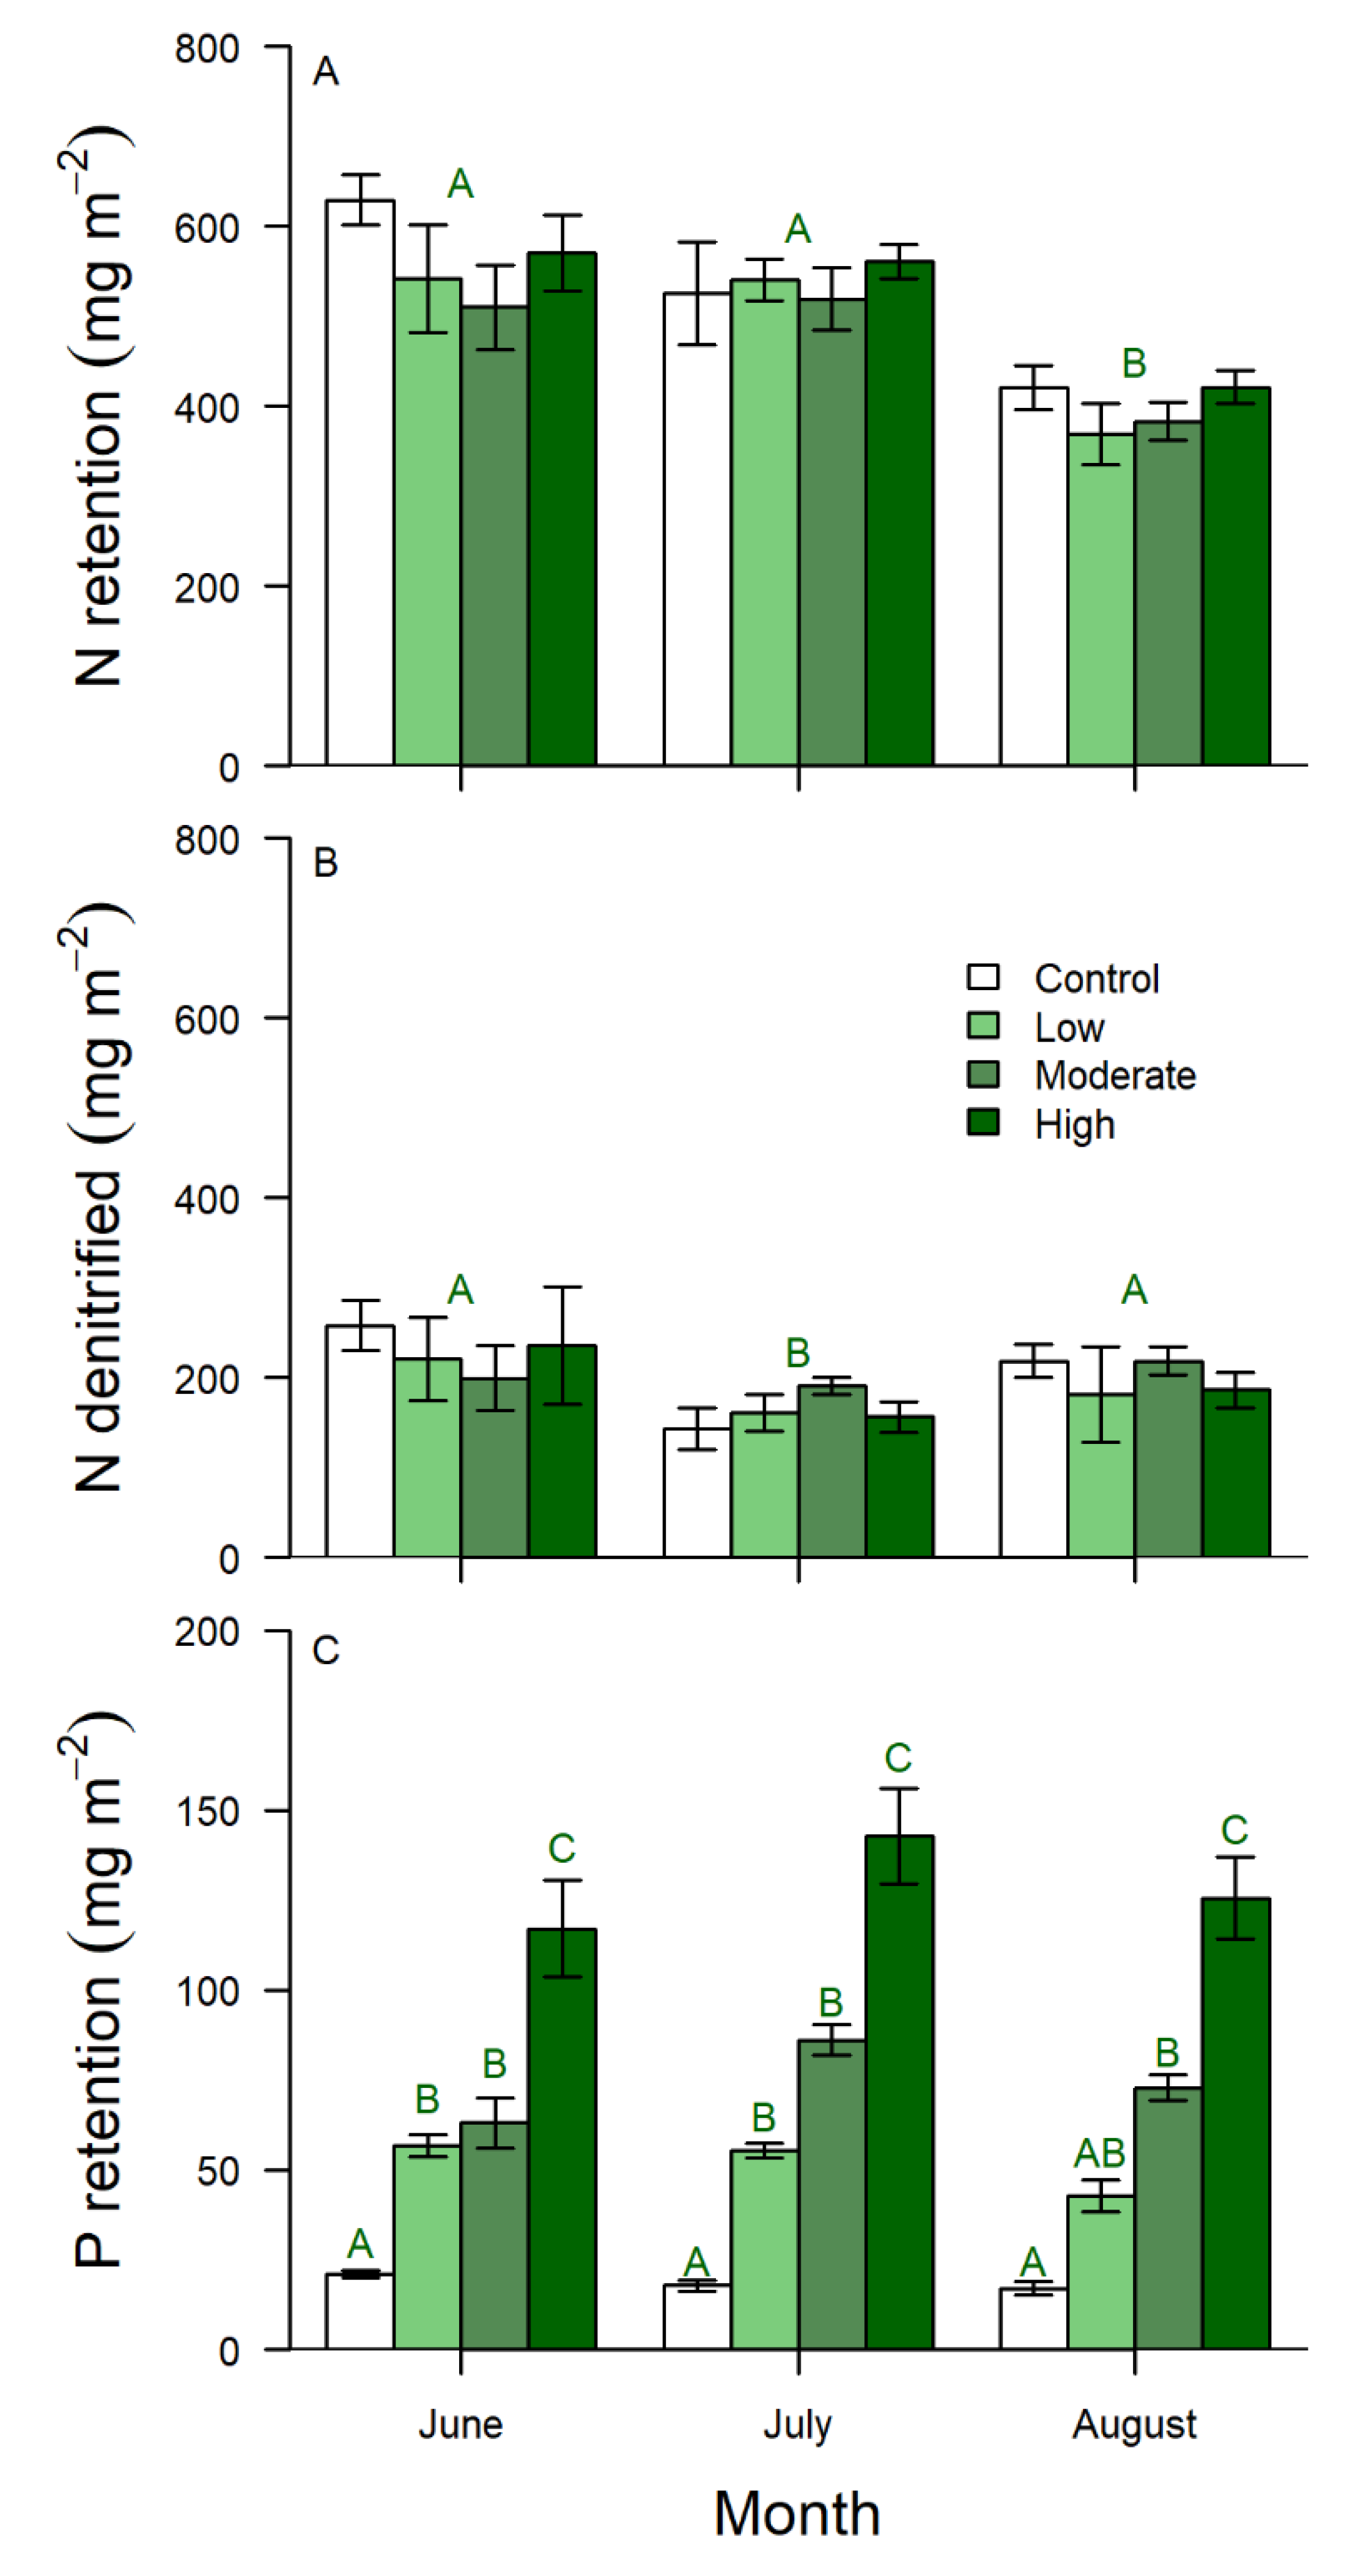
3.1. Summer Retention and Denitrification

Dissolved inorganic N retention during individual runoff events was high (500 ± 13.75 mg) and did not differ among P enrichment levels; however, N retention was significantly lower during the simulated runoff event in August (Table 1; LS means p < 0.05; Figure 2A). The estimated contribution of denitrification to N retention was variable and ranged from 71.5 to 522 mg per runoff event (Supplemental Materials, Table S1, Figure S3). Estimated denitrification did not differ among P enrichment treatments but was different among dates. Estimated denitrification in July was significantly lower than in June, but August estimated contributions were similar to those from June (Table 1: LS means p < 0.05; Figure 2B). Phosphorus retention increased significantly with P enrichment and month during summer runoff experiments (Table 1). During June and July simulated runoff events, P retention was significantly greater in mesocosms receiving highly enriched water and significantly lower in control mesocosms, compared to low and moderately enriched mesocosms (LS means p < 0.05; Figure 2C). Phosphorus retention decreased with lower P enrichment in August, but retention in mesocosms that received low P doses was intermediate between moderately enriched and control treatments (LS means p < 0.05; Figure 2C).

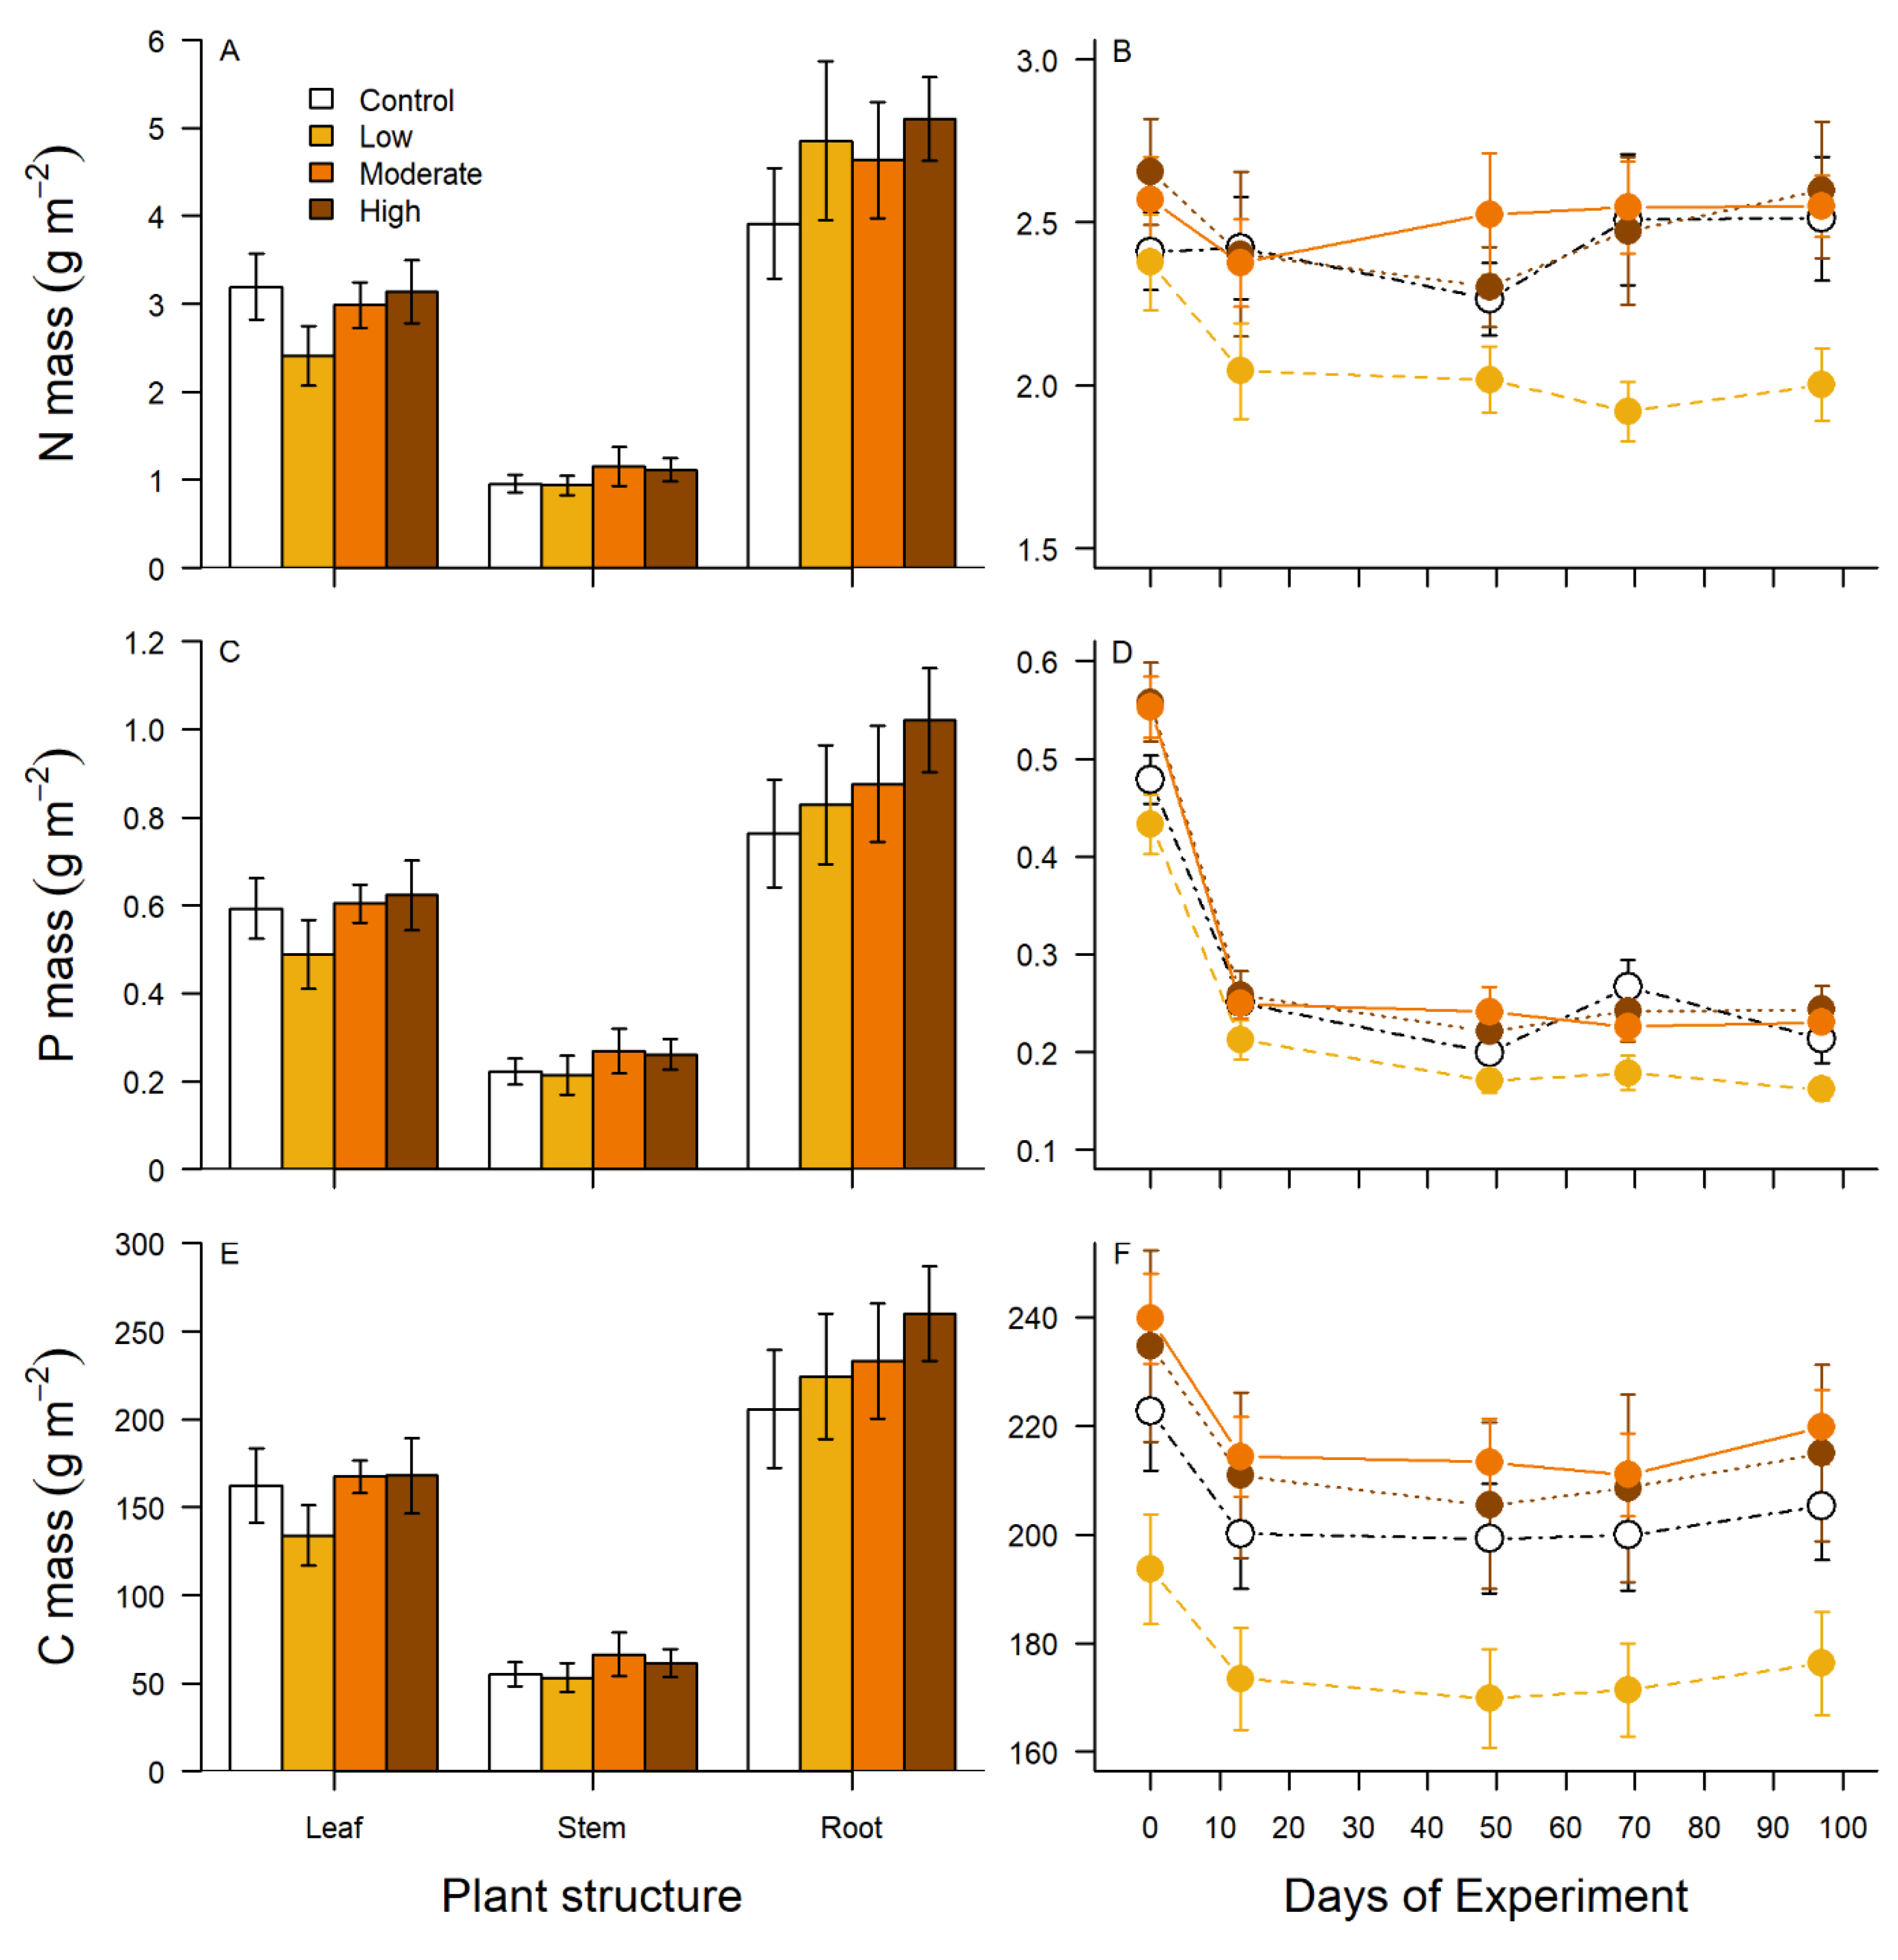
3.2. Plant Biomass, Breakdown, and Stoichiometry

At the end of the summer enrichment period, the total mass of N, P, and C in plant biomass trended higher in mesocosms enriched with the highest concentrations of P, but patterns associated with P enrichment were not significant (Table 2; Figure 3A,C,E).However, comparisons across separate plant structures indicated that significantly greater total mass of N, P, and C was stored in belowground roots compared to stem and leaf material. More recalcitrant stem material also had a lower N, P, and C total mass than leaf material (Table 2; Figure 3A,C,E). After senescence, harvested aboveground material contained a small fraction of original observed N, P, and C mass (Figure 3B,D,F). Biomass harvested in November indicated no loss of above-ground C storage compared to the end of the summer growing season. However, aboveground N and P mass had declined by 36.1 ± 2.04% and 37.0 ± 2.74%, respectively, indicating potentially more translocation of nutrients to roots may have occurred between early fall biomass sampling and aboveground biomass harvesting in winter.
Decomposition was minimal and not influenced by P enrichment (Table 3). Organic matter packs initially declined by ~10% but still retained 87% to 95% of mass by the end of the 97 day incubation study, indicating that changes in mass over time were driven by both decomposition and microbial colonization. This was evident when comparing changes in N mass over time. Change in N mass over time was dependent on P enrichment (Table 3, Figure 3B), but there were no clear patterns supporting a P enrichment effect. In control and moderately enriched mesocosms, there was no change in N mass over time (Figure 3B). In low treatments, there was an initial drop in N mass and then no change over time (Figure 3B). Likewise, in highly enriched mesocosms, there was an initial drop in N mass but after a recovery period, there was no difference in N mass between initial and final dates (Figure 3B). Overall changes in N mass were minimal compared to P and C. There was a significant drop in P mass between days 0 and 13 followed by little change throughout the rest of the study (Figure 3D). Likewise, while there was statistical evidence for the influence of P enrichment on changes in C mass over time (Table 3), the overall pattern showed an initial decrease in C mass followed by maintenance of mass over time (Figure 3F).

3.3. Winter Nutrient Export

There were 15 precipitation events during the 100 day winter portion of the study (Figure 4A). Individual precipitation events ranged from < 1 to ~10 cm and cumulatively accounted for almost 40 cm of precipitation during the 97 day study period (Figure 4A). Export of TN, TP, and TDOC during winter precipitation events was not significantly influenced by summer P enrichment treatments but significantly varied with time (Table 4). The majority of nutrient export occurred during the first rain event, four days after organic matter had been placed in mesocosms (Figure 4B–D). Thirty percent of the cumulative export of 130 mg m−2 TKN was accounted for by the initial runoff event on day 4 of the 97 day study (Figure 4B). For P, an initial pulse of 20 mg m−2 during the first runoff event accounted for 50% of the cumulative 40 mg m−2 of TP exported from mesocosms during the 97 day study (Figure 4C). The majority of TDOC (80%) exported from the system during the 97 day study also occurred during the first runoff event (Figure 4D).

3.4. Cumulative Flux

Cumulative fluxes from summer enrichment and winter export studies demonstrated that, on average, only 9.38 ± 0.83% of NO3-N retained during runoff events in the summer was exported during winter runoff events (Table 5). Phosphorus enrichment had no effect on NO3-N dynamics (Table 5). Modeled denitrification estimates using NO3-N data from summer runoff events indicated that 40.3 ± 2.36% of net NO3-N retention within vegetated mesocosm sediments was likely due to denitrification during and immediately after dosing with enriched water in the summer (Table 5). Comparisons between cumulative P fluxes from summer enrichment and winter export studies demonstrated significant differences in net P retention among P enrichment treatments (Table 5). A pattern of increasing P retention with increasing P enrichment during the summer, coupled with no differences in cumulative winter export, demonstrates a clear trend in increasing net P retention with increasing P enrichment. At low P enrichment levels, retention and loss were relatively balanced with only 26% of summer uptake retained throughout winter (Table 5). However, as P enrichment increased, 80%, 83%, and 90% net retention of summer uptake was observed during winter across the low, medium and high P enrichment treatments, respectively, indicating fairly consistent retention of excess P in vegetated mesocosms (Table 5).

4. Discussion

The objective of our study was to determine the net nutrient (N and P) mitigation potential of rice cutgrass in agricultural drainage environments by quantifying seasonal patterns in nutrient retention and release processes over annual cycles of growth and senescence in a controlled, experimental context. We hypothesized that both N and P retention would be influenced by P loading rates due to P availability and indirect interactions with drivers of N retention or removal. Net N retention was driven by high uptake during the growing season and low release during the winter in all vegetated mesocosms. We observed no evidence of an influence of P enrichment on N retention. High retention was likely driven by denitrification which was conservatively estimated to comprise 40% of retention during runoff events. In contrast, P retention increased with increasing loading rates, indicating the capacity of these systems for retaining P is higher than our experimental loading rates. We also hypothesized that excess P would be retained in plant biomass but leached after senescence, thus P loss during winter runoff events could be driven by summer loading rates. Our experimental observations did not support this hypothesis; no statistical evidence was found for increased P storage in plant biomass with increased enrichment, and no statistical differences in P runoff between our enrichment treatments were observed. Collectively, our results indicate that (1) vegetated drainage environments have a high capacity for N retention by serving as denitrification sinks; (2) these systems can also store significant loads of P; and (3) previously reported estimates of N and P retention in vegetated ditch environments are marginally impacted by nutrient releases associated with plant senescence and breakdown, at least when considering our study species (rice cutgrass; L. oryzoides) in agricultural areas of the Lower Mississippi River Basin.

4.1. The Role of Denitrification in Net Nitrogen retention in Vegetated Drainage Environments

Emergent vegetation plays a key role in reducing N export from agricultural drainage networks by enhancing conditions that promote denitrification [11,18,37]. Integration of modelled rates across time during our simulated runoff events indicated that approximately 40% of measured N retention was associate with denitrification in cutgrass mesocosms (Table 5). Our estimated denitrification rates (564–620 mg m−2) were similar to previously reported daily rates based on sediment core incubations (142–1049 mg m−2 day−1) [18,19] and daily diel N2-N flux estimates (700–1000 mg m−2 day−1) from experimental ditches vegetated with rice cutgrass [37]. Estimates from this study were also similar to reported denitrification rates (220–1176 mg m−2 day−1) from vegetated ditches in Italy [11,17,20] and the Czech Republic [14]. Studies in the Po River included both open channel and sediment core approaches to measuring denitrification, as well as day- and nighttime estimates.
Our model was based on sediment core incubations conducted only in the dark, which could bias results either positively or negatively. Light can enhance denitrification by increasing inorganic C delivery to sediments and the associated microbial community via root exudates [38,39] or conversely inhibit denitrification through photosynthesis-driven flux of O2 from aboveground biomass to the root zone [40,41,42]. Inhibition is unlikely in rice cutgrass beds given the relatively low convective flow rates in Leersia spp. [43,44] and experimental evidence that rice cutgrass maintains lower water column dissolved O2 concentrations than bare sediments in mesocosms [18]. Soana et al. [11] also demonstrated that sediment core incubations can account for as little as half of whole reach open-channel estimates of denitrification rates. Open-channel approaches to measuring denitrification potentially provide better estimates by integrating spatial and temporal heterogeneity of factors influencing denitrification at the reach scale but are highly dependent on factors that control the rates of gas transfer at the surface water interface [17,37,45]. While all methods of measuring denitrification in vegetated ditch environments are prone to different biases, our results, coupled with previous observations, provide strong support for denitrification serving as a dominant N removal pathway in vegetated ditches [11,17,18,19].
In addition to denitrification during runoff events, we observed significantly more N storage in root biomass compared to leaf or stem biomass at the end of the growing season, reducing the availability of organic N for leaching during the decomposition study. Reallocating a portion of excess nutrients to belowground storage for future growth and colonization at the end of the growing season is a common strategy in perennial plants [46]. It is also likely that aboveground senescent vegetation in our mesocosms enhanced denitrification rates. Microbial biofilms on senescent plant stems and sediments can denitrify N retained by ditch plants and potentially contribute to coupled nitrification-denitrification during the breakdown process [47,48].
Linkages between P enrichment and N removal have been demonstrated in lake environments, presumably due to the stimulation of primary production and therefor higher C sedimentation rates that can fuel benthic denitrification [27]. We hypothesized that a similar coupling of denitrification rates to P enrichment may occur in vegetated ditch environments via increases in productivity and plant uptake, which in turn, may increase C availability in the form of root exudates during the growing season or more plant biomass after senescence. We did not observe evidence for this effect, which could have been due to several factors. It is likely that indirect P enrichment effects on denitrification require longer time scales to be realized. Conversely, hydrologic and ecological differences between lakes and our experimental systems, and the ditches that they represent, may be too great to see the same relationships between enrichment and denitrification. Denitrification during simulated runoff events in summer, combined with the high potential for coupled nitrification-denitrification associated with breakdown and metabolism of organic matter in macrophyte beds over time during the fall, provides a good explanation for low observed N export from our vegetated mesocosms during winter storm events.

4.2. Potential for Nutrient Remobilization from Plant Tissue Outside of Growing Season

The primary reason for conducting this experiment was to evaluate the effects of leaching of nutrients from senescent plant material on the net nutrient mitigation potential of vegetated ditches in agricultural drainage networks. In contrast to N, there are no direct cycling pathways that permanently remove excess P in agricultural ditch networks. Observed P retention is more likely associated with biotic uptake or abiotic sorption. In addition to the potential for desorption from sediments associated with redox conditions and P equilibrium, the potential for aquatic remobilization of nutrients during plant senescence is of significant concern for long-term conservation practice development. In non-crop plant senescent leaching studies, results suggest nutrients once retained by plants are re-released in the environment during late fall and winter as plants die [23,24,25,26]. As such, we hypothesized that P export during winter storm events would be correlated with differential retention observed across our enrichment gradient. Contrary to our hypothesis, we observed no differences in P export during winter storm events across our enrichment gradient. This contradicts a 12-week greenhouse study, where senescent rice cutgrass plant material grown under P-enriched conditions released significantly higher P into the water column (2.19 ± 0.84 mg L−1) than unenriched and control mesocosms [23]. Wang et al. [49] examined the decomposition rate of Potamogeton crispus (curly pondweed) in deionized water within an incubator for 30 days, reporting a high rate of P release from senescent material.
Previous studies examining leaching of nutrients from senescent material have relied on measuring leaching rates in experimental chambers containing water only which represents a worst-case scenario for transfer of nutrients [23,24,25,49]. In contrast, we measured P release from senescent plant material in mesocosms that represented intact ecosystems with sediments, root systems, senescent plant biomass, and associated microorganisms. Only one other study used a similar approach to examine nutrient loss from senescent vegetation in whole mesocosms and ditches, but release rates were estimated by tracking surface water nutrient concentrations over time in stagnant mesocosms, rather than total export from system over time [26]. Our observations indicate significant translocation of excess P to root systems of rice cutgrass may partially explain the lack of observed differences in P export during winter. In addition to sediment microbes, the additional structure and C resources available in senescent emergent macrophytes also stimulates and maintains benthic and epiphytic periphyton assemblages that may enhance uptake and internal cycling of N and P [48,50,51]. Evidence from stream and wetland ecosystems indicate that the productivity of heterotrophic and autotrophic components of periphyton matrices and floating mats are coupled through efficient recycling of limiting nutrients when water column nutrients are not available [50,51]. The combination of uptake, microbial recycling, denitrification, and translocation of nutrients to root systems provides a compelling explanation for the high net N and P retention observed in our mesocosm study.

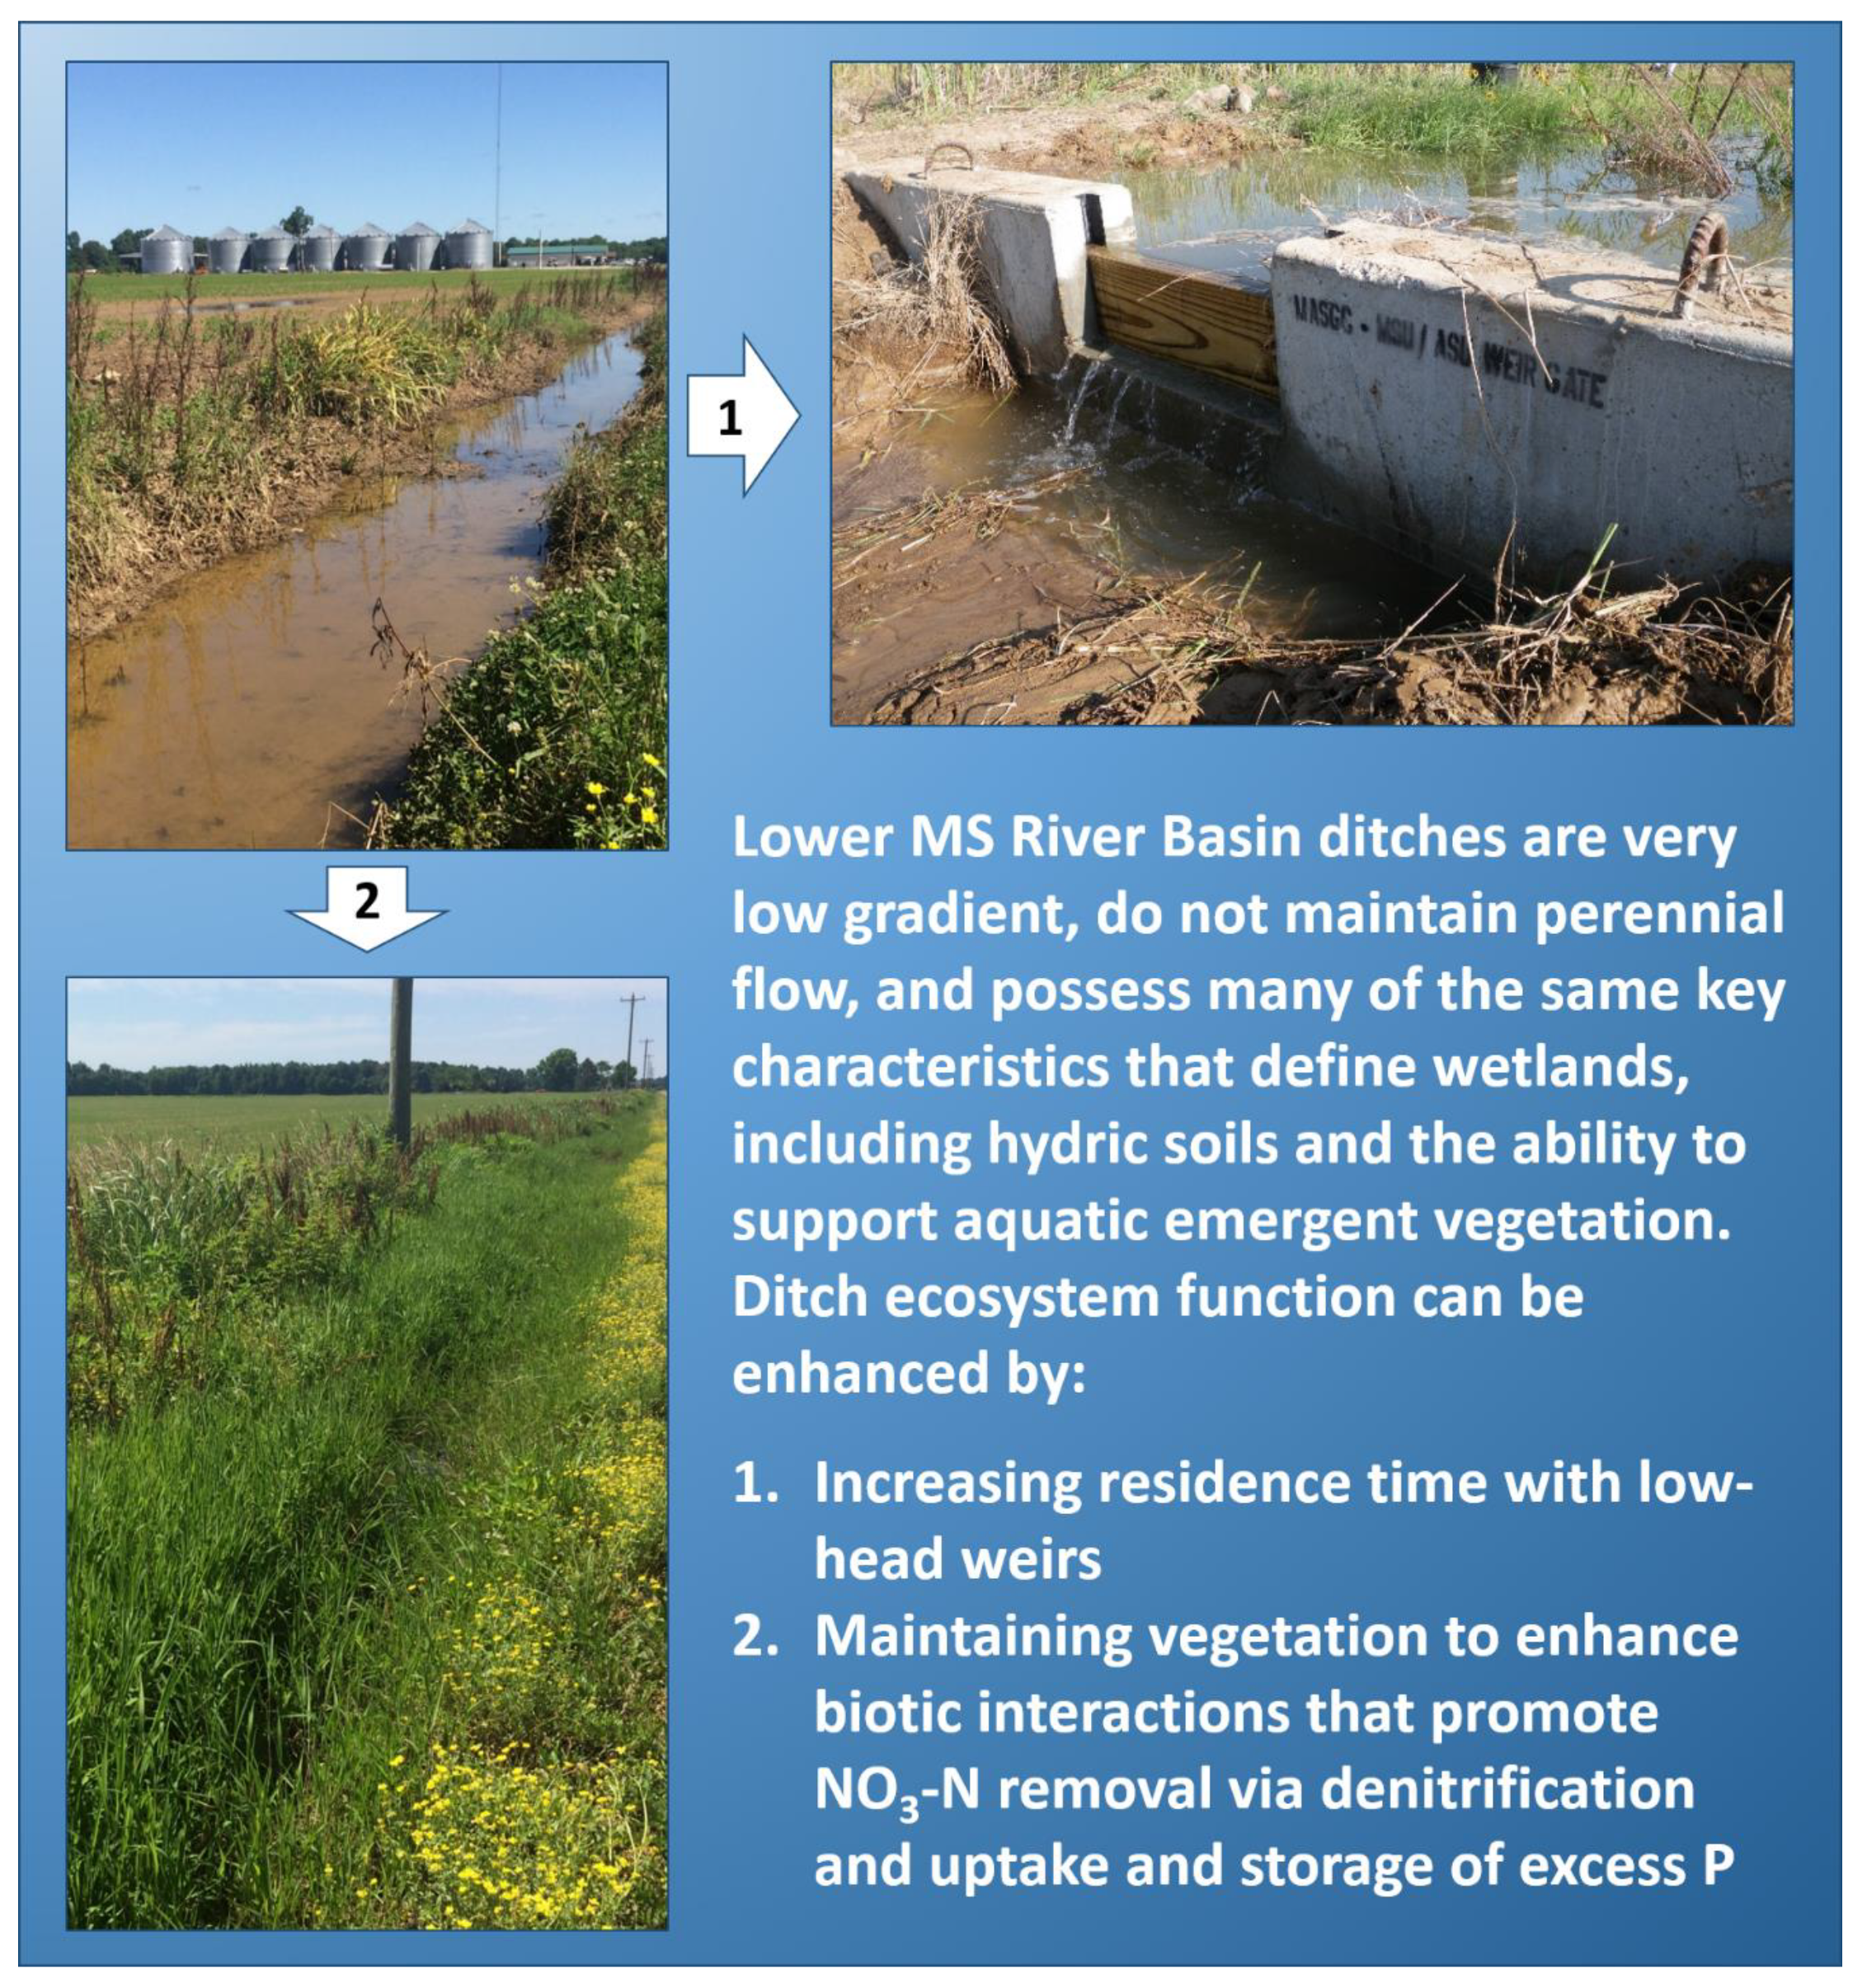
4.3. Managing Nitrogen and Phosphorus Runoff within Vegetated Agricultural Drainage Networks

Despite experimental evidence supporting the utility of using vegetated agricultural ditches to trap, remove, and/or store excess N and P from agricultural runoff, several additional environmental or management factors may compromise the effectiveness of this conservation practice in managing nutrients in agricultural landscapes. Our experimental mesocosms were relatively new ecosystems, and it is likely that excess P resources were utilized to support rhizome expansion and colonization of available sediment space by rice cutgrass. Biotic and abiotic P uptake are saturating processes and it is likely that continued exposure to P-enriched runoff could lead to saturation of storage capacity, shifting vegetated ditches from a sink to a source of P during runoff events. Thus, despite potential for P storage, vegetated ditches do require careful management in the form of limited harvesting to maintain P storage capacity [26]. Vegetated ditches also play a key role in trapping suspended sediments (and associated bound P), which serves as an additional compartment with potential P source–sink dynamics [14,52]. Biological activity associated with vegetation can mediate physical conditions that influence the balance between sorption and release of P in sediments by modulating O2 availability and redox conditions associated with diel patterns in primary production and respiration. For example, overlying water in rice cutgrass beds maintains less dissolved O2 throughout the diel cycle, presumably due to enhanced sediment O2 demand associated with high respiration activity. While harvesting plant biomass is generally assumed to be the best method for minimizing P storage saturation in ditch ecosystems, harvesting needs to be limited and carefully managed to maintain biofilms that influence denitrification and other nutrient processes [48]. Harvesting belowground biomass in limited patches may also provide opportunities for removing stored P and provide new area for rice cutgrass to store future excess P through increased colonization.
Agricultural ditches are designed to provide access to productive alluvial soils by draining fields quickly [53,54,55]; nutrient retention and associated processes in ditches are highly dependent on hydraulic residence times. While there is evidence that vegetated ditches increase water residence time and maximize contact between nutrient-enriched runoff and microbial communities in ditch habitats, additional hydrologic management is needed to maximize nutrient retention and removal in vegetated ditches [55,56,57]. There are multiple approaches to the management of hydrology including slotted inlet pipes, low head weirs, and two-stage ditches that, in conjunction with vegetation management, may increase nutrient retention and removal within agricultural drainage networks [58]. In poorly drained landscapes of the Lower Mississippi River Basin, extensive research on low-grade weirs has demonstrated that small barriers can increase the depth and duration of wetted areas, time to peak flow during storm events, and nutrient uptake [32,59,60]. In the Upper Mississippi River Basin, researchers have demonstrated that two-stage ditches enhance connectivity between vegetated floodplains and enhance denitrification, P storage, and sediment deposition [61,62,63]. Despite demonstrated advantages to managing vegetation and hydrology within drainage networks, these environments will have an optimal nutrient removal/retention efficiency that can easily be overwhelmed by high N and P concentrations in stormwater driven nutrient runoff [20,56].
It is also important for watershed managers to couple field-based best management practices such as cover crops, vegetated buffer strips, and increased nutrient use efficiency in agricultural production areas to reduce excess nutrient mobilization and runoff into ditch systems [64,65,66]. Reducing the magnitude and altering the timing of delivery of nutrient runoff through sustainable, on-field practices will increase the utility of vegetated ditches as a strategy for reducing N and P export from agricultural watersheds. In conclusion, our experimental results indicate that vegetated ditches potentially serve as denitrification sinks and important habitats for increasing storage of excess P in agricultural drainage networks. However, their true potential as important modulators of N export from agricultural watersheds is probably realized through combinations of hydrologic and vegetation management practice within ditches (Figure 5) combined with field management practices (e.g., cover crops). More research is needed to understand cumulative benefits of integrated management practices within drainage networks, agricultural areas, and intervening habitats for N and P retention in agricultural watersheds.

Supplementary Materials

The following is available online at https://www.mdpi.com/2073-4441/12/3/875/s1, SI.docx: Explanation, testing and implementation of the Michaelis–Menten model from Speir et al. (2017) used to estimate contribution of denitrification during simulated runoff events. Figure S1. Measured NO3-N concentrations over time during simulated runoff events from Taylor et al. 2015 (A). Estimated N2-N flux rates over time calculated using equation 1 (B). Figure S2. Comparison of 48-hr N2-N flux estimates from mesocosms vegetated with rice cutgrass during simulated runoff events. Mass balance estimates are from Taylor et al. (2015) and Michaelis-Menten estimates are from application of models developed by Speir et al. (2017) to the same dataset. Figure S3. Measured NO3-N concentrations over time during simulated runoff events in June (A), July (C), and August (E) and estimated N2-N flux rates over time for June (B), July (D) and August (F) calculated by applying equation S1 to NO3-N data. Table S1. Mean ± 1 SE N2-N flux estimates (mg of N) for June, July and August simulated runoff events. Total N2-N flux is also reported.

Author Contributions

Conceptualization, J.T, M.M. and S.T.III; methodology, J.T., M.M., S.L.S. and S.T.III; validation, J.T., M.M. and S.L.S.; data collection, J.T., M.M. and S.T.III; data analyses. J.T.; writing—original draft preparation, J.T. and M.M.; writing—review and editing, J.T., M.M. S.L.S. and S.T.III All authors have read and agreed to the published version of the manuscript.

Funding

This research received no external funding.

Acknowledgments

Lisa Brooks and James Hill provided nutrient analysis. Katelynn Dillard and Charlie Bryant assisted with field and laboratory processing of plant material. Lindsey Yasarer and Rachel Nifong provided helpful comments that improved this manuscript. Mention of trade names or commercial products in this article is solely for the purpose of providing specific information and does not imply recommendation or endorsement by the USDA. The USDA is an equal opportunity employer and provider.

Conflicts of Interest

The authors declare no conflict of interest.

References

  1. Battye, W.; Aneja, V.P.; Schlesinger, W.H. Is nitrogen the next carbon? Earth’s Futur. 2017, 5, 894–904. [Google Scholar] [CrossRef] [Green Version]
  2. Cordell, D.; White, S. Life’s bottleneck: Sustaining the world’s phosphorus for a food secure future. Annu. Rev. Eviron. Resour. 2014, 39, 161–188. [Google Scholar] [CrossRef]
  3. Sarvajayakesavalu, S.; Lu, Y.; Withers, P.J.A.; Pavinato, P.S.; Pan, G.; Chareonsudjai, P. Phosphorus recovery: A need for an integrated approach. Ecosyst. Health Sust. 2018, 4, 48–57. [Google Scholar] [CrossRef] [Green Version]
  4. Stoddard, J.L.; Van Sickle, J.; Herlihy, A.T.; Brahney, J.; Paulsen, S.; Peck, D.V.; Mitchell, R.; Pollard, A.I. Continental-scale increase in lake and stream phosphorus: Are oligotrophic systems disappearing in the United States? Environ. Sci. Technol. 2016, 50, 3409–3415. [Google Scholar] [CrossRef] [PubMed] [Green Version]
  5. Fisher, J.; Acreman, M.C. Wetland nutrient removal: A review of the evidence. Hydrol. Earth Syst. Sci. 2004, 8, 673–685. [Google Scholar] [CrossRef] [Green Version]
  6. Vymazal, J. Plants used in constructed wetlands with horizontal subsurface flow: A review. Hydrobiologia 2011, 674, 133–156. [Google Scholar] [CrossRef]
  7. Vymazal, J. The use of constructed wetlands for nitrogen removal from agricultural drainage: A review. Sci. Agric. Bohem. 2017, 48, 82–91. [Google Scholar] [CrossRef] [Green Version]
  8. Wang, M.; Zhang, D.; Dong, J.; Tan, S.K. Application of constructed wetlands for treating agricultural runoff and agro-industrial wastewater: A review. Hydrobiologia 2018, 805, 1–31. [Google Scholar] [CrossRef]
  9. Tournebize, J.; Chaumont, C.; Mander, Ü. Implications for constructed wetlands to mitigate nitrate and pesticide pollution in agricultural drained watersheds. Ecol. Eng. 2017, 103, 415–425. [Google Scholar] [CrossRef]
  10. Li, J.; Yang, X.; Wang, Z.; Shan, Y.; Zheng, Z. Comparison of four aquatic plant treatment systems for nutrient removal from eutrophied water. Bioresour. Technol. 2015, 179, 1–7. [Google Scholar] [CrossRef]
  11. Soana, E.; Balestrini, R.; Vincenzi, F.; Bartoli, M.; Castaldelli, G. Mitigation of nitrogen pollution in vegetated ditches fed by nitrate-rich spring waters. Agric. Ecosyst. Environ. 2017, 243, 74–82. [Google Scholar] [CrossRef]
  12. Lu, B.; Xu, Z.; Li, J.; Chai, X. Removal of water nutrients by different aquatic plant species: An alternative way to remediate polluted rural rivers. Ecol. Eng. 2018, 110, 18–26. [Google Scholar] [CrossRef]
  13. Moore, M.T.; Kroger, R.; Locke, M.A.; Cullum, R.F.; Steinriede Jr, R.W.; Testa, S., III.; Lizotte, R.E., Jr.; Bryant, C.T.; Cooper, C.M. Nutrient mitigation capacity in Mississippi Delta, USA drainage ditches. Environ. Pollut. 2010, 158, 175–184. [Google Scholar] [CrossRef] [PubMed]
  14. Vzmazal, J.; Březinová, T.D. Removal of nutrients, organics and suspended solids in vegetated agricultural drainage ditch. Ecol. Eng. 2018, 118, 97–103. [Google Scholar] [CrossRef]
  15. Schaller, J.L.; Royer, T.V.; David, M.B.; Tank, J.L. Denitrification associated with plants and sediments in an agricultural stream. J. N. Am. Benthol. Soc. 2004, 23, 667–676. [Google Scholar] [CrossRef]
  16. Mulholland, P.J.; Helton, A.M.; Poole, G.C.; Hall, R.O., Jr.; Hamilton, S.K.; Peterson, B.J.; Tank, J.L.; Ashkenas, I.R.; Cooper, I.W.; Dahm, C.N.; et al. Stream denitrification across biomes and its response to anthropogenic nitrate loading. Nature 2008, 452, 202–205. [Google Scholar] [CrossRef]
  17. Castaldelli, G.; Soana, E.; Racchetti, E.; Vincenzi, F.; Fano, E.A.; Bartoli, M. Vegetated canals mitigate nitrogen surplus in agricultural watersheds. Agric. Ecosyst. Environ. 2015, 212, 253–262. [Google Scholar] [CrossRef]
  18. Taylor, J.M.; Moore, M.T.; Scott, J.T. Contrasting nutrient mitigation and denitrification potential of agricultural drainage environments with different emergent aquatic macrophytes. J. Environ. Qual. 2015, 44, 1304–1314. [Google Scholar] [CrossRef] [Green Version]
  19. Speir, S.L.; Taylor, J.M.; Scott, J.T. Seasonal differences in relationships between nitrate concentration and denitrification rates in ditch sediments vegetated with rice cutgrass. J. Environ. Qual. 2017, 46, 1500–1509. [Google Scholar] [CrossRef]
  20. Soana, E.; Bartoli, M.; Milardi, M.; Fano, E.A.; Castaldelli, G. An ounce of prevention is worth a pound of cure: Managing macrophytes for nitrate mitigation in irrigated agricultural watersheds. Sci. Total Environ. 2019, 647, 301–312. [Google Scholar] [CrossRef]
  21. Tyler, H.L.; Moore, M.T.; Locke, M.A. Influence of three aquatic macrophytes on mitigation of nitrogen species from agricultural runoff. Water Air Soil Poll. 2012, 223, 3227–3236. [Google Scholar] [CrossRef]
  22. Tyler, H.L.; Moore, M.T.; Locke, M.A. Potential for phosphate mitigation from agricultural runoff by three aquatic macrophytes. Water Air Soil Poll. 2012, 223, 4557–4564. [Google Scholar] [CrossRef]
  23. Krӧger, R.; Holland, M.M.; Moore, M.T.; Cooper, C.M. Plant senescence: A mechanism for nutrient release in temperate agricultural wetlands. Environ. Pollut. 2007, 146, 114–119. [Google Scholar] [CrossRef] [PubMed]
  24. Peverly, J.H. Element accumulation and release by macrophytes in a wetland stream. J. Environ. Qual. 1985, 14, 137–143. [Google Scholar] [CrossRef]
  25. Menon, R.; Holland, M.M. Phosphorus release due to decomposition of wetland plants. Wetlands 2014, 34, 1191–1196. [Google Scholar] [CrossRef]
  26. Kumwimba, M.N.; Dzakpasu, M.; Zhu, B.; Muyembe, D.K. Uptake and release of sequestered nutrient in subtropical monsoon ecological ditch plant species. Water Air Soil Poll. 2016, 227, 405. [Google Scholar] [CrossRef]
  27. Finlay, J.C.; Small, G.E.; Sterner, R.W. Human influences on nitrogen removal in lakes. Science 2013, 342, 247–250. [Google Scholar] [CrossRef]
  28. USDA Plants Database. Available online: https://plants.sc.egov.usda.gov/java/charProfile?symbol=LEOR (accessed on 22 January 2020).
  29. Darris, D.; Bartow, A. Plant Fact Sheet for Rice Cutgrass (Leersia oryzoides); USDA-Natural Resources Conservation Service, Plant Materials Center: Corvallis, OR, USA, 2004. [Google Scholar]
  30. Shields, F.D., Jr.; Testa, S., III.; Cooper, C.M. Nitrogen and phosphorus levels in the Yazoo River basin, Mississippi. Ecohydrology 2009, 2, 270–278. [Google Scholar] [CrossRef]
  31. Krӧger, R.; Cooper, C.M.; Moore, M.T. A preliminary study of an alternative controlled drainage strategy in surface drainage ditches: Low-grade weirs. Agric. Water Manag. 2008, 95, 678–684. [Google Scholar] [CrossRef]
  32. American Public Health Association (APHA). Standard Methods for the Examination of Water and Wastewater, 21st ed.; American Public Health Association/American Water Works Association/Water Environment Federation: Washington, DC, USA, 2005. [Google Scholar]
  33. Benfield, E.F.; Fritz, K.M.; Tiegs, S.D. Leaf-litter breakdown. In Methods in Stream Ecology, Volume 2: Ecosystem Function, 3rd ed.; Lamberti, G.A., Hauer, F.R., Eds.; Academic Press: London, UK, 2017; pp. 71–82. [Google Scholar]
  34. Halvorson, H.M.; White, G.; Scott, J.T.; Evans-White, M.A. Dietary and taxonomic controls on incorporation of microbial carbon and phosphorus by detritivorous caddisflies. Oecologia 2016, 180, 567–579. [Google Scholar] [CrossRef]
  35. Zuur, A.F.; Ieno, E.N.; Walker, N.; Saveliev, A.A.; Smith, G.M. Mixed Effects Models and Extensions in Ecology with R; Springer: Berlin/Heidelberg, Germany, 2009. [Google Scholar]
  36. Pinheiro, J.; Bates, D.; DebRoy, S.; Sarkar, D.; Heisterkamp, S.; Van Willigen, B. Nlme: Linear and Nonlinear Mixed Effects Models. R Project for Statistical Computing, Vienna, Austria. Available online: https://cran.r-project.org/web/packages/nlme (accessed on 27 July 2018).
  37. Nifong, R.L.; Taylor, J.M.; Adams, G.; Moore, M.T.; Farris, J.L. Recognizing both denitrification and nitrogen consumption improves performance of stream diel N2 flux models. Limno. Oceanogr. Meth. In press.
  38. Christensen, P.B.; Sørensen, J. Temporal variation of denitrification activity in plant-covered, littoral sediment from Lake Hampen, Denmark. Appl. Environ. Microbiol. 1986, 51, 1174–1179. [Google Scholar] [CrossRef] [PubMed] [Green Version]
  39. Zhai, X.; Piwpuan, N.; Arias, C.A.; Headley, T.; Brix, H. Can root exudates from emergent plants fuel denitrification in subsurface flow constructed wetlands. Ecol. Eng. 2013, 61, 555–563. [Google Scholar] [CrossRef]
  40. Brix, H.; Sorrel, B.K.; Orr, P.T. Internal pressurization and convective gas flow in some emergent freshwater macrophytes. Limnol. Oceanogr. 1992, 37, 1420–1433. [Google Scholar] [CrossRef]
  41. Bendix, M.T.; Tornbjerg, T.; Brix, H. Internal gas transport in Typha latifolia L. and Typha angustifolia L.: 1. Humidity-induced pressurization and convective throughflow. Aquat. Bot. 1994, 49, 75–89. [Google Scholar] [CrossRef]
  42. Veraart, A.J.; De Bruijne, W.J.J.; de Klein, J.J.M.; Peeters, E.T.H.M.; Scheffer, M. Effects of aquatic vegetation type on denitrification. Biogeochemistry 2011, 104, 267–274. [Google Scholar] [CrossRef] [Green Version]
  43. Sorrel, B.K.; Hawes, I. Convective gas flow development and the maximum depths achieved by helophyte vegetation in lakes. Ann. Bot. 2010, 105, 165–174. [Google Scholar] [CrossRef] [Green Version]
  44. Konnerup, D.; Sorrell, B.K.; Brix, H. Do tropical wetland plants possess convective gas flow mechanisms? New Phytol. 2011, 190, 379–386. [Google Scholar] [CrossRef]
  45. Reisinger, A.J.; Tank, J.L.; Hoellein, T.J.; Hall, R.O., Jr. Sediment, water column, and open-channel denitrification in rivers measured using membrane-inlet mass spectrometry. J. Geophys. Res. Biogeosci. 2016, 121, 1258–1274. [Google Scholar] [CrossRef] [Green Version]
  46. Yang, J.; Udvardi, M. Senescence and nitrogen use efficiency in perennial grasses for forage and biofuel production. J. Exp. Bot. 2018, 69, 855–865. [Google Scholar] [CrossRef] [Green Version]
  47. McMillan, S.K.; Piehler, M.F.; Thompson, S.P.; Pearl, H.W. Denitrification of nitrogen released from senescing algal biomass in coastal agricultural headwater streams. J. Environ. Qual. 2010, 39, 274–281. [Google Scholar] [CrossRef]
  48. Soana, E.; Gavioli, A.; Tamburini, E.; Fano, E.A.; Castaldelli, G. To mow or not to mow: Reed biofilms as denitrification hotspots in drainage canals. Ecol. Eng. 2018, 113, 1–10. [Google Scholar] [CrossRef]
  49. Wang, L.; Liu, Q.; Hu, C.; Liang, R.; Qiu, J.; Wang, Y. Phosphorus release during decomposition of the submerged macrophyte Potamogeton crispus. Limnology 2018, 19, 355–366. [Google Scholar] [CrossRef] [Green Version]
  50. Scott, J.T.; Doyle, R.D. Coupled photosynthesis and heterotrophic bacterial biomass production in a nutrient-limited wetland periphyton mat. Aquat. Microb. Ecol. 2006, 45, 69–77. [Google Scholar] [CrossRef] [Green Version]
  51. Scott, J.T.; Back, J.A.; Taylor, J.M.; King, R.S. Does nutrient enrichment decouple algal-bacterial production in periphyton? J. N. Am. Benthol. Soc. 2008, 27, 332–344. [Google Scholar] [CrossRef]
  52. Sharpley, A.N.; Krogstad, T.; Kleinman, P.J.A.; Haggard, B.; Shigaki, F.; Saporito, L.S. Managing natural processes in drainage ditches for nonpoint source phosphorus control. J. Soil Water Conserv. 2007, 62, 197–206. [Google Scholar]
  53. Moore, M.T.; Bennett, E.R.; Cooper, C.M.; Smith, S., Jr.; Shields, F.D., Jr.; Milam, C.D.; Farris, J.L. Transport and fate of atrazine and lambda-cyhalothrin in an agricultural drainage ditch in the Mississippi Delta, USA. Agric. Ecosyst. Environ. 2001, 87, 309–314. [Google Scholar] [CrossRef]
  54. Needelman, B.A.; Kleinman, P.J.A.; Strock, J.S.; Allen, A.L. Improved management of agricultural drainage ditches for water quality protection: An overview. J. Soil Water Conserv. 2007, 62, 171–178. [Google Scholar]
  55. Stock, J.S.; Dell, C.J.; Schmidt, J.P. Managing natural processes in drainage ditches for nonpoint source nitrogen control. J. Soil Water Conserv. 2007, 62, 188–196. [Google Scholar]
  56. Royer, T.V.; Tank, J.L.; David, M.B. Transport and fate of nitrate in headwater agricultural streams in Illinois. J. Environ. Qual. 2004, 33, 1296–1304. [Google Scholar] [CrossRef]
  57. Sheibley, R.W.; Duff, J.H.; Tesoriero, A.J. Low transient storage and uptake efficiencies in seven agricultural streams. J. Environ. Qual. 2014, 43, 1980–1990. [Google Scholar] [CrossRef]
  58. Krӧger, R.; Prince Czarnecki, J.M.; Tank, J.L.; Christopher, S.F.; Witter, J.D. Implementing innovative drainage management practices in the Mississippi River Basin to enhance nutrient reductions. J. Am. Water Resour. Assoc. 2015, 51, 1020–1028. [Google Scholar] [CrossRef]
  59. Krӧger, R.; Moore, M.T.; Farris, J.L.; Gopalan, M. Evidence for the use of flow-grade weirs in drainage ditches to improve nutrient reductions from agriculture. Water Air Soil Pollut. 2011, 221, 223–234. [Google Scholar] [CrossRef]
  60. Usborne, E.L.; Krӧger, R.; Pierce, S.C.; Brandt, J.; Goetz, D. Preliminary evidence of sediment and phosphorus dynamics behind newly installed low-grade weirs in agricultural drainage ditches. Water Air Soil Pollut. 2013, 224, 1–11. [Google Scholar] [CrossRef]
  61. Roley, S.S.; Tank, J.L.; Stephen, M.L.; Johnson, L.T.; Beaulieu, J.J.; Witter, J.D. Floodplain restoration enhances denitrification and reach-scale nitrogen removal in an agricultural stream. Ecol. App. 2012, 22, 281–297. [Google Scholar] [CrossRef] [Green Version]
  62. Mahl, U.H.; Tank, J.L.; Roley, S.S.; Davis, R.T. Two-stage ditch floodplains enhance N-removal capacity and reduce turbidity and dissolved P in agricultural streams. J. Am. Water Resour. Assoc. 2015, 51, 923–940. [Google Scholar] [CrossRef]
  63. Hanrahan, B.R.; Tank, J.L.; Dee, M.M.; Trentman, M.T.; Berg, E.M.; McMillan, S.K. Restored floodplains enhance denitrification compared to naturalized floodplains in agricultural streams. Biogeochemistry 2018, 141, 419–437. [Google Scholar] [CrossRef]
  64. Lizotte, R.E., Jr.; Yasarer, L.M.W.; Locke, M.A.; Bingner, R.L.; Knight, S.S. Lake nutrient responses to integrated conservation practices in an agricultural watershed. J. Environ. Qual. 2017, 46, 330–338. [Google Scholar] [CrossRef]
  65. Yasarer, L.M.W.; Bingner, R.L.; Garbrecht, J.D.; Locke, M.A.; Lizotte, R., Jr.; Momm, H.G.; Busteed, P.R. Climate change impacts on runoff, sediment, and nutrient loads in an agricultural watershed in the lower Mississippi River Basin. App. Eng. Agric. 2017, 33, 379–392. [Google Scholar] [CrossRef]
  66. Hanrahan, B.R.; Tank, J.L.; Christopher, S.F.; Mahl, U.H.; Trentman, M.T.; Royer, T.V. Winter cover crops reduce nitrate loss in an agricultural watershed in the central U.S. Agric. Ecosyst. Environ. 2018, 265, 513–523. [Google Scholar] [CrossRef]
Figure 1. Experimental vegetated mesocosms during the summer growing season (A), winter stormwater runoff measurements (B), and organic matter breakdown experiment (C).
Water 12 00875 g001
Figure 2. Mean (± SE) N retention (A), denitrification (B), and P retention (C) across three different months from mesocosms representing different P enrichment treatments. Letters represent significant differences between treatments based on least-square mean post-hoc tests (p < 0.05).
Water 12 00875 g002
Figure 3. Mean (± SE) mesocosm nutrient mass for N, P, and C across P enrichment treatments and plant structures (A,C,E). Additionally, mean (± SE) mesocosm aboveground (leaf and stem) N, P, and C mass over time across P enrichment treatments during the decomposition process (B,D,F).
Water 12 00875 g003
Figure 4. Mean (± SE) rainfall (A) and TN (B), TP (C), and TDOC (D) mesocosm export occurring during 15 storms between December and March. Open circles represent individual storm event means and closed circles track the cumulative rainfall and nutrient export over time.
Water 12 00875 g004
Figure 5. Enhancing effectiveness of vegetated ditches through integrated best management practices.
Water 12 00875 g005
Table 1. Effects of P enrichment and month on vegetated mesocosm N retention, estimated denitrification, and P retention. F values and associated P values are based on linear mixed-effect models that incorporated random effects to account for repeated measures within each mesocosm.
FactorFP
Nitrogen retention
P enrichment 3, 160.750.5401
Month 2, 3255.67<0.0001
P enrichment × month 6, 321.400.2439
Estimated denitrification
P enrichment 3, 160.860.4835
Month 2, 325.100.0119
P enrichment × month 6, 320.570.7478
Phosphorus retention
P enrichment 3, 1638.50<0.0001
Month 2, 326.810.0034
P enrichment × month 6, 3210.71<0.0001
Table 2. Effects of P enrichment and plant structure on mesocosm plant tissue N, P, and C mass. F values and associated P values are based on linear mixed-effect models that incorporated random effects to account for nested measures within each mesocosm.
Source of VariationFPLS Means
Nitrogen mass by structure
P enrichment 3, 160.740.5454
Plant structure 2, 32108.24<0.0001Stem < Leaf < Root
P enrichment × plant structure 6, 320.660.6841
Phosphorus mass by structure
P enrichment 3, 160.950.4403
Plant structure 2, 3278.08<0.0001Stem < Leaf < Root
P enrichment × plant structure 6, 320.420.8581
Carbon mass by structure
P enrichment 3, 160.880.4702
Plant structure 2, 3289.54< 0.0001Stem < Leaf < Root
P enrichment × plant structure 6, 320.350.9026
Table 3. Effects of P enrichment and day on plant litter N, P and C mass. F values and associated P values are based on linear mixed-effect models that incorporated random effects to account for repeated measures within each mesocosm.
FactorFP
N mass over time
P enrichment 3, 160.920.4545
Day 4, 1639.36<0.0001
P enrichment × day 12, 1633.160.0004
P mass over time
P enrichment 3, 161.490.2555
Day 4, 16396.20<0.0001
P enrichment × day 12, 1631.110.3560
C mass over time
P enrichment 3, 160.960.4341
Day 4, 163577.65<0.0001
P enrichment × day 12, 1634.02<0.0001
Table 4. Effects of P enrichment and day on vegetated mesocosm TKN, TP and TDOC export during winter storm events. F values and associated P values are based on linear mixed-effect models that incorporated random effects to account for repeated measures within each mesocosm.
FactorFP
Total Kjeldahl nitrogen export
P enrichment 3, 160.130.9420
Day 13, 20862.07<0.0001
P enrichment × day 39, 2081.180.2265
Total phosphorus export
P enrichment 3, 161.030.4048
Day 13, 208104.24<0.0001
P enrichment × day 39, 2080.970.5193
Total dissolved carbon export
P enrichment 3, 160.150.9271
Day 13, 208230.83<0.0001
P enrichment × day 39, 2080.890.6661
Table 5. Mean (± SE) mass balance estimates (mg m−2) for net N and P retention in vegetated mesocosms across P enrichment treatments. Letters represent significant differences between treatments based on least square mean post-hoc tests (P < 0.05).
P TreatRetentionDenitrificationExportNet Retention
Nitrogen
Control1575.2 ± 107.1619.9 ± 50.7120.5 ± 26.61454.8 ± 95.5
Low 1468.9 ± 80.1563.5 ± 78.4134.0 ± 17.81334.9 ± 81.4
Moderate1412.0 ± 84.5608.9 ± 52.5136.6 ± 13.01275.4 ± 95.7
High1553.8 ± 92.0578.8 ± 50.6163.6 ± 35.91390.2±104.4
Phosphorus
Control55.6 ± 4.0aNA41.3 ± 3.614.3 ± 4.3a
Low 181.0 ± 26.9bNA35.6 ± 4.7145.4 ± 26.8b
Moderate221.9 ± 8.9cNA38.5 ± 3.4183.4 ± 10.8c
High404.9 ± 39.3dNA42.7 ± 7.4362.2 ± 42.2d

