Article

Permeability and Groundwater Enrichment Characteristics of the Loess-Paleosol Sequence in the Southern Chinese Loess Plateau

1
College of Geography Science and Tourism, Shaanxi Normal University, Xi’ an 710062, China
2
SNNU-JSU Joint Research Center for Nanoenvironment Science and Health, Shaanxi Normal University, Xi’an 710062, China
3
State Key Laboratory of Loess and Quaternary Geology, Earth Environment Institute, Chinese Academy of Science, Xi’an, 710075, China
4
Research Center for Scientific Development in Fenhe River Basin, Taiyuan Normal University, Taiyuan 030001, China
5
Shaanxi Key Laboratory of Disaster Monitoring and Mechanism Modeling, Baoji University of Arts and Sciences, Baoji 721013, China
*
Authors to whom correspondence should be addressed.
Water 2020, 12(3), 870; https://doi.org/10.3390/w12030870
Submission received: 28 January 2020 / Revised: 8 March 2020 / Accepted: 16 March 2020 / Published: 20 March 2020
(This article belongs to the Section Hydrology)

Abstract

:
To determine the permeability characteristics and the groundwater enrichment conditions of loess and paleosol layers, this article systematically investigated the permeability, magnetic susceptibility, porosity, and carbonate mass percentage of representative loess-paleosol layers (L1 to S5) on the Bailu tableland in the Chinese Loess Plateau south. The result of in situ permeability measurements showed that the average time to reach quasi-steady infiltration of loess layers is shorter than that of paleosol layers. In addition, loess layers have higher porosity and better water storage spaces than paleosol layers and were prone to form aquifers. Paleosol layers, on the contrary, are more likely to form aquitards. The difference between loess and paleosol in permeability, porosity and groundwater enrichment conditions is largely attributed to lower intensity pedogenesis of loess, which is in turn ascribed to the colder and drier palaeoclimatic conditions. It is worth mentioning that the CaCO3 concretion layer is a good aquifuge for its compact structure. Generally, the empirical formula of the Koctakob formula is applicable for describing the permeability rule of loess and paleosol layers, and the parameters of the empirical formulas can provide an important reference for hydrological and agricultural departments. In this regard, the Quaternary climatic change theory can contribute to the hydrogeology of the Chinese Loess Plateau, and the regional climatostratigraphy can be regarded as a baseline for local water resource positioning and revegetation in such a semi-arid area, which broadens the application field of Quaternary climatic change theory. Meanwhile, it also provides a reference path for solving water shortages of other loess distribution areas in China and other countries.

1. Introduction

Since the 1980s, numerous important achievements have been established through research on the source of loess holard and groundwater, the characteristic of water permeability, and migration [1,2,3]. Now we understand that atmospheric precipitation is the main source of loess groundwater, with the occurrence type being hole-fissure water and pore water [4]. This research determined water sources, migration and occurrence space in the loess aeration zone to some extent, but there have been few studies on the specific layer and laws of multilayer loess groundwater gathering in the vadose zone, the types of aquifers and aquitards, the relation between loess water storage spaces and palaeoclimate change.
In the past, researchers studied loess and its groundwater, regarding loess as sediments [5], but they did not realize that loess is a kind of soil, which has great significance for uncovering the migration characteristic, gathering laws, and occurrence types of loess holard and groundwater. The loess has undergone the effect of pedogenesis after the Aeolian deposits. It has the characteristics of soil, such as being porous and fertile, and can grow vegetation, etc. On this issue, Hu [6] and Bloemendal [7] also hold similar views.
Though not a few studies have been carried out on soil permeability and loess characteristics, most of them placed particular emphasis on topsoil permeability [8,9,10], pore network characterization and vertical joint of loess stratigraphy [11,12,13], loess erosion process and model simulation [14,15,16], loess geological hazard [17,18,19], or information on how loess reflects the climate [20,21,22,23,24], rather than laws of groundwater permeability and migration in the loess profile. In particular, the vertical variation of permeability within the loess–paleosol sequence, which impacts groundwater accumulation and determines the existence of aquifers/aquitards, has not been systematically investigated.
Li et al. [25] creative proposed to bulldoze mountains to build cities in the hilly loess plateau region. It can effectively solve the development plight of serious land shortage in hilly urban areas. In the process, inevitably there are a lot of environmental, ecological, and economic risks. Groundwater resource risk is an important aspect of them. For example, most large-scale cities have the pollution risk of soil and groundwater caused by the landfill of household garbage. Whereas, the permeability of loess and paleosols plays an important role in avoiding or reducing the pollution risk in northwest China, where loess is widely distributed [26]. Researching the permeability characteristics and groundwater enrichment conditions of loess layers are absolutely necessary because it can be used to provide theoretical and technical support for the smooth implementation of a practical project, to avoid the happening of geological environment and the ecological environment problems.
Based on a series of experiments on the permeability, porosity, magnetic susceptibility, and carbonate mass percentage of the representative loess–paleosol sequence, this research has provided scientific evidence for exploiting and using loess groundwater through discussions on the issues of gathering conditions, laws, and controlling factors of loess moisture as well as groundwater. The results from these experiments illustrate the palaeoclimatic change that controls the existence of the loess–paleosol sequence and determines its texture and structures, which, in turn, affect the accumulation of modern loess moisture. In this regard, palaeoclimatic change theory can be applied to the issues and growing tension on water resource shortages, against the backdrop of the Chinese Loess Plateau area’s climatic warming and drying [27,28], which opens up a new field for the application of climatic change theory.
In this paper, by systematically investigating the permeability, magnetic susceptibility, porosity, and carbonate mass percentage of representative loess–paleosol layers (L1 to S5) on the Bailu tableland in the Chinese Loess Plateau south, we determine the permeability characteristics and groundwater enrichment conditions of loess and paleosol layers and provide theoretical and technical support for solving the scientific and reasonable development and utilization of groundwater resources in Chinese Loess Plateau. We also provide a reference path for groundwater resource development and utilization of other loess distribution areas in China and other loess distribution areas of the world such as Russia, the United States, Germany, France, Hungary, Romania, New Zealand, and Argentina.

2. Location and Methodology
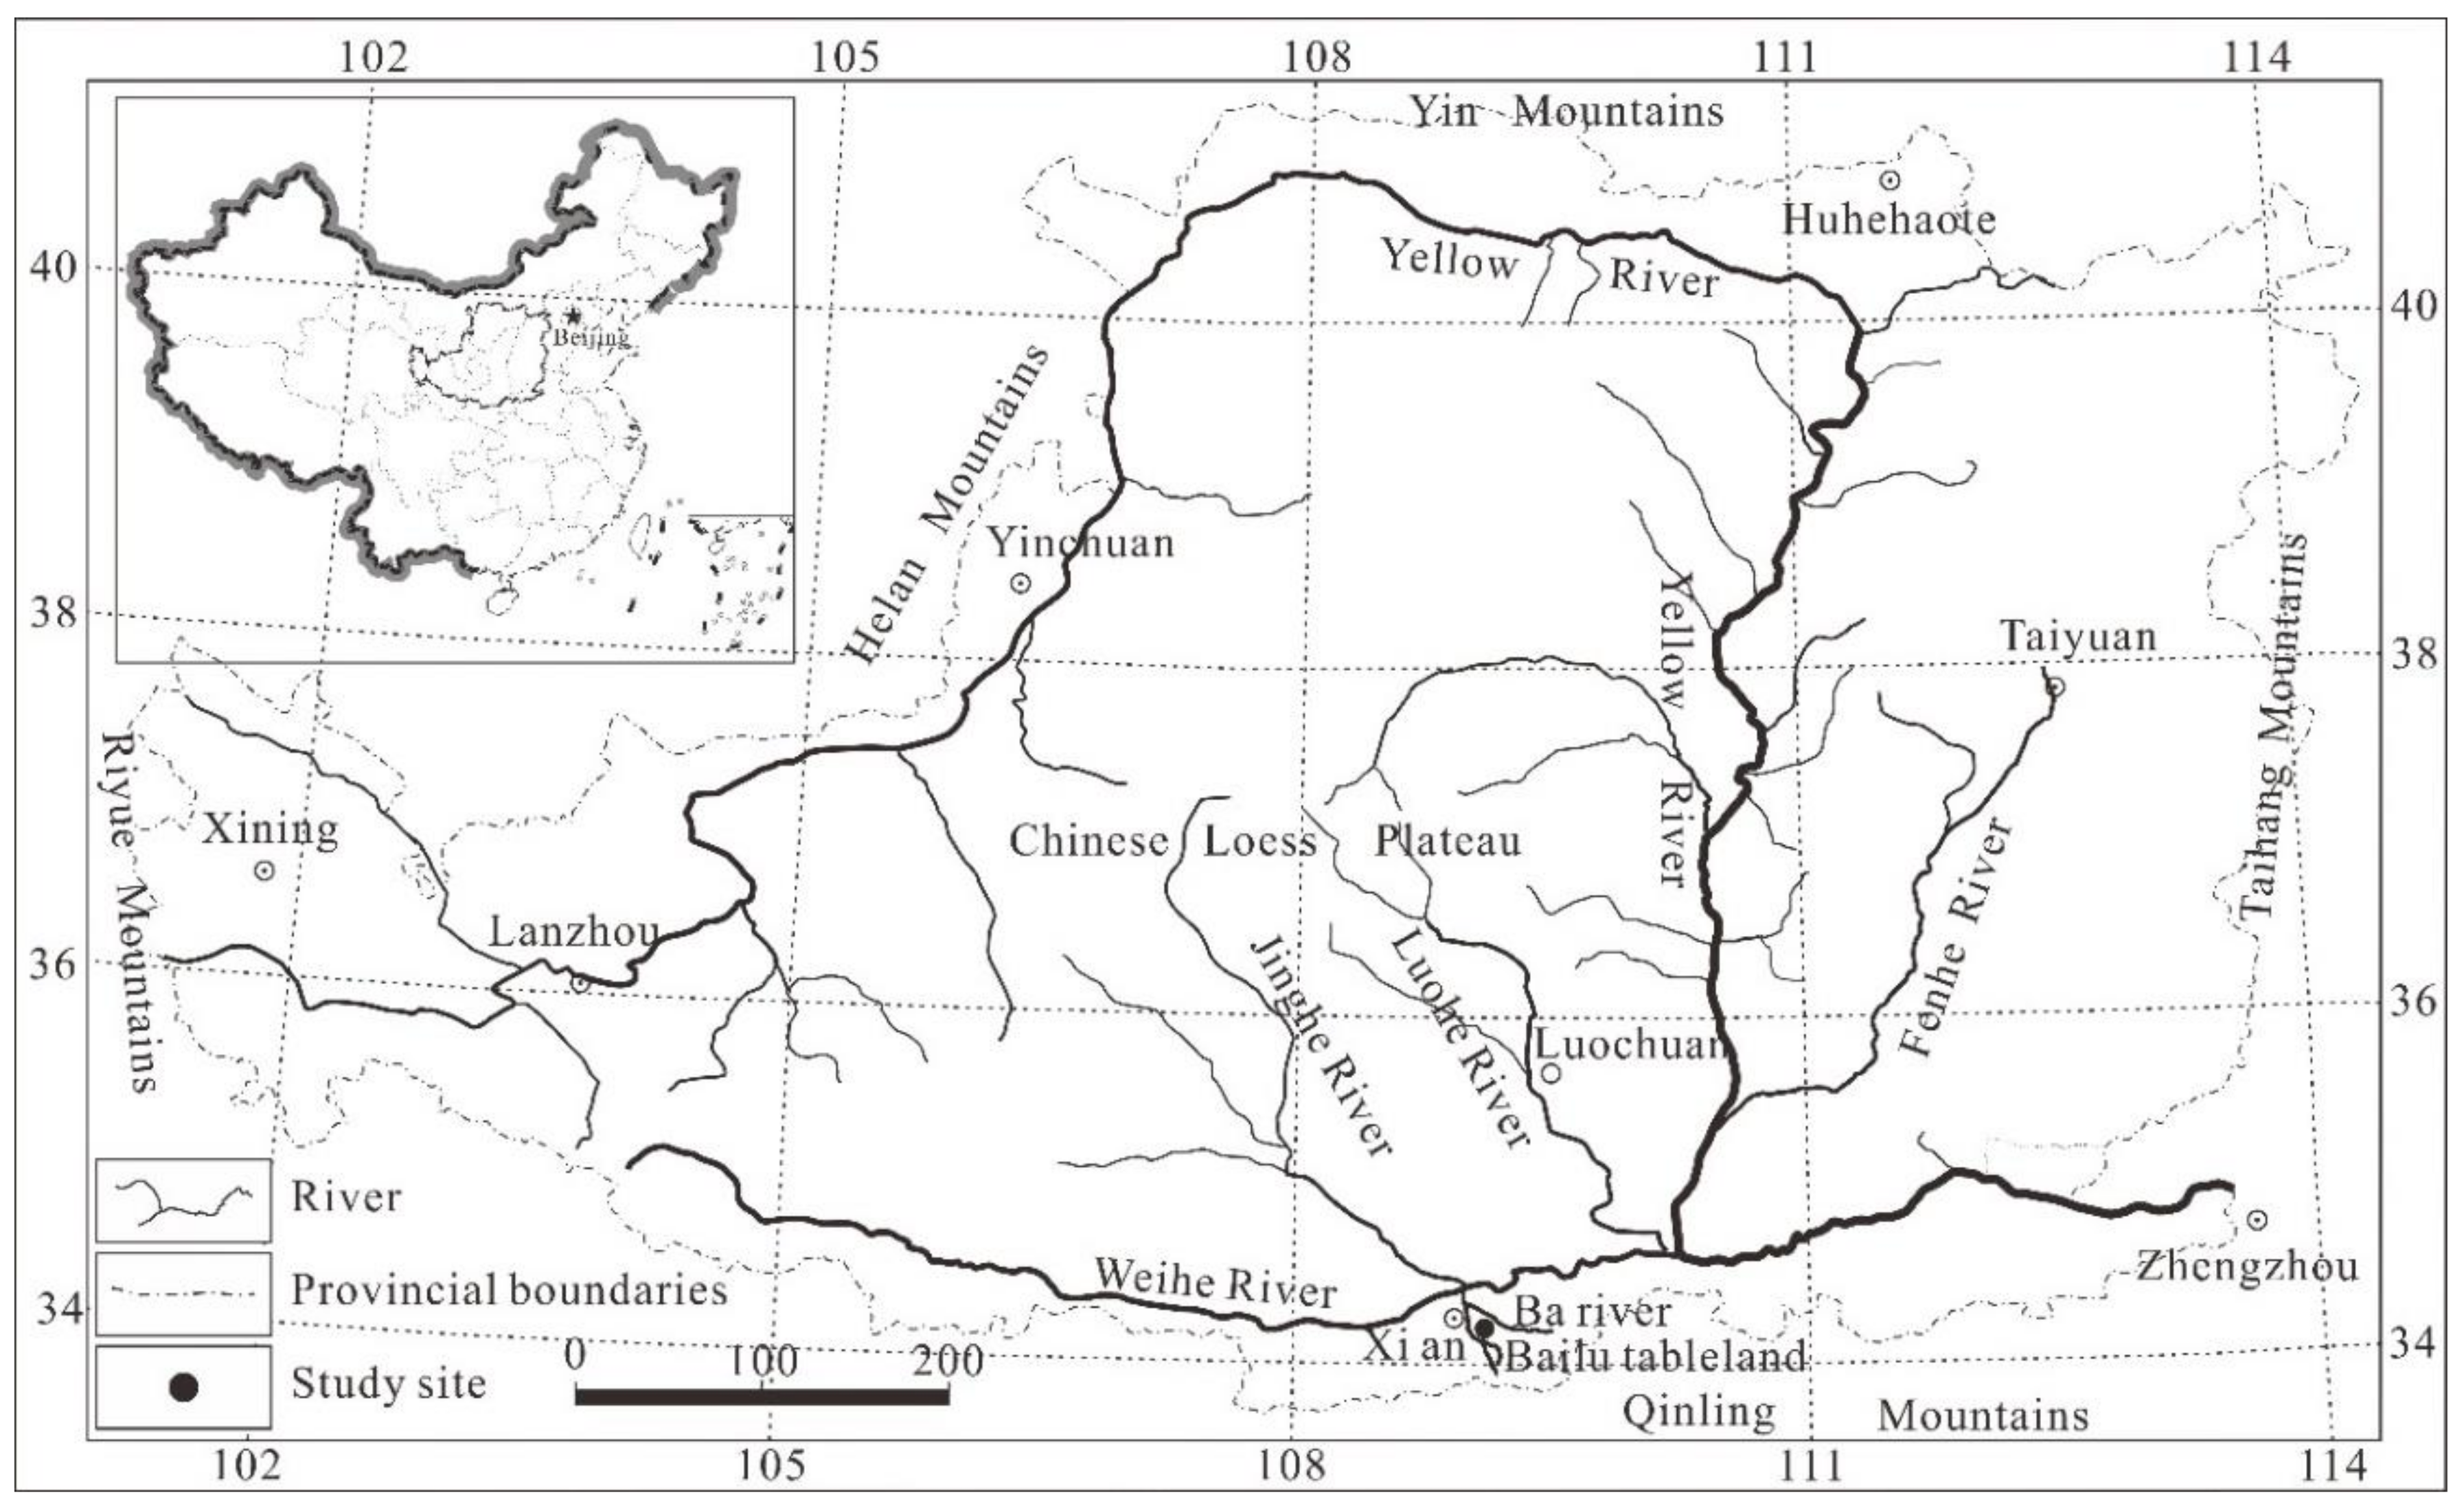
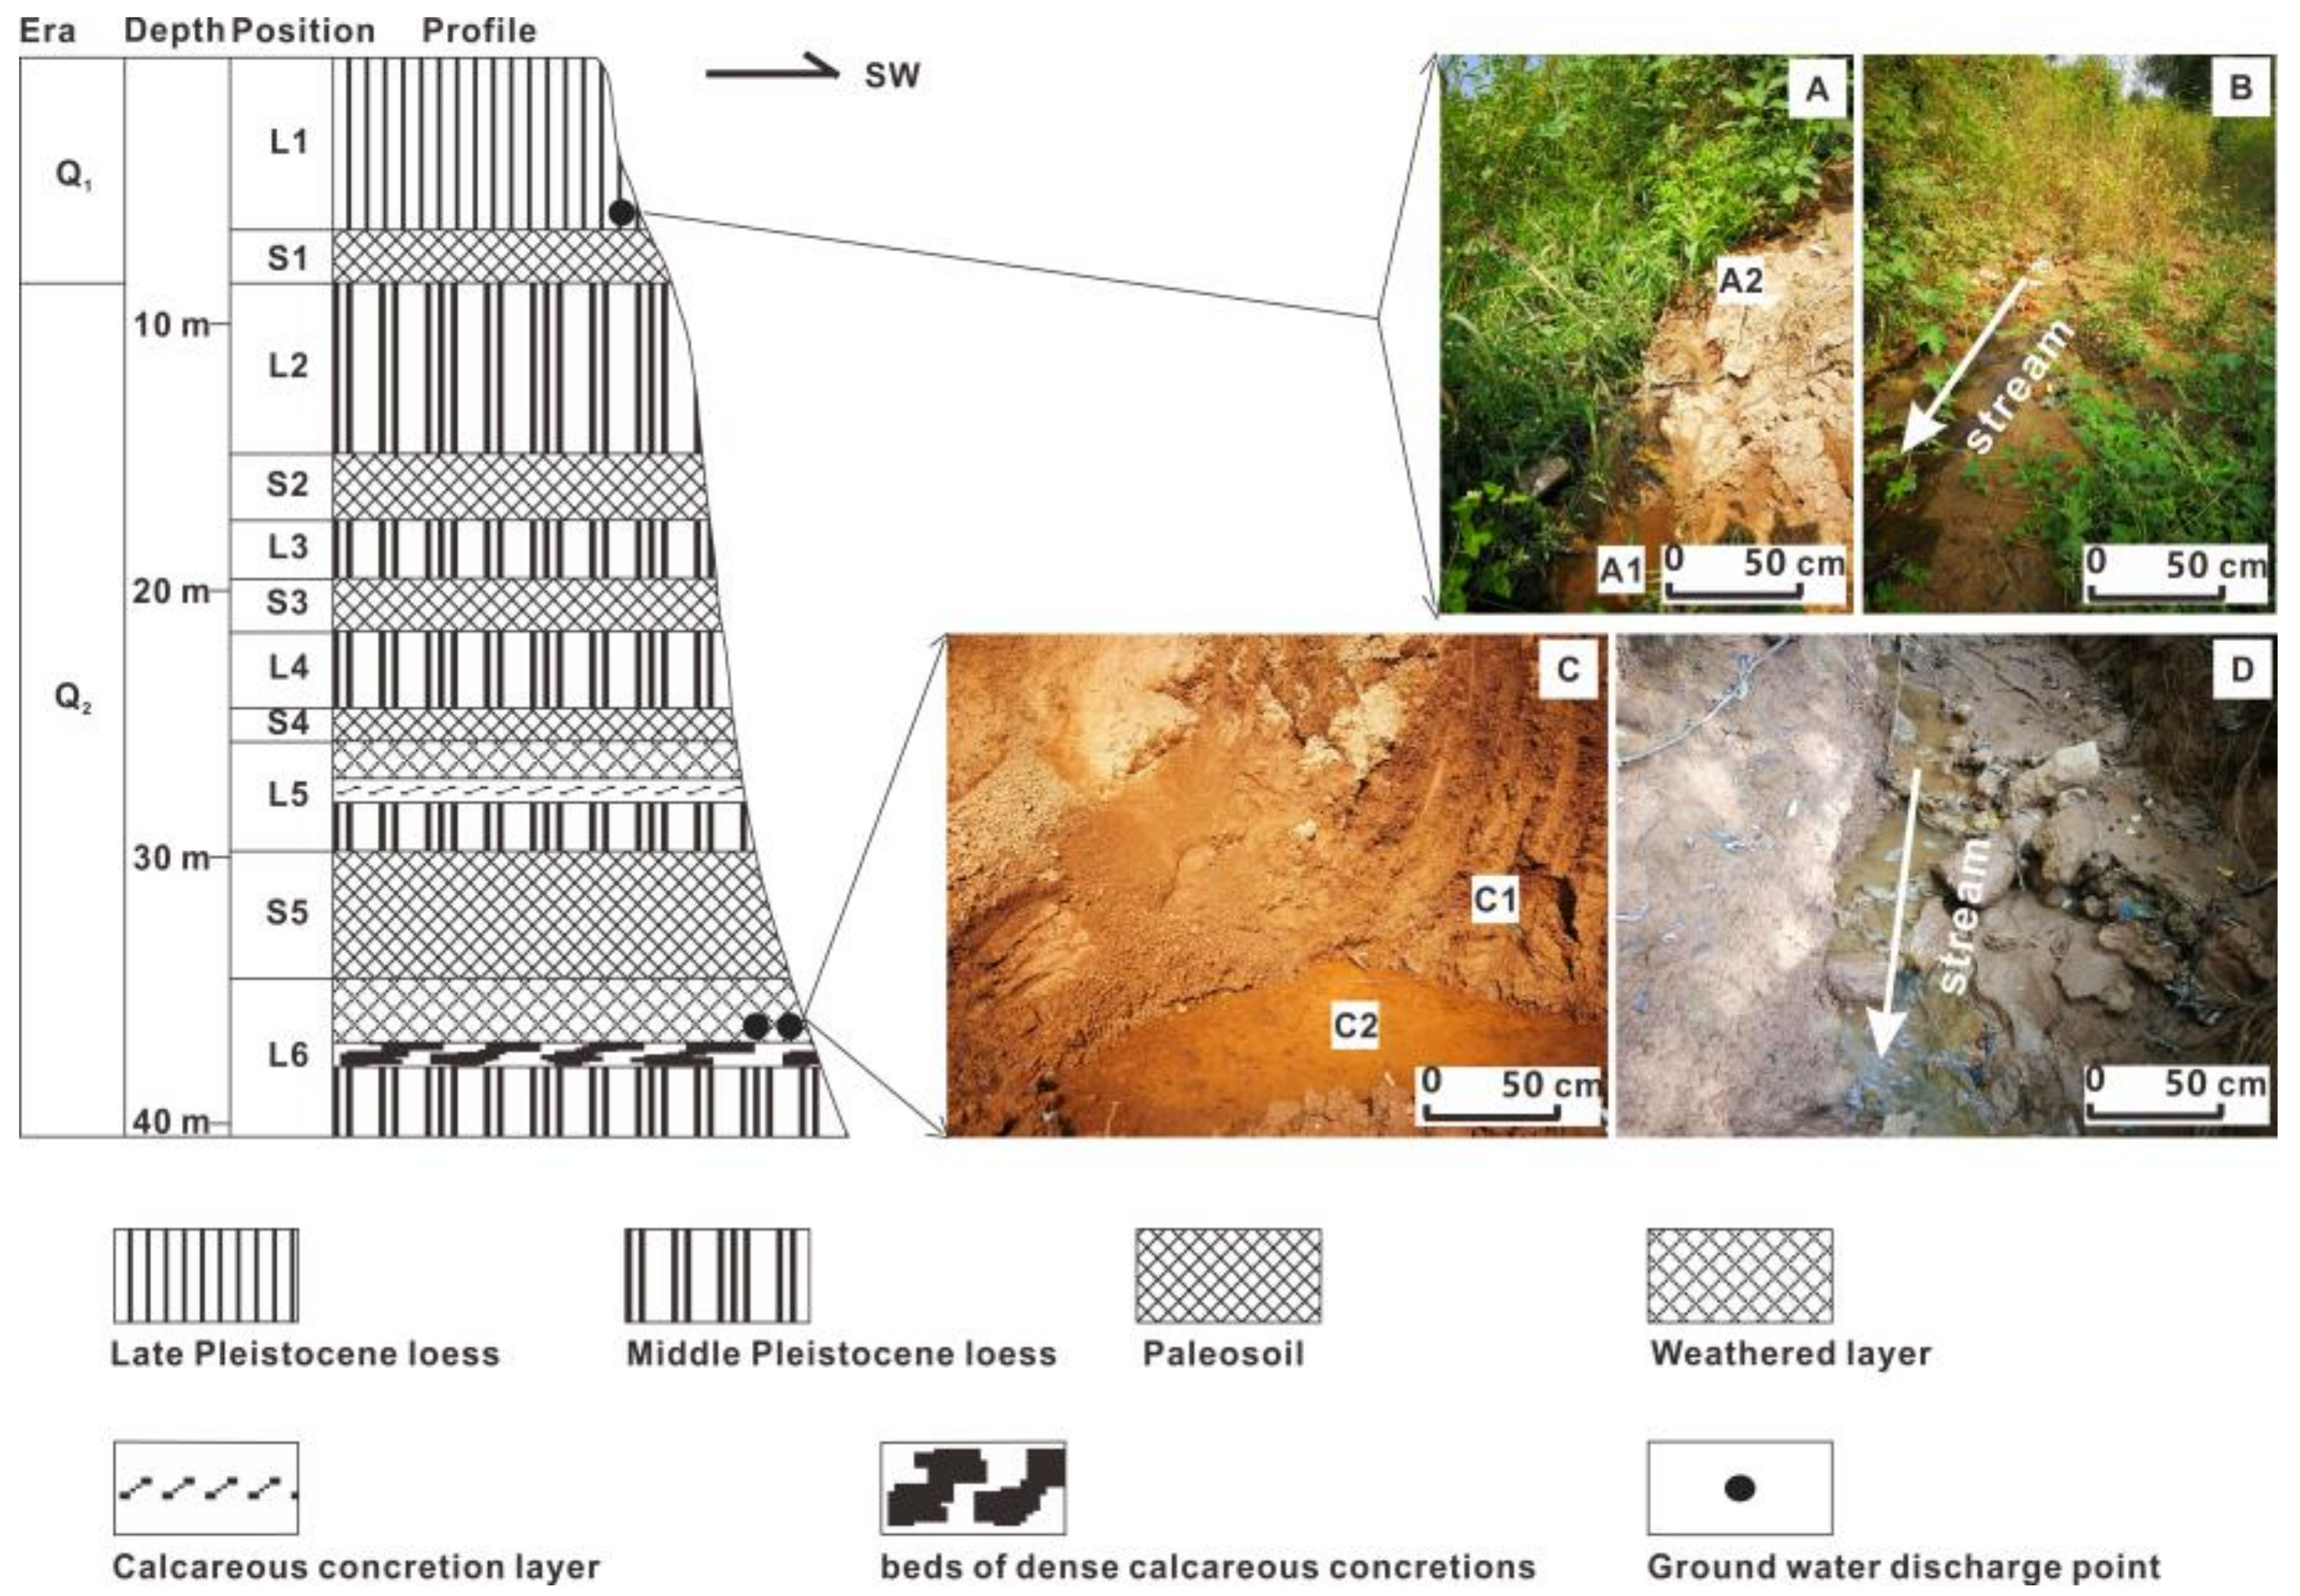
2.1. Study Site

The Bailu tableland, situated in the eastern suburbs of Xi’an, was chosen as a case study site for carrying out the present research, with the Ba River in the northeast, and the Chan River in the southwest. Its altitude varies from 610 m to 803.9 m. The height difference between the northern tableland and Ba River is 260 m to 350 m, while between the southern tableland and the Chan River is 150 m to 200 m. As the greatest loess tableland around Xi’an, the Bailu tableland is about 28 km long and 6 to 10 km wide with an area of 263 km2, located in the southern margin of the Chinese Loess Plateau, neighboring the Qinling Mountains (Figure 1). The Bailu tableland features a warm, temperate, semi-humid, continental monsoon climate, with an annual mean temperature of 13.1 °C and annual precipitation of approximately 600 mm. More than 70% of the precipitation occurs between June and September in the form of rainfall brought by summer monsoons (Shaanxi Province Statistical Yearbook, 1984–2014).
The emergence of strata in this area is mainly lacustrine facies and fluvial facies deposits of the Tertiary period and Quaternary loess deposits. In the research section position, multilayer thick loess and paleosol expose on the surface. The loess is a kind of porous and yellow-grey soil, formed by Aeolian accumulation under the condition of relative old-dry climate. The paleosol is a kind of dark red soil, formed by Aeolian accumulation under the condition of relative warm-wet climate. Compared with loess, paleosol has experienced more intense precipitation eluviation and pedogenesis process. The soil mechanical composition shows its clay content is much higher than that of the loess [29], and the soil structure is more compact and tight. The water-gathering strata in the Bailu Tableland include Wucheng loess (Q1, reddish-yellow, formed in the early Pleistocene) and Lishi loess (Q2, light reddish-yellow and formed in the late middle Pleistocene), with hole-fissure phreatic water [30]. This region is mainly recharged by atmospheric precipitation, and in addition, the Bailu tableland boasts of flat, open surface, which benefits rainfall infiltration.

2.2. Method of In Situ Permeability Measurements

The in situ permeability measurements and sampling sites were set on a loess-paleosol section exposed by the Ba River, which cuts through the loess tableland into tertiary period red clay and the shell structure of tufa. The loess-paleosol stratigraphy of the Bailu tableland emerges clearly and has representation in the southern Loess Plateau. A stratigraphic description of this sequence was found in Liu [31] and Zhao [32]. The 10 uppermost layers (Table 1) of the sequence, which were formed from about 0.01 to 0.5 Ma B.P. [9,31], and can be identified in situ according to apparent differences (in color, structure, and texture) between loess and paleosol units (Table 1), were chosen for permeability measurements and sampling in the present study. For controlling test and reducing errors, four to six sites were selected on each loess/paleosol layer, and three sets of data that showed similar results would be collected for the final result. All the experimental sites were on shade slopes or the sunless side of a hill for the purpose of avoiding different evaporation conditions. A double-cylinder permeameter based on Bouwer [33] and Wang et al. [34] was adopted in carrying out infiltration experiments; the volume of water added to the permeameter and corresponding time intervals were recorded until three identical values occurred consecutively. The operations were as follows: (1) dig a one-meter-across suborbicular flat face on the surface of selected sites; (2) put a double-cylinder permeameter on the flat face of each loess/paleosol layers to be tested; (3) bury the bottom of double-cylinder permeameter deep into soil of 5 cm; finally, (4) place a layer of fine gravel on the soil surface within the cylinders in an attempt to avoid soil structures being disturbed. The function of the outer, larger cylinder in the double-cylinder system is to practically turn a 3-D single-ringed system into a one-dimensional model by allowing water into the inner, smaller cylinder to flow nearly exclusively straight down [33,34]. After installing the double-cylinder permeameter, we poured water into it until the water level reached 5 cm, and kept the water level constant at 5 cm throughout the infiltration process to keep constant water head/pressure. For thick loess/paleosol layers, experimental sites were conducted in the middle part, while for comparatively thin soil layers, sites were on the top to ensure that the infiltration process mostly occurred in these layers. To be able to provide references to hydrological and agricultural sectors in evaluating soil characteristics, Koctakob formula, Horton formula and general empirical formulas three representative empirical formulas [35,36] were used for fitting the permeability of loess/paleosol layers. Their equations, respectively, are f(t) = at−b, f(t) = fc + (f0 − fc)e−kt, f(t) = a1 + b1t−n.
In the above formula, f(t), f0, fc, and t are respectively represented infiltration rate, initial infiltration rate, quasi-steady infiltration rate and infiltration time; a, b, k, a1, b1, n are experience parameters.

2.3. Sample Collection and Laboratory Analysis

Samples of porosity, carbonate mass percentage and magnetic susceptibility were also collected for subsequent lab analysis. In each layer (L1-S5), four to six samples were collected by ring kit for porosity, and another 300 samples were collected for measuring carbonate mass percentage and magnetic susceptibility, in 10 cm intervals. The carbonate mass percentage was determined by measuring the volume of CO2 produced by each sample’s chemical reaction with 10% hydrochloric acid (Ministry of Agriculture of China, 1993). A Magnetic Susceptibility Meter (England Bartington MS2B) was used to obtain information on both high and low-frequency susceptibility [38,39]. Soil porosity can be obtained through the following method [40]. Its computation formula is as follows:
Pt% = (1 − D/d) × 100
In this equation, Pt, D, and d respectively on behalf of soil porosity, soil bulk density, and soil specific gravity. All of the lab analyses were conducted at Shaanxi Normal University.
The data were analyzed using SPSS 22.0, Origin 7.5, ArcGIS 10.1, and Microsoft Office Excel 2007.

3. Results

3.1. The Results of In Situ Permeability Experiments

The infiltration rates were calculated based on the data of the volume of water infiltrating into the soil and the corresponding time period. The results of in situ permeability measurements on the layers of L1-S5, including CaCO3 concretion layer (S4′) in the Bailu tableland, are presented in Figure 2. On basis of the results of experimental data, the infiltration rates were high during the first 10 min, and then slow afterward, and then it achieved quasi-steady infiltration after 140 to 160 min (Figure 2).
The average infiltration rate of L1 before quasi-steady status was 1.93 mm/min, while its quasi-steady infiltration rate was 1.27 mm/min (Figure 2a). The S1 infiltration rate was largest in all paleosols layers (Figure 2), and its quasi-steady infiltration rate and mean infiltration rate before quasi-steady status reached 2.24 mm/min and 1.49 mm/min, respectively (Figure 2b). The mean infiltration rate of L2 before quasi-steady status was 4.12 mm/min, whereas its quasi-steady infiltration rate was 2.33 mm/min (Figure 2a), both of which were largest in all loess/paleosol layers. The mean infiltration rate of S2 before quasi-steady infiltration was 1.14 mm/min, whereas its quasi-steady infiltration rate was 0.79 mm/min (Figure 2b). L3 had the smallest average infiltration rate and quasi-steady infiltration rate among loess layers (Figure 2), of 0.76 and 0.50 mm/min, respectively (Figure 2a). The mean infiltration rate of S3 before stabilization was 1.63 mm/min, whereas its quasi-steady infiltration rate was 1.34 mm/min (Figure 2b). The mean infiltration rate of L4 before quasi-steady status was 2.81 mm/min, while its quasi-steady infiltration rate was 1.52 mm/min (Figure 2a). Before reaching quasi-steady status, S4 had an average infiltration rate of 0.76 mm/min, while its quasi-steady infiltration rate was 0.50 mm/min (Figure 2b), both of which were similar to, but much smaller than, those of S1, S2, S3. The mean infiltration rate of L5 before quasi-steady status was 2.43 mm/min, while its quasi-steady infiltration rate was 1.84 mm/min (Figure 2a). S5 had the smallest quasi-steady infiltration rate and mean infiltration rate among the paleosol layers (Figure 2), respectively, of only 0.42 mm/min and 0.21 mm/min (Figure 2b). Most noteworthy is the CaCO3 concretion layer, whose quasi-steady infiltration (0.19 mm/min) was smaller than those of all the soil layers (Figure 2), and which is a very good aquifuge for its compact structure.

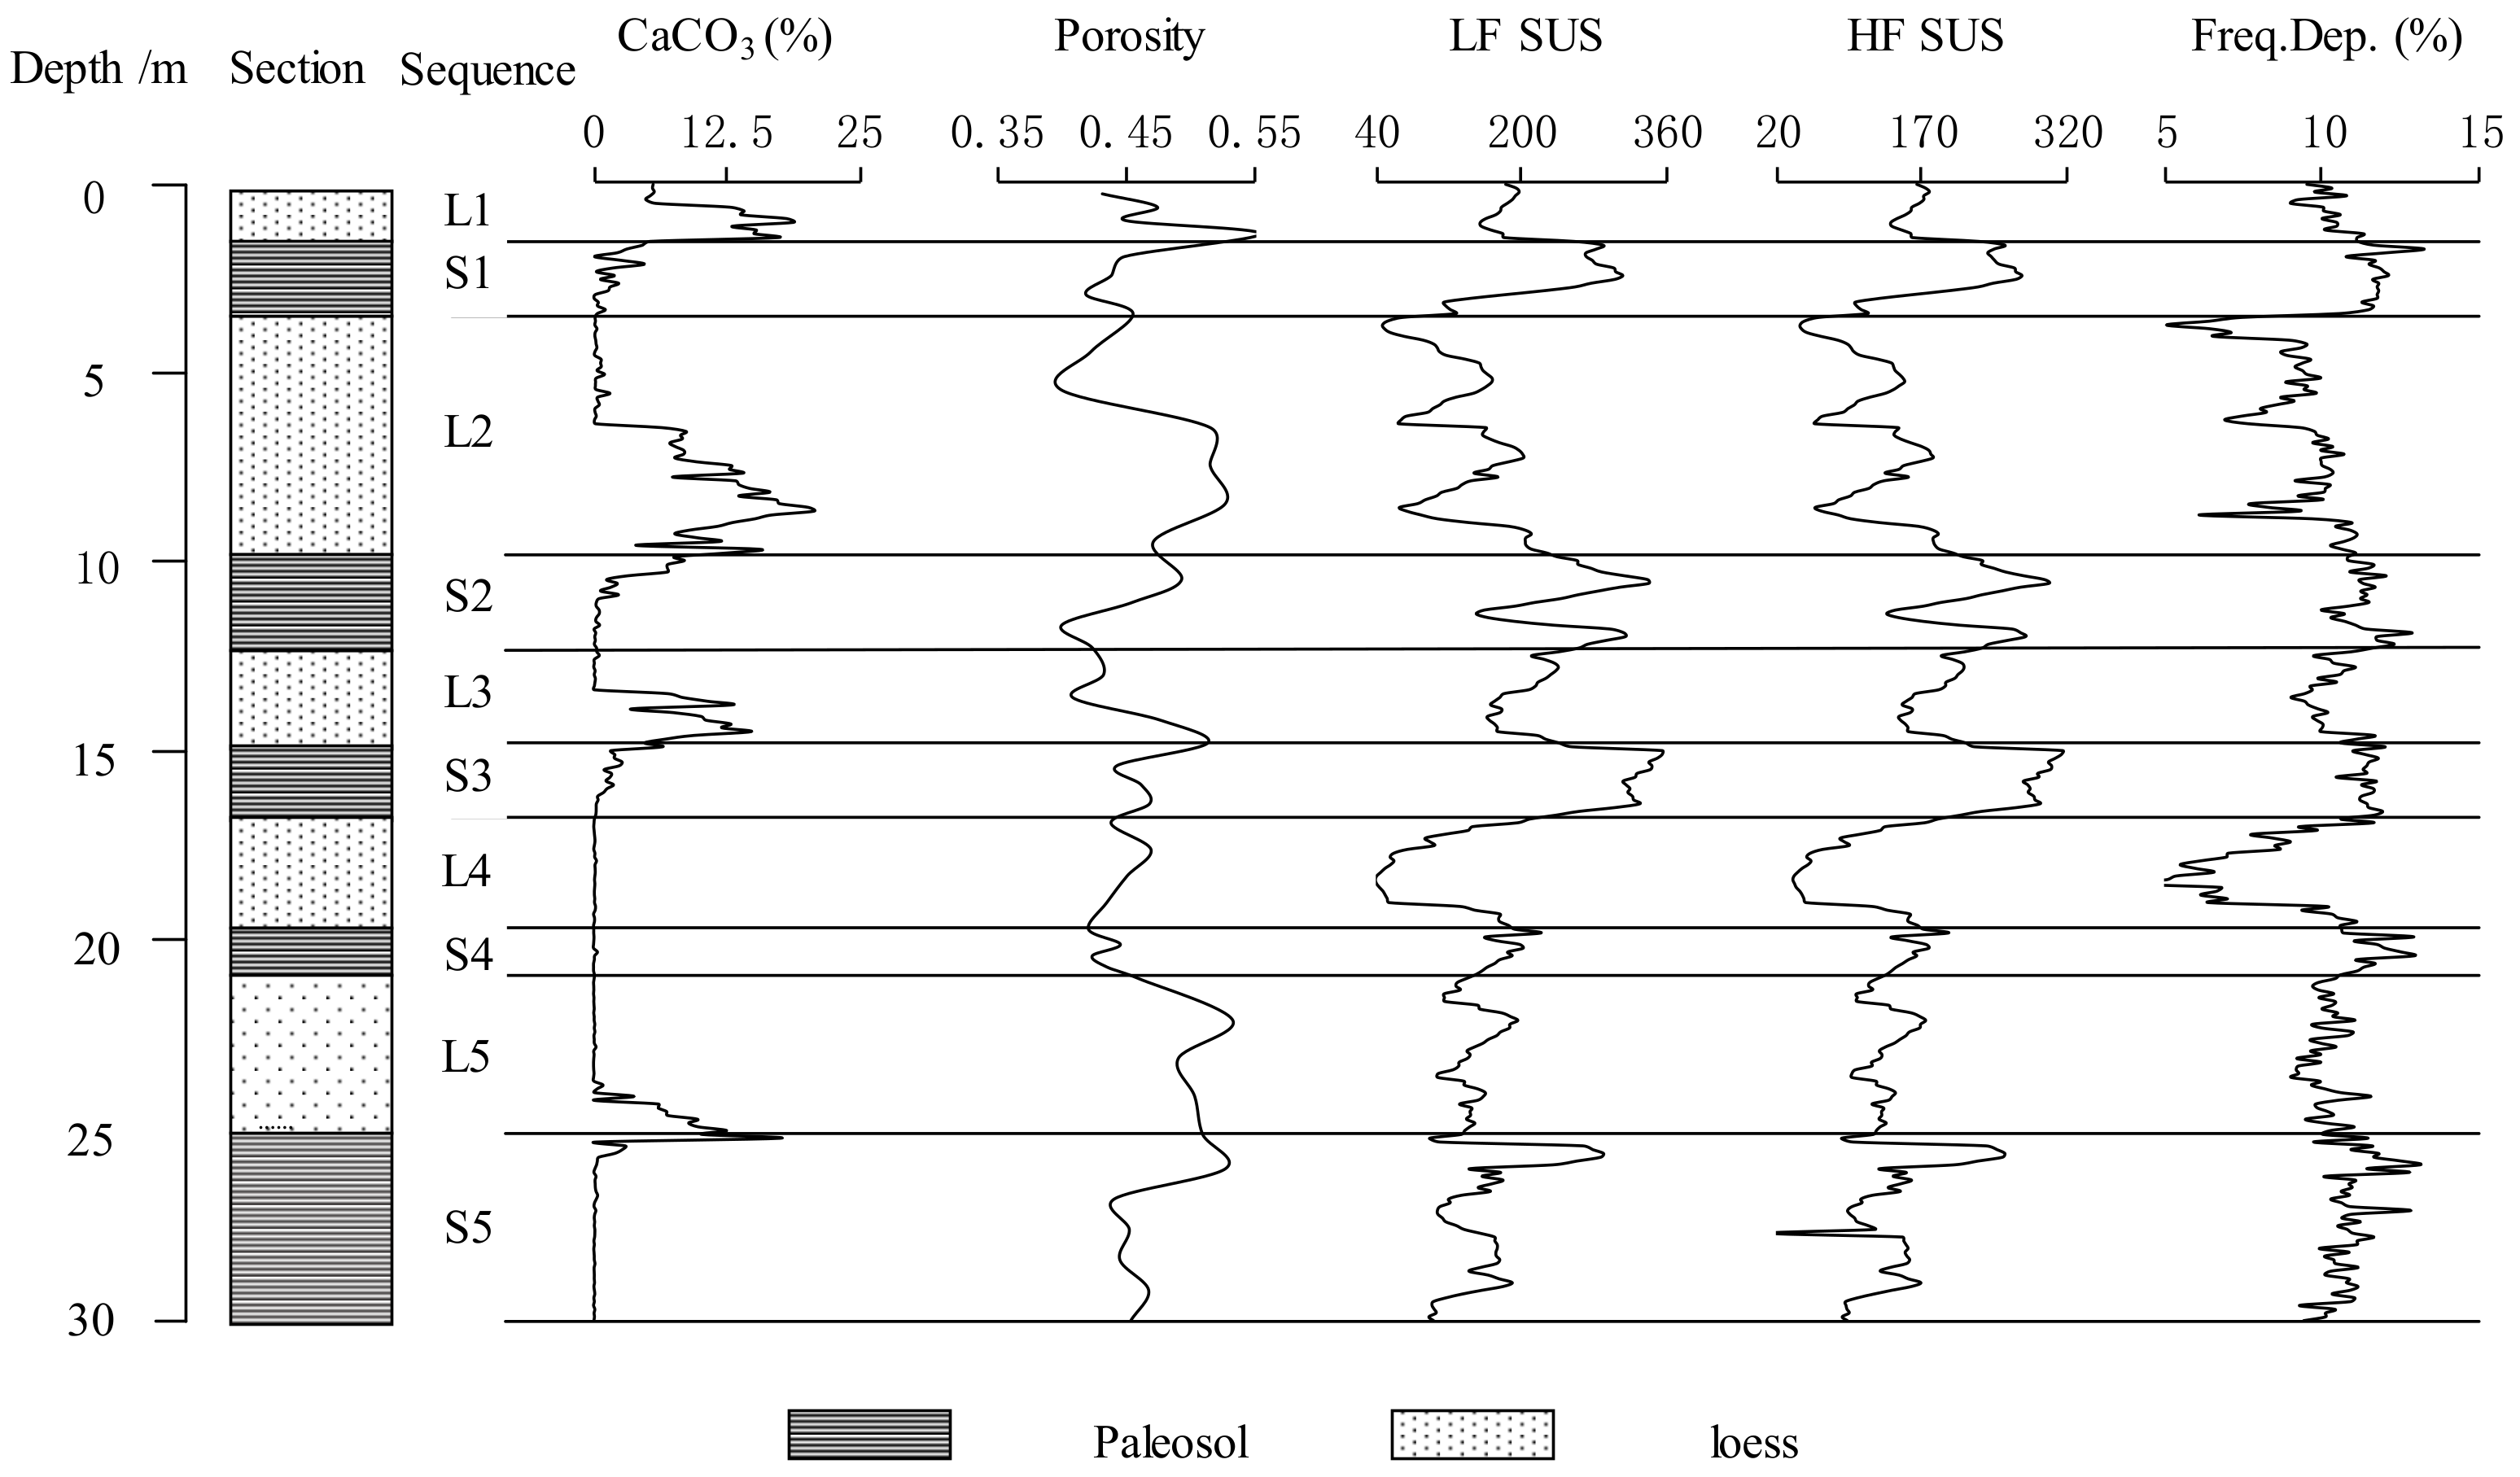
3.2. Results Analysis of Porosity, CaCO3 Content, and Magnetic Susceptibility

Porosity is a significant indicator that describes soil/sediment water storage capacity, as well as the prerequisite for the enrichment of loess groundwater; whether it is large or small depends on the pores, fissures, and holes in loess. The groundwater enrichment layer is formed when there is sufficient storage capacity, groundwater recharge, and aquifuges in the soil layer [32]. As we all know, the soil distribution of loess plateau shows loess and paleosol layering distributions alternately. When the climate is dry and little rain, the soil moisture mainly exists in the paleosol layers with fine particles, dense texture, and low porosity. Vice versa, when the climate is relatively humid, the soil moisture mainly exists in the loess layers with coarse particles, loose texture, and high porosity relatively. For this manuscript, its research region is located in the southeast of loess plateau. The multi-year average precipitation of this region is between 550–880 mm, and the soil moisture mainly exists in the loess layers. So, in this region, the paleosol layers with fine particle, dense texture, and low porosity usually form aquitards, and the loess layers become aquifers for its coarse particle, loose texture, and high porosity, relatively. Therefore, soil porosity is a significant indicator that describes soil/sediment water potential storage capacity. It stands to reason that the groundwater enrichment layer will form in the Chinese southeast Loess Plateau, where there is sufficient storage capacity, groundwater recharge, and aquifuges.
The average porosity of the entire section (10 soil layers) was 46.21% which varied from 44.19% to 50.99% for disparate loess and paleosol layers (Figure 3). The average porosity of the five loess layers was 47.37%, and of five paleosol layers was 45.06%, and the discrepancy between them was about 2.31% (Figure 3). The porosity’s differences were obvious among the different strata (Figure 3), such as L5 and S4, where there was a discrepancy of 6.80% (Figure 3, Table 2). The porosity results indicated that water storage capacity in loess layers was larger than that of paleosol layers.
The CaCO3 content average of the entire section (300 samples collected from L1 to S5) was 3.17%, while the values varied dramatically from zero to 20.72% (Figure 3, Table 2). The average of CaCO3 content of the loess layers was 5.22%, which is greater than that of the paleosol layers (only 1.00%) (Figure 3, Table 2). The change of CaCO3 content is a significant indicator of the climatic environment evolvement [41]. As mentioned below, CaCO3 content can provide important information on the causes of loess and paleosol water properties. Both the loess and the paleosol on the Chinese loess plateau have the same material source. The CaCO3 content difference between them is caused by different soil pedogenesis and eluviation. In the geological period, the climate varies alternately. During warm humid climates, soil pedogenesis and eluviation are intense, and the soil soluble calcium ions migrate downward along with soil water moisture. Due to the increase of migration depth and reduction of soil water content, the soluble calcium ions usually deposit in the form of calcium carbonate in the immediately following paleosol layers. Therefore, paleosol’s CaCO3 content is generally higher than that of loess. So the CaCO3 content can be regarded as a significant indicator of climatic environment evolvement. Meanwhile, CaCO3 content can provide important information on the causes of loess and paleosol water physical properties. The main reason is as follows: in warm humid climate periods, intense soil pedogenesis and eluviation not only leads to soil soluble calcium ions to migrate downwards but also causes the paleosol’s texture structure to become denser, have finer particles and lower porosity. Therefore, the paleosol layers are more prone to form aquifuges.
Magnetic susceptibility fluctuates along the sequence (Figure 3). However, both low-frequency and high-frequency susceptibility of the loess show a general tendency to be lower than that of the paleosol layers (Figure 3). The frequency percentage magnetic susceptibility of loess layers that has similar trends varies from 3.69% to 12.05%, whereas that of the paleosol layers ranges from 9.31% to 13.29%. The magnetic susceptibility is a factor sensitive to climatic environmental change [31,42,43,44,45], which proves why the hydrogeological nature of loess is distinguished from that of paleosol. The soil magnetic susceptibility is closely related to magnetite and hematite, especially their tiny particles with stronger magnetic forces [46,47,48,49]. In warm climatic conditions, the surface of the magnetite is strongly oxidized and forms many stronger magnetic and smaller particles of hematite. The soil magnetic susceptibility is a sensitive factor to climatic environmental change. As mentioned, the texture structure, particle composition, porosity characteristic, and water physical properties of loess and paleosol are dominated by the climatic environment evolvement, therefore soil magnetic susceptibility is also an important influencing factor to the hydrogeological nature of loess and paleosol.

4. Discussions

4.1. Permeability Differences Between Loess and Paleosol

According to the permeability experimental data, the average infiltration rate and quasi-steady infiltration rate between loess and paleosol have an obvious difference: the infiltration rate of loess is higher than that of paleosol (Figure 2 and Figure 4), although they have similar trends (Figure 2). In general, the permeability for both kinds of layers is higher at the beginning and then decreases gradually until a quasi-steady status is reached (Figure 2 and Figure 4). The quasi-steady infiltration rate was generally higher, the values of L1, L2, L3, L4, and L5 were 1.27 mm/min, 2.33 mm/min, 0.50 mm/min, 1.52 mm/min, 1.84 mm/min, respectively, with a mean value of 1.49 mm/min; whereas the values of S1, S2, S3, S4, and S5 were 1.49 mm/min, 0.79 mm/min, 1.34 mm/min, 0.71 mm/min, and 0.21 mm/min, respectively (i.e., the average permeability of paleosol is 0.91 mm/min) (Figure 2 and Figure 4). Therefore, it is clear that the average of quasi-steady infiltration rate in loess is generally higher than that of paleosol. The difference value was 0.58 mm/min. Porosity differences between loess and paleosol layers (Figure 3) are suggested to be the main factor that causes this difference; this will be further discussed in Section 4.3.
The time intervals for paleosol to achieve quasi-steady infiltration varied from 120 to 160 min, whereas that of loess ranged from 80 to 140 min (Figure 2). Along these lines, there are evident time differences, i.e., it took more time for paleosol to achieve quasi-steady status than loess. This resulted from the differences in structure between loess and paleosol (Table 1). Because of intensive eluviation during the formation period, the paleosol structure was less homogeneous than that of loess, mainly in the well-developed prismatic structure and greater spatial variation [50]. Based on in situ observation at the Bailu tableland, the paleosol prismatic structure can reach 2–20 cm long, while their transaction diameter as long as 1–2 cm; vertical microcracks were found between prisms. By contrast, loess in this region had much more of a granular or crumb structure rather than vertical micro cracks. It turns out that the inhomogeneous structure of the paleosol layer required more time to reach quasi-steady status as the infiltration rate was slow at times and fast at other times (Figure 2).

4.2. The Empirical Formulas Fitting of Infiltration Experiment Results

Three representative empirical formulas—Koctakob formula, Horton formula, and general empirical formulas [35,36]—were used for fitting the permeability of loess/paleosol layers in the Chinese Loess Plateau southern. By the regression analysis of infiltration rate data, experiential parameters values of the three formulas are provided in Table 3.
The experiential parameter “a” value varied in a wide range from 1.00 to 21.09 (Table 3), which is related to the differences between loess and paleosol layers in initial moisture content and soil bulk density. The “b” value in the Koctakob formula, which can reflect the declining speed of the infiltration rate along with time, varied from 0.27 to 0.95 (Table 3). In general, the bigger the b value is, the faster the infiltration rate declined with time, and vice versa. As a result, in this article, the infiltration rate of L5 decreased the fastest progressively, and that of S4 decreased the slowest progressively (Table 3). The “f0 − fc” in the Horton formula denotes the D-Value between initial infiltration rate and quasi-steady infiltration rate, which varied from 0.67 to 6.72 in this study. The maximum and minimum D-value appeared in L2 and S5, respectively (Figure 2, Table 3). The permeability parameters “k” in the Horton formula are used to characterize the parameter which related to the diffusion rate. The “k” value depends on the soil character such as soil texture, soil structure, and it varied from 0.02 to 0.11 in this study (Table 3). In general empirical formulas, “a1” were virtually equal to the quasi-steady infiltration rate [36]. The empirical formulas’ nonlinear fitting of infiltration experiment results shows that the Koctakob formula and Horton formula can only be used for the permeability of individual loess/paleosol layers. However, the general empirical formulas can be suitable for almost all the soil layers (most of the R2 values are greater than 0.85), which is applicable for describing the permeability of loess and paleosol formed 0.5 Ma BP. Therefore, in the Chinese Loess Plateau southern, the general empirical formula is often chosen in the practical application of the agricultural sector.
The value differences of experiential parameters in the empirical formula among the diverse soil layers are mainly caused by different properties of soil layers (Table 1). In terms of research on the hydrological cycle and farmland irrigation, what researchers are most concerned with are the specific figures of experiential parameters. For this purpose, the mean value and standard deviation data of experiential parameters (Table 4) were calculated by the experiential parameters of each loess and paleosol layers (listed in Table 3), and it can provide an important reference for hydrological and agricultural sectors for using infiltration empirical formulas in the Chinese Loess Plateau southern. Therefore, the mean value can serve as a specific evaluation value of experiential parameters, and the standard deviation can be used to estimate the possible discrete range of results.

4.3. Porosity-Controlled Permeability, Loess Aquiferous Space and Their Relationship with the Regional Palaeoclimate

Soil porosity of loess-paleosol layers is one of the most important factors affecting the permeability. Generally, the soil infiltration rate increases with the increase of soil porosity, and vice versa. The porosity of loess–paleosol layers can be used to demonstrate the permeability differences of strata in the Chinese Loess Plateau southern (as in Section 4.1), and can also affect the soil/sediment water storage capacity. Loess aquiferous space, which is considered to be generally caused by porosity, reflects soil/sediment water storage capacity, including interparticle pores, macropore (mainly root channels and insect holes), and macroscopic vertical fissures [30]. Among these types, the interparticle pore is the smallest and most important aquiferous space, which can only be seen under the microscope. Root channels and insect holes are the second most important. They are the so-called macropore, with root channels in the majority and insect holes in the minority. The root channels, 20–40 cm long and 0.5–2 mm in diameter are mostly distributed vertically. According to in situ observation, the macroscopic vertical fissures were generally 2–4 m long and 2–3 cm wide with a 2–3 m distance between them. The macroscopic vertical fissures were not the primary type of loess aquiferous space because of their low number. Aquifers are formed easily in loess, as well-developed aquiferous space.
The development process of loess takes place in very favorable soil formation surroundings. Loess is a kind of soil in nature, produced by geochemical or biogeochemical weathering/pedogenesis from dust transported by sandstorms and sedimentation [31,32]. So a loess aquiferous space is soil aquiferous space and it is affected by soil properties. The soil properties such as the three-phase ratio, porosity, texture, structure, water content, soil moisture characteristic curve, nutrient and so on, have many influential factors. Generally, influential factors include climate, biology, parent material, topography, time, and human factors, etc. Thereunto, the climate and vegetation were the dominant factors and had the greatest impact on the formation of loess aquiferous space. Past research shows that the main types of loess in the Chinese Loess Plateau southern were sierozem, heilu soil, and brown carbonate soil [51]. These types of soil formation enjoyed a cold, dry, and semiarid climate, with annual precipitation of approximately 350 mm, an annual average temperature of 7–10 °C, and vegetation of grassland and forest-steppe mixed with abundant herbage and small amounts of arbor plant. In this regard, the principal controlling factor of interparticle pore formation and aquiferous space formation in loess and permeability of loess/paleosol layers is the regional palaeoclimate.
The above argument is supported by the following analysis. CaCO3 content and magnetic susceptibility, as two kinds of sensitive palaeoclimatic indicators [52,53], always show an approximate coincidence with the porosity (Figure 3). In the Chinese Loess Plateau area, the argillation of loess was weak, and then interparticle micropore and aquiferous space were formed because of a lack of clay cement/chemical cement filling and adhesion [54]. Higher CaCO3 content in loess layers indicates less regional precipitation, weaker eluviation and weathering and colder and drier climatic conditions [32]. Intensive geochemical or biogeochemical weathering/pedogenesis benefits ferromagnetic minerals accumulation; hence, higher magnetic susceptibility values generally appear in the paleosol layers of a warmer and wetter climate and intensive weathering and pedogenesis [55]. The aquiferous space of root channels was formed by herbage and arbor plant root growth. In the process of loess formation, its properties are influenced by gravity, but in this study, investigated soil layers were in the upper part of the loess section, where the soil could hardly be affected by gravity; so, gravity counted for little.

4.4. The Significance of Paleosol as Aquitards

The above discussion has proven the tendency that a loess layer demonstrates greater permeability than a paleosol layer, which is also the main reason for the formation of aquifers and aquitards, respectively. Assuming the loess-paleosols layers (L1 to S5) as a complete system, in the case of adequate water supply, the system may present a state of water circulation balance. The real diffusion situation of groundwater is supposed to follow this trend [30]. Each layer within the system maintains a quasi-steady infiltration rate, and excess water also drains out from the sequence through interfaces where a sudden decline of quasi-steady infiltration rates occurs. It is worth mentioning that the turning point where quasi-steady infiltration rates decrease suddenly generally appears in the bottom of loess layers and the top of paleosol layers. This phenomenon has also been confirmed by the soil moisture content monitoring data in the study area (Figure 5). As shown in Figure 5, at the bottom of L4 and L5 strata, the soil moisture contents are significantly higher, even exceeding the local field capacity [56], thus forming gravity water. The formation of this phenomenon is closely related to the weak permeability of paleosol. This can be explained as follows.
In the warmer and wetter situation, paleosol easily becomes an aquitard because of lower porosity, weaker permeability, intensive pedogenesis and cementation, and clay collapsibility under the influence of water. On the other hand, the loess has relatively ample water storage space and is a natural soil reservoir. With insufficient water supply, the distribution of groundwater becomes complicated. The water circulation balance may be broken, and even the water storage or water-resisting functions of loess/paleosol sequences are likely to change. Therefore, the water/moisture of the individual paleosol layer is higher than that of loess because of the paleosol’s intensive pedogenesis, higher clay content and better water retention [57]. That means that paleosol layers have become an aquifer. So whether the water supply is adequate or not, paleosol always plays an important role in water/moisture retention and storage. Not all of the loess and paleosol groundwater can become directly available water resources, because the water resources in the soil near the surface are limited and quite difficult to extract, on account of the high water retention of loess, evaporation, and transpiration. In the middle and lower position of Loess tableland slopes, there are a large number of groundwater emergences in the form of spring water runoff [30,57]. For example, underground diving is exposed in the upper part of the Shaoling tableland loess layer a few kilometers west of the study area (Figure 6). It can be seen from Figure 6 that there are two groundwater exposure points in the Shaoling area of the southern suburbs of Xi’an. The lower groundwater exposure point is at the bottom of the profile (about 32 m away from the earth’s surface), and its position is between the fifth layer of paleosol (S5) and its dense calcareous concretions layer. The spring water of this groundwater exposure point is perennial, which is because the layer has reached the local subsurface water level (C1 and C2 in Figure 6 is the exposure point of the spring water and the puddle made up of spring water, respectively; D in Figure 6 shows the perennial murmuring stream formed by spring water.).
Another is located at the junction of the L1 and S1 layers, about 8 m below the earth’s surface (Figure 6). The spring water of this exposure point is not perennial, but the seasonal or short time spring water which is caused by more precipitation in the area during the year or a period of time. In Figure 6, A1 is the positions of the spring water exposure point and the puddle formed by the spring water; A2 is the loess cover above the seasonal spring water exposure point; B shows the seasonal murmuring stream formed by spring water. The groundwater between the two spring water exposure points is mainly in the form of capillary water or thin-film water. Even in these layers, there is a partial retention water phenomenon caused by paleosols or sparse calcium carbonate nodules but on the whole, its moisture content has not reached the critical point of spring water exposure. However, the soil layer thickness between the two spring water exposure points is large, so a large amount of water resources are also stored for vegetation utilization or other ecological cycles.
The thickness of loess and paleosol sequences more than 200 m on the Chinese Loess Plateau makes it an important storage place for groundwater resources, which helps relieve the tension between the increasing shortage of water resources and the demands of local inhabitants. At the same time, it also provides potential options for solving water shortages in other countries.

5. Conclusions

The average quasi-steady infiltration rate of loess is 1.49 mm/min, while that of paleosol is 0.91 mm/min; therefore, the average hydraulic infiltration performance of loess is generally larger than that of paleosol. Moreover, because of the difference between porosity and structural homogeneity, the average time to reach the quasi-steady status in loess is generally shorter than that of paleosols. Generally, loess layers have higher porosity, better permeability and more ample storage space than paleosol, which is prone to form aquifers, whereas the paleosol is more likely to form aquitards. For this reason, the turning points of quasi-steady infiltration rates decrease suddenly, and the exposed positions of underground springs generally appear at the bottom of loess layers and the top of paleosol layers. In this regard, present hydrogeological properties in the loess/paleosol sequence are strongly related to the paleoclimate environmental change, as the soil structure and porosity are controlled by palaeoclimatic conditions and post-depositional pedogenesis under the influence of palaeoclimatic conditions. In the semi-arid Chinese Loess Plateau area, the thick loess-paleosol sequences as a storage place of groundwater have vital significance in relieving the imbalance between supply and demand of water resources.

Author Contributions

J.N. and J.Z. conceived and designed the experiments; Z.X. and R.W. performed the experiments; P.W. and D.S. analyzed the data; T.S. wrote the paper. All authors have read and agreed to the published version of the manuscript.

Funding

National Natural Science Foundation of China: 41171423. Fundamental Research Funds for the Central Universities: GK201803055. Shaanxi Province Postdoctoral Science Foundation: 2016BSHEDZZ27.

Acknowledgments

This research was financially supported by the Fundamental Research Funds for the Central Universities, No.GK201803055, Shaanxi province Postdoctoral Science Foundation No: 2016BSHEDZZ27 and the National Natural Science Foundation, Grant No. 41171423.

Conflicts of Interest

The authors declared that they have no conflicts of interest to this work.

References

  1. Lin, R.; Wei, K. Tritium profiles of pore water in the Chinese loess unsaturated zone: Implications for estimation of groundwater recharge. J. Hydrol. 2006, 328, 192–199. [Google Scholar] [CrossRef]
  2. Huo, L.; Qian, T.; Hao, J.; Zhao, D. Sorption and retardation of strontium in saturated chinese loess: Experimental results and model analysis. J. Environ. Radioact. 2013, 116, 19–27. [Google Scholar] [CrossRef] [PubMed]
  3. Zhou, Y.F.; Tham, L.G.; Yan, W.M.; Dai, F.C.; Xu, L. Laboratory study on soil behavior in loess slope subjected to infiltration. Eng. Geol. 2014, 183, 31–38. [Google Scholar] [CrossRef]
  4. Jiang, M.; Zhang, F.; Hu, H.; Cui, Y.; Peng, J. Structural characterization of natural loess and remolded loess under triaxial tests. Eng. Geol. 2014, 181, 249–260. [Google Scholar] [CrossRef]
  5. Li, P.C.; Liu, J.M.; Wei, X.M. The Loess Plateau Irrigation Water Source Conversion Mechanism and Regulation; Shaanxi Science and Technology Press: Xi’an, China, 1999; pp. 20–79. (In Chinese) [Google Scholar]
  6. Hu, P.; Liu, Q.; Torrent, J.; Barrón, V.; Jin, C. Characterizing and quantifying iron oxides in chinese loess/paleosols: Implications for pedogenesis. Earth Planet. Sci. Lett. 2013, 369–370, 271–283. [Google Scholar] [CrossRef]
  7. Bloemendal, J.; Liu, X.; Sun, Y.; Li, N. An assessment of magnetic and geochemical indicators of weathering and pedogenesis at two contrasting sites on the chinese loess plateau. Palaeogeogr. Palaeoclimatol. Palaeoecol. 2008, 257, 152–168. [Google Scholar] [CrossRef]
  8. Gvirtzman, H.; Shalev, E.; Dahan, O.; Hatzor, Y.H. Large-scale infiltration experiments into unsaturated stratified loess sediments: Monitoring and modeling. J. Hydrol. 2008, 349, 214–229. [Google Scholar] [CrossRef]
  9. Sheikh, V.; Visser, S.; Stroosnijder, L. A simple model to predict soil moisture: Bridging event and continuous hydrological (beach) modelling. Environ. Modell. Softw. 2009, 24, 542–556. [Google Scholar] [CrossRef]
  10. Yu, Y.; Zhang, G.; Geng, R.; Sun, L. Temporal variation in soil detachment capacity by overland flow under four typical crops in the loess plateau of china. Biosys. Eng. 2014, 122, 139–148. [Google Scholar] [CrossRef]
  11. Wei, T.; Fan, W.; Yuan, W.; Wei, Y.; Yu, B. Three-dimensional pore network characterization of loess and paleosol stratigraphy from south jingyang plateau, china. Environ. Earth Sci. 2019, 78, 123–133. [Google Scholar] [CrossRef]
  12. Feng, L.; Lin, H.; Zhang, M.; Guo, L.; Jin, Z.; Liu, X. Development and evolution of loess vertical joints on the chinese loess plateau at different spatiotemporal scales. Eng. Geol. 2020, 265, 105–122. [Google Scholar] [CrossRef]
  13. Schlüter, S.; Albrecht, L.; Schwärzel, K.; Kreiselmeier, J. Long-term effects of conventional tillage and no-tillage on saturated and near-saturated hydraulic conductivity—can their prediction be improved by pore metrics obtained with x-ray ct? Geoderma 2020, 361, 114–132. [Google Scholar] [CrossRef]
  14. Li, P.; Mu, X.; Holden, J.; Wu, Y.; Irvine, B.; Wang, F.; Gao, P.; Zhao, G.; Sun, W. Comparison of soil erosion models used to study the chinese loess plateau. Earth-Sci. Rev. 2017, 170, 17–30. [Google Scholar] [CrossRef] [Green Version]
  15. Cai, J.; Zhou, Z.; Liu, J.; Wang, H.; Jia, Y.; Xu, C.Y. A three-process-based distributed soil erosion model at catchment scale on the loess plateau of China. J. Hydrol. 2019, 578, 124–129. [Google Scholar] [CrossRef]
  16. Liu, S.; Huang, S.; Xie, Y.; Leng, G.; Huang, Q.; Wang, L.; Xue, Q. Spatial-temporal changes of rainfall erosivity in the loess plateau, china: Changing patterns, causes and implications. Catena 2018, 166, 279–289. [Google Scholar] [CrossRef]
  17. Juang, C.H.; Dijkstra, T.; Wasowski, J.; Meng, X. Loess geohazards research in China: Advances and challenges for mega engineering projects. Eng. Geol. 2019, 251, 1–10. [Google Scholar] [CrossRef]
  18. Wang, S.; Peng, J.; Zhuang, J.; Kang, C.; Jia, Z. Underlying mechanisms of the geohazards of macro loess discontinuities on the chinese loess plateau. Eng. Geol. 2019, 263, 105–125. [Google Scholar] [CrossRef]
  19. Peng, J.; Wang, S.; Wang, Q.; Zhuang, J.; Huang, W.; Zhu, X.; Leng, Y.; Ma, P. Distribution and genetic types of loess landslides in China. J.Asian Earth Sci. 2019, 170, 329–350. [Google Scholar] [CrossRef]
  20. Perić, Z.; Lagerbäck Adolphi, E.; Stevens, T.; Újvári, G.; Zeeden, C.; Buylaert, J.P.; Marković, S.B.; Hambach, U.; Fischer, P.; Schmidt, C.; et al. Quartz osl dating of late quaternary chinese and serbian loess: A cross eurasian comparison of dust mass accumulation rates. Quatern. Int. 2019, 502, 30–44. [Google Scholar]
  21. Liu, X.; Sun, Y.; Vandenberghe, J.; Li, Y.; An, Z. Palaeoenvironmental implication of grain-size compositions of terrace deposits on the western chinese loess plateau. Aeolian Res. 2018, 32, 202–209. [Google Scholar] [CrossRef]
  22. Li, Y.; Yang, S.; Xiao, J.; Jiang, W.; Yang, X. Hydrogen isotope ratios of leaf wax n-alkanes in loess and floodplain deposits in Northern China since the last glacial maximum and their paleoclimatic significance. Palaeogeogr. Palaeoclimatol. Palaeoecol. 2018, 509, 91–97. [Google Scholar] [CrossRef]
  23. Hartmann, K.; Wünnemann, B. Hydrological changes and holocene climate variations in nw china, inferred from lake sediments of juyanze palaeolake by factor analyses. Quatern. Int. 2009, 194, 28–44. [Google Scholar] [CrossRef]
  24. Osterrieth, M.; Madella, M.; Zurro, D.; Fernanda Alvarez, M. Taphonomical aspects of silica phytoliths in the loess sediments of the argentinean pampas. Quatern. Int. 2009, 193, 70–79. [Google Scholar] [CrossRef]
  25. Li, P.; Qian, H.; Wu, J. Accelerate research on land creation. Nature 2014, 510, 29–31. [Google Scholar] [CrossRef] [PubMed]
  26. Zhang, D.; Wang, J.; Chen, C. Gas and liquid permeability in the variably saturated compacted loess used as an earthen final cover material in landfills. Waste Manag. 2020, 105, 49–60. [Google Scholar] [CrossRef]
  27. Chen, H.; Shao, M.; Li, Y. Soil desiccation in the loess plateau of China. Geoderma 2008, 143, 91–100. [Google Scholar] [CrossRef]
  28. Chung, C.Y.; Power, S.B. Precipitation response to la niña and global warming in the indo-pacific. Clim. Dyn. 2014, 43, 3293–3307. [Google Scholar] [CrossRef]
  29. Zhao, J.B.; Shao, T.J.; Niu, J.J. A study on permeability and water-bearing conditions of loess in Bailu tableland of the eastern suburbs of Xi’an. Geogr. Res. 2009, 28, 1188–1197, (In Chinese with English abstract). [Google Scholar]
  30. Zhao, J.; Long, T.; Wang, C.; Zhang, Y. How the quaternary climatic change affects present hydrogeological system on the chinese loess plateau: A case study into vertical variation of permeability of the loess–palaeosol sequence. Catena 2012, 92, 179–185. [Google Scholar] [CrossRef]
  31. Liu, D.S. Loess and Environment; Science Press: Beijing, China, 1985; pp. 20–79. (In Chinese) [Google Scholar]
  32. Zhao, J.B. Illuvial Theory and Environmental Evolution in Loess Plateau; Science Press: Beijing, China, 2002; pp. 23–31. (In Chinese) [Google Scholar]
  33. Bouwer, H. Intake rate: Cylinder infiltrometer. In Methods of Soil Analysis; Klute, A., Ed.; ASA: Madison, WI, USA, 1986; pp. 825–843. [Google Scholar]
  34. Wang, Y.L.; Jiang, Q.; Cai, J.J. Spatial Variability of Infiltration Rate in the Semiarid Loess Hilly and Gully Area. Bull. Soil Water Conserv. 2008, 28, 52–57, (In Chinese with English abstract). [Google Scholar]
  35. Wang, J.M.; Wu, Q.X.; Han, B. Distribution law on infiltration of loess hilly region. Syst. Sci. Compr. Stud. Agric. 2004, 20, 288–290, (In Chinese with English abstract). [Google Scholar]
  36. Lv, G.; Wu, X.Y. Review on Influential Factors of Soil Infiltration Characteristics. Chinese Agricul. Sci. Bull. 2008, 24, 494–499, (In Chinese with English abstract). [Google Scholar]
  37. Sun, J.Z. Loessology (volume 1); Hong Kong Institute of Archaeology Press: Hong Kong, China, 2005; pp. 19–236. [Google Scholar]
  38. Hamilton, A.C.; Magowan, W.; Taylor, D. Use of the bartington meter to determine the magnetic susceptibility of organic-rich sediments from western uganda. Phys. Earth Planet. Inter. 1986, 42, 5–9. [Google Scholar] [CrossRef]
  39. Kanu, M.O.; Meludu, O.C.; Oniku, S.A. Comparative study of top soil magnetic susceptibility variation based on some human activities. Geofis. Int. 2014, 53, 411–423. [Google Scholar] [CrossRef]
  40. Hu, H.R. Soil Science Experiment Guidance Tutorial; Chinese Forestry Press: Beijing, China, 2012; pp. 24–27. (In Chinese) [Google Scholar]
  41. Zhao, J.; Cao, J.; Jin, Z.; Xing, S.; Shao, T. The fifth paleosol layer in the southern part of China’s loess plateau and its environmental significance. Quatern. Int. 2014, 334–335, 189–196. [Google Scholar] [CrossRef]
  42. Zhou, L.P.; Oldfield, F.; Wintle, A.G. Partly pedogenic origin of magnetic variations in chinese loess. Nature 1990, 346, 737–739. [Google Scholar] [CrossRef]
  43. Liu, X.; Liu, T.; Paul, H.; Xia, D.; Jiri, C.; Wang, G. Two pedogenic models for paleoclimatic records of magnetic susceptibility from chinese and siberian loess. Sci. China-Earth Sci. 2008, 51, 284–293. [Google Scholar] [CrossRef]
  44. Silva, A.C.; Vleeschouwer, D.; Boulvain, F.; Claeys, P.; Fagel, N.; Humblet, M.; Mabille, C.; Michel, J.; Sardar, A.M.; Pas, D.; et al. Magnetic susceptibility as a high-resolution correlation tool and as a climatic proxy in paleozoic rocks—merits and pitfalls: Examples from the devonian in belgium. Mar. Pet. Geol. 2013, 46, 173–189. [Google Scholar] [CrossRef]
  45. Song, Y.; Hao, Q.; Ge, J.; Zhao, D.; Zhang, Y.; Li, Q.; Zuo, X.; Lü, Y.; Wang, P. Quantitative relationships between magnetic enhancement of modern soils and climatic variables over the Chinese loess plateau. Quatern. Int. 2014, 334–335, 119–131. [Google Scholar] [CrossRef]
  46. Heller, F.; Liu, T.S. Magnetostratigraphical dating of loess deposits in China. Nature 1982, 300, 431–433. [Google Scholar] [CrossRef]
  47. Heller, F.; Liu, T.S. Magnetism of Chinese loess deposits. Geophys. J. R. Astr. Soc. 1984, 77, 125–141. [Google Scholar] [CrossRef]
  48. Burbank, W.S.; Li, J.J. Age and palaeoclimatic significance of the loess of lanzhou, North China. Nature 1985, 316, 429–431. [Google Scholar] [CrossRef]
  49. Zhao, G.; Liu, X.; Chen, Q.; Lü, B.; Niu, H.; Liu, Z.; Li, P. Paleoclimatic evolution of holocene loess and discussion of the sensitivity of magnetic susceptibility and median diameter. Quatern. Int. 2013, 296, 160–167. [Google Scholar] [CrossRef]
  50. Yin, Q.; Xiao, G.; Guo, Z. Syn- and post-depositional modification of loess deposits and their paleoenvironmental significance. Quatern. Sci. 2007, 27, 295–302, (In Chinese with English abstract). [Google Scholar]
  51. Xu, Q.X.; Zhao, J.B.; Qi, X.L. Primary probing into the relationship of loess porosity and its granularity. J. Xi’an Eng. Univ. 2000, 22, 67–70, (In Chinese with English abstract). [Google Scholar]
  52. Tang, Y.; Jia, J.; Xie, X. Records of magnetic properties in quaternary loess and its paleoclimatic significance: A brief review. Quatern. Int. 2003, 108, 33–50. [Google Scholar] [CrossRef]
  53. Hošek, J.; Hambach, U.; Lisá, L.; Grygar, T.M.; Horáček, I.; Meszner, S.; Knésl, I. An integrated rock-magnetic and geochemical approach to loess/paleosol sequences from Bohemia and Moravia (Czech Republic): Implications for the upper pleistocene paleoenvironment in Central Europe. Palaeogeogr. Palaeoclimatol. Palaeoecol. 2015, 418, 344–358. [Google Scholar] [CrossRef]
  54. Zheng, H.; Theng, B.G.; Whitton, J.S. Mineral composition of loess–paleosol in the Loess Plateau of China nd its environmental implications. Geochimica (S1). 1994, 23, 113–123, (In Chinese with English abstract). [Google Scholar]
  55. Heller, F.; Liu, X.; Liu, T. Magnetic susceptibility of loess in china. Earth Planet. Sci. Lett. 1991, 103, 301–310. [Google Scholar] [CrossRef]
  56. Qiao, J.; Zhu, Y.; Jia, X.; Huang, L.; Shao, M.A. Pedotransfer functions for estimating the field capacity and permanent wilting point in the critical zone of the loess plateau, China. J. Soils Sed. 2018, 19, 140–147. [Google Scholar] [CrossRef]
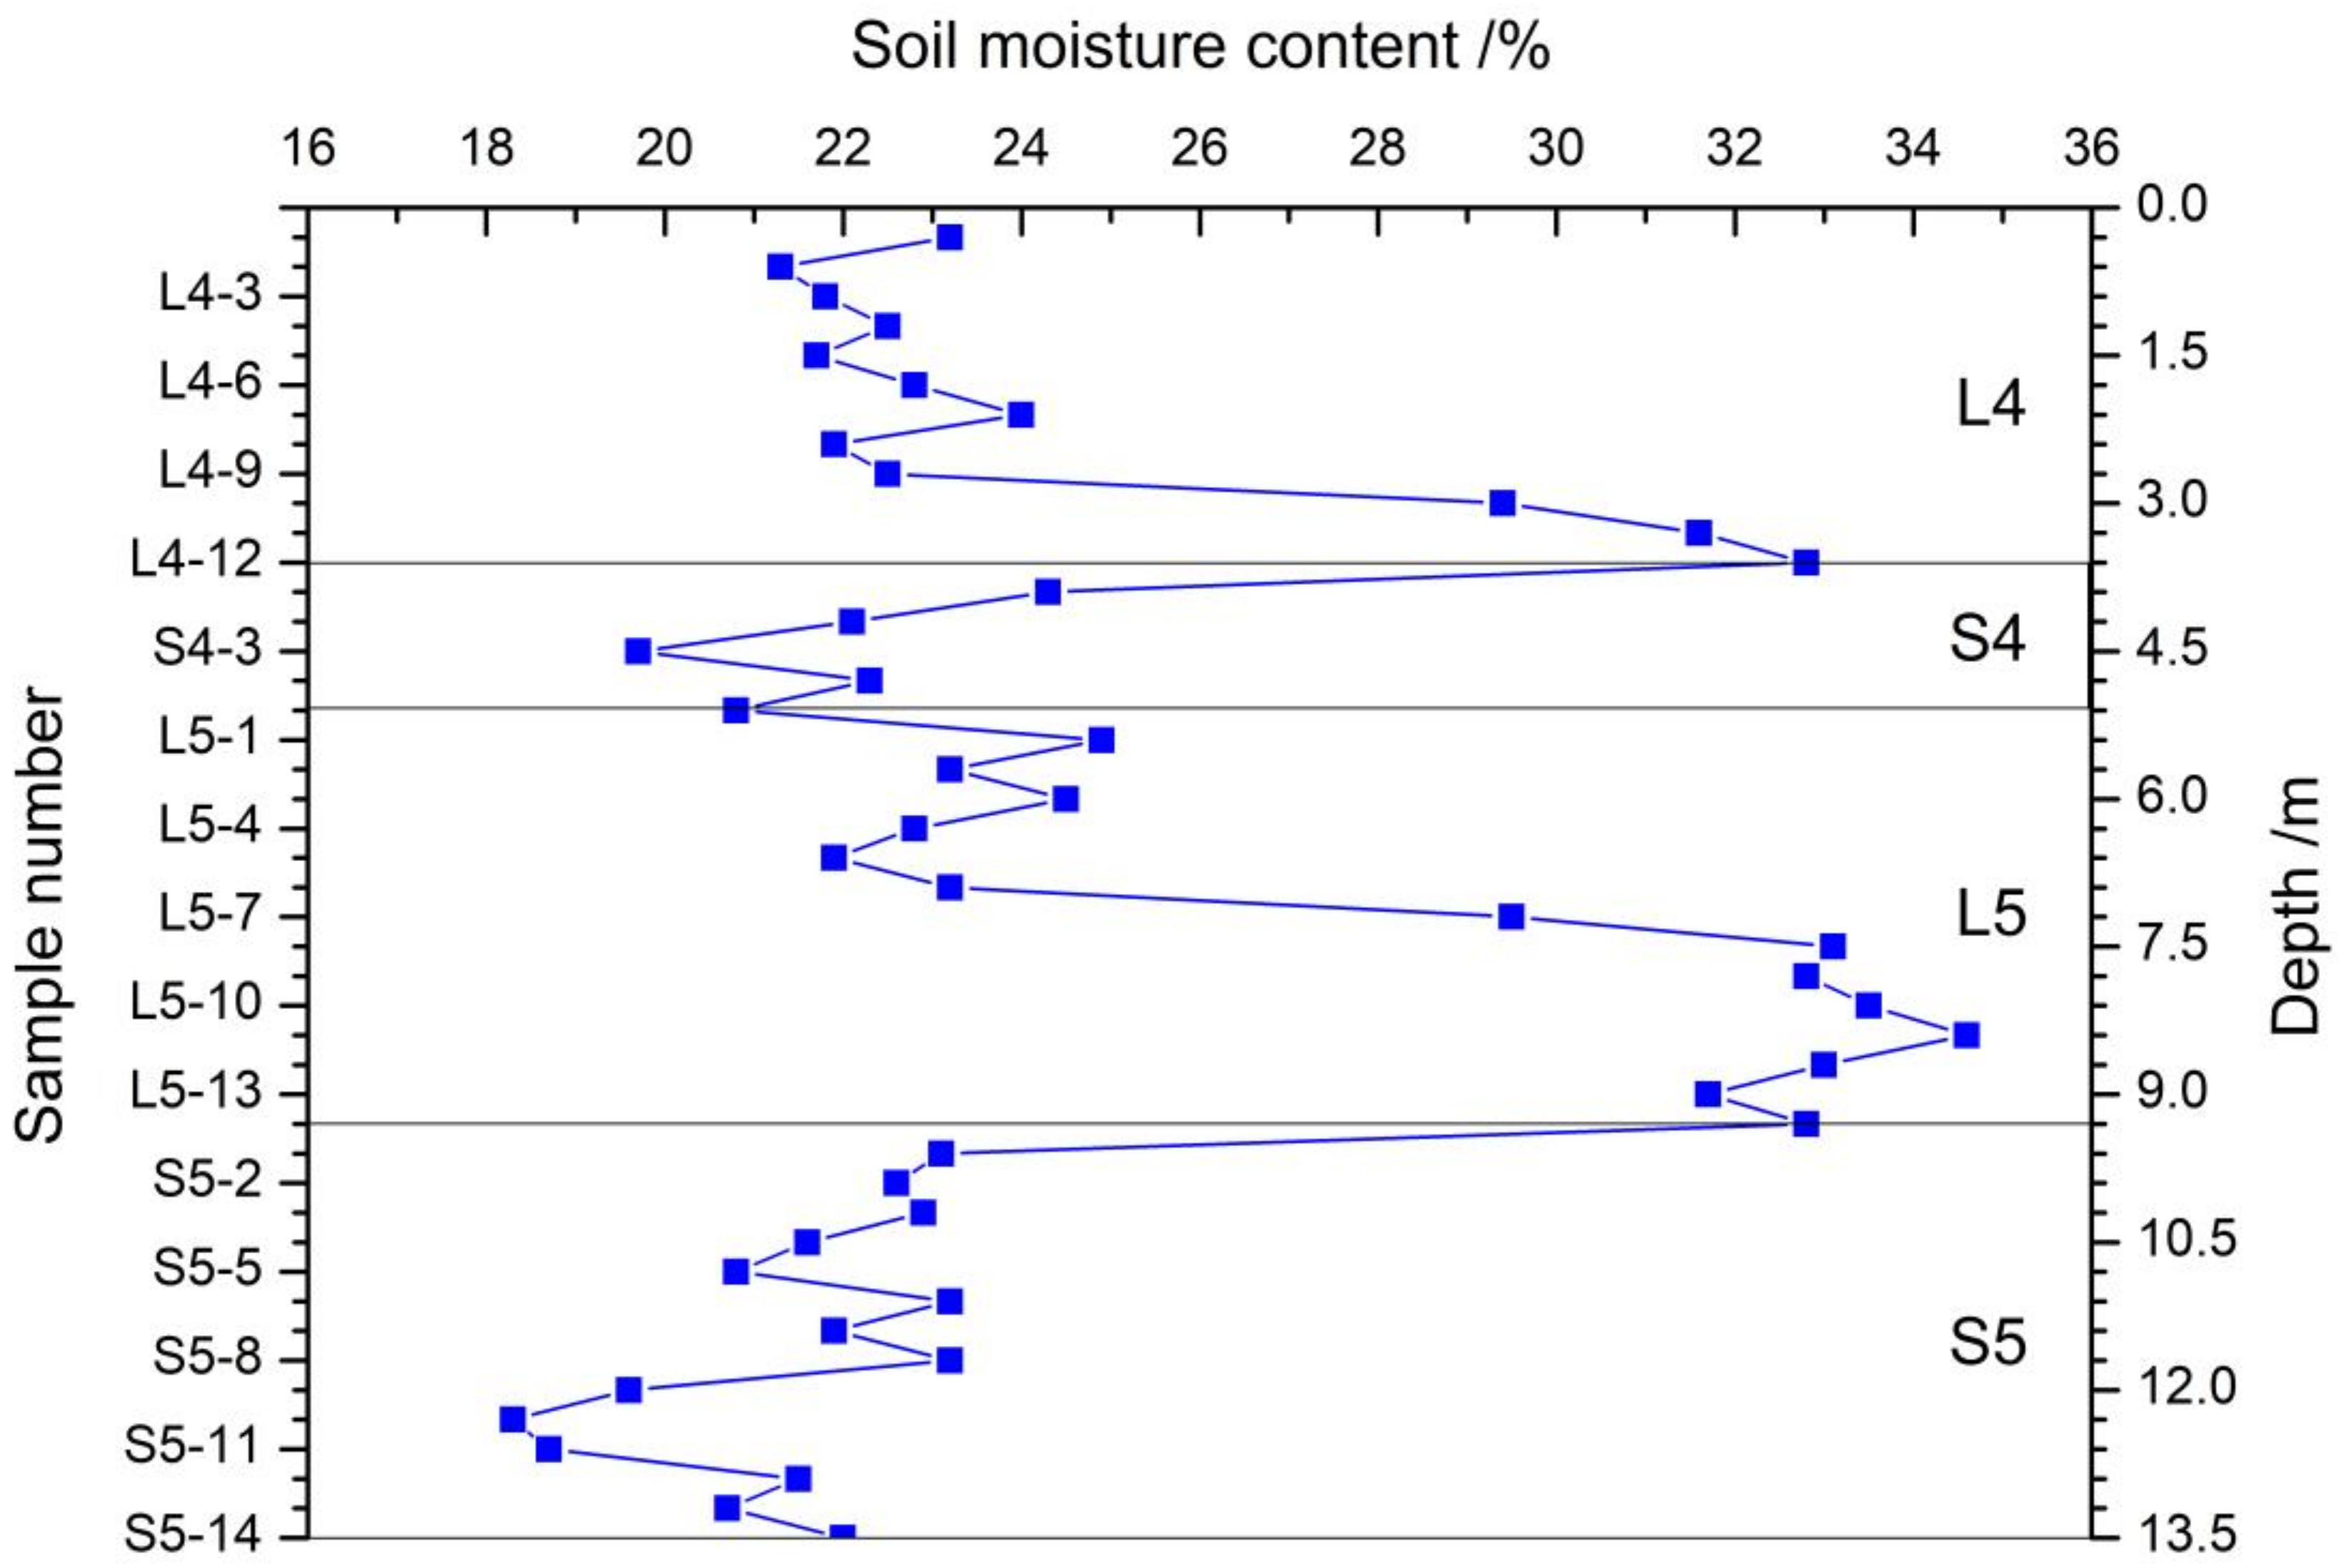
  57. Zhao, J.B.; Du, J.; Cai, X.W. Researching in the moisture content of loess profile in east suburb in Xi’an and Lantian County. J. Shaanxi Normal Univ. 2003, 31, 105–109, (In Chinese with English abstract). [Google Scholar]
Figure 1. Location of experimental and sampling sites.
Water 12 00870 g001
Figure 2. Permeability of loess–paleosol sequence in the Chinese Loess Plateau southern. Note: S4′ is CaCO3 concretion layer, (a) Loess, (b) Paleosol.
Water 12 00870 g002
Figure 3. Variations of CaCO3 content, porosity, and magnetic susceptibility of different loess/paleosol layers in the Chinese Loess Plateau southern. Notes: Li and Si respectively on behalf of loess and paleosol. The letter i is the number of the layer. S4′ layer is located at the top of the L5 stratum, and it is considered to be contained in the L5 stratum.
Water 12 00870 g003
Figure 4. Comparison of the infiltration rates of different loess/paleosol layers in the Chinese Loess Plateau southern; Note: S4′ is CaCO3 concretion layer.
Water 12 00870 g004
Figure 5. The line chart of soil moisture content (mass ratio) in the loess strata (L4-S5) of the study area.
Water 12 00870 g005
Figure 6. Schematic diagram of the loess strata and groundwater exposure positions of Shaolingyuan in the southern suburbs of Xi’an.
Water 12 00870 g006
Table 1. Soil thickness of L1-S5 at the Bailu tableland [29,31,37].
PositionThicknessSoil ColorSoil Structure Characteristics
L11.5 m *Grayish-yellowThis layer has big holes, larger soil porosity, better development of vertical joints, and no iron & manganese film. There are loose structures.
S12.0 mThe upper part shows dark brown because of containing abundant organic matter, and the bottom is red or reddish-brown.This layer is divided into 3 or 4 sub-layers and has better development of iron and manganese film. There are dense structures. The bottom has the weathering fragmental zone of loess.
L26.4 mBrown-yellowThe upper part has a weathering fragmental zone and calcareous concretions. The layer is more compact than L1 in texture.
S22.5 mAt the middle-upper part, there is a slightly yellow zone between the two red zones.This layer is divided 3 sub-layers, and has better development of iron and manganese film. There are dense structures.
L32.2 mBrown-yellowThe upper part has a calcareous concretions. There are loose structures.
S32.0 mThe upper part shows reddish-brown, and the bottom is redThis layer has better development of iron and manganese film. There are dense structures.
L42.9 mBrown-yellowThe upper part has a calcareous concretions. There are loose structures.
S41.3 mRedThis layer has better development of iron and manganese film. There are dense structures.
L54.1 mBrown-yellowThe bottom of this layer has calcareous concretions. There are loose structures.
S54.8 mThere are 2 brown yellow belts among 3 red belts. The bottom is a gray weathering fragmental zone.This layer is divided into 6 sub-layers and has better development of iron and manganese film. There are dense structures. The bottom has the weathering fragmental zone of loess.
*: Due to the artificial agricultural cultivation factors, the L1 upper-part has disappeared.
Table 2. Porosity and CaCO3 content of loess/paleosol layers in the Chinese Loess Plateau southern.
PositionPorosityCaCO3 ContentPositionPorosityCaCO3 Content
Average %Variation Range %Average %Variation Range %Average %Variation Range %Average %Variation Range %
L147.8343.22–55.5511.434.90–18.79S144.1141.95–45.621.760.05–5.31
L247.5939.99–52.806.560.09–20.72S244.3740.06–49.391.800.05–8.55
L345.8540.91–51.435.570.02–14.84S345.3643.90–46.901.100.04–2.69
L444.4742.21–47.010.100–0.19S444.1942.44–46.060.060–0.37
L550.9949.14–53.382.470–17.53S546.5244.15–52.810.270–3.00
Table 3. The experiential parameters values of the three kind infiltration formulas.
PositionKoctakob Formula f(t) = at−bHorton Formula f(t) = fc + (f0 − fc)e−ktGeneral Empirical Formulas f(t) = a1 + b1t−n
abR2fcf0fckR2a1b1nR2
L115.170.510.971.274.500.040.870.9320.950.770.99
S116.660.500.941.494.870.040.900.1417.010.520.94
L221.090.390.832.336.720.020.90−731.3745.70.000.90
S24.870.350.910.791.660.030.790.706.850.690.94
L34.740.470.980.501.400.030.910.074.880.510.98
S34.870.280.521.341.980.070.621.4353.261.820.91
L48.600.280.701.523.000.110.77−957.7964.70.000.77
S42.580.270.810.710.930.040.810.674.890.860.91
L51.000.950.871.841.730.020.81−1.256.750.150.87
S51.530.310.810.210.670.020.570.272.090.650.83
S4′7.530.820.880.202.350.090.820.2830.611.710.98
Note: R2 is the coefficient of determination; S4′ is the CaCO3 concretion layer.
Table 4. Mean value and standard deviation of experiential parameters.
ParametersKoctakob FormulaHorton FormulaGeneral Empirical Formulas
abfcf0fcka1b1n
Mean value8.0570.4660.7781.7330.010−153.251168.8790.697
Standard deviation6.3630.1800.3850.9830.003329.414327.1980.575

