Climatic Variability and Periodicity for Upstream Sub-Basins of the Yangtze River, China
by
 , , ,
, , ,
Naveed Ahmed
1,2 ,
,
Genxu Wang
1,*,
Martijn J. Booij
3,
Adeyeri Oluwafemi
4,5,
Muhammad Zia-ur-Rahman Hashmi
6,
Shahid Ali
7 and
Sarfraz Munir
8 1
Key Laboratory of Mountain Surface Process and Ecological Regulations, Institute of Mountain Hazards and Environment, Chinese Academy of Sciences, Chengdu 610041, China
2
University of Chinese Academy of Sciences, Beijing 100049, China
3
Water Engineering and Management Group, Faculty of Engineering Technology, University of Twente, 7522 Enschede, The Netherlands
4
Institute for Meteorology and Climate Research Atmospheric Environmental Research, Karlsruhe Institute of Technology, Campus Alpine, 76131 Karlsruhe, Germany
5
Department of Meteorology and Climate Science, Fedral University of Technology, 460114 Akure, Nigeria
6
Water Resources and Glaciology Section, Global Change Impact Studies Centre (GCISC), 6th Floor Emigration Tower, G-8/1, Islamabad 44000, Pakistan
7
Department of Civil Engineering, National University of Computer and Emerging Sciences, Foundation for Advancement of Science and Technology, Lahore 54000, Pakistan
8
School of Science and Engineering, University of Kurdistan Hewler, 30 Meter Avenue, Erbil, Kurdistan 44001, Iraq
*
Author to whom correspondence should be addressed.
Water 2020, 12(3), 842; https://doi.org/10.3390/w12030842
Submission received: 20 February 2020
/
Revised: 11 March 2020
/
Accepted: 13 March 2020
/
Published: 17 March 2020
(This article belongs to the Section Hydrology)
Abstract
:The headwaters of the Yangtze River are located on the Qinghai Tibetan Plateau, which is affected by climate change. Here, treamflow trends for Tuotuohe and Zhimenda sub-basins and relations to temperature and precipitation trends during 1961–2015 were investigated. The modified Mann–Kendall trend test, Pettitt test, wavelet analysis, and multivariate correlation analysis was deployed for this purpose. The temperature and precipitation significantly increased for each sub-basin, and the temperature increase was more significant in Tuotuohe sub-basin as compared to the Zhimenda sub-basin. A statistically significant periodicity of 2–4 years was observed for both sub-basins in different time spans. Higher flow periodicities for Tuotuohe and Zhimenda sub-basin were found after 1991 and 2004, respectively, which indicates that these are the change years of trends in streamflows. The influence of temperature on streamflow is more substantial in Tuotuohe sub-basin, which will ultimately impact the melting of glaciers and snowmelt runoff in this sub-basin. Precipitation plays a more critical role in the Zhimenda streamflow. Precipitation and temperature changes in the headwaters of the Yangtze River will change the streamflow variability, which will ultimately impact the hydropower supply and water resources of the Yangtze Basin. This study contributes to the understanding of the dynamics of the hydrological cycle and may lead to better hydrologic system modeling for downstream water resource developments.
Keywords:
climate change; trend analysis; mann kendall; wavelet; periodicity; Yangtze River; Qinghai Tibet1. Introduction
Climate change and its impacts have been evident in the Qinghai Tibetan Plateau over the last decade [1,2,3,4,5]. The warming rate has been more significant during the last 50 years on the Qinghai Tibetan Plateau compared to other regions in the world with the same altitude [6,7,8]. Additionally, a slight increase in precipitation was observed in the last 20 years [9]. Climate change may have severe impacts on regional water resources [10]. The hydrological process in a basin is highly dependent on the various climatic parameters and their complex interrelations, and streamflow is the non-linear result of variations in temperature and precipitation in a drainage basin [9]. The headwaters of the Yangtze River (HWYZ) are located on the central Tibetan Plateau, with a large area covered by glaciers, permanently frozen soil, permafrost and lakes which include about 88.8 km3 of water [11] According to Chen, et al. [12], the size and water storage capacity of glaciers and lakes have reduced in the HWYZ over the last two decades. These reductions will ultimately have severe impacts on dry season streamflows. Woo, et al. [13] and Xu, et al. [14] found that summer flows will increase due to more extreme precipitation events, more frequent warm nights, and long heatwaves in the HWYZ. Most of the studies conducted in this region were related to temperature and precipitation trends [15,16,17,18,19,20,21,22] and very few investigated linkages with stream flows [4,23,24]. The wavelet method is one of the most reliable tools for analyzing the variations in the hydrological and climatic components by the discretization of the time series into different periods and scales. Kuang et al. [23] and Yua, et al. [25] have used the wavelet method for the investigation of the long-term time series of temperature, precipitation, and streamflows in the Yangtze River estuary and source regions of the Yellow River. Runoff seriously impacts the production of food, fiber, and hydro-electricity, and so its trends and linkages with climatic variables need to be analyzed in further detail. Due to the large quantity of water stored in this region, a detailed understanding of the linkages between hydro-climatic and streamflow variability should be established. Therefore, in this study, we explored the trends in precipitation, temperature and streamflow from 1961–2015 at the sub-basin scale of the HWYZ. We also focused on the periodic behavior of streamflow, precipitation, and temperature in the sub-basins of HWYZ during 1961–2015, and the wavelet method was deployed to investigate periodic behavior. Moreover, multi-variate correlation analysis was used to link the temperature and precipitation with streamflows. The dominant climatic variable influencing streamflow was also identified for each sub-basin in HWYZ.
2. Material and Methods
2.1. Study Area and Data
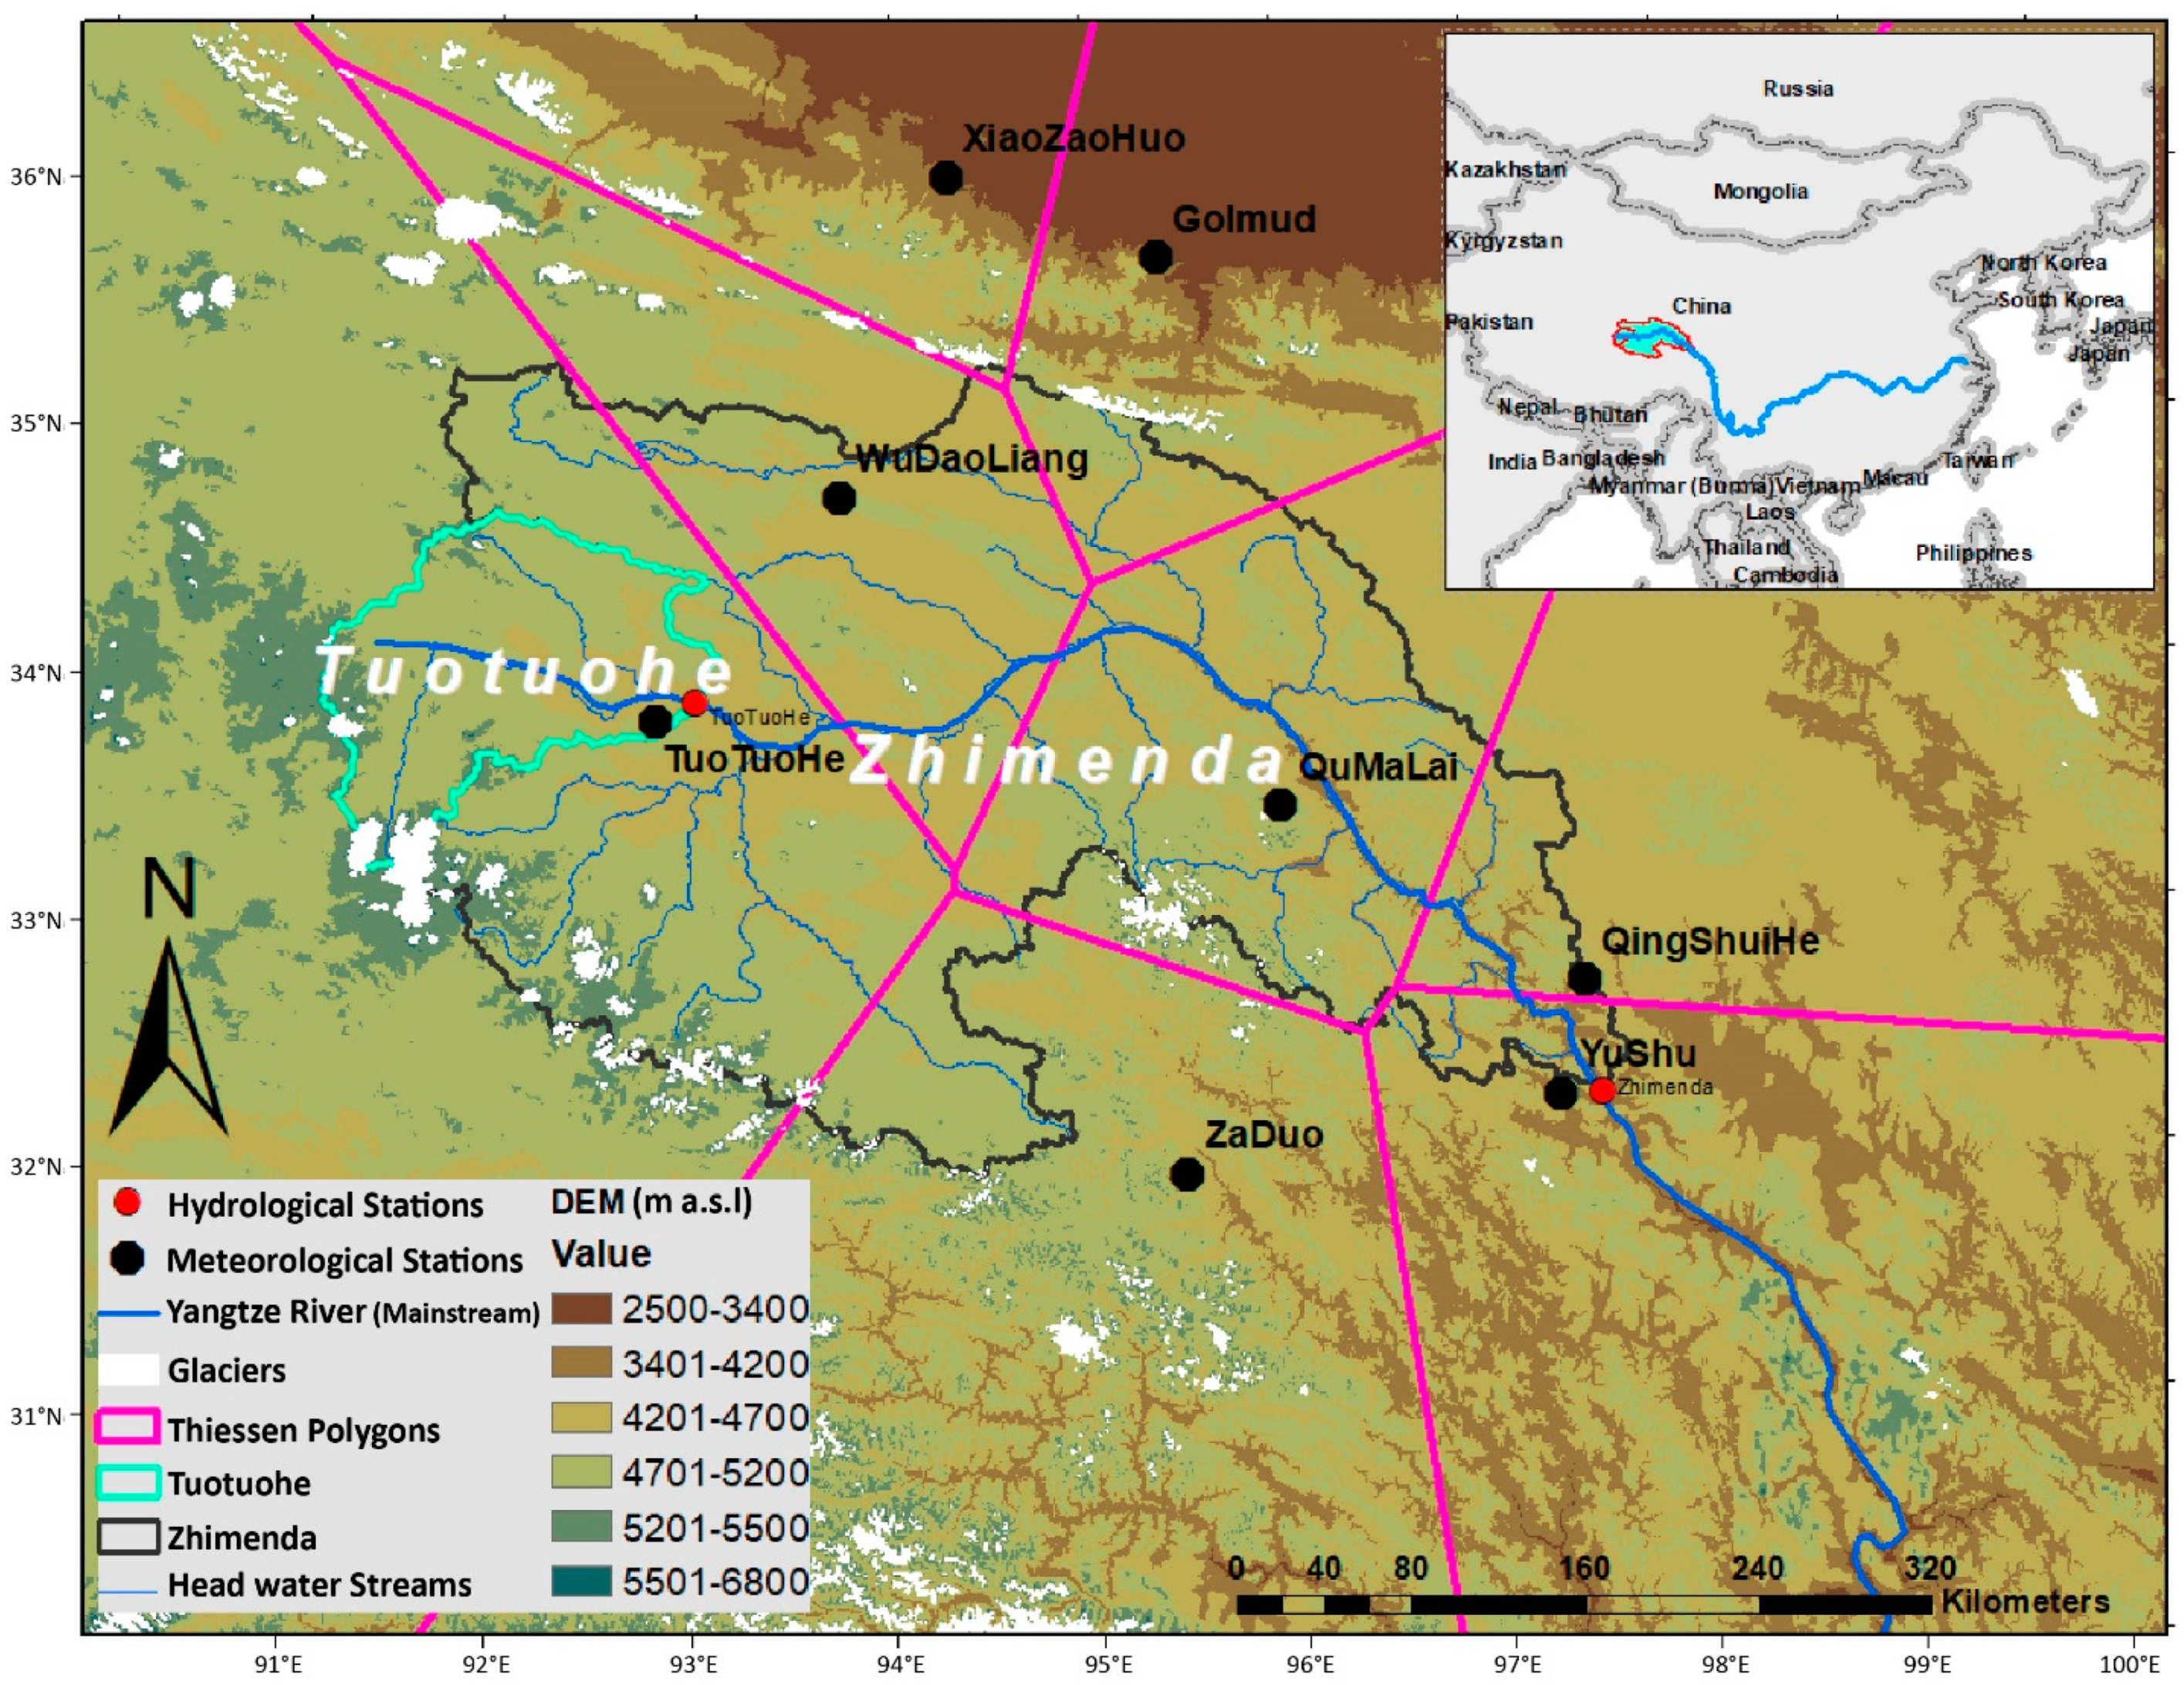
At over 6300 km long, the Yangtze River (Changjiang) is the largest and longest river in China and the third-longest river in the world. The headwaters of the Yangtze River (HWYZ) are situated to the west of the 6621 m a.s.l high Geladandong Mountain, the principal peak of the Tanggula Mountain chain on the Qinghai–Tibetan Plateau (QTP), southwest of China (Figure 1). The river flows from west to east through the provinces of Qinghai, Tibet, Sichuan, Yunnan, Hubei, Hunan, Jiangxi, Anhui, and Jiangsu as well as the city of Shanghai, finally reaching the East China Sea. HWYZ, longitude 90°30′ E–97°15′ E, latitude 32°30′ N, and 35°50′ N, is located in the center of QTP and covers an area of about 135,700 km2 [26]. It is divided into Tuotuohe and Zhimenda sub-basins. The HWYZ covers about 17% of the area of QTP and contributes to 20% of the total water volume of the Yangtze River [27]. HWYZ is the world’s highest major river basin at an average height of 4754 m (Figure 1). There are about 753 glaciers in the HWYZ [28], and their water equivalent is approximately 887.5 × 10⁸ m3, which is five-times the annual flow at the Zhimenda hydrological station [29]. The Tuotuohe River is the starting point of the Yangtze River, and ultimately, it converges into the Dangqu River. Swampy land, permafrost, and lakes are widely distributed in the area [30,31,32,33,34]. The maximum and minimum temperatures had positive trends in the Yangtze River basin during 1960–2002 [15]. Daily temperature, precipitation, and monthly streamflow data from 1961–2015 were obtained from the China Meteorological Administration and the Yangtze River Authority, respectively (Figure 1).
2.2. Methodology
The modified Mann–Kendall (MMK) test [35,36] and Sen’s estimator [37] were used for trend analysis and slope detection, respectively, while the pre-whitening was applied to detect the auto-correlation in the time series [38]. The MMK, a non-parametric trend analysis test, was used for the trend analysis of temperature, precipitation, and streamflow. This method has been commonly used in different river basins across the world, including the Colorado River Basin [39], the Calabria region in Southern Italy [40], and the Komadougu-Yobe basin in West Africa [41]. The Pettitt test [42] is a ranked-based test used for the detection of changes in the mean of time series when there is no clear and exact change point identifiable. The Pettitt test has been widely used for the detection of discontinuities in hydro-climatic time series [38,43,44].
Wavelet analysis is mostly used for signal processing [23,45] and is used in this study for the analysis of periodicity. This method is better compared to traditional Fourier transformation and is also a more powerful signal processing tool. The Morlet wavelet function was used in this study, which is an effective method to identify the dominant periodic behavior in the time series [25]. This method represents the detailed features of the time series due to its narrowly shaped frequency domain and relatively widely developed time domain. Further details about the application of wavelet methods in hydrology are available, for instance, in Torrence and Compo [46]. A multivariate correlation analysis was also carried out to find relations among temperature, precipitation, and streamflow time series for each sub-basin in HWYZ during 1961–2015.
3. Results and Discussion
3.1. Annual Trend Analysis
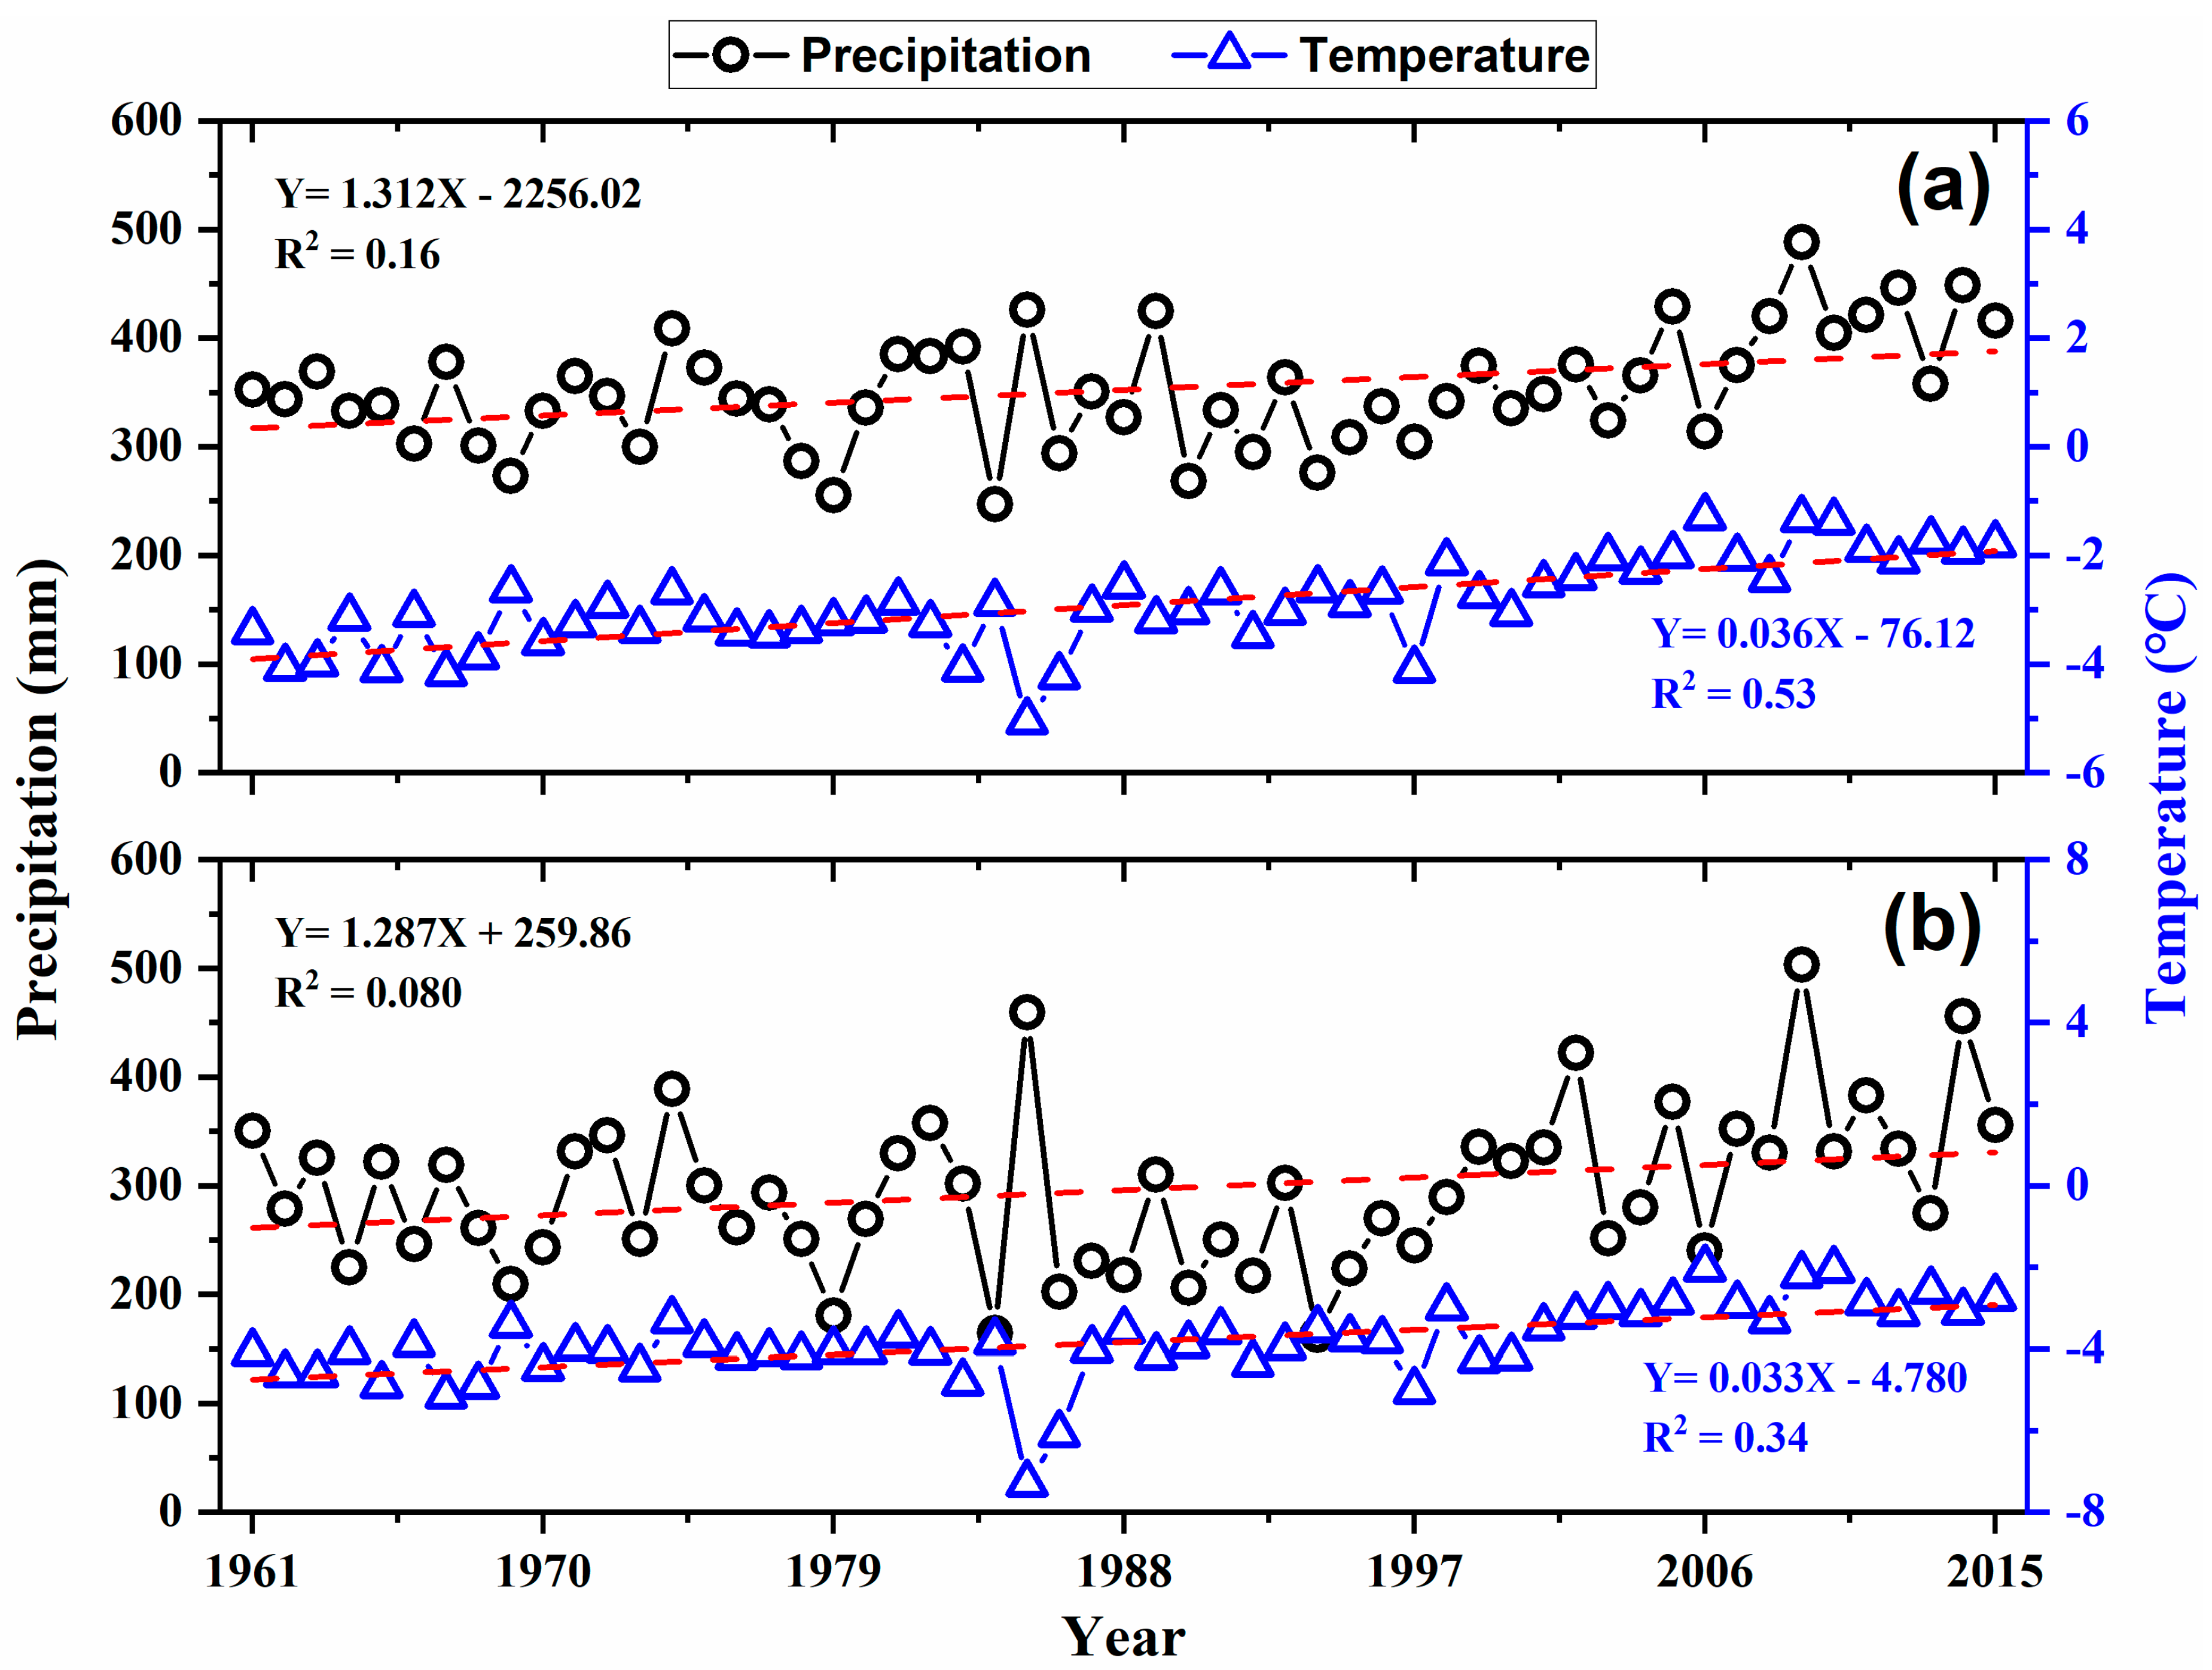
The mean annual areal averaged precipitation and temperature for the Zhimenda and Tuotuohe sub-basins are shown in Figure 2. The Thiessen polygon method was used to calculate the areal mean averaged precipitation and temperature for each sub-basin. The precipitation and temperature significantly increased in the whole study area. The precipitation has an increasing trend of 1.2 mm year−1, and the temperature increased by 0.03 °C year−1 for both sub-basins. Figure 2 shows that on short time scales, temperature and precipitation are negatively correlated, which is consistent with other studies of short-term climate variations. On longer scales, they are positively correlated. The mean, maximum, and minimum temperature, precipitation, and streamflow are presented in Table 1 and Table 2.
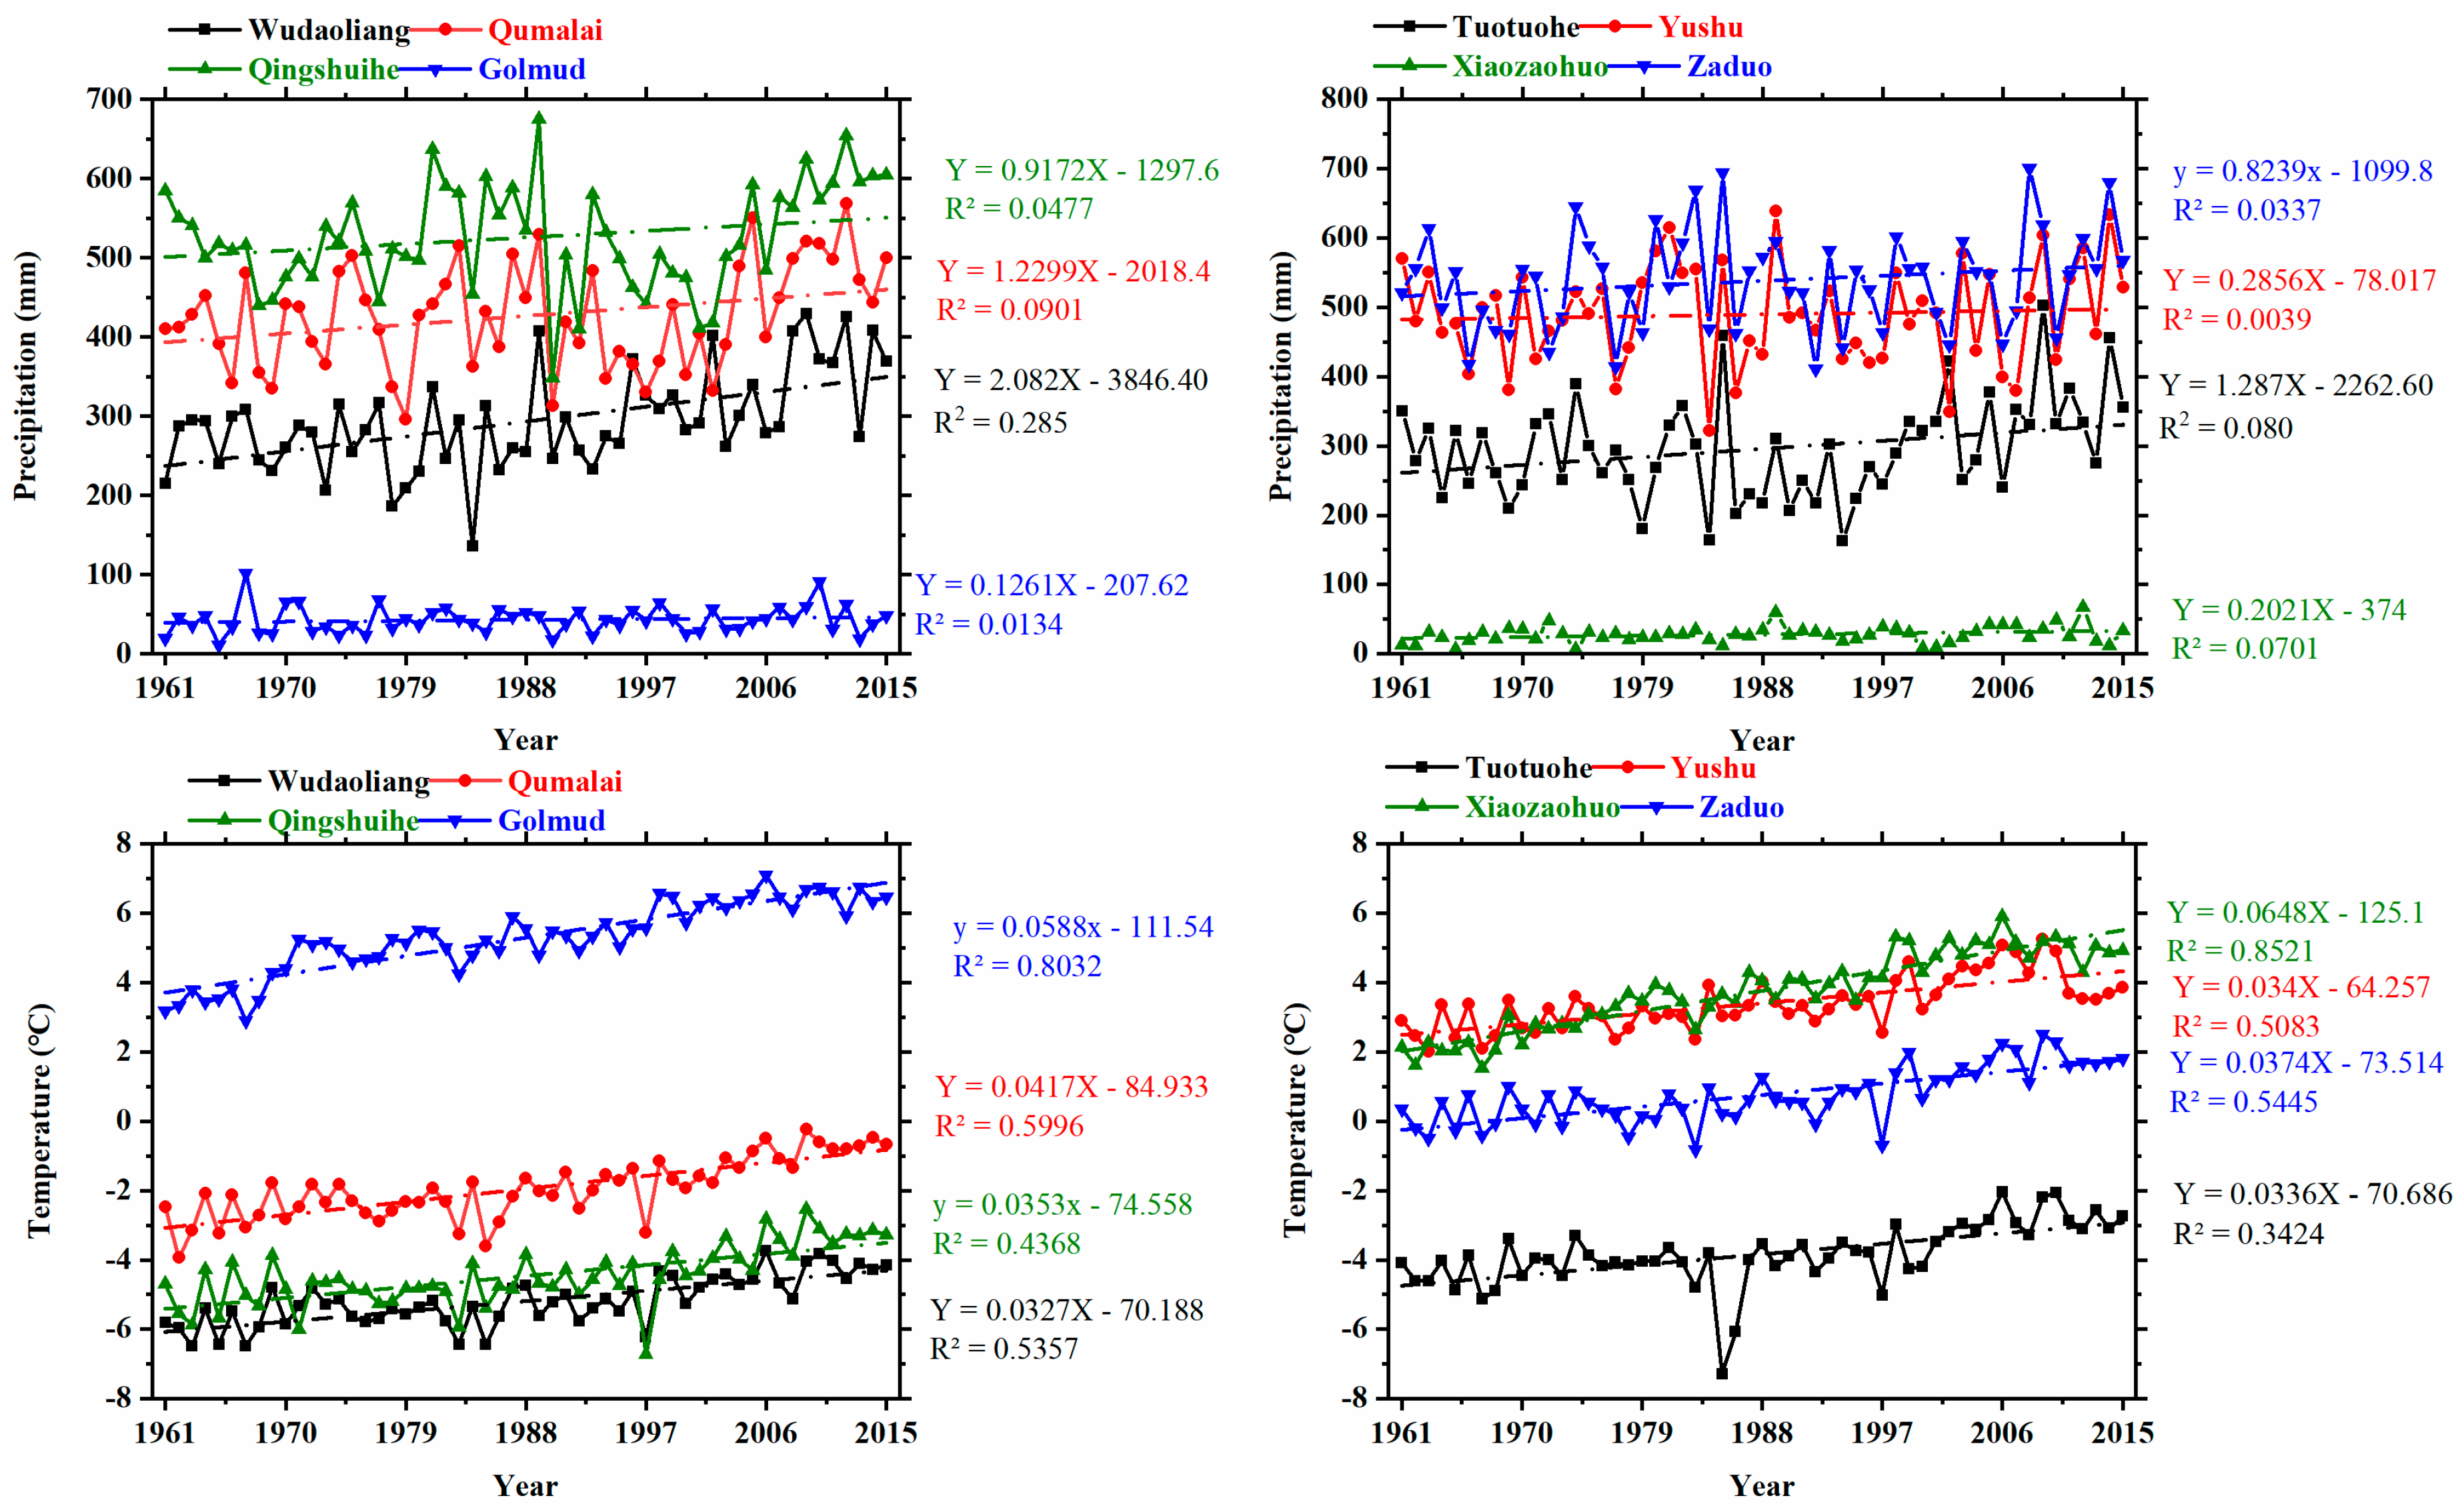
Figure 3 presents the linear trends for each station in HWYZ during 1961–2015 for temperature and precipitation. Temperature and precipitation increased for all stations during the study period, as shown in this figure. The magnitude of the linear trends and modified Mann–Kendall test statistics are presented in Table 3. The temperature significantly increased for all stations during 1961–2015, whereas seven stations showed significantly increasing precipitation trends, and only for one station (Yushu) was a non-significantly increasing trend found. Stations located at higher elevations experienced a more substantial increase as compared to stations situated at lower elevations. The greatest precipitation trend was observed at Wudaoliang (3.79 mm decade−1), followed by Qumalai (2 mm decade−1).
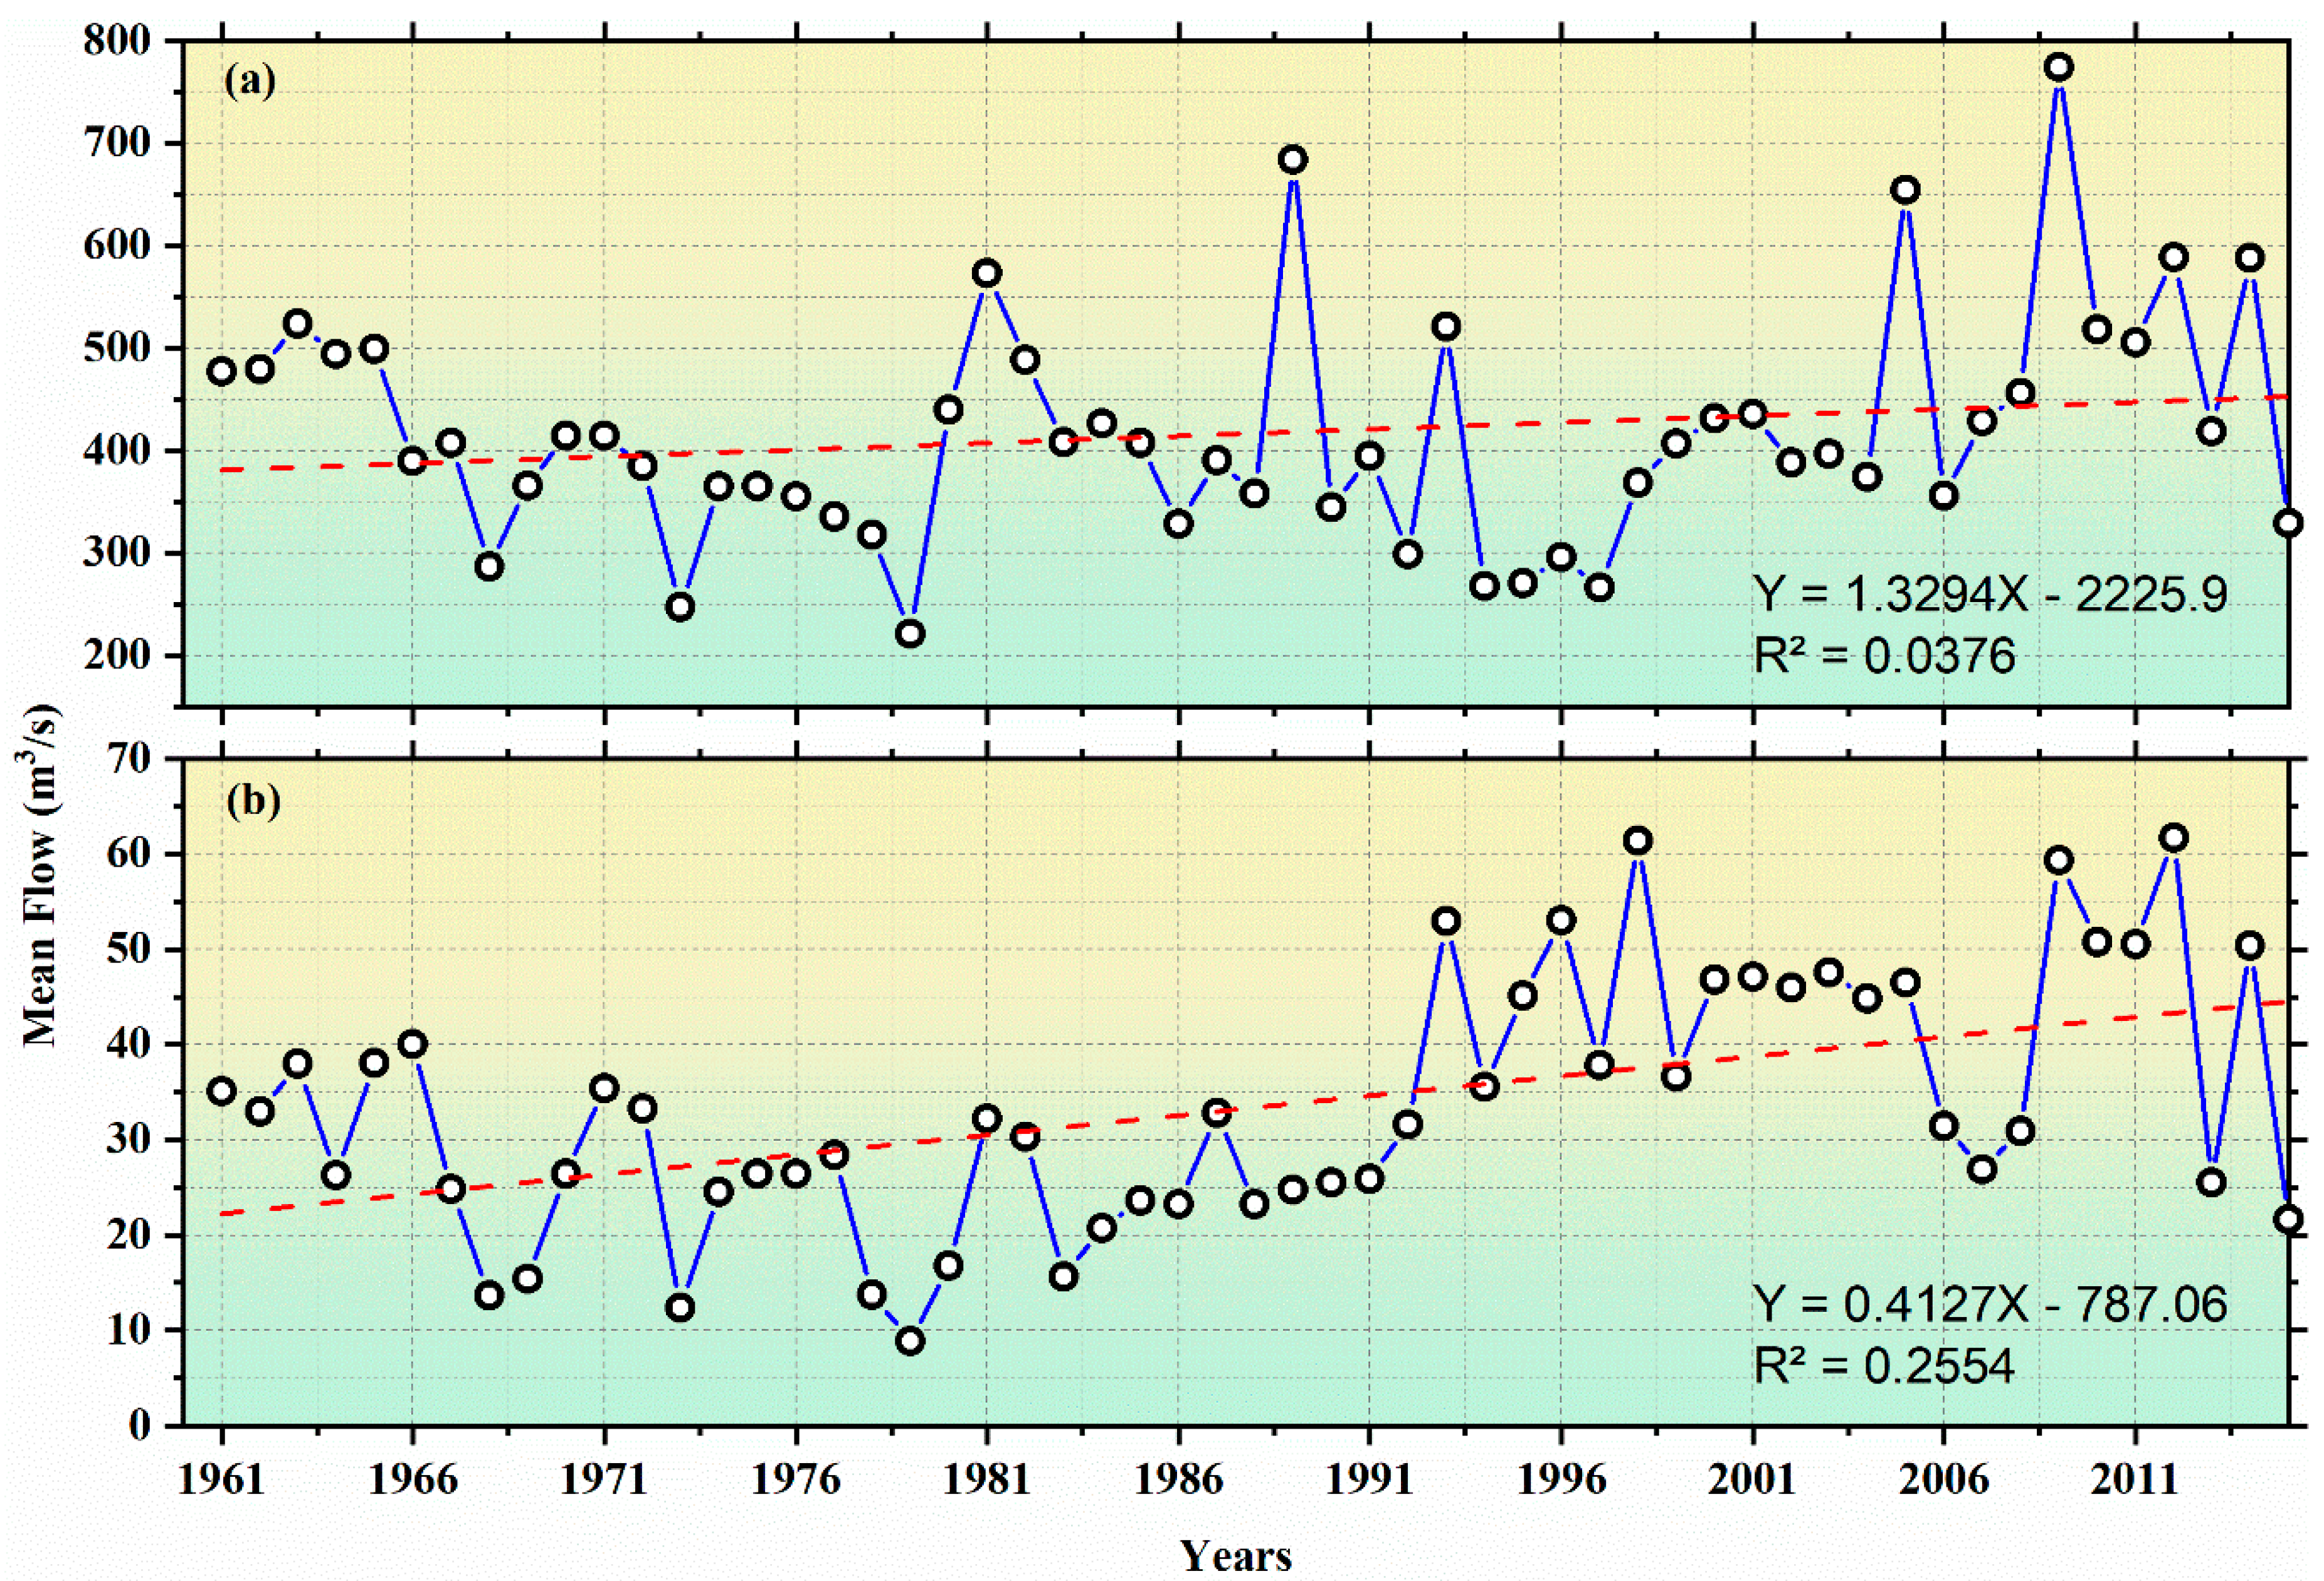
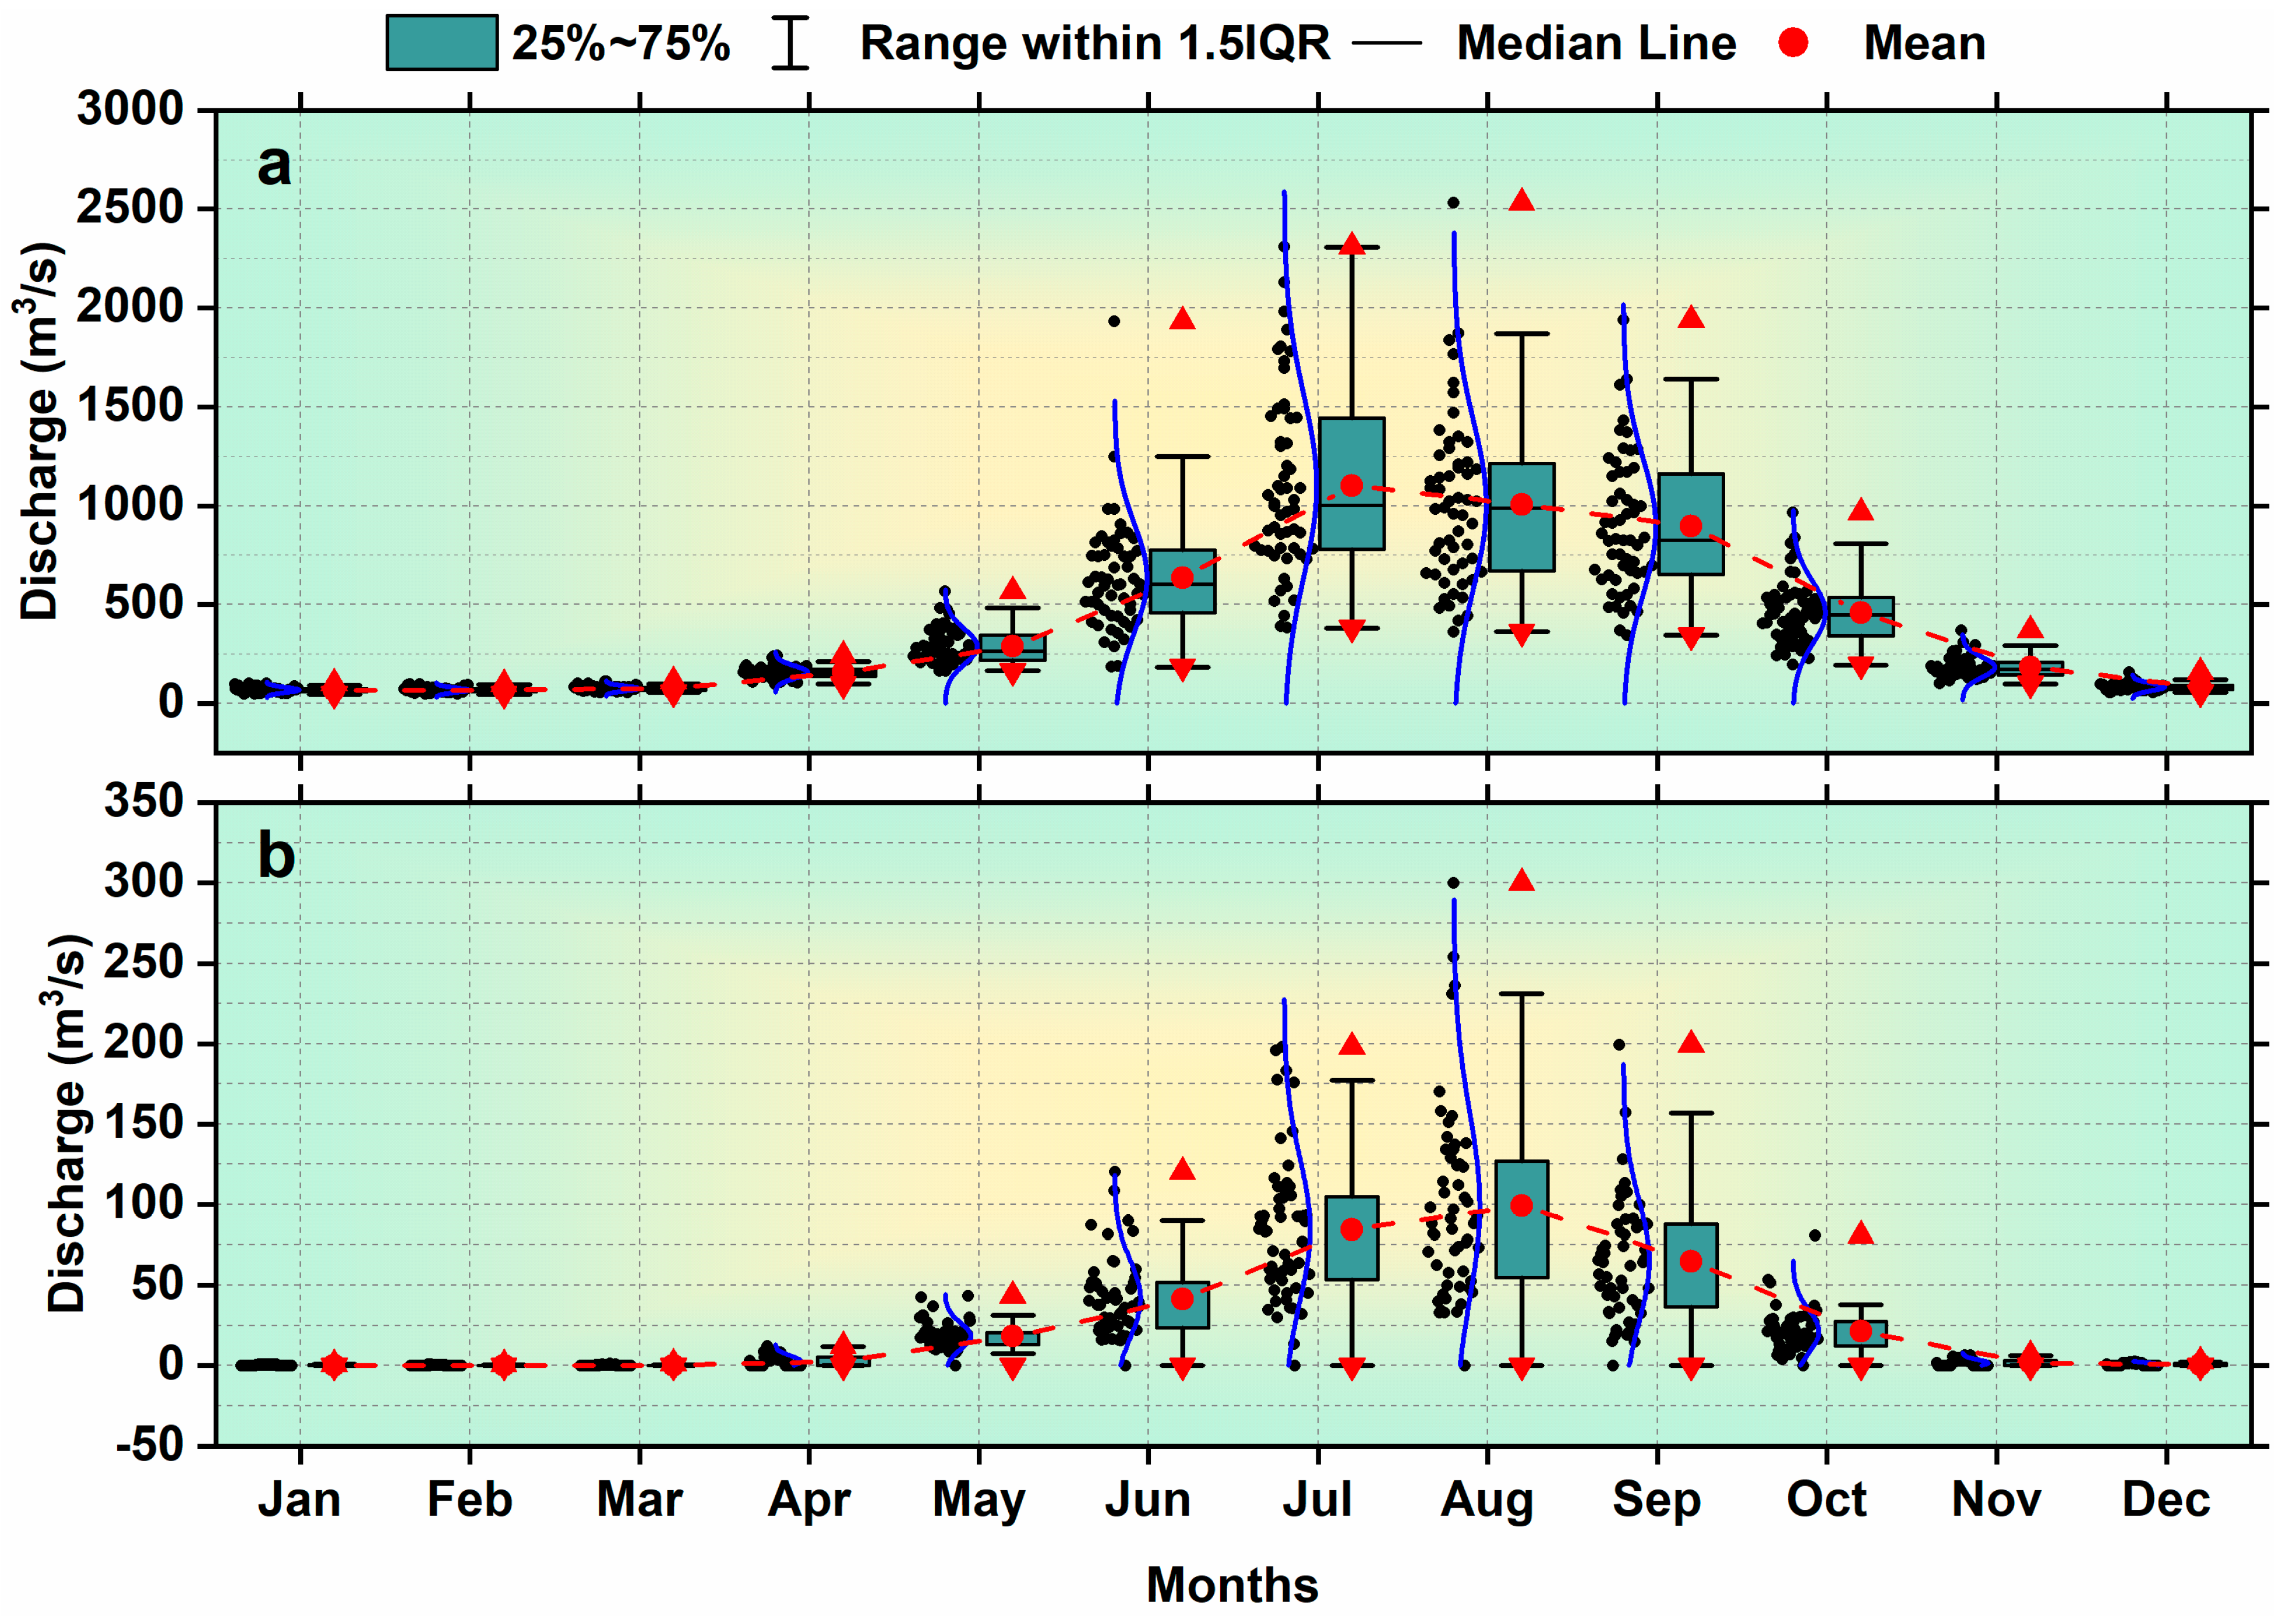
The annual streamflow for the Tuotuohe and Zhimenda stations is presented in Figure 4 for 1961–2015. A linear trend shows that streamflows increased for both sub-basins. The results of the linear and modified Mann–Kendall trend test statistics for the streamflow of Tuotuohe and Zhimenda are presented in Table 4. The sreamflow for both stations had an insignificant increasing trend at a 0.05 confidence level. The monthly streamflow for Zhimenda and Tuotuohe sub-basins showed that maximum flows were recorded during July and August, respectively (Figure 5). The monthly streamflow pattern shows a gradual increase from May to July and August and gradually decreases afterward. During the summer months (June–August), maximum streamflows were recorded during 2005 (2533 m3/s) in August, whereas the lowest were in June 1979 (184 m3/s) for the Zhimenda sub-basin. The Tuotuohe sub-basin recorded the maximum streamflow during August 2002 (300 m3/s), whereas the lowest was during July 1979 (13.5 m3/s). The lowest streamflow was observed during the month of February 1997 (46.10 m3/s) for the Zhimenda sub-basin, and for the whole winter season for the Tuotuohe sub-basin (December–February), there is no streamflow. This is because of the topographical location of this sub-basin. Even though there is an increase in the trend of annual streamflow, the monthly variability shows a unimodal pattern of streamflow; i.e., from June to October. This also coincides with the months of the highest precipitation.
3.2. Change Point Analysis and Seasonal Variations
The annual precipitation, temperature, and streamflow during 1961–2015 for Tuotuohe and Zhimenda sub-basins in the HWYZ were used to specify the year in which a change point was likely to exist [47]. The discontinuity in the annual time series of temperature, precipitation, and streamflow was detected using Pettitt’s test. This test identifies the location of the change point in the time series. The results of the change point analysis are presented in Table 5. For the Tuotuohe sub-basin, the change points in the temperature time series, precipitation time series, and streamflow series occurred in 2000, 1998, and 1991, respectively, all at a 95% confidence level. For Zhimenda, change points in temperature, precipitation, and streamflow series occurred in 1997, 1998, and 2004, respectively. The mean annual temperature for the Tuotuohe sub-basin is −4.22 °C from 1961–2000 and −3.0 °C during 2001–2015, and the annual precipitation is 273.47 mm during 1961–1998 and 346.02 mm during 1999–2015. For the Zhimenda sub-basin, the mean annual temperature during 1961–1997 was −3.21 °C, and −1.92 °C during 1998–2015, and precipitation was 335.14 mm during 1961–1998 and 390.74 mm during 1999–2015.
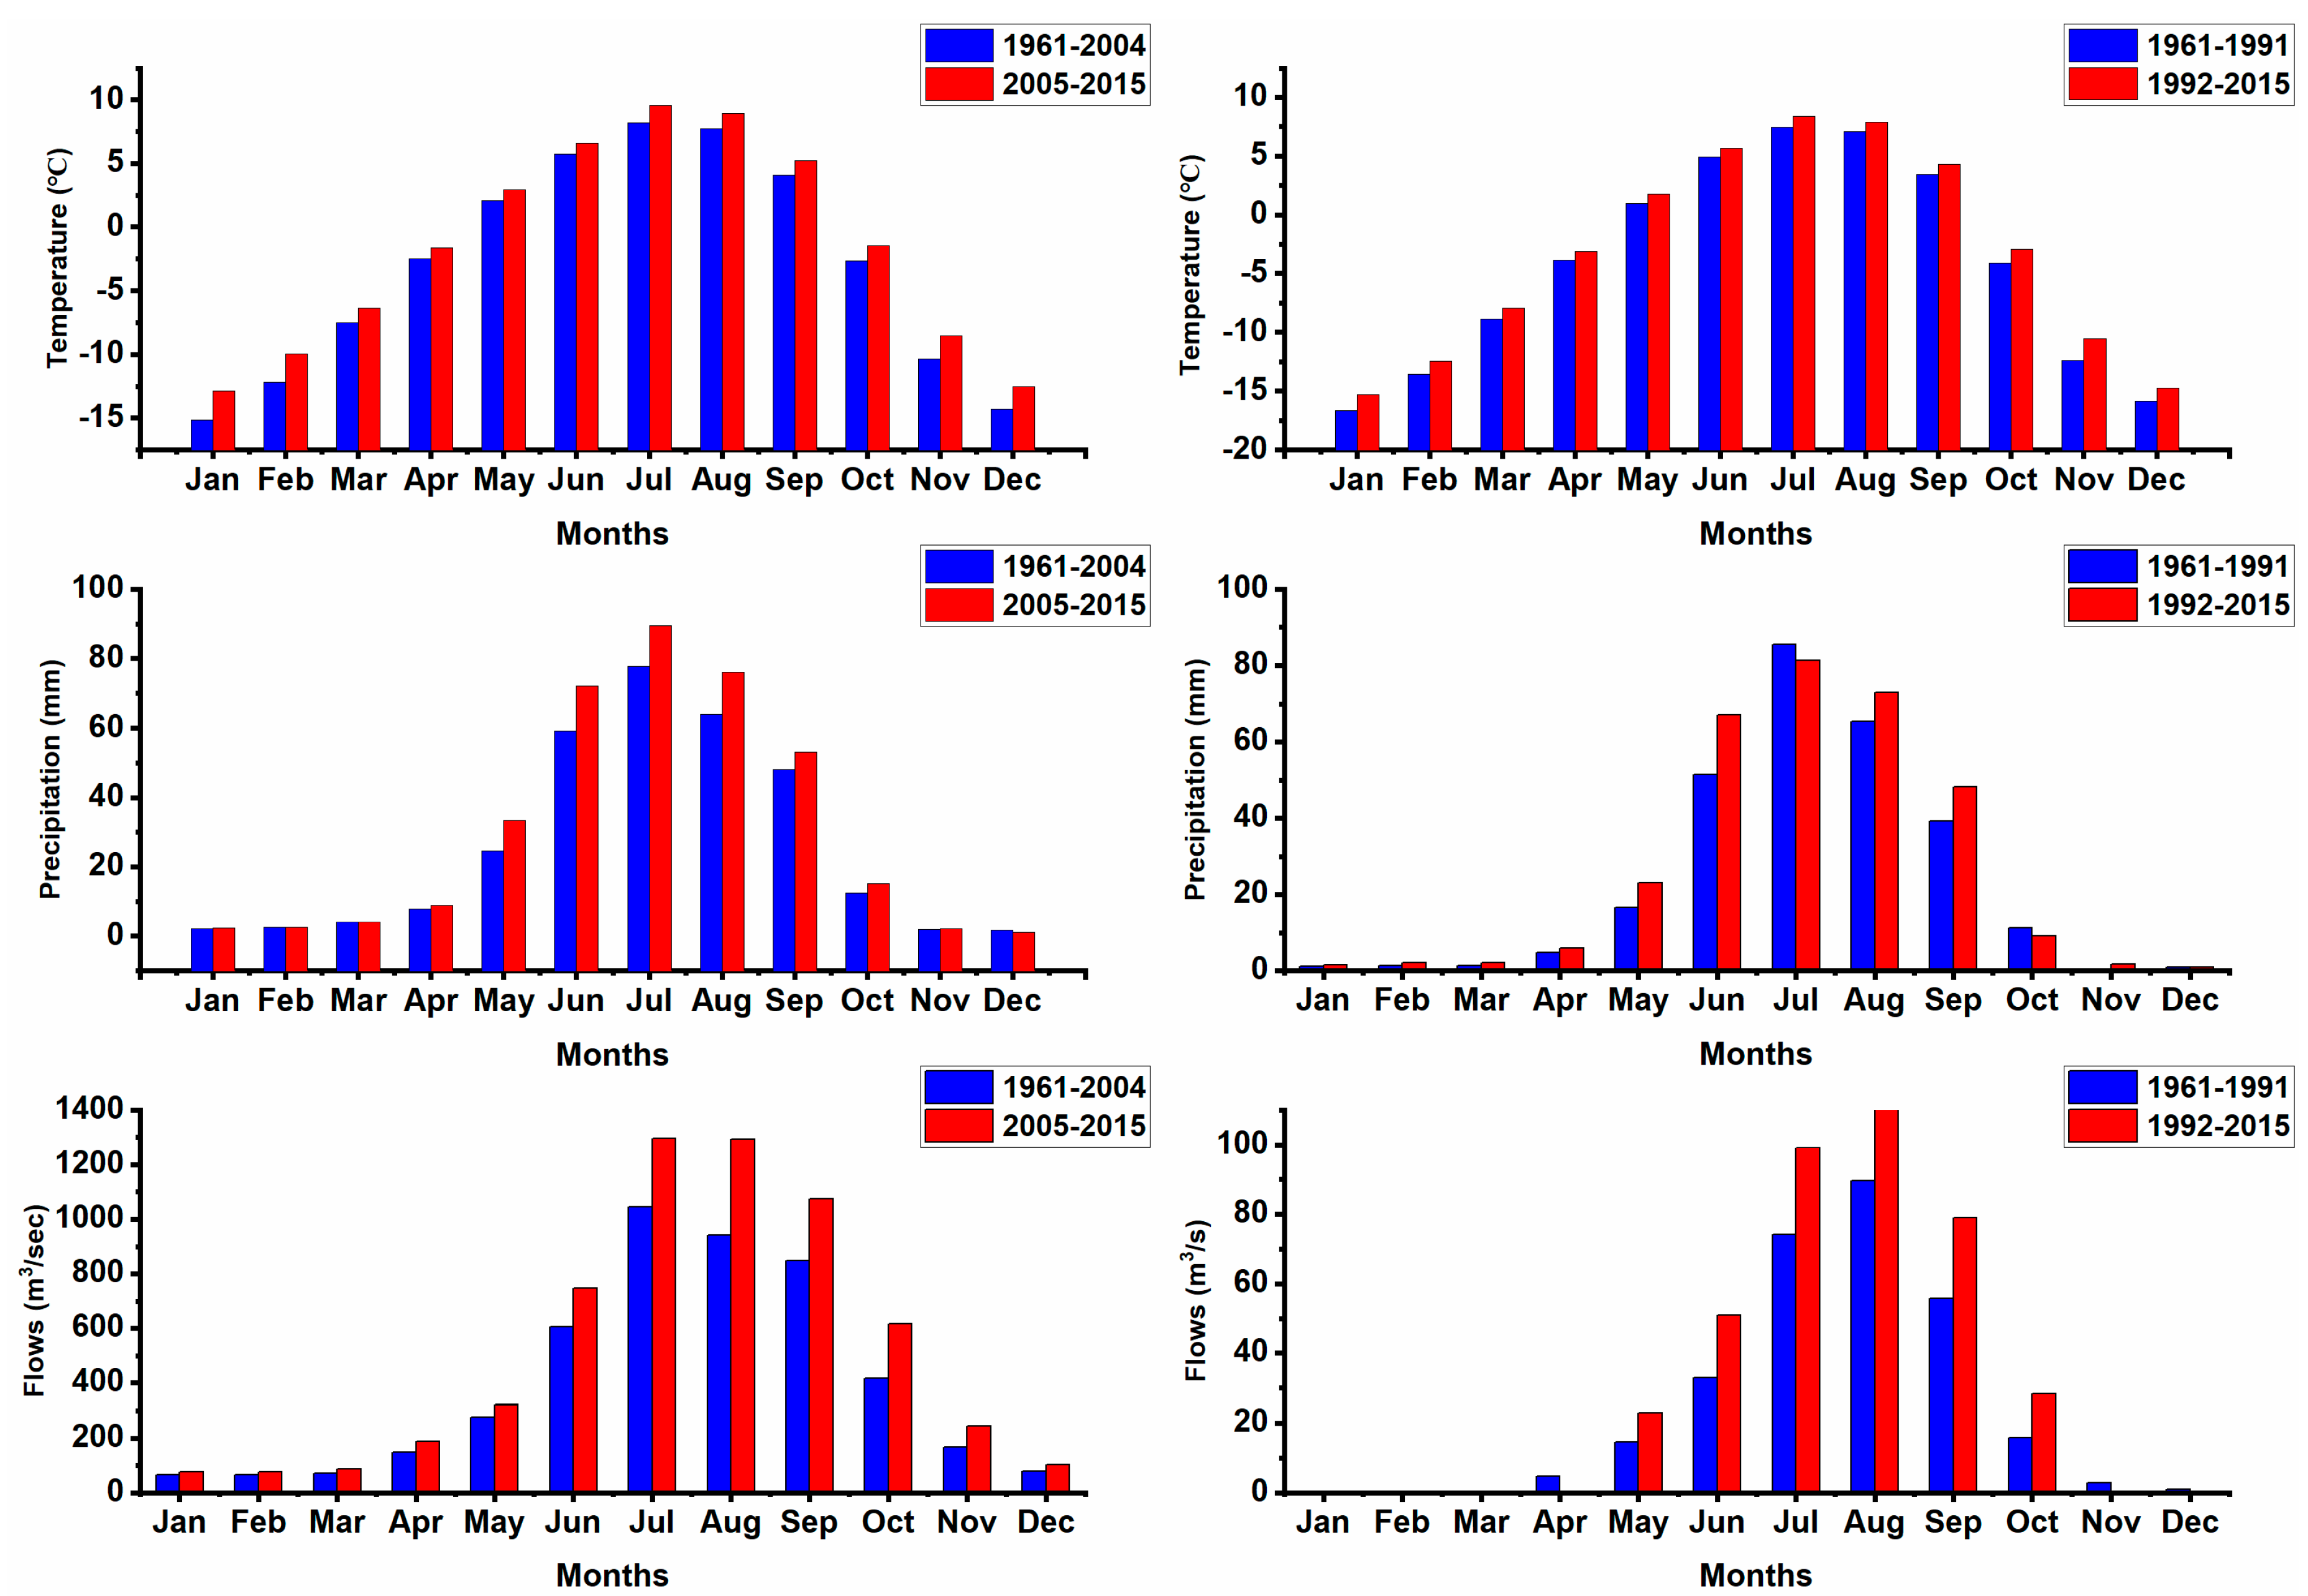
It is evident in Table 5 that the change points for temperature and streamflow time series are different for the Tuotuohe and Zhimenda sub-basins, while precipitation showed the same change point year of 1998 for both sub-basins. Temperature and precipitation are an integral part of the hydrological system, acting as spatial and temporal integrator over the sub-basins. Streamflow records can serve as an index of the inter-annual hydro-climatic variability at the regional scale. Therefore, the data were divided into two different periods based on the change point in streamflow for the Tuotuohe sub-basin, averaged for 1961–1991 and 1992–2015, as presented in Figure 6 (right panels).
The monthly temperature, precipitation, and streamflow for the Tuotuohe sub-basin for 1961–1991 and 1992–2015 are presented in Figure 6. The division of data into two periods is justified because the temperature and precipitation increased after the change point in the year 1991, which ultimately increased the flows from 1992–2015 as compared to 1961–1991. The temperature from January to July increased and gradually decreased for the rest of the months. During the dry season (October to March), the highest increase in temperature was found in November 1992–2015 as compared to 1961–2015. Precipitation decreased in July, which is the monsoon period, and also reduced in October from 1992–2015 as compared to 1961–2015. The streamflow in the Tuotuohe sub-basin increased from May to October; the most significant positive change in flows was found in August, followed by July and September. This means that an increase in temperature will impact the melting of glaciers and snowmelt runoff in the Tuotuohe sub-basin and, with a rise in precipitation, increase the flows for the Tuotuohe sub-basin.
The monthly temperature, precipitation, and streamflow for the Zhimenda sub-basin during 1961–2004 and 2005–2015 are shown in Figure 6 (left panels). During 2005–2015, temperature, precipitation, and streamflow increased as compared to 1961–2004. The temperature from January to July increased, and after July it started to decrease. During 1961–2004, the highest temperature was observed in July (8.20 °C) followed by August (7.72 °C), while during 2005–2015, the temperature increased by 1.20 °C and 1.10 °C, respectively, in these months. A lower temperature during 1961–2004 occurred from October to April (dry season). However, the lowest temperature was recorded during January and February, at −15.14 °C and −12.18 °C in the period 1961–2004. During 2005–2015, the temperature in these months increased by 2.26 °C and 2.24 °C. This was the highest change observed in monthly temperature during 2005–2015. The highest precipitation amounts of 89.43 mm and 76.01 mm during 1961–2004 were recorded in July and August, although during 2005–2015, these values was increased to 89.43 mm and 76.01 mm, respectively. July and August received 11.63 mm and 12.04 mm more precipitation during 2005–2015 as compared to 1961–2004. Eventually, the increase in temperature and precipitation impacted the flows. July and August recorded the highest monthly flows of 1044.35 m3 s−1 and 942.01 m3 s−1 during 1961–2004 and 1296 m3 s−1 and 1294 m3 s−1 during 2005–2015. These variations show that the increase in temperature, by melting glaciers and snow, impacted runoff in the Zhimenda sub-basin. Combined with the addition of precipitation, the result is higher flows in all months at the Zhimenda station.
3.3. Precipitation, Temperature, and Streamflows Periodicity Features for Each Sub-Basin
Annual time series of precipitation, temperature, and streamflow were evaluated based on the wavelet analysis, and results are presented in Figure 7, Figure 8 and Figure 9, respectively, for each sub-basin. From Figure 7, significant periodicities for 2 to 4 years for the Zhimenda sub-basin occurred during 1966–1976 and 2000–2012 and for Tuotuohe sub-basin during 1970–1977 and 1999–2012. Intense 6–10 years periodicities were found during 1973–1986 and 1977–1992 for Zhimenda and Tuotuohe sub-basins, respectively.
Regarding the annual temperature, the Zhimenda sub-basin showed 1–3 year periodicities for 1965–1973 and parts of 1980–2010, whereas 6–10 year periodicities were found during 1980–1990, as shown in Figure 8. For the Tuotuohe sub-basin, during 1965–1973 and 1978–2012, periodicities of 2 to 4 years were observed, while during 1982–1993, a periodicity of 8–16 years was found.
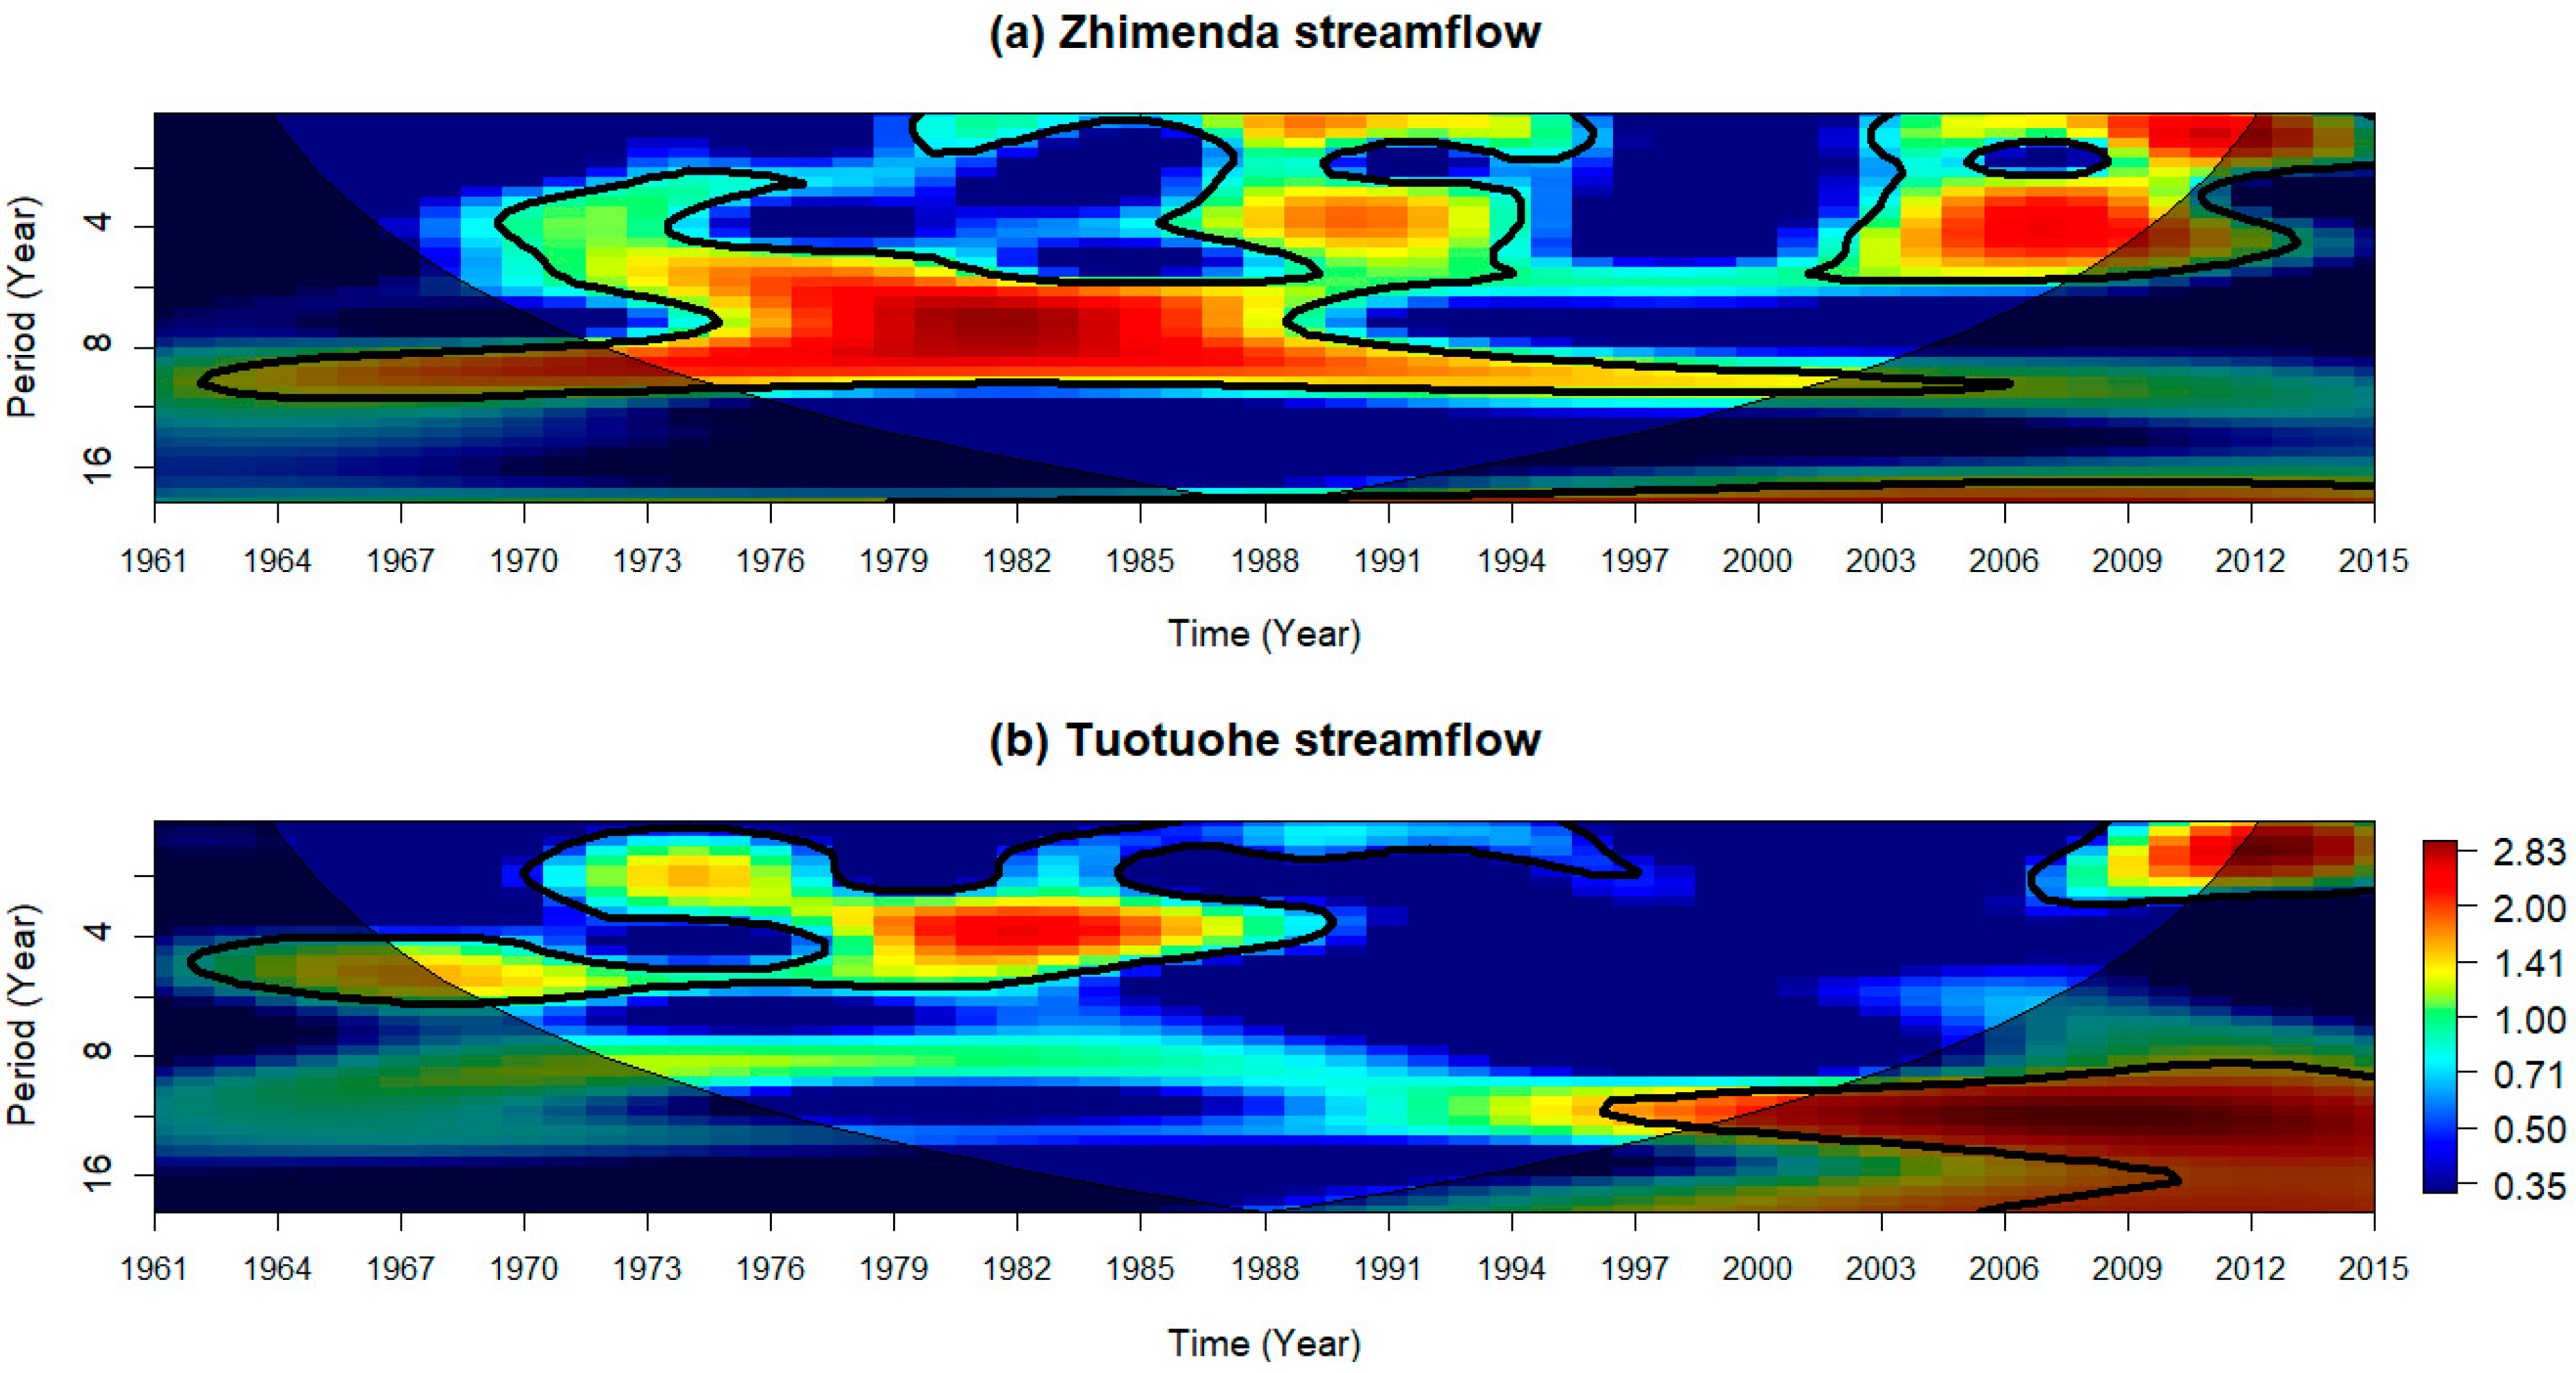
Dominant streamflow periodicities are presented in Figure 9 for each station. There are 2–4 year periodicities from 1970–1976, 1984–1994, and 2003–2012, showing a high intensity found from 2004 onwards, as this is the change year for streamflow for the Zhimenda station. High flow periodicities of 6–10 years were also observed from 1974–1990. For Tuotuohe station, 2–6 year periodicities were found during 1970–1990 and high flow periodicities with longer periods after 1994, which is the change point for this station.
3.4. Water Balance for Each Sub-Basin
Streamflow in the headwaters of the Yangtze River is affected by climate change and the significant spatial variations in the headwaters of the Yangtze River. The water balances for each sub-basin were analyzed to better understand and explore the hydrological behavior in the sub-basins. The results of the MMK test statistics for areal mean precipitation and temperature in each sub-basin are presented in Table 6. The temperature significantly increased for all seasons for both sub-basins and dramatically increased at an annual scale in the Zhimenda sub-basin. Precipitation increased significantly for all seasons for Tuotuohe sub-basin, whereas annual significance was observed in both sub-basins.
The correlation between annual streamflow and annual areal mean temperature and precipitation for Tuotuohe and Zhimenda stations is shown in Table 7. Streamflow for both stations is positively correlated with both temperature and precipitation, although values are higher for temperature. Moreover, a larger correlation difference is found for the most upstream sub-basin (Tuotuohe sub-basin). This suggests that changes in temperature are more important in upstream regions of HWYZ because of the melting of glaciers and seasonally frozen ground in this region.
3.5. Discussion
The results of the modified Mann–Kendall test revealed that the climate of HWYZ became warmer in the period 1961–2015. The annual and seasonal temperatures show positive trends with the highest increase in autumn. These findings are in agreement with Su et al. [15], Yang et al. [16], and Kang et al. [48]. Most of the trends were significant, which showed consistency in results with Qi and Wang [49]. Yao et al. [50] reported that temperature increases during the summer season as compared to the winter season, whereas in our study, significantly increasing trends and magnitudes were larger during autumn season for both sub-basins. Berg et al. [51] confirmed that, in autumn seasons, a temperature increase is attributed to the process of drying soil. However, this is reversed in dry months. Berg et al. [51] and Adeyeri et al. [52] confirmed that moisture availability influences the precipitation intensity during the warm season rather than the atmospheric moisture storage capacity. The seasonal analysis findings are consistent with previous research on climate change in the Qinghai Tibetan Plateau region [53]. This increase in temperature happens mostly in autumn and winter months (October to February), which may reduce the percentage of snowfall and degrade the permafrost. Annual precipitation in the HWYZ during 1961–2015 has continuously increased, which showed consistency with the studies conducted by Zhang et al. [21]. This increase in temperature will alter streamflow as reported by Yuan et al. [25]. Furthermore, Adeyeri et al. [41] and Mouhamed et al. [54] showed that increasing temperature can be caused by an increased ocean–land temperature gradient characterized by the monsoon. Another cause could be the increasing concentration of greenhouse gases in the atmosphere.
Streamflow for both stations is positively correlated with temperature and precipitation. The correlation is higher for temperature as compared to precipitation. Moreover, a higher correlation was found for the upstream Tuotuohe sub-basin. However, the correlation for precipitation is higher for the sub-basin located downstream (Zhimenda sub-basin). This analysis reveals that changes in temperature have more impact in upper regions of HWYZ and result in the melting of glaciers and seasonally frozen ground in this region. Eventually, this implies that in the Tuotuohe sub-basin, the dominant contribution to streamflow is temperature, whereas in Zhimenda sub-basin, the significant contribution is from precipitation.
Wavelet analysis, used to analyze the periodicity in the hydroclimatic variables, showed the severity of droughts with their frequency. A statistically significant 2–4 year periodicity was found for precipitation during 1966–1976 and 2000–2012 for the Zhimenda sub-basin and for the Tuotuohe sub-basin in 1970–1977 and 1999–2012. These results are in agreement with the findings of Qian et al. [24]. Intense 6–10 year periodicities were found during 1973–1986 and 1977–1992 for Zhimenda and Tuotuohe sub-basins, respectively. For annual temperature, Zhimenda sub-basin showed 1–3 year periodicities for 1965–1975 and 1980–2010 and 6–10 year periodicities for high temperatures during 1980–1990. For the Tuotuohe sub-basin, during 1965–1976 and 1978–2012, a periodicity of 2 to 4 years was observed, and during 1982–1993, a high amplitude of temperatures for 8–16 years were found. For streamflows, 3–4 year, 7–8 year, and 42–44 year periodicities were investigated by Liang et al. [55] in the source regions of the Yellow River; among these, 3–4 year periodicities during 1970–2000 and 2002–2015 were also found in the Zhimenda sub-basin. For the Tuotuohe station, 2–6 year periodicities were found for 1970–1991 and high flow periodicities after 1994 to 2015, which indicates that 1994 is the changing year/breakpoint for this station. Besides, there appears to be a common magnitude of periodicities in some years in both basins. This could be attributed to a common cause variation in both variables in the basins; i.e., the variations were predominantly caused by climate variability or human activities [56]. Furthermore, years characterized with high periodicities are mostly associated with a combined effect of a high degree of climate variability and high impact of human activities in a basin [57]. As observed, there are varying degrees of high periodicities in the basin. This is an indication of the combined effect of climate variability and human activities in the basin [56,57].
4. Conclusions
The purpose of this study was to investigate and explore the trends in and linkages between streamflow, temperature, and precipitation for two sub-basins of the headwaters of the Yangtze River (HWYZ) during 1961–2015. Temperature and precipitation significantly increased for each sub-basin. However, the rate of change in temperature was more substantial in Tuotuohe sub-basin as compared to the Zhimenda sub-basin. The streamflow for both sub-basins increased during 2005–2015 due to an increase in temperature and precipitation. In particular, the months of July and August recorded higher flows, which was the result of an increase in precipitation during these months. Wavelet analysis enabled the analysis of long-term time-series of streamflow and revealed multi-time scale structures, change points, and changes in and distributions of periodic variations for different time scales of the streamflow series. A significant periodicity of 2–4 years was observed in precipitation, temperature, and streamflow for both sub-basins; however, these periodical variations did not occur in the same years. For streamflow, high periodical variations were observed for Tuotuohe and Zhimenda sub-basins after 1991 and 2004, respectively, which indicates that these are the change points of trends in flows for corresponding sub-basins. The periodicity analysis examined the dynamic link between streamflow and climate variability in the headwaters of the Yangtze River. This improved the understanding of the dynamics of the hydrological cycle. The influence of temperature on streamflow is more significant than that of precipitation in the Tuotuohe sub-basin, which will ultimately impact the melting of glaciers and snowmelt runoff in the Tuotuohe sub-basin. On the other hand, precipitation has a more significant role in the Zhimenda streamflow as compared to temperature. Hydroclimatic variability in the headwaters of the Yangtze River impacts downstream water fluctuations and power generation, and insights from this study could therefore be valuable for water resource planning and management in the Yangtze River basin.
Author Contributions
N.A. designed the research, highlighted the problem, formulated the research plan. N.A., A.O. and S.M. analyzed the data. G.W., M.J.B. helped in interpretation of results and supervised the study. G.W. also provide the financial resources and also supervised this study. Original draft was written by N.A. whereas; G.W., M.Z.-u.-R.H. and S.A. review the draft paper. N.A., G.W. and M.J.B. finalize the research paper. All authors confirm the final version of paper for submission to journal. All authors have read and agreed to the published version of the manuscript.
Funding
This work was supported by the Major Research Plan of the National Natural Science Foundation of China (91547203) and the Strategic Priority Research Program of the Chinese Academy of Sciences (Grant No. XDA20050102). The first author would also like to express his sincere gratitude to the Chinese Academy of Sciences and The World Academy of Sciences (CAS-TWAS) for providing fellowship for the doctoral degree (Awardee of 2017, CAS-TWAS President’s Fellowship).
Acknowledgments
This research was conducted in the Key Laboratory of Mountain Surface Process and Ecological Regulations, Institute of Mountain Hazards and Environment, Chinse Academy of Sciences, Chengdu, Sichuan, China. Authors are very thankful to China Meteorological Administrations (CMA) for sharing data used in this study.
Conflicts of Interest
The authos declare no conflict of interest.
References
- Liu, X.; Chen, B. Climatic warming in the Tibetan Plateau during recent decades. Int. J. Climatol. 2000, 20, 1729–1742. [Google Scholar] [CrossRef]
- You, Q.; Kang, S.; Pepin, N.; Yan, Y. Relationship between trends in temperature extremes and elevation in the eastern and central Tibetan Plateau, 1961–2005. Geophys. Res. Lett. 2008, 35. [Google Scholar] [CrossRef] [Green Version]
- Wang, G.; Li, Y.; Wu, Q.; Wang, Y. Impacts of Permafrost Changes on Alpine Ecosystem in Qinghai-Tibet Plateau; Springer: Berlin/Heidelberg, Germany, 2006; Volume 49, pp. 1156–1169. [Google Scholar]
- Du, Y.; Berndtsson, R.; An, D.; Zhang, L.; Hao, Z.; Yuan, F. Hydrologic Response of Climate Change in the Source Region of the Yangtze River, Based on Water Balance Analysis. Water 2017, 9, 115. [Google Scholar] [CrossRef] [Green Version]
- Zhou, B.; Liang, C.; Zhao, P.; Dai, Q. Analysis of Precipitation Extremes in the Source Region of the Yangtze River during 1960–2016. Water 2018, 10, 1691. [Google Scholar] [CrossRef] [Green Version]
- Yao, T.; Liu, X.; Wang, N.; Shi, Y. Amplitude of climatic changes in Qinghai-Tibetan Plateau. Chin. Sci. Bull. 2000, 45, 1236–1243. [Google Scholar] [CrossRef]
- Zhang, S.J.; Gan, W.E.; Su, Q.D. Determination of cadmium in tobacco using thermospray-chemical vapor generation-AAS system. Guang Pu Xue Yu Guang Pu Fen Xi Guang Pu 2008, 28, 678–680. [Google Scholar] [PubMed]
- Guo, D.; Wang, H. The significant climate warming in the northern Tibetan Plateau and its possible causes. Int. J. Climatol. 2012, 32, 1775–1781. [Google Scholar] [CrossRef]
- Cao, J.; Qin, D.; Kang, E.; Li, Y. River discharge changes in the Qinghai-Tibet Plateau. Chin. Sci. Bull. 2006, 51, 594–600. [Google Scholar] [CrossRef]
- Yang, T.; Shao, Q.; Hao, Z.-C.; Chen, X.; Zhang, Z.; Xu, C.-Y.; Sun, L. Regional frequency analysis and spatio-temporal pattern characterization of rainfall extremes in the Pearl River Basin, China. J. Hydrol. 2010, 380, 386–405. [Google Scholar] [CrossRef]
- Shiyin, L.; Yong, Z.; Yingsong, Z.; Yongjian, D. Estimation of glacier runoff and future trends in the Yangtze River source region, China. J. Glaciol. 2009, 55, 353–362. [Google Scholar] [CrossRef] [Green Version]
- Chen, X.; Zong, Y.; Zhang, E.; Xu, J.; Li, S. Human impacts on the Changjiang (Yangtze) River basin, China, with special reference to the impacts on the dry season water discharges into the sea. Geomorphology 2001, 41, 111–123. [Google Scholar] [CrossRef]
- Woo, M.-K.; Long, T.-Y.; Thorne, R. Simulating monthly streamflow for the Upper Changjiang, China, under climatic change scenarios / Simulation du débit mensuel du Haut Changjiang, en Chine, sous des scénarios de changement climatique. Hydrol. Sci. J. 2009, 54, 596–605. [Google Scholar] [CrossRef]
- Xu, Y.; Xu, C.; Gao, X.; Luo, Y. Projected changes in temperature and precipitation extremes over the Yangtze River Basin of China in the 21st century. Quat. Int. 2009, 208, 44–52. [Google Scholar] [CrossRef]
- Su, B.D.; Jiang, T.; Jin, W.B. Recent trends in observed temperature and precipitation extremes in the Yangtze River basin, China. Theor. Appl. Climatol. 2006, 83, 139–151. [Google Scholar] [CrossRef]
- Yang, J.; Ding, Y.; Chen, R. Climatic causes of ecological and environmental variations in the source regions of the Yangtze and Yellow Rivers of China. Environ. Geol. 2007, 53, 113–121. [Google Scholar] [CrossRef]
- Chen, J.; Li, D.; Meng, Q.; Yong, G. The impact of climatic changes on permafrost degradation in source region of the Yangtze River. In Proceedings of the Geoinformatics 2008 and Joint Conference on GIS and Built Environment: Monitoring and Assessment of Natural Resources and Environments, Guangzhou, China, 3 November 2008; p. 71451T. [Google Scholar] [CrossRef]
- Zhao, G.-J.; Hörmann, G.; Fohrer, N.; Gao, J.-F.; Zhai, J.-Q.; Zhang, Z.-X. Spatial and temporal characteristics of wet spells in the Yangtze River Basin from 1961 to 2003. Theor. Appl. Climatol. 2009, 98, 107–117. [Google Scholar] [CrossRef]
- Huang, J.; Zhang, J.; Zhang, Z.; Sun, S.; Yao, J. Simulation of extreme precipitation indices in the Yangtze River basin by using statistical downscaling method (SDSM). Theor. Appl. Climatol. 2012, 108, 325–343. [Google Scholar] [CrossRef]
- Chen, Y.; Zhang, Q.; Mingzhong, X.; Singh, V.; Leung, Y.; Jiang, L. Precipitation extremes in the Yangtze River Basin, China: Regional frequency and spatial-temporal patterns. Theor. Appl. Climatol. 2013, 116. [Google Scholar] [CrossRef]
- Zhang, Q.; Peng, J.; Xu, C.-Y.; Singh, V. Spatiotemporal variations of precipitation regimes across Yangtze River Basin, China. Theor. Appl. Climatol. 2013, 115. [Google Scholar] [CrossRef]
- Hu, C.; Xu, Y.; Han, L.; Yang, L.; Xu, G. Long-term trends in daily precipitation over the Yangtze River Delta region during 1960–2012, Eastern China. Theor. Appl. Climatol. 2016, 125, 131–147. [Google Scholar] [CrossRef]
- Kuang, C.; Su, P.; Gu, J.; Chen, W.; Zhang, J.; Zhang, W.; Zhang, Y. Multi-time scale analysis of runoff at the Yangtze estuary based on the Morlet Wavelet Transform method. J. Mt. Sci. 2014, 11, 1499–1506. [Google Scholar] [CrossRef]
- Qian, K.; Wang, X.; Lv, J.; Wan, L. The wavelet correlative analysis of climatic impacts on runoff in the source region of Yangtze River, in China. Int. J. Climatol. 2014, 34, 2019–2032. [Google Scholar] [CrossRef]
- Yuan, F.; Berndtsson, R.; Zhang, L.; Uvo, C.B.; Hao, Z.; Wang, X.; Yasuda, H. Hydro climatic trend and periodicity for the source region of the Yellow River. J. Hydrol. Eng. 2015, 20, 05015003. [Google Scholar] [CrossRef]
- Yu, S.G. Research of Sustainable Development in Yangtze River Basin; Beijing Science Press: Beijing, China, 2003. [Google Scholar]
- Mao, T.; Wang, G.; Zhang, T. Impacts of Climatic Change on Hydrological Regime in the Three-River Headwaters Region, China, 1960–2009. Water Resour. Manag. 2016, 30, 115–131. [Google Scholar] [CrossRef]
- Shi, Y.; Liu, C.; Wang, Z.; Liu, S.; Ye, B. Concise Glacier Inventory of China; Shanghai Popular Science Press: Shanghai, China, 2005. [Google Scholar]
- Shi, Y.; Liu, C.; Kang, E. The glacier inventory of China. Ann. Glaciol. 2009, 50, 1–4. [Google Scholar] [CrossRef] [Green Version]
- Fujita, K.; Ageta, Y. Effect of summer accumulation on glacier mass balance on the Tibetan Plateau revealed by mass-balance model. J. Glaciol. 2000, 46, 244–252. [Google Scholar] [CrossRef] [Green Version]
- Wang, G.; Cheng, G. Characteristics of grassland and ecological changes of vegetations in the source regions of Yangtze and Yellow Rivers. J. Desert Res. 2001, 21, 101–107. [Google Scholar]
- Dong, S.; Zhou, C.; Wang, H. Ecological crisis and countermeasures of the Three Rivers Headstream Regions. J. Nat. Resour. 2002, 17, 713–720. [Google Scholar]
- Wang, G.; Li, Y.; Wang, Y.; Shen, Y. Impacts of alpine ecosystem and climate changes on surface runoff in the headwaters of the Yangtze River. J. Glaciol. Geocryol. 2007, 29, 159–168. [Google Scholar]
- Yang, J.; Ding, Y.J.; Chen, R.S.; Shen, Y.P. Permafrost change and its effect on eco-environment in the source regions of the Yangtze and Yellow Rivers. J. Mt. Sci. 2002, 22, 33–39. [Google Scholar]
- Gbode, I.E.; Adeyeri, O.E.; Menang, K.P.; Intsiful, J.D.; Ajayi, V.O.; Omotosho, J.A.; Akinsanola, A.A. Observed changes in climate extremes in Nigeria. Meteorol. Appl. 2019, 26, 642–654. [Google Scholar] [CrossRef] [Green Version]
- Hamed, K.H.; Rao, A.R. A modified Mann-Kendall trend test for autocorrelated data. J. Hydrol. 1998, 204, 182–196. [Google Scholar] [CrossRef]
- Sen, P.K. Estimates of the Regression Coefficient Based on Kendall’s Tau. J. Am. Stat. Assoc. 1968, 63, 1379–1389. [Google Scholar] [CrossRef]
- Adeyeri, O.E.; Lamptey, B.L.; Lawin, A.; Sanda, I.S. Spatio-Temporal Precipitation Trend and Homogeneity Analysis in Komadugu-Yobe Basin, Lake Chad Region. J Climatol. Weather Forecast. 2017, 5. [Google Scholar] [CrossRef]
- Miller, W.P.; Piechota, T.C. Regional Analysis of Trend and Step Changes Observed in Hydroclimatic Variables around the Colorado River Basin. J. Hydrometeorol. 2008, 9, 1020–1034. [Google Scholar] [CrossRef] [Green Version]
- Tommaso, C.; Roberto, C.; Ennio, F.; Marco, M. Trend detection of annual and seasonal rainfall in Calabria (Southern Italy). Int. J. Climatol. 2011, 31, 44–56. [Google Scholar] [CrossRef]
- Adeyeri, O.; Lawin, A.; Laux, P.; Ishola, K.A.; Ige, S.O. Analysis of climate extreme indices over the Komadugu-Yobe basin, Lake Chad region: Past and future occurrences. Weather Clim. Extrem. 2019, 23, 100194. [Google Scholar] [CrossRef]
- Pettitt, A. A non-parametric approach to the change-point problem. J. R. Stat. Soc. Ser. C (Appl. Stat.) 1979, 28, 126–135. [Google Scholar] [CrossRef]
- Moraes, J.M.; Pellegrino, G.Q.; Ballester, M.V.; Martinelli, L.A.; Victoria, R.L.; Krusche, A.V. Trends in hydrological parameters of a southern Brazilian watershed and its relation to human induced changes. Water Resour. Manag. 1998, 12, 295–311. [Google Scholar] [CrossRef]
- Zhang, S.; Lu, X. Hydrological responses to precipitation variation and diverse human activities in a mountainous tributary of the lower Xijiang, China. Catena 2009, 77, 130–142. [Google Scholar] [CrossRef]
- Labat, D. Wavelet analysis of the annual discharge records of the world’s largest rivers. Adv. Water Resour. 2008, 31, 109–117. [Google Scholar] [CrossRef]
- Torrence, C.; Compo, G.P. A practical guide to wavelet analysis. Bull. Am. Meteorol. Soc. 1998, 79, 61–78. [Google Scholar] [CrossRef] [Green Version]
- Yurong, H.; Shreedhar, M.; Stefan, U.; Hongli, Z. Streamflow trends and climate linkages in the source region of the Yellow River, China. Hydrol. Process. 2011, 25, 3399–3411. [Google Scholar] [CrossRef]
- Kang, S.; Zhang, Y.; Qin, D.; Ren, J.; Zhang, Q.; Grigholm, B.; Mayewski, P.A. Recent temperature increase recorded in an ice core in the source region of Yangtze River. Chin. Sci. Bull. 2007, 52, 825–831. [Google Scholar] [CrossRef]
- Qi, L.; Wang, Y. Changes in the Observed Trends in Extreme Temperatures over China around 1990. J. Clim. 2012, 25, 5208–5222. [Google Scholar] [CrossRef]
- Yao, Z.; Liu, Z.; Huang, H.; Liu, G.; Wu, S. Statistical estimation of the impacts of glaciers and climate change on river runoff in the headwaters of the Yangtze River. Quat. Int. 2014, 336, 89–97. [Google Scholar] [CrossRef]
- Berg, P.; Haerter, J.O.; Thejll, P.; Piani, C.; Hagemann, S.; Christensen, J.H. Seasonal characteristics of the relationship between daily precipitation intensity and surface temperature. J. Geophys. Res. Atmos. 2009, 114. [Google Scholar] [CrossRef]
- Adeyeri, O.E.; Laux, P.; Lawin, A.E.; Ige, S.O.; Kunstmann, H. Analysis of hydrometeorological variables over the transboundary Komadugu-Yobe basin, West Africa. J. Water Clim. Chang. 2019. [Google Scholar] [CrossRef]
- Chuan, L.; Tin-jun, Z.; Jing, C. Climatic Change of Qinghai-Xizang Plateau Region in Recent 40-year Reanalysis and Surface Observation Data-Contrast of Observational Data and NCEP, ECMWF Surface Air Temperature and Precipitation. Plateau Meteorol. 2004, 23, 97–103. [Google Scholar]
- Mouhamed, L.; Traore, S.B.; Alhassane, A.; Sarr, B. Evolution of some observed climate extremes in the West African Sahel. Weather Clim. Extrem. 2013, 1, 19–25. [Google Scholar] [CrossRef] [Green Version]
- Liang, S.; Ge, S.; Wan, L.; Zhang, J. Can climate change cause the Yellow River to dry up? Water Resour. Res. 2010, 46. [Google Scholar] [CrossRef]
- Adeyeri, O.E.; Laux, P.; Lawin, A.; Arnault, J. Assessing the impact of human activities and rainfall variability on the river discharge of Komadugou-Yobe Basin, Lake Chad Area. Environ. Earth Sci. 2019, 79, 143. [Google Scholar] [CrossRef]
- Adeyeri, O.E.; Laux, P.; Arnault, J.; Lawin, A.E.; Kunstmann, H. Conceptual hydrological model calibration using multi-objective optimization techniques over the transboundary Komadugu-Yobe basin, Lake Chad Area, West Africa. J. Hydrol. Reg. Stud. 2020, 27, 100655. [Google Scholar] [CrossRef]
Figure 1.
Study area of the headwaters of the Yangtze River (HWYZ) with hydrological and meteorological stations.
Figure 1.
Study area of the headwaters of the Yangtze River (HWYZ) with hydrological and meteorological stations.

Figure 2.
Areal mean annual precipitation and temperature in Zhimenda (a) and Tuotuohe (b) sub-basins.
Figure 2.
Areal mean annual precipitation and temperature in Zhimenda (a) and Tuotuohe (b) sub-basins.

Figure 3.
Precipitation and temperature trends for each climatic station in HWYZ during 1961–2015.

Figure 4.
Annual streamflow linear trends for the Zhimenda (a), and Tuotuohe (b) stations during 1961–2015.
Figure 4.
Annual streamflow linear trends for the Zhimenda (a), and Tuotuohe (b) stations during 1961–2015.

Figure 5.
Variation in monthly flows represented by a 25%–75% inter-quantile range (IQR), 99%, and 1% (red triangles) values, mean values, and median values for (a) Zhimenda and (b) Tuotuohe sub-basins.
Figure 5.
Variation in monthly flows represented by a 25%–75% inter-quantile range (IQR), 99%, and 1% (red triangles) values, mean values, and median values for (a) Zhimenda and (b) Tuotuohe sub-basins.

Figure 6.
Change of monthly temperature, precipitation and flows for the Zhimenda (left column) and Tuotuohe (right column) sub-basins of HWYZ during 1961–2015.
Figure 6.
Change of monthly temperature, precipitation and flows for the Zhimenda (left column) and Tuotuohe (right column) sub-basins of HWYZ during 1961–2015.

Figure 7.
Wavelet power spectrum for the annual areal averaged precipitation for Zhimenda and Tuotuohe sub-basins during 1961–2015. The black line shows statistical significance at the 0.05 level.
Figure 7.
Wavelet power spectrum for the annual areal averaged precipitation for Zhimenda and Tuotuohe sub-basins during 1961–2015. The black line shows statistical significance at the 0.05 level.

Figure 8.
Wavelet power spectrum for annual areal averaged temperature for Zhimenda and Tuotuohe sub-basins during 1961–2015. The black line shows statistical significance at the 0.05 level.
Figure 8.
Wavelet power spectrum for annual areal averaged temperature for Zhimenda and Tuotuohe sub-basins during 1961–2015. The black line shows statistical significance at the 0.05 level.

Figure 9.
Wavelet power spectrum for streamflow for Zhimenda and Tuotuohe stations during 1961–2015. The black line shows statistical significance at the 0.05 level.
Figure 9.
Wavelet power spectrum for streamflow for Zhimenda and Tuotuohe stations during 1961–2015. The black line shows statistical significance at the 0.05 level.


Table 1.
Observation stations with mean, minimum, and maximum annual precipitation and temperature during 1961–2015.
Table 1.
Observation stations with mean, minimum, and maximum annual precipitation and temperature during 1961–2015.
| Stations | Elevations (m.a.s.l.) | Precipitation (mm) | Temperature (°C) | ||||
|---|---|---|---|---|---|---|---|
| Mean | Minimum | Maximum | Mean | Minimum | Maximum | ||
| Wudaoliang | 4612.20 | 291.91 | 136.30 | 429.40 | −5.21 | −6.49 | −3.75 |
| Tuotuohe | 4533.10 | 294.79 | 162.70 | 503.00 | −3.86 | −7.29 | −2.03 |
| Qumalai | 4175.00 | 425.29 | 296.20 | 568.40 | −1.97 | −3.94 | −0.24 |
| Yushu | 3681.20 | 488.96 | 321.70 | 638.30 | 3.40 | 2.01 | 5.25 |
| Qingshuihe | 4415.40 | 524.26 | 348.20 | 675.00 | −4.48 | −6.73 | −2.55 |
| Xiaozaohuo | 2767.00 | 27.75 | 6.10 | 67.50 | 3.74 | 1.53 | 5.91 |
| Golmud | 2807.60 | 42.89 | 11.40 | 101.80 | 5.28 | 2.89 | 7.10 |
| Zaduo | 4066.40 | 537.67 | 411.70 | 700.80 | 0.74 | −0.82 | 2.50 |
Table 2.
Observation stations with mean, maximum, and minimum streamflow in the headwaters of the Yangtze River (HYWZ) during 1961–2015.
Table 2.
Observation stations with mean, maximum, and minimum streamflow in the headwaters of the Yangtze River (HYWZ) during 1961–2015.
| Stations | Altitude (m.a.s.l.) | Longitude | Latitude | Discharge (m3/s) | |||
|---|---|---|---|---|---|---|---|
| Mean | Minimum | Maximum | Drainage Area (km2) | ||||
| Tuotuohe | 4532 | 97.23° E | 33.01° N | 33.36 | 8.84 | 61.71 | 15,924 |
| Zhimenda | 3530 | 92.44° E | 34.22° N | 415.75 | 221.21 | 774.46 | 137,704 |
Table 3.
Linear trends in precipitation and temperature and modified Mann–Kendall statistics (Z) during 1961–2015. Bold values show statistically significant trends at a 0.05 significant level.
Table 3.
Linear trends in precipitation and temperature and modified Mann–Kendall statistics (Z) during 1961–2015. Bold values show statistically significant trends at a 0.05 significant level.
| Stations | Precipitation | Temperature | Precipitation | Precipitation | Temperature | ||||
|---|---|---|---|---|---|---|---|---|---|
| Trend (mm dec−10) | Standard Deviation | Trend (°C dec−10) | SD | Coefficient of Variance | Z | p | Z | p | |
| Wudaoliang | 19.89 | 62.40 | 0.33 | 0.72 | 0.21 | 5.94 | p < 0.05–0.09 | 9.44 | p < 0.05 |
| Tuotuohe | 11.50 | 72.76 | 0.34 | 0.92 | 0.25 | 2.82 | p < 0.05 | 7.00 | p < 0.05 |
| Qumalai | 13.06 | 65.63 | 0.44 | 0.86 | 0.15 | 3.21 | p < 0.05 | 8.92 | p < 0.05 |
| Yushu | 2.97 | 73.37 | 0.33 | 0.76 | 0.15 | 1.12 | p > 0.05 | 11.32 | p < 0.05 |
| Qingshuihe | 9.38 | 67.25 | 0.38 | 0.86 | 0.13 | 2.41 | p < 0.05 | 7.16 | p < 0.05 |
| Xiaozaohuo | 1.87 | 12.23 | 0.65 | 1.12 | 0.44 | 5.74 | p < 0.05 | 13.94 | p < 0.05 |
| Golmud | 2.21 | 17.43 | 0.58 | 1.05 | 0.41 | 3.30 | p < 0.05 | 12.85 | p < 0.05 |
| Zaduo | 7.65 | 71.95 | 0.39 | 0.81 | 0.13 | 3.74 | p < 0.05 | 8.13 | p < 0.05 |
Table 4.
Linear trends in streamflow and modified Mann–Kendall statistics (Z) during 1961–2015.
| Station | Streamflow Trend (m3/s/year) | Z | p | Standard Deviation | Co-Efficient of Variance |
|---|---|---|---|---|---|
| Tuotuohe | 0.22 | 1.86 | p < 0.05 | 13.08 | 0.39 |
| Zhimenda | 1.36 | 1.38 | p < 0.05 | 110 | 0.26 |
Table 5.
Results and confidence levels of change point analysis from 1961–2015.
| Hydro-Climatic Variables | Change Point | Change Point | Confidence (%) |
|---|---|---|---|
| Tuotuohe Sub-Basin | Zhimenda Sub-Basin | ||
| Temperature (°C) | 2000 | 1997 | 95 |
| Precipitation (mm) | 1998 | 1998 | 95 |
| Flows (m3/s) | 1991 | 2004 | 95 |
Table 6.
Results of annual areal mean precipitation and temperature for each sub-basin for modified Mann–Kendall statistics (Z), both annually and seasonally. Bold values show statistically significant trends at a 0.05 significant level.
Table 6.
Results of annual areal mean precipitation and temperature for each sub-basin for modified Mann–Kendall statistics (Z), both annually and seasonally. Bold values show statistically significant trends at a 0.05 significant level.
| Mann Kendall Test Statistics and Sen’s Slope | Annual | Winter | Spring | Summer | Autumn |
|---|---|---|---|---|---|
| Zhimenda Sub-Basin | |||||
| Temperature | |||||
| Z | 7.99 | 7.03 | 8.98 | 8.78 | 13.26 |
| p | p < 0.05 | p < 0.05 | p < 0.05 | p < 0.05 | p < 0.05 |
| Slope/10Year (°C) | 0.39 | 0.5 | 0.27 | 0.34 | 0.4 |
| Precipitation | |||||
| Z | 3.99 | 3.21 | 2.99 | 3.04 | 0.97 |
| p | p < 0.05 | p > 0.05 | p > 0.05 | p > 0.05 | p > 0.05 |
| Slope/10Year (mm) | 3.4 | 1.2 | 1.27 | 2.38 | 0.12 |
| Tuotuohe Sub-Basin | |||||
| Temperature | |||||
| Z | 6.8 | 6.34 | 6.91 | 7.6 | 9.17 |
| p | p > 0.05 | p < 0.05 | p < 0.05 | p < 0.05 | p < 0.05 |
| Slope/10Year (°C) | 0.33 | 0.43 | 0.26 | 0.28 | 0.37 |
| Precipitation | |||||
| Z | 2.87 | 5.14 | 8.95 | 2.33 | 2.65 |
| p | p < 0.05 | p < 0.05 | p < 0.05 | p < 0.05 | p < 0.05 |
| Slope/10Year (mm) | 3.33 | 2 | 3.63 | 2.22 | 1.23 |
Table 7.
Correlation coefficient between annual streamflow and annual areally averaged precipitation and temperature for each sub-basin. Bold values show statistically significance at a 0.05 significance level.
Table 7.
Correlation coefficient between annual streamflow and annual areally averaged precipitation and temperature for each sub-basin. Bold values show statistically significance at a 0.05 significance level.
| Climatic Variables | Tuotuohe Sub-Basin | Zhimenda Sub-Basin |
|---|---|---|
| Precipitation | 0.283 | 0.447 |
| Temperature | 0.701 | 0.548 |
© 2020 by the authors. Licensee MDPI, Basel, Switzerland. This article is an open access article distributed under the terms and conditions of the Creative Commons Attribution (CC BY) license (http://creativecommons.org/licenses/by/4.0/).
Share and Cite
MDPI and ACS Style
Ahmed, N.; Wang, G.; Booij, M.J.; Oluwafemi, A.; Hashmi, M.Z.-u.-R.; Ali, S.; Munir, S. Climatic Variability and Periodicity for Upstream Sub-Basins of the Yangtze River, China. Water 2020, 12, 842. https://doi.org/10.3390/w12030842
AMA Style
Ahmed N, Wang G, Booij MJ, Oluwafemi A, Hashmi MZ-u-R, Ali S, Munir S. Climatic Variability and Periodicity for Upstream Sub-Basins of the Yangtze River, China. Water. 2020; 12(3):842. https://doi.org/10.3390/w12030842
Chicago/Turabian StyleAhmed, Naveed, Genxu Wang, Martijn J. Booij, Adeyeri Oluwafemi, Muhammad Zia-ur-Rahman Hashmi, Shahid Ali, and Sarfraz Munir. 2020. "Climatic Variability and Periodicity for Upstream Sub-Basins of the Yangtze River, China" Water 12, no. 3: 842. https://doi.org/10.3390/w12030842
Note that from the first issue of 2016, this journal uses article numbers instead of page numbers. See further details here.