Climate and Extreme Rainfall Events in the Mono River Basin (West Africa): Investigating Future Changes with Regional Climate Models

 , , ,
, , ,  ,
,  , ,
, ,
Abstract
:1. Introduction
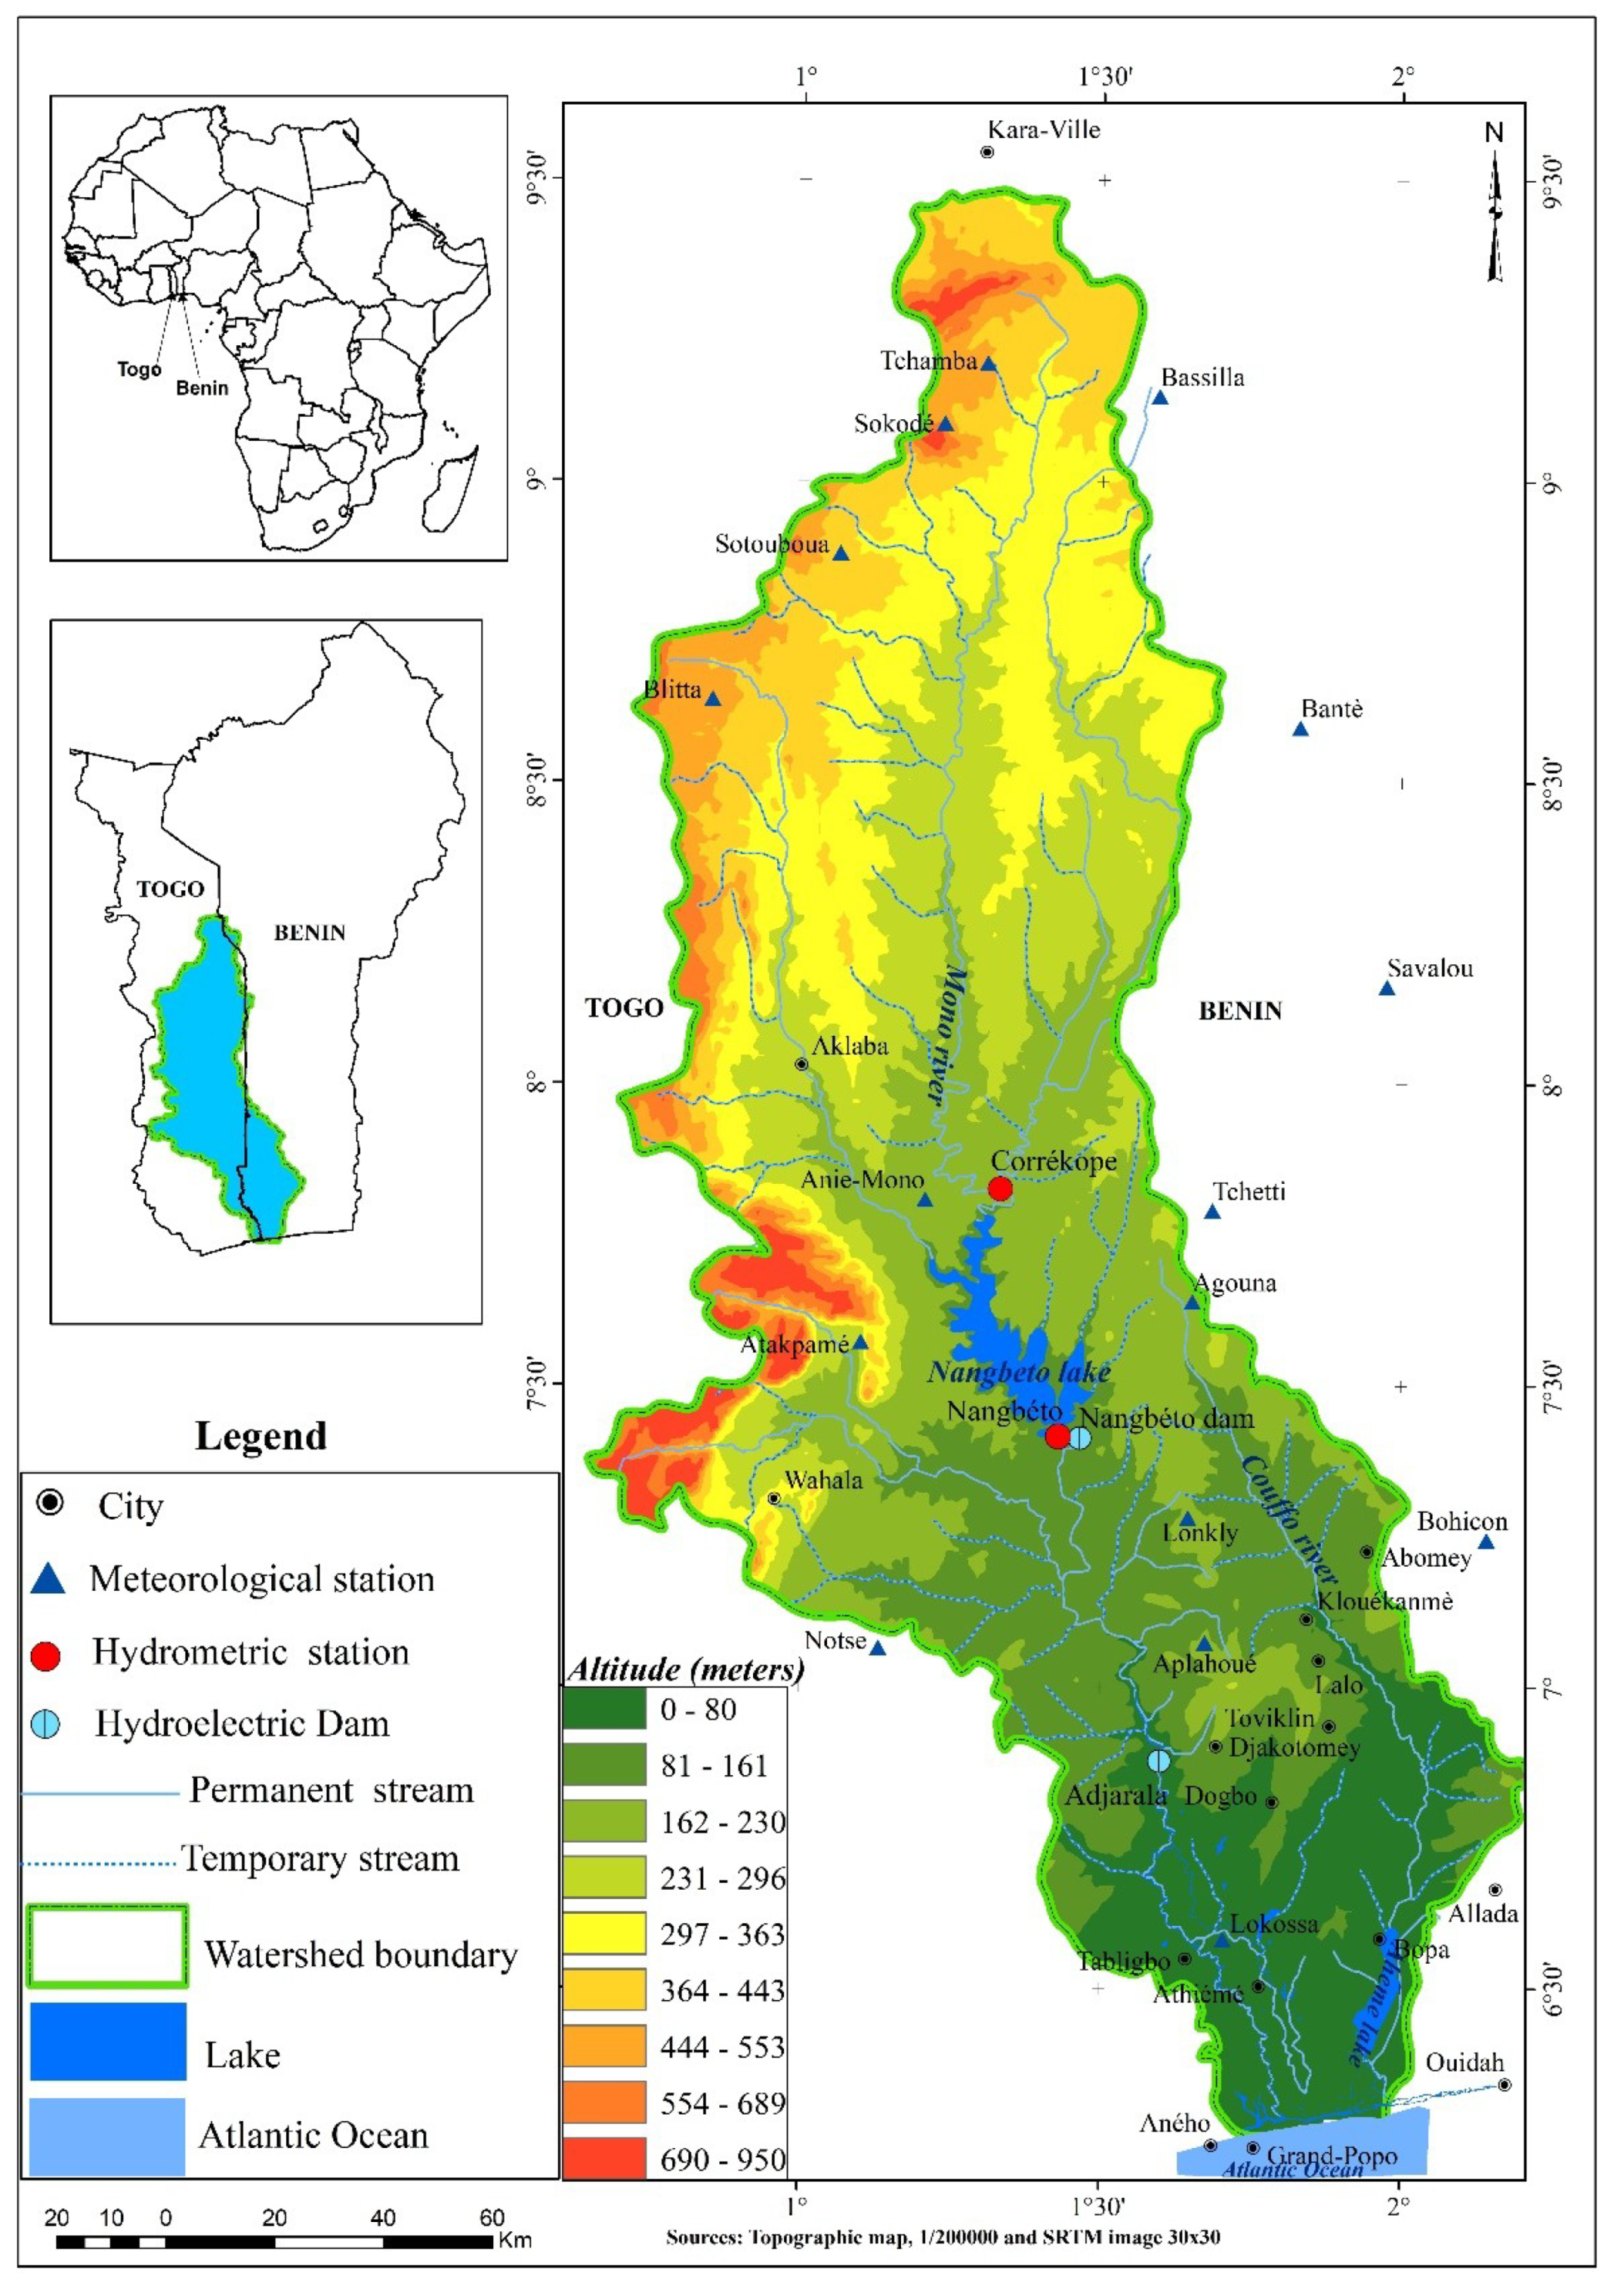
2. Study Area
3. Materials and Methods
3.1. Observational Climate Data
3.2. Data from Regional Climate Models
3.3. Statistical Methods
4. Results and Discussion
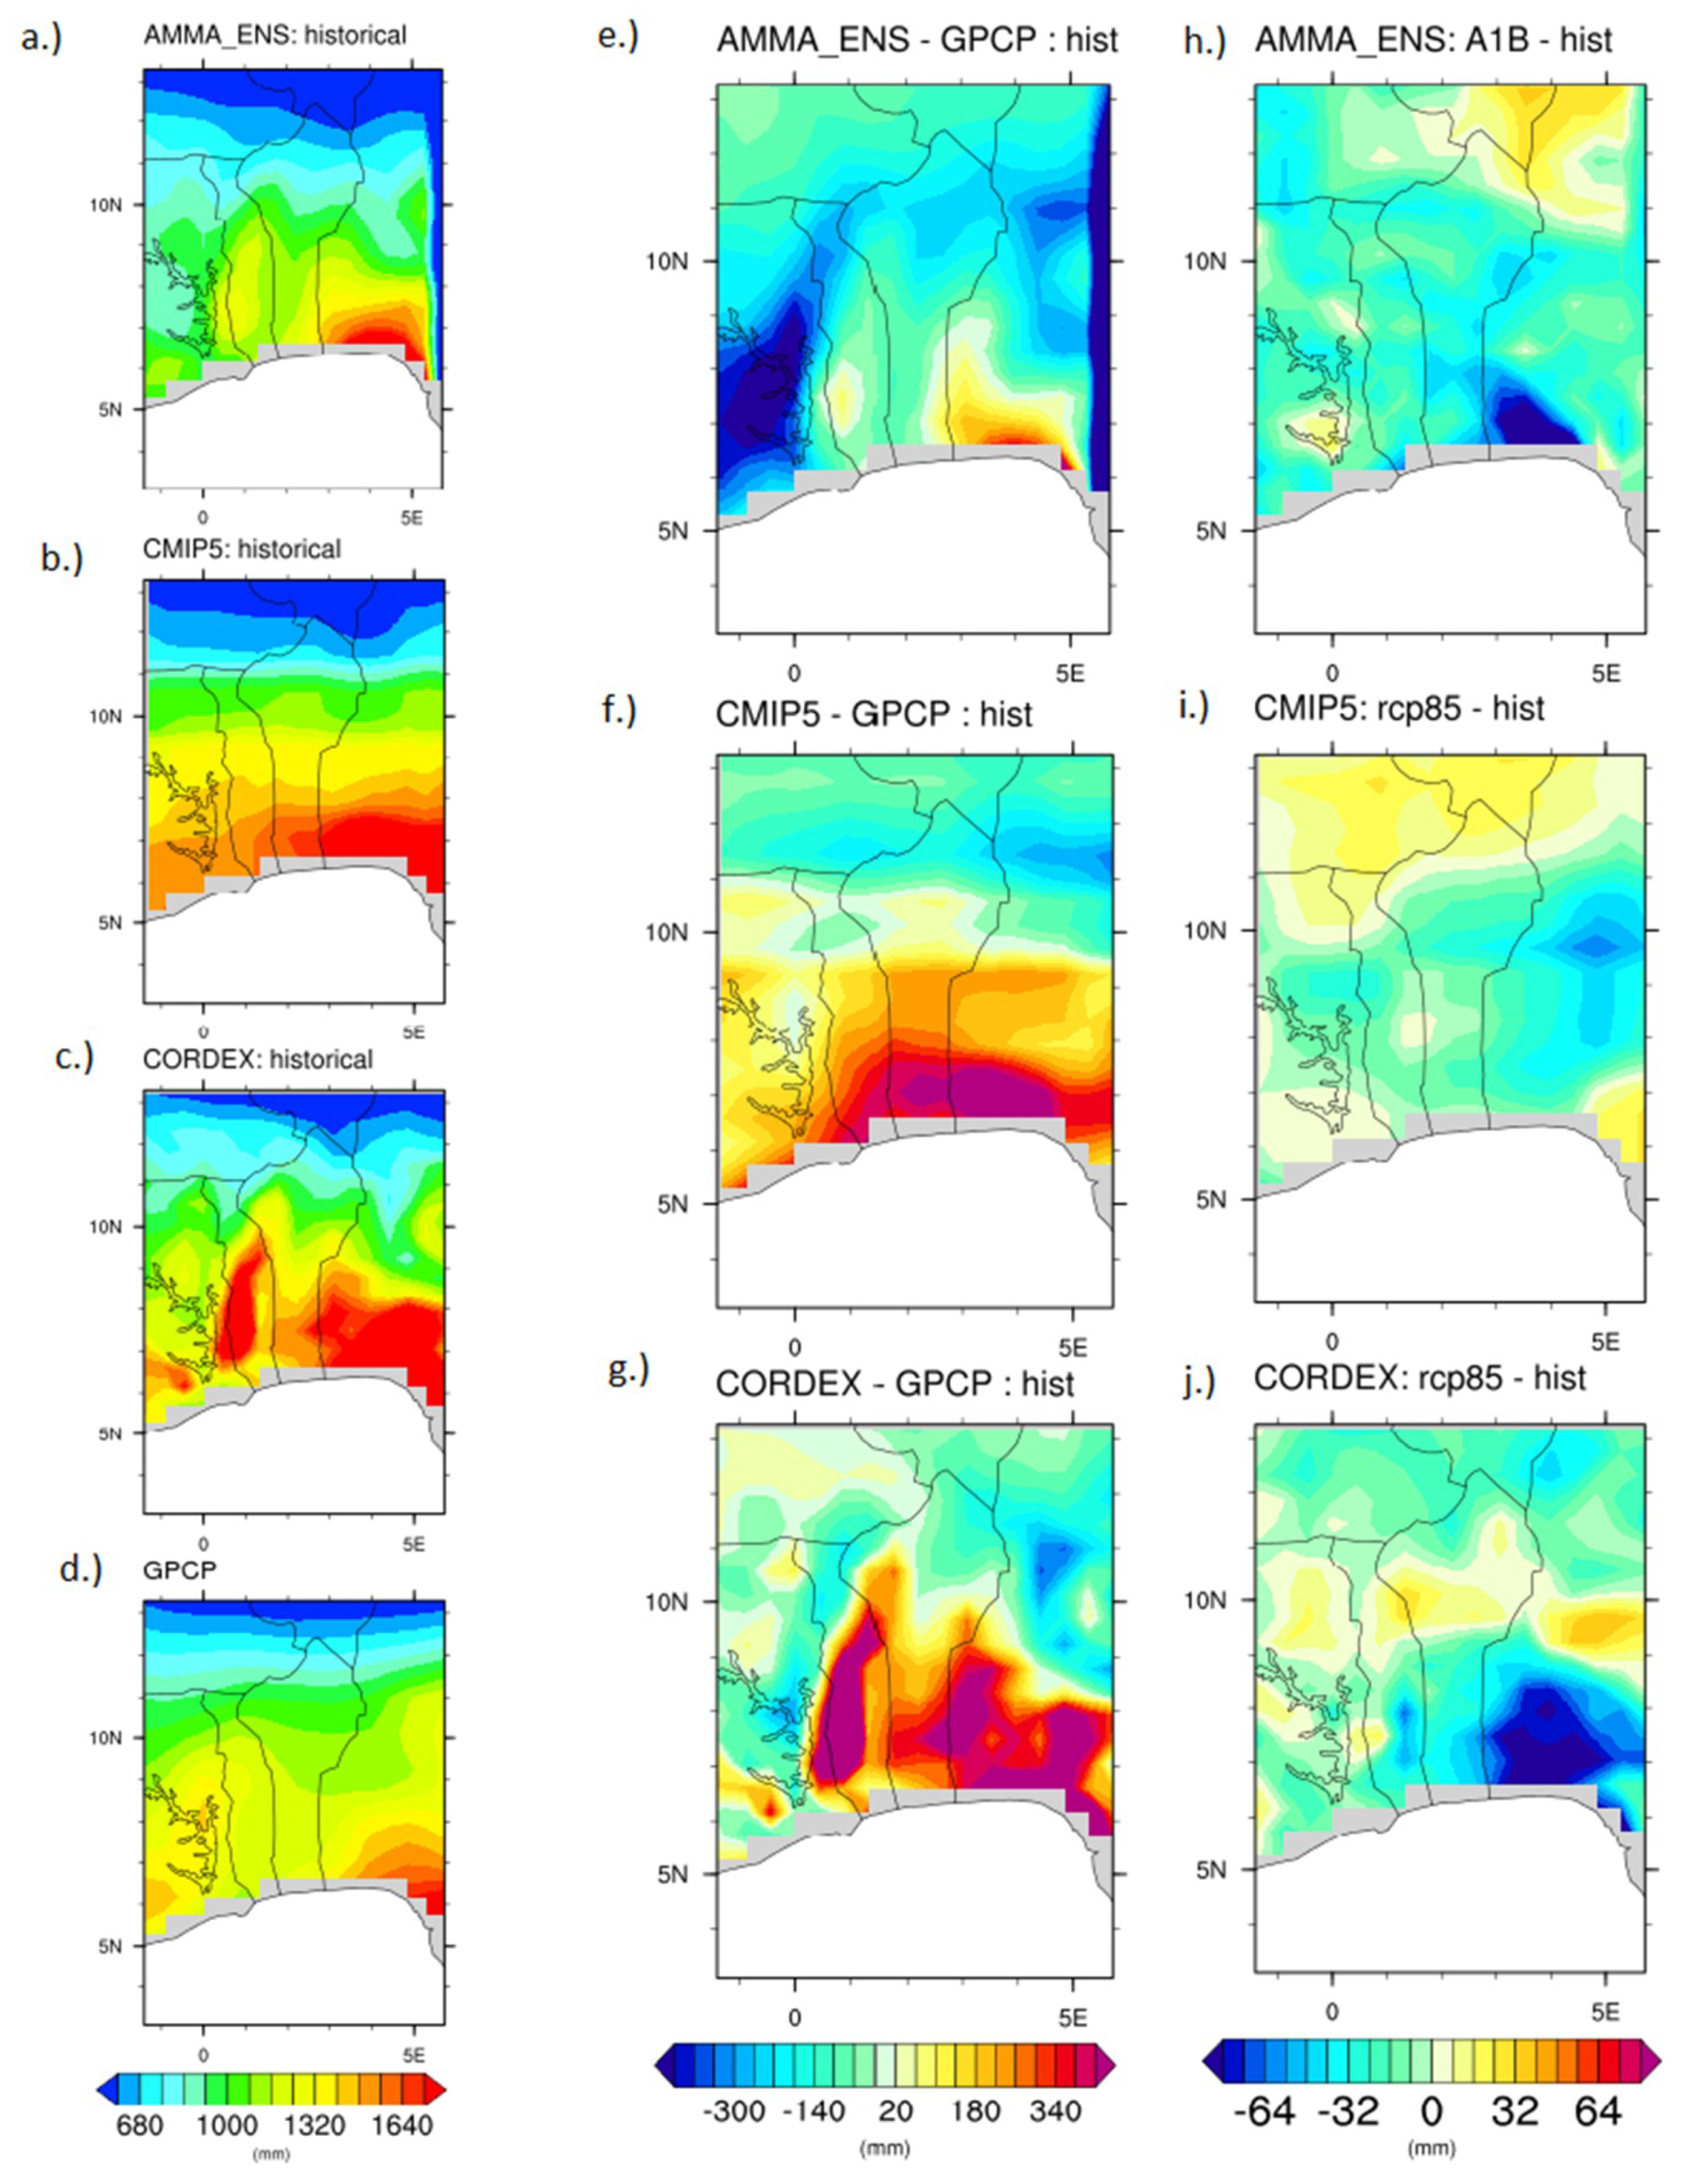
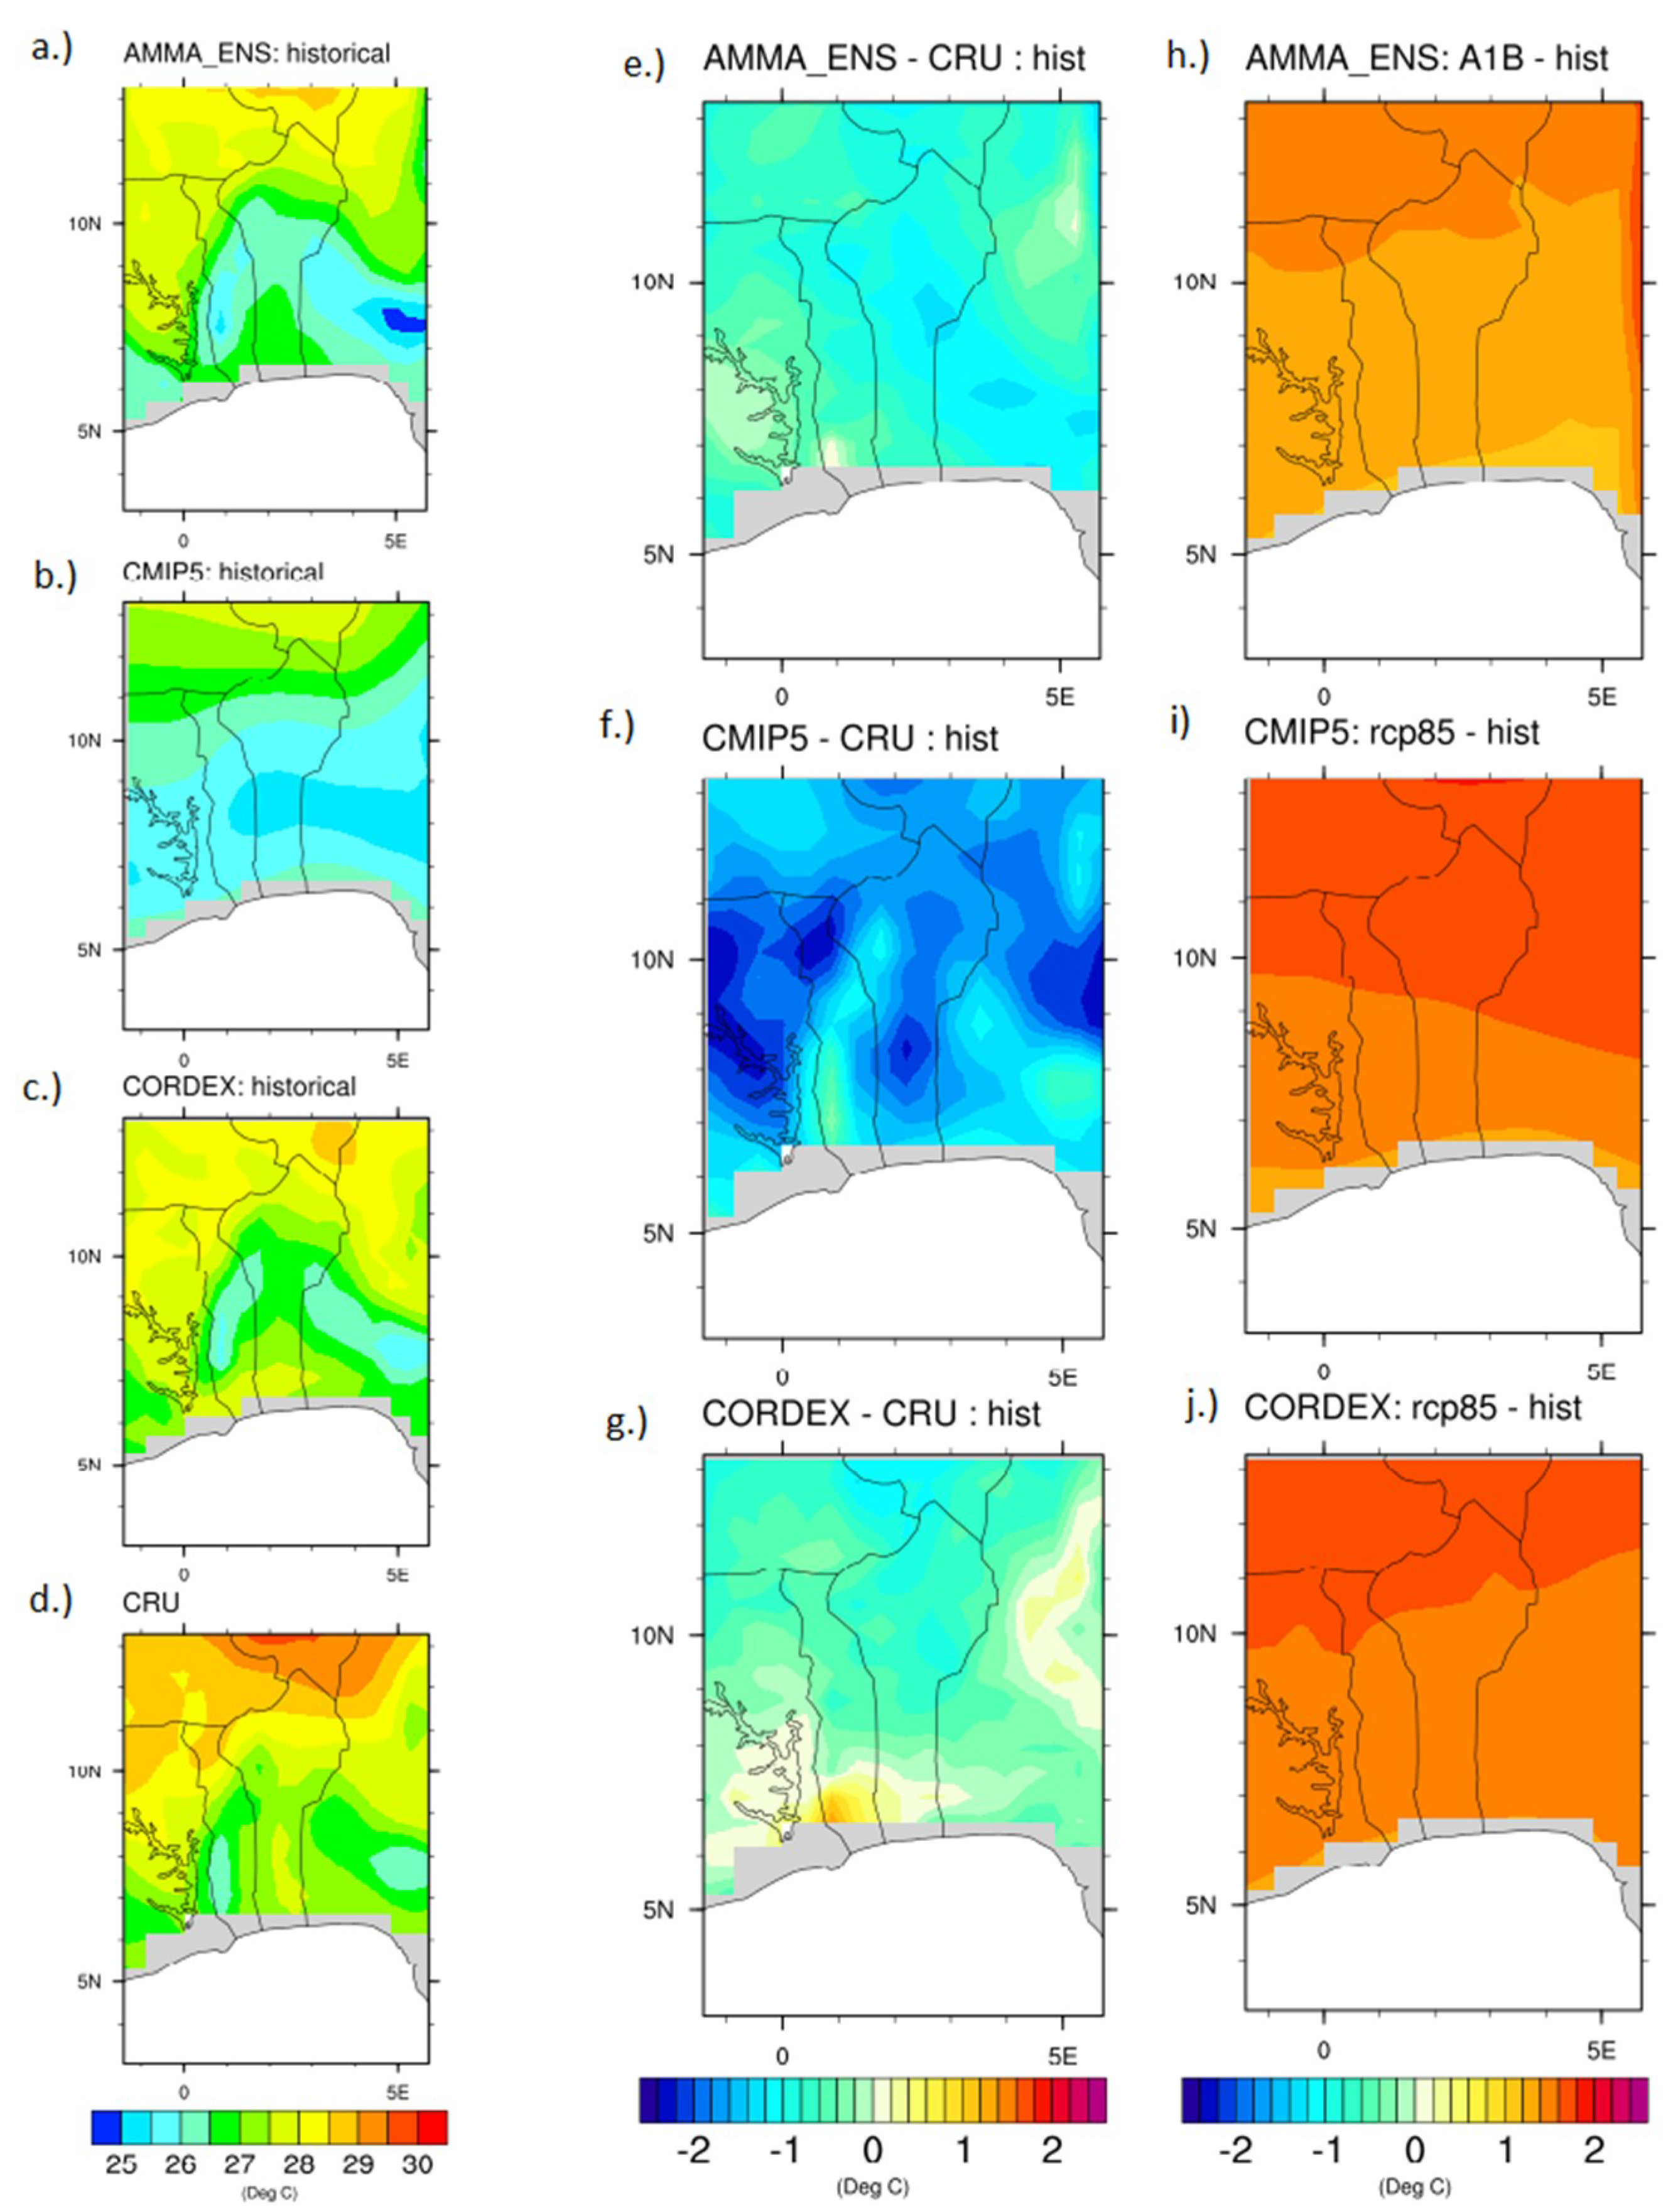
4.1. Spatial Distribution of the Annual Rainfall and Air Temperature for Three Datasets
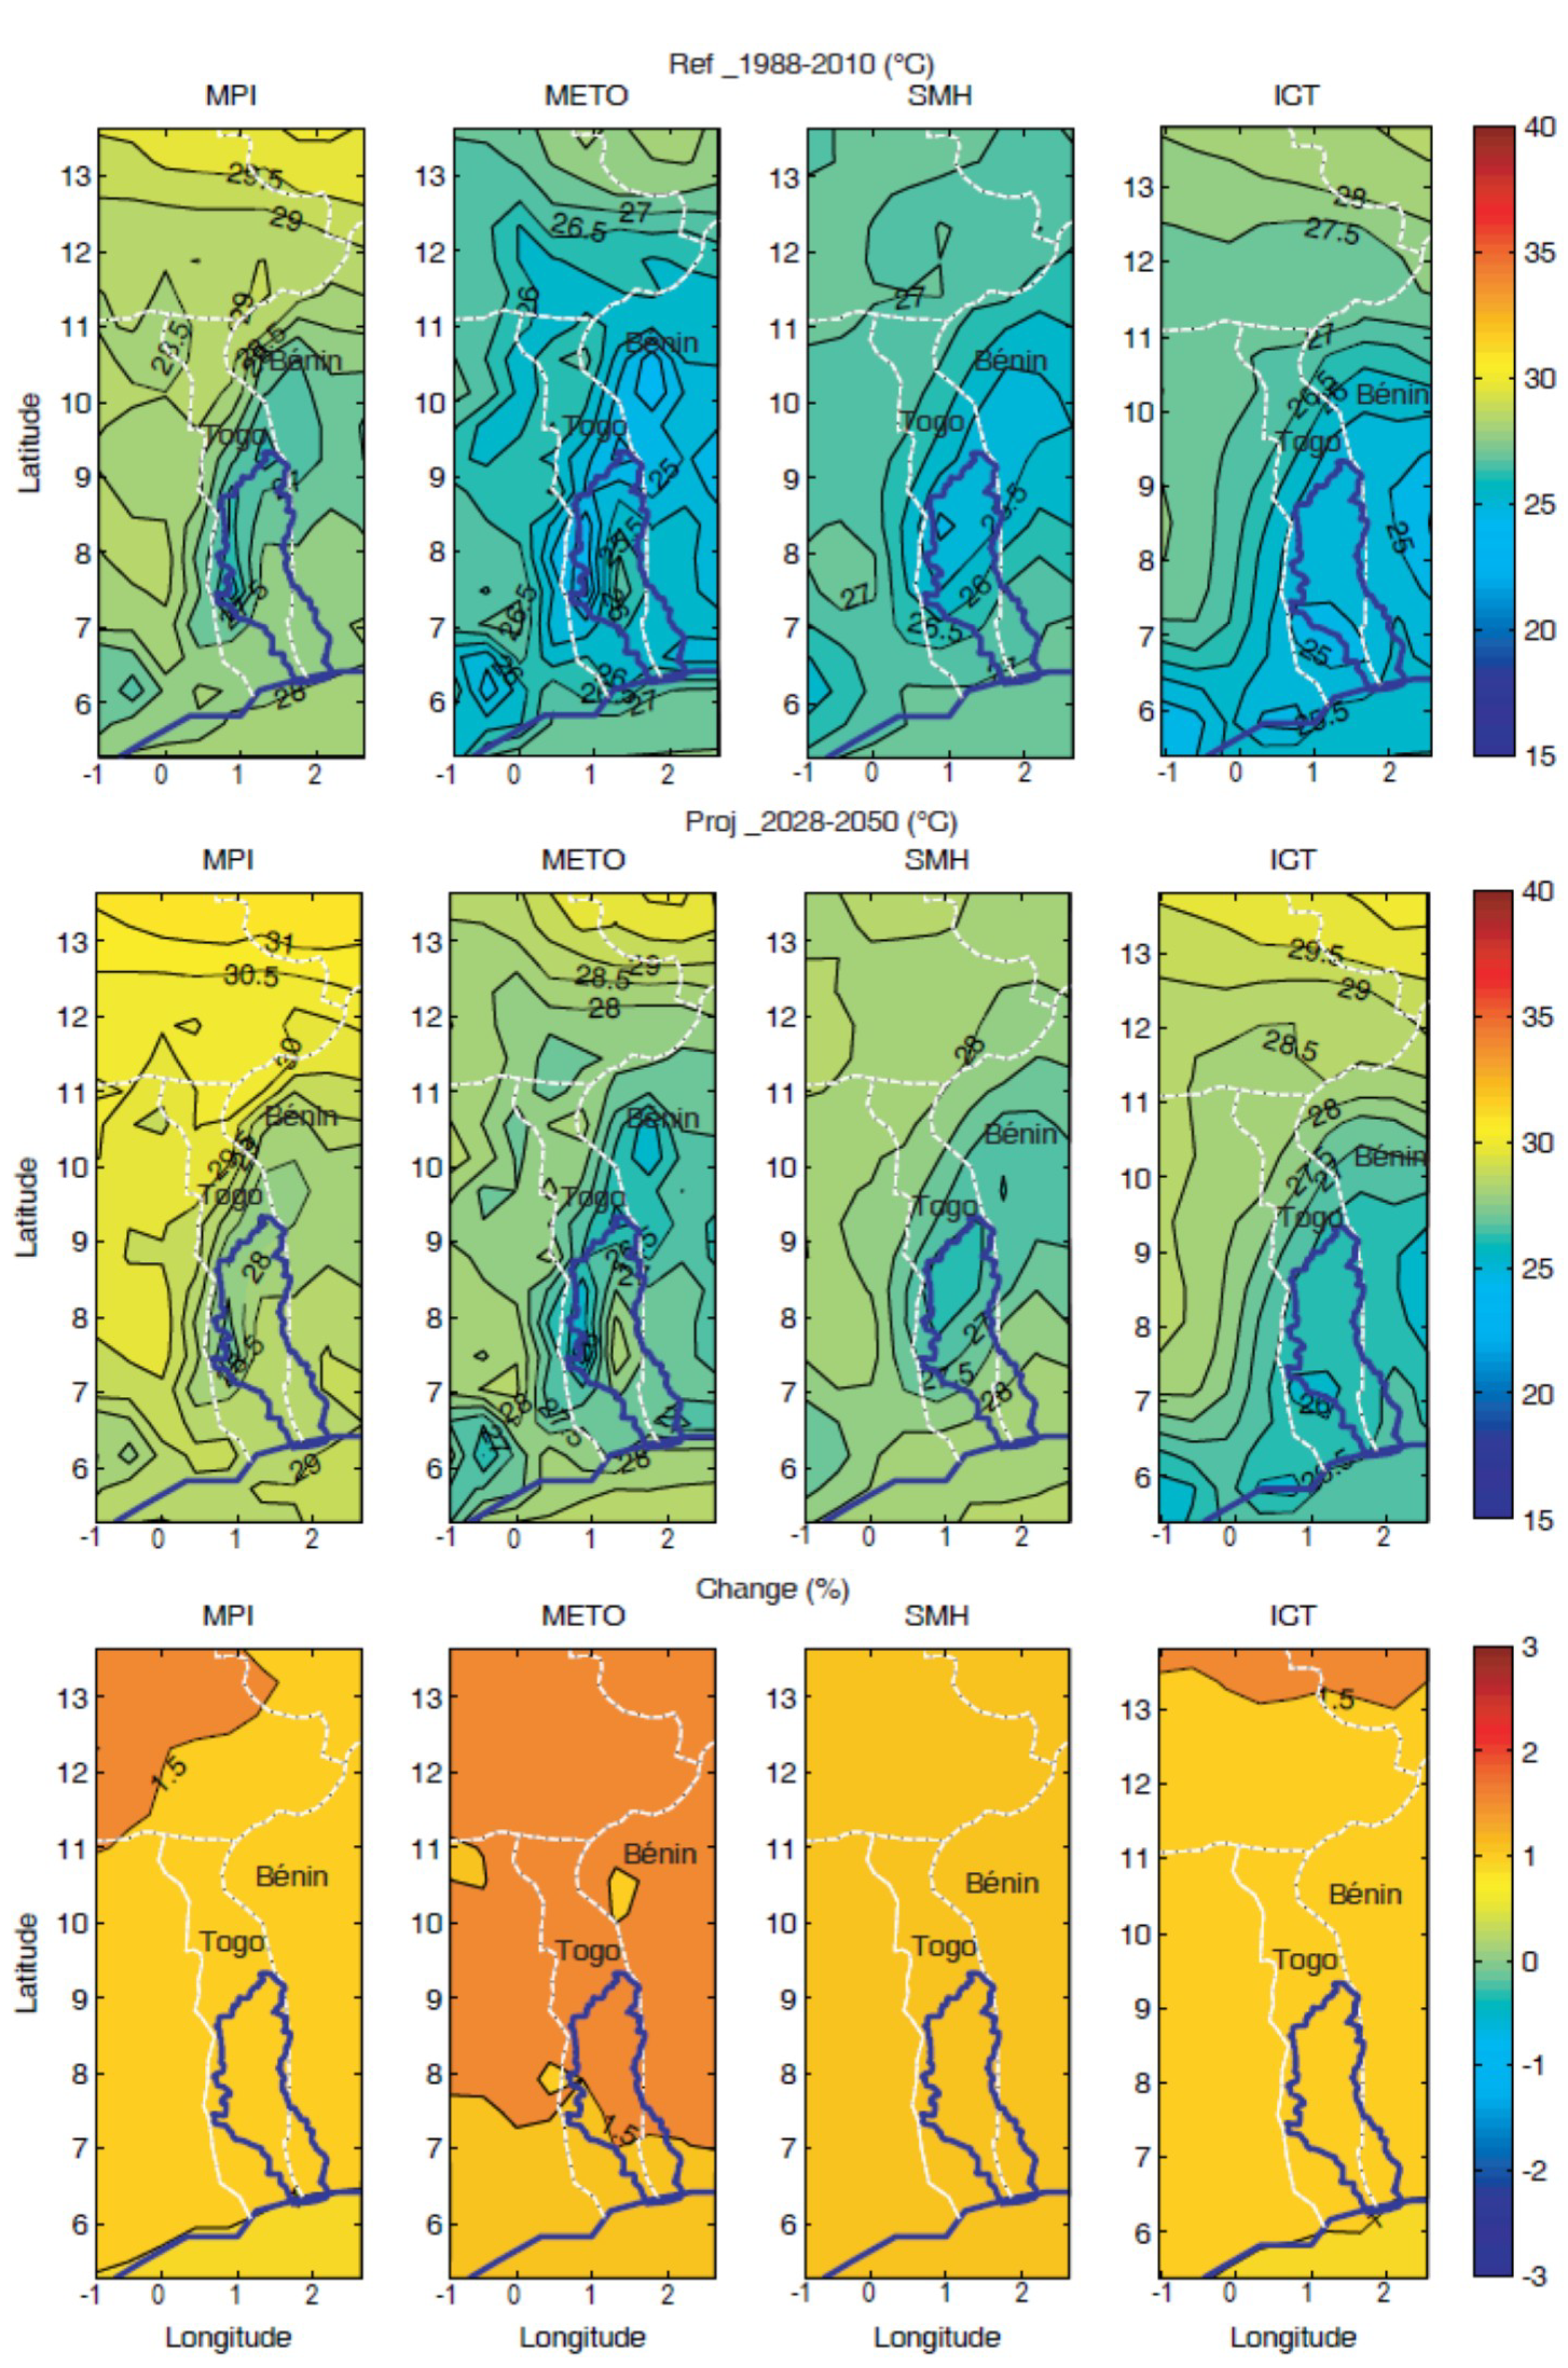
4.2. Spatial Distribution of the Averaged Annual Precipitation and Air Temperature for AMMA-ENSEMBLES Models
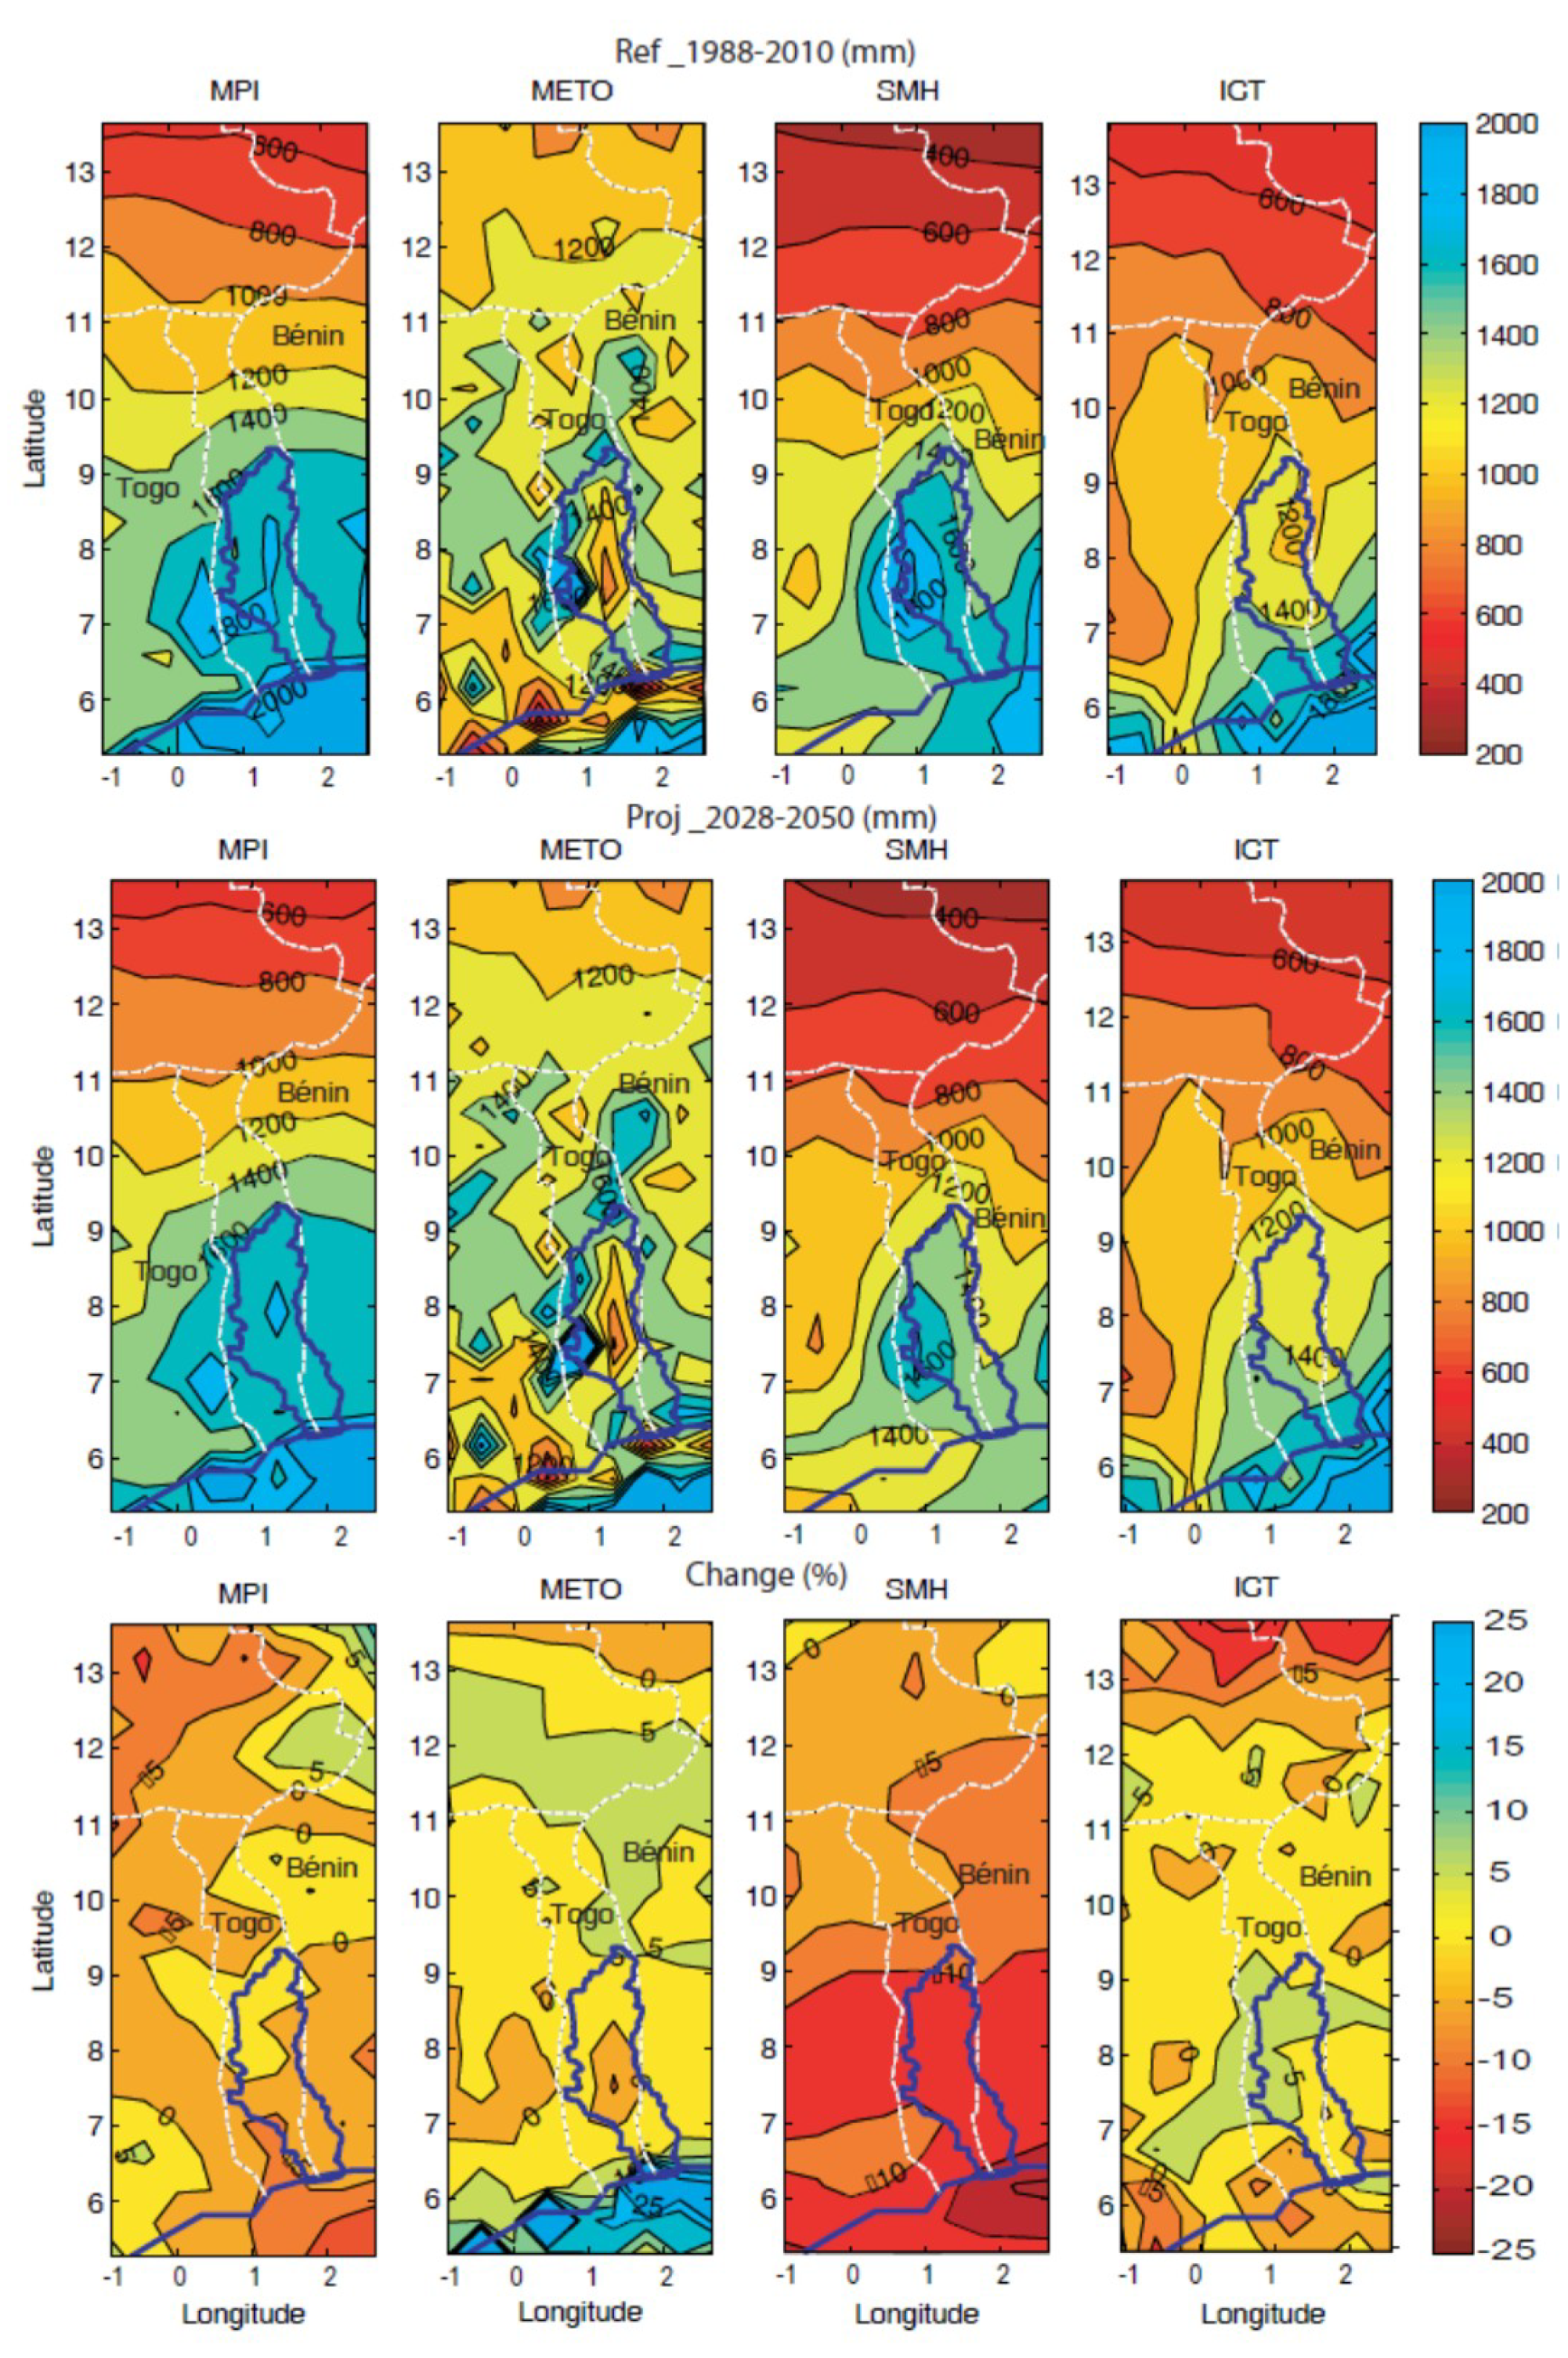
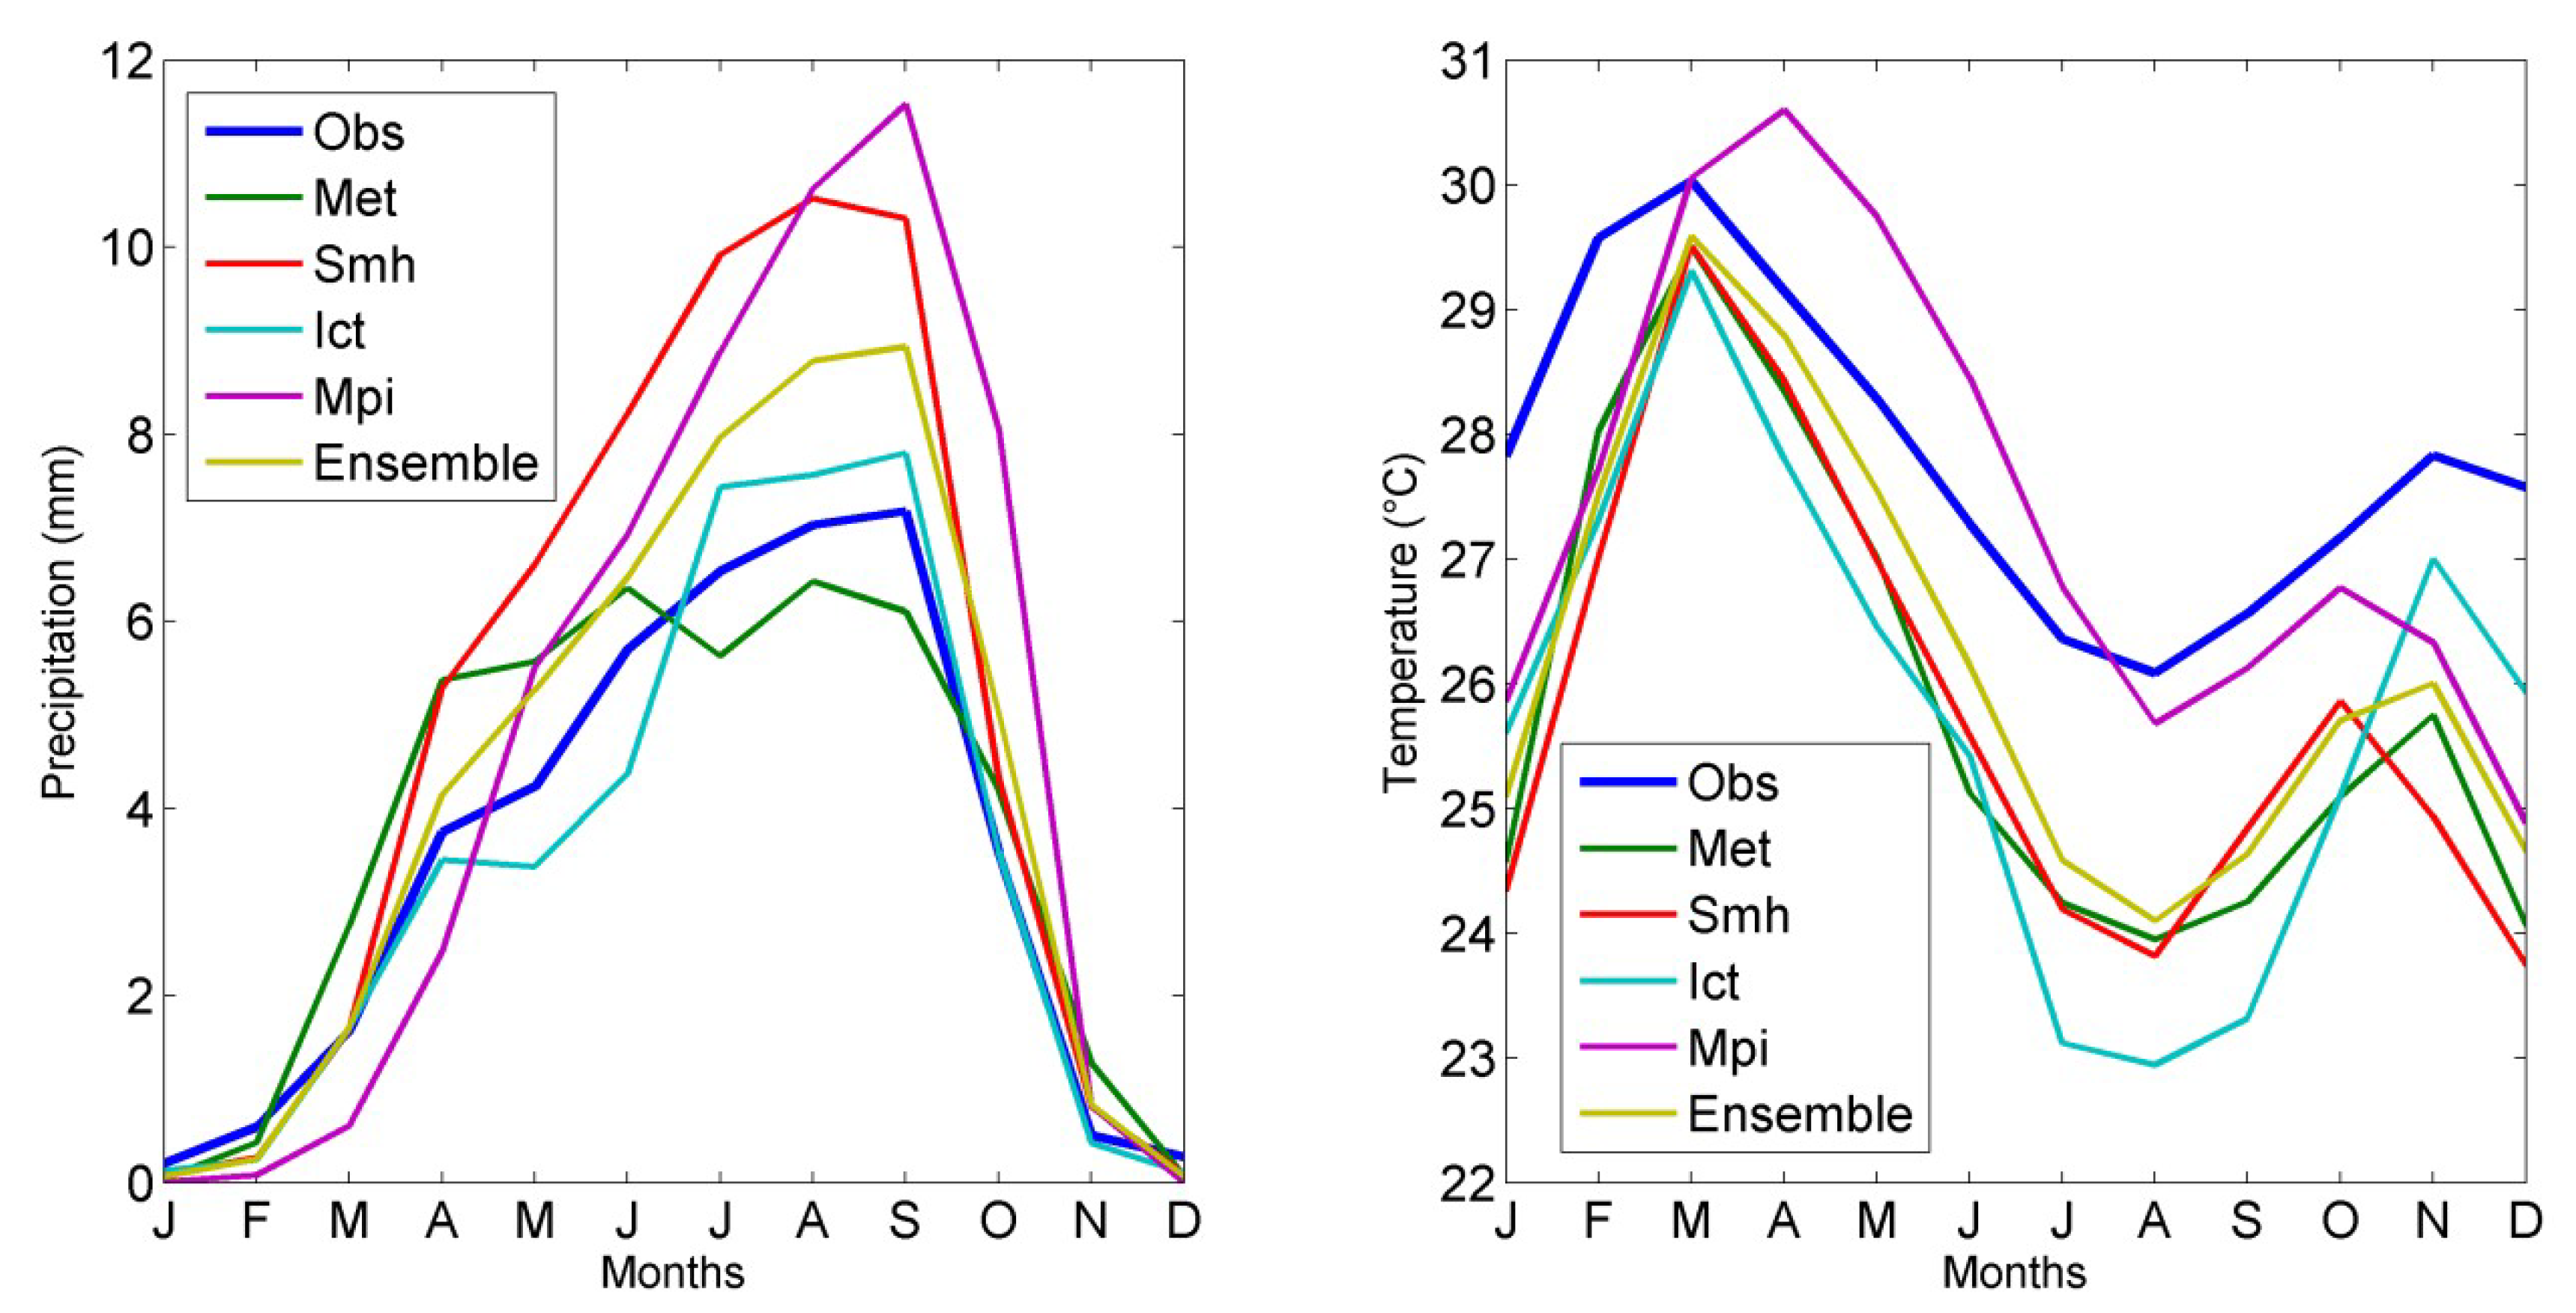
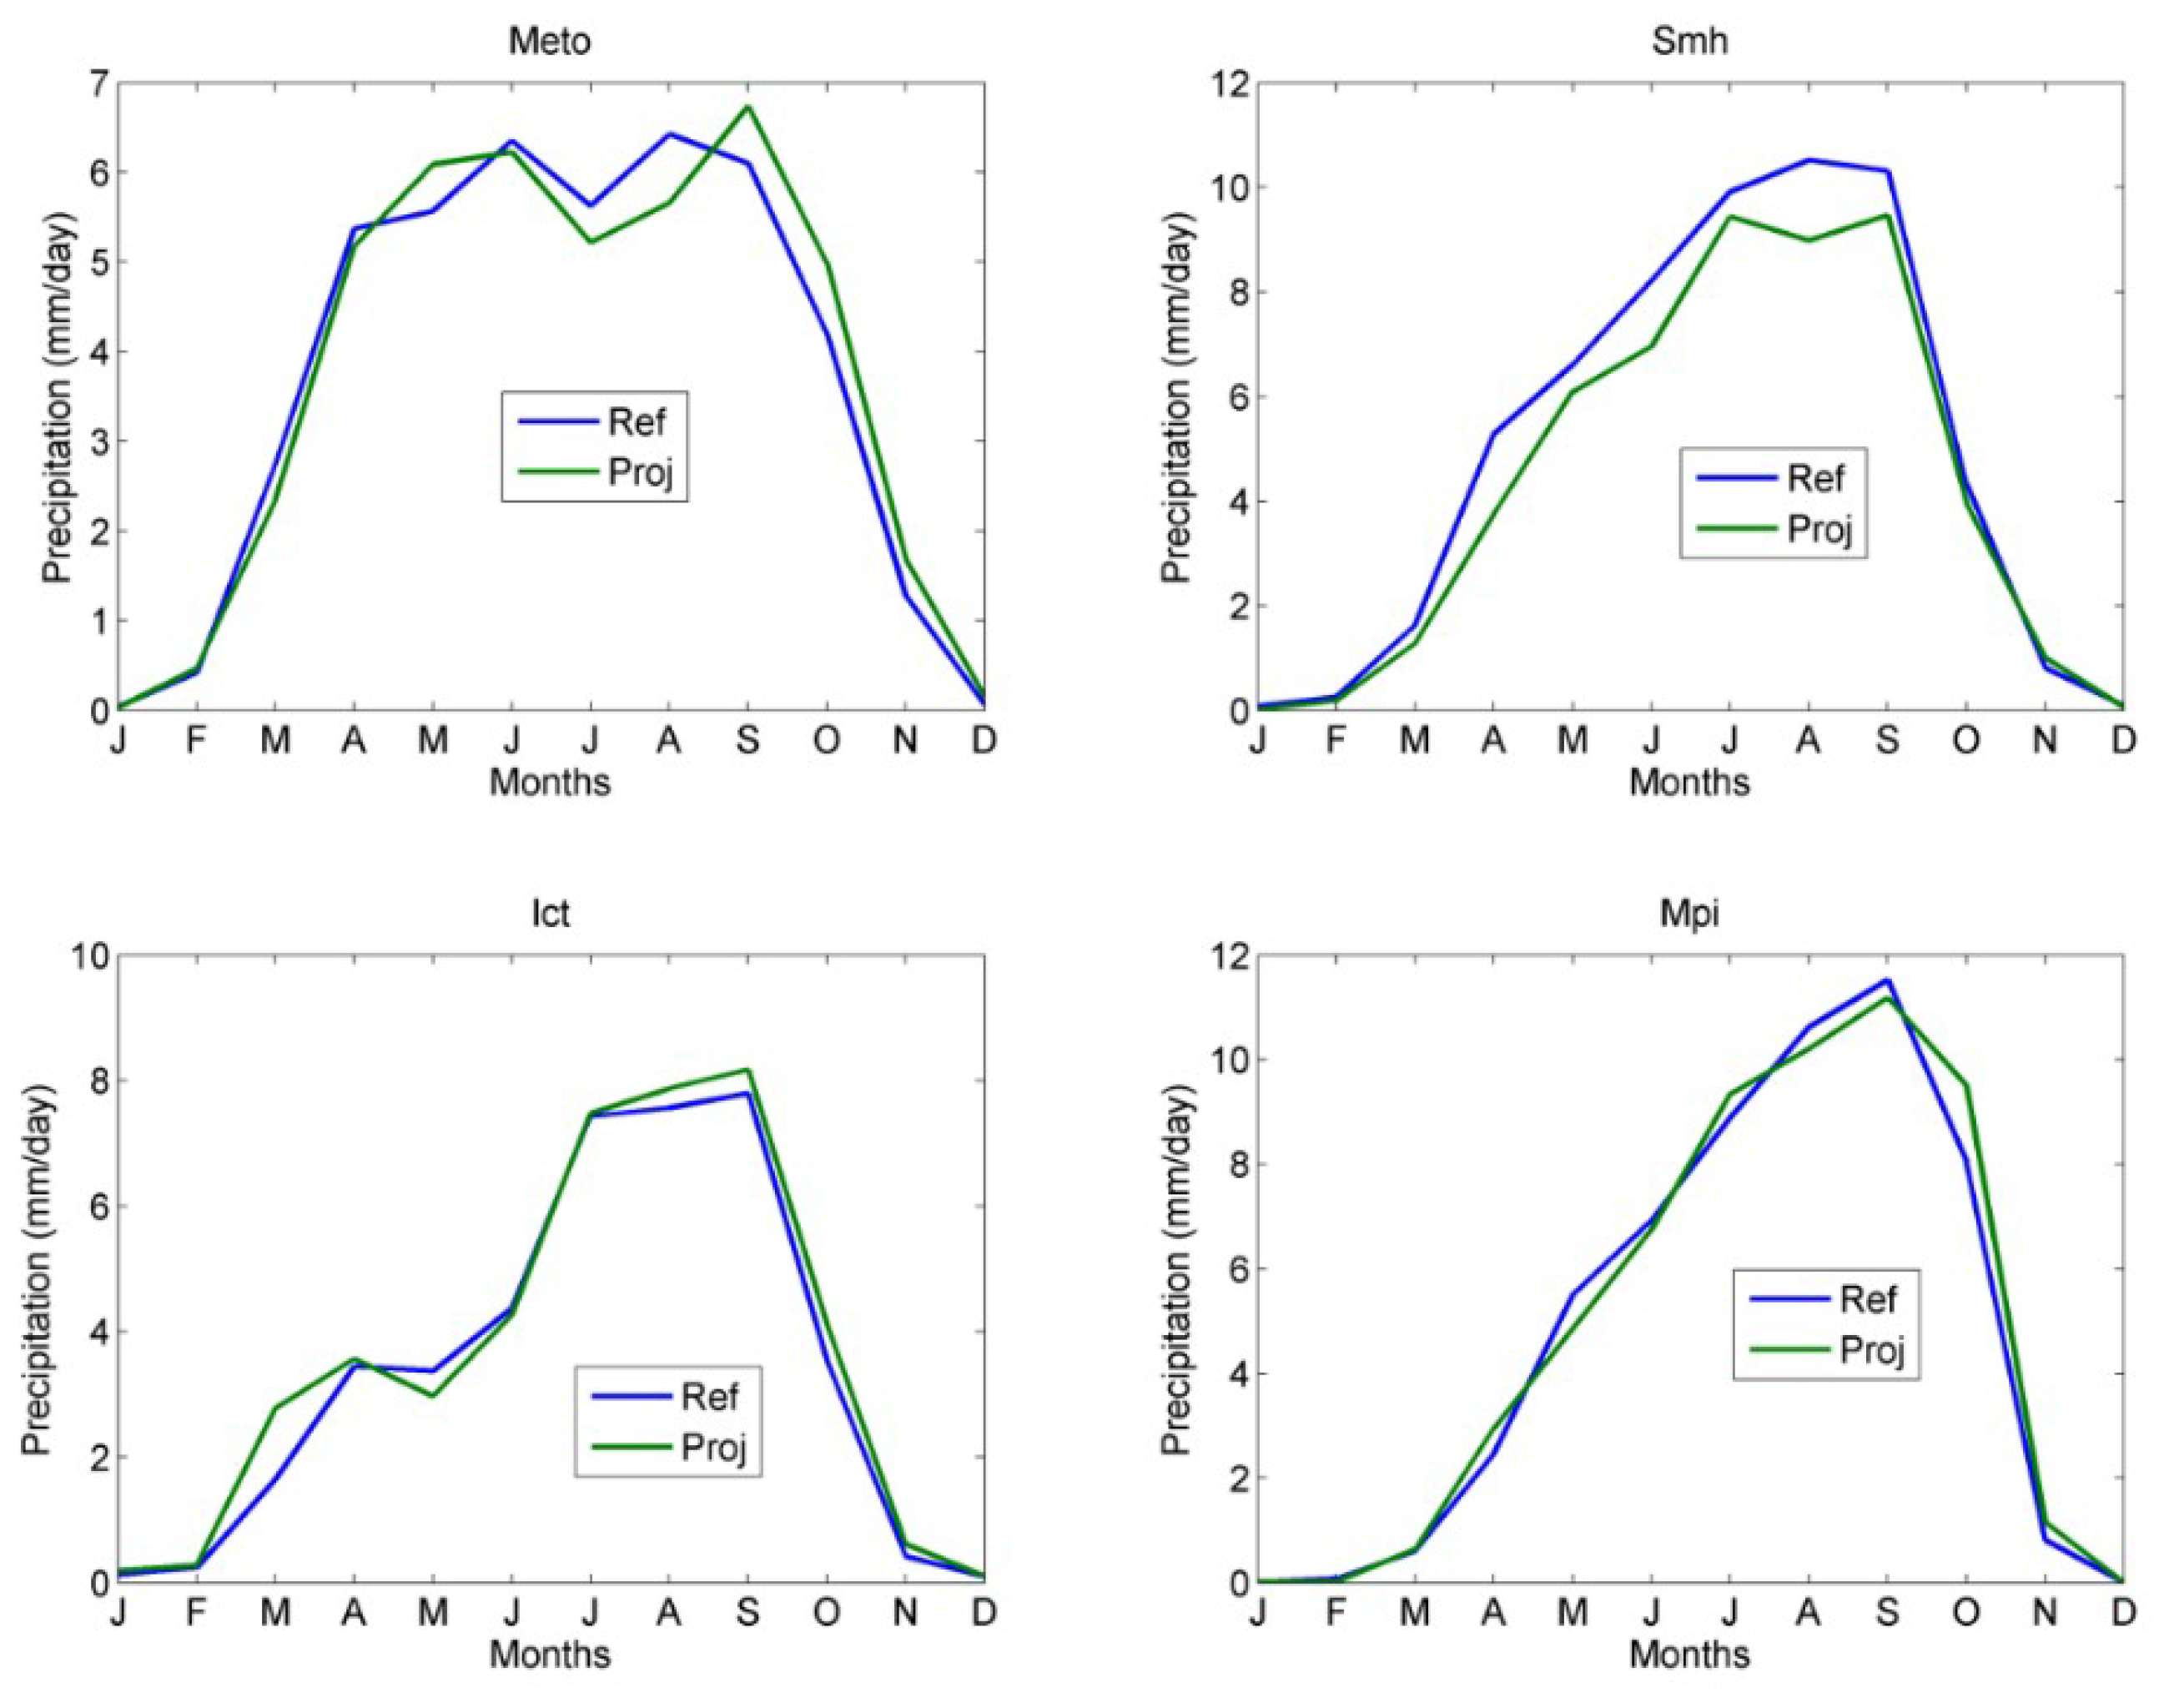
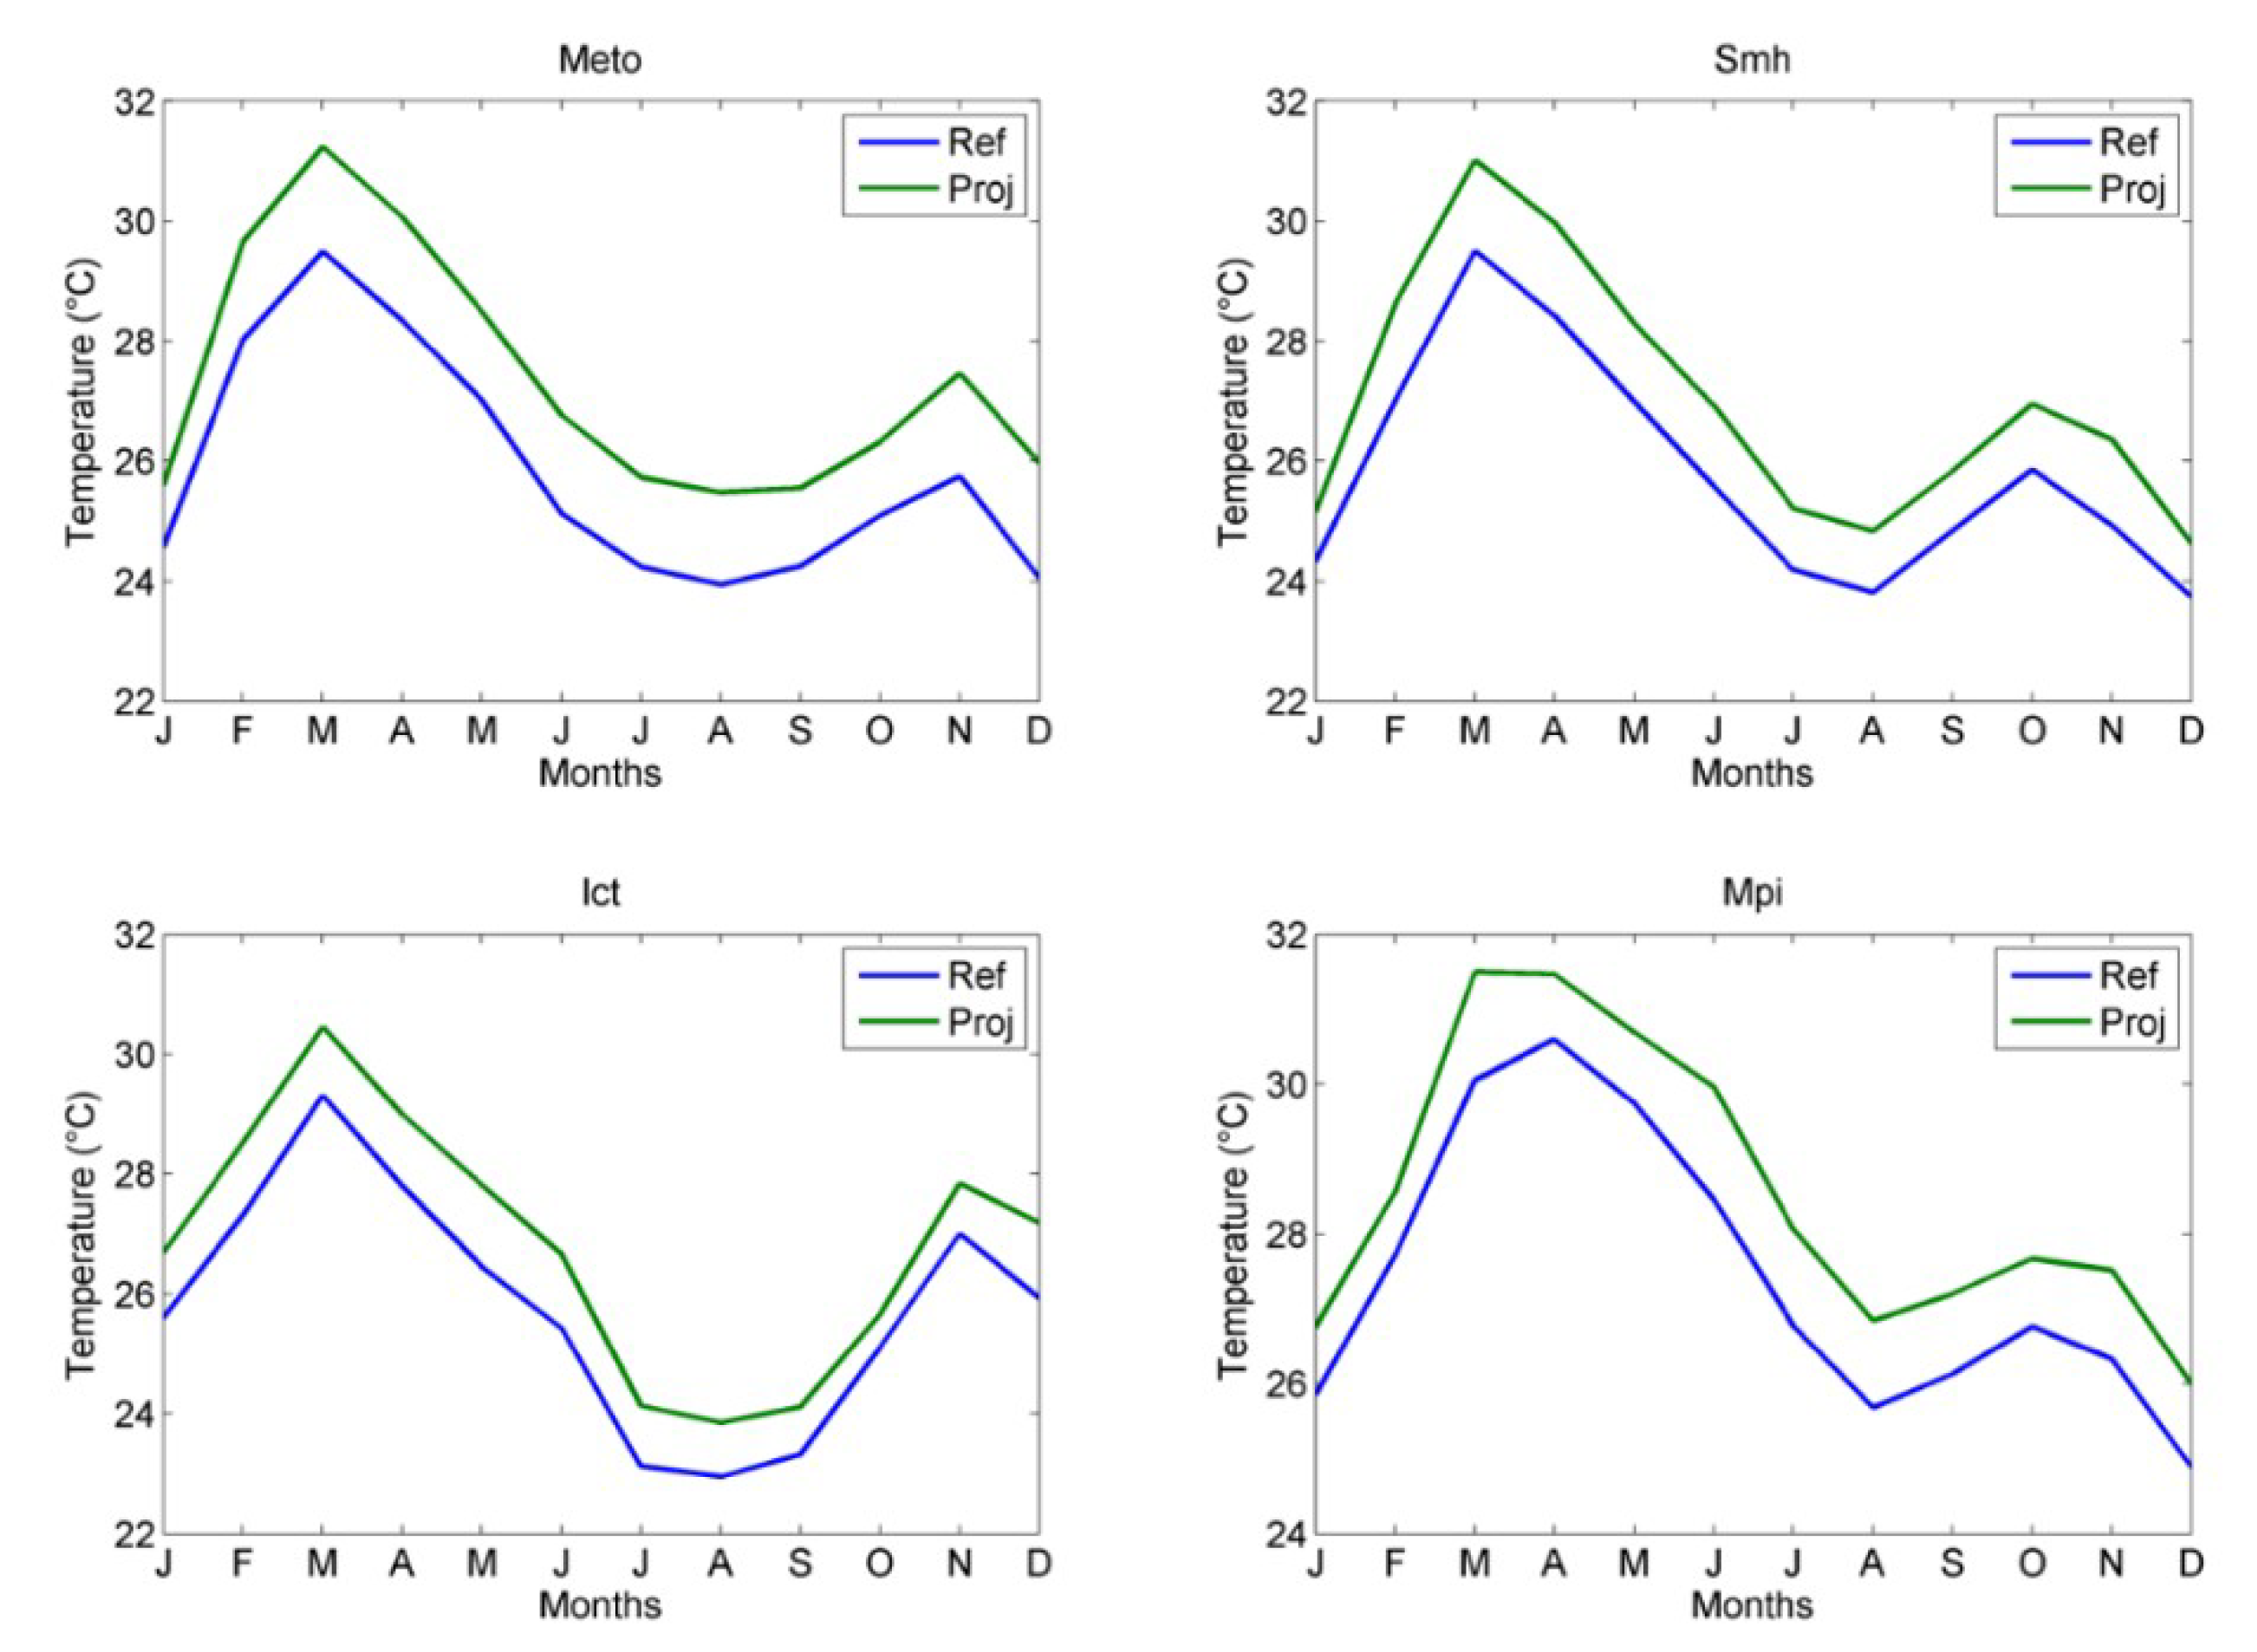
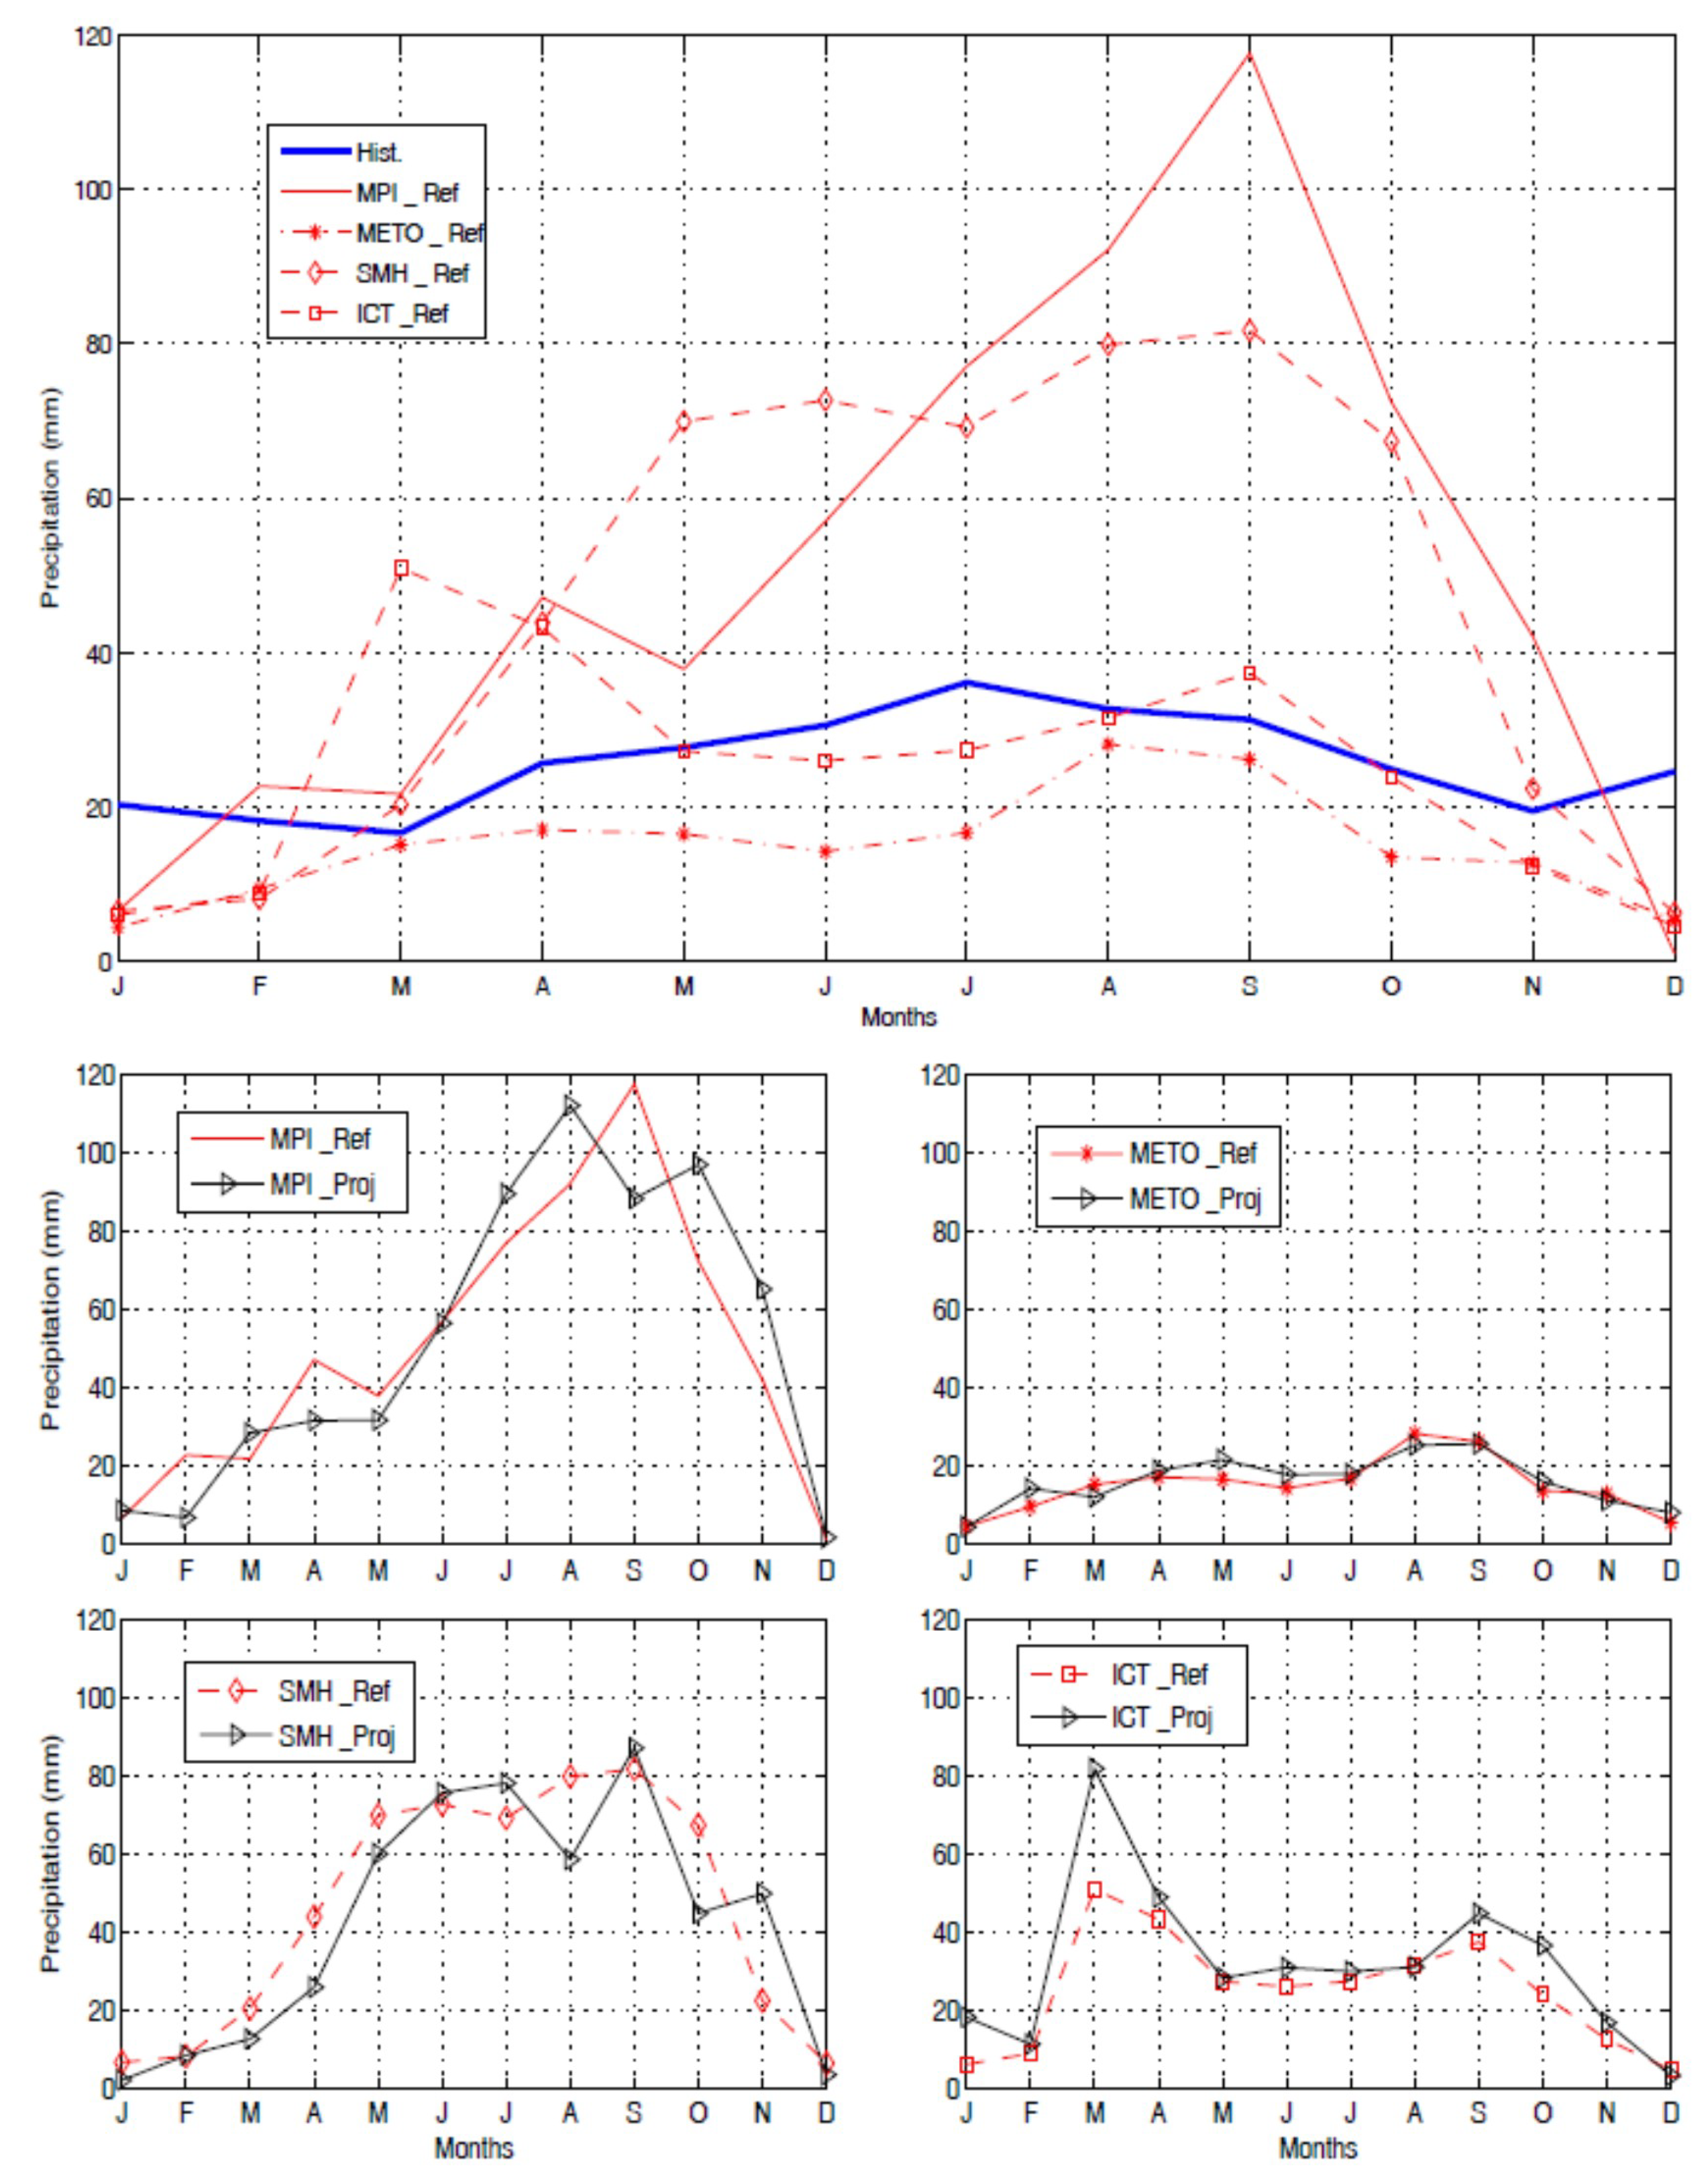
4.3. Average Rainfall and Temperature Regimes in the Mono River Basin at the Nangbéto Outlet
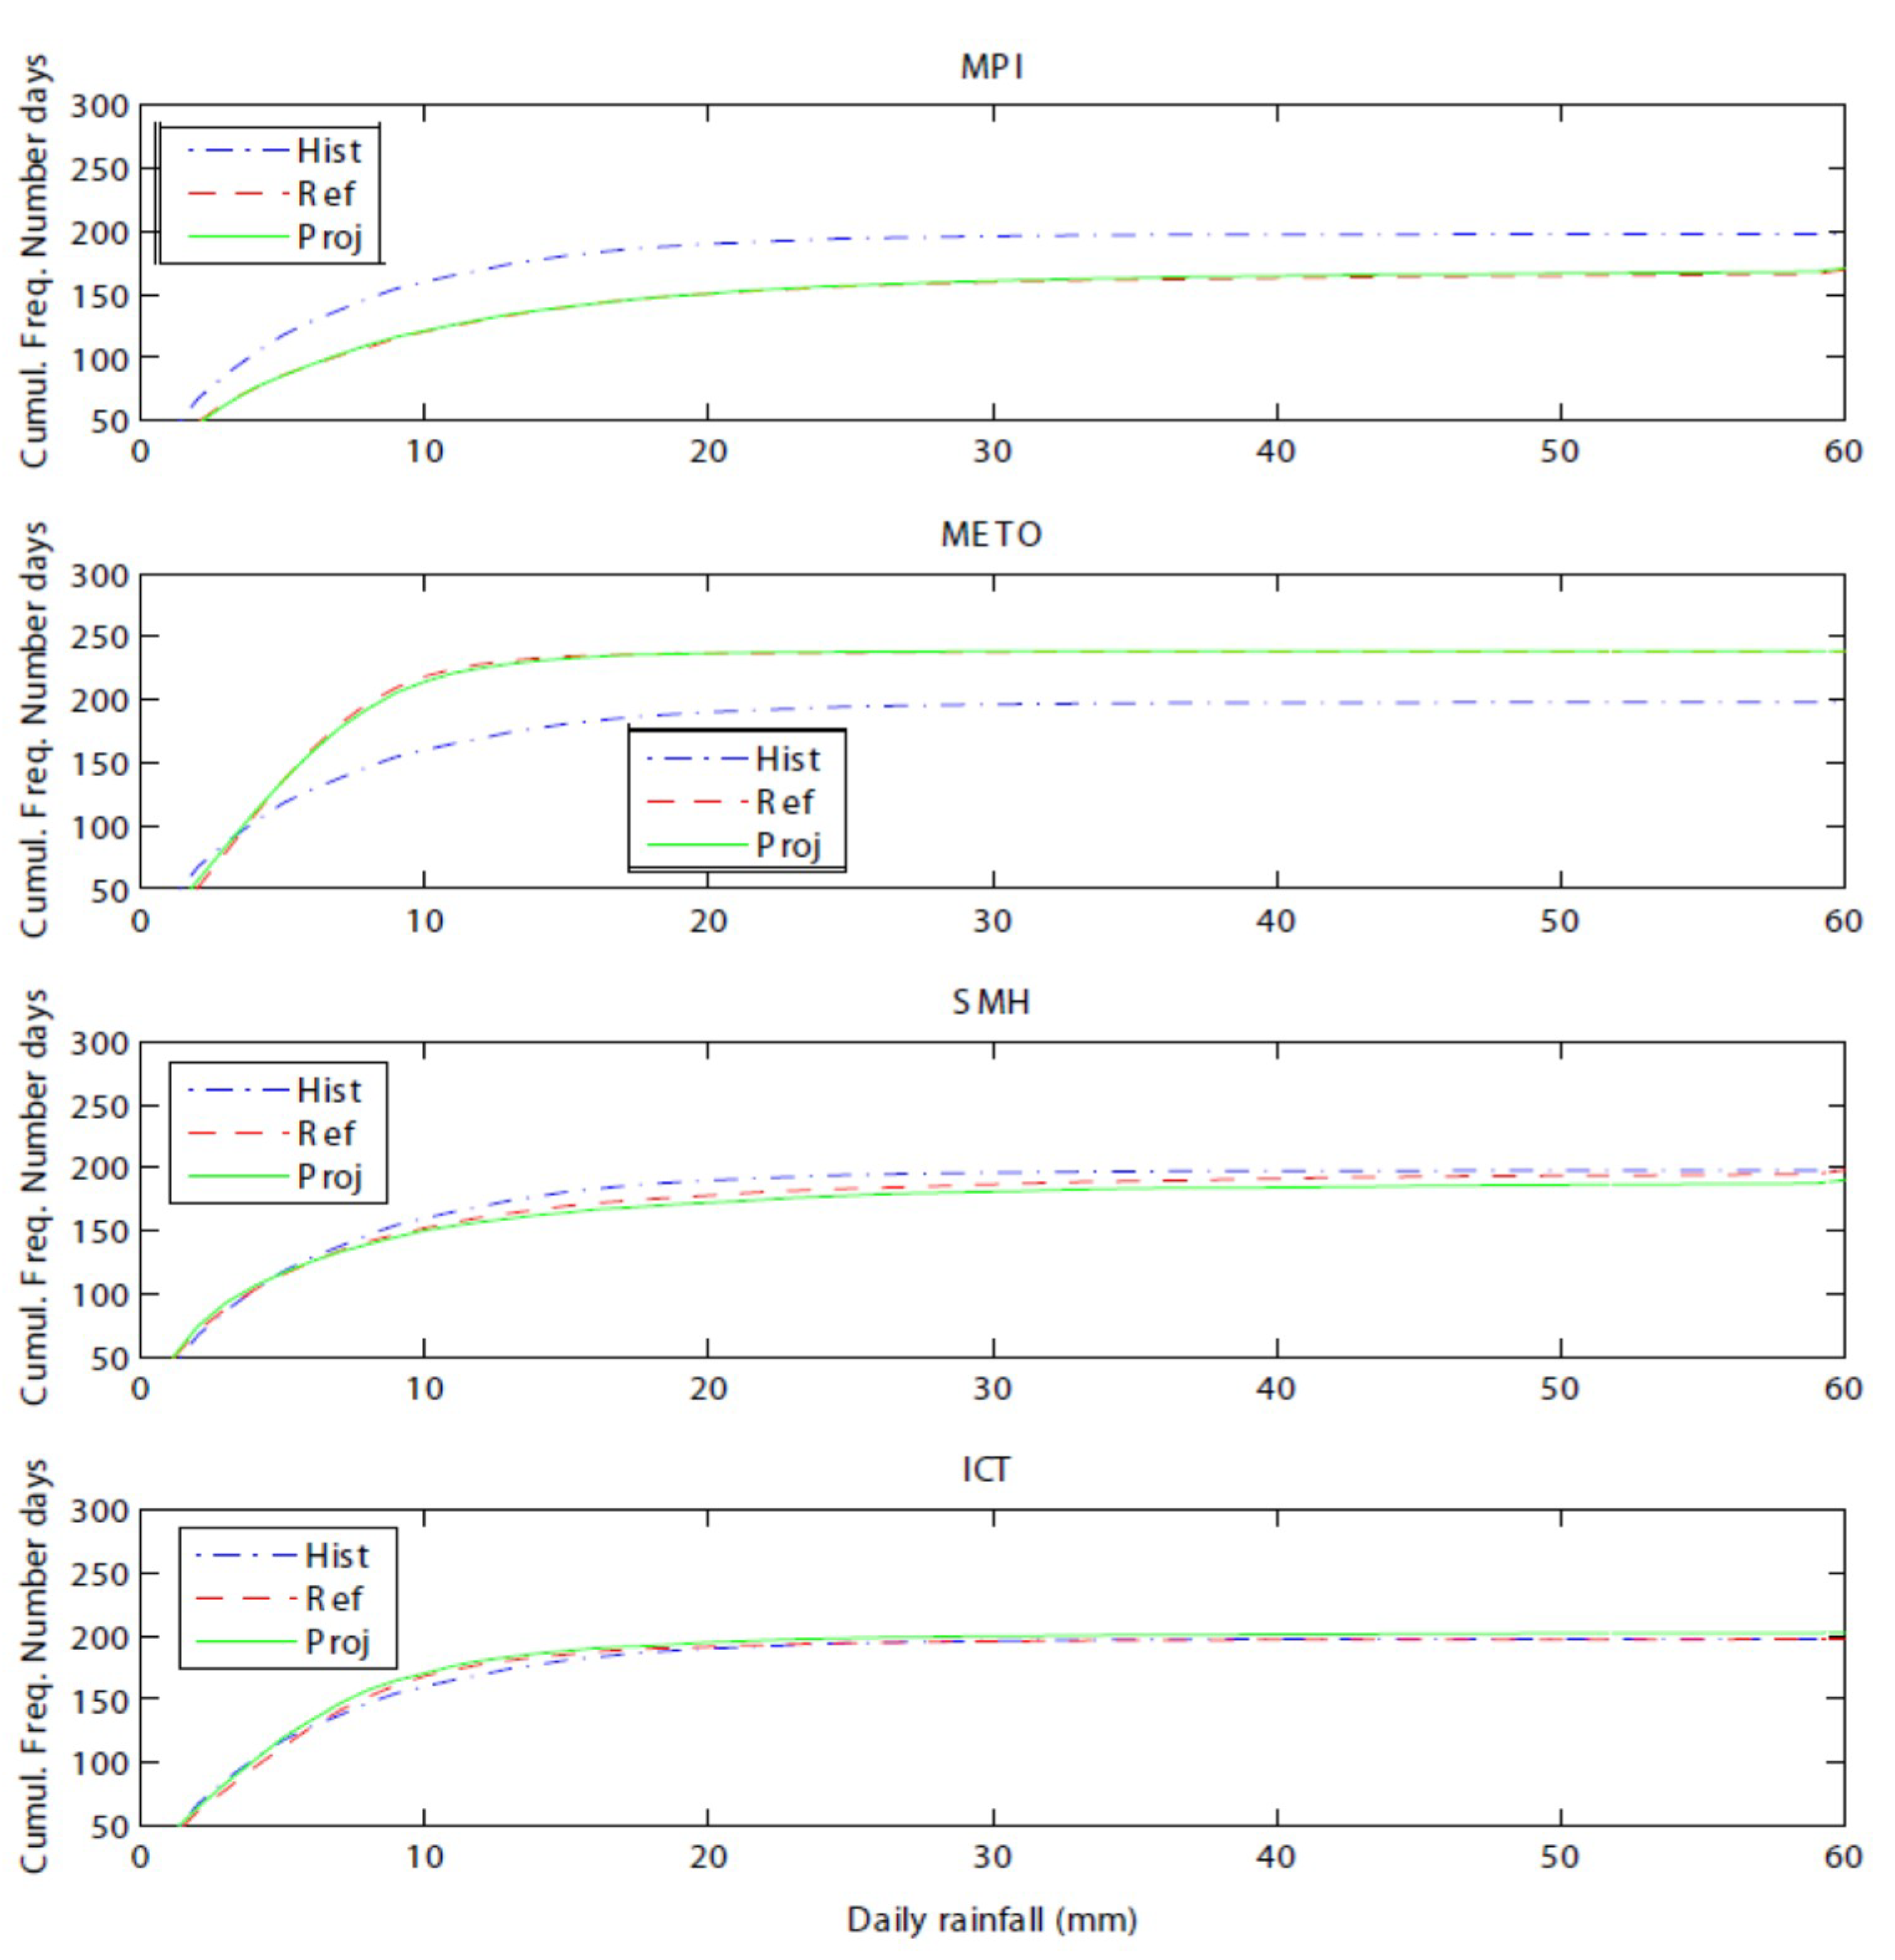
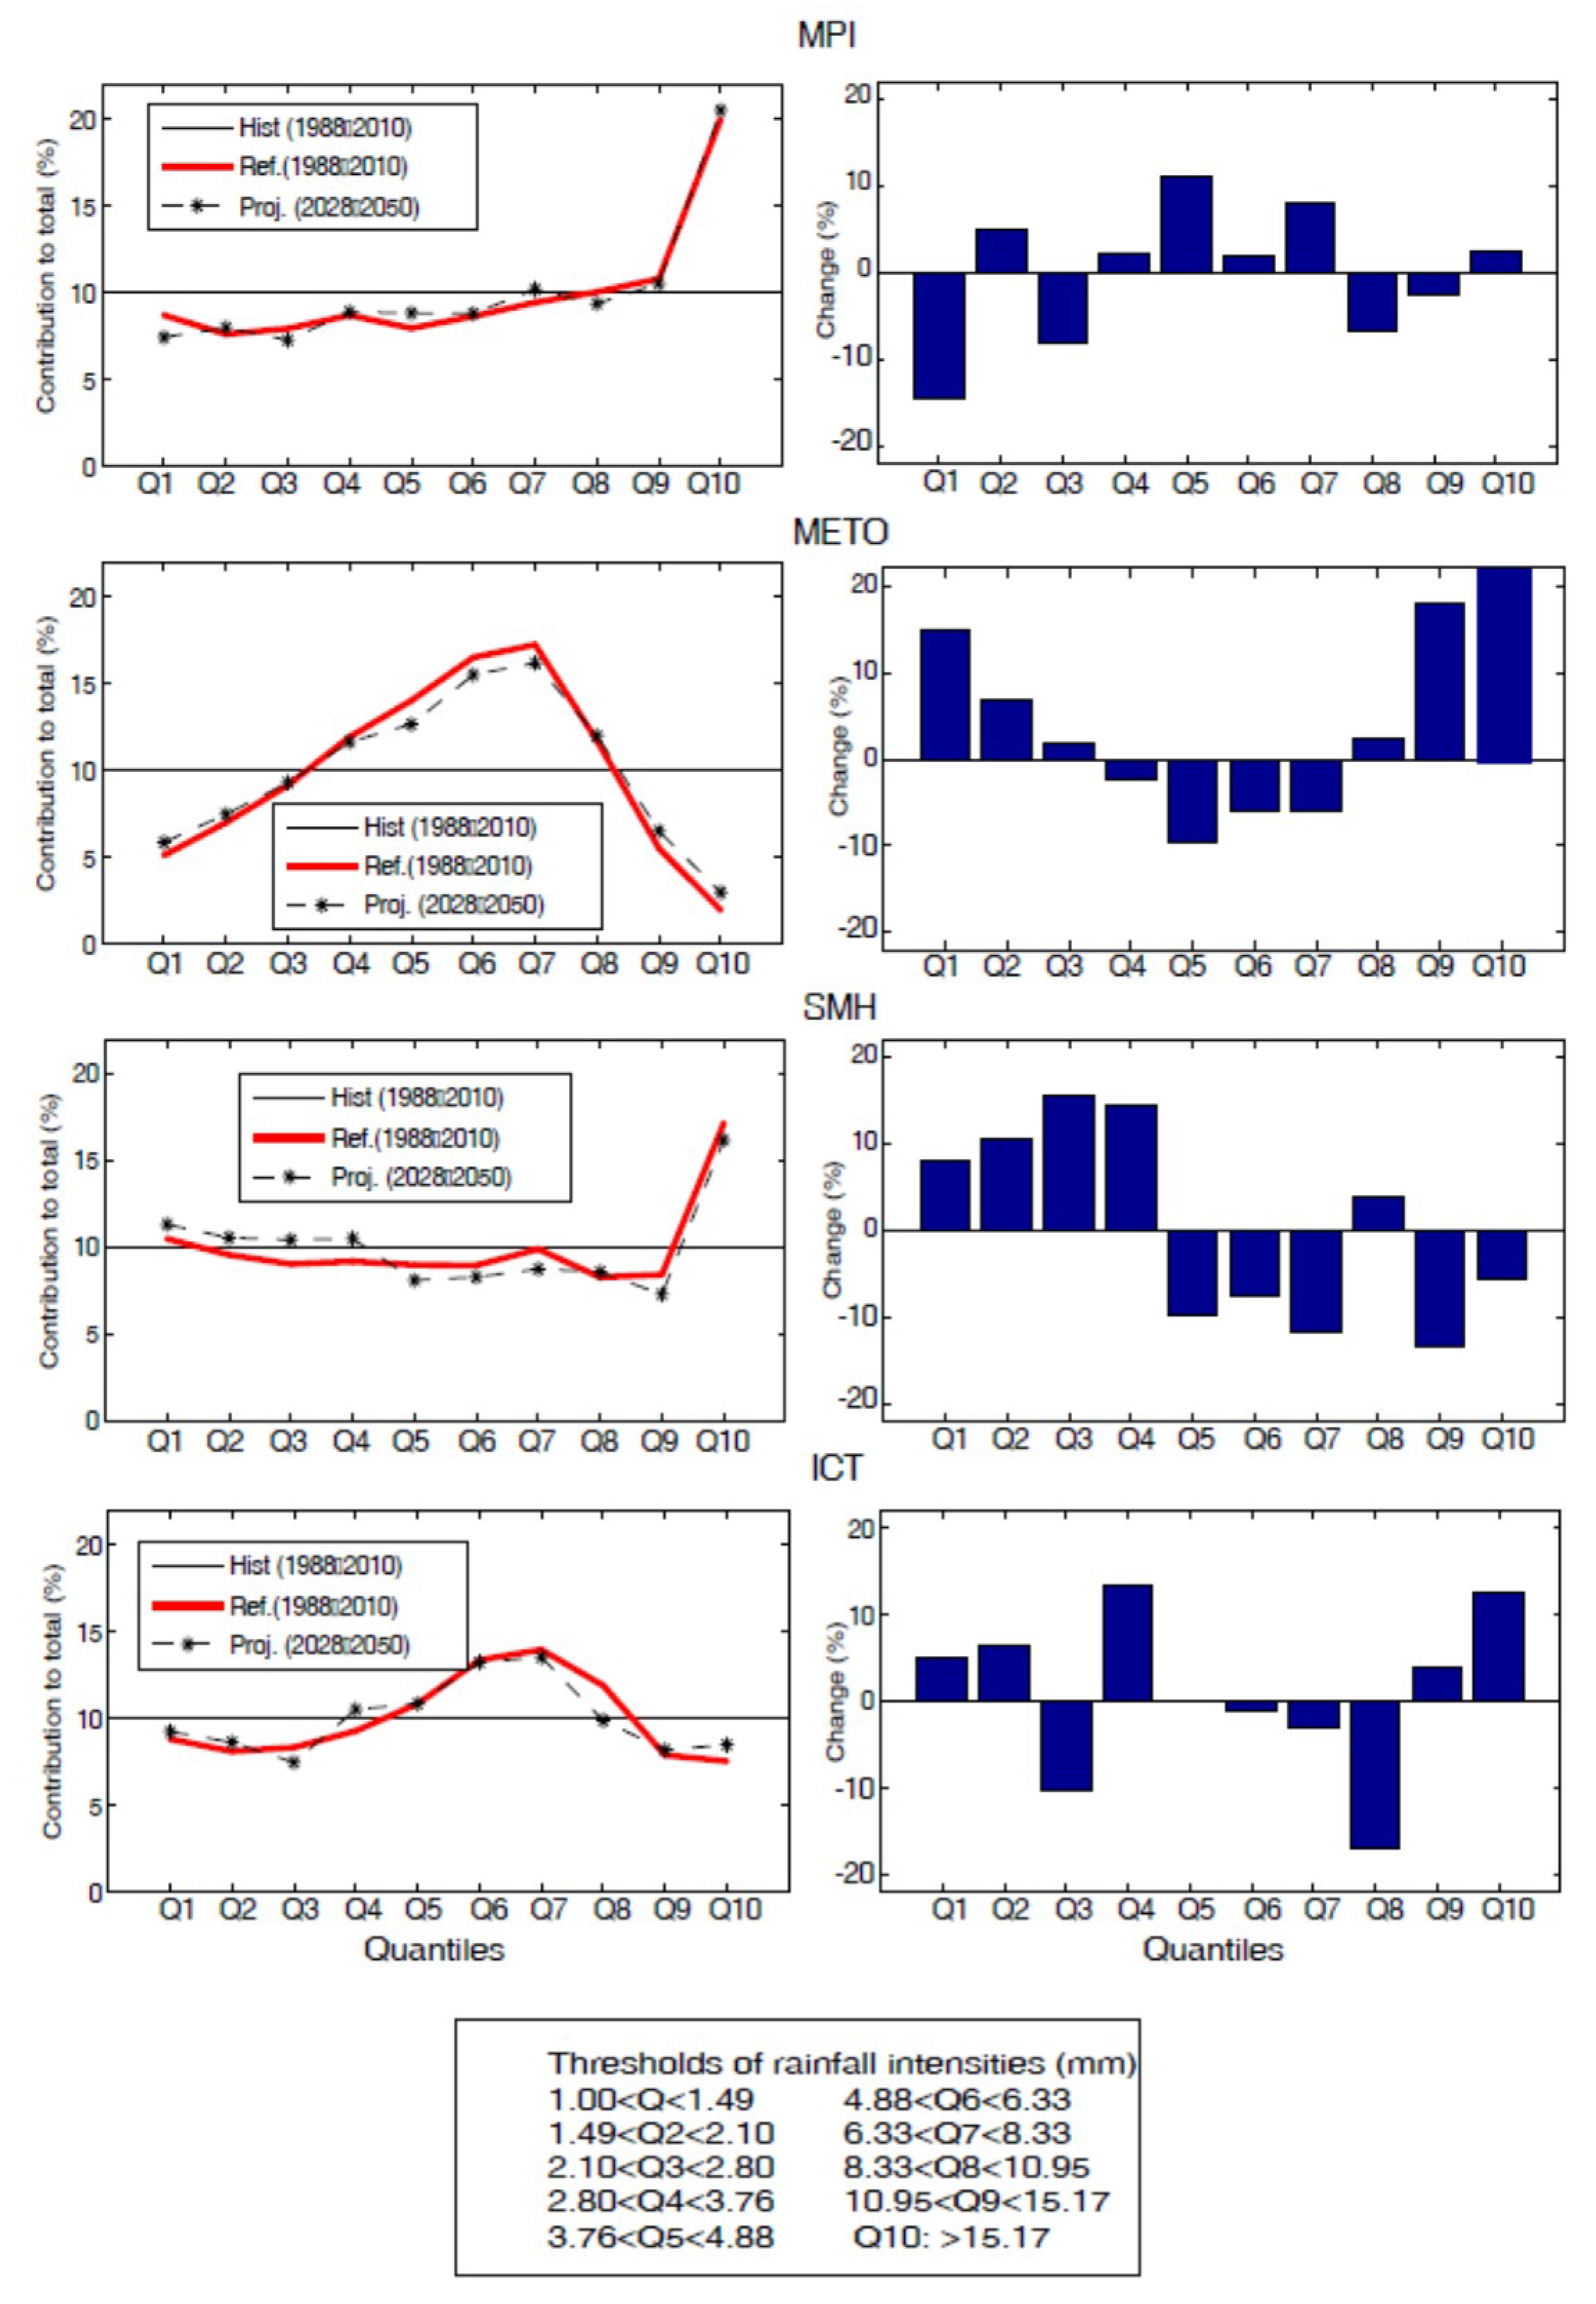
4.4. Frequency Analysis of Rainfall Distribution in the Mono River Basin
4.5. Analysis of Extreme Precipitation under Present Day and Future Climates
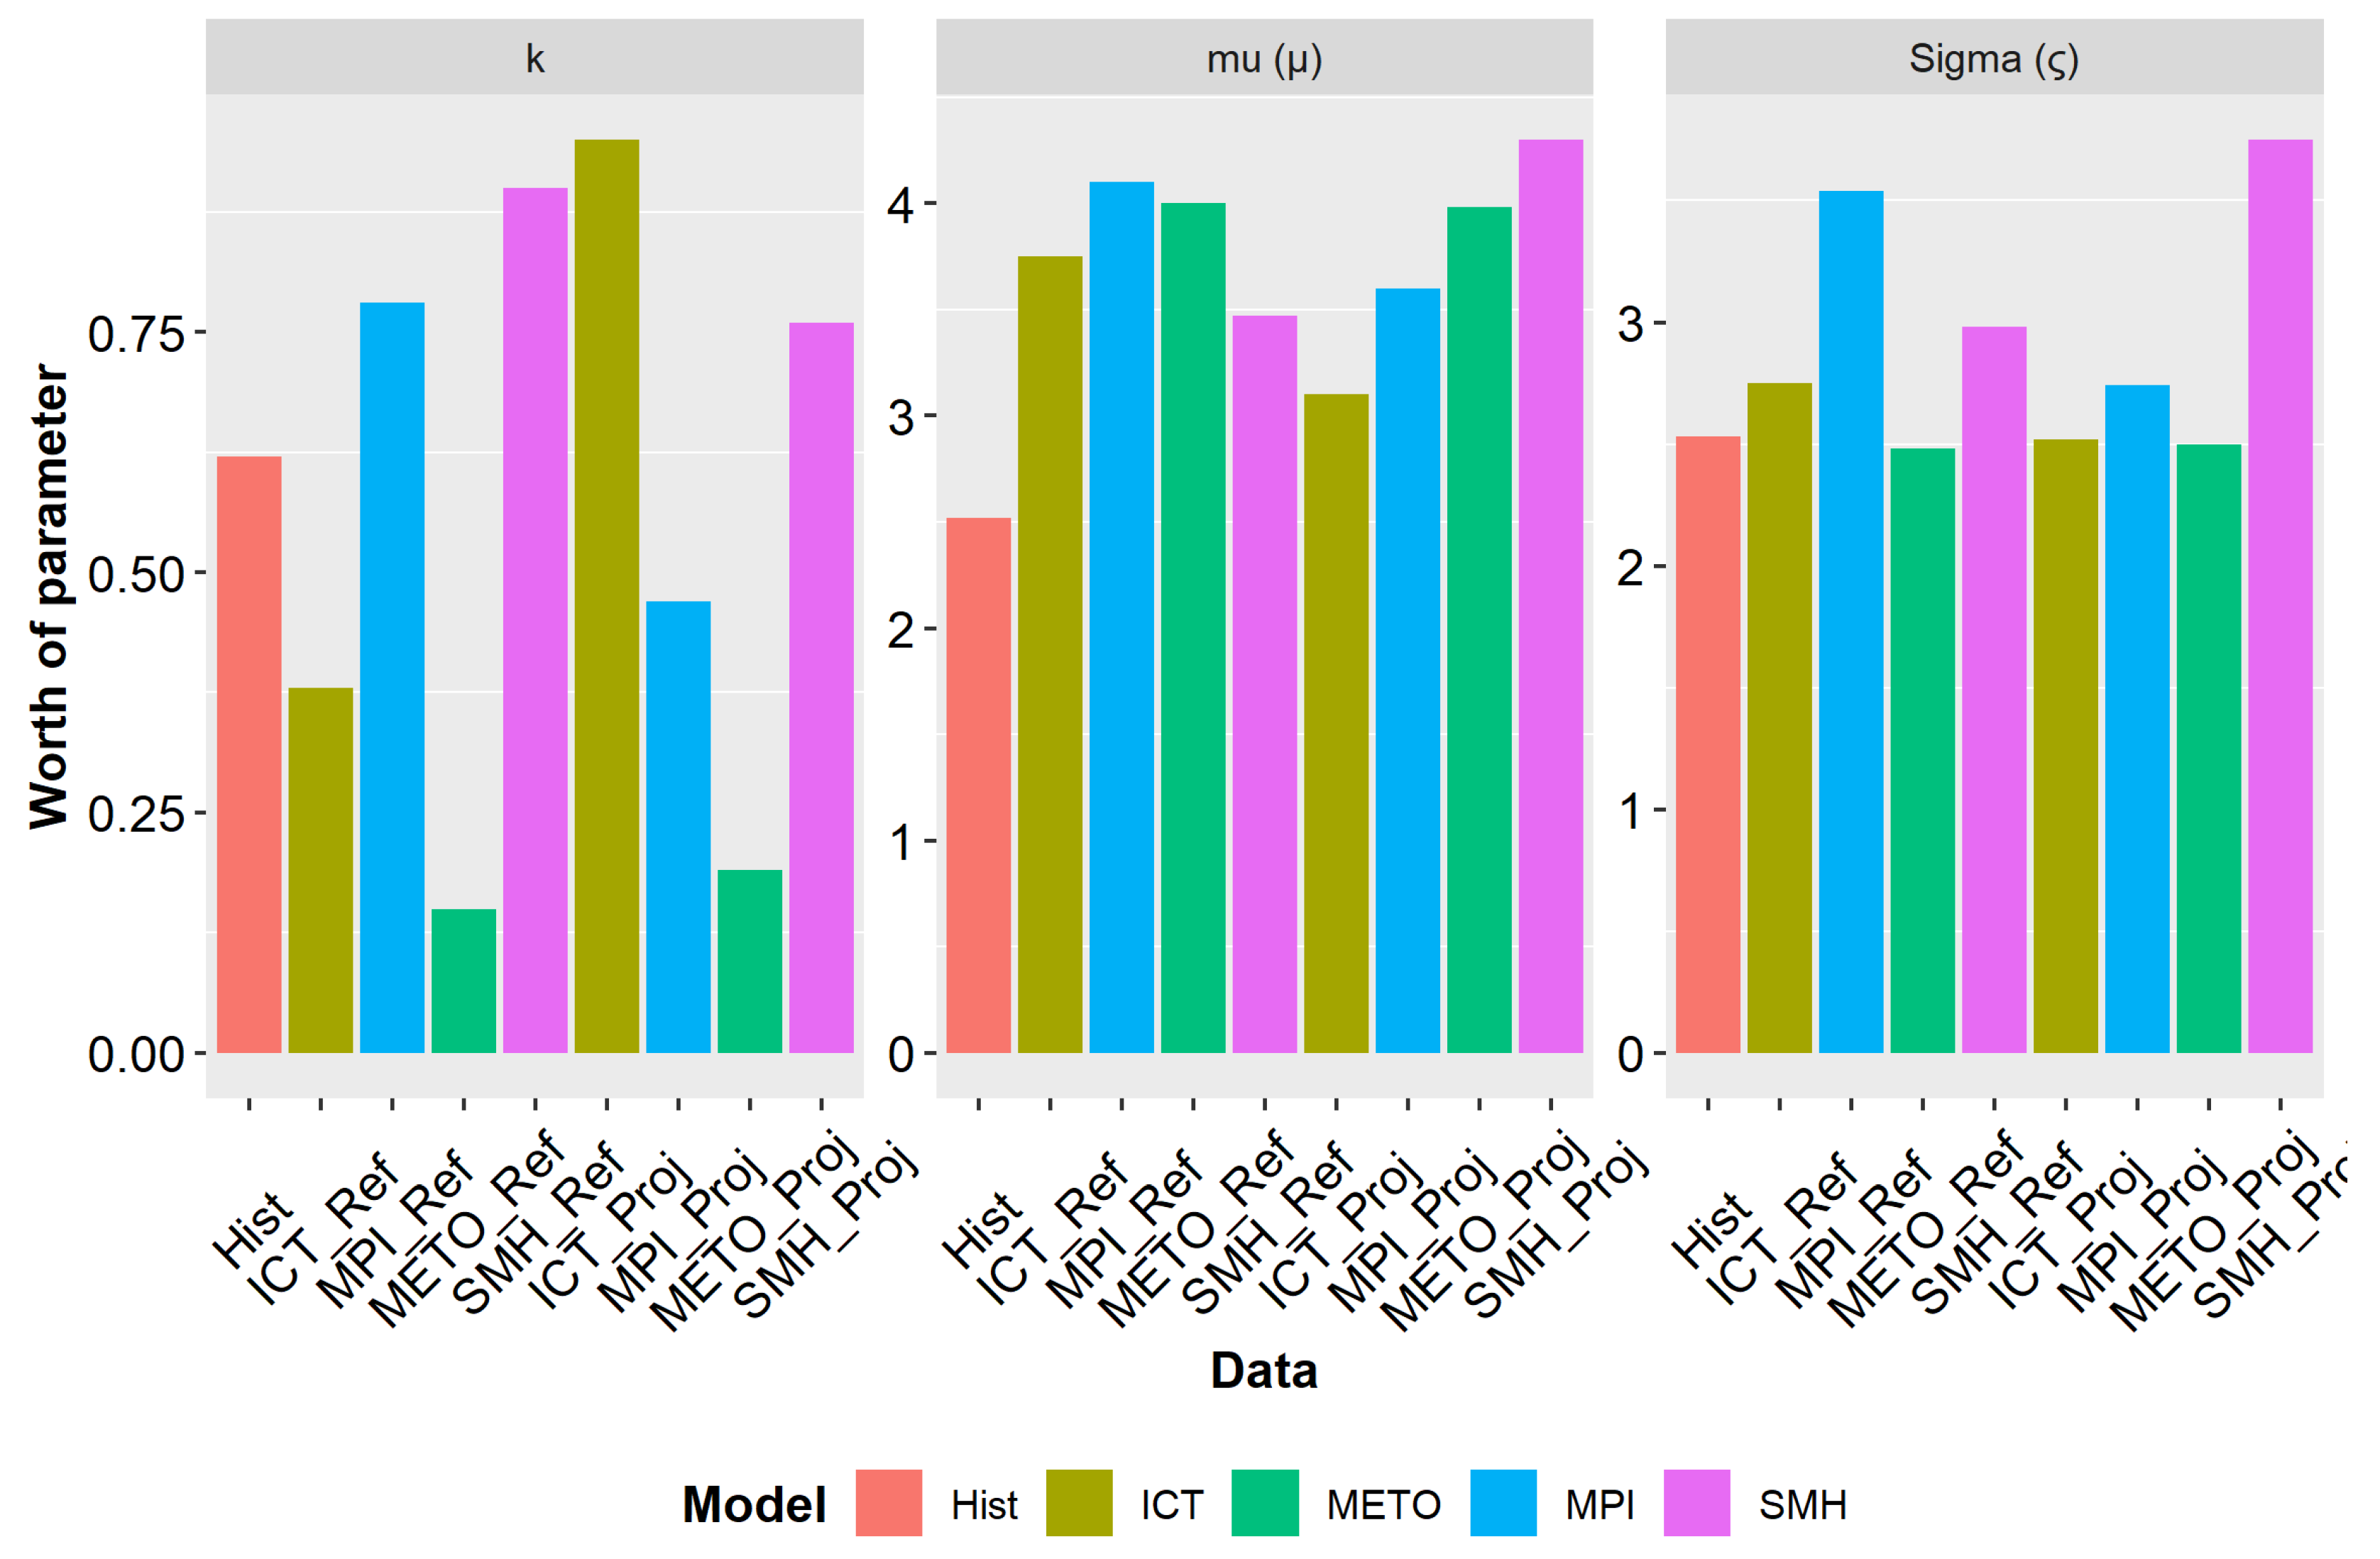
4.6. Analysis of the Return Periods of Rainfall Extreme Using a GEV Model
5. Conclusions
Author Contributions
Funding
Acknowledgments
Conflicts of Interest
References
- Brown, O.L.I.; Hammill, A.; Mcleman, R. Climate change as the ‘new’ security threat: Implications for Africa. Int. Aff. 2007, 83, 1141–1154. [Google Scholar] [CrossRef]
- Amoussou, E. Variabilité Pluviométrique et Dynamique Hydro-Sédimentaire du Bassin Versant du Complexe Fluvio-Lagunaire Mono-Ahémé-Couffo (Afrique de l’ouest). Ph.D. Thesis, Université de Bourgogne, Dijon, France, January 2010. [Google Scholar]
- Mladjic, B.; Sushama, L.; Khaliq, M.N.; Laprise, R.; Caya, D.; Roy, R. Canadian RCM projected changes to extreme precipitation characteristics over Canada. J. Clim. 2011, 24, 2565–2584. [Google Scholar] [CrossRef] [Green Version]
- Tramblay, Y.; Amoussou, E.; Dorigo, W.; Mahé, G. Flood risk under future climate in data sparse regions: Linking extreme value models and flood generating processes. J. Hydrol. 2014, 519, 549–558. [Google Scholar] [CrossRef]
- Dilley, M.; Chen, R.S.; Deichmann, U.; Lerner-Lam, A.L.; Arnold, M. Natural Disaster Hotspots: A Global Risk Analysis; World Bank: Washington, DC, USA, 2005; Volume 7. [Google Scholar]
- Crétat, J.; Vizy, E.K.; Cook, K.H. How well are daily intense rainfall events captured by current climate models over Africa? Clim. Dyn. 2014, 42, 2691–2711. [Google Scholar] [CrossRef]
- Panthou, G.; Lebel, T.; Vischel, T.; Quantin, G.; Sane, Y.; Ba, A.; Ndiaye, O.; Diongue-Niang, A.; Diopkane, M. Rainfall intensification in tropical semi-arid regions: The Sahelian case Rainfall intensification in tropical semi-arid regions: The Sahelian case. Environ. Res. Letts. 2018, 13, 064013. [Google Scholar] [CrossRef]
- Niasse, M.; Coalition, I.L. Climate-Induced Water Conflict Risks in West Africa: Recognizing and Coping with Increasing Climate Impacts on Shared Watercourses. In Human Security and Climate Change; PRIO, CICERO and GECHS: Asker, Norway, 2005; pp. 21–23. Available online: https://www.researchgate.net/profile/Madiodio_Niasse/publication/237699436_Climate-Induced_Water_Conflict_Risks_in_West_Africa_Recognizing_and_Coping_with_Increasing_Climate_Impacts_on_Shared_Watercourses/links/5440fe550cf2a76a3cc60e7c.pdf (accessed on 1 January 2019).
- Loughlin, J.O.; Witmer, F.D.W.; Linke, A.M.; Laing, A.; Gettelman, A.; Dudhia, J. Climate variability and con fl ict risk in East. Proc. Natl. Acad. Sci. USA 2012, 109, 18344–18349. [Google Scholar]
- Brown, O.; Crawford, A. Climate change: A new threat to stability in West Africa? Evidence from Ghana and Burkina Faso Climate change: A new threat to stability in West Africa? Evidence from Ghana and Burkina Faso 1. Afr. Secur. Stud. 2010, 17, 39–57. [Google Scholar] [CrossRef]
- Collier, P.; Conway, G.; Venables, T. Climate change and Africa. Oxf. Rev. Econ. Policy 2008, 24, 337–353. [Google Scholar] [CrossRef]
- Oyebande, L. Climate Change Impact on Water Resources at the Transboundary Level in West Africa: The Cases of the Senegal, Niger and Volta Basins. Open Hydrol. J. 2013, 4, 163–172. [Google Scholar] [CrossRef] [Green Version]
- Barbe, L. Rainfall Variability in West Africa during the Years 1950–1990. J. Clim. 2002, 15, 187–202. [Google Scholar] [CrossRef]
- Dezetter, A.; Servat, E.; Paturel, J.E.; Mahé, G.; Dieulin, C. Using general circulation model outputs to assess impacts of climate change on runoff for large hydrological catchments in West Africa Using general circulation model outputs to assess impacts of climate change on runoff for large hydrological catchments. Hydrol. Sci. J. 2009, 6667, 1. [Google Scholar]
- Houghton, J.T.; Ding, Y.D.; Griggs, D.J.; Noguer, M.; van der Linden, P.J.; Dai, X.; Maskell, K.; Johnson, C.A. Climate Change 2001: The Scientific Basis; The Press Syndicate of the University of Cambridge: Cambridge, UK, 2001. [Google Scholar]
- IPCC (Intergovernmental Panel on Climate Change). Summary for Policymakers. In Climate Change 2007: The Physical Science Basis; Contribution of Working Group I to the Fourth Assessment Report of the Intergovernmental Panel on Climate Change; Solomon, S., Qin, M.M., Chen, M.M.Z., Averyt, K.B., Tignor, M., Miller, H.L., Eds.; Cambridge University Press: Cambridge, UK; New York, NY, USA, 2007; pp. 1–18. [Google Scholar]
- Paeth, H.; Hall, N.M.; Gaertner, M.A.; Alonso, M.D.; Moumouni, S.; Polcher, J.; Ruti, P.M.; Fink, A.H.; Gosset, M.; Lebel, T.; et al. Progress in regional downscaling of West African precipitation Progress in regional downscaling of west African precipitation. Atmos. Sci. Lett. 2016, 12, 75–82. [Google Scholar] [CrossRef]
- Louis, J.-F. A Parametric Model of Vertical Fluxes in the atmosphere. Bound. Layer Meteorol. 1979, 17, 187–202. [Google Scholar] [CrossRef]
- Dayan, U.; Nissen, K.; Ulbrich, U. Review Article: Atmospheric conditions inducing extreme precipitation over the eastern and western Mediterranean. Nat. Hazards Earth Syst. Sci. 2015, 15, 2525–2544. [Google Scholar] [CrossRef] [Green Version]
- Katz, R.W.; Parlange, M.B.; Naveau, P. Statistics of extremes in hydrology. Adv. Water Ressour. 2002, 25, 1287–1304. [Google Scholar] [CrossRef] [Green Version]
- Fowler, H.J.; Blenkinsop, S.; Tebaldi, C. Linking climate change modelling to impacts studies: Recent advances in downscaling techniques for hydrological. Int. J. Climatol. 2007, 27, 1547–1578. [Google Scholar] [CrossRef]
- Lebel, T.; le Barbé, L.; Delclaux, F.; Polcher, J. From GCM scales to hydrological scales: Rainfall variability in West Africa. Stoch. Environ. Res. Risk Assess. 2000, 14, 275–295. [Google Scholar] [CrossRef]
- Paeth, H.; Scholten, A.; Friederichs, P.; Hense, A. Uncertainties in climate change prediction: El Niño-Southern Oscillation and monsoons. Glob. Planet. Chang. 2008, 60, 265–288. [Google Scholar] [CrossRef]
- Camberlin, P.; Fauchereau, N.; Gabriel, S. Empirical predictability study of October–December East African rainfall. Q. J. R. Meteorol. Soc. 2002, 128, 2239–2256. [Google Scholar]
- Girmes, H.; Robin, P. Improving Seasonal Forecasting in the Low Latitudes. Mon. Weather Rev. 2006, 134, 1859–1879. [Google Scholar]
- Paeth, H.; Diederich, M. Postprocessing of simulated precipitation for impact research in West Africa. Part II: A weather generator for daily data. Clim. Dyn. 2011, 36, 1337–1348. [Google Scholar] [CrossRef]
- López-Moreno, J.I.; Beniston, M. Daily precipitation intensity projected for the 21st century: Seasonal changes over the Pyrenees. Theor. Appl. Climatol. 2009, 95, 375–384. [Google Scholar] [CrossRef] [Green Version]
- Olume, V. Hydrological Processes in Regional Climate Model Simulations of the Central United States Flood of June–July 1993. J. Hydrometeorol. 2003, 4, 584–598. [Google Scholar]
- Fowler, H.J.; Ekström, M.; Kilsby, C.G.; Jones, P.D. New estimates of future changes in extreme rainfall across the UK using regional climate model integrations. 1. Assessment of control climate. J. Hydrol. 2005, 300, 212–233. [Google Scholar] [CrossRef]
- Dee, D.P.; Uppala, S.M.; Simmons, A.J.; Berrisford, P.; Poli, P.; Kobayashi, S.; Andrae, U.; Balmaseda, M.A.; Balsamo, G.; Bauer, D.P.; et al. The ERA-Interim reanalysis: Configuration and performance of the data assimilation system. Q. J. R. Meteorol. Soc. 2011, 137, 553–597. [Google Scholar] [CrossRef]
- Vose, R.S.; Schmoyer, R.L.; Steurer, P.M.; Peterson, T.C.; Heim, R.; Karl, T.R.; Eischeid, J.K. The Global Historical Climatology Network: Long-Term Monthly Temperature, Precipitation, Sea Level Pressure, and Station Pressure Data; Oak Ridge National Lab., TN (United States). Carbon Dioxide Information Analysis Center: Washington, DC, USA, 1992.
- Pendergrass Angeline, The Climate Data Guide: GPCP (Monthly): Global Precipitation Climatology Project, National Center for Atmospheric Research Staff (Eds.), Last Modified 02 July 2016. 2016. Available online: https://climatedataguide.ucar.edu/climate-data/gpcp-monthly-global-precipitation-climatology-project. (accessed on 2 January 2018).
- New, M.; Lister, D.; Hulme, M.; Makin, I. A high-resolution data set of surface climate over global land areas. Clim. Res. 2002, 21, 1–25. [Google Scholar] [CrossRef] [Green Version]
- Simmons, A.J.; Jones, P.D.; Bechtold, V.C.; Beljaars, A.C.M.; Ka, P.W. Comparison of trends and low-frequency variability in CRU, ERA-40, and NCEP//NCAR analyses of surface air temperature. J. Geophys. Res. 2004, 109, 1–18. [Google Scholar] [CrossRef]
- Hewitt, C.D.; Griggs, D.J. Ensembles-based predictions of climate changes and their impacts. Eos 2004, 85, 566. [Google Scholar] [CrossRef]
- Shahid, S. Trends in extreme rainfall events of Bangladesh. Theor. Appl. Climatol. 2011, 104, 489–499. [Google Scholar] [CrossRef]
- Sciences, E.; Carolina, N.; Columbia, B.; Sciences, E.; Carolina, N. Avoiding Inhomogeneity in Percentile-Based Indices of Temperature Extremes. J. Clim. 2005, 18, 1641–1651. [Google Scholar]
- Villarini, G.; Scoccimarro, E.; Gualdi, S. Projections of heavy rainfall over the central United States based on CMIP5 models. Atmos. Sci. Lett. 2013, 14, 200–205. [Google Scholar] [CrossRef]
- Zolina, O.; Simmer, C.; Belyaev, K.; Kapala, A.; Gulev, S. Improving Estimates of Heavy and Extreme Precipitation Using Daily Records from European Rain Gauges. J. Hydrometeorol. 2009, 10, 701–716. [Google Scholar] [CrossRef]
- Amoussou, E.; Camberlin, P.; Totin, V.S.H.; Pérard, J. Événements hydroclimatiques et risque d’inondation au sud-ouest du Bénin. In Proceedings of the 24ème colloque de l’Association Internationale de Climatologie, Rovereto, Italy, 6–10 September 2011; p. 2010. [Google Scholar]
- Amoussou, E.; Tramblay, Y.; Totin, H.S.V.; Mahé, G. Dynamique et modélisation des crues dans le bassin du Mono à Nangbéto (Togo/Bénin). Hydrol. Sci. J. 2014, 59, 2060–2071. [Google Scholar] [CrossRef]
- Fisher, R.A.; Tippett, L.H.C. Limiting forms of the frequency distribution in the largest particle size and smallest member of a sample. Proc. Camb. Phil. Soc. 1928, 24, 180–190. [Google Scholar] [CrossRef]
- Nelder, J.A.; Mead, R. Nelder1965.pdf. Comput. J. 1965, 7, 308–313. [Google Scholar] [CrossRef]
- Coles, S. An Introduction to Statistical Modeling of Extreme Values; Springer: London, UK, 2011; Volume 208. [Google Scholar]
- Chu, P.S.; Zhao, X.; Ruan, Y.; Grubbs, M. Extreme rainfall events in the Hawaiian Islands. J. Appl. Meteorol. Climatol. 2009, 48, 502–516. [Google Scholar] [CrossRef] [Green Version]
- Cunnane, C. Statistical Distributions for Flood Frequency Analysis; WMO Operational Hydrolofy report no. 33; the Secretariat of the Word Meteorological Organization: Geneva, Switzerland, 1989; pp. 581–582. [Google Scholar]
- Jenkinson, A.F. The frequency distribution of the annual maximum (or minimum) values of meteorological elements. Q. J. R. Meteorol. Soc. 1955, 81, 158–171. [Google Scholar] [CrossRef]
- El Adlouni, S.; Quarda, T.B.M.J. Comparaison des méthodes d’estimation des paramètres du modèle GEV non stationnaire. Rev. des Sci. l’Eau 2008, 21, 35–50. [Google Scholar] [CrossRef] [Green Version]
- Ntajal, J.; Lamptey, B.L.; Mianikpo, J.; Kpotivi, W.K. R Ainfall T Rends and F Lood F Requency a Nalyses in the L Ower M Ono R Iver B Asin in T Ogo, W Est a Frica. Int. J. Adv. Res. 2016, 4, 1–11. [Google Scholar]
- Davison, A. Bootstrap Methods and their Application, no. 1.; Cambridge University Press: Cambridge, UK, 1997. [Google Scholar]
- Stedinger, J.R.; Vogel, R.M.; Foufoula-Georgiou, E. Frequency Anlysis of Extreme Events. In Handbook of Hydrology; Maidment, D.D.M.-H., Ed.; McGraw-Hill: New York, NY, USA, 1993; p. 68. [Google Scholar]
- Lamptey, B.L. Comparison of gridded multisatellite rainfall estimates with gridded gauge rainfall over West Africa. J. Appl. Meteorol. Climatol. 2008, 47, 185–205. [Google Scholar] [CrossRef] [Green Version]
- Gbobaniyi, E.; Sarr, A.; Sylla, M.B.; Diallo, I.; Lennard, C.; Dosio, A.; Dhiédiou, A.; Kamga, A.; Klutse, N.A.; Hewitson, B.; et al. Climatology, annual cycle and interannual variability of precipitation and temperature in CORDEX simulations over West Africa. Int. J. Climatol. 2014, 34, 2241–2257. [Google Scholar] [CrossRef]
- Diallo, I.; Sylla, M.B.; Giorgi, F.; Gaye, A.T.; Camara, M. Multimodel GCM-RCM ensemble-based projections of temperature and precipitation over West Africa for the Early 21st Century. Int. J. Geophys. 2012, 2012. [Google Scholar] [CrossRef] [Green Version]
- Riede, J.O.; Posada, R.; Fink, A.H.; Kaspar, F. What’s on the 5th IPCC Report for West Africa? In Adaptation to Climate Change and Variability in Rural West Africa; Springer: Cham, Switzerland, 2016; pp. 7–23. [Google Scholar]
- Ruti, P.M.; Williams, J.E.; Hourdin, F.; Guichard, F.; Boone, A.; Van Velthoven, P.; Favot, F.; Musat, I.; Rummukainen, M.; Domínguez, M.; et al. The West African climate system: A review of the AMMA model inter-comparison initiatives. Atmos. Sci. Lett. 2011, 12, 116–122. [Google Scholar] [CrossRef]
- Lafore, J.P.; Flamant, C.; Giraud, V.; Guichard, F.; Knippertz, P.; Mahfouf, J.F.; Mascart, P.; Williams, E.R. Introduction to the AMMA Special Issue on ‘Advances in understanding atmospheric processes over West Africa through the AMMA field campaign’. Q. J. R. Meteorol. Soc. 2010, 136, 2–7. [Google Scholar] [CrossRef] [Green Version]
- Angelina, A.; Djibo, A.G.; Seidou, O.; Sanda, I.S.; Sittichok, K. Modifications du régime d’écoulement du fleuve Niger à Koulikoro sous changement climatique. Hydrol. Sci. J. 2015, 60, 1709–1723. [Google Scholar] [CrossRef]
- Sylla, M.B.; Nikiema, P.M.; Gibba, P.; Kebe, I.; Klutse, N.A.B. Climate Change over West Africa: Recent Trends and Future Projections. In Adaptation to Climate Change and Variability in Rural West Africa; Yaro, J.A., Hesselberg, J., Eds.; Springer International Publishing: Berlin, Germany, 2016; pp. 1–244. [Google Scholar]
- Mahe, G. Mémoire Habilitation à Diriger des Recherches Variabilité pluie-débit en Afrique de l’Ouest et Centrale au 20ème siècle: Changements Hydro-Climatiques, Occupation du sol et Modélisation Hydrologique Université des Sciences et Techniques Gil Mahé. HDR Dissertation, Université des Sciences et Techniques Montpellier, Montpellier, France, 2015. [Google Scholar]
- Yabi, I.; Afouda, F. Extreme rainfall years in Benin (West Africa). Quat. Int. 2012, 262, 39–43. [Google Scholar] [CrossRef]
- Kasei, R.; Diekkrüger, B.; Leemhuis, C. Drought frequency in the Volta basin of West Africa. Sustain. Sci. 2010, 5, 89–97. [Google Scholar] [CrossRef]
- Hourdin, F.; Musat, I.; Guichard, F.S.; Ruti, P.M.; Favot, F.; Filiberti, M.A.; Pham, M.; Grandpeix, J.Y.; Polcher, J.; Marquet, P.; et al. Amma-Model intercomparison project. Bull. Am. Meteorol. Soc. 2010, 91, 95–104. [Google Scholar] [CrossRef]
- Tossou, E.M.; Ndiaye, M.L.; Traore, V.B.; Sambou, H.; Kelome, N.C.; SY, B.A.; Diaw, A.T. Characterisation and Analysis of Rainfall Variability in the Mono-Couffo River Watershed Complex, Benin (West Africa). Resour. Environ. 2017, 7, 13–29. [Google Scholar]
- Fowler, H.J.; Wilby, R.L. Detecting changes in seasonal precipitation extremes using regional climate model projections: Implications for managing fluvial flood risk. Water Resour. Res. 2010, 46, 1–17. [Google Scholar] [CrossRef] [Green Version]
- Frei, C.; Scho, R.; Fukutome, S.; Vidale, P.L. Future change of precipitation extremes in Europe: Intercomparison of scenarios from regional climate models. J. Geophys. Res. 2006, 111. [Google Scholar] [CrossRef] [Green Version]
- Beniston, M.; Stephenson, D.B.; Christensen, O.B.; Ferro, C.A.; Frei, C.; Goyette, S.; Halsnaes, K.; Holt, T.; Jylhä, K.; Koffi, B.; et al. Future extreme events in European climate: An exploration of regional climate model projections. Clim. Chang. 2007, 81, 71–95. [Google Scholar] [CrossRef] [Green Version]
- Burn, D.H. The use of resampling for estimating confidence intervals for single site and pooled frequency analysis/Utilisation d’ un rééchantillonnage pour l’ estimation des intervalles de confiance lors d’ analyses fréquentielles mono et multi-site intervals f. Hydrol. Sci. Sci. Hydrol. 2003, 48, 25–38. [Google Scholar] [CrossRef] [Green Version]
- Caya, D.; Laprise, R. A semi-implicit semi-Lagrangian regional climate model: The Canadian RCM. Mon. Weather Rev. 1999, 127, 341–362. [Google Scholar] [CrossRef]
- Hall, M.J.; Van den Boogaard, H.F.; Fernando, R.C.; Mynett, A.E. The construction of confidence intervals for frequency analysis using resampling techniques to cite this version: HAL Id: Hal-00304907 The construction of confidence intervals for frequency analysis using resampling techniques. Hydrol. Earth Syst. Sci. 2004, 8, 235–246. [Google Scholar] [CrossRef]
- Sylla, M.B.; Gaye, A.T.; Jenkins, G.S. On the fine-scale topography regulating changes in atmospheric hydrological cycle and extreme rainfall over West Africa in a regional limate model projections. Int. J. Geophys. 2012. [Google Scholar] [CrossRef]
- Ekström, M.; Fowler, H.J.; Kilsby, C.G.; Jones, P.D. New estimates of future changes in extreme rainfall across the UK using regional climate model integrations. 2. Future estimates and use in impact studies. J. Hydrol. 2005, 300, 234–251. [Google Scholar] [CrossRef]
- Emori, S.; Hasegawa, A.; Suzuki, T.; Dairaku, K. Validation, parameterization dependence, and future projection of daily precipitation simulated with a high-resolution atmospheric GCM. Geophys. Res. Lett. 2005, 32, 1–4. [Google Scholar] [CrossRef]
- Kodja, D.J. Indicateurs des Évènements Hydroclimatiques Extrêmes dans le Bassin Versant de l’Ouémé à l’exutoire de Bonou en Afrique de l’Ouest. Ph.D. Dissertation, Université of Montpellier, Montpellier, France, 2018. [Google Scholar]
- Embrechts, P.; Klüppelberg, C.; Mikosch, T.; Emberchts, P.; Klüppelberg, C.; Mikosch, T. Modelling Extremal Events. In Statistical Methods for Extremal Events; Springer: Berlin/Heidelberg, Germany; NewYork, NY, USA; London, UK; Paris, France; Tokyo, Janpan; Hong Kong, China; Barcelona, Spain; Budapest, Hungary, 1997; pp. 283–370. [Google Scholar]
- Zwiers, F.W.; Kharin, V.V. Changes in the Extremes of the Climate Simulated by CCC GCM2 under CO2 Doubling. J. Clim. 1998, 2, 2200–2222. [Google Scholar] [CrossRef] [Green Version]
- Amoussou, E.; Camberlin, P.; Mahe, G. Impact de la variabilité climatique et du barrage Nangbéto sur l’ hydrologie du système Mono-Couffo (Afrique de l’ Ouest). Hydrol. Sci. J. 2012, 57, 805–817. [Google Scholar]
- Kendall, M.; Stuart, A. Analysis Multivariate; Griffin, C., Ed.; Charles Griffim & Company Ltd.: London, UK, 1975. [Google Scholar]


| Model Number | Regional Climate Model (RCM) | Driving Global Climate Model (GCM) | ||
|---|---|---|---|---|
| RCM | Modeling Agency | GCM | Modeling Agency | |
| CORDEX | ||||
| (1) | REMO | GERICS | CM5A-LR | IPSL |
| (2) | RegCM4-3 | ICTP | MPI-ESM-MR | MPI-M |
| (3) | REMO | MPI-CSC | MPI-ESM-LR | MPI-M |
| (4) | SMHI | RCA4 | CNRM-CERFACS | CNRM-CM5 |
| (5) | SMHI | RCA4 | CM5A-MR | IPSL |
| (6) | SMHI | RCA4 | MPI-ESM-LR | MPI-M |
| CMIP5 | ||||
| (7) | CM5 | CNRM | ||
| (8) | CM5A-LR | IPSL | ||
| (9) | CM5A-MR | IPSL | ||
| (10) | ESM-LR | MPI | ||
| (11) | ESM-MR | MPI | ||
| AMMA-ENSEMBLES | Scenario | |||
| (12) | RegCM3 | ICTP | ECHAM5 | A1B |
| (13) | HIRHAM | METNO | HadCM3 | A1B |
| (14) | REMO | MPI-M | ECHAM | A1B |
| (15) | RCA | SMHI | HadCM3 | A1B |
| RCMs | Ref_1988–2010 | Proj_2028–2050 |
|---|---|---|
| MPI | 42 | 42 |
| METO | 63 | 62 |
| SMH | 47 | 45 |
| ICT | 48 | 48 |
| Precipitation (mm) | Hist | MPI | METO | SMH | ICT |
|---|---|---|---|---|---|
| Ref_1988–2010 | |||||
| 99th percentile | 29.92 | 86.66 | 17.98 | 75.22 | 31.32 |
| Proj_2028–2050 | |||||
| 99th percentile | - | 85.70 | 19.36 | 71.39 | 38.11 |
| Return Periods (Years) | Hist | ICT_Ref | ICT_Proj |
|---|---|---|---|
| 1 | 32.5 | 40 | 90 |
| 2 | 35 | 48 | 100 |
| 5 | 40 | 52.5 | 120 |
| 10 | 45 | 77 | 200 |
| 20 | 47.5 | 89 | 289 |
© 2020 by the authors. Licensee MDPI, Basel, Switzerland. This article is an open access article distributed under the terms and conditions of the Creative Commons Attribution (CC BY) license (http://creativecommons.org/licenses/by/4.0/).
Share and Cite
Amoussou, E.; Awoye, H.; Totin Vodounon, H.S.; Obahoundje, S.; Camberlin, P.; Diedhiou, A.; Kouadio, K.; Mahé, G.; Houndénou, C.; Boko, M. Climate and Extreme Rainfall Events in the Mono River Basin (West Africa): Investigating Future Changes with Regional Climate Models. Water 2020, 12, 833. https://doi.org/10.3390/w12030833
Amoussou E, Awoye H, Totin Vodounon HS, Obahoundje S, Camberlin P, Diedhiou A, Kouadio K, Mahé G, Houndénou C, Boko M. Climate and Extreme Rainfall Events in the Mono River Basin (West Africa): Investigating Future Changes with Regional Climate Models. Water. 2020; 12(3):833. https://doi.org/10.3390/w12030833
Chicago/Turabian StyleAmoussou, Ernest, Hervé Awoye, Henri S. Totin Vodounon, Salomon Obahoundje, Pierre Camberlin, Arona Diedhiou, Kouakou Kouadio, Gil Mahé, Constant Houndénou, and Michel Boko. 2020. "Climate and Extreme Rainfall Events in the Mono River Basin (West Africa): Investigating Future Changes with Regional Climate Models" Water 12, no. 3: 833. https://doi.org/10.3390/w12030833