Trends of Runoff Variation and Effects of Main Causal Factors in Mun River, Thailand During 1980–2018


1
Institute of Geographic Sciences and Natural Resources Research, Chinese Academy of Sciences, Beijing 100101, China
2
University of Chinese Academy of Sciences, Beijing 100049, China
3
Twenty First Century Aerospace Technology Co. Ltd., Beijing 100096, China
4
Environmental Engineering and Disaster Management Program, School of Interdisciplinary Studies, Mahidol University, Kanchanaburi Campus, Kanchanaburi 71150, Thailand
*
Authors to whom correspondence should be addressed.
Water 2020, 12(3), 831; https://doi.org/10.3390/w12030831
Submission received: 5 February 2020
/
Revised: 7 March 2020
/
Accepted: 12 March 2020
/
Published: 15 March 2020
(This article belongs to the Special Issue Application of Space-Time Statistics in Water Resources)
Abstract
:Mun River is the largest tributary of the Mekong River in Thailand and provides abundant water resources not only for an important agricultural area in Thailand but also for the lower Mekong River. To understand how the runoff of Mun River responds to climate change and human activities in recent decades, this study performed a detailed examination of the characteristics of runoff variation based on measurements at two hydrological gauging stations on the main stem of Mun River during 1980–2018. Using the Mann-Kendall test, Morlet wavelet transform and Double Cumulative Curve methods, this study identifies that the variation of annual runoff of Mun River encountered an abruption in 1999/2000, with an increased trend taking place since then. Furthermore, a detailed assessment of the effects of the variations in rainfall, temperature, evaporation, and land use types extracted from remote sensing images at the basin scale reveals that a significant reduction in forest area and slight reductions in evaporation and farmland area taking place since 1999 can lead to an increase in the runoff of Mun River, while the dramatic increase in garden area since 1999 tends to make the runoff decrease.
1. Introduction
Detecting trends of variations in hydrological variables and identifying main causes for the variations have been given emphasis in recent years, with an increasing scientific consensus on global and regional climate change due to human activities [1]. A detailed understanding of the variation of river runoff so as to reveal the changes in the spatio-temporal distribution and quantity of surface water resource is critical [2], since they deeply affect ecology, economy and people’s livelihood along rivers [3]. The quantity and regime of river runoff depend on a variety of climate factors, including rainfall, temperature, evaporation, wind, etc. [4]. The impact of human activities is mainly reflected through land use change [5]. Current changes in river runoff vary on different scales and the report of IPCC (Intergovernmental Panel on Climate Change) in 2013 predicted that global climate change is likely to exert substantial impacts on surface water resource across the world [6]. In some regions water availability will increase but in many densely populated areas, particularly urbanizing regions with intensive conflicts among different water users, water scarcity will increase [7]. During 1936-1998, the study of runoff variation in Yenisei River showed a significantly increasing trend, while the precipitation in the area essentially showed a decreasing trend; nevertheless, the runoff of Lena River shows an increasing trend, but the regional precipitation shows only a slight increasing trend [8]. As a result, there is no sufficient evidence to prove that the changes in runoff are determined solely by precipitation because the rainfall-runoff relationships of rivers vary from one basin to another. Some studies on the variation of annual runoff in the Yangtze River basin of China showed an insignificant increasing trend after 1960 mainly due to the rainfall brought by monsoon climate in the middle and lower reaches [9]. Yet the annual runoff in the Yellow River basin of China showed a continuously decreasing trend from 1950 to 2014, which was caused largely by human activities that took a large amount of water for irrigation and industrial production [10]. A statistically significant decreasing trend was detected based on runoff data from 925 seagoing rivers including the Mekong River from 1948 to 2004, and yet the impact of human activities on global river runoff was found far less than the effect of climate change [11]. In the prediction of future river runoff variation in Thailand and Malaysia, machine learning models and distributed hydrological models coupled with future climate scenarios are employed and the results show that the variation of forest area induced by land use change is a very influential factor [12,13,14].
As the largest tributary of the Mekong River in Thailand, Mun River inputs about 20 × 109 m3 of freshwater per year to the Mekong River on average [15]. This is important for ecosystems and people living in the middle and lower reaches of the Mekong River. The Mun River basin is an important agricultural area in Thailand, where climate change and human activities exert considerable impacts on surface water resource [16]. Some researchers used statistical downscaling methods in combination with hydrological models to model and simulate future rainfall process in the Mun River and the adjacent Chi River basins, and yet found that the responsive relationships of runoff to rainfall in different climate models were different considerably [17]. The Standardized Precipitation and Evapo-transpiration Index (SPEI) was used to assess the impacts of recent climate variations on rice yields in the Mun River basin, and the results demonstrate that the drought index SPEI detects soil moisture deficiency and crop stress in rice better than precipitation or precipitation based indicators [18]. It is clear that a thorough assessment of runoff variability in the Mun River basin is still lacking. In addition, the entire Lancang-Mekong River basin has undergone rapid urbanization in recent decades while being dominated traditionally with agriculture and so it is urgent to know if Mun River [19], the largest tributary of the Mekong River in Thailand, has or is going to supply lesser amounts of freshwater to the lower Mekong River.
The main objectives of this study are twofold and the first is to gain knowledge on if the amount of freshwater input to the lower Mekong River from Mun River has reduced. The second objective is to identify main factors of climate change and human activities that play important roles in influencing the variation of runoff of Mun River over the last several decades. To achieve the objectives, this study presents a detailed evaluation of the characterization of runoff variation in Mun River based on long-term measurements at local weather and hydrological gauging stations. In addition, a detailed analysis is performed to determine the changes of local land use types in different time periods using remote sensing images and consequently the possible influences of the changes of local climate factors and different land use types on the variation of runoff of Mun River are evaluated.
2. Research Area and Methods
2.1. Research Area
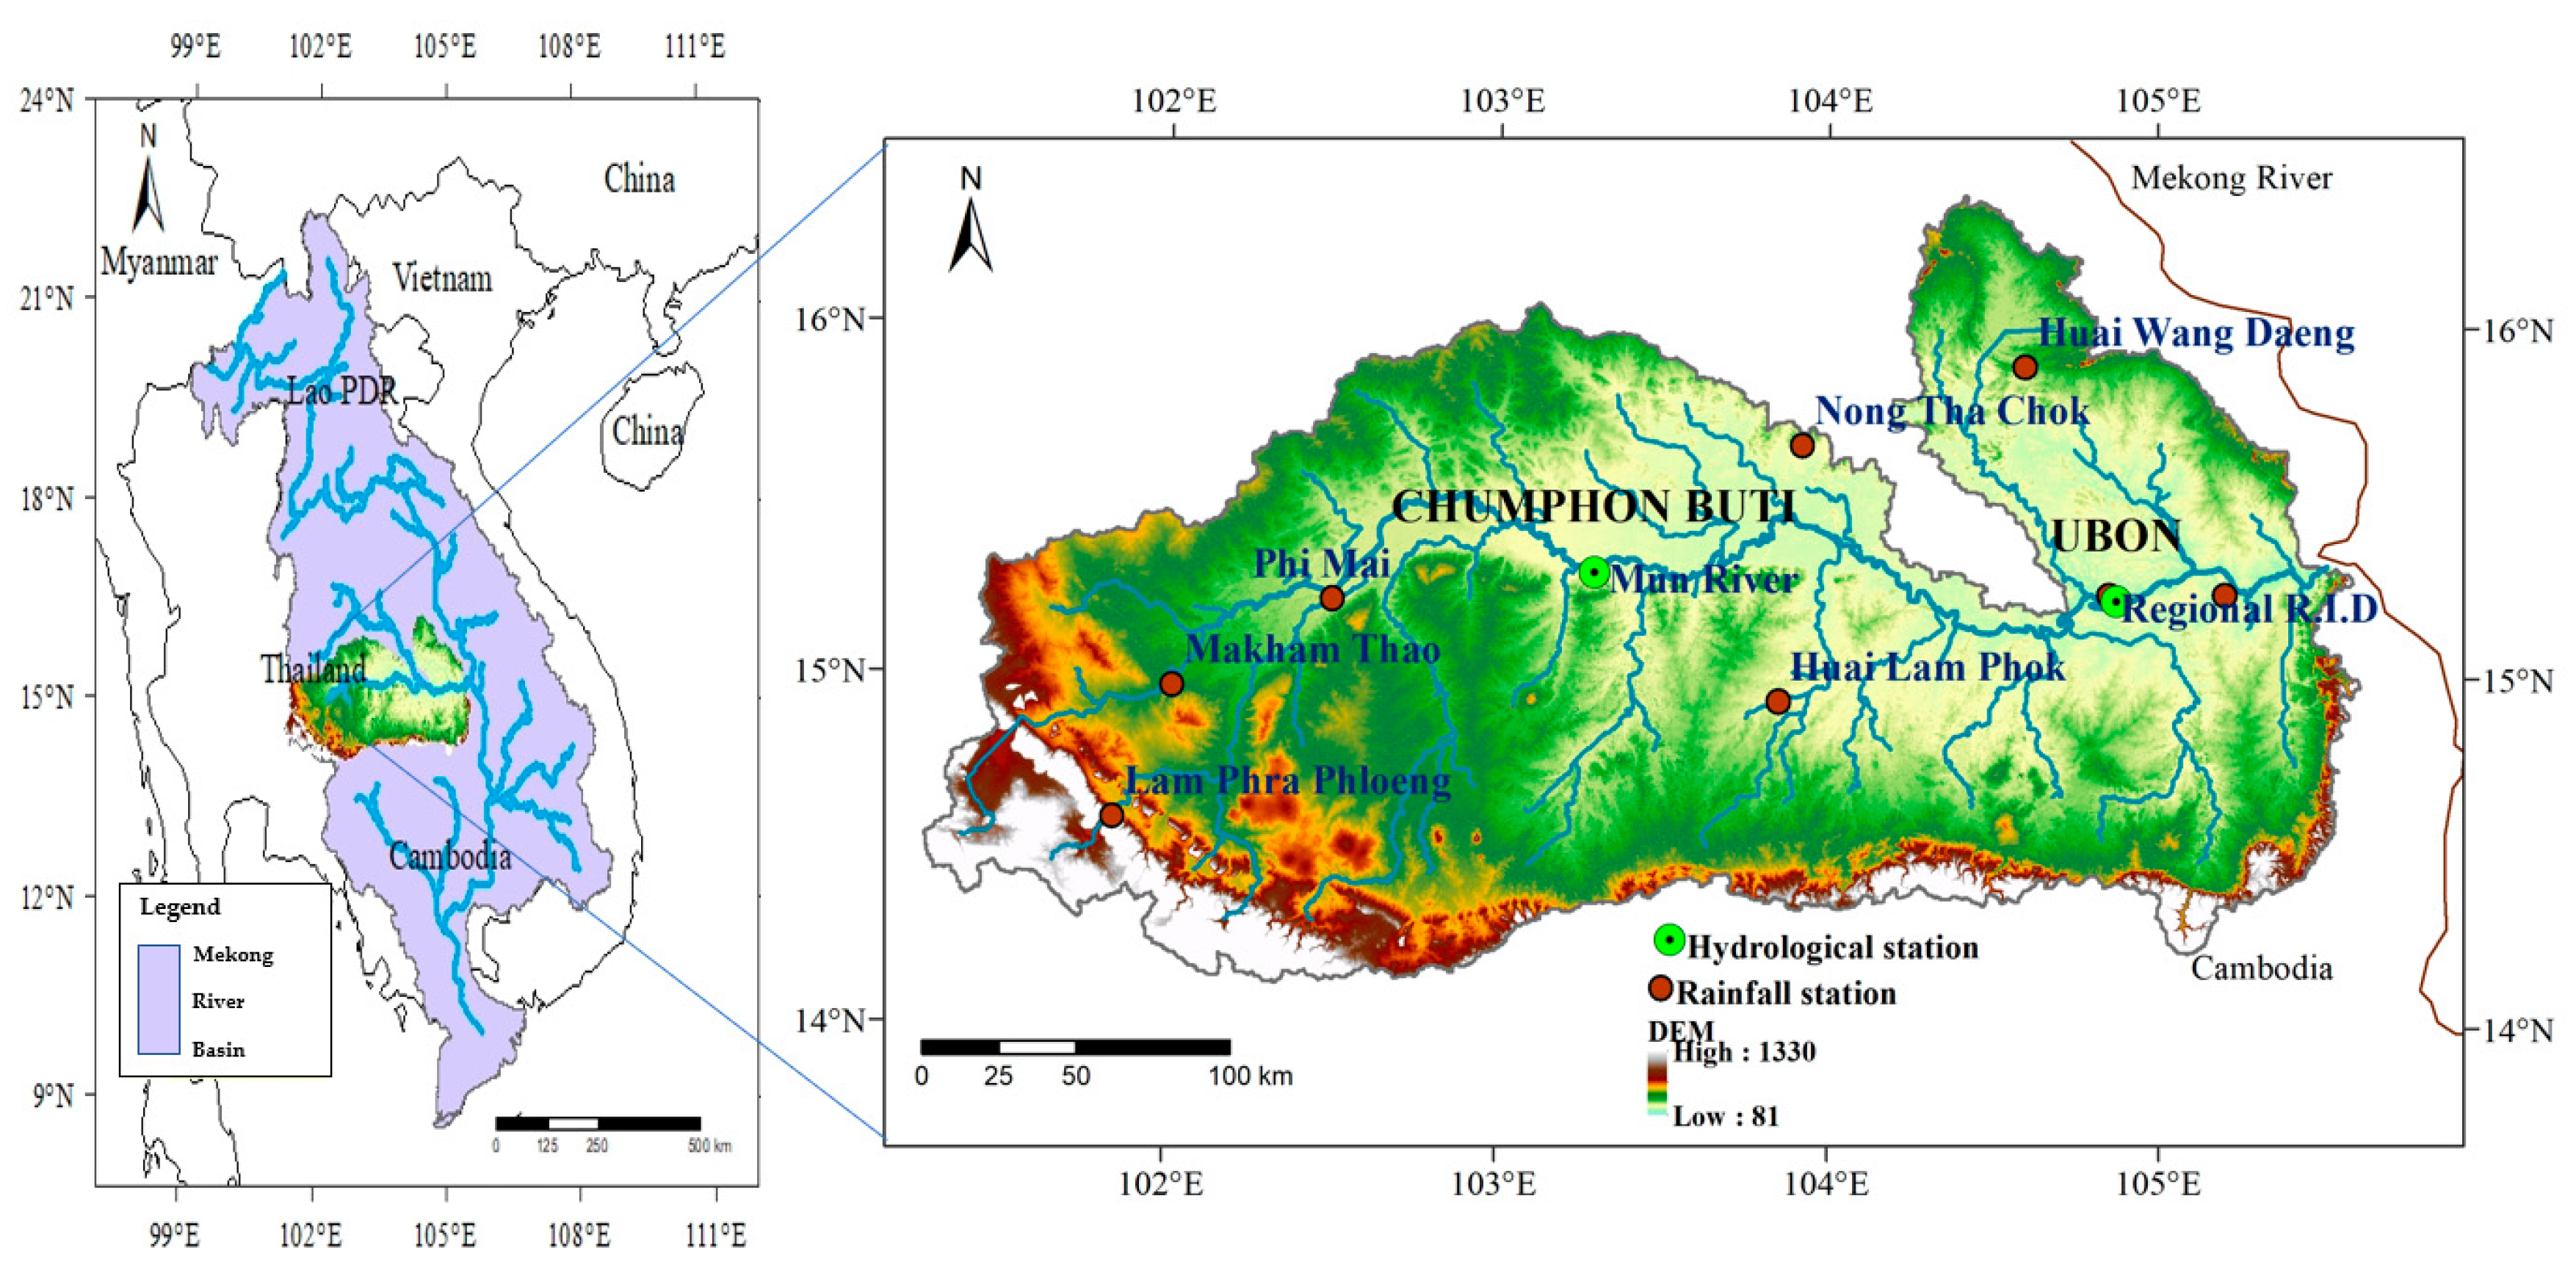
Mun River, one of the large tributaries of the Mekong River, is situated in the northeastern Thailand and lies between latitudes 14° and 16° and longitudes 101°30‘ and 105°30′, with a length of approximately 760 km and a basin area of 82,000 km2, respectively [20] (Figure 1). The river originates on the Khorat plateau near Nakhon Ratchasima in the northwest and flows towards east through southern flat area until it joins the Mekong River in Ubon Ratchathani province, Thailand [21]. The basin is an important agricultural area in Thailand, about 80%, 10%, and 5% of the total land area being farmland, forest and garden, respectively, in 2018 [22,23,24].
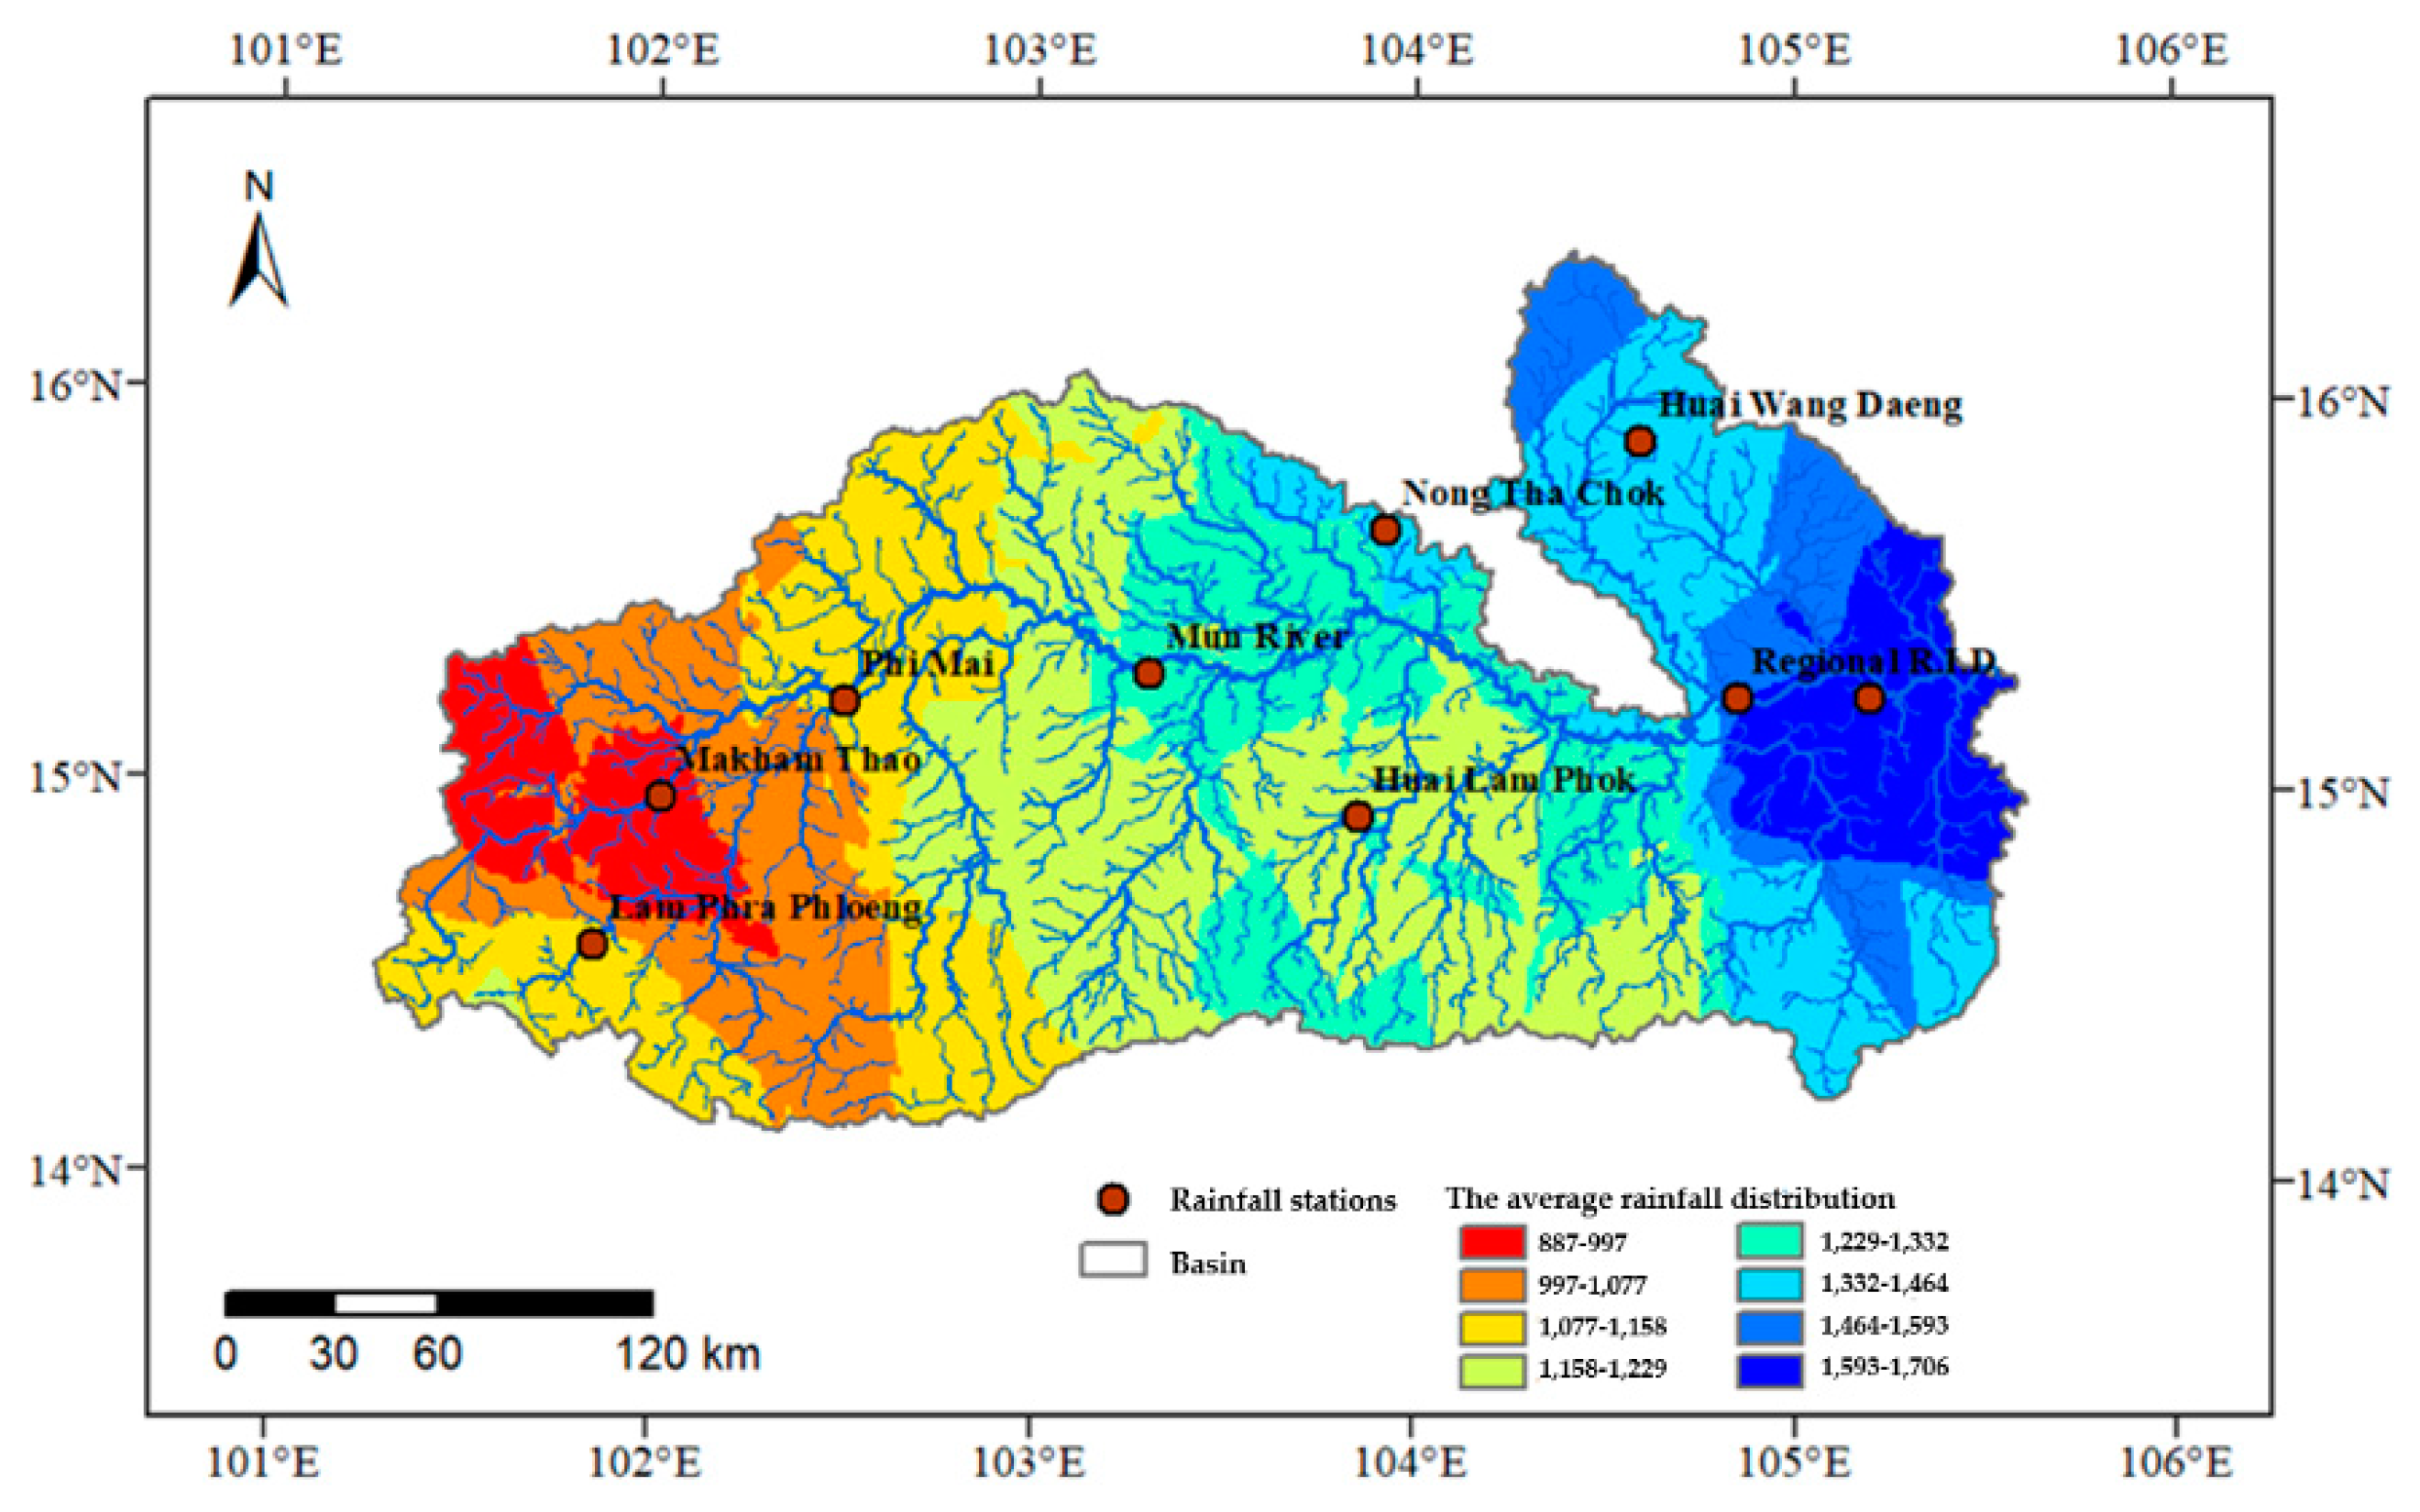
The Mun River basin has a tropical savanna climate which is most significantly affected by tropical monsoons in Asia [25]. The climate and hydrology within the basin show significant seasonal differences brought upon by the seasonal monsoons, forming distinct rainy (flooding) and dry seasons that last from June to October, and November to May of the following year, respectively [15]. Rainfall in the rainy season accounts for 92–98% of the total annual rainfall and only 2–8% in the dry season. The peak rainfall generally occurs during August to September. The spatial distribution of rainfall is gradually increasing from west to east, and the average annual rainfall is 1300–1500 mm (Figure 2). The annual temperature in the basin is largely higher than 18 °C, with an annual average temperature of about 25 °C [26].
2.2. Data Collection
Hydrological monitoring in the Mun River basin has been conducted since 1980 at CHUMPHON (simply as CH) station in the middle reach and UBON (simply as UB) station in the lower reach, and Figure 1 shows the locations of the two hydrological gauging stations on the main stem of Mun River. Meteorological stations (about 159 stations) in the Mun River basin were set up since 1950. Due to data availability, daily rainfall data at 9 meteorological stations (including Lam Phra Phloeng, Makham Thao, Phi Mai, Mun River, Nong Tha Chok, Huai Lam Phok, Huai Wang Daeng, Ubon, and Regional R.I.D) and daily evaporation data at 13 stations measured respectively since 1960 and 1980 were selected. All of this information is provided by the Royal Irrigation Department (R.I.D) of, Thailand. The digital elevation model used in this study is obtained from the Geospatial Data Cloud (China), while temperature data at 3 stations and Land use data were obtained respectively from Globe Summary of the Day (GSOD) and Servir Mekong website (Table 1).
2.3. Methods
To investigate the temporal variation of runoff in Mun River, both parametric and non-parametric test methods were employed [27]. As a non-parametric method, the Mann-Kendall trend test is effective in dealing with long time-series hydrological and meteorological data that are not in normal distributions [28]. It can identify quantitatively whether a certain runoff change process has an abrupt point or has a stable change trend [29]. Comparatively, as one of the parametric test methods, the Double Cumulative Curve method is applicable to analyze the relationship between rainfall and runoff [30,31]. In addition, the spatial Kriging interpolation method is used to examine the spatial distribution of rainfall in terms of the calculated results using Thiessen polygon method, while the wavelet analysis is applied to study the periodicity of rainfall and runoff [32,33,34,35].
2.3.1. Mann-Kendall Non-Parametric Trend Test
For time series H0 containing n samples (x1, x2, … xn), which are independent and random, the Mann-Kendall statistic S is given as
The application of the trend test is conducted for a time series xi that is ranked from i = 1,2,...n−1 and xj, which is ranked from j = I + 1,2,...n. Each of the data point xi is taken as a reference point which is compared with the rest of the data points xj so that
It has been documented that when n ≥ 8, the statistic S is approximately normally distributed with the mean [36,37]:
The test statistics Z is computed as
where Z follows a standard normal distribution. A positive (negative) value of Z signifies an upward (downward) trend. A significance level α is also utilized for testing either an upward or downward monotone trend (a two-tailed test). If , then the confidence test of 90%, 95%, and 99% is passed, respectively.
2.3.2. Mann-Kendall Non-Parametric Mutation Test
To perform a Mann-Kendall non-parametric mutation test, the rank column Um of the sequence needs to be constructed in the following manner:
When the sample value i is greater than the value at the moment j, the number of values will be accumulated. When x1, x2, and xn are independently and continuously distributed, the following statistics can be determined:
where UFm is a standard normal distribution and UF1 = 0, and E(Um) and Var(Um) are the mean and variance of a cumulative count of Um, respectively.
For a given significance level, the critical value Ua can be obtained by querying the normal distribution table. If |UFi| > Ua (U0.05 = 1.96, U0.01 = 2.58), it means that the sequence has an obvious trend of increase or decrease [38]. Repeat the calculation process above to obtain the inverted sequence statistical value UBm and when the UFm and UBm curves intersected between the critical boundary, the intersection point can be taken as the beginning of mutation [39].
2.3.3. Morlet Wavelet Transform Method
Morlet wavelet function is a kind of complex-valued and continuous wavelet and so continuous wavelet transform is more suitable for signal feature extraction and further analysis [40,41]. Complex-valued wavelet gives the information of phase and amplitude of time series and is able to eliminate the false oscillation caused by real wavelet transform coefficient, so that more accurate results can be obtained. The detailed expression of the method is:
where fb is the bandwidth, fc is the central frequency, and i is the imaginary part.
The expression of the continuous wavelet transform of f(t) takes a form of:
In order to further determine the main period of the time series, the wavelet squared difference can be obtained by integrating the square of all wavelet coefficients about alpha through formula (12) [42].
The wavelet squared diagram reflects the distribution of signal wave energy with the time scale. While the wavelet squared difference determines the signal peak value, the year corresponding to the peak value is regarded as the main cycle [43]:
2.3.4. Double Cumulative Curve Method
The method of Double Cumulative Curve has been used in the analysis of long-term trend of hydrological sequence [44]. Combined with Mann-Kendall test, this method can effectively identify the variation period of the slope of a double cumulative curve [45]. Theoretically, the slope of the double cumulative curve for runoff against rainfall will not change significantly when only rainfall takes effect on runoff, while the slope may change when other factors such as land use and other human activity factors exert an influence on runoff. According to the time and variation of the slope, the influencing degree of a certain factor on runoff can be evaluated.
Based on the mutation year of a double cumulative curve and choosing a period with no or little significant slope offset as a reference period (others are changing periods), the following linear regression equation between cumulative runoff and cumulative rainfall can be established:
where Q is the runoff and P is the rainfall.
Assuming that the trend of climate change in a changing period is consistent with that in the reference period [46], the contributions of rainfall and human activities to runoff variation can then be calculated by using the following formulas, respectively:
where is the quantity of runoff influenced by human activities, is the contribution of rainfall, subscript 1 and 2 represent, respectively, the reference period and changing period, i stands for the value calculated, and j means the value measured.
2.3.5. Spatial Kriging Interpolation Method
Similar to Inverse Distance Weighting (IDW) method, Kriging method uses a weighting, which assigns more influence to the nearest data points in the interpolation of values for unknown locations [47]. Kriging method considers not only the relationship between the positions of the target points and the given points, but also the spatial correlation of the variables. The two-step process of Kriging method begins with semi variance estimations and then performs the interpolation [48].
The aim of Kriging method is to estimate the value of an unknown real-valued function Z at a point (m, n), with the given values of the function at some other points {(m1, n1), (m2, n2)... (m3, n3)}. A Kriging estimator is assumed to be linear because the predicted value Z(m, n) is a linear combination that can be written as:
where is a weight coefficient of the solutions of a system of linear equations which minimize the difference between the estimated value and the true value at the point (m0, n0), while (m, n) is the error of prediction as:
where random process F(m, n) also satisfies the condition of unbiased estimation:
3. Results and Discussion
3.1. Annual and Interannual Variation of Runoff
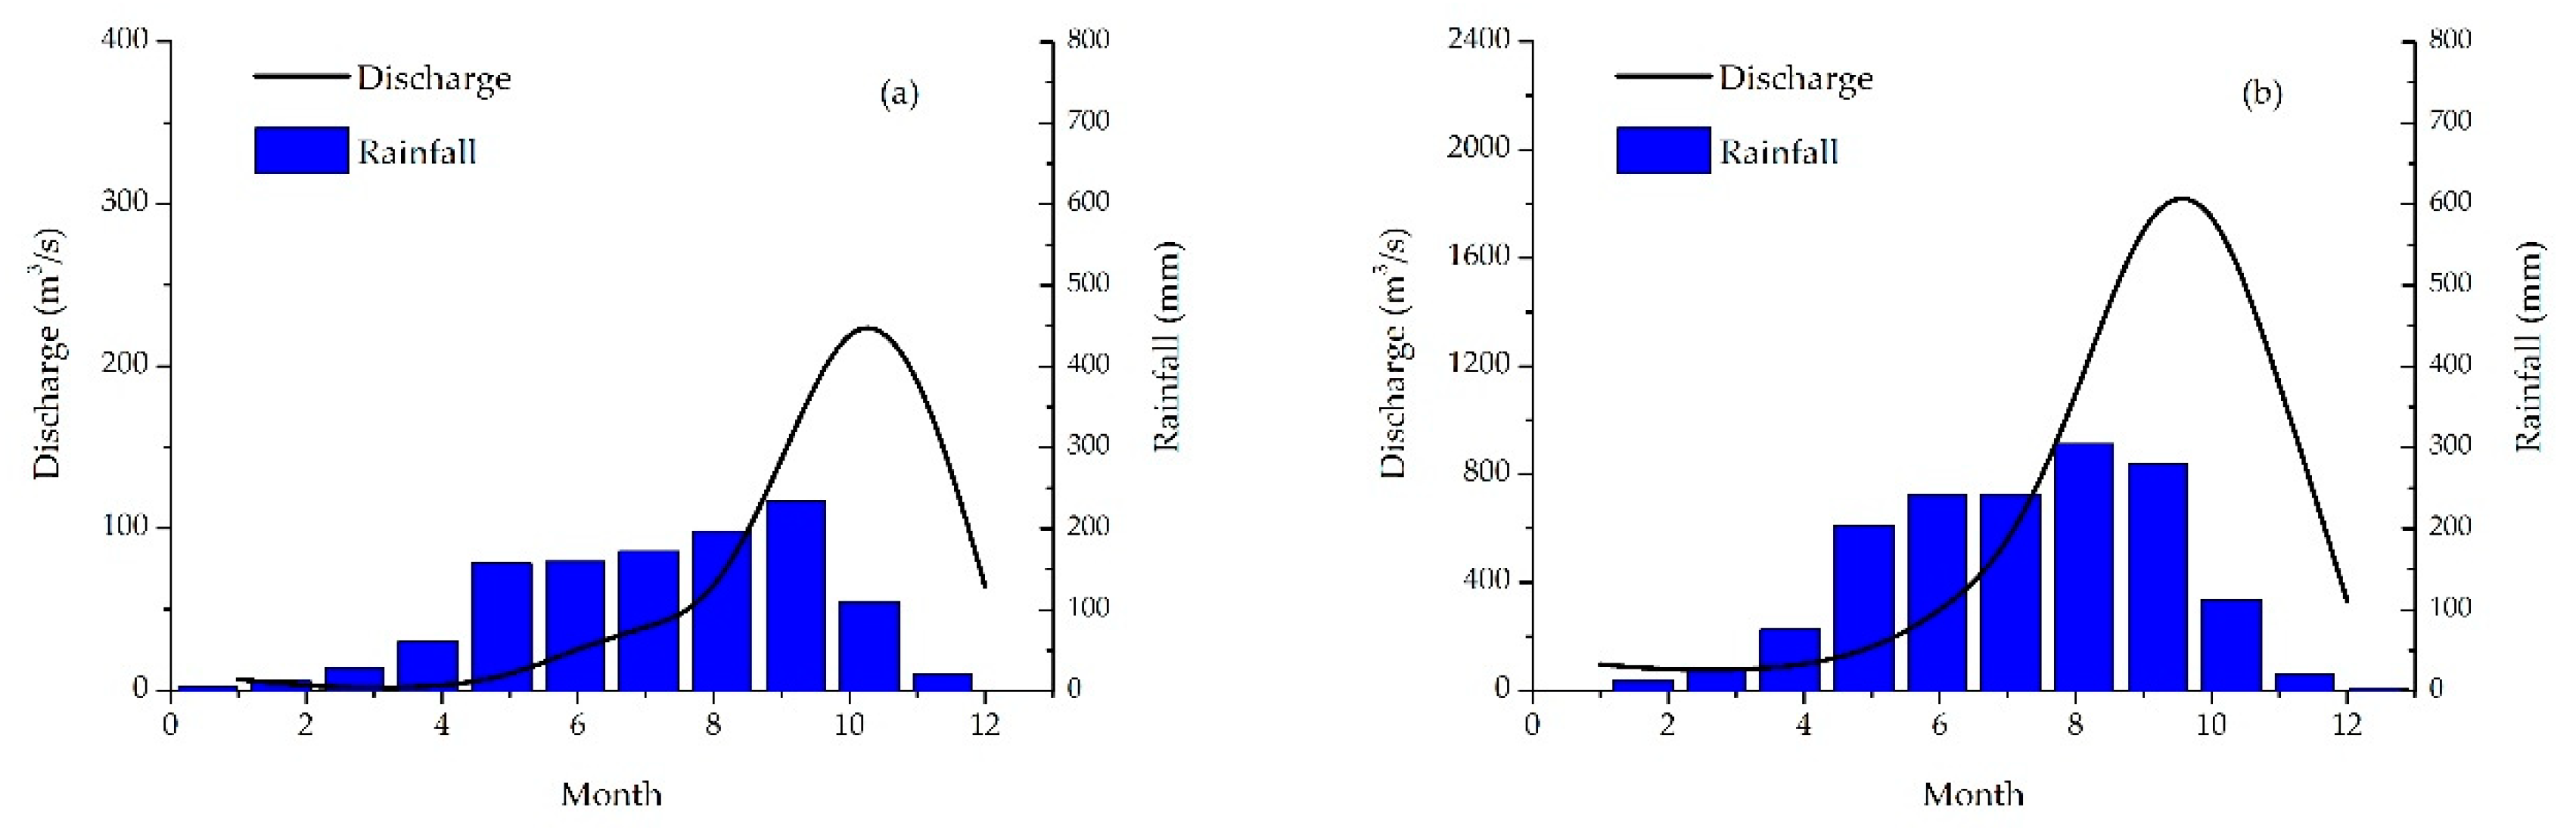
Figure 3 shows the distribution of monthly average flow discharge at CH and UB, two hydrological stations located in the main stem of Mun River, based on flow data measured during 1980 to 2018. The low and high flow discharges at the two stations in the study period all exhibit seasonal distribution characteristics. The rainy season is from August to November, during which the ratio of the maximum monthly flow discharge to the minimum can reach up to 600:1 and the runoff in the season accounts for about 77% of the total annual runoff. The monthly average flow discharge in the rainy and dry seasons in the Mun River basin fluctuated in wide ranges. The average flow discharge at CH station in the rainy season is 99.6 m³/s, 2.4 times of the counterpart in the dry season (Figure 3a). The annual average flow discharge at UB station in the rainy season is 1136.4 m³/s, four times of the counterpart in the dry season (Figure 3b). The average annual flow discharge at UB station is 640.7 m³/s, almost ten times of the counterpart at CH station in the upper reach. The peak flow discharge occurs in general from September to October, slightly behind the peak of the rainfall.
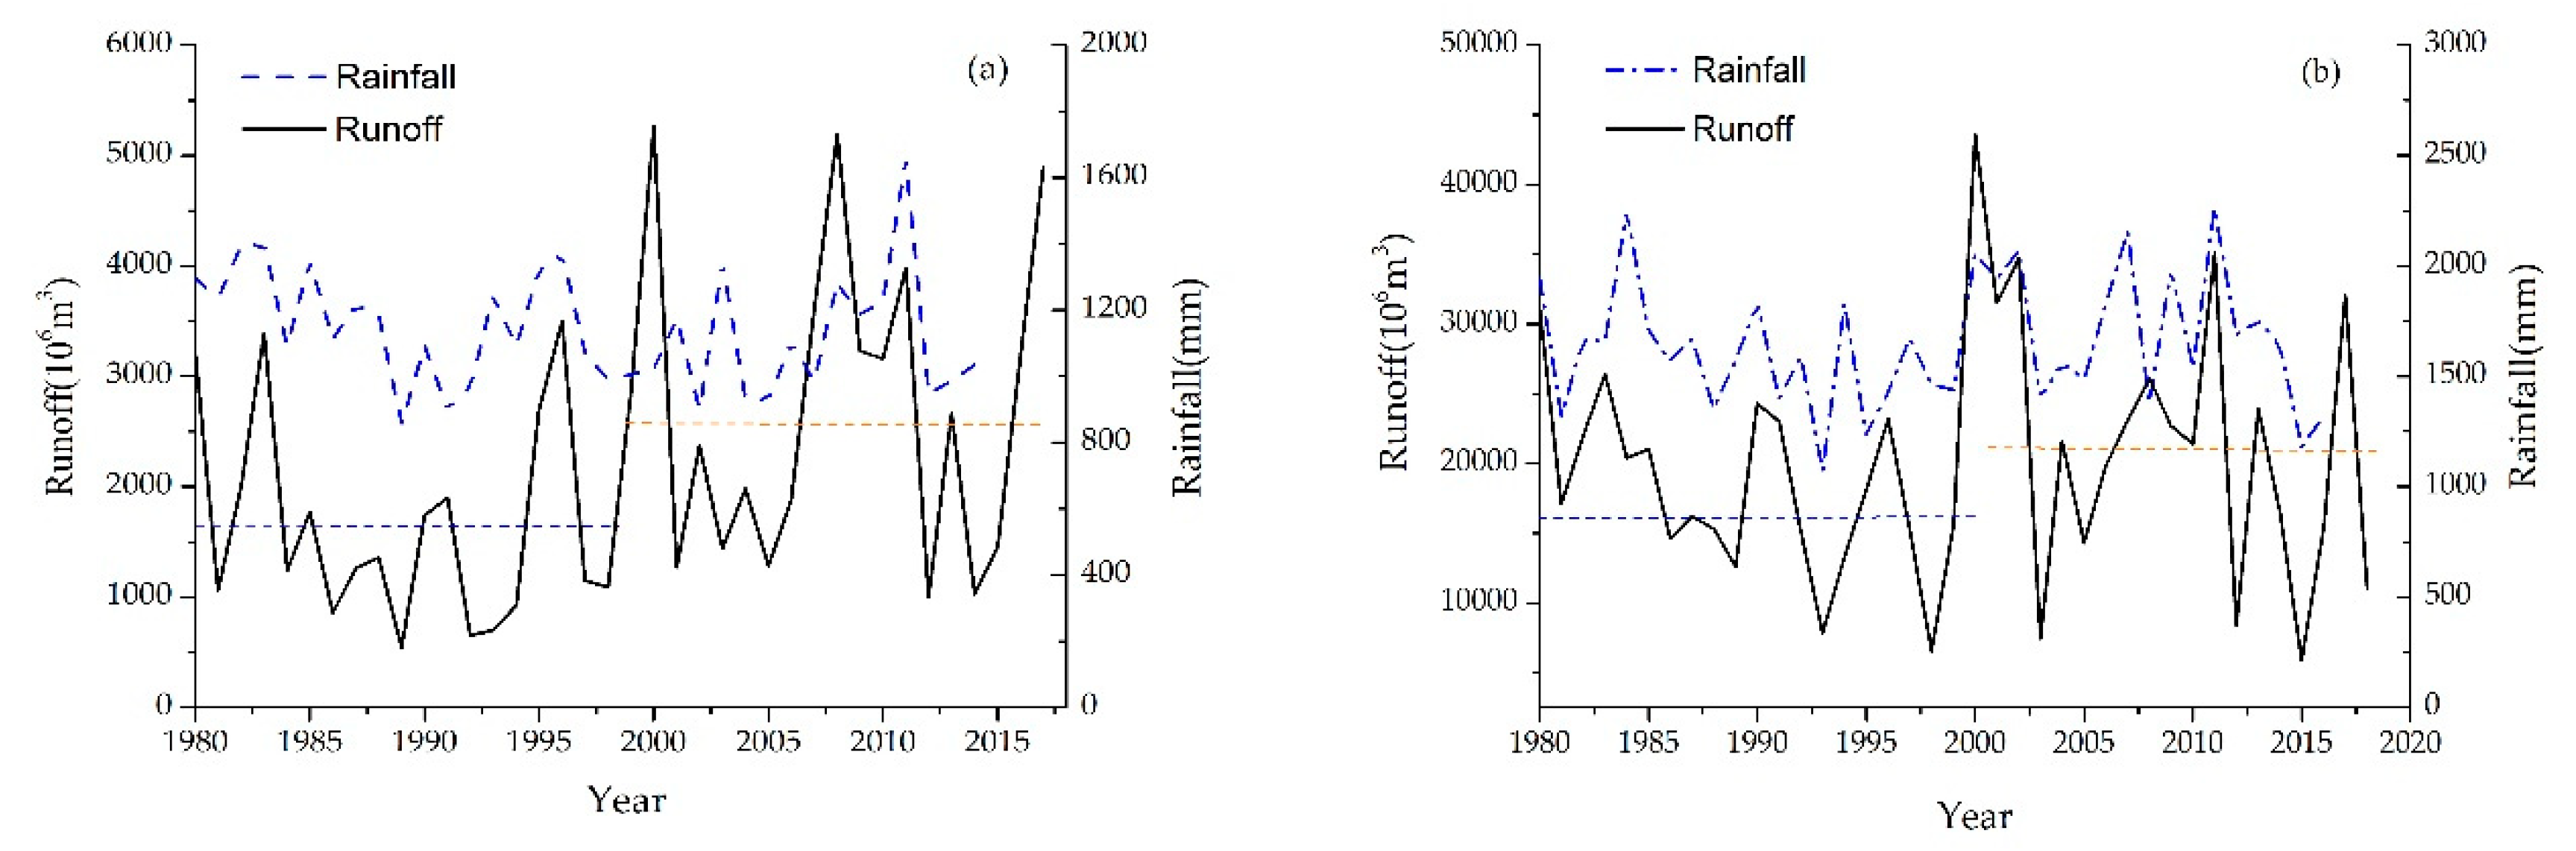
The average annual runoff at CH and UB stations in the period 1980–2018 is 2.18 × 10⁹ m³ and 19.5 × 10⁹ m³, with a runoff yield per square kilometer of 76.8 × 10³ m³ and 183.17 × 10³ m³, respectively (Figure 4). Based on the Mann-Kendall trend test (Table 2), though no significant increasing or decreasing trend can be detected from the runoff variation during 1980–2018, a significantly decreasing trend and an increasing trend in the variation of the average annual runoff can be observed for the period before 1999 and after 2000, respectively. The Cv (coefficient of variation) of the annual runoff at CH and UB stations over the period 1980–2018 is 0.4 and 0.6, respectively, while the annual runoff at both CH and UB stations reached maximum values in 2000. This general variation trend and high variability of annual runoff are highly consistent with the variation of rainfall in the whole Mun River basin.
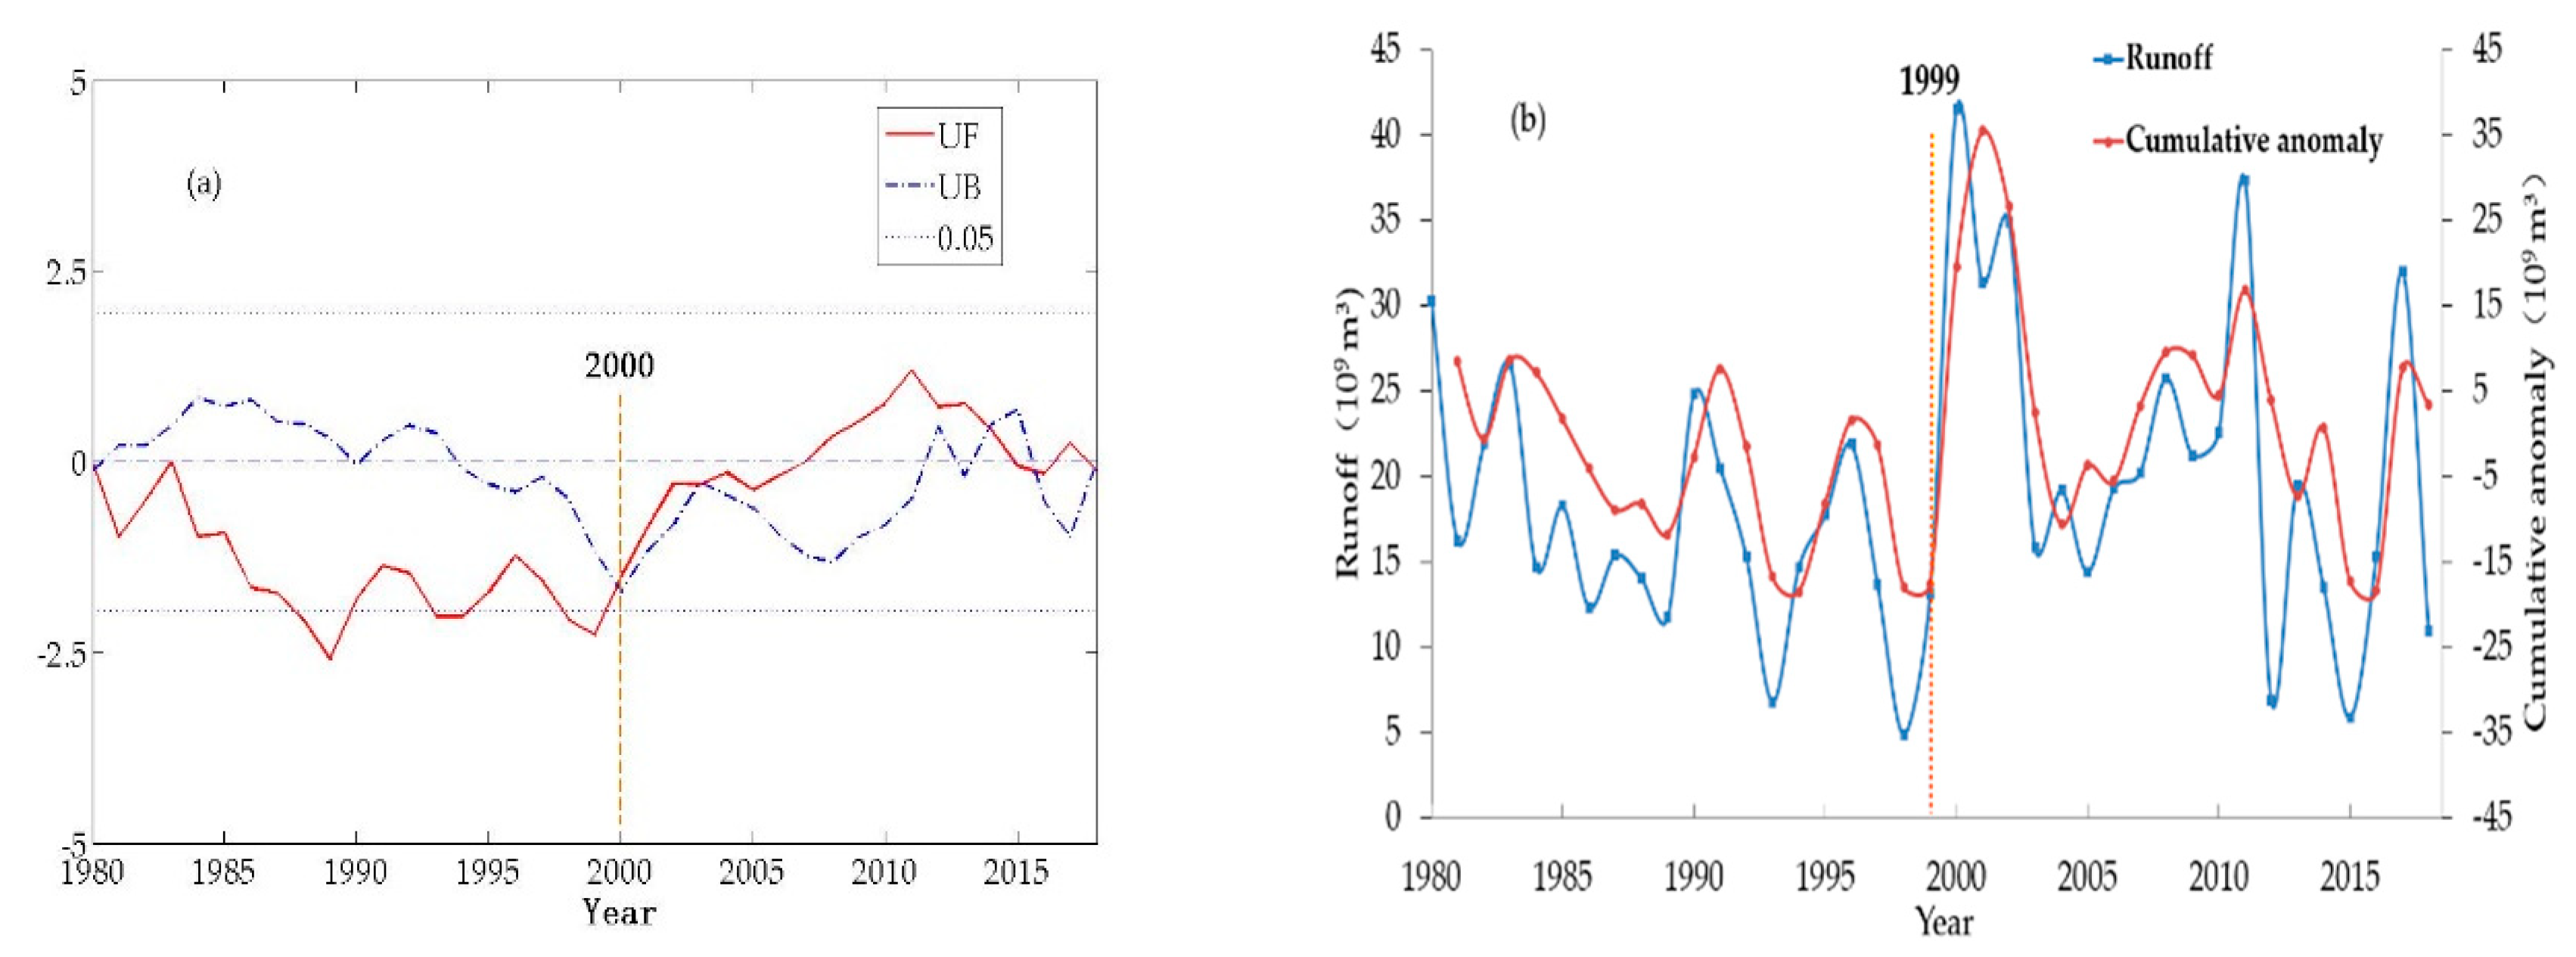
According to the results of an abruption analysis using Mann-Kendall test (Figure 5a) and the cumulative anomaly runoff change curve between CH and UB stations (Figure 5b), UF and UB curves intersect in 2000 and the intersection point falls within the critical boundary. The cumulative anomaly runoff value in the Mun River basin decreased significantly from 1980 to 1999 and reached the lowest point in 1999, while it recovered obviously after 2000. Therefore, 1999–2000 can be regarded as the abrupt time of annual runoff change in the Mun River basin.
3.2. Temporal Variation of Runoff and Rainfall
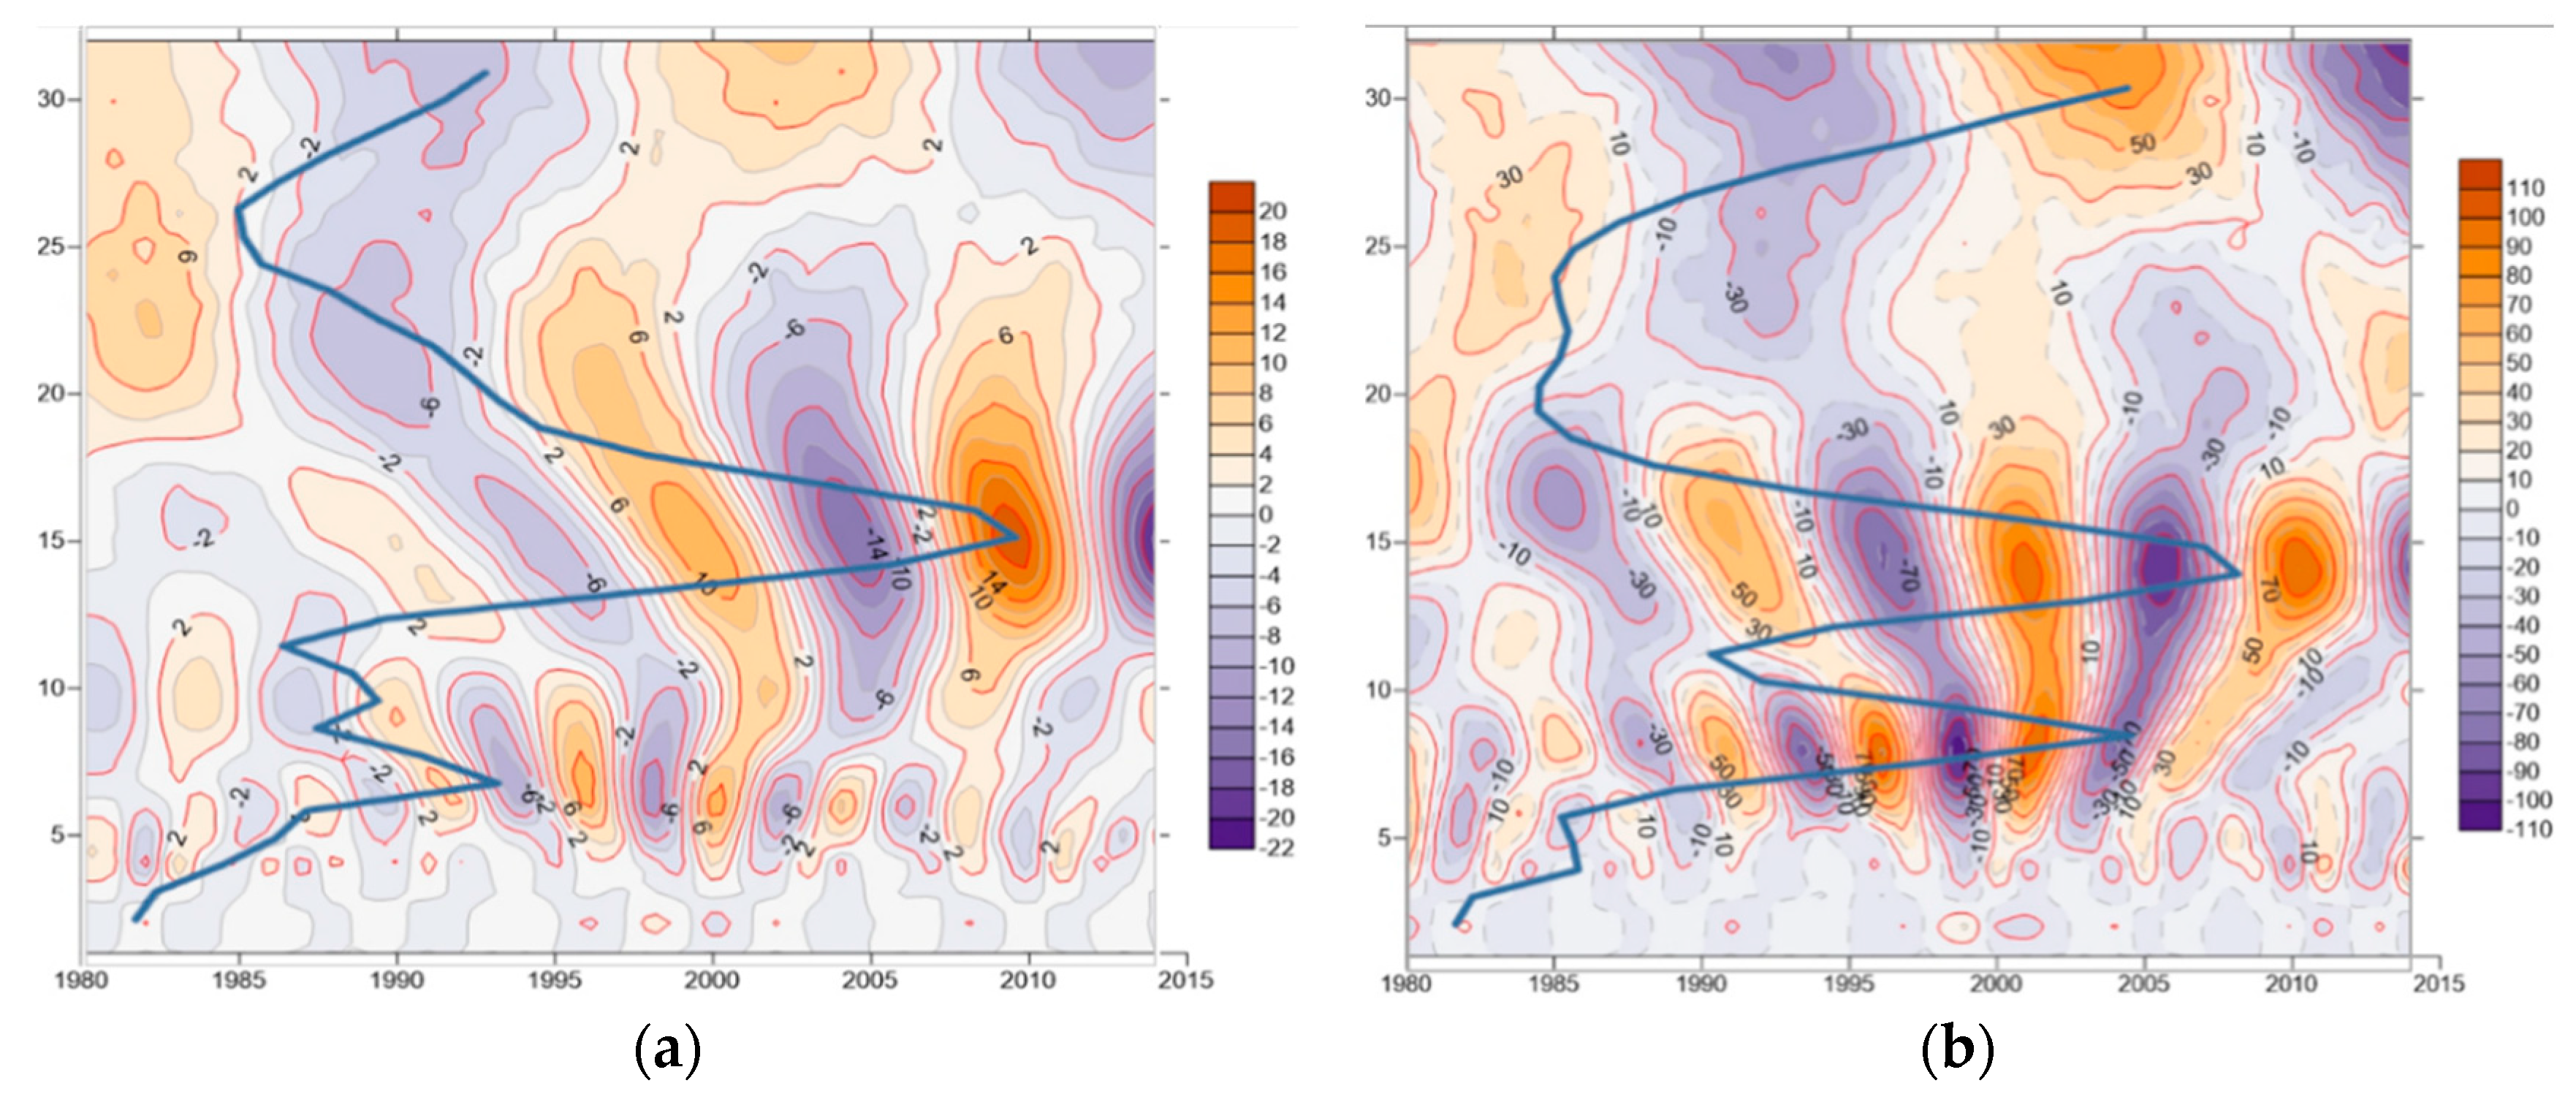
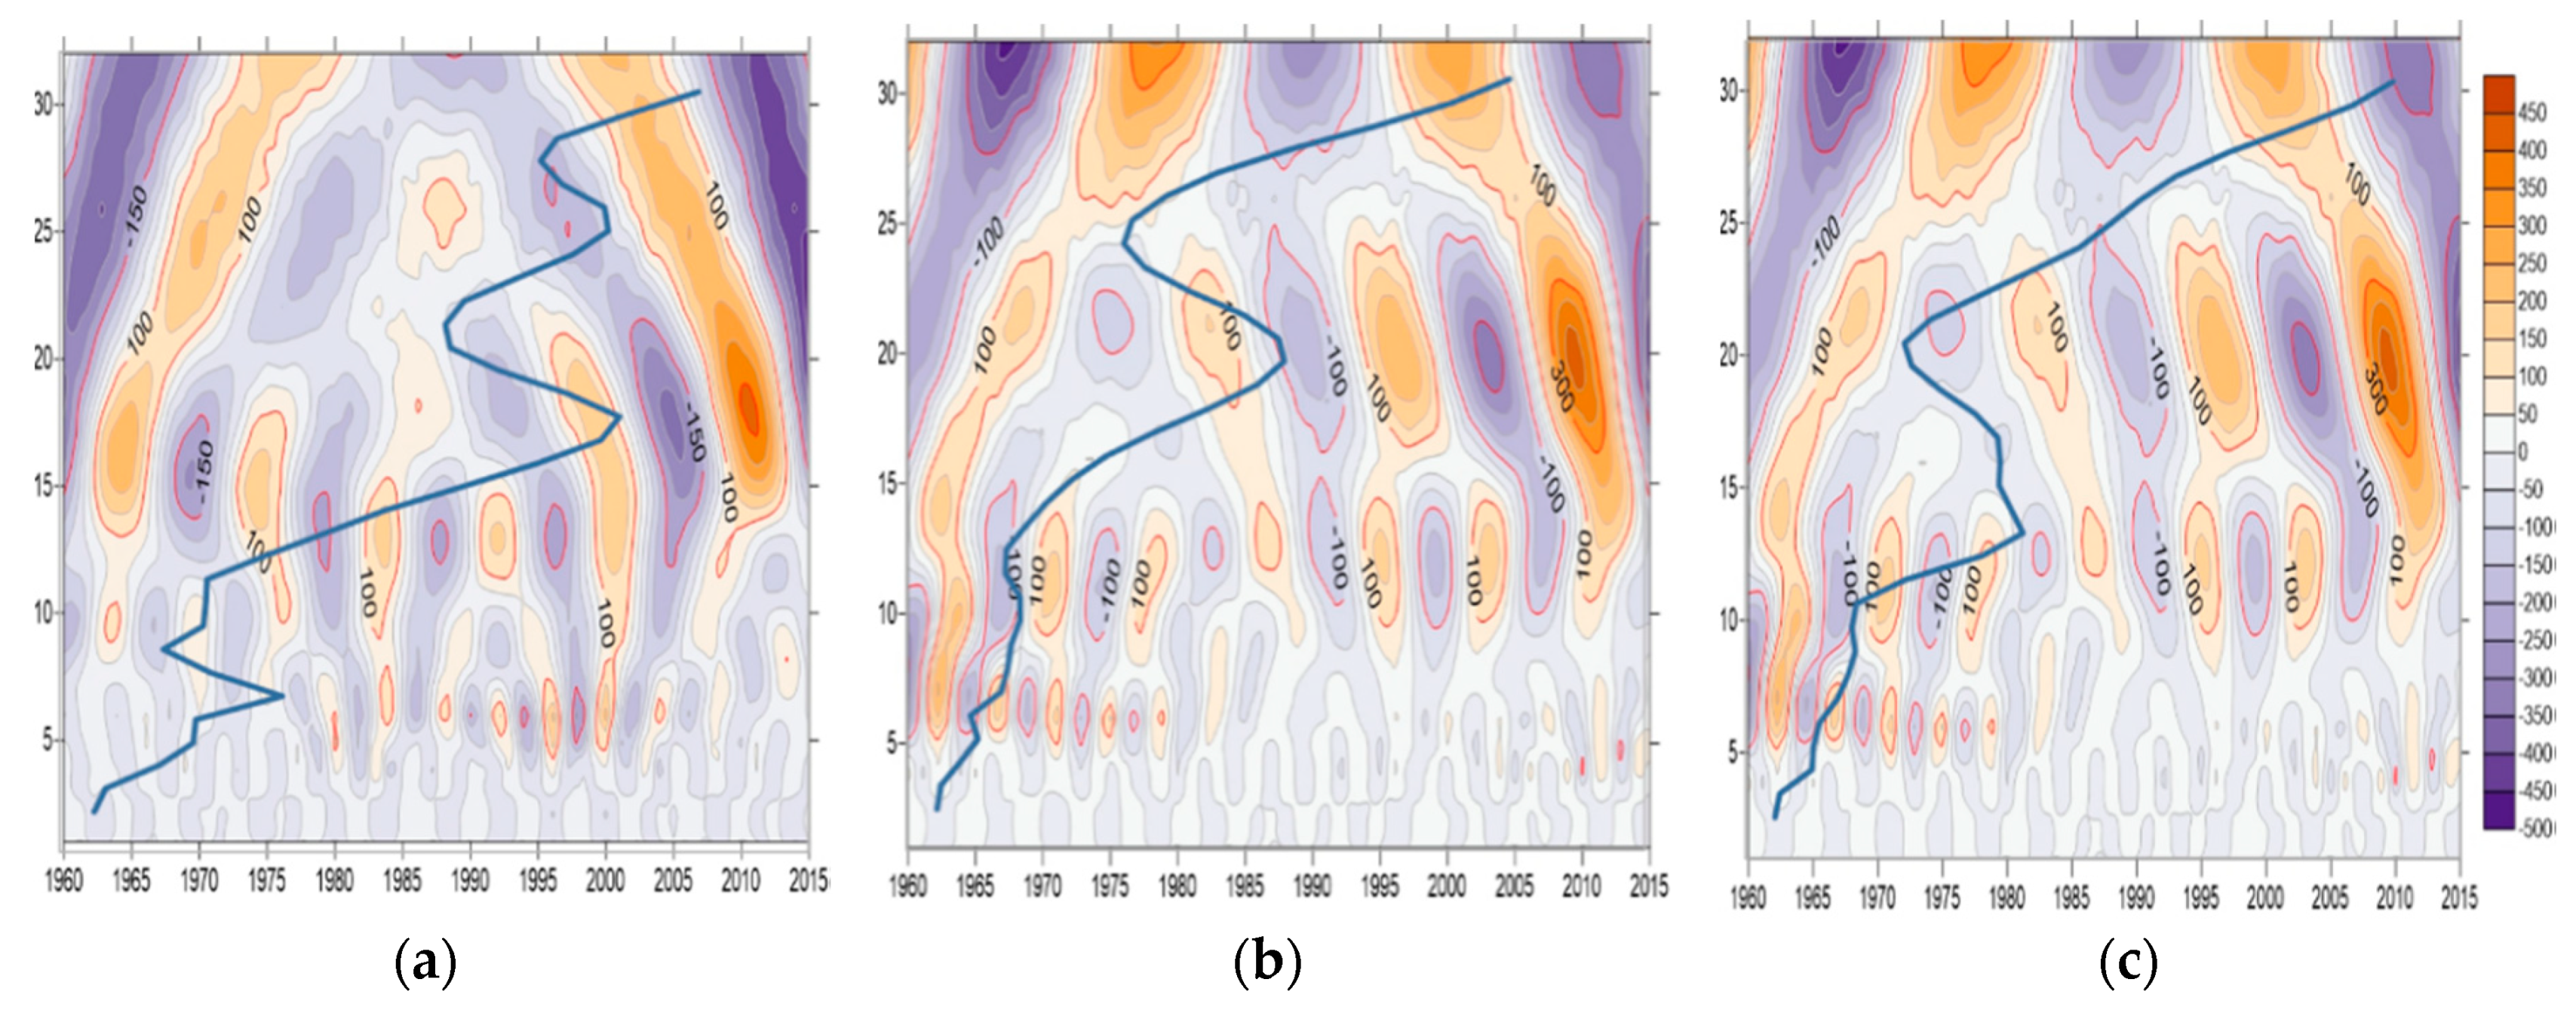
Figure 6 and Figure 7 show the real part of runoff wavelet transform coefficients and wavelet square differences at CH and UB stations (blue polylines), and the real part of rainfall coefficients at three representative weather stations along the main stem of Mun River (Phi Mai Barrage station, Mun River station and Regional R.I.D shown in Figure 1).
It can be noted from Figure 6 that the variation of annual runoff in the Mun River basin exhibits characteristic timescales of 6–8, 15–16 and 30 years, respectively, corresponding to the cycles of 6, 11 and 15 years, among which the 11-year cycle is the first main cycle. The annual rainfall in the Mun River basin also exhibits three characteristic timescales (8, 14–20 and 30 years), respectively corresponding to cycles of 5, 11 and 15 years, among which the 11-year cycle is the first main cycle (Figure 7).
The runoff and rainfall periodicities in the Mun River basin are summarized in Table 3, in which the period with a duration of 16–0 years is classified as long-term scale, the period of 10–15 years as intermediate scale, and the period of less than 10 years as short-term scale, corresponding to long, middle and short periods, respectively. It can be seen from Table 2 that in the Mun River basin the periodic changes of rainfall and runoff exhibit similar patterns.
3.3. Factors Leading to Runoff Change
3.3.1. Rainfall
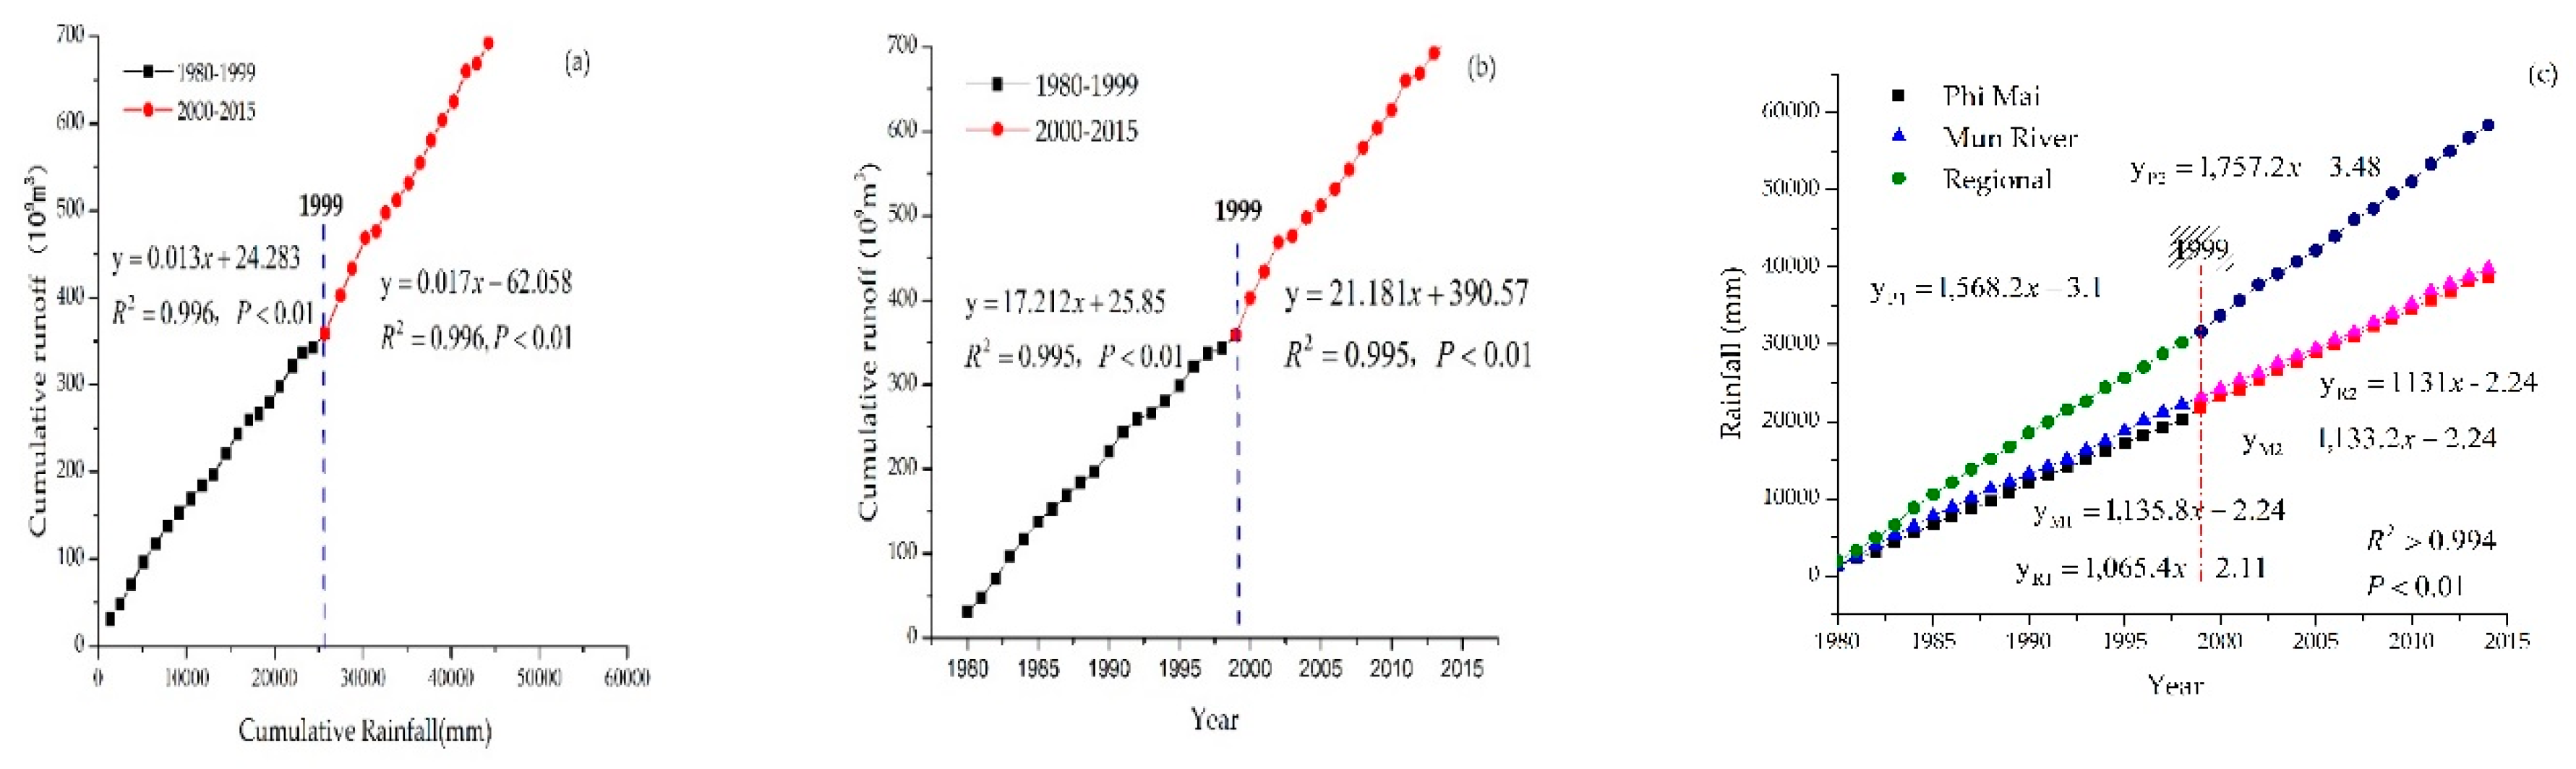
Figure 8 presents the double cumulative curve of runoff against rainfall and the cumulative curves of runoff and rainfall in the Mun River basin in the period 1980-2015, respectively. According to the results obtained earlier and shown in Table 3 and Figure 2, Figure 6, and Figure 7, the runoff sequence in the Mun River basin can be divided into two periods: Period A (1980–1999) and Period B (2000–2015). In comparison with Period A, Figure 8a shows that the value of slope in the double cumulative curve of runoff against rainfall is larger than in Period B, meaning an increase in runoff relative to the change in rainfall in Period B. Moreover, Table 4 shows that runoff and rainfall in period B increases 23.1% and 12.1%, respectively, at two stations, while the average annual rainfall increases slightly at one station (6.2%) and yet decreases insignificantly at the other station (−0.2%). These inconsistencies in the relationship of runoff and rainfall in the Mun River basin demonstrate clearly that the slight increase in annual runoff change in Period B in Mun River is caused not by the change in annual rainfall but by the other factors.
3.3.2. Temperature and Evaporation
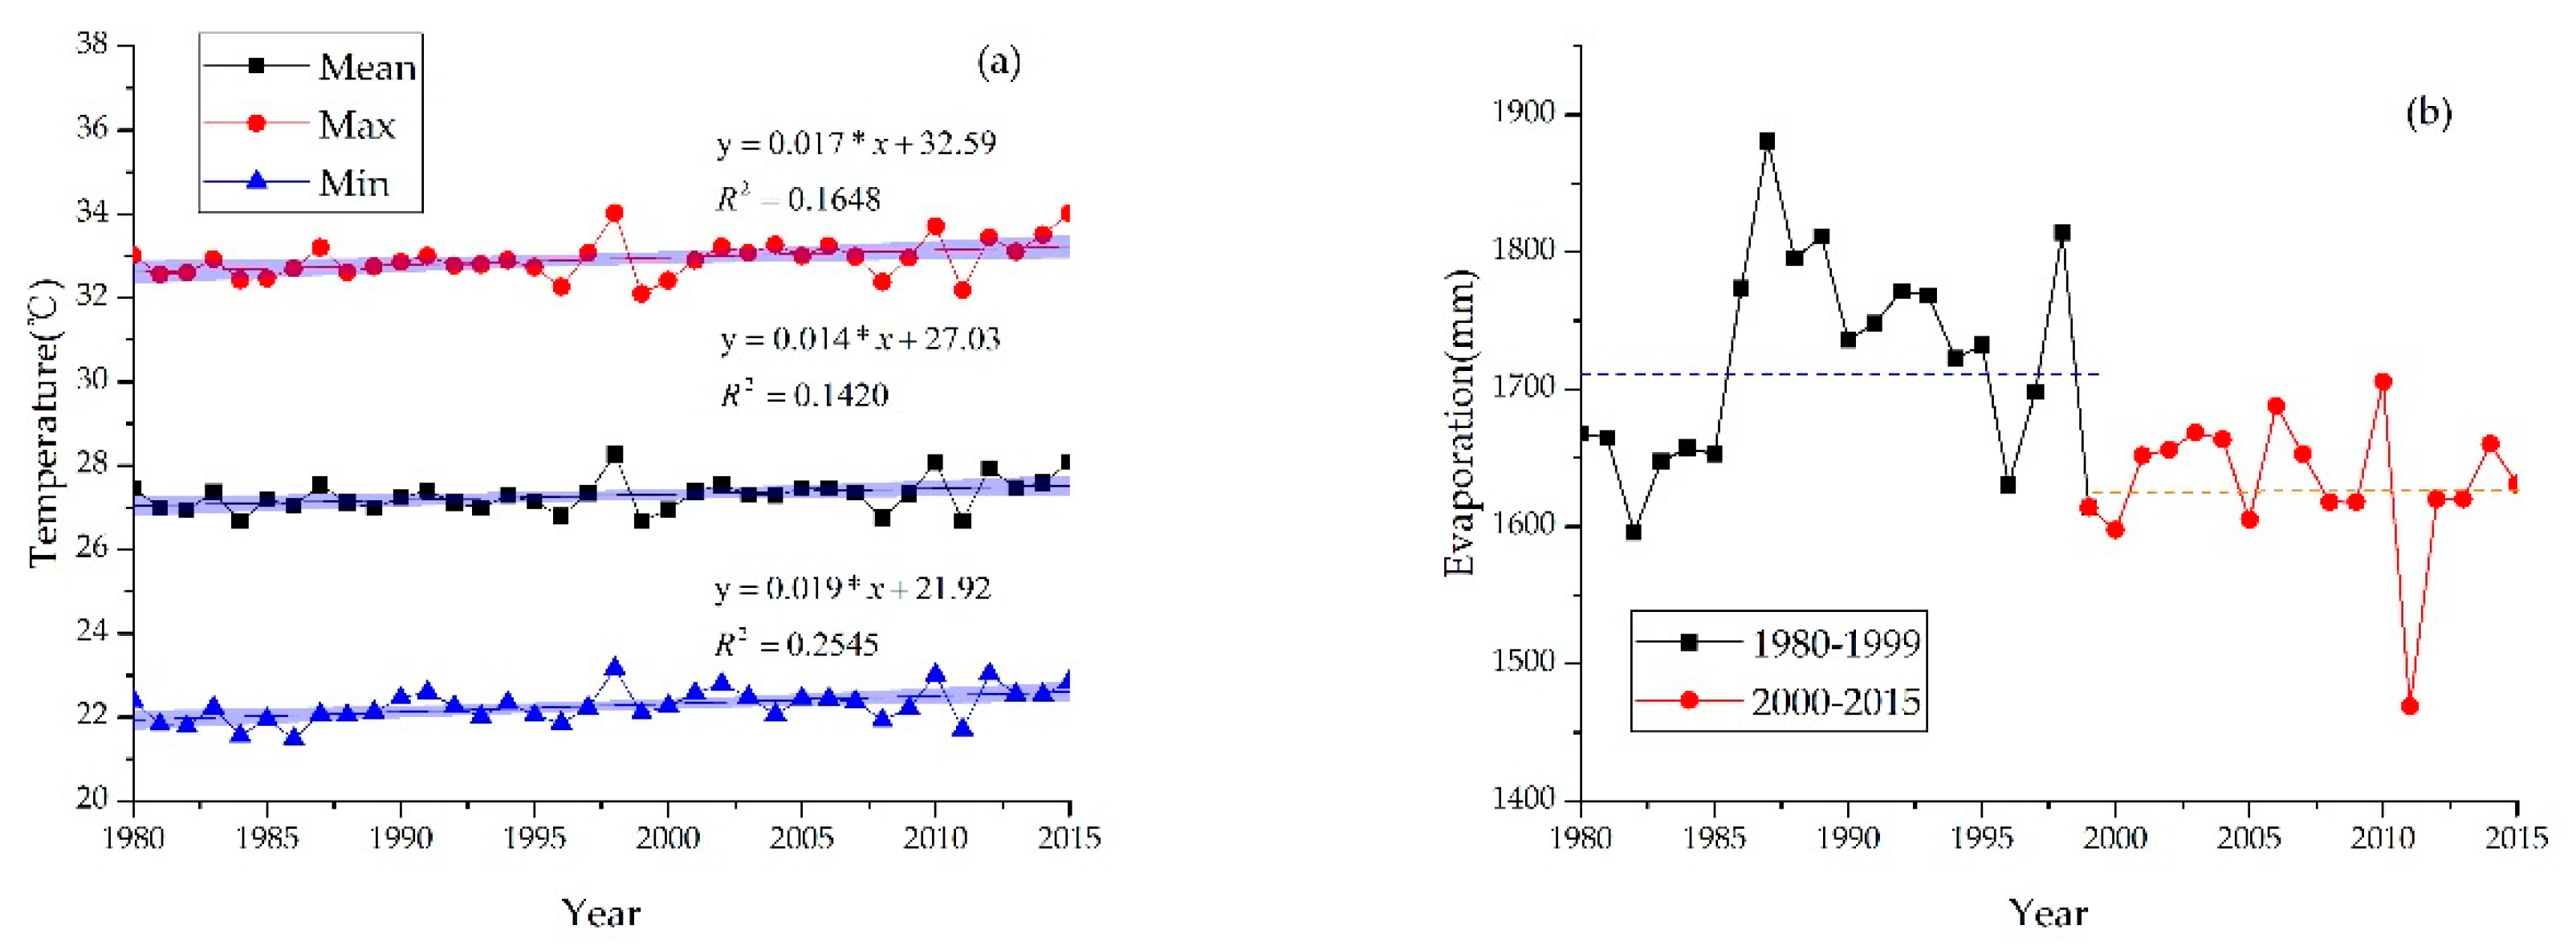
The average, maximum, and minimum temperature variations at three representative meteorological stations (i.e., Nakhon Ratchasima, Surin, and Ubon Rathathani stations) located respectively in the upper, middle, and lower reaches of Mun River are shown in Figure 9a. The annual evaporation change is shown in Figure 9b. Although slightly increasing trends are exhibited in the variations of all three variables, the corresponding variation ranges are very small (Figure 9a). In comparison with the average value of evaporation in Period A, the average value in Period B reduces about 100 mm, or −6% (Figure 9b). According to the water balance principle in a river basin, the reduction of evaporation normally exerts a positive effect on the increase of runoff [49,50]. In the Mun River basin, hence, the evaporation decrease can benefit the recovery of runoff, although not to a very significant degree because only a very minor reduction takes place in evaporation.
3.3.3. Land Use Change
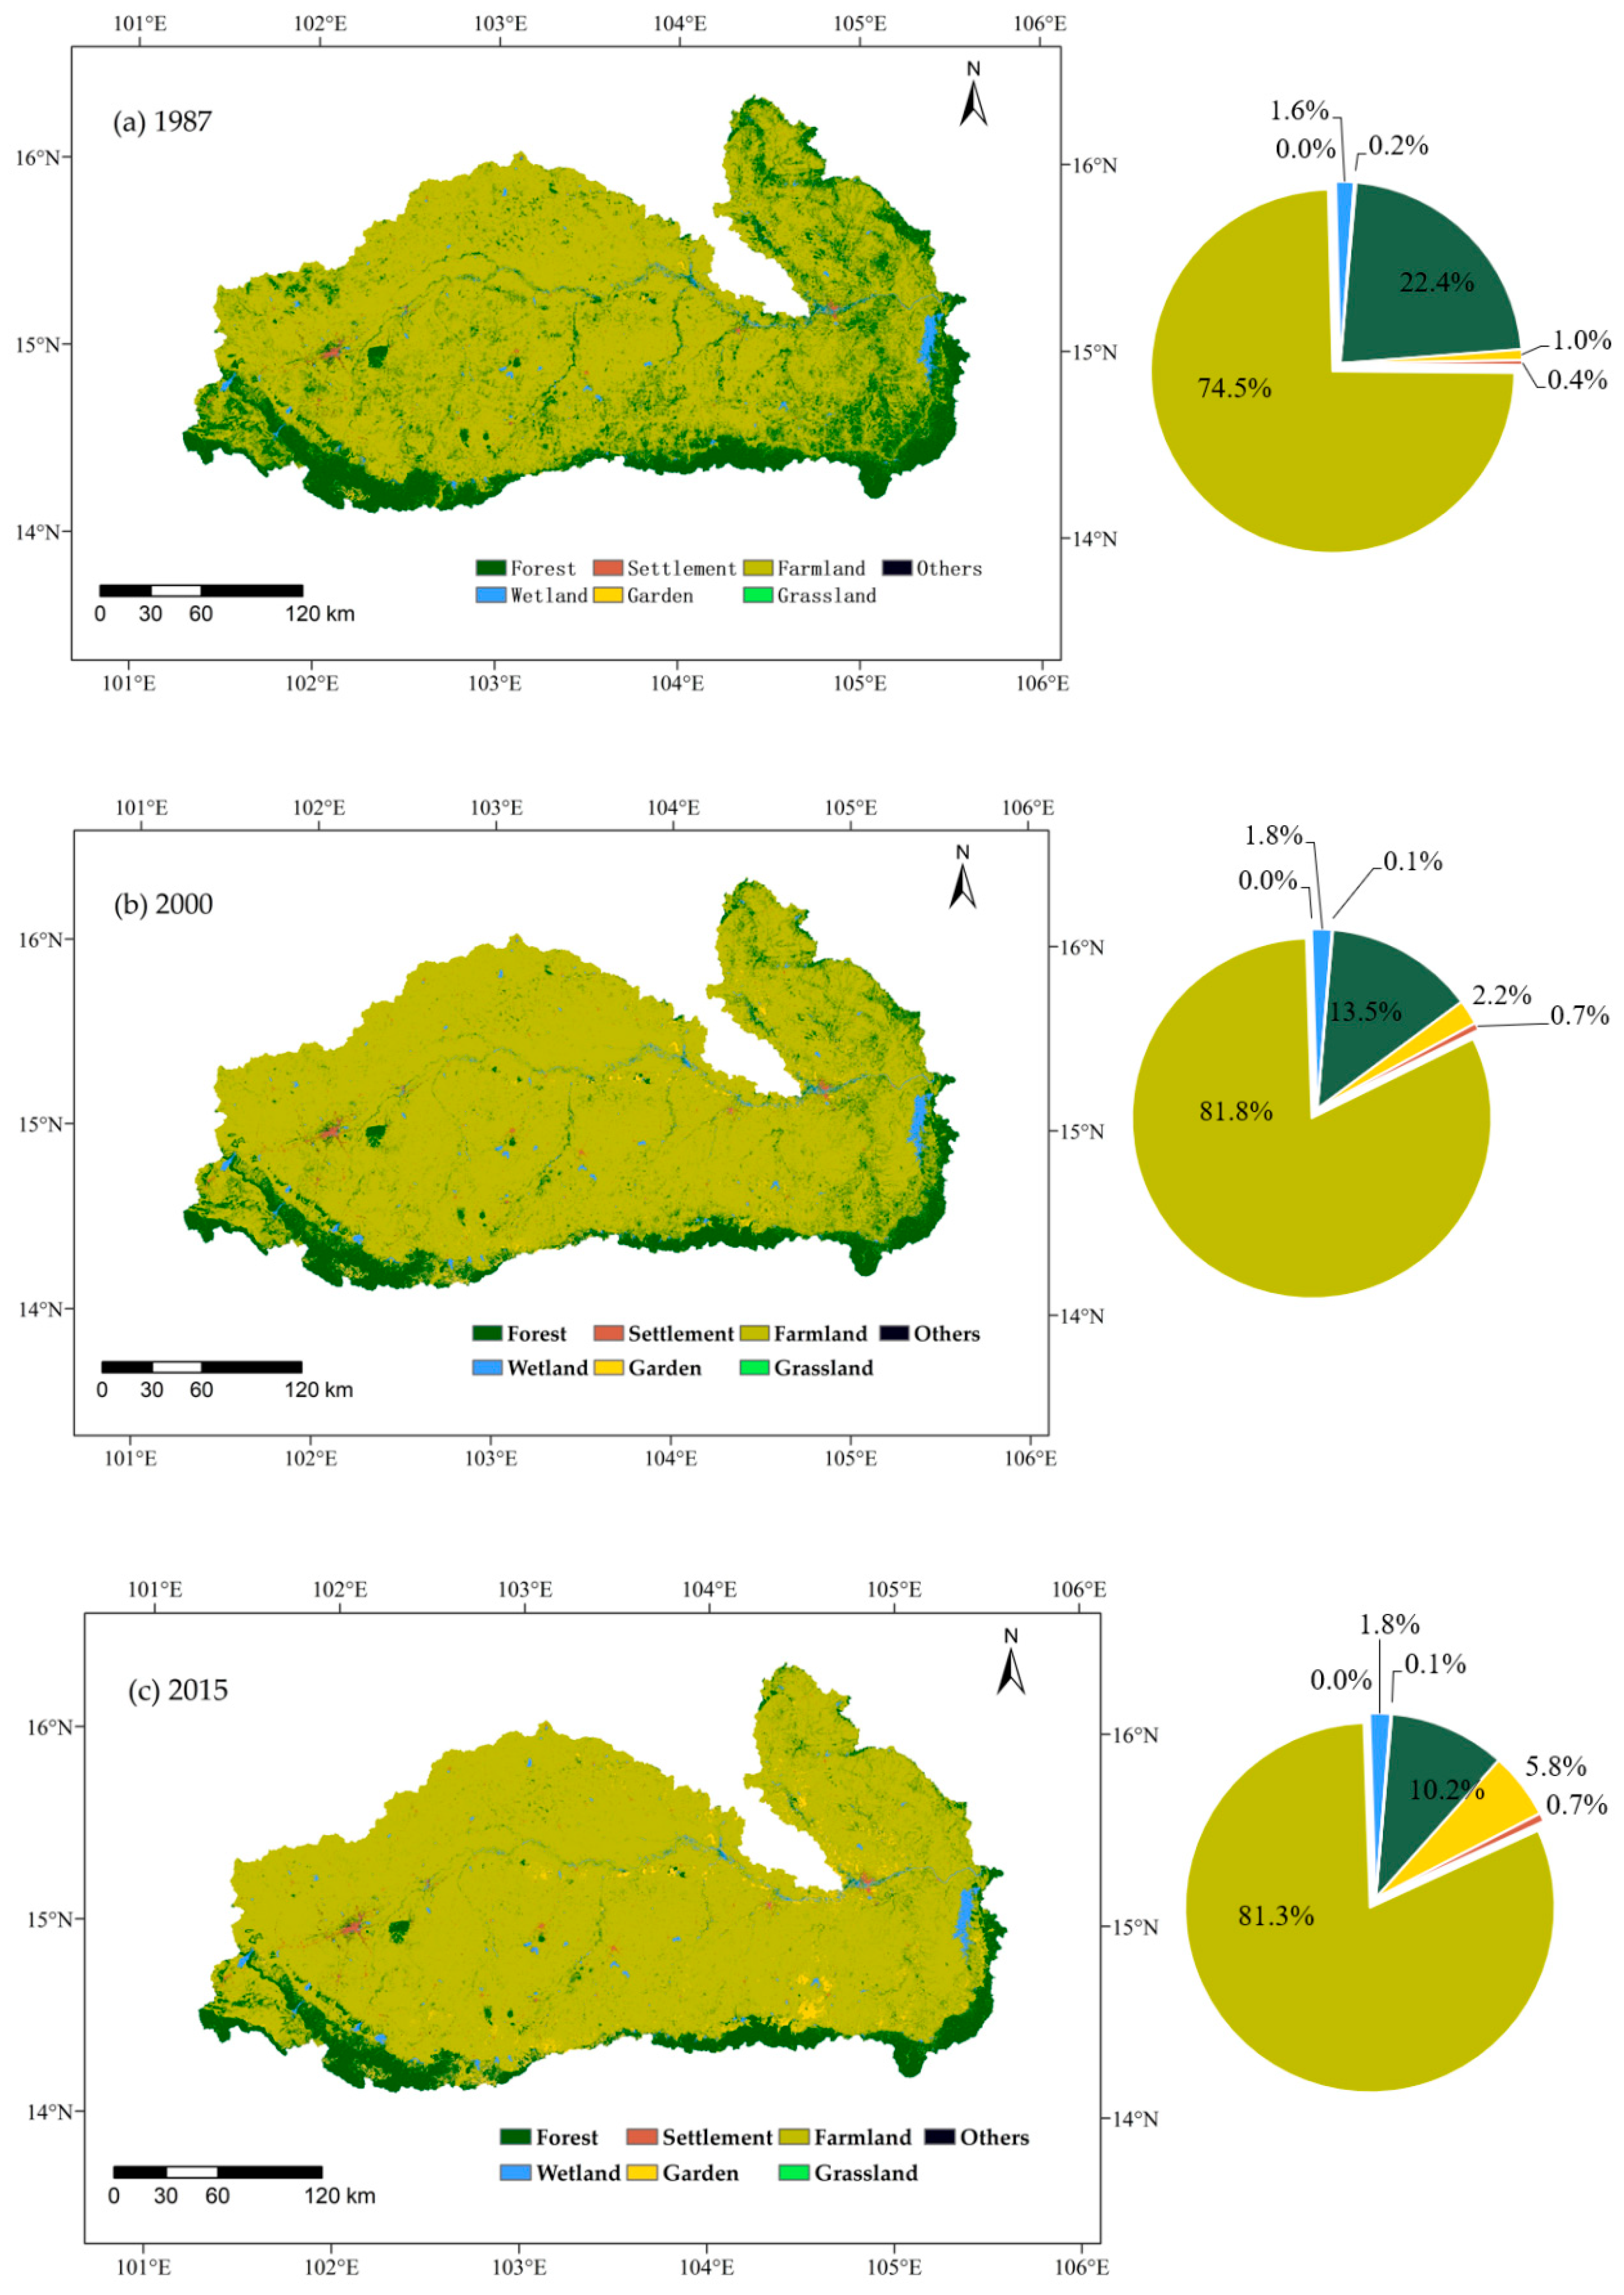
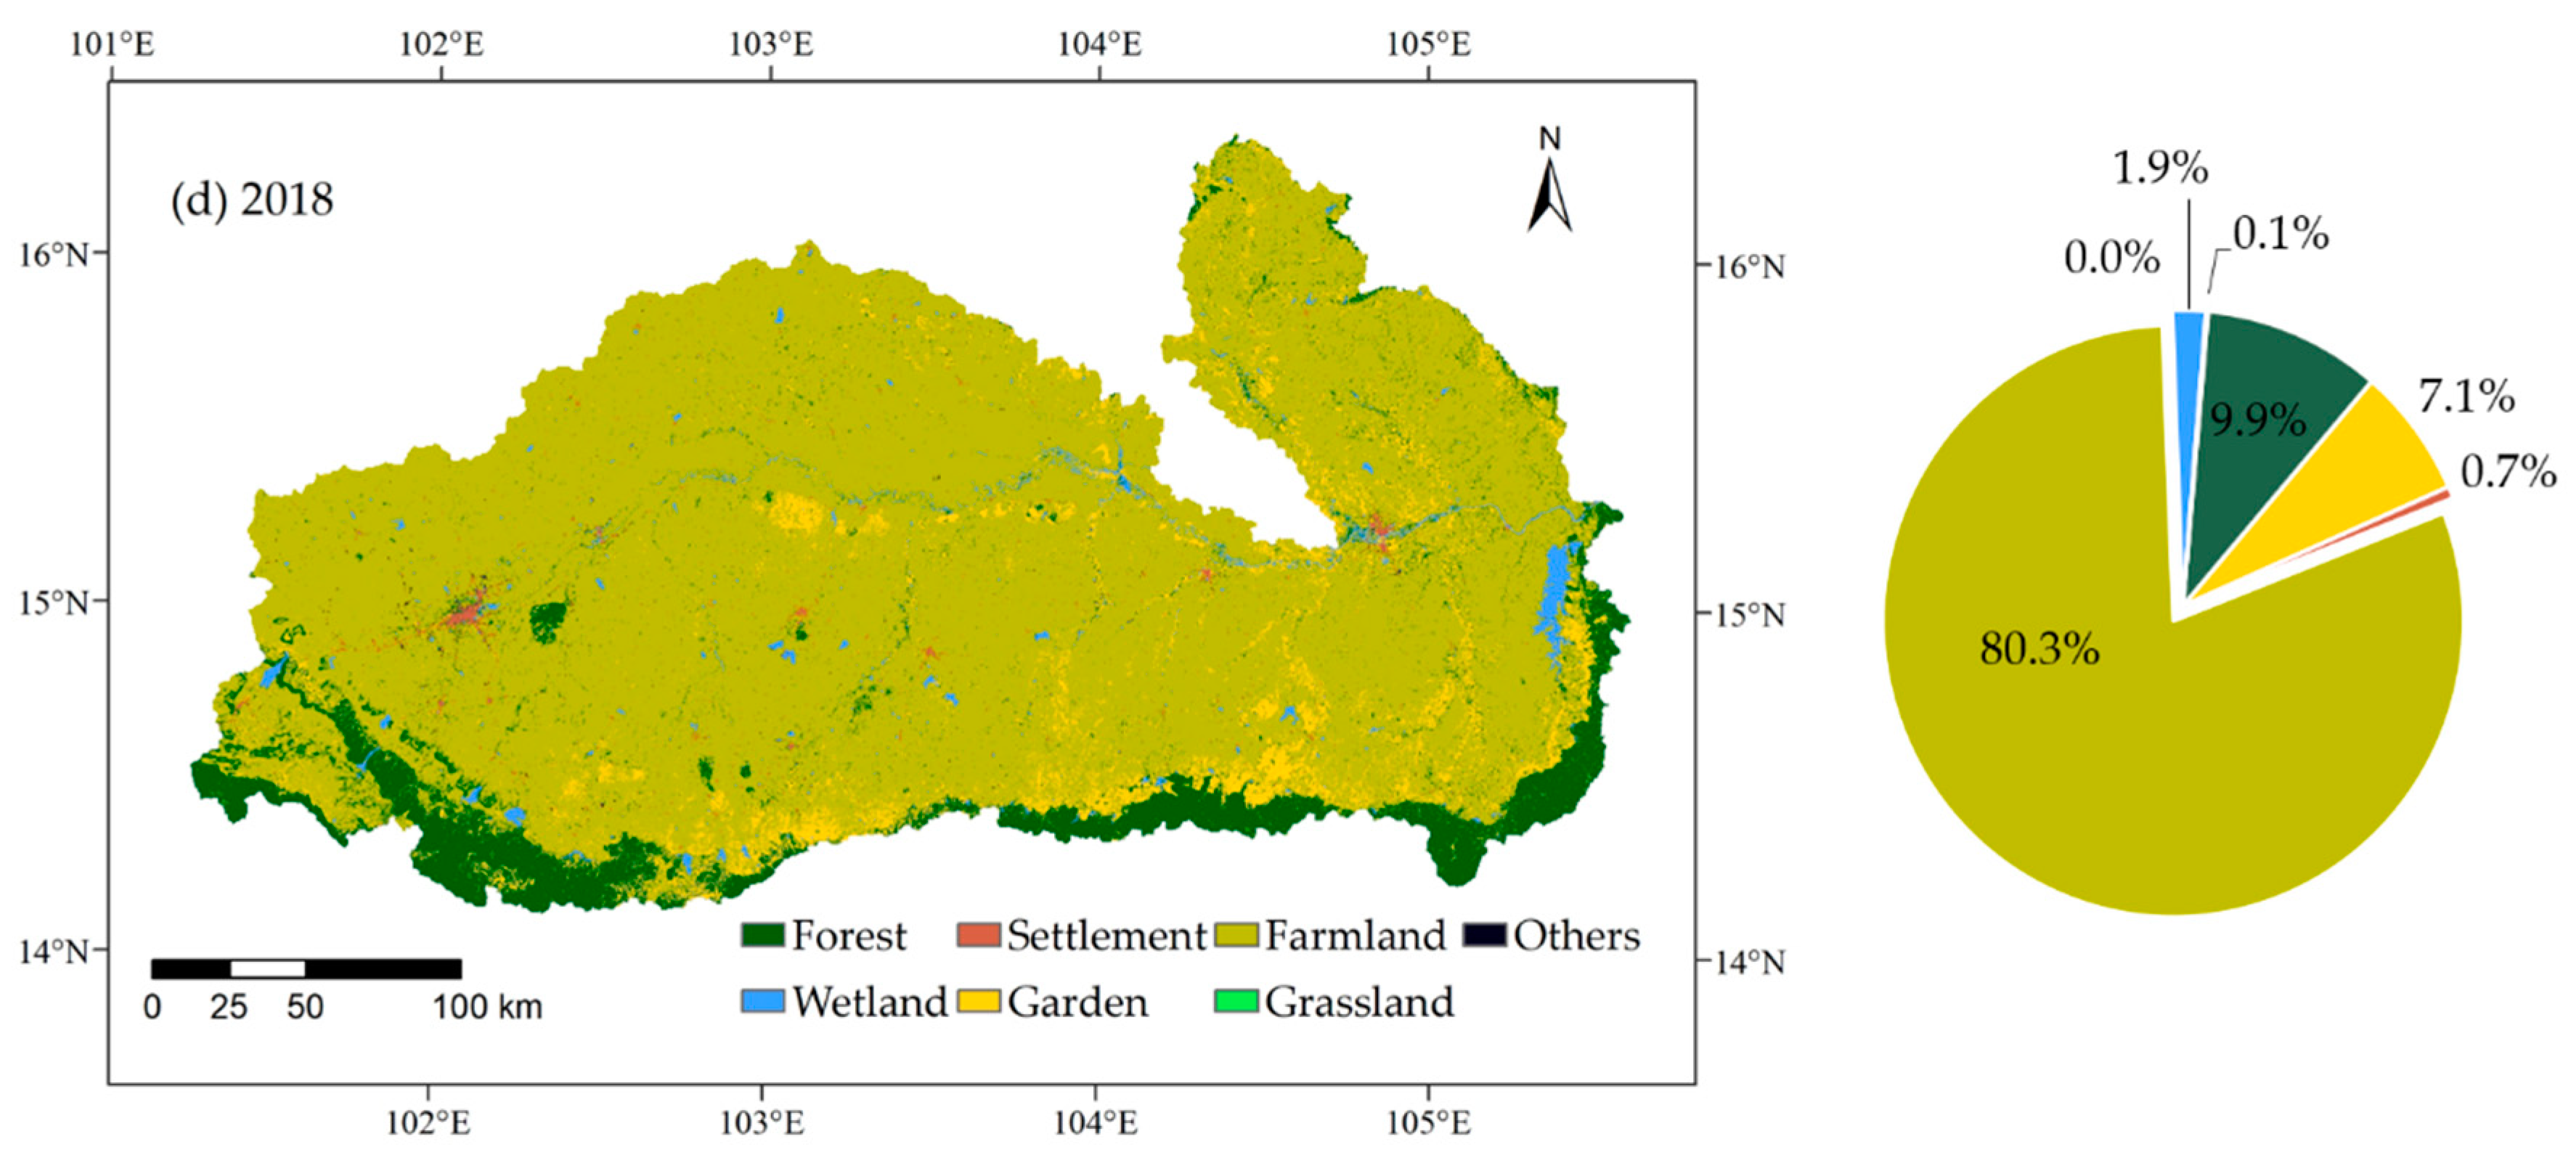
Figure 10 shows the distributions and proportions of major land use types in four years of 1987, 2000, 2015 and 2018 in the Mun River basin, respectively. It is seen clearly that farmland is the dominant land use type in the Mun River basin, occupying 74.5%, 81.8%, 81.3%, and 80.3% respectively, in 1987, 2000, 2015 and 2018. Forest area ranks the second, occupying 22.4%, 13.5%, 10.2% and 9.9%, respectively, in 1987, 2000, 2015 and 2018. While the area of wetland maintains almost the same proportion in the four years, within the range of 1.6% to 1.9%, the area of garden becomes larger and larger, from 1.0% to 2.2%, 5.8%, and finally 7.1%. The areas of settlement and other land use types take only a very small proportion in total.
Table 5 shows the areas of different land use types in typical years during 1987–2018 and the area changes during 1987–2000 and 2000–2018, respectively. It can be noticed that farmland and wetland changed only slightly during the two periods. In contrast, the area of forest decreased significantly, while the areas of grassland, garden and settlement all increased very significantly during the two periods. Because the areas of settlement, grassland and other land use types in total occupy a very small proportion of the whole land area, the most significant area changes occurred in forest and garden during 2000–2018, with the former decreasing significantly and the latter increasing dramatically.
Because the farmland in the Mun River basin is largely in the forms of rice, sugarcane and cassava plantation, an increase in farmland area can induce higher water deprivation and vice versa [51]. While there are studies that demonstrate that a reduction in the area of forest or farmland can lead to an increase in runoff due to the reduction in the water storage capacity of the land [52,53], an increase in the area of garden commonly leads to the use of more water and so can result in a reduction in runoff [12,54]. Hence, it is clear that the significant reduction in forest area and the slight reduction in farmland area in the Mun River basin during 2000–2018 helped to increase the runoff of Mun River, while the dramatic increase in garden area tends to reduce the runoff.
4. Conclusions
As the largest tributary of the Mekong River in Thailand, the Mun River provides abundant water resources to the lower Mekong River. Nevertheless, the Mun River basin is an important agricultural area in Thailand and has been subject to climate change and human activities, in particular in recent decades. To understand how the runoff of Mun River responds to climate change and human activities, this study performed a detailed examination of the characteristics of runoff variation based on measurements at two hydrological gauging stations on the main stem of Mun River during 1980-2018. Importantly, this study also presents a detailed investigation of the effects of potential factors on the variation of runoff at the basin scale. These detailed analyses yield the following results:
- In the variation of annual runoff of Mun River during 1980-2018, an abruption occurred in 1999/2000 and since then the variation of annual runoff of Mun River takes an increased trend;
- The variations of rainfall and runoff across the Mun River basin exhibit similar periodic patterns, while the average annual runoff in Period B (during 2000–2018) is significantly larger than in Period A (during 1980–1999) and the average annual rainfall in the basin varies in a consistent trend in the two periods;
- The average, maximum and minimum temperature observed at representative meteorological stations in the upper, middle and lower drain basin vary all in slightly increasing trends, while the average evaporation in Period B reduces slightly;
- The land use types in the Mun River basin vary in very different forms during 1987–2015, with forest area showing a significant decrease, garden area increasing dramatically, farmland area reducing slightly, and the other types (settlement, wetland, grassland, etc.) changing insignificantly during 2000–2015.
- The significant reduction in forest area and slight reductions in evaporation and farmland area since 1999 all help to increase the runoff of Mun River, although the dramatic increase in garden area since 1999 tends to decrease the runoff.
Under the effects of climate change and human activities, a very large number of rivers have encountered the situation of a significant reduction in runoff output. Hence, it is very interesting to know that the runoff of Mun River to the Mekong River has increased since 2000. Although this study identifies that the significant reduction in forest area and slight reductions in evaporation and farmland area since 1999 all helped to increase the runoff of Mun River, the findings are based on qualitative inferences and a more detailed quantitative assessment using basin-scale hydrologic models and other approaches is required in future studies.
Author Contributions
Conceptualization, R.L. and H.H.; methodology, R.L., H.Y., and T.S.; software, R.L., G.Y., and H.Y.; validation, R.L. and H.H.; formal analysis, R.L. and H.H.; investigation, R.L., H.H., G.Y. and A.B.; resources, A.B. and G.Y.; data curation, R.L.; writing—original draft preparation, R.L.; writing—review and editing, R.L. and H.H.; visualization, R.L., H.H. and H.Y.; supervision, H.H. and G.Y.; project administration, H.H. and G.Y.; funding acquisition, H.H. and G.Y. All authors have read and agreed to the published version of the manuscript.
Funding
This research was financially supported by the National Natural Science Foundation of China (Grant Nos. 41561144012, 41661144030) and the National Key Research and Development Program of China (2016YFC0402502).
Conflicts of Interest
The authors declare no conflict of interest.
References
- Delgado, J.M.; Apel, H.; Merz, B. Flood trends and variability in the Mekong River. Hydrol. Earth Syst. Sci. 2010, 14, 407–418. [Google Scholar] [CrossRef] [Green Version]
- Shiklomanov, I.A. The World’s Water Resources. Available online: http://www.ce.utexas.edu/prof/mckinney/ce385d/papers/shiklomanov.pdf (accessed on 14 March 2020).
- Cai, J.; Varis, O.; Yin, H. China’s water resources vulnerability: A spatio-temporal analysis during 2003–2013. J. Clean. Prod. 2017, 142, 2901–2910. [Google Scholar] [CrossRef]
- Singh, P.; Bengtsson, L. Impact of warmer climate on melt and evaporation for the rainfed, snowfed and glacierfed basins in the Himalayan region. J. Hydrol. 2005, 300, 140–154. [Google Scholar] [CrossRef]
- Fang, C.; Liu, H.; Li, G. International progress and evaluation on interactive coupling effects between urbanization and the eco-environment. J. Geog. Sci. 2016, 26, 1081–1116. [Google Scholar] [CrossRef]
- Stocker, T. (Ed.) Climate Change 2013: The Physical Science Basis: Working Group I Contribution to the Fifth Assessment Report of the Intergovernmental Panel on Climate Change; Cambridge University Press: Cambridge, UK, 2014. [Google Scholar]
- Varis, O.; Vakkilainen, P. China’s 8 challenges to water resources management in the first quarter of the 21st Century. Geomorphology 2001, 41, 93–104. [Google Scholar] [CrossRef]
- Berezovskaya, S.; Yang, D.; Kane, D.L. Compatibility analysis of precipitation and runoff trends over the large Siberian watersheds. Geophys. Res. Lett. 2004, 31. [Google Scholar] [CrossRef] [Green Version]
- Piao, S.; Ciais, P.; Huang, Y.; Shen, Z.; Peng, S.; Li, J.; Friedlingstein, P. The impacts of climate change on water resources and agriculture in China. Nature 2010, 467, 43. [Google Scholar] [CrossRef]
- Shi, H.; Hu, C.; Wang, Y.; Liu, C.; Li, H. Analyses of trends and causes for variations in runoff and sediment load of the Yellow River. Int. j. Sediment Res. 2017, 32, 171–179. [Google Scholar] [CrossRef]
- Dai, A.; Qian, T.; Trenberth, K.E.; Milliman, J.D. Changes in continental freshwater discharge from 1948 to 2004. J. Clim. 2009, 22, 2773–2792. [Google Scholar] [CrossRef]
- Wangpimool, W.; Pongput, K.; Sukvibool, C.; Sombatpanit, S.; Gassman, P.W. The effect of reforestation on stream flow in Upper Nan river basin using Soil and Water Assessment Tool (SWAT) model. Int. Soil Water Conserv. Res. 2003, 1, 53–63. [Google Scholar] [CrossRef] [Green Version]
- Shamshirband, S.; Hashemi, S.; Salimi, H.; Samadianfard, S.; Asadi, E.; Shadkani, S.; Chau, K.W. Predicting standardized streamflow index for hydrological drought using machine learning models. Eng. Appl. Comp. Fluid Mech. 2020, 14, 339–350. [Google Scholar] [CrossRef]
- Homsi, R.; Shiru, M.S.; Shahid, S.; Ismail, T.; Harun, S.B.; Al-Ansari, N.; Yaseen, Z.M. Precipitation projection using a CMIP5 GCM ensemble model: A regional investigation of Syria. Eng. Appl. Comp. Fluid Mech. 2020, 14, 90–106. [Google Scholar] [CrossRef]
- Tian, H.; Yu, G.A.; Tong, L.; Li, R.Z.; Huang, H.Q.; Bridhikitti, A.; Prabamroong, T. Water quality of the Mun River in Thailand— spatiotemporal variations and potential causes. Int. J. Environ. Res. Public Health 2019, 16, 3906. [Google Scholar] [CrossRef] [Green Version]
- Kite, G. Modelling the Mekong: Hydrological simulation for environmental impact studies. J. Hydrol. 2001, 253, 1–13. [Google Scholar] [CrossRef]
- Artlert, K.; Chaleeraktrakoon, C. Modeling and analysis of rainfall processes in the context of climate change for Mekong, Chi, and Mun River Basins (Thailand). J. Hydro-Environ. Res. 2013, 7, 2–17. [Google Scholar] [CrossRef]
- Prabnakorn, S.; Maskey, S.; Suryadi, F.X.; de Fraiture, C. Rice yield in response to climate trends and drought index in the Mun River Basin, Thailand. Sci. Total Environ. 2018, 621, 108–119. [Google Scholar] [CrossRef]
- Varis, O.; Keskinen, M.; Kummu, M. Mekong at the crossroads. AMBIO 2008, 37, 146–150. [Google Scholar] [CrossRef]
- Toda, O.; Tanji, H.A.J.I.M.E.; Somura, H.I.R.O.A.K.I.; Higuchi, K.A.S.T.U.H.I.R.O.; Yoshida, K.O.S.H.I. Evaluation of tributaries contribution in the Mekong River Basin during rainy and dry season. In Proceedings of the 2nd Asia Pacific Association of Hydrology and Water Resources Conference, Singapore, 5–8 July 2014; 2004; pp. 5–9. [Google Scholar]
- Akter, A.; Babel, M. Hydrological modeling of the Mun River basin in Thailand. J. Hydrol. 2012, 452–453, 232–246. [Google Scholar] [CrossRef]
- Zhao, Z.; Liu, G.; Liu, Q.; Huang, C.; Li, H.; Wu, C. Distribution characteristics and seasonal variation of soil nutrients in the Mun River Basin, Thailand. Int. J. Environ. Res. Public Health 2018, 15, 1818. [Google Scholar] [CrossRef] [Green Version]
- Zhao, Z.; Liu, G.; Liu, Q.; Huang, C.; Li, H. Studies on the spatiotemporal variability of river water quality and its relationships with soil and precipitation: A case study of the Mun River Basin in Thailand. Int. J. Environ. Res. Public Health 2018, 15, 2466. [Google Scholar] [CrossRef] [Green Version]
- Hydro and Agro Informatics Institute (HAII) of the Ministry of Science and Technology. Data collection and analysis under the project on developing 25 basins data archive and water extreme simulations: The Mun River Basin, 2012, 74pp. Available online: http://www.thaiwater.net/web/attachments/25basins/05-moon.pdf (accessed on 14 March 2020). (In Thai).
- Snidvongs, A.; Choowaew, S.; Chinvanno, S. Impact of Climate Change on Water and Wetland Resources in Mekong River Basin: Directions for Preparedness and Action; IUCN: Gland, Switzerland, 2003. [Google Scholar]
- Kosa, P.; Kulworawanichpong, T.; Horpibulsuk, S.; Chinkulkijiwat, A.; Srivoramas, R.; Teaumroong, N. Potential micro-hydropower assessment in Mun River Basin, Thailand. In Proceedings of the 2011 Asia-Pacific Power and Energy Engineering Conference (APPEEC), Wuhan, China, 25–28 March 2011. [Google Scholar]
- Hirsch, R.; Slack, J. A Nonparametric trend test for seasonal data with serial dependence. Water Resour. Res. 1984, 20, 727–732. [Google Scholar] [CrossRef] [Green Version]
- Bouza-Deaño, R.; Ternero-Rodríguez, M.; Fernández-Espinosa, A. Trend study and assessment of surface water quality in the Ebro River (Spain). J. Hydrol. 2008, 361, 227–239. [Google Scholar] [CrossRef]
- Zhan, C.S.; Jiang, S.S.; Sun, F.B.; Jia, Y.W.; Niu, C.W.; Yue, W.F. Quantitative contribution of climate change and human activities to runoff changes in the Wei River basin, China. Hydrol. Earth Sys. Sci. 2014, 18, 3069–3077. [Google Scholar] [CrossRef] [Green Version]
- Zhang, Q.; Liu, C.; Xu, C.; Xu, Y.; Jiang, T. Observed trends of annual maximum water level and streamflow during past 130 years in the Yangtze River basin, China. J. Hydrol. 2006, 324, 255–265. [Google Scholar] [CrossRef]
- Kundzewicz, Z.; Robson, A. Change detection in hydrological records—a review of the methodology. Hydrol. Sci. J. 2004, 49, 7–19. [Google Scholar] [CrossRef]
- Holdaway, M.R. Spatial modeling and interpolation of monthly temperature using Kriging. Clim. Res. 1996, 6, 215–225. [Google Scholar] [CrossRef] [Green Version]
- Lafreniere, M.; Sharp, M. Wavelet analysis of inter-annual variability in the runoff regimes of glacial and nival stream catchments, Bow Lake, Alberta. Hydrol. Process. 2003, 17, 1093–1118. [Google Scholar] [CrossRef]
- Ma, J.; Chen, L.; He, J.; Zhang, Y.; Li, X.; Edmunds, W.M. Trends and periodicities in observed temperature, precipitation and runoff in a desert catchment: Case study for the Shiyang River Basin in Northwestern China. Water Environ. J. 2013, 27, 86–98. [Google Scholar] [CrossRef]
- Fiedler, F.R. Simple, practical method for determining station weights using Thiessen polygons and isohyetal maps. J. Hydrol. Eng. 2003, 8, 219–221. [Google Scholar] [CrossRef]
- Kendall, M.G. Rank Correlation Methods. 2nd impression. In Charles Griffin and Company Ltd. London and High. Wycombe; Griffin: London, UK, 1975. [Google Scholar]
- Noszczyk, T.; Rutkowska, A.; Hernik, J. Determining changes in land use structure in Małopolska using statistical methods. Polish J. Environ. Stud. 2017, 26, 211–220. [Google Scholar] [CrossRef]
- Yanming, Z.; Jun, W.; Xinhua, W. Study on the change trend of precipitation and temperature in Kunming city based on Mann-Kendall analysis. In Future Computer, Communication, Control and Automation; Springer: Heidelberg, Germany, 2012; pp. 505–513. [Google Scholar]
- Tang, X.L.; Li, J.F.; Lv, X.; Long, H.L. Analysis of the characteristics of runoff in the Manasi River Basin in the past 50 years. Procedia Environ. Sci. 2012, 13, 1354–1362. [Google Scholar] [CrossRef] [Green Version]
- Li, H. Complex Morlet wavelet amplitude and phase map based bearing fault diagnosis. In Proceedings of the 2010 8th World Congress on Intelligent Control and Automation, Jinan, China, 7–9 July 2010. [Google Scholar]
- Long, C.J.; Datta, S. Wavelet based feature extraction for phoneme recognition. In Proceeding of the Fourth International Conference on Spoken Language Processing. ICSLP’96, Philadelphia, PA, USA, 3–6 October 1996; Volume 1, pp. 264–267. [Google Scholar]
- Nason, G.P.; Sachs, R.V. Wavelets in time-series analysis. Philos. Trans. R. Soc. Lond. Ser. A Math. Phys. Eng. Sci. 1999, 357, 2511–2526. [Google Scholar] [CrossRef]
- Smith, L.C.; Turcotte, D.L.; Isacks, B.L. Stream flow characterization and feature detection using a discrete wavelet transform. Hydrol. Process. 1998, 12, 233–249. [Google Scholar] [CrossRef]
- Searcy, J.K.; Hardison, C.H.; Langbein, W.B. Double-Mass Curves, with a Section Fitting Curves to Cyclic Data; US Government Printing Office: Washington, DC, USA, 1960; pp. 31–66.
- Mu, X.M.; Zhang, X.Q.; Gao, P.; Wang, F. Theory of double mass curves and its applications in hydrology and meteorology. J. China Hydrol. 2010, 30, 47–51. [Google Scholar]
- Hattermann, F.F.; Post, J.; Conradt, T.; Wechsung, F. Assessment of water availability in a Central-European River Basin (Elbe) under climate change. Adv. Clim. Change Res. 2008, 4, 42–50. [Google Scholar]
- Keblouti, M.; Ouerdachi, L.; Boutaghane, H. Spatial interpolation of annual precipitation in Annaba-Algeria-comparison and evaluation of methods. Energy Procedia 2012, 18, 468–475. [Google Scholar] [CrossRef] [Green Version]
- Azpurua, M.A.; Ramos, K.D. A comparison of spatial interpolation methods for estimation of average electromagnetic field magnitude. Prog. Electromagn. Res. 2010, 14, 135–145. [Google Scholar] [CrossRef] [Green Version]
- Wilk, J.; Kniveton, D.; Andersson, L.; Layberry, R.; Todd, M.C.; Hughes, D.; Vanderpost, C. Estimating rainfall and water balance over the Okavango River Basin for hydrological applications. J. Hydrol. 2006, 331, 18–29. [Google Scholar] [CrossRef] [Green Version]
- Zhang, L.; Hickel, K.; Dawes, W.R.; Chiew, F.H.; Western, A.W.; Briggs, P.R. A rational function approach for estimating mean annual evapotranspiration. Water Resour. Res. 2004, 40. [Google Scholar] [CrossRef]
- Gheewala, S.; Silalertruksa, T.; Nilsalab, P.; Mungkung, R.; Perret, S.; Chaiyawannakarn, N. Water footprint and impact of water consumption for food, feed, fuel crops production in Thailand. Water 2014, 6, 1698–1718. [Google Scholar] [CrossRef] [Green Version]
- Wei, W.; Chen, L.; Fu, B.; Huang, Z.; Wu, D.; Gui, L. The effect of land uses and rainfall regimes on runoff and soil erosion in the semi-arid loess hilly area, China. J. Hydrol. 2007, 335, 247–258. [Google Scholar] [CrossRef]
- Zhang, A.; Zhang, C.; Fu, G.; Wang, B.; Bao, Z.; Zheng, H. Assessments of impacts of climate change and human activities on runoff with SWAT for the Huifa River Basin, Northeast China. Water Resour. Manage. 2012, 26, 2199–2217. [Google Scholar] [CrossRef]
- Pei, L.I. The progress and enlightenment of Thailand urbanization. Urban Problems 2007, 6. [Google Scholar]
Figure 1.
Location of the Mun River basin and the river network.

Figure 2.
Spatial distribution of mean annual rainfall in the Mun River basin based on observations during 1980–2015.
Figure 2.
Spatial distribution of mean annual rainfall in the Mun River basin based on observations during 1980–2015.

Figure 3.
Variations of monthly average flow discharge at CHUMPHON (CH) (a) and UBON (UB) (b) stations during 1980–2018 in line with the variations of monthly average rainfall in the Mu River basin.
Figure 3.
Variations of monthly average flow discharge at CHUMPHON (CH) (a) and UBON (UB) (b) stations during 1980–2018 in line with the variations of monthly average rainfall in the Mu River basin.

Figure 4.
Variations of annual runoff and rainfall at CHUMPHON (CH) (a) and UBON (UB) (b) stations.

Figure 5.
Results of the Mann-Kendall mutation test (a) and cumulative anomaly variation of annual runoff at UBON (UB) station (b) in Mun River.
Figure 5.
Results of the Mann-Kendall mutation test (a) and cumulative anomaly variation of annual runoff at UBON (UB) station (b) in Mun River.

Figure 6.
The real part of Morlet wavelet transform coefficient and the wavelet variances at CHUMPHON (CH) (a) and UBON (UB) (b) stations.
Figure 6.
The real part of Morlet wavelet transform coefficient and the wavelet variances at CHUMPHON (CH) (a) and UBON (UB) (b) stations.

Figure 7.
The real part of Morlet wavelet transform coefficient and the wavelet variances of rainfall at representative weather stations in the Mun River basin: (a) at Phi Mai Barrage station; (b) at Mun River station; and (c) at Regional R.I.D.
Figure 7.
The real part of Morlet wavelet transform coefficient and the wavelet variances of rainfall at representative weather stations in the Mun River basin: (a) at Phi Mai Barrage station; (b) at Mun River station; and (c) at Regional R.I.D.

Figure 8.
Cumulative variations of rainfall and runoff in the Mun River basin during 1980–2015: (a) Variation of cumulative runoff against cumulative rainfall; (b) Variation of cumulative runoff with time; and (c) Variation of cumulative rainfall with time.
Figure 8.
Cumulative variations of rainfall and runoff in the Mun River basin during 1980–2015: (a) Variation of cumulative runoff against cumulative rainfall; (b) Variation of cumulative runoff with time; and (c) Variation of cumulative rainfall with time.

Figure 9.
Variations of annual air temperatures (min, mean and max) (a) and evapotranspiration (b) in the Mun River basin during 1980–2015.
Figure 9.
Variations of annual air temperatures (min, mean and max) (a) and evapotranspiration (b) in the Mun River basin during 1980–2015.

Figure 10.
The distribution maps of different land use types in 1987 (a), 2000 (b), 2015 (c) and 2018 (d) in the Mun River basin
Figure 10.
The distribution maps of different land use types in 1987 (a), 2000 (b), 2015 (c) and 2018 (d) in the Mun River basin


Table 1.
Summary list of data collected for this study.
| Data Type | Criterion | Duration | Site | Source |
|---|---|---|---|---|
| Spatial data DEM | ASTER GDEMV2 Scale: 1:100,000 | Geospatial Data Cloud http://www.gscloud.cn/ | ||
| Basin boundary | Vector format | Mahasarakan University | ||
| Land use | Raster format | 1987–2018 | Servir Mekong website https://servir.adpc.net/ | |
| Hydro-meteorological data | Daily | |||
| Rainfall | Daily | 1960–2015 | 159 stations | R.I.D |
| Temperature | Daily | 1980–2014 | 3 stations | GSOD |
| Evaporation | Daily | 1980–2015 | 13stations | R.I.D |
| Runoff | Monthly | 1980–2018 | 2 stations | R.I.D |
Table 2.
Variation characteristics of runoff at CHUMPHON (CH) and UBON (UB) stations in the Mun River basin.
Table 2.
Variation characteristics of runoff at CHUMPHON (CH) and UBON (UB) stations in the Mun River basin.
| Station | Z(1980–1999) | Z(2000–2018) | Cv | |
|---|---|---|---|---|
| CH | 2.06* | −0.62 | 0.3 | 0.4 |
| UB | 0.27 | −2.36** | 1.13 | 0.6 |
Note: * and ** mean at a 0.1 and 0.05 significance level, respectively.
Table 3.
The periodical characteristics of runoff and rainfall variation in the Mun River basin.
| Runoff-Rainfall | Reach | Time Scale | ||
|---|---|---|---|---|
| Long (16–30a) | Middle (10–15a) | Short (<10a) | ||
| Runoff | Upper and middle | 15 | 11 | 6 |
| Middle and lower | 15 | 11 | 5 | |
| Rainfall | Upper | 17 | 8-10 | 5 |
| Middle | 14 | 8-10 | 5 | |
| Lower | 16 | 8-10 | 5 | |
Table 4.
Values and variations of slope calculated from the cumulative curves of rainfall against runoff.
Table 4.
Values and variations of slope calculated from the cumulative curves of rainfall against runoff.
| Station | Period | Curve Slope Value | Compared to Period A | ||
|---|---|---|---|---|---|
| Slope Variation | Rate | ||||
| Rainfall-runoff | UBON | A(1980–1999) | 0.013 | ||
| B(2000–2015) | 0.017 | 0.004 | 30.7% | ||
| Runoff | UBON | A(1980–1999) | 17.212 | ||
| B(2000–2015) | 21.181 | 3.969 | 23.1% | ||
| Rainfall | Phi Mai Barrage | A(1980–1999) | 1568.2 | ||
| B(2000–2015) | 1757.2 | 189 | 12.1% | ||
| Mun River | A(1980–1999) | 1135.8 | |||
| B(2000–2015) | 1133.2 | −2.6 | -0.2% | ||
| Regional R.I.D | A(1980–1999) | 1065.4 | |||
| B(2000–2015) | 1131.0 | 65.6 | 6.2% | ||
Table 5.
The changes of different land use types in the Mun River basin during 1987–2018.
| Land-Use Type | 1987 (km2) | 2000 (km2) | 2015 (km2) | 1987–2000 (%) | 2000–2015 (%) | 2015–2018 (%) |
|---|---|---|---|---|---|---|
| Forest | 13,246.37 | 7965.03 | 6042.71 | −39.87 | −24.13 | −3.08 |
| Wetland | 960.28 | 1074.6 | 1078.01 | 11.91 | 0.32 | 2.78 |
| Settlement | 252.30 | 389.25 | 436.50 | 54.28 | 12.14 | −11.51 |
| Garden | 564.70 | 1329.94 | 3452.68 | 135.51 | 159.61 | 22.05 |
| Farmland | 44,089.32 | 48,409.13 | 48,139.00 | 9.80 | −0.56 | −1.19 |
| Grassland | 0.003 | 1.37 | 7.37 | 45,666 | 437.96 | 24.17 |
| Others | 96.60 | 40.25 | 53.30 | −58.33 | 32.42 | 16.60 |
© 2020 by the authors. Licensee MDPI, Basel, Switzerland. This article is an open access article distributed under the terms and conditions of the Creative Commons Attribution (CC BY) license (http://creativecommons.org/licenses/by/4.0/).
Share and Cite
MDPI and ACS Style
Li, R.; Huang, H.; Yu, G.; Yu, H.; Bridhikitti, A.; Su, T. Trends of Runoff Variation and Effects of Main Causal Factors in Mun River, Thailand During 1980–2018. Water 2020, 12, 831. https://doi.org/10.3390/w12030831
AMA Style
Li R, Huang H, Yu G, Yu H, Bridhikitti A, Su T. Trends of Runoff Variation and Effects of Main Causal Factors in Mun River, Thailand During 1980–2018. Water. 2020; 12(3):831. https://doi.org/10.3390/w12030831
Chicago/Turabian StyleLi, Renzhi, Heqing Huang, Guoan Yu, Hong Yu, Arika Bridhikitti, and Teng Su. 2020. "Trends of Runoff Variation and Effects of Main Causal Factors in Mun River, Thailand During 1980–2018" Water 12, no. 3: 831. https://doi.org/10.3390/w12030831
Note that from the first issue of 2016, this journal uses article numbers instead of page numbers. See further details here.