Article

Injection of Zerovalent Iron Gels for Aquifer Nanoremediation: Lab Experiments and Modeling

1
Department of Environment, Land and Infrastructure Engineering, Politecnico di Torino, corso Duca degli Abruzzi 24, 10129 Torino, Italy
2
Decarbonisation and Environmental Laboratories, Eni S.p.A., Via F. Maritano 26, 20097 San Donato Milanese, Italy
*
Author to whom correspondence should be addressed.
Water 2020, 12(3), 826; https://doi.org/10.3390/w12030826
Submission received: 19 February 2020 / Revised: 9 March 2020 / Accepted: 12 March 2020 / Published: 15 March 2020

Abstract

:
One of the main technical problems faced during field-scale injections of iron microparticles (mZVI) for groundwater nanoremediation is related to their poor colloidal stability and mobility in porous media. In this study, a shear-thinning gel, composed of a mixture of two environmentally friendly biopolymers, i.e., guar gum and xanthan gum, was employed to overcome these limitations. The slurry rheology and particle mobility were characterized by column transport tests. Then, a radial transport experiment was performed to mimic the particle delivery in more realistic conditions. The gel, even at a low polymeric content (1.75 g/L), proved effective in enhancing the mobility of high concentrated mZVI suspensions (20 g/L) in field-like conditions. The high radius of influence (73 cm) and homogeneous iron distribution were achieved by maintaining a low injection overpressure (<0.4 bar). Based only on the information derived from column tests, the MNMs 2018 software (Micro- and Nanoparticle transport, filtration, and clogging Model-Suite) was able to predict the particle distribution and pressure build-up measured in the radial domain. Experimental and simulated results showed good agreement, thus proving that a simplified experimental-modeling procedure based on 1D column tests could be used to effectively upscale the slurry behavior to more representative scales, e.g., radial domains.

Graphical Abstract

1. Introduction

The subsurface injection of water-based slurries containing nanoreagents (the so-called nanoremediation) has proved to be an effective technique for in-situ remediation of contaminated aquifers [1,2,3,4,5,6]. Typically, nanoreagents are injected directly close to the source of the contamination, thus improving the remediation performances and reducing the investment costs compared to more commonly applied techniques, such as permeable reactive barriers or pump and treat systems [7,8].
Due to its high specific surface area and strong reducing power, nanoscale zero-valent iron (nZVI) is one of the most extensively studied materials for in situ treatment of many widespread contaminants, such as chlorinated solvents, heavy metal ions, and pesticides [9,10,11,12,13]. On the other hand, microscale iron particles (mZVI) have also been considered as a valid alternative to nZVI. Despite the fact that the reactivity toward pollutants of mZVI is usually smaller than the nanoparticle one, the use of microscale iron in field applications presents some relevant advantages compared to nZVI, such as the longer lifetime of the remediation, easier and safer handling of the dry particles, and lower commercial costs.
The successful implementation of a ZVI-based nanoremediation is strictly related to the achievement of effective delivery and distribution of the iron in the contaminated aquifer system. Particle delivery into the subsoil can be performed either through high-pressure injections using direct push equipment (controlled fracturing approach) [14,15,16] or by applying low-pressure injections through screened wells (permeation approach) [17,18]. In the first case, particles are delivered within fractures or preferential flow pathways that are created in the aquifer during the injection, and the overall distribution of the reagent results to be heterogeneous. Therefore, the maximum migration distance that can be achieved is mainly influenced by the injection pressure, the geotechnical properties of the aquifer, and the colloidal stability of the slurry. If a permeation approach is applied, a radial or radial-like flow is established around the well [17,19], and the distribution of the particles is expected to be more homogeneous. In this case, particle transport in porous media is controlled by particle-particle and particle-porous medium interactions, which are, in turn, affected by the flow velocity, the colloidal stability of the suspension, and the rheological properties of the carrier fluid.
When dispersed in pure water, iron particles exhibit very poor colloidal stability that results in fast sedimentation and unsatisfying migration through the porous medium. Specifically, due to magnetic aggregation among particles, nZVI tends to form big clusters that quickly settle down within the suspension. For microparticles, instead, the sedimentation is induced by their high density and relatively large size [20]. Green polymers, such as guar gum (GG) [21,22], xanthan gum (XG) [23], starch, and carboxymethyl-cellulose [24], are commonly used to improve the colloidal stability of iron particles. When dosed in concentrations of few g/L [17], these polymers provide steric repulsion among particles and increase the slurry viscosity, thus preventing iron sedimentation for several hours [25].
Concerning toxicological aspects, the application of biopolymers for groundwater remediation is considered safe and harmless for the environment [26]. The same molecules are, in fact, also used as eco-friendly thickeners in the food industry. On the other hand, several studies have shown that the presence of organic coatings is able to reduce the potential toxicity of nZVI to microorganisms by reducing the adhesion between the bacteria cell wall and the particles and thus decreasing the oxidative stress response [27]. Moreover, once in groundwater, polymeric stabilizers, specifically guar gum, act as carbon sources to promote the growth of soil bacteria [28]. In this way, it is possible to potentiate the organic contaminant removal effectiveness by combining the abiotic dehalogenation potential of iron particles with the biotic degradation mechanisms induced by the growth of indigenous microbial communities.
From a rheological point of view, biopolymer solutions are characterized by a shear-thinning behavior: the viscosity of the fluid is high at a low shear rate (static or quasi-static conditions), while it strongly decreases in dynamic conditions. As a consequence of this behavior, biopolymers can be used both to prevent particle sedimentation during the storage of the suspension and to contain the pressure build-up during the injection [29,30,31,32]. This aspect is crucial in the case of particle delivery through a permeation approach, when an excessive pressure increase during the injection phase may lead to a potential fracturing of the porous medium and a consequent formation of preferential flow paths for particle migration [1,33].
As an alternative to single biopolymer solutions, Xue and Sethi [34] proposed to use a shear-thinning gel for the stabilization of iron micro- and nanoparticles. The gel, obtained by amending GG solutions with small amounts of XG (XG/GG weight ratio 1:19), is characterized by a viscoelastic behavior given by the synergistic effect between the two polymers. Thanks to its viscoelastic properties, the gel, even at polymer concentrations lower than 1.5 g/L, has shown optimal capabilities in the stabilization of highly concentrated (20 g/L) micro- and nanoparticle suspensions (stability time up to few days). Xue and Sethi [34] fully characterized the rheological behavior of the gel and its stabilization performances in static conditions. However, the gel capacity to improve the iron particle mobility in porous media has never been studied. The aim of this work was to evaluate the capacity of the shear-thinning gel to improve the mobility of mZVI particles in field-like conditions. To achieve this goal, a hybrid experimental modeling approach was applied to characterize both the rheological behavior of the gel and the particle mobility in dynamic conditions.
The design of a micro- or nanoremediation intervention requires detailed knowledge of the flow velocity influence on the kinetics of the particle-porous medium interactions (deposition and release processes), of the potential clogging of the aquifer, and of the shear-thinning carrier fluid viscosity [35,36,37]. From an experimental point of view, 2D or 3D experimental models are commonly employed to characterize contaminant and particle transport under uniform or natural flow [38,39]. However, the reproduction at a laboratory scale of a radial flow—similar to the one observed during field injection—may result to be complex, expensive, and time-consuming [40,41]. For this reason, a simplified approach is usually adopted for the characterization of the velocity-dependent particle transport parameters. This approach is based on the execution of a few 1D column transport tests at different flow rates and on the application for the result upscaling [17]. However, to the authors’ knowledge, this approach has never been verified against experimental data obtained from radial-like experiments. To fill this gap, in this work, both a simplified experimental-modeling approach and a full radial experiment were used to characterize the transport of a highly concentrated suspension (20 g/L) of mZVI particles stabilized with a 1.75 g/L shear-thinning gel, and results were compared to cross-validate the methods.
As a first step, a set of one-dimensional column transport tests was performed at different injection flow rates to investigate the effect of flow velocity on the mobility of the stabilized mZVI particles and to verify the gel rheology inside the porous medium [17]. The MNMs 2018 software (Micro- and Nanoparticle transport, filtration, and clogging Model-Suite) (https://areeweb.polito.it/ricerca/groundwater/software/mnms/) was employed to determine the kinetic parameters governing the gel-stabilized mZVI particle transport in porous media. Secondly, the mZVI slurry was injected in a radial experimental setup, which was built to mimic in the laboratory the flow field and the operating conditions typically observed during real field scale injections. A simulation in radial coordinates was then performed in forward mode using the coefficients obtained from column tests, and the results gathered were found to be in good agreement with the particle distribution measured at the end of the radial experiment. This finding confirmed the validity of the experimental-modeling procedure as a reliable tool to characterize the gel-stabilized particle mobility in simplified geometries (i.e., column transport test) and to predict the slurry behavior in field-like conditions (i.e., radial injection test).

2. Materials and Methods

2.1. Materials

Microscale iron particles (Superfine Iron Powder UIF) were supplied as a dry powder by SAGWELL Science & Technology CO., LTD (Chengdu City, China). Such particles are approximately spherical with nominal sizes of 0.86 μm (d10), 1.9 μm (d50), and 3.97 μm (d90) and are composed of iron (98.55%), oxygen (0.80%), carbon (0.03%), nitrogen (0.01%), and other impurities (0.61%). Their specific surface area per unit of solid volume is 3.16 × 10⁻⁶ m 2 / m 3 , and their density is 9760 kg / m 3 . Guar gum and xanthan gum were both provided by Rantec Corporation (Ranchester, Wyoming, USA) in the form of dry powder. The carboxymethyl cellulose (CMC-2000) was supplied by CHEMPOINT (Maastricht, The Netherlands).
For the column and radial transport tests, pure quartz sand (Dorsilit #8 from Dorfner GmbH & Co., Hirschau, Germany) was used to mimic an ideal porous medium. The sand is mainly composed of quartz (99.1%), with the measured size distribution d 10 , s a n d d 50 , s a n d d 90 , s a n d of 0.22–0.28–0.33 mm, respectively. The average grain density was found equal to 2650 kg/m3. Furthermore, to eliminate any residual impurities and colloids, the sand was cleaned through three cycles of washing and sonication with NaOH 0.1 M, tap water, and deionized water.

2.2. Preparation of the mZVI Slurry

The shear-thinning gel and the mZVI particle suspensions were prepared following a modified version of the procedure proposed by Xue and Sethi [34]. To summarize the process: GG was dissolved in warm water (60 °C) at a concentration of 1.75 g/L; the solution was stirred for 30 min and left in the fridge for full hydration and sedimentation of the polymer undissolved fraction [17]. The supernatant was then filtered through a sandy bed to completely remove the undissolved polymer residuals (microgels) that could contribute to clogging the porous medium during particle injection [29,42]. Furthermore, mZVI particles were dispersed at a concentration of 20 g/L within the GG solution using a high shear mixer, and the proper amount of XG was added to the polymeric solution to reach a mass ratio of 1:19 with respect to GG, thus creating the gel. Finally, the ZVI slurries were degassed using a vacuum pump to remove air bubbles.

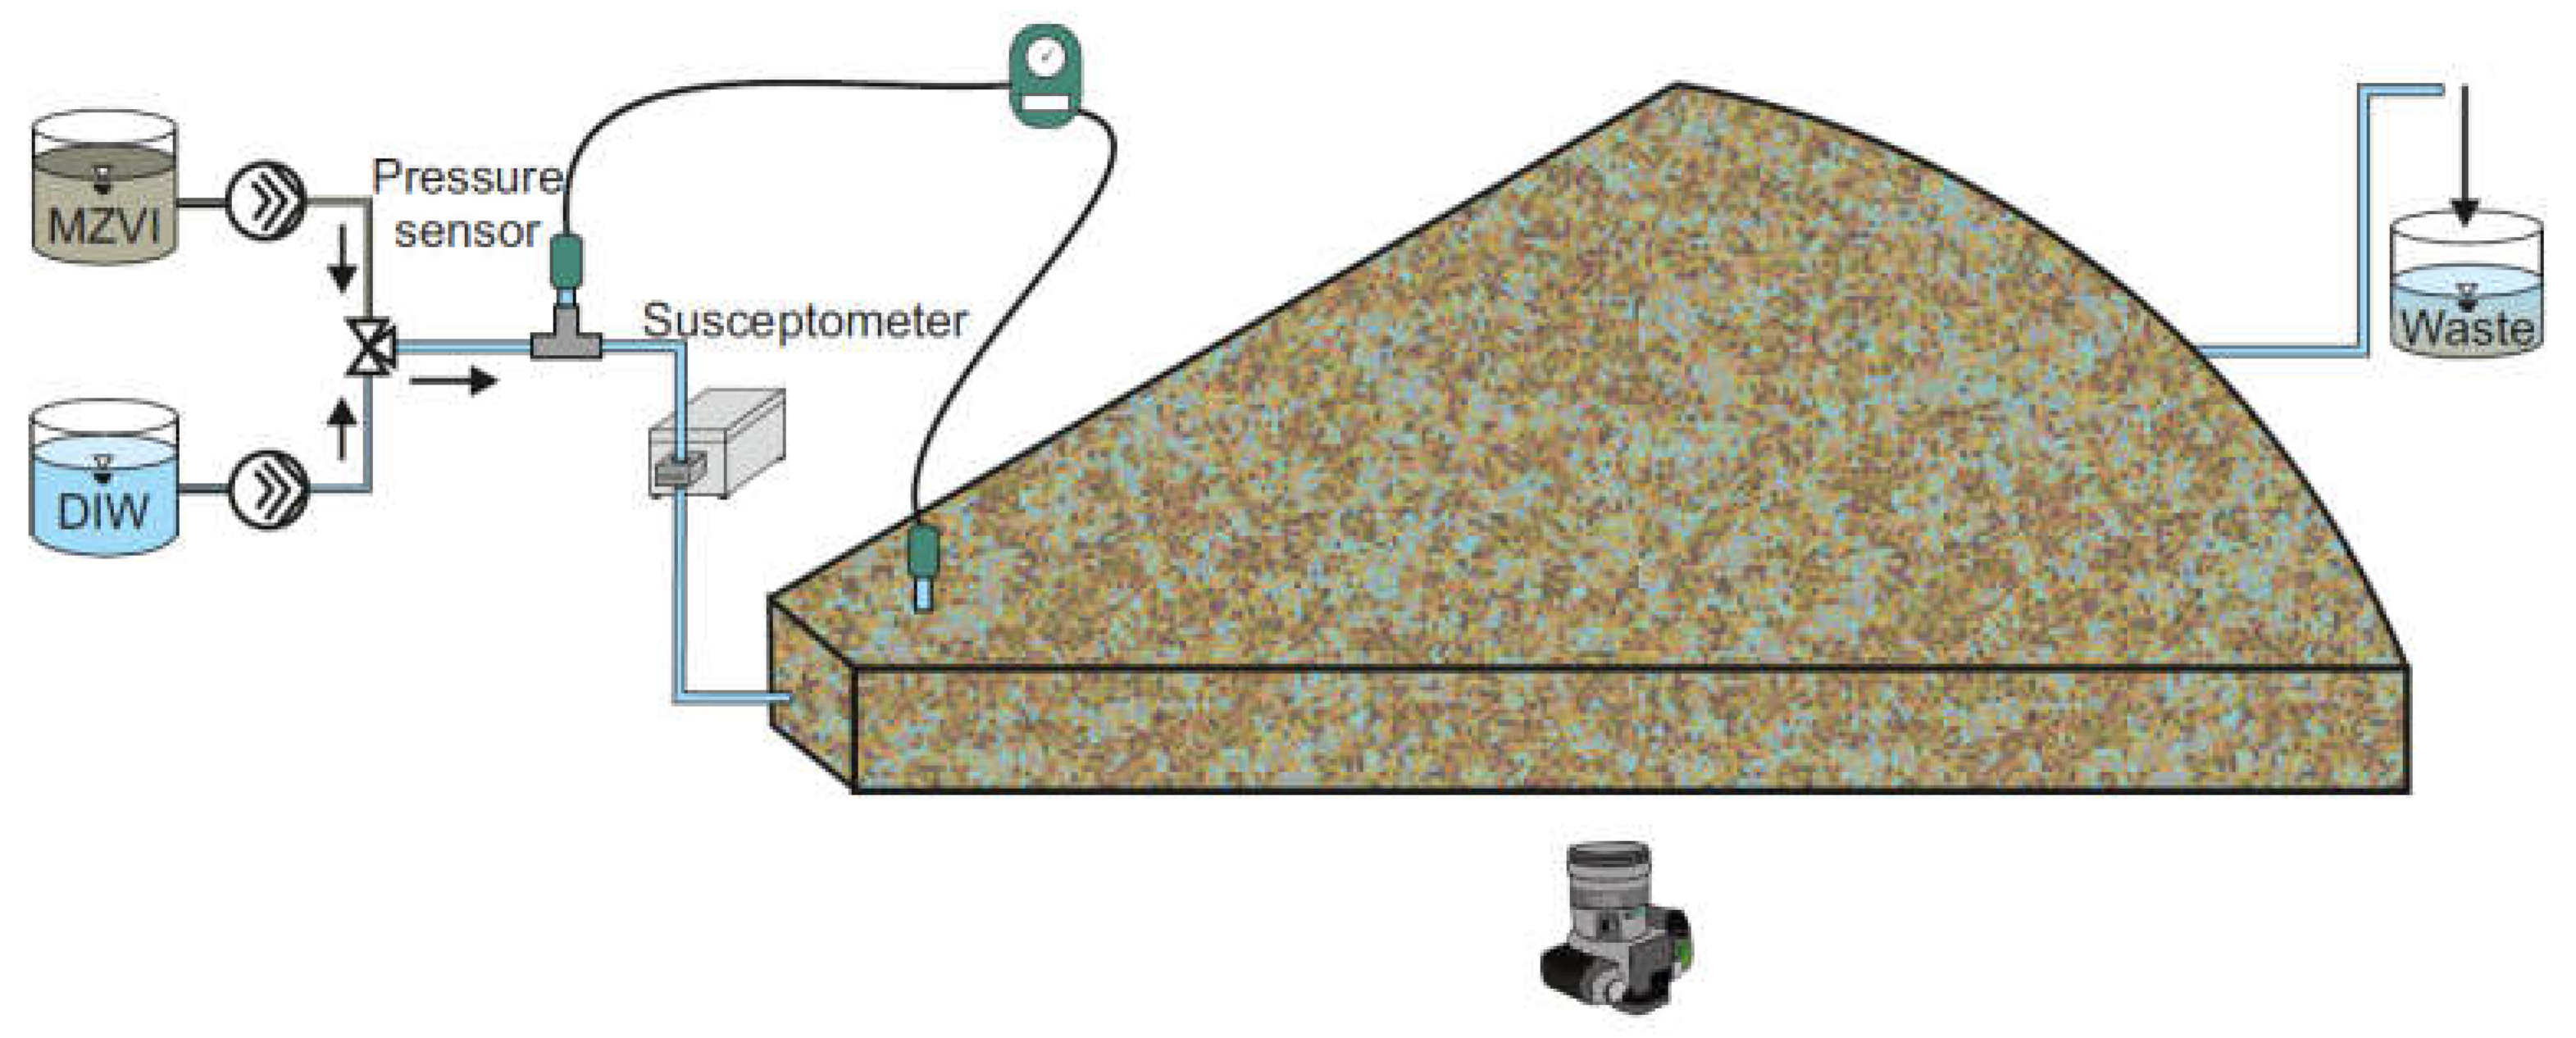
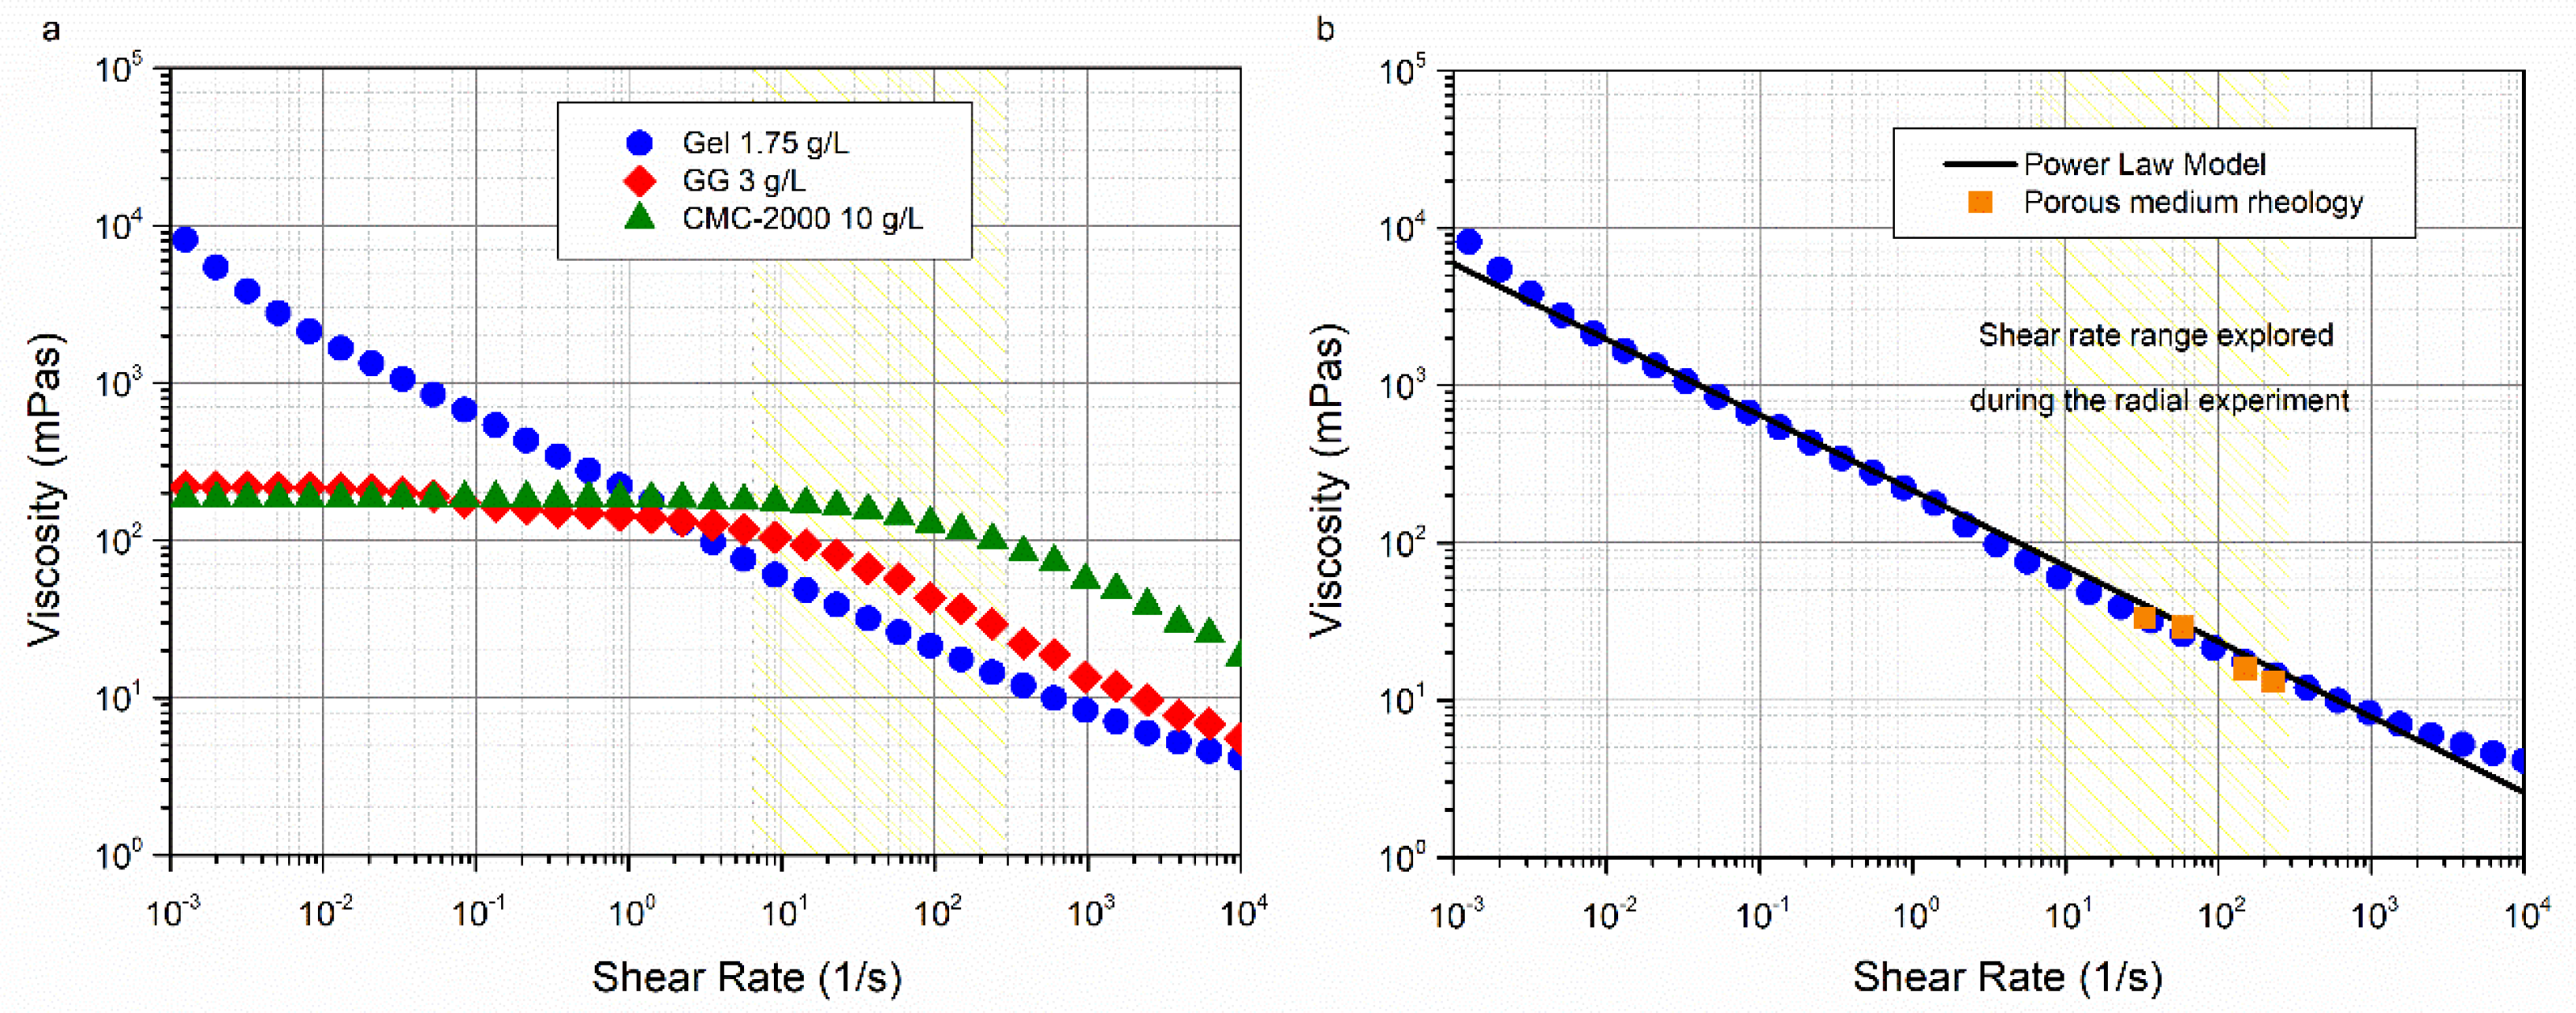
2.3. Bulk and Porous Medium Rheology

The rheological characterization is essential in order to predict the pressure drop increase along the column due to the injection of a shear-thinning fluid [29]. However, both the fluid rheological behavior in the bulk and in the porous medium need to be characterized since they may potentially be strongly different in the case of flow-through heterogeneous media. In this work, the bulk viscosity of the shear-thinning gel was measured in a shear rate range between 1 × 10⁻³ and 1 × 10⁴ s−1 by means of an Antoon Paar (Graz, Austria) rheometer (MCR302). The gel rheology inside the porous medium was instead characterized through the interpretation of 4 column transport tests (details about the tests are reported in the next section). The interpretation procedure, reported in Figure S1, provided one couple of shear rate and viscosity value for each column test. The graph representing these data represents the fluid rheogram in the porous medium.
The fluid rheology was modeled using the Ostwald de Waele power-law model [43] for shear-thinning fluids:
{ μ m ( γ m ˙ ) = k γ m ˙ ( n 1 ) γ m ˙ = α q K ε
where k and n are experimental coefficients to be determined from rheological measurements interpretation, ε is the porous medium effective porosity (-), and γ m ˙ is the shear rate experienced by the fluid when flowing inside the porous medium. α is the shift-factor accounting for the difference between the fluid rheogram in the bulk and in the porous medium. In particular, the shift factor α should be equal to 1 for an ideal porous medium (well-sorted rounded grains). Conversely, the more irregularly shaped and poorly sorted the media are, the more the shift factor is higher than one [29,30].

2.4. Column Transport Tests

1D transport tests were performed in a Plexiglas column with a 2.4 cm inner diameter, a fixed cap at the inlet, designed to withstand high injection pressures, and a screwed cap at the outlet. The column was wet-packed with the quartz sand under saturated flow conditions. The main properties of the bulk medium were: length 40 cm, average porosity ε 0 = 0.45 , bulk density 1.46 × 10 3 kg / m 3 , and specific surface area a 0 = 2.14 × 10 4   m 2 / m 3 . Plexiglas filters and 2 cm thick coarse sand pre-filters (nominal size 1.6–2.5 mm) were inserted at both extremities to homogenize the flow. An average dispersivity coefficient α x of 1.5 × 10 4 m was estimated through tracer tests.
The transport tests were performed at four different Darcy velocities, 2.6 × 10 4 , 4.3 × 10 4 , 1.2 × 10 3 , and 1.9 × 10 3   m / s (respectively named as q 1 ,   q 2 ,   q 3 , and q 4 ), each one corresponding to a different distance from the injection well according to Equation (2). The injection protocol consisted of two sequential steps:
  • Pre-conditioning the porous medium with 5 pore volumes (PVs) of deionized water;
  • Injecting 10 PVs of iron slurry.
The column was horizontally placed, and two different progressive cavity pumps were used to inject the deionized water and the iron slurry separately. Two pressure sensors (DELTA OHM, Padova, Italy), at the inlet and outlet of the column, were used to continuously measure the pressure drop along the column. As described in Tosco et al. [17], an indirect quantification of the iron concentration was obtained by measuring the iron magnetic susceptibility at the column inlet and outlet through two susceptibility sensors (Bartington Instruments Limited, Witney, UK). As a matter of fact, a linear correlation between the susceptibility measured by the sensors and the iron particle concentration was previously demonstrated [23]. Moreover, a third magnetic susceptibility sensor was located coaxially to the column, free to move along it, to record the profile of iron concentration (each 2 cm) at the end of the experiment.

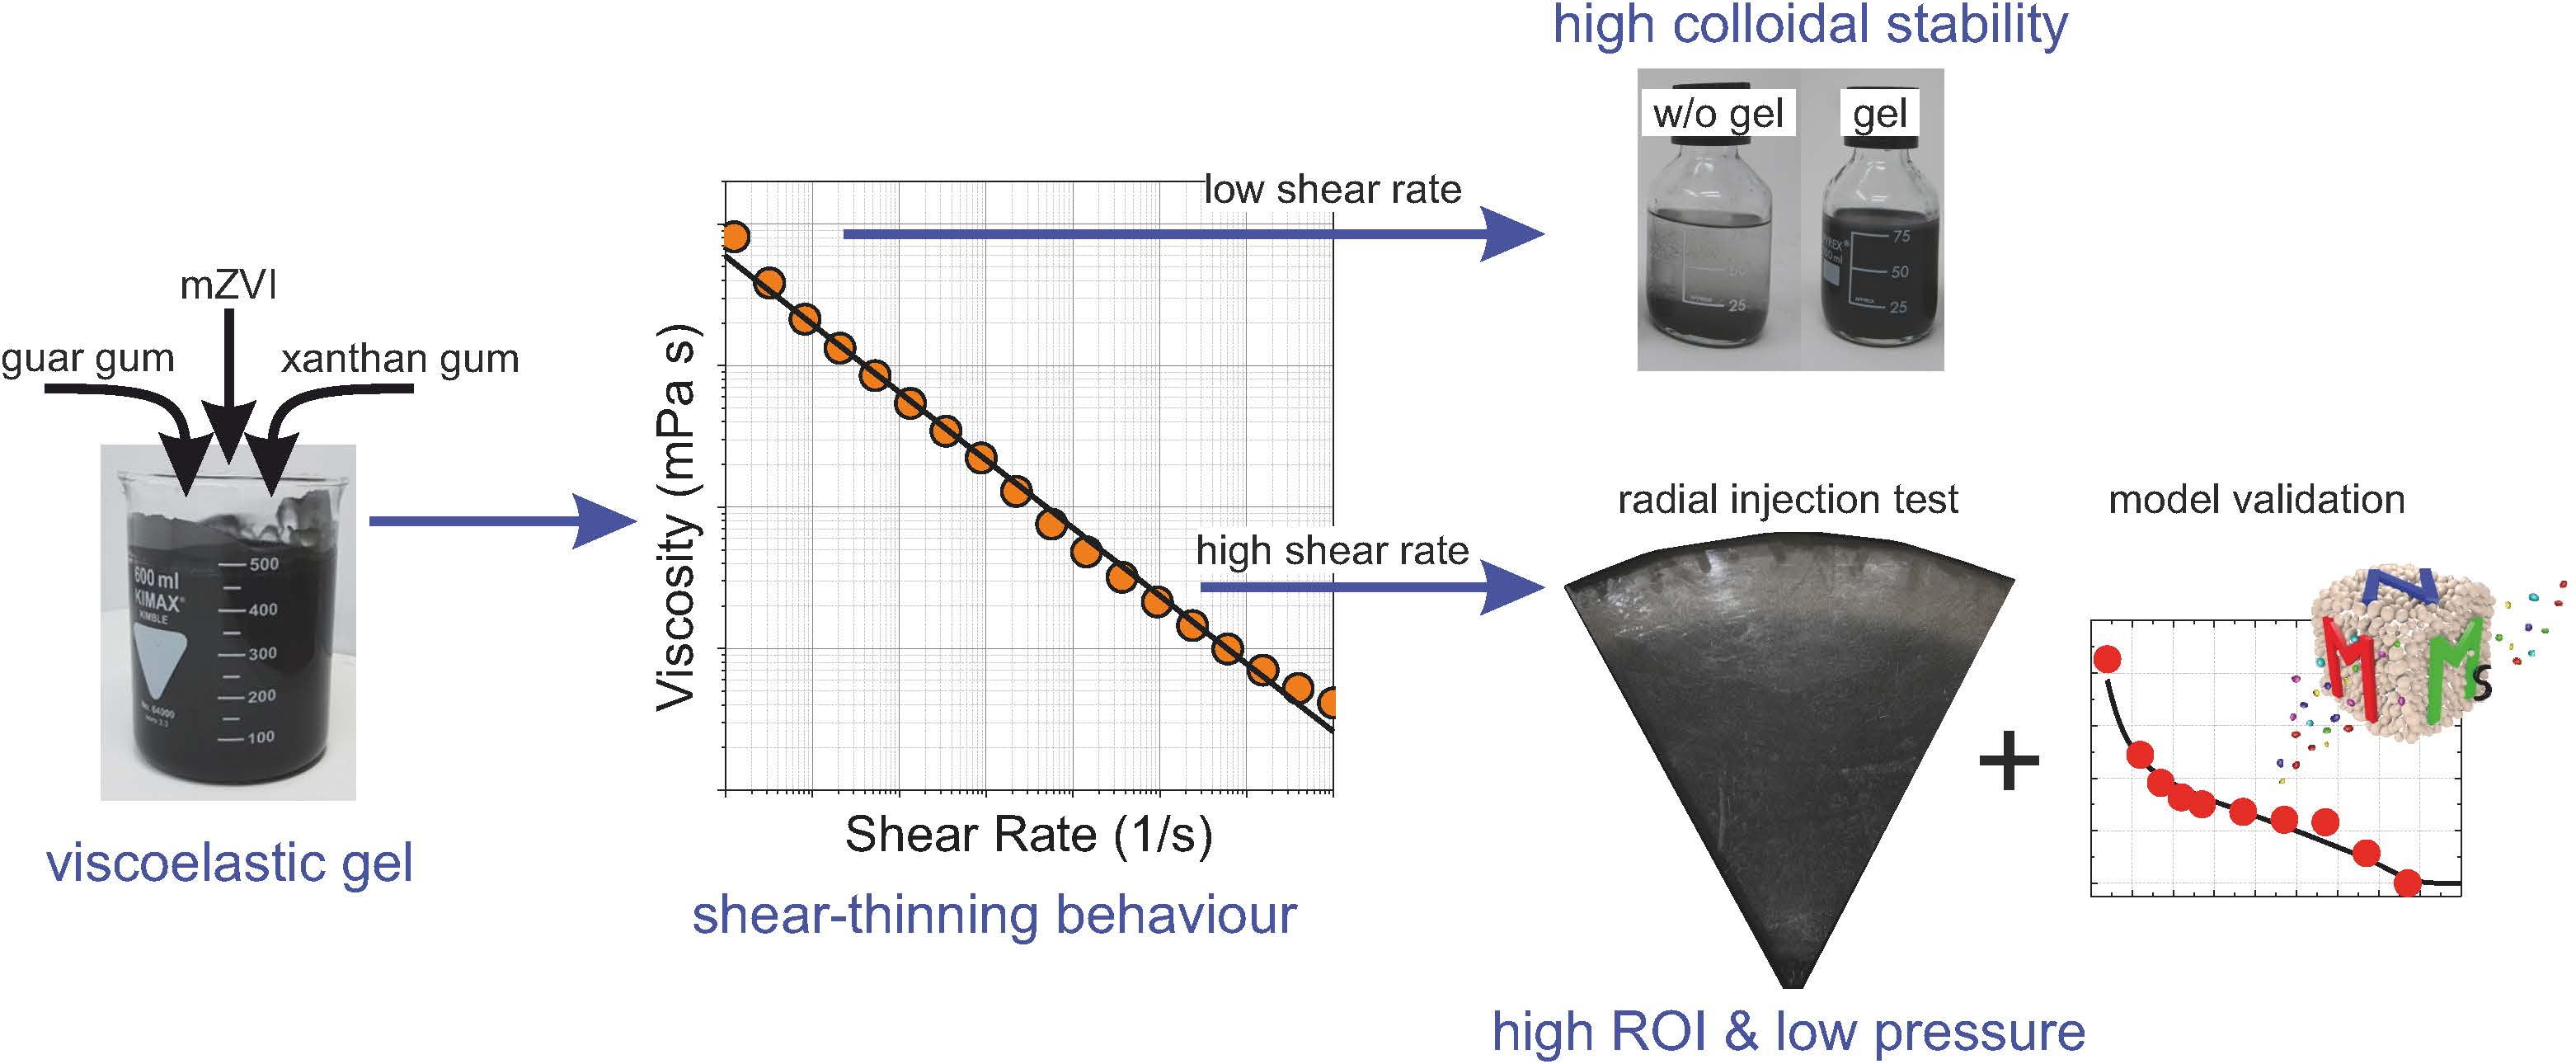
2.5. Radial Transport Test

The experimental setup for the radial transport test was composed of a 1/6-cylinder portion with a 90 cm radius and 4 cm depth (Figure 1). The model was made in Plexiglass—with 1 cm thick walls and steel inserts designed to resist high injection pressure, and was wet-packed with quartz sand, avoiding the presence of air and the formation of areas with different compaction. The fluids were injected inside the tank through a screened well—having a 4 cm inner diameter and 0.5 cm thick walls—placed at the vertex of the cylinder slice. As for the column transport tests, two progressive cavity pumps (Seepex, Bottrop, Germany) were used for water and iron suspension injection, ensuring a constant and non-pulsating flow rate up to a pressure of 24 bar. An injection flow rate of 7 L/h was applied during the test, corresponding to a discharge rate of 1 m 3 / h per screen well unit in full 3D geometry. At the end of the model, 17 extraction points were placed, with an angular spacing of 3.5°, to endure a uniform flow with radial symmetry. A constant hydraulic head of 1 m was imposed as the outlet boundary condition.
Coherently with column tests, the experimental protocol consisted of two sequential injection steps:
  • 2 PVs pre-conditioning with deionized water;
  • 0.8 PVs of iron slurry injection.
Two pressure sensors (DELTA OHM, Padova, Italy)—one immediately prior to the inlet and the other 7 cm downstream the injection well—were installed to measure the pressure variation in time due to the injection of a viscous fluid and the potential clogging of the porous medium. The inlet concentration of mZVI was continuously monitored through a susceptibility sensor with a time interval of 1 s (Figure 1). At the end of the test, the porous medium was dissected, and sand samples were collected along three different radial directions, 15° apart from each other. The iron content was again determined by magnetic susceptibility measurements. A high definition camera, placed below the model, recorded the experiment with an acquisition frequency of 2 photos per minute.

2.6. mZVI Transport Model in Radial Geometry

When fluids are injected through a screened well, the Darcy velocity decreases hyperbolically with increasing distance from the well according to the following Equation [17]:
q = Q 2 π r b
where Q is the discharge rate ( L 3 · T 1 ), b is the vertical length of the well screen (L), and r is the radial distance from the injection point (L). In the case of a homogeneous and isotropic porous medium, radial symmetry can be assumed, and the transport of mZVI particles upon injection can be modeled as a one-dimensional problem by the following modified advection-dispersion equation [13,44,45,46]:
{ ( ε C F e ) t + ( ρ b S F e , i ) t + 1 r r ( r q C F e ) 1 r r [ r ε D r C F e r ] = 0 ( ρ b S F e , 1 ) t = ε k a , 1 ( 1 S F e , 1 S m a x ) C F e ( ρ b S F e , 2 ) t = ε k a , 2 [ d 50 , s a n d + r d 50 , s a n d ] β s t r C F e
where C F e is the concentration of particles suspended in the liquid phase ( ML 3 ) , S F e , i is the concentration of particles deposited in the solid phase ( MM 1 ) , ρ b is the bulk density of the porous medium ( ML 3 ) , D r is the hydrodynamic dispersion coefficient ( L 2 T 1 ) ,   k a , 1 and k a , 2 are the particle attachment rate coefficient ( T 1 ) , S m a x and β s t r are experimental parameters for the specific interaction site, d 50 , s a n d is the median grain size of the porous medium, and r is the radial coordinate.
The source/sink term (second and third line in Equation (3)) takes into account the mass exchanges between the liquid and the solid phase due to physical and physicochemical mechanisms of particle retention onto the porous medium surface [19,47,48]. The different retention mechanisms can be expressed with several formulations, depending on the phenomena involved. In this paper, two concurrent interaction sites (i = 1, 2) for two different processes were considered:
  • First site expressing irreversible blocking dynamics: blocking is a physicochemical deposition mechanism that typically happens when particle-particle interactions are strongly repulsive. In this case, the already deposited particles prevent suspended ones from further attachment, and a porous medium saturation can be achieved. The particle deposition rate decreases with increasing S F e , i and goes to zero when the saturation concentration of deposited particles, S m a x , is reached [44,49,50].
  • Second site expressing irreversible straining dynamics: straining is a physical deposition mechanism due to colloid trapping into small pore throats. Straining is likely to occur when the ratio between the size of the colloid and the sand grain is greater than, or close to, 0.5% [51,52]. In this study, a d 50 , F e / d 50 , s a n d of 0.68% was found, suggesting that straining might be a relevant deposition mechanism in this system.
The attachment coefficients— k a , 1 and k a , 2 , reported in Equation (3), are strongly influenced by both the flow velocity [53] and the carrier fluid viscosity, which, in case of shear-thinning fluids, is, in turn, dependent on the velocity itself through the shear rate. To model the influence of these parameters on the particle attachment kinetics, the formulation proposed by Tosco et al. [17] was employed in this work [17,19]:
k a , i ( v , μ m ) = C a , i v d 50 , s a n d η 0 ( v , μ m )
where v is the effective velocity ( LT 1 ) , defined as the Darcy velocity divided by the effective porous medium porosity, and η 0 is the single collector contact efficiency, here calculated using the formulation given by Yao et al. [54]. An exponential function was instead used to model the dependency of the straining parameter β s t r on flow velocity:
β s t r ( v ) = ω e τ v
C a , i , ω , and τ are empirical coefficients that were determined from a column transport test data fitting, following the procedure reported in Bianco et al. [44]. Briefly: the least-squares method was employed to independently fit the experimental breakthrough curves and concentration profiles against the Equation S1 implemented in MNMs 2018 (Figure S2); for each test, performed at a constant flow velocity, a set of transport parameters ( k a , 1 , k a , 2 , and β s t r ) was found (Table S1); the trend of k a , 1 , k a , 2 , and β s t r as a function of velocity was fitted to Equations (4) and (5) to determine the empirical parameters for the velocity-dependent model (Figure S3). The blocking parameter S m a x was assumed constant for all the tests.
A modified Darcy’s law for shear-thinning fluids was used to model the pressure build-up due to the injection of the mZVI suspension [30]:
Δ P Δ R = μ m ( γ m ˙ ) K q
where Δ P is the pressure difference between two observation points ( M   L 1 T 2 ) , and Δ R is the radial distance between the two observation points ( L ) . In the presence of clogging phenomena, the permeability of the porous medium cannot be considered constant, but it decreases over time because of the progressive filtration of both undissolved polymeric microgels and mZVI particles. Results of gel filtration tests in sand columns (Figure S4) proved that the contribution of microgel filtration to the porous medium clogging could be neglected in the conditions explored in this work. As a consequence, a simplified version of the equations proposed by Tosco, Gastone, and Sethi [17] was used here to model the reduction of permeability due to porous medium clogging:
{ K = ( ε ε 0 ) 3 ( a 0 a ) 2 K 0 ε = ε 0 ρ b λ F e ρ F e S F e a = a 0 + θ a F e ρ b ρ F e S F e
where ε 0 is the clean bed porosity of the column, λ F e ( ) is an empirical coefficient representing the packing degree of the iron deposits, ρ F e is the density of the colloidal particles ( ML 3 ) , a 0 is the clean bed specific surface area of the matrix ( L 1 ) , a F e is the specific surface of the deposited particles ( L 1 ) , and θ   ( ) is an empirical coefficient representing the fraction of the deposed particles that contributes to the specific area increase. λ F e and θ were obtained from a global fitting of the pressure-drop data registered during the column experiments (Figure S2).
The transport parameters estimated from column experiments were then implemented in MNMs 2018 and used to predict, in forward mode, the expected mZVI distribution at the end of the radial experiment. A modified version of MNMs was used to include the straining process into the radial model. The main simulation parameters are summarized in Table 1. The predictive simulation results were validated against the experimental data obtained from the injection into the radial setup in terms of total iron concentration profile and pressure build-up, measured at a distance of 7 cm from the injection well. Finally, the simulation was repeated using the same transport parameters estimated by Tosco, Gastone, and Sethi [17] for the injection of mZVI particles stabilized with GG only at a concentration of 3 g/L. The concentration profiles obtained for mZVI particles stabilized with the shear-thinning gel and the GG were compared in terms of the radius of influence (ROI), defined as the radial distance where the total concentration of iron is equal or lower than a specific target. The target concentration was selected, considering the typical range of concentration applied in-field, that is, 5 g/L [17,20].

3. Results

3.1. Bulk and Porous Medium Rheology

Figure 2a shows the bulk rheogram obtained for the shear-thinning gel at 1.75 g/L, where the viscosity was reported as a function of the shear rate γ ˙ . Low values of shear rate ( 1 × 10 3 1 × 10 2 s 1 ) were representative of quasi-static conditions observed during the storage phase of the mZVI suspensions. High shear rate values ( 1 × 10 2 1 × 10 3 s 1 ) were instead typically reached during the injection step: as an example, the yellow rectangle in Figure 2 identifies the region of shear rates, and consequently, viscosities, explored during the mZVI injection experiment within the radial setup.
The gel showed a strong shear-thinning behavior, with a viscosity that decreased over all the shear rate range explored following a power-law model. In agreement with the results of Xue and Sethi [34], a very high viscosity value, of about 1 × 10 4 Pa∙s, was measured in quasi-static conditions, proving the high potentiality of the gel to stabilize the particles during their storage. However, the viscosity of the gel strongly decreased with increasing shear stress. Values lower than 10   mPa · s were reached for shear rates higher than 1000 s−1 that corresponded to the radial model region close to the injection well, where the highest velocities were observed. Such low viscosity values limited the pressure increase during the mZVI injection in the subsoil, reducing the risk of porous medium fracturing and the consequential generation of preferential flow paths. The experimental rheogram of the shear-thinning gel (dots) was fitted against the Ostwald de Waele power-law model (solid line) with a good agreement (Figure 2b). The parameters k and n, obtained from the experimental data fitting, were, respectively, 0.22 Pa∙sn and 0.52.
Figure 2a also reports the rheogram of a GG solution at a concentration of 3 g/L and of a CMC-2000 solution at 10 g/L. Similar to the GG-XG mixture, the single biopolymer water-based solutions showed a non-Newtonian shear-thinning behavior. However, the rheograms presented two Newtonian plateaux of high viscosity at low shear rates (quasi-static conditions) and low viscosity at high shear rates (dynamic conditions). At intermediate shear rates, the viscosity decreased following a power law. This rheological behavior could be described by the Cross model [22,55]. Compared to the gel, the single polymer solutions presented a less pronounced shear-thinning behavior, i.e., the viscosity of the single polymers was lower than the gel one in quasi-static conditions and higher in dynamic conditions.
The rheological properties of the gel in the porous medium were determined from the interpretation of the pressure drop curves registered during the mZVI column tests. A good agreement was observed between the gel rheology in bulk and in the porous medium (a shift factor equal to 1 was used to overlap the two curves in Figure 2b). Moreover, this result suggested that the presence of the mZVI particles did not have a significant influence on the global rheological behavior of the gel.

3.2. Column Transport Tests and Modeling

The breakthrough curves, the total iron concentration profiles, and the pressure build-up along the column measured during transport experiments performed at different injection flow rates are reported in Figure S1. In general, good mobility of the mZVI particles was observed for all the flow velocities explored in this study, thus confirming the capability of the shear-thinning gel to improve iron delivery. Experimental breakthrough and concentration profiles showed similar behavior for all the tests, both in terms of the curved shape and maximum particle concentration achieved at the column outlet (C/C0 > 0.8). In particular, the concentration data analysis suggested the presence of two concurrent retention mechanisms within the sandy bed: (1) the sigmoidal shape of the breakthrough curves indicates that the particle deposition rate is decreasing over time because of saturation phenomena typical of a blocking deposition mechanism [56,57]; (2) the hyper-exponential shape of the concentration profiles, associated with a maximum outlet concentration lower than C0, can be instead ascribed to irreversible straining kinetics [45,58]. The kinetic coefficients determined for each test through the inverse fitting of the concentration data are reported in Table S2. A constant value, equal to 0.0027 gFe/kgSand, was found for the blocking parameter S m a x , while a velocity-dependent behavior was observed for k a , 1 , k a , 2 , and β s t r . In Figure S3, the values of k a , 1 and k a , 2 in all the tests were reported as a function of v e d 50 , s a n d η 0 , while β s t r was plotted against the effective velocity v . A clear linear trend for the two attachment parameters was found, whereas an exponential correlation of β s t r with velocity was instead observed. The fitting of the kinetic coefficient trends against Equations (4) and (5) led to the estimation of the following empirical parameters: C a , 1 = 0.13   ( ) , C a , 2 = 0.23   ( ) , ω = 0.13 , τ = 364.84   s / m .
Pressure drop data, reported in Figure S1c, provided information about the fluid viscosity in dynamic conditions and the porous medium clogging over time. In particular, the steep pressure increase observed at the beginning of the particle injection (from time 0 to 1 PV) was due to the water displacement by the viscous gel. The second part of the curve, where the pressure differences increased with a smaller slope, was instead related to the permeability reduction induced by the clogging of the porous medium. Despite the use of a high viscosity gel to stabilize the mZVI particles, in this study, the pressure drop never overcame the value of 0.7 bar, not even in the test at the highest velocity. This result confirmed the marked shear-thinning behavior of the fluid, which made this gel suitable to be applied as an effective and efficient stabilizing agent during mZVI field injections. A satisfying fitting of the experimental pressure data was achieved using MNMs 2018 (Figure S1c). The clogging parameters were found to be constant in all the tests and equal, respectively, to λ F e = 0.45 and θ = 0.75 .

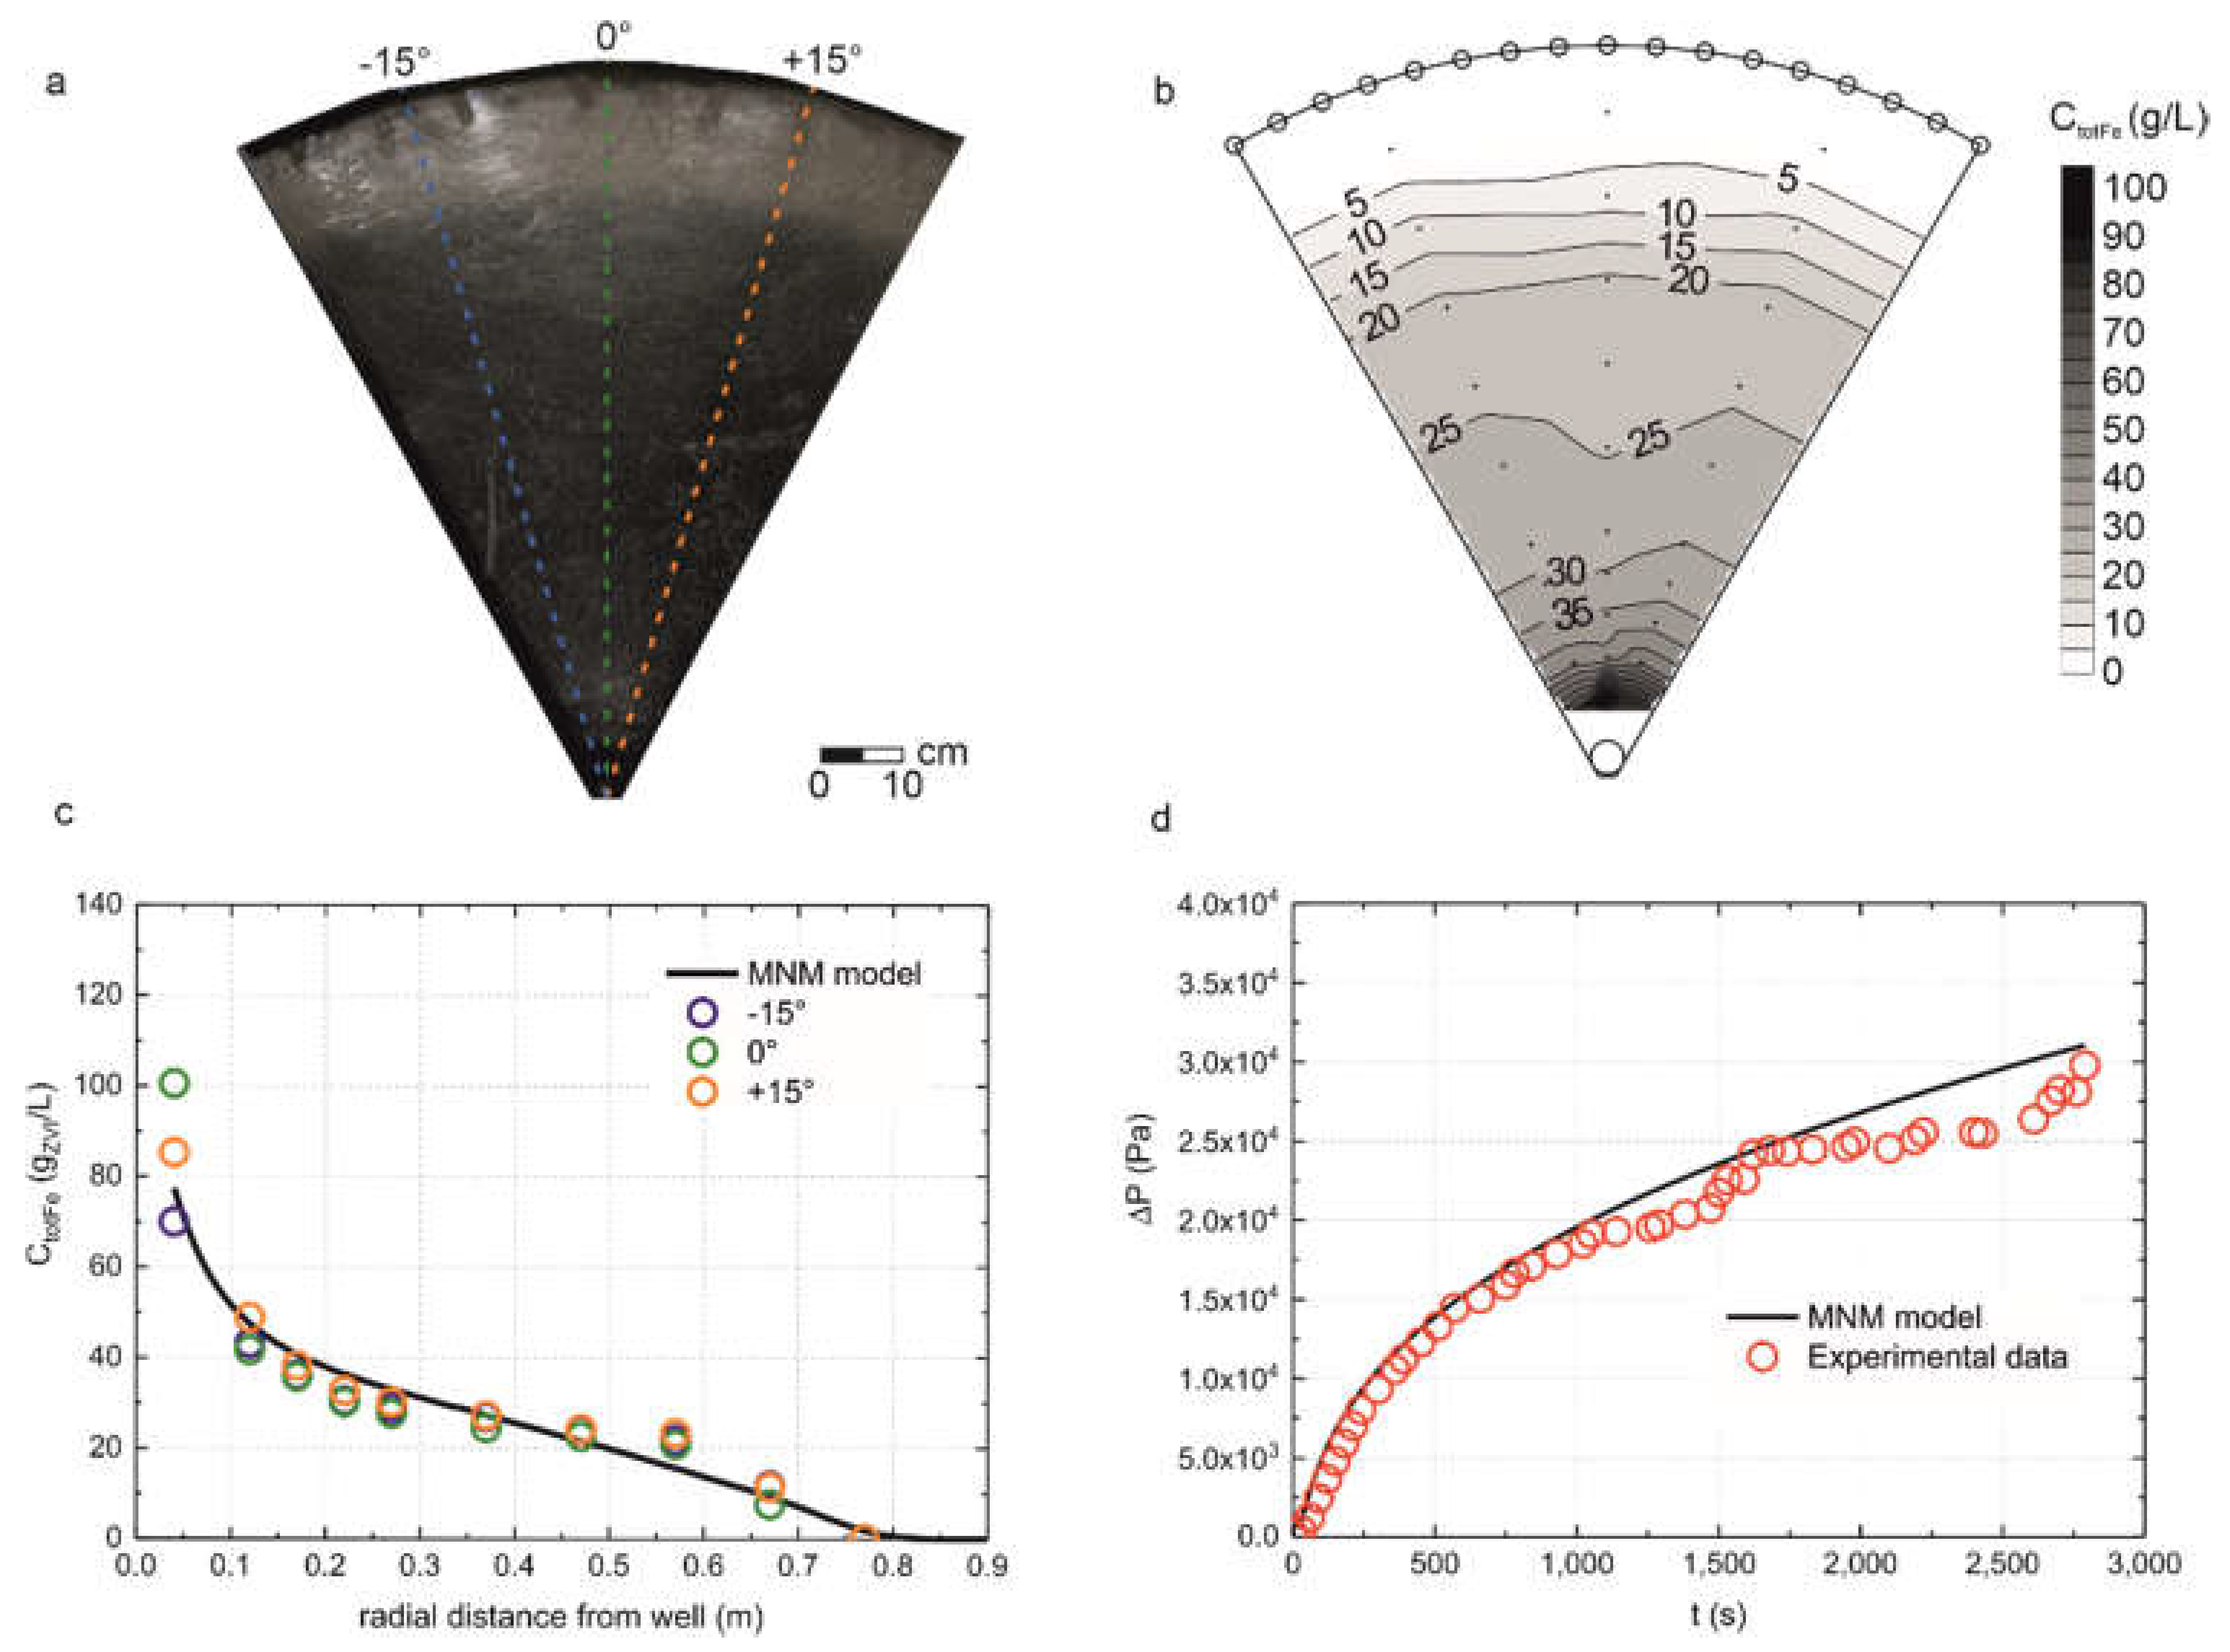
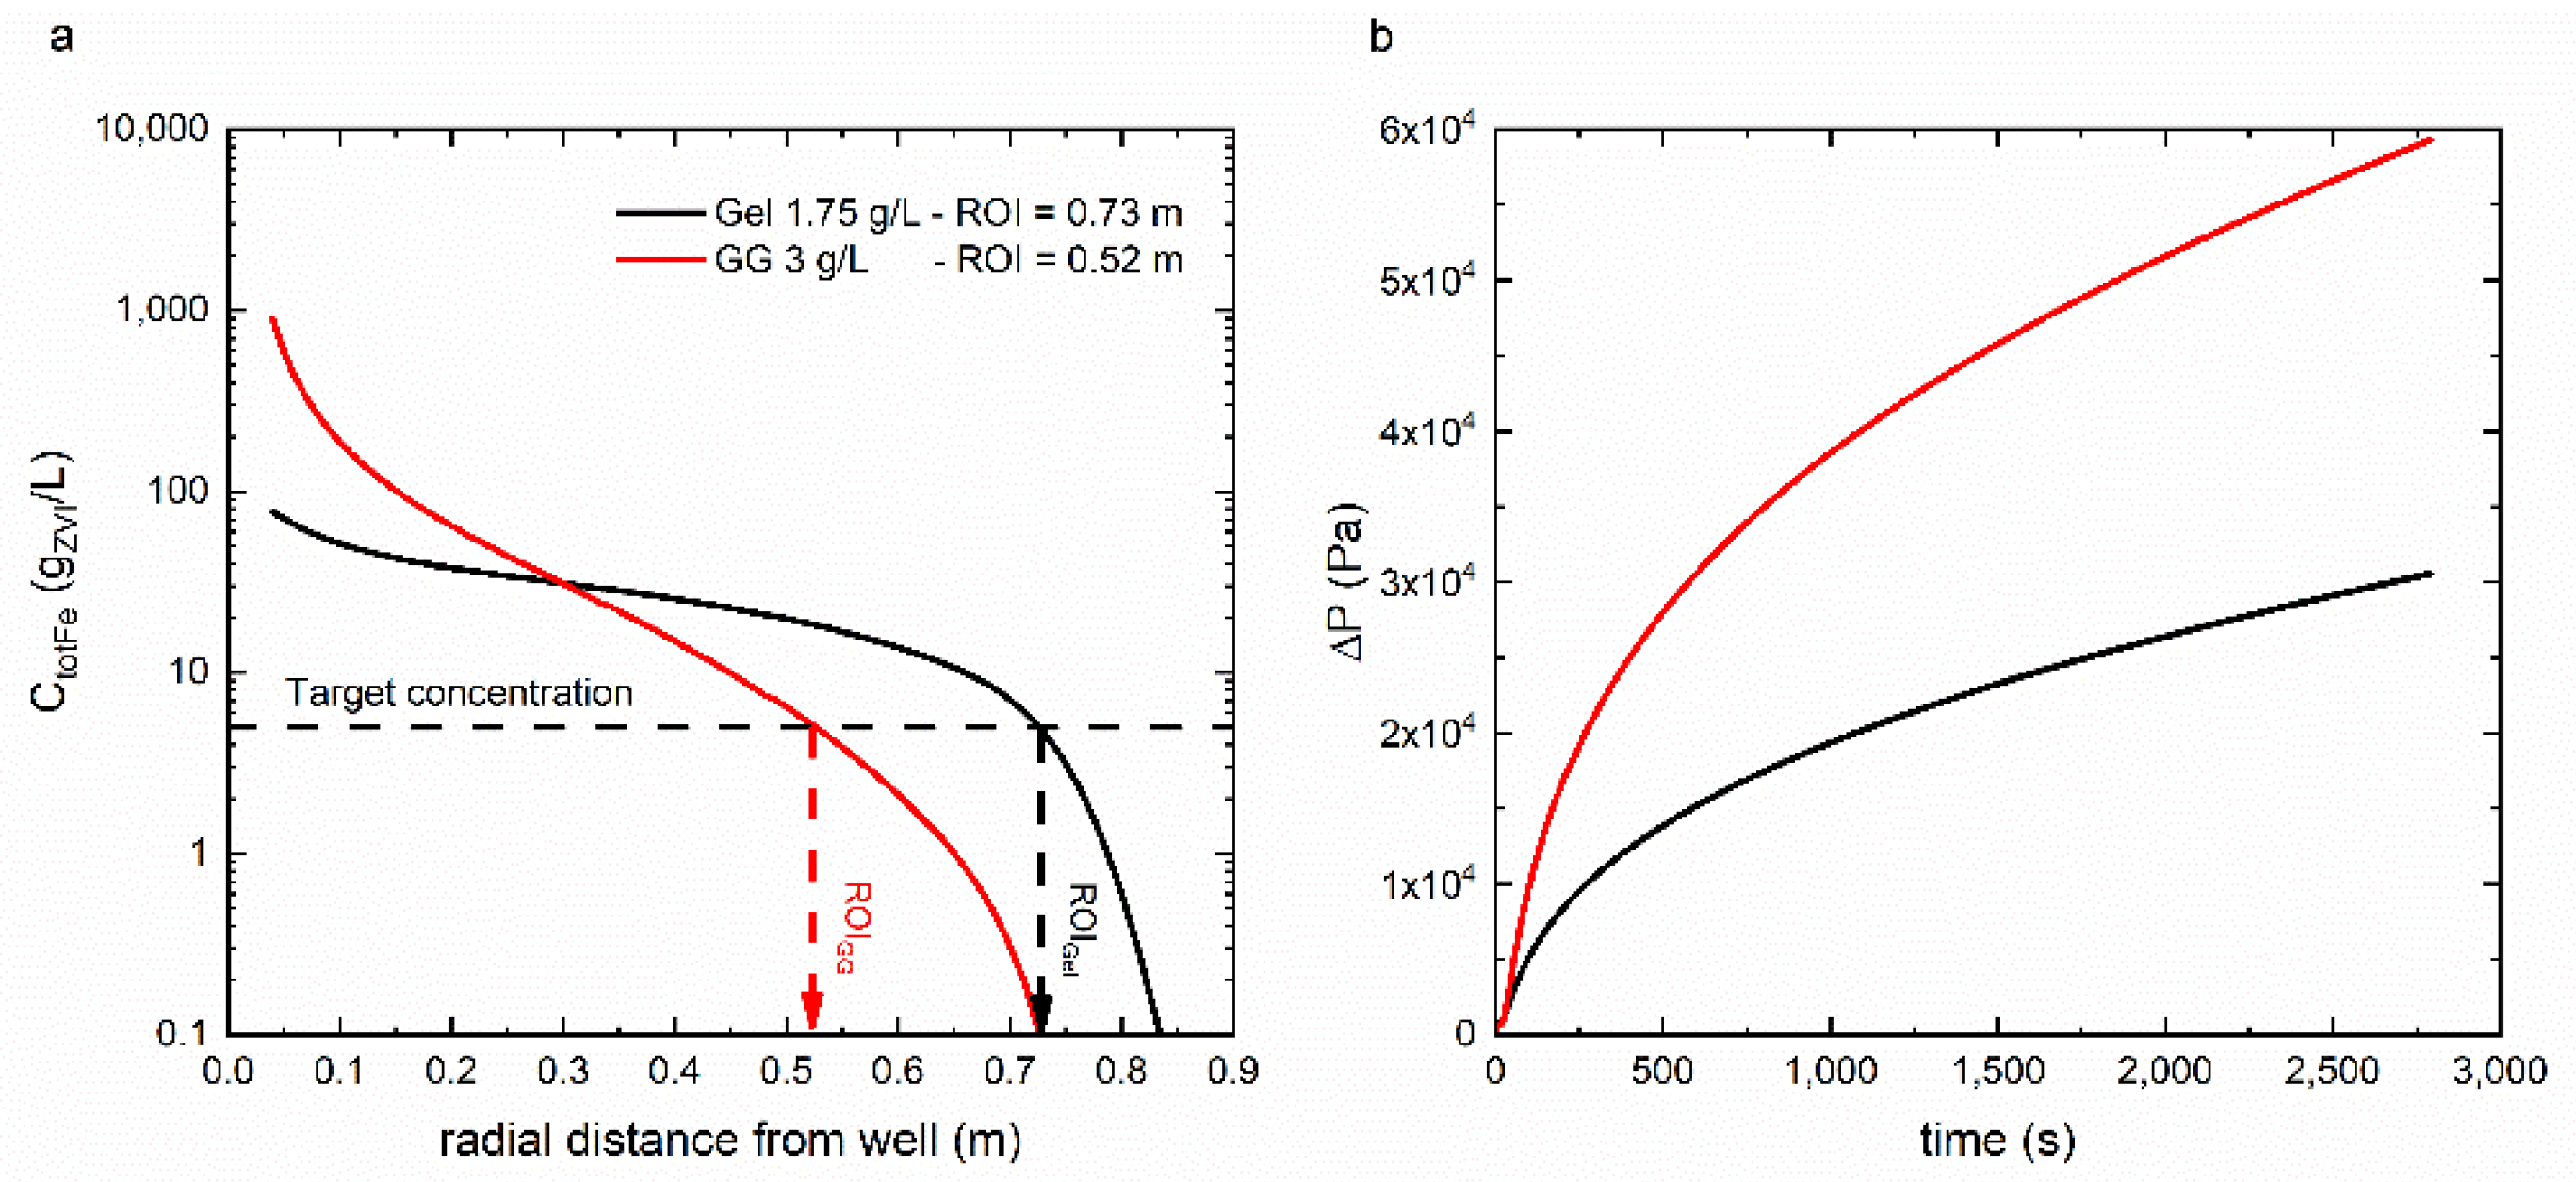
3.3. Radial Injection of mZVI Particles

Gel-stabilized mZVI particles were injected in the radial setup at a concentration of 20 g/L. Figure 3a reports a frame captured at the end of the test. It showed that the advancing front of the mZVI particles reached, at the end of the injection phase, a distance of 73 cm from the injection well. This distance was very close to the one estimated for a tracer injected in the same conditions (76 cm), thus confirming that optimal mobility of the iron particles was achieved even in this complex radial domain. The time-evolution observation of the injection phase into the radial model showed a fairly homogeneous advancement of the mZVI suspension with no instabilities of the front due to viscous fingering effects (see supporting information). This behavior resulted from the strong viscosity contrast between the polymeric gel and water. It is indeed confirmed by previous studies [59,60] that viscous fingering only occurs when a less viscous fluid (i.e., water) displaces a more viscous one (i.e., polymeric gel). Conversely, the stability of the advancing front was expected in the opposite case.
At the end of the test, the model was dissected, and the total concentration distribution (particles deposited onto the porous matrix plus particle suspended in the pore fluid) was detected through susceptibility measurements. The total iron concentration profiles along three different directions, reported in Figure 3c, presented very similar trends and highlighted that a uniform permeation of the mZVI slurry inside the model was achieved. The total iron concentration map of the radial model was obtained by triangulation with linear interpolation of the sample measurements (Figure 3b). The distribution of the mZVI particles within the domain showed higher iron concentration close to the injection well. The higher values of particle concentration observed near the injection point could be mainly ascribed to the low viscosity experienced by the pore fluid in this region (as a consequence of the high velocity induced by the radial flow), which resulted in a weaker stabilization of the particles; high deposition rates due to the occurrence of straining phenomena, leading to the generation of hyper-exponential concentration profiles [61].
Figure 3d shows the variation of pressure over time measured at an observation point located at a 7 cm distance from the injection well. Similar to what observed during column experiments, a relatively small pressure increase (<0.4 bar) was observed during the injection in consequence of the gel marked shear-thinning behavior and of the negligible permeability reduction due to the porous medium clogging.
Forward simulation of the radial experiment was then performed, assuming the transport mechanisms and the parameters derived from the 1D column transport tests’ interpretation. The results are reported in Figure 3 and were compared with experimental data in terms of the spatial distribution of total iron and pressure over time. The model reproduced with good accuracy the experimental data, both in terms of shape and magnitude. It was the first time that this procedure had been validated against radial injection data in such controlled conditions. It must be emphasized that no additional adjustments had been applied to the coefficients derived from column tests. The outcome proved that a simplified experimental-modeling approach, involving the execution of few column tests and the use of advanced numerical models, could be effectively applied to get a reliable prediction of the particle transport properties at larger scales. As a consequence, such an approach could be considered a reliable tool to support the design of field-scale applications.
The radial simulation of the gel-stabilized iron injection was finally compared with the results obtained in the same operating conditions for a suspension of mZVI particles stabilized with bare GG at 3 g/L. The kinetic coefficients for the GG-based slurry were derived from Tosco, Gastone, and Sethi [17]. The simulation results, reported in Figure 4, suggested that the gel composed of the GG-XG mixture, even if dosed at a lower biopolymer concentration (1.75 g/L), provided a better stabilization than the GG solution at 3 g/L. The iron concentration profiles were, in fact, more flattened in the gel case, thus indicating higher mobility of the particles and a more homogeneous iron distribution around the injection well. Conversely, the iron concentration profiles for the colloid dispersed in GG only were steeper, resulting in a greater accumulation of retained particles close to the injection well and a less homogeneous iron distribution into the radial domain. In agreement with that, a radius of influence of 0.73 m, for a target concentration of 5 g/L, was found for the gel-stabilized particles against a radius of only 0.52 m in the case of guar gum. Conversely, the model predicted a much higher overpressure for the injection of the GG slurry, as a consequence of the less pronounced shear-thinning behavior of this polymer in comparison with the gel. This outcome confirmed the conclusions presented by Xue & Sethi [34], claiming that GG with a small quantity of XG could considerably improve the stabilization properties of the biopolymer solution and, as a consequence, the mobility of the iron particles.

4. Conclusions

In this work, a polymeric gel, composed of guar gum and xanthan gum mixture, was studied as an environmentally friendly solution to optimize the subsurface delivery of mZVI particles for groundwater remediation purposes. This gel was characterized by a high viscosity in static and quasi-static conditions, even if diluted to concentrations as low as 1.75 g/L. Moreover, it presented a marked shear-thinning behavior, more pronounced than other polymers commonly used in nanoremediation applications, such as CMC or bare guar gum. The non-Newtonian behavior made this gel an optimal candidate for iron particle stabilization during storage and helped in preventing the pressure build-up at the injection well, thus reducing the probability of fracturing or creating preferential pathways in the aquifer. Also, the higher-than-water viscosity of the gel reduced the probability of viscous fingering phenomena, thus leading to a more homogeneous distribution of the iron within the aquifer system. An additional indirect advantage of the gel derived from its high biodegradability under natural or artificially-induced conditions. The polymer degradation promoted indeed the microbial growth within the aquifer, thus combining biotic and abiotic mechanisms for organic contaminant removal.
A radial experiment was performed to characterize the gel-stabilized particle delivery in conditions similar to real field-scale applications. The gel proved to be effective in enhancing the mobility of high concentrated mZVI suspensions (20 g/L). A 73 cm radius of influence was reached, and the injection overpressure remained lower than 0.4 bar during the whole experiment. Moreover, a homogeneous distribution of the iron inside the radial setup was observed, with no formation of preferential pathways.
An integrated experimental-modeling approach was finally applied to characterize the gel rheology and particle mobility in 1D geometry (column tests) and upscale the transport properties to field-like conditions, i.e., radial geometry. Based on the information derived from column test results, a radial simulation was performed using the MNMs 2018 software to predict the particle distribution and pressure build-up at the end of the injection into the radial experimental setup. Very good agreement was found between experimental and simulated results. This was an important step forward in the field of micro- and nanoremediation of contaminated aquifers: for the first time, this approach was validated against experimental data obtained from radial injections performed in very controlled conditions. This result corroborated the role of numerical models as useful tools for an efficient design of micro- and nanoremediation interventions. Such models could be used to obtain reliable estimations of important design parameters (e.g., ROI, injection pressures), to test hypotheses and explore different remediation scenarios.

Supplementary Materials

The following are available online at https://www.mdpi.com/2073-4441/12/3/826/s1, Figure S1: Pressure drop over time recorded for the column transport tests of mZVI particles at different discharge rates, Table S1: Shear rate and viscosities in the porous medium for different column tests, Figure S2: Breakthrough curves, iron concentration profiles and pressure drop along the column for mZVI transport tests, Table S2: Transport and clogging parameters from fitting of mZVI column transport tests, Figure S3: Trend of attachment coefficients derived from column test interpretation, Figure S4: Pressure drop along the column for the gel filtration test, Table S3: Model parameter implemented in the radial model, Table S4: Cross parameters of bulk viscosity curves, Figure S5: Experimental and modelled radial tracer test, Figure S6: Time evolution of mZVI injection in the radial setup.

Author Contributions

Investigation and Methodology: A.P., F.M., and A.G.; Formal analysis: A.P., F.M., and C.B.; Conceptualization, Supervision: C.B., R.S., and T.T.; Visualization and Writing-original draft: A.P., F.M., and C.B.; Writing-review and editing: C.B., R.S., T.T., A.d.F.D., and M.T. All authors have read and agreed to the published version of the manuscript.

Funding

This research was funded by Eni S.p.A., contract number 4310231662.

Acknowledgments

The authors gratefully acknowledge the valuable contributions of Sofia Credaro, who assisted in the proofreading and language editing of the manuscript.

Conflicts of Interest

The authors declare no conflict of interest.

References

  1. Tosco, T.; Papini, M.; Viggi, C.; Sethi, R. Nanoscale zerovalent iron particles for groundwater remediation: A review. J. Clean. Prod. 2014, 77, 10–21. [Google Scholar] [CrossRef]
  2. Zhao, X.; Liu, W.; Cai, Z.; Han, B.; Qian, T.; Zhao, D. An overview of preparation and applications of stabilized zero-valent iron nanoparticles for soil and groundwater remediation. Water Res. 2016, 100, 245–266. [Google Scholar] [CrossRef] [PubMed] [Green Version]
  3. Beryani, A.; Alavi Moghaddam, M.R.; Tosco, T.; Bianco, C.; Hosseini, S.M.; Kowsari, E.; Sethi, R. Key factors affecting graphene oxide transport in saturated porous media. Sci. Total Environ. 2020, 698, 134224. [Google Scholar] [CrossRef] [PubMed]
  4. Gallo, A.; Bianco, C.; Tosco, T.; Sethi, R. Zerovalent iron for the remediation of contaminated aquifers. Geoing. Ambient. E Min. 2018, 155, 5–16. [Google Scholar]
  5. Bianco, C.; Patiño Higuita, J.E.; Tosco, T.; Tiraferri, A.; Sethi, R. Controlled Deposition of Particles in Porous Media for Effective Aquifer Nanoremediation. Sci. Rep. 2017, 7, 12992. [Google Scholar] [CrossRef] [PubMed] [Green Version]
  6. Gillies, G.; Raj, R.; Kopinke, F.D.; Georgi, A. Suspension stability and mobility of Trap-Ox Fe-zeolites for in-situ nanoremediation. J. Colloid Interface Sci. 2017, 501, 311–320. [Google Scholar] [CrossRef] [PubMed]
  7. Li, X.-Q.; Elliott, D.W.; Zhang, W.-X. Zero-Valent Iron Nanoparticles for Abatement of Environmental Pollutants: Materials and Engineering Aspects. Crit. Rev. Solid State Mater. Sci. 2006, 31, 111–122. [Google Scholar] [CrossRef]
  8. Di Molfetta, A.; Sethi, R. Clamshell excavation of a permeable reactive barrier. Environ. Geol. 2006, 50, 361–369. [Google Scholar] [CrossRef]
  9. Crane, R.A.; Scott, T.B. Nanoscale zero-valent iron: Future prospects for an emerging water treatment technology. J. Hazard. Mater. 2012, 211–212, 112–125. [Google Scholar] [CrossRef]
  10. Wang, Q.; Qian, H.; Yang, Y.; Zhang, Z.; Naman, C.; Xu, X. Reduction of hexavalent chromium by carboxymethyl cellulose-stabilized zero-valent iron nanoparticles. J. Contam. Hydrol. 2010, 114, 35–42. [Google Scholar] [CrossRef]
  11. Gallo, A.; Bianco, C.; Tosco, T.; Tiraferri, A.; Sethi, R. Synthesis of eco-compatible bimetallic silver/iron nanoparticles for water remediation and reactivity assessment on bromophenol blue. J. Clean. Prod. 2019, 211, 1367–1374. [Google Scholar] [CrossRef]
  12. Tiraferri, A.; Saldarriaga Hernandez, L.A.; Bianco, C.; Tosco, T.; Sethi, R. Colloidal behavior of goethite nanoparticles modified with humic acid and implications for aquifer reclamation. J. Nanoparticle Res. 2017, 19, 107. [Google Scholar] [CrossRef]
  13. Sethi, R.; Di Molfetta, A. Groundwater Engineering: A Technical Approach to Hydrogeology, Contaminant Transport and Groundwater Remediation; Springer International Publishing: Cham, Switzerland, 2019. [Google Scholar]
  14. Mueller, N.C.; Braun, J.; Bruns, J.; Černík, M.; Rissing, P.; Rickerby, D.; Nowack, B. Application of nanoscale zero valent iron (NZVI) for groundwater remediation in Europe. Environ. Sci. Pollut. Res. 2012, 19, 550–558. [Google Scholar] [CrossRef] [PubMed] [Green Version]
  15. Su, C.; Puls, R.W.; Krug, T.A.; Watling, M.T.; O’Hara, S.K.; Quinn, J.W.; Ruiz, N.E. A two and half-year-performance evaluation of a field test on treatment of source zone tetrachloroethene and its chlorinated daughter products using emulsified zero valent iron nanoparticles. Water Res. 2012, 46, 5071–5084. [Google Scholar] [CrossRef] [PubMed]
  16. Velimirovic, M.; Tosco, T.; Uyttebroek, M.; Luna, M.; Gastone, F.; De Boer, C.; Klaas, N.; Sapion, H.; Eisenmann, H.; Larsson, P.-O.; et al. Field assessment of guar gum stabilized microscale zerovalent iron particles for in-situ remediation of 1,1,1-trichloroethane. J. Contam. Hydrol. 2014, 164, 88–99. [Google Scholar] [CrossRef] [Green Version]
  17. Tosco, T.; Gastone, F.; Sethi, R. Guar gum solutions for improved delivery of iron particles in porous media (Part 2): Iron transport tests and modeling in radial geometry. J. Contam. Hydrol. 2014, 166, 34–51. [Google Scholar] [CrossRef] [Green Version]
  18. Christiansen, C.M.; Damgaard, I.; Broholm, M.; Kessler, T.; Klint, K.E.; Nilsson, B.; Bjerg, P.L. Comparison of Delivery Methods for Enhanced In Situ Remediation in Clay Till. Groundw. Monit. Remediat. 2010, 30, 107–122. [Google Scholar] [CrossRef]
  19. Litter, M. Iron Nanomaterials for Water and Soil Treatment; Jenny Stanford Publishing: Singapore, 2018. [Google Scholar]
  20. O’Carroll, D.; Sleep, B.; Krol, M.; Boparai, H.; Kocur, C. Nanoscale zero valent iron and bimetallic particles for contaminated site remediation. Adv. Water Resour. 2013, 51, 104–122. [Google Scholar] [CrossRef]
  21. Tiraferri, A.; Chen, K.L.; Sethi, R.; Elimelech, M. Reduced aggregation and sedimentation of zero-valent iron nanoparticles in the presence of guar gum. J. Colloid Interface Sci. 2008, 324, 71–79. [Google Scholar] [CrossRef]
  22. Gastone, F.; Tosco, T.; Sethi, R. Green stabilization of microscale iron particles using guar gum: Bulk rheology, sedimentation rate and enzymatic degradation. J. Colloid Interface Sci. 2014, 421, 33–43. [Google Scholar] [CrossRef] [Green Version]
  23. Dalla Vecchia, E.; Luna, M.; Sethi, R. Transport in Porous Media of Highly Concentrated Iron Micro- and Nanoparticles in the Presence of Xanthan Gum. Environ. Sci. Technol. 2009, 43, 8942–8947. [Google Scholar] [CrossRef] [PubMed]
  24. Cohen, M.; Yakirevich, A.; Weisbrod, N. The Role of Stabilizer Concentration in the Mobility of Carbon-Supported Nanozerovalent Iron (nZVI) in Fractured Media. Water Resour. Res. 2019, 55, 8164–8177. [Google Scholar] [CrossRef]
  25. Cohen, M.; Weisbrod, N. Field Scale Mobility and Transport Manipulation of Carbon-Supported Nanoscale Zerovalent Iron in Fractured Media. Environ. Sci Technol 2018, 52, 7849–7858. [Google Scholar] [CrossRef] [PubMed]
  26. Thombare, N.; Jha, U.; Mishra, S.; Siddiqui, M.Z. Guar gum as a promising starting material for diverse applications: A review. Int. J. Biol. Macromol. 2016, 88, 361–372. [Google Scholar] [CrossRef] [PubMed]
  27. Xue, W.; Huang, D.; Zeng, G.; Wan, J.; Cheng, M.; Zhang, C.; Hu, C.; Li, J. Performance and toxicity assessment of nanoscale zero valent iron particles in the remediation of contaminated soil: A review. Chemosphere 2018, 210, 1145–1156. [Google Scholar] [CrossRef] [PubMed]
  28. Velimirovic, M.; Simons, Q.; Bastiaens, L. Guar gum coupled microscale ZVI for in situ treatment of CAHs: Continuous-flow column study. J. Hazard. Mater. 2014, 265, 20–29. [Google Scholar] [CrossRef] [PubMed]
  29. Gastone, F.; Tosco, T.; Sethi, R. Guar gum solutions for improved delivery of iron particles in porous media (Part 1): Porous medium rheology and guar gum-induced clogging. J. Contam. Hydrol. 2014, 166, 23–33. [Google Scholar] [CrossRef] [Green Version]
  30. Tosco, T.; Marchisio, D.; Lince, F.; Sethi, R. Extension of the Darcy-Forchheimer Law for Shear-Thinning Fluids and Validation via Pore-Scale Flow Simulations. Transp. Porous Media 2013, 96, 1–20. [Google Scholar] [CrossRef]
  31. Truex, M.J.; Vermeul, V.R.; Mendoza, D.P.; Fritz, B.G.; Mackley, R.D.; Oostrom, M.; Wietsma, T.W.; Macbeth, T.W. Injection of Zero-Valent Iron into an Unconfined Aquifer Using Shear-Thinning Fluids. Groundw. Monit. Remediat. 2011, 31, 50–58. [Google Scholar] [CrossRef]
  32. Zhong, L.; Szecsody, J.; Oostrom, M.; Truex, M.; Shen, X.; Li, X. Enhanced remedial amendment delivery to subsurface using shear thinning fluid and aqueous foam. J. Hazard. Mater. 2011, 191, 249–257. [Google Scholar] [CrossRef]
  33. Luna, M.; Gastone, F.; Tosco, T.; Sethi, R.; Velimirovic, M.; Gemoets, J.; Muyshondt, R.; Sapion, H.; Klaas, N.; Bastiaens, L. Pressure-controlled injection of guar gum stabilized microscale zerovalent iron for groundwater remediation. J. Contam. Hydrol. 2015, 181, 46–58. [Google Scholar] [CrossRef] [PubMed]
  34. Xue, D.; Sethi, R. Viscoelastic gels of guar and xanthan gum mixtures provide long-term stabilization of iron micro- and nanoparticles. J. Nanoparticle Res. 2012, 14, 1239. [Google Scholar] [CrossRef] [Green Version]
  35. Longo, S.; Di Federico, V.; Chiapponi, L.; Archetti, R. Experimental verification of power-law non-Newtonian axisymmetric porous gravity currents. J. Fluid Mech. 2013, 731, 1–12. [Google Scholar] [CrossRef] [Green Version]
  36. Ciriello, V.; Di Federico, V. Similarity solutions for flow of non-Newtonian fluids in porous media revisited under parameter uncertainty. Adv. Water Resour. 2012, 43, 38–51. [Google Scholar] [CrossRef]
  37. Wexler, J.S.; Trinh, P.H.; Berthet, H.; Quennouz, N.; Du Roure, O.; Huppert, H.E.; Linder, A.; Stone, H.A. Bending of elastic fibres in viscous flows: The influence of confinement. J. Fluid Mech. 2013, 720, 517–544. [Google Scholar] [CrossRef] [Green Version]
  38. Tatti, F.; Papini, M.P.; Sappa, G.; Raboni, M.; Arjmand, F.; Viotti, P. Contaminant back-diffusion from low-permeability layers as affected by groundwater velocity: A laboratory investigation by box model and image analysis. Sci. Total Environ. 2018, 622–623, 164–171. [Google Scholar] [CrossRef] [PubMed]
  39. Luciano, A.; Mancini, G.; Torretta, V.; Viotti, P. An empirical model for the evaluation of the dissolution rate from a DNAPL-contaminated area. Environ. Sci. Pollut. Res. 2018, 25, 33992–34004. [Google Scholar] [CrossRef]
  40. Chao, H.-C.; Rajaram, H.; Illangasekare, T. Intermediate-scale experiments and numerical simulations of transport under radial flow in a two-dimensional heterogeneous porous medium. Water Resour. Res. 2000, 36, 2869–2884. [Google Scholar] [CrossRef]
  41. Kobus, H.; Koschitzky, H.-P. Role of Controlled Experiments for Research on Groundwater Contamination and Remediation. In Proceedings of the Groundwater Quality: Remediation and Protection Conference, Prague, Czech Republic, 15–18 May 1995; pp. 431–438. [Google Scholar]
  42. Chaudemanche, C.; Budtova, T. Mixtures of pregelatinised maize starch and κ-carrageenan: Compatibility, rheology and gelation. Carbohydr. Polym. 2008, 72, 579–589. [Google Scholar] [CrossRef]
  43. Lindner, A.; Bonn, D.; Meunier, J. Viscous Fingering in a Shear-Thinning Fluid. Phys. Fluids 2000, 12, 256–261. [Google Scholar] [CrossRef]
  44. Bianco, C.; Tosco, T.; Sethi, R. A 3-dimensional micro- and nanoparticle transport and filtration model (MNM3D) applied to the migration of carbon-based nanomaterials in porous media. J. Contam. Hydrol. 2016, 193, 10–20. [Google Scholar] [CrossRef] [PubMed] [Green Version]
  45. Tosco, T.; Sethi, R. Transport of Non-Newtonian Suspensions of Highly Concentrated Micro- And Nanoscale Iron Particles in Porous Media: A Modeling Approach. Environ. Sci. Technol. 2010, 44, 9062–9068. [Google Scholar] [CrossRef] [PubMed] [Green Version]
  46. Dentz, M.; Icardi, M.; Hidalgo, J.J. Mechanisms of dispersion in a porous medium. J. Fluid Mech. 2018, 841, 851–882. [Google Scholar] [CrossRef] [Green Version]
  47. Katzourakis, V.E.; Chrysikopoulos, C.V. Modeling dense-colloid and virus cotransport in three-dimensional porous media. J. Contam. Hydrol. 2015, 181, 102–113. [Google Scholar] [CrossRef]
  48. Chrysikopoulos, C.V.; Syngouna, V.I.; Vasiliadou, I.A.; Katzourakis, V.E. Transport of Pseudomonas putida in a 3-D Bench Scale Experimental Aquifer. Transp. Porous Media 2012, 94, 617–642. [Google Scholar] [CrossRef]
  49. Kretzschmar, R.; Borkovec, M.; Grolimund, D.; Elimelech, M. Mobile subsurface colloids and their role in contaminant transport. Adv. Agron. 1999, 66, 121–193. [Google Scholar] [CrossRef]
  50. Katzourakis, V.E.; Chrysikopoulos, C.V. Mathematical modeling of colloid and virus cotransport in porous media: Application to experimental data. Adv. Water Resour. 2014, 68, 62–73. [Google Scholar] [CrossRef]
  51. Bradford, S.; Bettahar, M.; Simunek, J.; van Genuchten, M. Straining and attachment of colloids in physically heterogeneous porous media. Vadose Zone J. 2004, 3, 384–394. [Google Scholar] [CrossRef]
  52. Bradford, S.; Simunek, J.; Bettahar, M.; Van Genuchten, M.; Yates, S. Modeling colloid attachment, straining, and exclusion in saturated porous media. Environ. Sci. Technol. 2003, 37, 2242–2250. [Google Scholar] [CrossRef]
  53. Boccardo, G.; Crevacore, E.; Sethi, R.; Icardi, M. A robust upscaling of the effective particle deposition rate in porous media. J. Contam. Hydrol. 2018, 212, 3–13. [Google Scholar] [CrossRef] [Green Version]
  54. Yao, K.-M.; Habibian, M.T.; O’Melia, C.R. Water and waste water filtration. Concepts and applications. Environ. Sci. Technol. 1971, 5, 1105–1112. [Google Scholar] [CrossRef]
  55. Cross, M.M. Rheology of non-Newtonian fluids: A new flow equation for pseudoplastic systems. J. Colloid Sci. 1965, 20, 417–437. [Google Scholar] [CrossRef]
  56. Ko, C.; Elimelech, M. The “shadow effect” in colloid transport and deposition dynamics in granular porous media: Measurements and mechanisms. Environ. Sci. Technol. 2000, 34, 3681–3689. [Google Scholar] [CrossRef]
  57. Johnson, P.; Elimelech, M. Dynamics of colloid deposition in porous-media-blocking based on random sequential adsorption. Langmuir 1995, 11, 801–812. [Google Scholar] [CrossRef]
  58. Bradford, S.; Yates, S.; Bettahar, M.; Simunek, J. Physical factors affecting the transport and fate of colloids in saturated porous media. Water Resour. Res. 2002, 38, 63-1–63-12. [Google Scholar] [CrossRef] [Green Version]
  59. Homsy, G.M. Viscous Fingering in Porous Media. Annu. Rev. Fluid Mech. 1987, 19, 271–311. [Google Scholar] [CrossRef]
  60. Obernauer, S.; Temprano, N.; Chertcoff, R.; D’Onofrio, A.G.; Gabbanelli, S.; Rosen, M. Miscible Displacement of Polymers in Porous Medi. In Proceedings of the SPE Latin America/Caribbean Petroleum Engineering Conference, Buenos Aires, Argentina, 27–29 April 1994; p. 16. [Google Scholar]
  61. Bradford, S.A.; Torkzaban, S.; Walker, S.L. Coupling of physical and chemical mechanisms of colloid straining in saturated porous media. Water Res. 2007, 41, 3012–3024. [Google Scholar] [CrossRef]
Figure 1. Experimental radial setup for iron transport tests.
Water 12 00826 g001
Figure 2. Rheological curves of CMC-2000 at 10 g/L, GG at 3 g/L and GG:XG at 1.75 g/L solutions (a), bulk and porous medium rheograms of the XG:GG mixture at 1.75 g/L (b): experimental data (point values) and model (solid line). CMC, carboxymethyl cellulose; GG, guar gum; XG, xanthan gum.
Water 12 00826 g002
Figure 3. (a) frame captured at the end of the test, (b) the total iron concentration map of the radial model, (c) total iron concentration profiles along the three different directions, and (d) the variation of pressure over time measured at 7 cm from the injection well: experimental data (point values) and model (black line).
Water 12 00826 g003
Figure 4. Simulation results for microscale iron (mZVI) particles stabilized through the gel and mZVI particles dispersed in GG only: (a) total iron concentration profiles, (b) the variation of pressure over time measured at 7 cm from the injection well.
Water 12 00826 g004
Table 1. Model parameters for the simulation in the radial domain.
Gel Concentration (g/L)mZVI Conc. (g/L)Well Radius (m) Discharge   Rate   ( m 3 / h ) Injection Duration (min)Simulation Radius (m)Cell NumberInlet Boundary Condition
1.75200.021460.93003rd Type-Robin

