Streamflow Decline in the Yellow River along with Socioeconomic Development: Past and Future

 , ,
, ,
Abstract
:1. Introduction
2. Materials and Methods
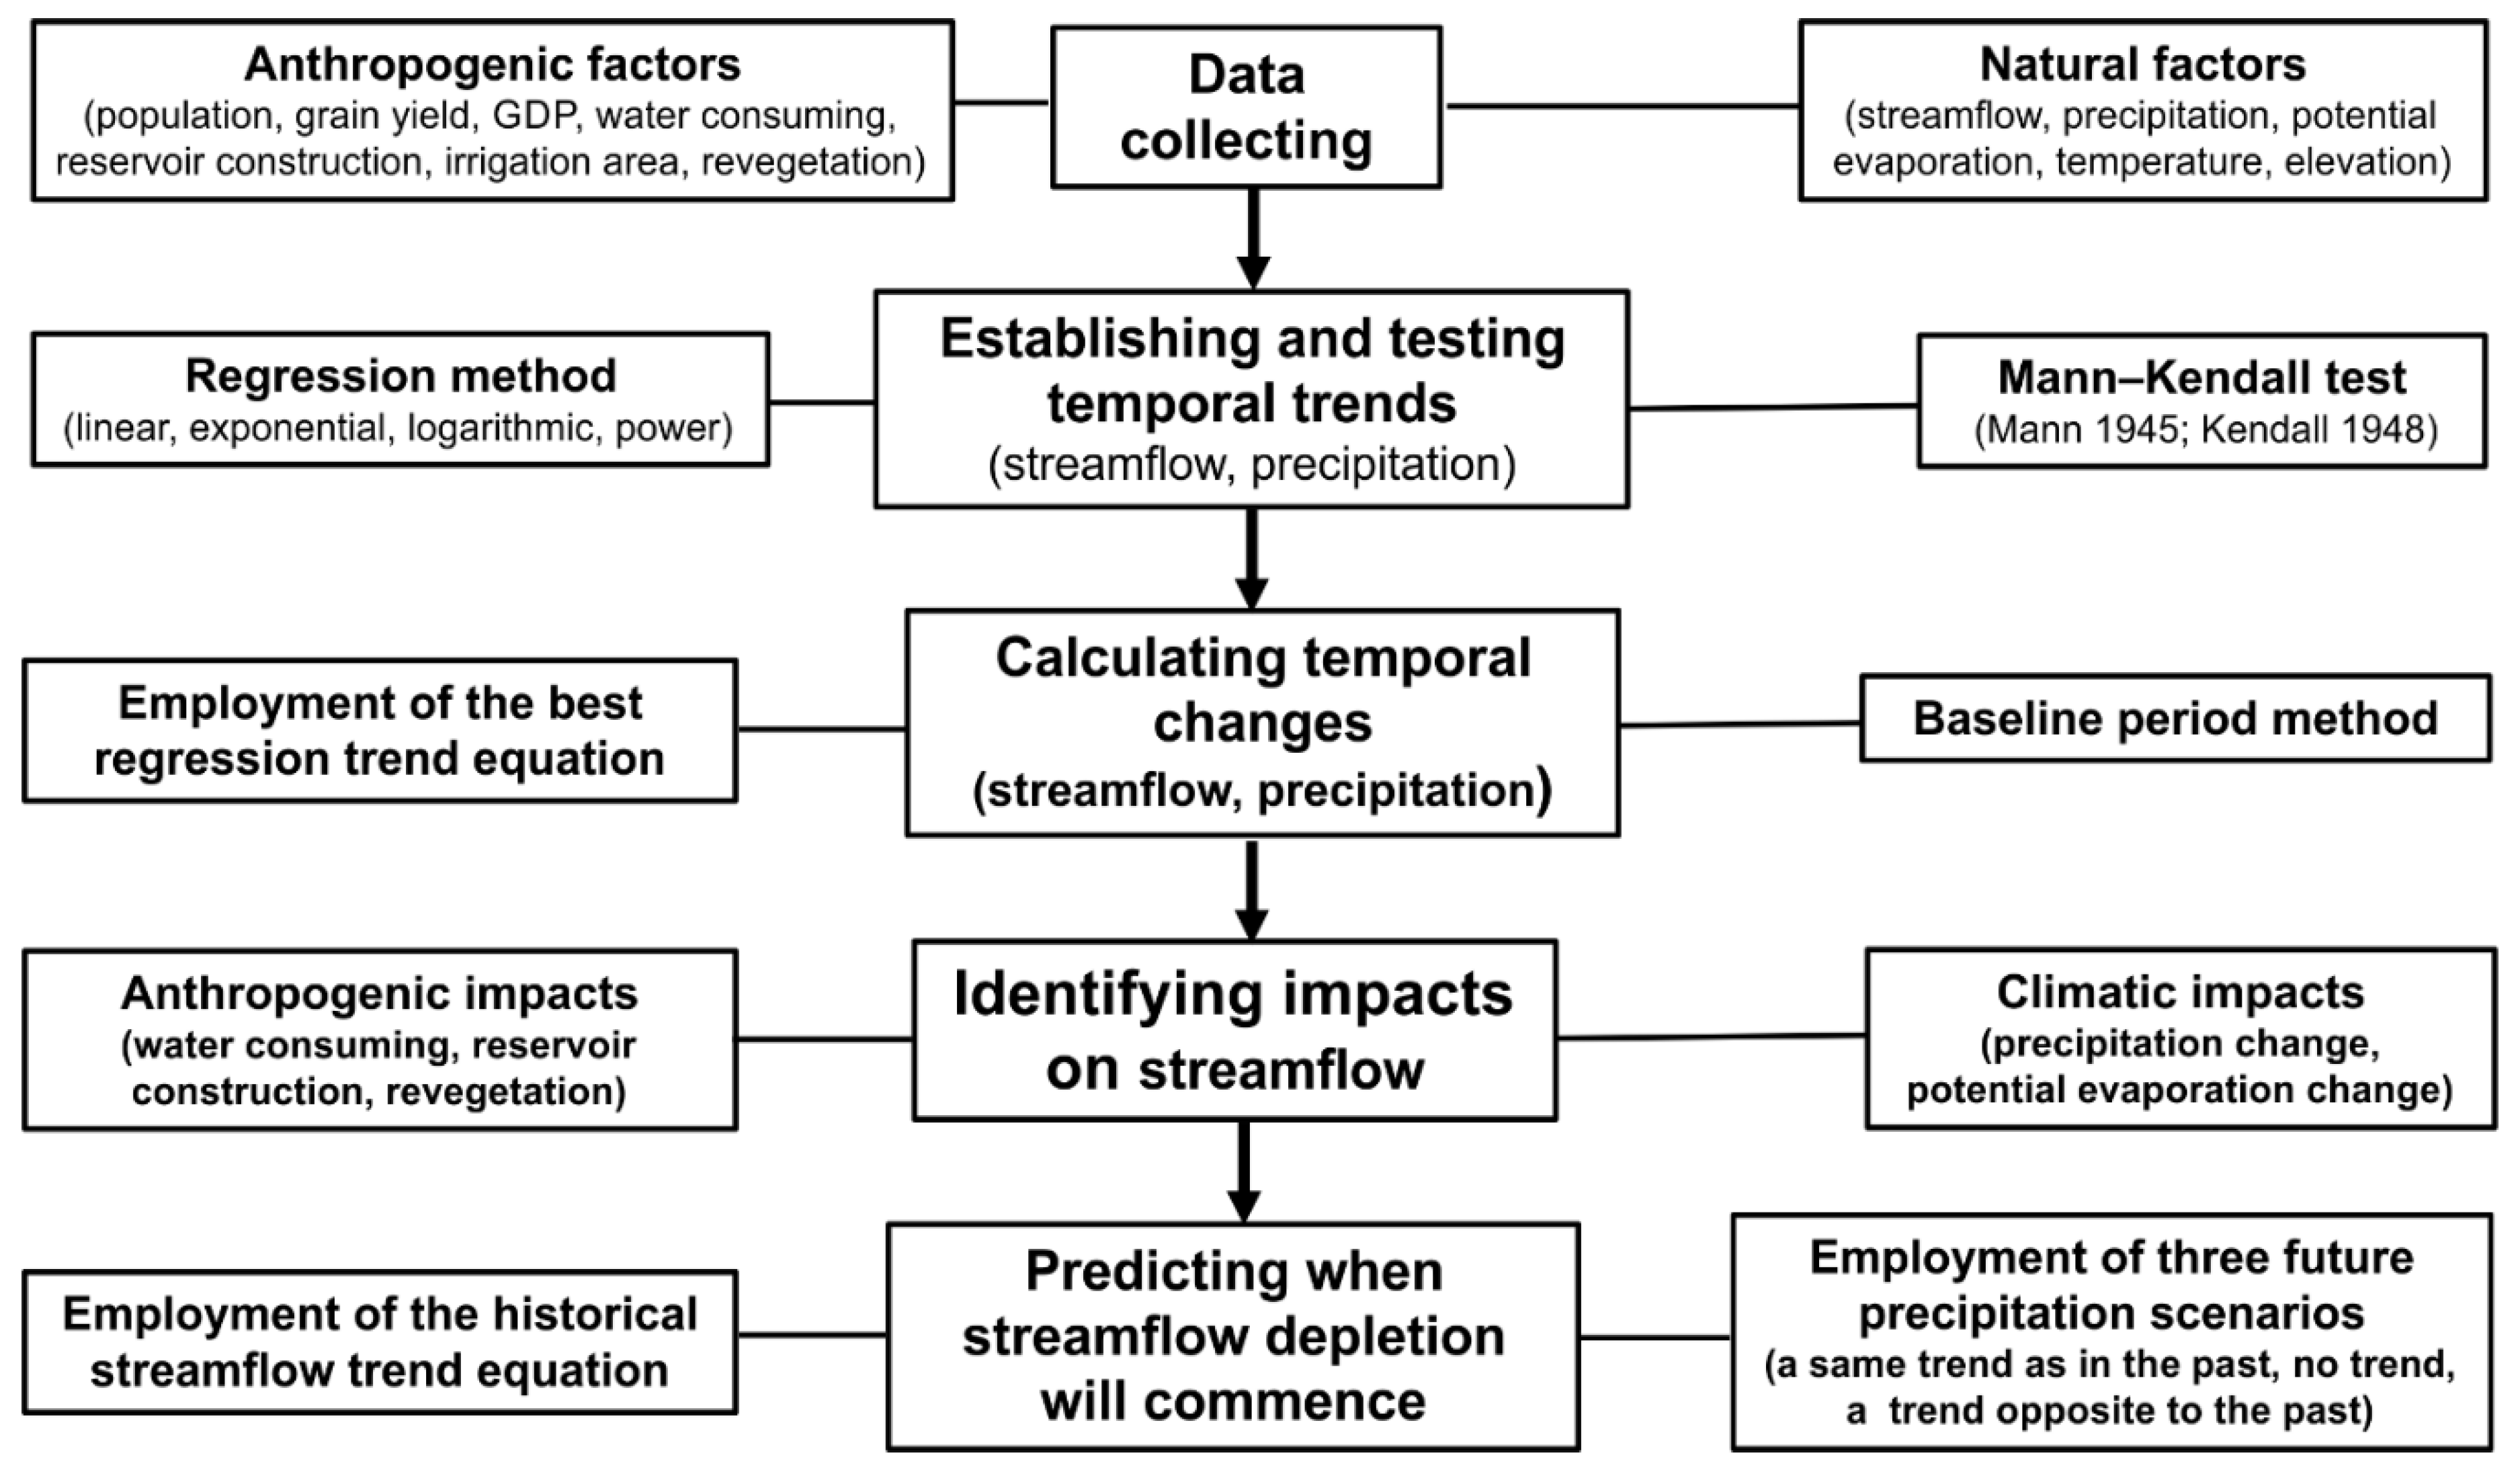
2.1. Data Mining
2.2. Methodology
2.2.1. Establishing the Temporal Trends in Measured Streamflow and Precipitation Water
2.2.2. Calculating Trend-Based Changes in Streamflow and Precipitation Water over the Past Six Decades
2.2.3. Assessing the Contribution of Precipitation Change to the Decreased Streamflow Rate
2.2.4. Predicting Calendar Year from which Annual Streamflow Depletion Will Commence in the YR
3. Results and Discussion
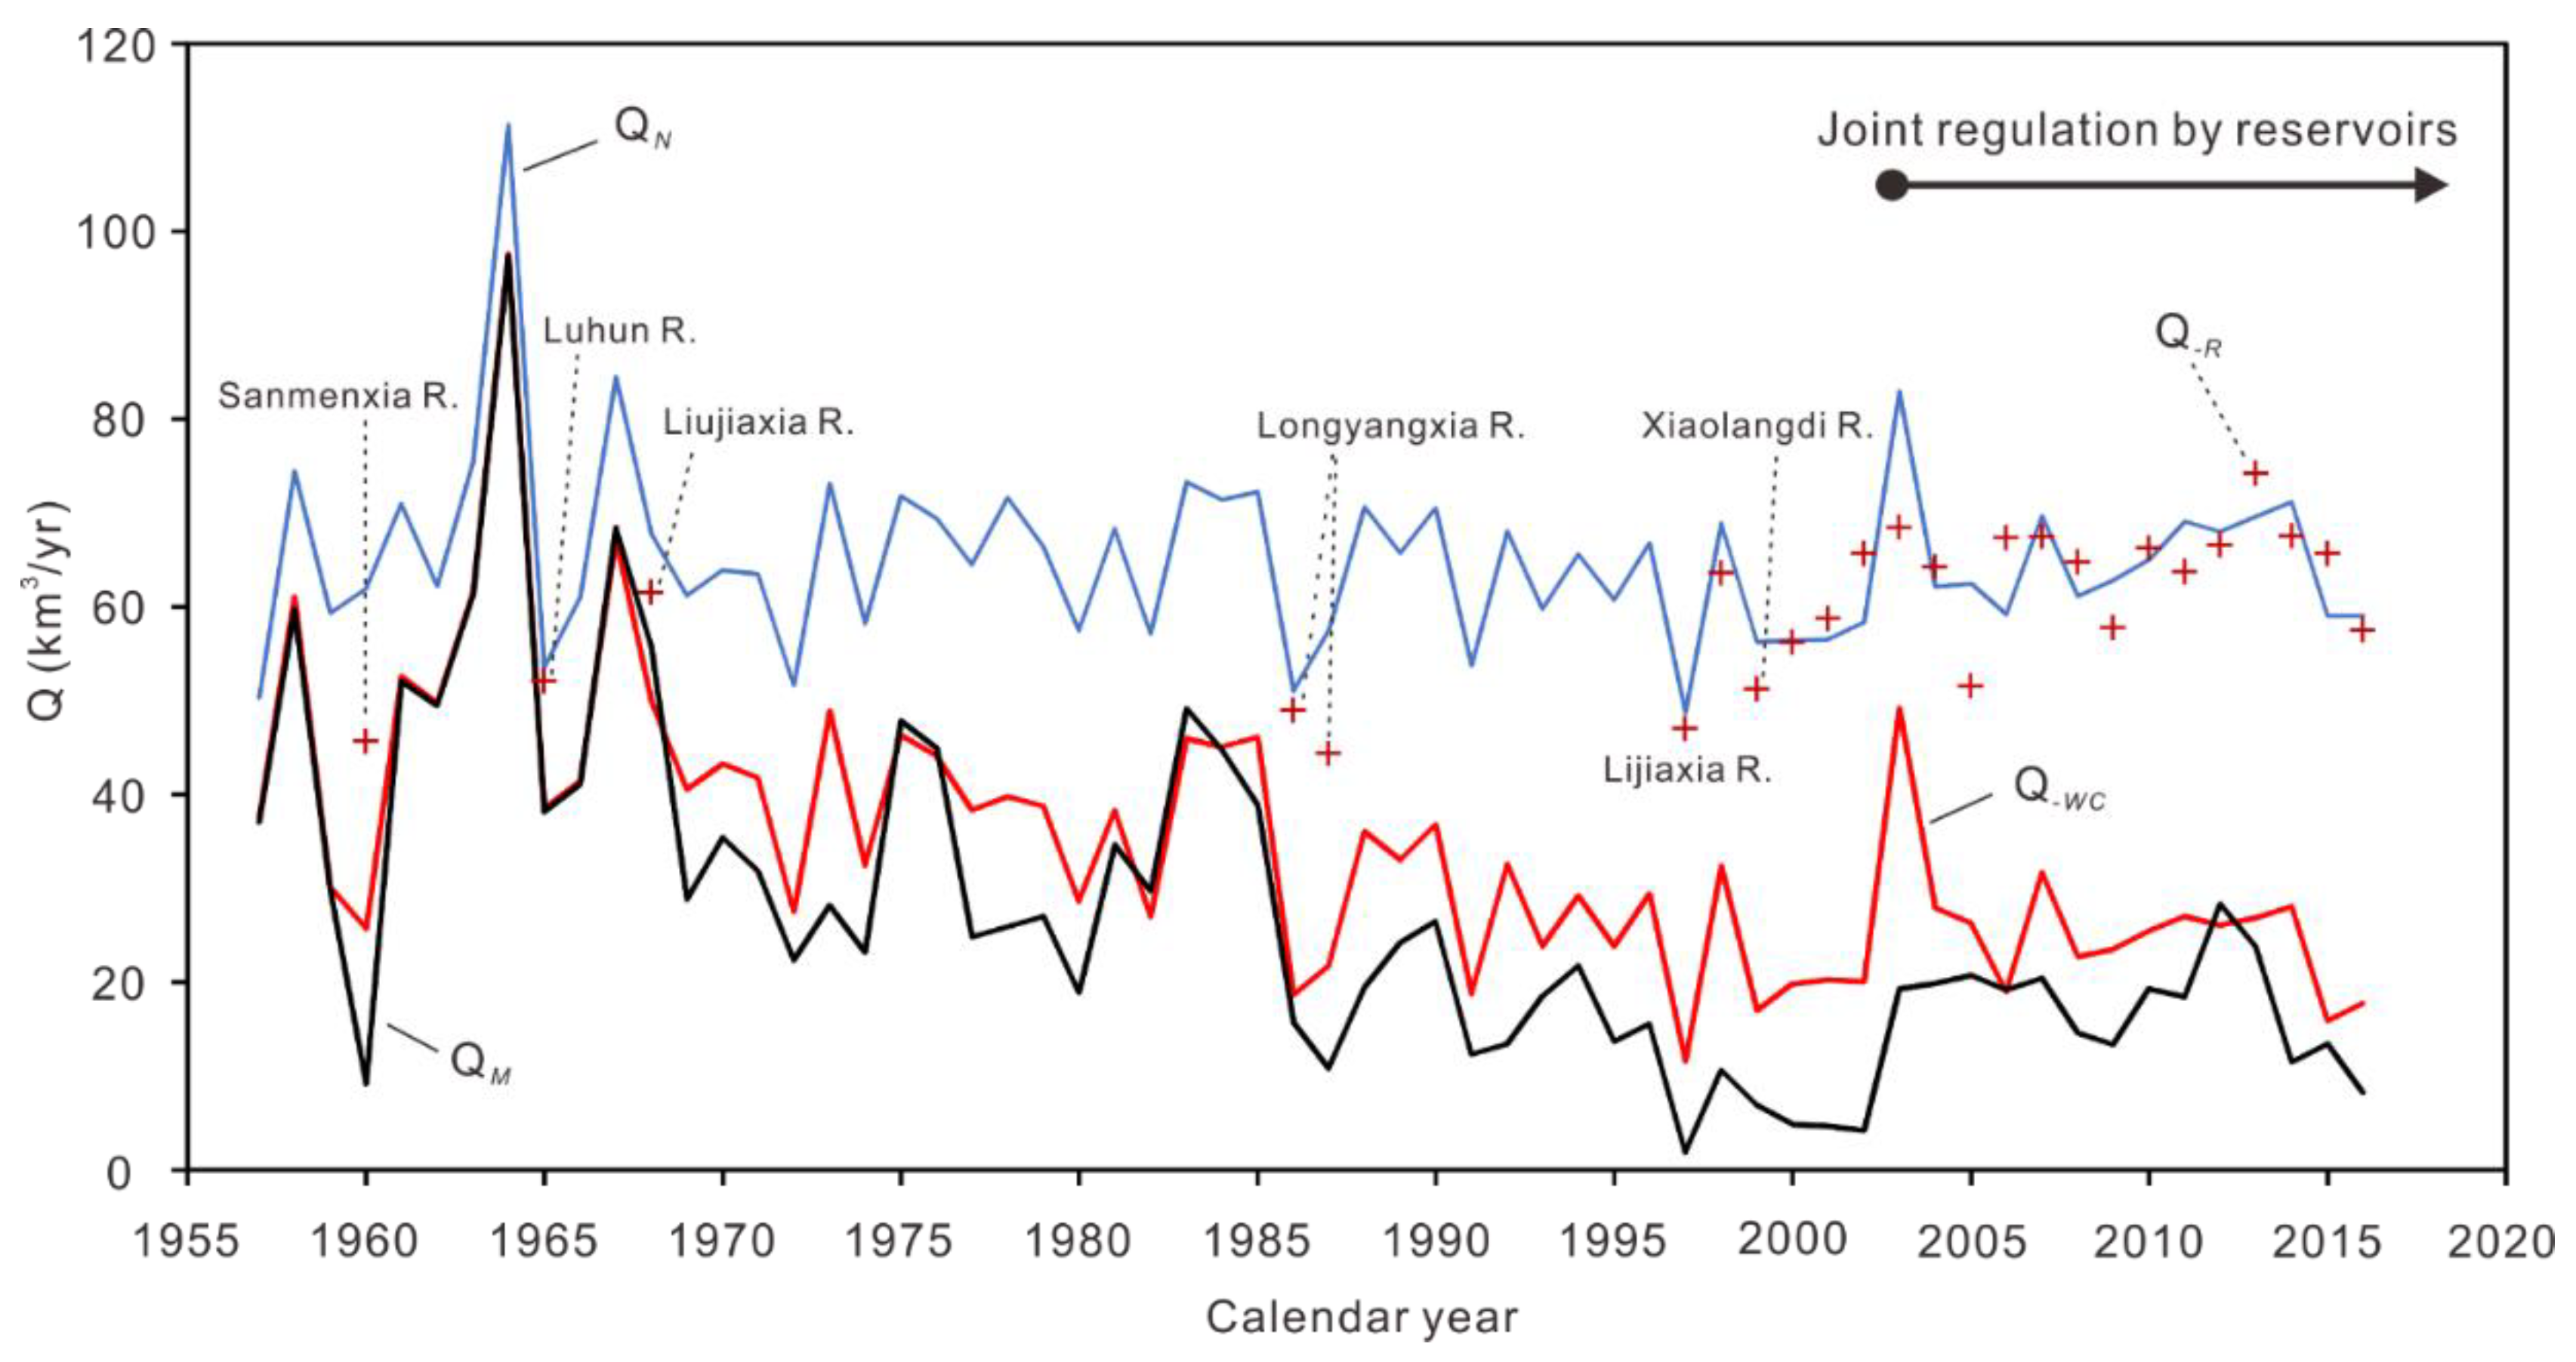
3.1. Streamflow Decline over the Past Decades
3.2. Climatic Impacts on the Temporal Trend in Streamflow
3.3. Human Impacts on the Temporal Trend in Streamflow
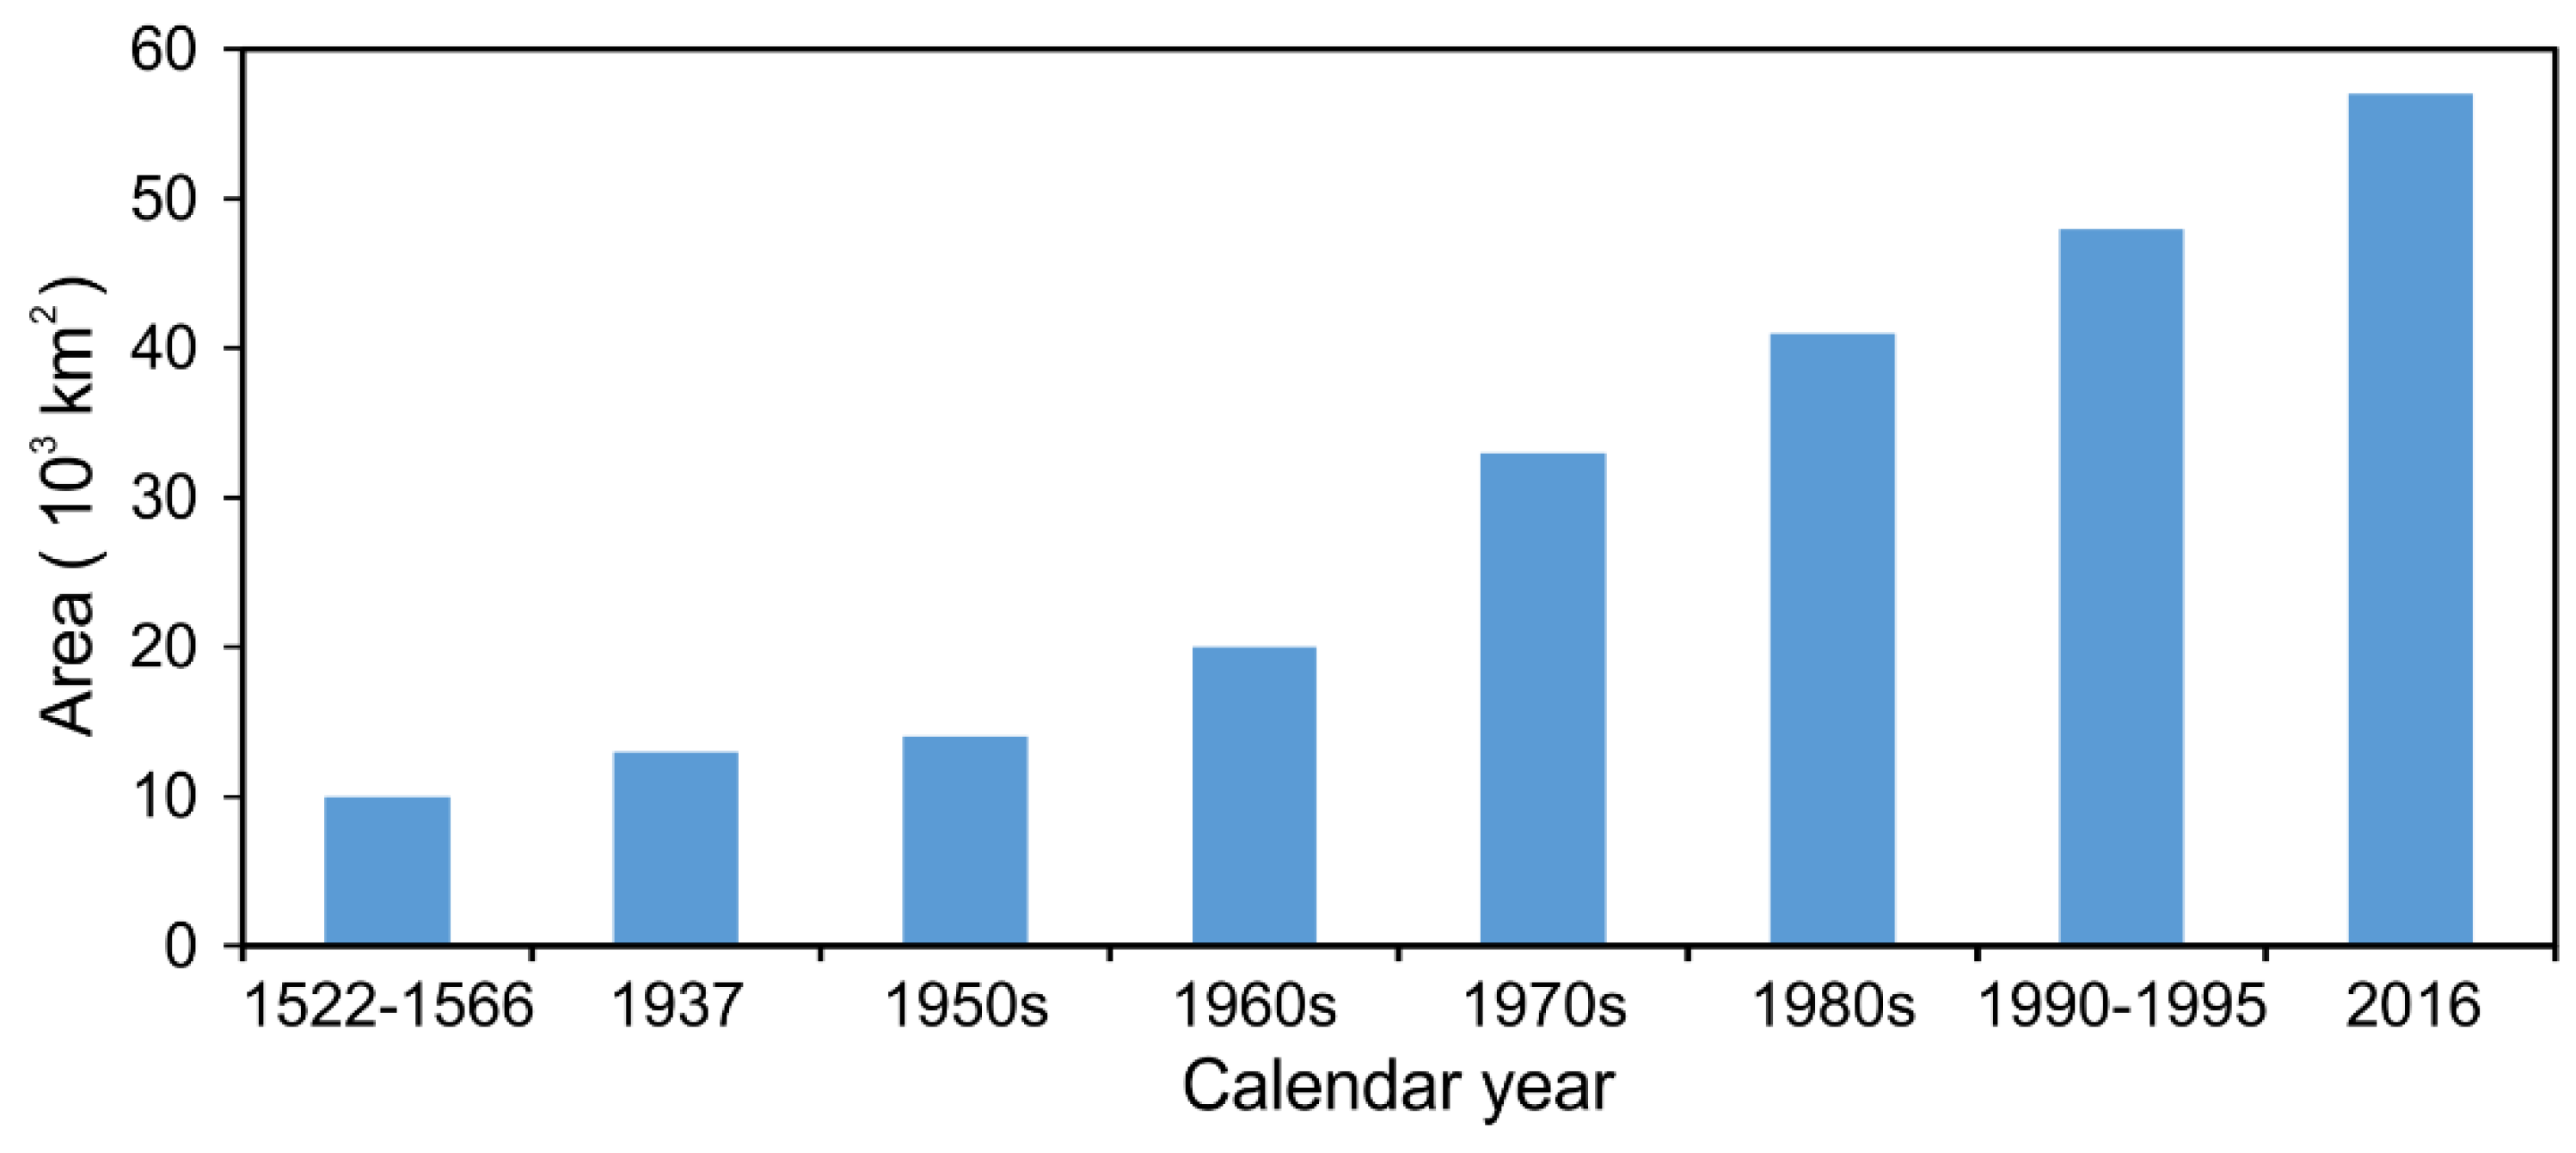
3.3.1. Water Consumption
3.3.2. Reservoir Construction
3.3.3. Revegetation
3.3.4. Land Use/Cover Change
3.4. Temporal Variation in the Weights of Factors Affecting Streamflow
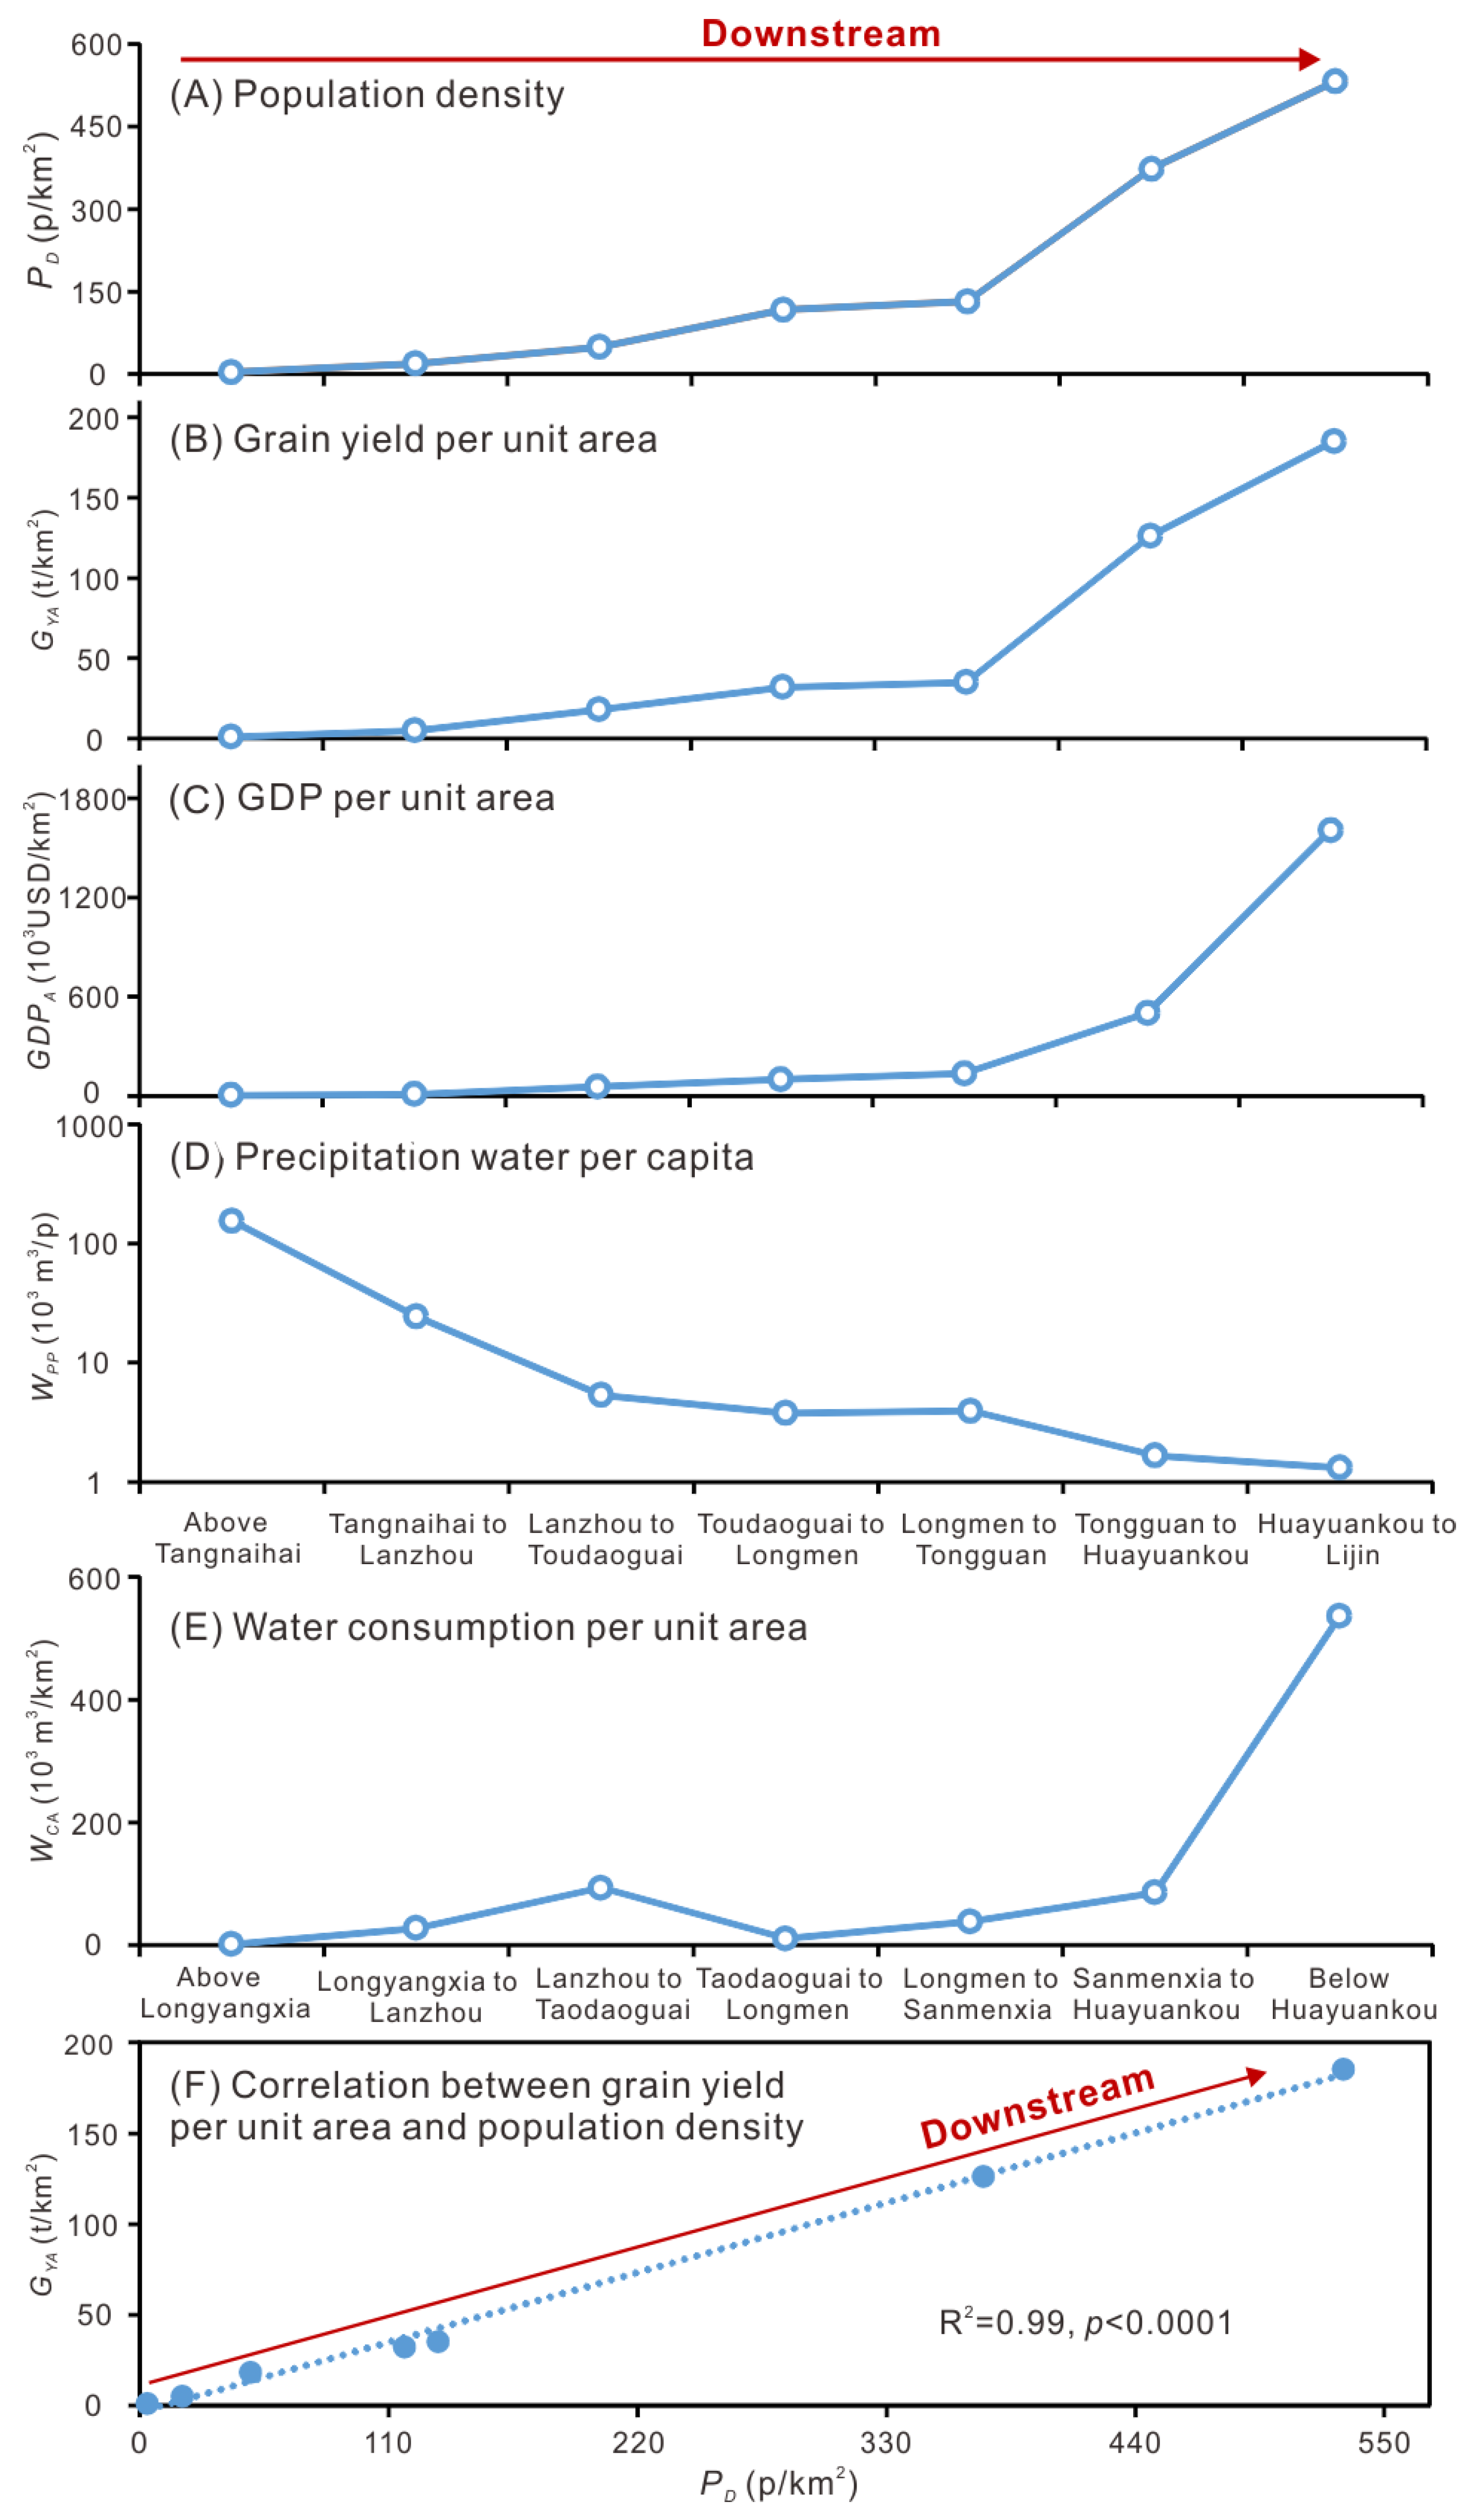
3.5. Natural and Socioeconomic Causes of Severer Streamflow Decline in Downstream Areas
3.6. Trend-Based Predictions of Future Streamflow
3.7. Consequences of Streamflow Decline
3.7.1. Ecosystem Degeneration
3.7.2. Socioeconomic Impacts
4. Conclusions
Author Contributions
Acknowledgments
Conflicts of Interest
Appendix A

| Variables | Yellow River Basin | Data Sources (Reference) | Global Total/Average | Data Sources (Reference) |
|---|---|---|---|---|
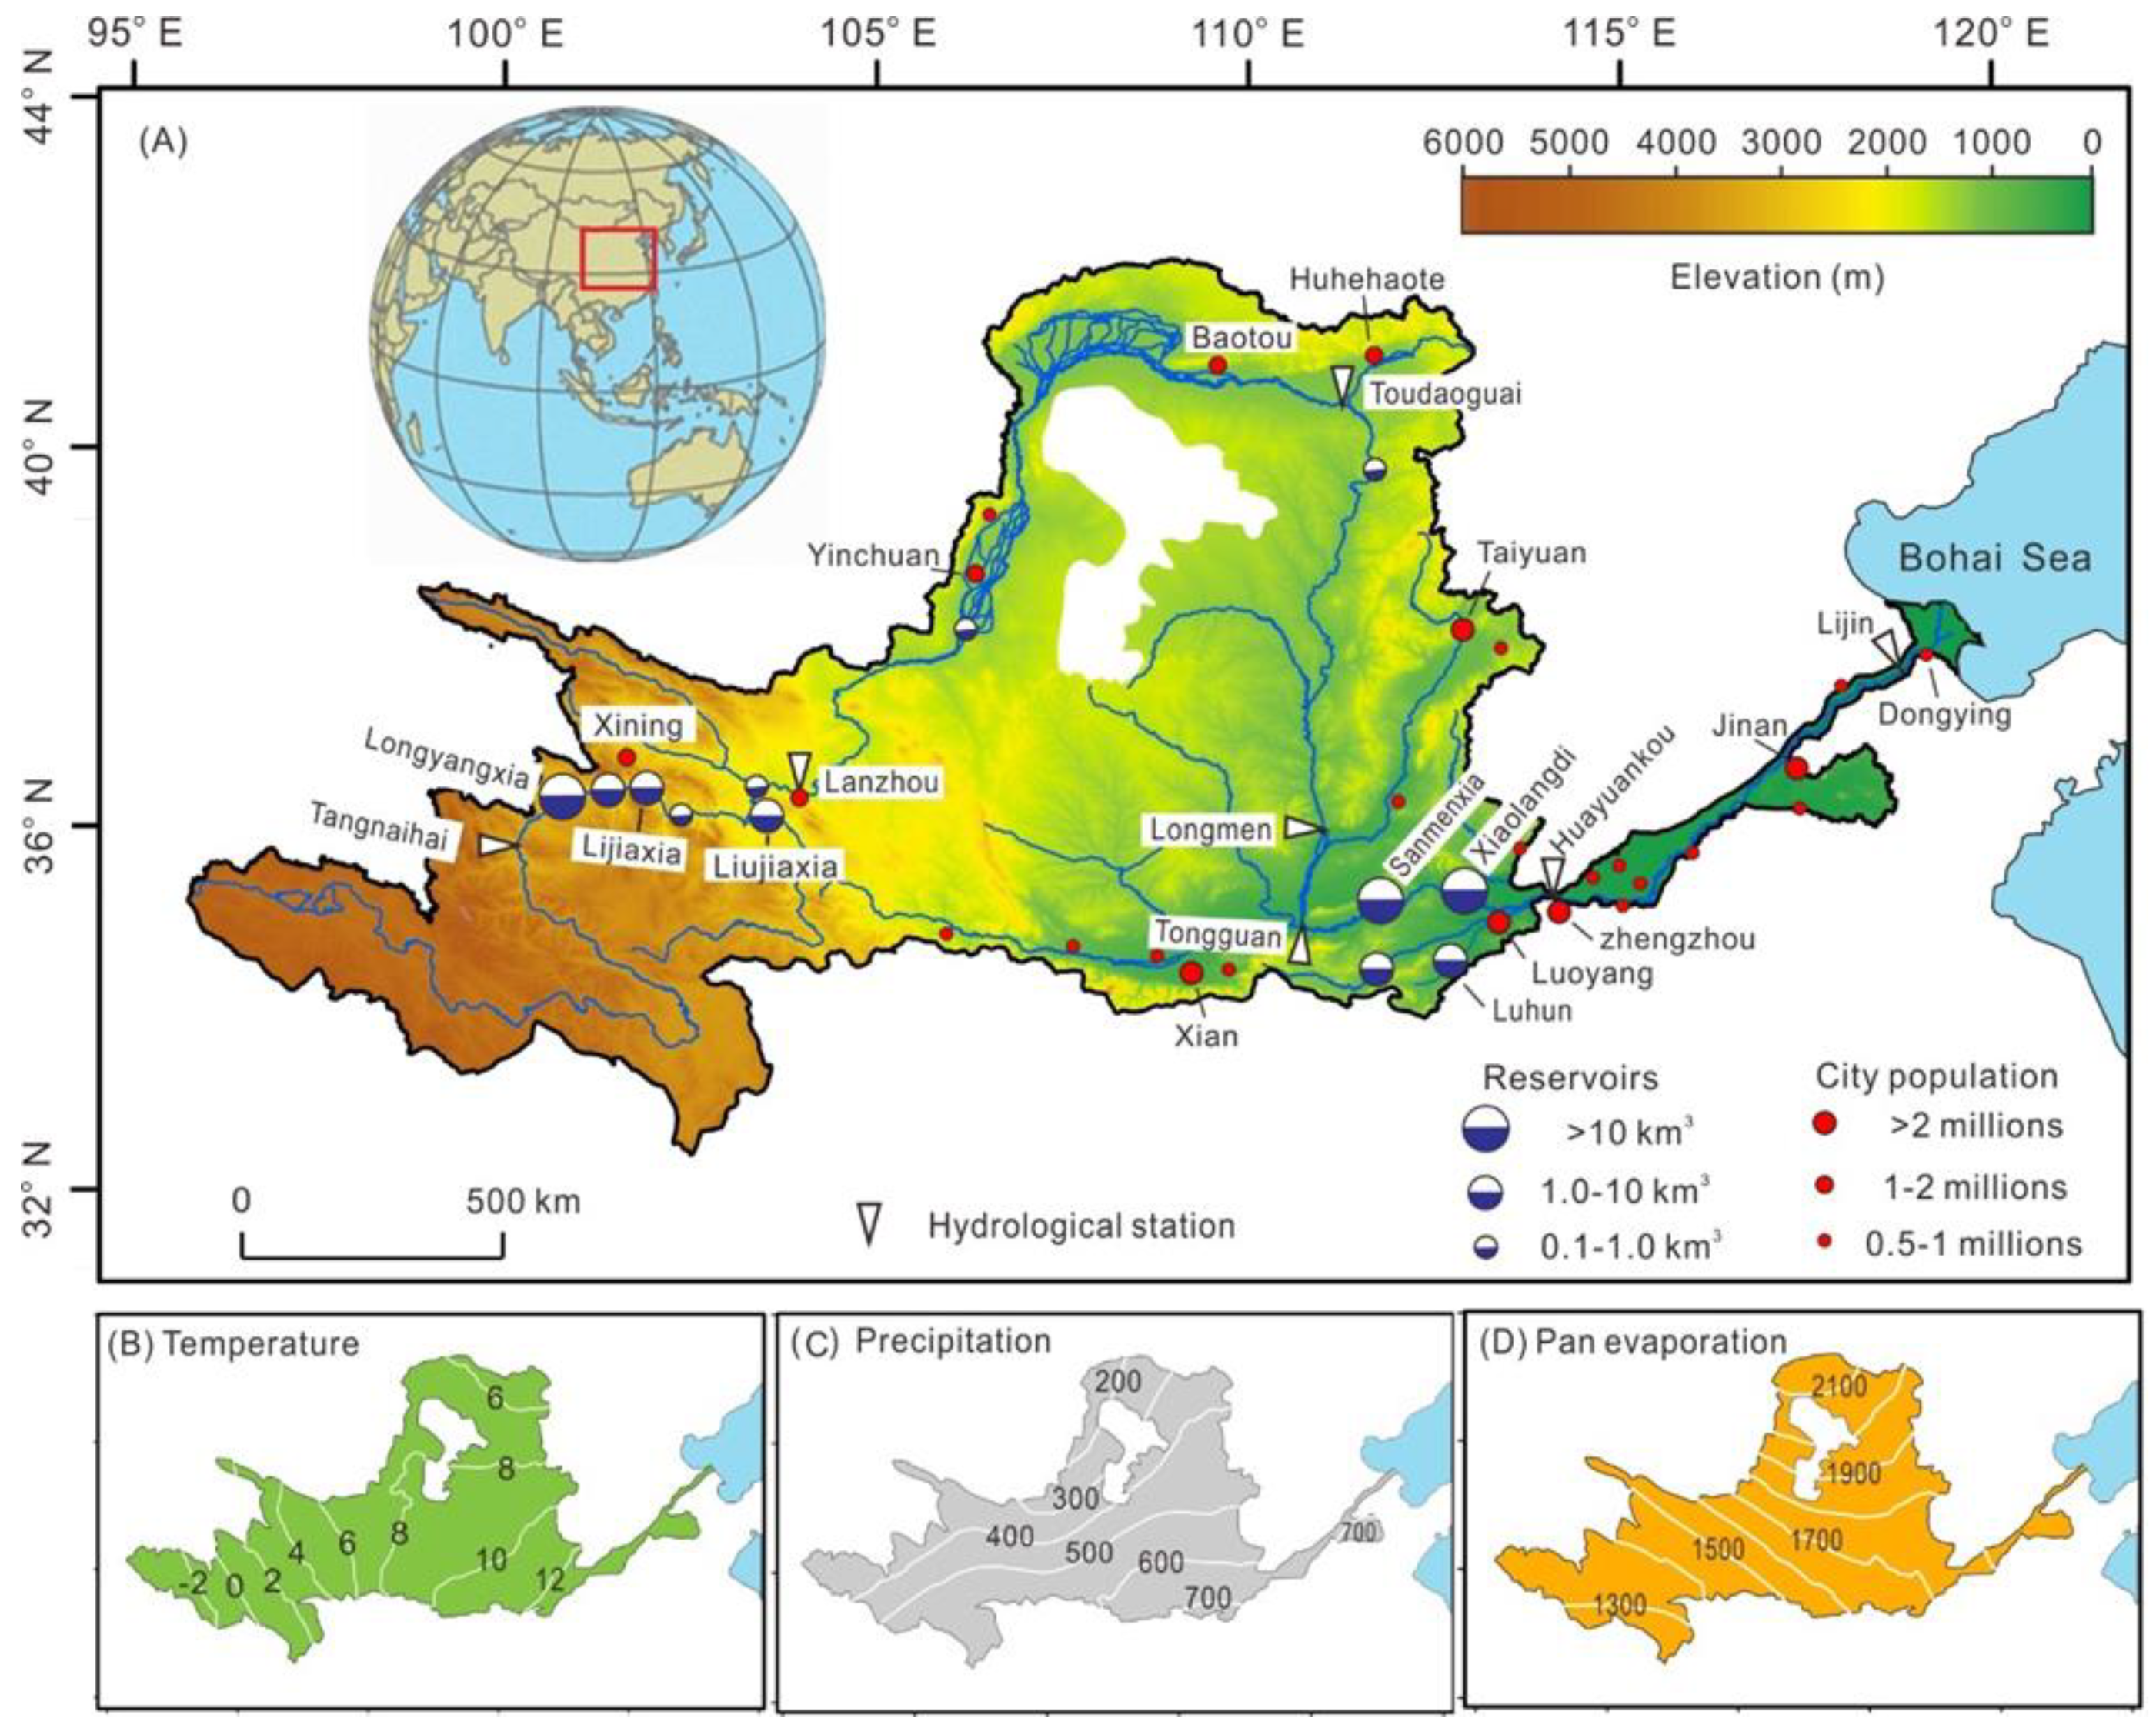
| Catchment area (103 km2) | 752 | (38) | 105,000 | (6) |
| Range of latitude (°N) | 32.2–41.8 | (53) | – | |
| Temperature (C°) a | 7.0 | This study (calculation) | – | |
| Precipitation (mm) a | 459 | This study (calculation) | 953 | [72] |
| Pan evaporation (mm) a | 1690 | (35) | 1150 | [73] |
| Runoff (km3/yr) a,b | 65 | This study (calculation) | 39,000 | [74] |
| Population (106 people) c | 107 | This study (calculation) | 7400 | https://www.baidu.com |
| Population density (people/km2) c | 142 | This study (calculation) | 70 | This study (calculation) |
| Total precipitation water (km3/yr) a | 345 | This study (calculation) | 100,000 | This study (calculation) |
| Precipitation water per capita (103 m3/person/yr) a | 3.22 | This study (calculation) | 13.5 | This study (calculation) |
| Runoff per capita (103 m3/person/yr) a | 0.61 | This study (calculation) | 5.23 | This study (calculation) |
| Grain yield (106 t/yr) c | 47.9 | This study (calculation) | 2880 | https://www.baidu.com |
| Grain yield per unit area (103 t/km2/yr) c | 63.4 | This study (calculation) | 2.74 | This study (calculation) |
| Grain yield per capita (t/person/yr) c | 0.45 | This study (calculation) | 0.39 | This study (calculation) |
| Grain yield per unit runoff (103 t/km3/yr) c | 737 | This study (calculation) | 73.8 | This study (calculation) |
| GDP (109 USD /yr) c | 686 | This study (calculation) | 75,900 | World Bank (https://data.worldbank.org.cn) |
| GDP per unit area (103 USD /km2/yr) c | 912 | This study (calculation) | 542 | This study (calculation) |
| GDP per capita (103 USD/person/yr) c | 6.4 | This study (calculation) | 10.3 | This study (calculation) |
| GDP per unit runoff (109 USD/km3/yr) c | 10.6 | This study (calculation) | 1.95 | This study (calculation) |
| Gauging Stations | PW and QM | ZMK | β | Trend Equation | R | p | Trend-Based Change from 1957 to 2016 (%) a | Trend-Based Prediction of Calendar Years for Commence of 5% Streamflow (and Depletion) b |
|---|---|---|---|---|---|---|---|---|
| Tangnaihai | PW | 0.61 | −1.35 | PW = 0.0236Y + 18.07 PW = 47.10ln(Y) + 272.7 PW = 0.0999Y 0.8521 PW = 27.64e0.0004Y | 0.058 0.058 0.068 0.068 | 0.66 (nonsignificant) 0.66 (nonsignificant) 0.52 (nonsignificant) 0.52 (nonsignificant) | +2.2 +2.2 +2.6 +2.4 | |
| QM | 0.04 | −0.04 | QM = −0.0468Y + 112.9 QM = −92.57ln(Y) + 723.0 QM = 8E+17Y−5.038 QM = 3028.6e−0.00255Y | 0.157 0.157 0.177 0.178 | 0.23 (nonsignificant) 0.23 (nonsignificant) 0.18 (nonsignificant) 0.18 (nonsignificant) | −13 (−15) −13 (−15) −14 (−16) −14 (−16) | 2340 ± 50 (2360 ± 52) 2385 ± 53 (2414 ± 55) 3343 ± 205 (Infinite) 2963 ± 172 (Infinite) | |
| Lanzhou | PW | 0.52 | 0.05 | PW = 0.0297Y + 51.56 PW = 58.893ln(Y) − 336.7 PW = 0.6007Y 0.6861 PW = 55.399 e0.000345Y | 0.046 0.046 0.059 0.059 | 0.73 (nonsignificant) 0.73 (nonsignificant) 0.58 (nonsignificant) 0.58 (nonsignificant) | +1.6 +1.6 +2.1 +2.1 | |
| QM | −2.16 | −0.11 | QM = −0.1321Y + 293.1 QM = −262.6ln(Y) + 2024.8 QM = 1.14E+28Y−8.058 QM = 94134e−0.00404Y | 0.349 0.349 0.343 0.343 | 0.006 (significant) 0.006 (significant) 0.006 (significant) 0.006 (significant) | −23 (−24) −23 (−24) −21 (−22) −21 (−22) | 2208 ± 13 (2221 ± 13) 2215 ± 13 (2219 ± 13) 2670 ± 180 (Infinite) 2636 ± 176 (Infinite) | |
| Toudaoguai | PW | −0.13 | −0.03 | PW = −0.0243Y + 194.9 PW = −48.44ln(Y) + 514.5 PW = 107.2 Y 0.0404 PW = 139.88e2E-05Y | 0.025 0.025 0.003 0.003 | 0.85 (nonsignificant) 0.85 (nonsignificant) 0.94 (nonsignificant) 0.94 (nonsignificant) | −1.0 −1.0 +0.1 +0.1 | |
| QM | −3.92 | −0.18 | QM = −0.2130Y + 443.8 QM = −423.1ln(Y) + 3233.8 QM = 5.6E+67Y−20.15 QM = 8.3E+9e−0.01Y | 0.494 0.494 0.510 0.510 | <0.0001 (very significant) <0.0001 (very significant) <0.0001 (very significant) <0.0001 (very significant) | −47 (−46) −46 (−45) −45 (−44) −45 (−44) | 2084 ± 6 (2089 ± 6) 2086 ± 6 (2091 ± 6) 2312 ± 37 (Infinite) 2298 ± 37 (Infinite) | |
| Longmen | PW | −0.25 | −0.05 | PW = −0.1157Y + 433.0 PW = −231.4ln(Y) + 1960.5 PW = 16609Y−0.581 PW = 357.9e−3E−04Y | 0.077 0.078 0.040 0.039 | 0.56 (nonsignificant) 0.55 (nonsignificant) 0.77 (nonsignificant) 0.79 (nonsignificant) | −3.3 −3.3 −1.7 −1.8 | |
| QM | −5.17 | −0.27 | QM = −0.3117Y + 644.1 QM = −619.1ln(Y) + 4726.8 QM = 1.75E+82Y −24.52 QM = 5.48E+11e−0.012Y | 0.623 0.623 0.651 0.651 | <0.0001 (very significant) <0.0001 (very significant) <0.0001 (very significant) <0.0001 (very significant) | −54 (−51) −53 (−50) −52 (−49) −51 (−48) | 2067 ± 5 (2071 ± 5) 2069 ± 5 (2074 ± 5) 2237 ± 36 (Infinite) 2243 ± 36 (Infinite) | |
| Tongguan | PW | −0.70 | −0.21 | PW = −0.3539Y + 1004 PW = −705.2ln(Y) + 5656.1 PW = 5.8E+08Y−1.905 PW = 1992.5e−1E−03Y | 0.159 0.159 0.130 0.131 | 0.23 (nonsignificant) 0.23 (nonsignificant) 0.31(nonsignificant) 0.30(nonsignificant) | −6.7 −6.7 −5.5 −5.5 | |
| QM | −5.53 | −0.40 | QM = −0.4568Y + 940.0 QM = −994.8ln(Y) + 7590.1 QM = 3.96E+93Y−27.93 QM = 3.65E+13e−0.014Y | 0.643 0.643 0.678 0.678 | <0.0001 (very significant) <0.0001 (very significant) <0.0001 (very significant) <0.0001 (very significant) | −59 (−50) −58 (−50) −56 (−48) −56 (−48) | 2061 ± 8 (2066 ± 8) 2063 ± 8 (2068 ± 8) 2216 ± 35 (Infinite) 2208 ± 34 (Infinite) | |
| Huayuankou | PW | −0.71 | −0.23 | PW = −0.4101Y + 1146 PW = −817ln(Y) + 6535.7 PW = 1.85E+09Y−2.045 PW = 2523.8e−0.00102Y | 0.168 0.168 0.143 0.143 | 0.20 (nonsignificant) 0.20 (nonsignificant) 0.28 (nonsignificant) 0.28 (nonsignificant) | −7.0 −7.1 −5.9 −5.9 | |
| QM | −5.13 | −0.43 | QM = −0.5007Y + 1030.0 QM = −994.8ln(Y) + 7590.1 QM = 3.05E+91x−27.29 QM = 2.45E+13e−0.0138Y | 0.606 0.607 0.621 0.621 | <0.0001 (very significant) <0.0001 (very significant) <0.0001 (very significant) <0.0001 (very significant) | −59 (−50) −59 (−50) −56 (−48) −56 (−48) | 2061 ± 9 (2066 ± 9) 2063 ± 9 (2068 ± 9) 2213 ± 33 (Infinite) 2205 ± 32 (Infinite) | |
| Lijin | PW | −0.81 | −0.26 | PW = −0.4316Y + 1204 PW = −859.9ln(Y) + 6876.6 PW = 2.35E+09Y−2.07 PW = 2705.7e−0.001Y | 0.171 0.171 0.146 0.146 | 0.19 (nonsignificant) 0.19 (nonsignificant) 0.27 (nonsignificant) 0.27 (nonsignificant) | −7.1 −7.1 −6.0 −5.9 | |
| QM | −5.64 | −0.61 | QM = −0.6761Y + 1370 QM = −1344ln(Y) + 10,235.9 QM = 3.35E+170Y−51.3 QM = 4.1E+23e−0.026Y | 0.654 0.656 0.609 0.608 | <0.0001 (very significant) <0.0001 (very significant) <0.0001 (very significant) <0.0001 (very significant) | −85 (−74) −81 (−70) −78 (−68) −78 (−68) | 2026 ± 2 (2028 ± 2) 2029 ± 2 (2031 ± 2) 2075 ± 12 (Infinite) 2075 ± 12 (Infinite) |
| Periods | WE (km3) | WC (km3) | CWI (km3) | NWI (km3) | Spatial distribution of WC (%) | Percentage of WC (%) | |||||||
|---|---|---|---|---|---|---|---|---|---|---|---|---|---|
| Above LZ | LZ to TDG | TDG to LM | LM to SMX | SMX to HYK | Below HYK | Agriculture Use | Industry Use | Urban Use | |||||
| 1998 | 49.7 | 36.5 | 5.26 | 22.1 | 7 | 33 | 3 | 19 | 7 | 31 | 90 | 8 | 2 |
| 1999 | 51.7 | 39.3 | 4.96 | 27.0 | 7 | 34 | 2 | 19 | 7 | 32 | 90 | 8 | 2 |
| 2000 | 48.1 | 36.6 | 0.155 | 27.2 | 8 | 33 | 3 | 20 | 6 | 29 | 88 | 9 | 3 |
| 2001 | 47.5 | 36.2 | −2.27 | 24.9 | 8 | 34 | 3 | 20 | 6 | 29 | 87 | 9 | 4 |
| 2002 | 49.5 | 38.2 | −7.39 | 17.5 | 8 | 31 | 3 | 19 | 6 | 34 | 87 | 10 | 3 |
| 2003 | 42.9 | 33.7 | 14.41 | 31.9 | 6 | 31 | 4 | 20 | 8 | 31 | 86 | 12 | 2 |
| 2004 | 44.5 | 34.2 | −2.18 | 29.7 | 9 | 35 | 3 | 20 | 7 | 26 | 87 | 11 | 2 |
| 2005 | 46.5 | 36.2 | 10.91 | 40.7 | 8 | 37 | 4 | 20 | 6 | 26 | 88 | 11 | 1 |
| 2006 | 51.2 | 40.2 | −8.23 | 32.4 | 8 | 31 | 4 | 20 | 7 | 30 | 87 | 10 | 3 |
| 2007 | 48.5 | 38.0 | 2.15 | 34.6 | 8 | 32 | 4 | 21 | 7 | 27 | 87 | 11 | 2 |
| 2008 | 49.1 | 38.4 | −3.68 | 30.9 | 8 | 32 | 4 | 20 | 8 | 29 | 86 | 12 | 2 |
| 2009 | 50.3 | 39.3 | 4.96 | 35.9 | ND | ND | ND | ND | ND | ND | 86 | 12 | 2 |
| 2010 | 51.2 | 39.5 | −1.31 | 34.5 | ND | ND | ND | ND | ND | ND | 85 | 12 | 3 |
| 2011 | 53.6 | 42.1 | 5.3 | 39.8 | ND | ND | ND | ND | ND | ND | 85 | 13 | 2 |
| 2012 | 52.4 | 41.9 | 1.4 | 41.2 | ND | ND | ND | ND | ND | ND | ND | ND | ND |
| 2013 | 53.3 | 42.7 | −4.63 | 36.6 | 11 | 30 | 4 | 19 | 7 | 29 | 85 | 12 | 3 |
| 2014 | 53.5 | 43.1 | 3.59 | 40.2 | 11 | 29 | 4 | 19 | 7 | 31 | 85 | 12 | 3 |
| 2015 | 53.5 | 43.2 | −6.67 | 33.5 | 10 | 28 | 4 | 19 | 7 | 32 | 85 | 12 | 3 |
| 2016 | 51.5 | 41.3 | 1.47 | 35.0 | 11 | 28 | 4 | 20 | 7 | 30 | 85 | 12 | 3 |
| Average | 49.9 | 39.0 | 0.96 | 32.4 | 9 | 32 | 4 | 20 | 7 | 30 | 86 | 11 | 3 |
| Name of Reservoir | Distance from Headwater (km) | Catchment Area (km2) | Maximum Storage Capacity (km3) | Regulating Storage Capacity (km3) | Surface Area (km2) | Time of Initial Water Impoundment |
|---|---|---|---|---|---|---|
| Longyangxia | 1684 | 131,000 | 27.4 a | 19.4 | 383 | October 1986 |
| Laxiwa | 1716 | ND | 1.08 a | ND | ND | April 2009 |
| Gongboxia | 1754 | ND | 0.62 a | 0.08 | ND | September 2004 |
| Lijiaxia | 1796 | 159,600 | 1.75 a | ND | 32 | December 1996 |
| Jishixia | 1900 | ND | 0.29 a | ND | ND | November 2010 |
| Liujiaxia | 2021 | 173,000 | 6.4 a | ND | 130 | October 1968 |
| Yanguoxia | 2026 | 183,000 | 0.22 | ND | ND | November 1961 |
| Daliushu | 2346 | 252,000 | 11 | 5 | ND | Construction in plan |
| Qingtongxia | 2600 | 275,000 | 0.62 | 0.32 | 113 | 1968 |
| Wanjiazhai | 3550 | 395,000 | 0.896 a | ND | ND | October 1998 |
| Sanmenxia | 4470 | 688,000 | 16.2 | ND | 200 | January 1960 |
| Xiaolangdi | 4538 | 694,000 | 12.7 a | 5.1 | 278 | October 1999 |
| Luhun | Tributary | 3490 | 1.32 a | ND | 31 | 1965 |
| Guxian | Tributary | 5370 | 1.2 | ND | 35 | 1994 |
| Variables | Above TNH | TNH to LZ | LZ to TDG | TDG to LM | LM to TG | TG to HYK | HYK to LJ |
|---|---|---|---|---|---|---|---|
| Length of stream segment (km) | 1553 | 543 | 1376 | 723 | 155 | 328 | 786 |
| Catchment area (103 km2) | 122 | 101 | 134 | 130 | 185 | 47.8 | 21.9 |
| Precipitation water per unit area (103 m3/p) a | 543 | 464 | 262 | 442 | 521 | 623 | 702 |
| Population density (p/km2) a | 3.5 | 19 | 49 | 117 | 132 | 373 | 532 |
| Grain yield density (t/km2) a | 1 | 5 | 18 | 32 | 35 | 126 | 185 |
| GDP per unit area (103 USD/km2) a | 2.7 | 9.0 | 54 | 98 | 134 | 500 | 1606 |
| Precipitation water per capita (103 m3/p) a | 155 | 24.4 | 5.35 | 3.78 | 3.95 | 1.67 | 1.32 |
| Trend-based precipitation change (%) b | +2.2 | +0.8 | −8.5 | −9.1 | −13 | −10 | −8.0 |
| Above LYX | LYX to LZ | LZ to TDG | TDG to LM | LM to SMX | SMX to HYK | Below HYK | |
| Length of stream segment (km) | 1684 | 412 | 1376 | 723 | 275 | 208 | 786 |
| Catchment area (103 km2) | 131 | 92 | 134 | 130 | 201 | 31.8 | 21.9 |
| Water consumption per unit area (103 m3/km2) c | 1.5 | 28 | 93 | 10 | 39 | 86 | 537 |
| Headwater Areas | Upper Reaches | Middle Reaches | Lower Reaches | ||
|---|---|---|---|---|---|
| Population density (p/km2) | 1957–1966 | 2.5 | 19 | 94 | 339 |
| 2007–2016 | 4.5 | 46 | 183 | 602 | |
| Growth | 2.0 | 27 | 89 | 269 | |
| Grain yield per unit area (t/km2) | 1957–1966 | 0.7 | 5.2 | 22 | 71 |
| 2007–2016 | 1.3 | 24.4 | 73 | 308 | |
| Growth | 0.6 | 19 | 52 | 237 | |
| GDP per unit area (103 USD/km2) | 1957–1966 | 0.06 | 0.58 | 3.62 | 6.09 |
| 2007–2016 | 21.7 | 203 | 1267 | 3623 | |
| Growth | 21.7 | 202 | 1263 | 3617 | |
References
- Creed, I.F.; Lane, C.R.; Serran, J.N.; Alexander, L.C.; Basu, N.B.; Calhoun, A.J.K.; Christensen, J.E.; Cohen, M.J.; Craft, C.; D’Amico, E.; et al. Enhancing protection for vulnerable waters. Nat. Geosci. 2017, 10, 809–815. [Google Scholar] [CrossRef] [PubMed]
- Hering, J.G.; Ingold, K.M. Water resources management: What should be integrated? Science 2012, 336, 1234–1235. [Google Scholar] [CrossRef] [PubMed]
- Larsen, T.A.; Hoffmann, S.; Lüthi, C.; Truffer, B.; Maurer, M. Emerging solutions to the water challenges of an urbanizing world. Science 2016, 352, 928–933. [Google Scholar] [CrossRef] [PubMed]
- Vörösmarty, C.J.; McIntyre, P.B.; Gessner, M.O.; Dudgeon, D.; Prusevich, A.; Green, P.; Glidden, S.; Bunn, S.E.; Sullivan, C.A.; Reidy Liermann, C. Global threats to human water security and river biodiversity. Nature 2010, 467, 555–561. [Google Scholar] [CrossRef]
- Wiegel, R.L. Nile delta erosion. Science 1996, 272, 338–340. [Google Scholar] [CrossRef]
- Milliman, J.D.; Farnsworth, K.L. River Discharge to the Coastal Ocean; Cambridge University Press: Cambridge, UK, 2011. [Google Scholar]
- Milly, P.C.D.; Dunne, K.A.; Vecchia, A.V. Global pattern of trends in streamflow and water availability in a changing climate. Nature 2005, 438, 347–350. [Google Scholar] [CrossRef]
- Arnell, N.W. Climate change and global water resources: SRES emissions and socio-economic scenarios. Glob. Environ. Chang. 2004, 14, 31–52. [Google Scholar] [CrossRef]
- Piao, S.; Ciais, P.; Huang, Y.; Shen, Z.; Peng, S.; Li, J.; Zhou, L.P.; Liu, H.Y.; Ma, Y.C.; Ding, Y.H.; et al. The impacts of climate change on water resources and agriculture in China. Nature 2010, 467, 43–51. [Google Scholar] [CrossRef]
- Schewe, J.; Heinke, J.; Gerten, D.; Haddeland, I.; Arnell, N.W.; Clark, D.B.; Dankers, R.; Eisner, S.; Fekete, B.M.; Colón-González, F.J.; et al. Multimodel assessment of water scarcity under climate change. Proc. Natl. Acad. Sci. USA 2014, 111, 3245–3250. [Google Scholar] [CrossRef] [Green Version]
- Sun, Q.; Miao, C.; Duan, Q.; Ashouri, H.; Sorooshian, S.; Hsu, K. A Review of Global Precipitation Data Sets: Data Sources, Estimation, and Intercomparisons. Rev. Geophys. 2018, 56, 79–107. [Google Scholar] [CrossRef] [Green Version]
- Vörösmarty, C.J.; Green, P. Global Water Resources: Vulnerability from Climate Change and Population Growth. Science 2000, 289, 284–289. [Google Scholar] [CrossRef] [PubMed] [Green Version]
- Oki, T.; Kanae, S. Global hydrological cycles and world water resources. Science 2006, 313, 1068–1072. [Google Scholar] [CrossRef] [PubMed] [Green Version]
- Liu, C.; Zhang, X. Causal Analysis on Actual Water Flow Reduction in the Mainstream of the Yellow River. Acta Geogr. Sin. 2004, 59, 323–330. [Google Scholar]
- Jiang, C.; Xiong, L.; Wang, D.; Liu, P.; Guo, S.; Xu, C.Y. Separating the impacts of climate change and human activities on runoff using the Budyko-type equations with time-varying parameters. J. Hydrol. 2015, 522, 326–338. [Google Scholar] [CrossRef]
- Gao, Z.; Zhang, L.; Zhang, X.; Cheng, L.; Potter, N.; Cowan, T.; Cai, W. Long-term streamflow trends in the middle reaches of the Yellow River Basin: Detecting drivers of change. Hydrol. Process. 2016, 30, 1315–1329. [Google Scholar] [CrossRef]
- Wang, Y.; Zhao, W.; Wang, S.; Feng, X.; Liu, Y. Yellow River water rebalanced by human regulation. Sci. Rep. 2019, 9, 9707. [Google Scholar] [CrossRef] [Green Version]
- Wang, H.; Yang, Z.; Saito, Y.; Liu, J.P.; Sun, X.X. Interannual and seasonal variation of the Huanghe (Yellow River) water discharge over the past 50 years: Connections to impacts from ENSO events and dams. Glob. Planet Chang. 2006, 50, 212–225. [Google Scholar] [CrossRef]
- Li, B.; Li, C.; Liu, J.; Zhang, Q.; Duan, L. Decreased Streamflow in the Yellow River Basin, China: Climate Change or Human-Induced? Water 2017, 9, 116. [Google Scholar] [CrossRef]
- Gao, P.; Mu, X.-M.; Wang, F.; Li, R. Changes in streamflow and sediment discharge and the response to human activities in the middle reaches of the Yellow River. Hydrol. Earth Syst. Sci. 2011, 15, 1–10. [Google Scholar] [CrossRef] [Green Version]
- Miao, C.Y.; Ni, J.R.; Borthwick, A.G.L. Recent changes of water discharge and sediment load in the Yellow River basin, China. Prog. Phys. Geogr. 2010, 34, 541–561. [Google Scholar] [CrossRef] [Green Version]
- Zhao, G.; Li, e.; Mu, X.; Wen, Z.; Rayburg, S.; Tian, P. Changing trends and regime shift of streamflow in the Yellow River basin. Stoch. Environ. Res. Risk Assess. 2015, 29, 1331–1343. [Google Scholar] [CrossRef]
- Chen, J.W. Tendency, causes and control measures on Yellow River dry-up. J. Nat. Resour. 2000, 15, 31–35. [Google Scholar]
- Yao, W.; Zhao, Y.; Tang, L.; Li, S. Preliminary study on no flow disaster in the lower reaches of Yellow River. Adv. Water Sci. 1999, 10, 160–164. [Google Scholar]
- Peng, K. China water resource crisis in the 21th century. Adv. Sci. Technol. Water Resour. 2000, 20, 13–16. [Google Scholar]
- He, C. Route and Model Towards a Great Modernized Country. Bull. Chin. Acad. Sci. 2018, 33, 274–283. [Google Scholar]
- Li, Q.J.; Liu, Z.S.; Xiao, S.J.; Meng, J. Water demand prediction of national economy in the Yellow River Basin. Yellow River 2011, 33, 61–63. [Google Scholar]
- Dey, P.; Mishra, A. Separating the impacts of climate change and human activities on streamflow: A review of methodologies and critical assumptions. J. Hydrol. 2017, 548, 278–290. [Google Scholar] [CrossRef]
- Yang, S.L.; Xu, K.H.; Milliman, J.D.; Yang, H.F.; Wu, C.S. Decline of Yangtze River water and sediment discharge: Impact from natural and anthropogenic changes. Sci. Rep. 2015, 5, 12581. [Google Scholar] [CrossRef]
- Yang, H.F.; Yang, S.L.; Xu, K.H.; Milliman, J.D.; Wang, H.; Yang, Z.; Chen, Z.; Zhang, C.Y. Human impacts on sediment in the Yangtze River: A review and new perspectives. Glob. Planet. Chang. 2018, 162, 8–17. [Google Scholar] [CrossRef]
- Mann, H.B. Nonparametric Tests Against Trend. Econometrica 1945, 13, 245–259. [Google Scholar] [CrossRef]
- Kendall, M.G. Rank Correlation Methods; Charles Griffin: London, UK, 1975. [Google Scholar]
- Meade, R.H.; Moody, J.A. Causes for the decline of suspended-sediment discharge in the Mississippi River system, 1940–2007. Hydrol. Process. 2010, 24, 35–49. [Google Scholar] [CrossRef]
- Yang, S.L.; Liu, Z.; Dai, S.B.; Gao, Z.X.; Zhang, J.; Wang, H.J.; Luo, X.X.; Wu, C.S.; Zhang, Z. Temporal variations in water resources in the Yangtze River (Changjiang) over the Industrial Period based on reconstruction of missing monthly discharges. Water Resour. Res. 2010, 46, W10516. [Google Scholar] [CrossRef] [Green Version]
- Dai, S.B.; Yang, S.L.; Cai, A.M. Catena Impacts of dams on the sediment fl ux of the Pearl River, southern China. Catena 2008, 76, 36–43. [Google Scholar] [CrossRef]
- Liu, C.; Wang, S.; Liang, Y.; Leung, R.L. Analysis of Pan Evaporation Change and the Influence Factors in the Yellow River Basin in 1961–2010. Progress. Inquisitiones Mutat. Clim. 2013, 9, 327–334. [Google Scholar]
- Roderick, M.L.; Farquhar, G.D. The cause of decreased pan evaporation over the past 50 years. Science 2002, 298, 1410–1411. [Google Scholar] [PubMed]
- Lu, D. History of irrigation in Ningxia Plain. Yellow River 1990, 12, 69–72. [Google Scholar]
- Ministry of Water Resources of China (MWRC). China Water Resources Bulletin in 1997–2016. Available online: http://www.mwr.gov.cn/sj/tjgb/szygb/ (accessed on 1 July 2019). (In Chinese)
- Dai, S.B.; Yang, S.L.; Li, M. Sharp decrease in suspended sediment supply from China’s rivers to the sea: Anthropogenic and natural causes. Hydrolog. Sci. J. 2009, 54, 135–146. [Google Scholar] [CrossRef] [Green Version]
- Yellow River Conservancy Commission (YRCC). Yellow River Water Resource Bulletin in 2016. Available online: http://www.yrcc.gov.cn/other/hhgb/2016szygb/index.html#p=1 (accessed on 1 July 2019). (In Chinese)
- Wang, H.; Wu, X.; Bi, N.; Li, S.; Yuan, P.; Wang, A.; Syvitski, J.P.M.; Saito, Y.; Yang, Z.; Liu, S. Impacts of the dam-orientated water-sediment regulation scheme on the lower reaches and delta of the Yellow River (Huanghe): A review. Glob. Planet. Chang. 2017, 157, 93–113. [Google Scholar] [CrossRef]
- Feng, X.; Fu, B.; Piao, S.; Wang, S.; Zeng, Z.; Lü, Y.; Zeng, Y.; Li, Y. Revegetation in China’s loess plateau is approaching sustainable water resource limits. Nat. Clim. Chang. 2016, 6, 1019. [Google Scholar] [CrossRef]
- Lv, M.; Ma, Z.; Li, M.; Zheng, Z. Quantitative analysis of terrestrial water storage changes under the grain for green program in the Yellow River Basin. J. Geophys. Res. Atmos. 2019, 124, 1336–1351. [Google Scholar] [CrossRef]
- Xu, J. Effect of human activities on overall trend of sedimentation in the lower Yellow River, China. Environ. Manag. 2004, 33, 637–653. [Google Scholar]
- Chen, L.Q.; Liu, C.M. Influence of climate and land-cover change on runoff of the source regions of Yellow River. China Environ. Sci. 2007, 27, 559–565. [Google Scholar]
- Qiu, G.Y.; Yin, J.; Xiong, Y.J.; Zhao, S.H.; Wang, P.; Wu, X.Q.; Zeng, S. Studies on the Effects of Climatic warming-drying trend and land use change on the runoff in the Jinghe River Basin. J. Nat. Resour. 2008, 23, 211–218. [Google Scholar]
- Zheng, H.; Zhang, L.; Zhu, R.; Liu, C.; Sato, Y.; Fukushima, Y. Responses of streamflow to climate and land surface change in the headwaters of the Yellow River Basin. Water Resour. Res. 2009, 45, W00A19. [Google Scholar] [CrossRef]
- Shi, P.; Wang, J.; Feng, W.; Ye, T.; Ge, Y.; Chen, J.; Liu, J. Response of eco-environmental security to land use/cover changes and adjustment of land use policy and pattern in China. Adv. Earth Sci. 2006, 21, 111–119. [Google Scholar]
- Ministry of Land and Resources of China (MLRC). China Land and Resources Bulletin in 2016. Available online: https://wenku.baidu.com/view/cd4d0610657d27284b73f242336c1eb91b373351.html (accessed on 1 July 2019). (In Chinese).
- Liu, C.; Zheng, H. Trend analysis of hydrological components in the Yellow River basin. J. Nat. Resour. 2003, 18, 130–135. [Google Scholar]
- Zhang, Q.; Xu, C.Y.; Yang, T. Variability of water resource in the Yellow River Basin of past 50 years, China. Water Resour. Manag. 2009, 23, 1157–1170. [Google Scholar] [CrossRef]
- Stocker, T.F.; Qin, D.; Plattner, G.K.; Tignor, M.M.B.; Allen, S.K.; Boschung, J.; Nauels, A.; Xia, Y.; Bex, V.; Midgley, P.M. Climate Change 2013: The Physical Science Basis; Cambridge University Press: Cambridge, UK, 2013. [Google Scholar]
- Tian, Q.; Yang, S. Regional climatic response to global warming: Trends in temperature and precipitation in the Yellow, Yangtze and Pearl River basins since the 1950s. Quat. Int. 2017, 440, 1–11. [Google Scholar] [CrossRef]
- Xue, S. Summary of Yellow River Basin Integrated Water Resources Plan. China Water Resour. 2011, 23, 108–111. [Google Scholar]
- Wang, B.C.; Liu, H.M.; Xu, L.J. Demonstration and Determination of the Main Technical Indicators of Soil and Water Conservation Planning of Yellow River Basin. Yellow River 2013, 35, 127–130. [Google Scholar]
- Carriquiry, J.D.; Sánchez, A. Sedimentation in the Colorado River delta and Upper Gulf of California after nearly a century of discharge loss. Mar. Geol. 1999, 158, 125–145. [Google Scholar] [CrossRef]
- Patil, R.; Wei, Y.; Pullar, D.; Shulmeister, J. Understanding hydro-ecological surprises for riverine ecosystem management. Curr. Opin. Environ. Sustain. 2018, 33, 142–150. [Google Scholar] [CrossRef]
- Stanley, D.J.; Warne, A.G. Nile Delta: Recent Geological Evolution and Human Impact. Science 1993, 260, 628–634. [Google Scholar] [CrossRef] [PubMed]
- Zhang, Q.; Yang, Z.; Hao, X.; Ping, Y. Conversion features of evapotranspiration responding to climate warming in transitional climate regions in northern China. Clim. Dyn. 2019, 52, 3891–3903. [Google Scholar] [CrossRef]
- Li, H. Feasibility analysis of “Sky River Project” based on manual intervention of transport track. Jiangsu Sci. Technol. Inf. 2019, 36, 73–76. [Google Scholar]
- Giosan, L.; Syvitski, J.; Constantinescu, S.; Day, J. Climate change: Protect the world’s deltas. Nature 2014, 516, 31. [Google Scholar] [CrossRef] [Green Version]
- Humborg, C.; Ittekkot, V.; Cociasu, A.; Bodungen, B.V. Effect of Danube River dam on Black Sea biogeochemistry and ecosystem structure. Nature 1997, 386, 385–388. [Google Scholar] [CrossRef]
- Syvitski, J.P.M.; Vörösmarty, C.J.; Kettner, A.J.; Pamela, G. Impact of humans on the flux of terrestrial sediment to the global coastal ocean. Science 2005, 308, 376–380. [Google Scholar] [CrossRef]
- Pereira, E.; Quintella, B.R.; Mateus, C.S.; Alexandre, C.M.; Belo, A.F.; Telhado, A.; Quadrado, M.F.; Almeida, P.R. Performance of a Vertical-Slot Fish Pass for the Sea Lamprey Petromyzon marinus L. and Habitat Recolonization: Performance of a Fish Pass for Sea Lamprey. River Res. Appl. 2016, 33, 16–26. [Google Scholar] [CrossRef]
- Wang, S.; Fu, B.; Piao, S.; Lü, Y.; Ciais, P.; Feng, X.; Wang, Y. Reduced sediment transport in the Yellow River due to anthropogenic changes. Nat. Geosci. 2016, 9, 38–42. [Google Scholar] [CrossRef]
- Chu, Z.X.; Sun, X.G.; Zhai, S.K.; Xu, K.H. Changing pattern of accretion/erosion of the modern Yellow River (Huanghe) subaerial delta, China: Based on remote sensing images. Mar. Geol. 2006, 227, 13–30. [Google Scholar] [CrossRef]
- Cui, B.; Yang, Q.; Yang, Z.; Zhang, K. Evaluating the ecological performance of wetland restoration in the Yellow River Delta, China. Ecol. Eng. 2009, 35, 1090–1103. [Google Scholar] [CrossRef]
- Wang, M.; Qi, S.; Zhang, X. Wetland loss and degradation in the Yellow River Delta, Shandong Province of China. Environ. Earth Sci. 2012, 67, 185–188. [Google Scholar] [CrossRef]
- Fan, H.; Huang, H. Response of coastal marine eco-environment to river fluxes into the sea: A case study of the Huanghe (Yellow) River mouth and adjacent waters. Mar. Environ. Res. 2008, 65, 378–387. [Google Scholar] [CrossRef] [Green Version]
- Li, F.; Zhang, X. Impact of human activity on “Marine Big Environment” and protective tactics. Mar. Sci. 2000, 24, 6–8. [Google Scholar]
- Wang, B.; Ding, Q. Changes in global monsoon precipitation over the past 56 years. Geophys. Res. Lett. 2006, 33, 272–288. [Google Scholar] [CrossRef] [Green Version]
- Choudhury, B.J. Global pattern of potential evaporation calculated from the Penman-Monteith equation using satellite and assimilated data. Remote Sens. Environ. 1997, 61, 64–81. [Google Scholar] [CrossRef]
- Foley, J.A.; DeFries, R.; Asner, G.P.; Barford, C.; Bonan, G.; Carpenter, S.R.; Chapin, F.S.; Coe, M.T.; Daily, G.C.; Gibbs, H.K.; et al. Global consequences of land use. Science 2005, 309, 570–574. [Google Scholar] [CrossRef] [Green Version]
- Gocic, M.; Trajkovic, S. Analysis of changes in meteorological variables using Mann-Kendall and Sen’s slope estimator statistical tests in Serbia. Glob. Planet. Chang. 2013, 100, 172–182. [Google Scholar] [CrossRef]
- Wu, C.S.; Yang, S.L.; Lei, Y.P. Quantifying the anthropogenic and climatic impacts on water discharge and sediment load of the Pearl River (Zhujiang), China (1954–2009). J. Hydrol. 2012, 452, 190–204. [Google Scholar] [CrossRef] [Green Version]
- Jia, J. Dam Construction in China; China Water and Power Press: Beijing, China, 2013. [Google Scholar]


| Variables | Tannaihai | Lanzhou | Toudaoguai | Longmen | Tongguan | Huayuankou | Lijin | |
|---|---|---|---|---|---|---|---|---|
| Downstream distance from headwater (km) | 1553 | 2096 | 3472 | 4195 | 4350 | 4678 | 5464 | |
| Precipitation water (km3/yr) | 1957–1966 | 62.7 | 109 | 150 | 206 | 312 | 345 | 361 |
| 2007–2016 | 67.2 | 114 | 145 | 209 | 305 | 334 | 348 | |
| Change (%) | 7.1 | 5.7 | 3.1 | 1.5 | −2.3 | −3.2 | −3.5 | |
| Streamflow (km3/yr) | 1957–1966 | 19.6 | 33.4 | 24.8 | 31.6 | 43.7 | 48.0 | 47.5 |
| 2007–2016 | 20.0 | 20.2 | 18.0 | 19.7 | 24.4 | 26.7 | 17.1 | |
| Change (%) | 2.2 | −9.6 | −27.1 | −37.7 | −44.2 | −44.3 | 64.0 | |
© 2020 by the authors. Licensee MDPI, Basel, Switzerland. This article is an open access article distributed under the terms and conditions of the Creative Commons Attribution (CC BY) license (http://creativecommons.org/licenses/by/4.0/).
Share and Cite
Yang, S.L.; Shi, B.; Fan, J.; Luo, X.; Tian, Q.; Yang, H.; Chen, S.; Zhang, Y.; Zhang, S.; Shi, X.; et al. Streamflow Decline in the Yellow River along with Socioeconomic Development: Past and Future. Water 2020, 12, 823. https://doi.org/10.3390/w12030823
Yang SL, Shi B, Fan J, Luo X, Tian Q, Yang H, Chen S, Zhang Y, Zhang S, Shi X, et al. Streamflow Decline in the Yellow River along with Socioeconomic Development: Past and Future. Water. 2020; 12(3):823. https://doi.org/10.3390/w12030823
Chicago/Turabian StyleYang, Shi Lun, Benwei Shi, Jiqing Fan, Xiangxin Luo, Qing Tian, Haifei Yang, Shenliang Chen, Yingxin Zhang, Saisai Zhang, Xuefa Shi, and et al. 2020. "Streamflow Decline in the Yellow River along with Socioeconomic Development: Past and Future" Water 12, no. 3: 823. https://doi.org/10.3390/w12030823