Article

Assessment of Flood Inundation by Coupled 1D/2D Hydrodynamic Modeling: A Case Study in Mountainous Watersheds along the Coast of Southeast China

1
Department of Hydrology and Water Resource, Hohai University, Nanjing 210098, China
2
The State Key Laboratory of Hydrology-Water Resources and Hydraulic Engineering, Hohai University, Nanjing 210098, China
3
Hydrology and Water Resources Department, Nanjing Hydraulic Research Institute, Nanjing 210029, China
4
The State Key Laboratory of Hydrology-Water Resources and Hydraulic Engineering, Nanjing Hydraulic Research Institute, Nanjing 210029, China
*
Author to whom correspondence should be addressed.
Water 2020, 12(3), 822; https://doi.org/10.3390/w12030822
Submission received: 13 February 2020 / Revised: 3 March 2020 / Accepted: 9 March 2020 / Published: 14 March 2020
(This article belongs to the Section Hydrology)

Abstract

:
Mountain flood disasters in China’s southeastern coastal watershed are not predictable and are sudden. With rapid urbanization and development in the middle and lower reaches of the region, the accumulation of wealth and population has magnified the flood risk. Exploring flood numerical simulation technology suitable for the rapid economic development of mountainous basins, effective flood models are the key tools for controlling and mitigating flood disasters. In this paper, we established a 1D/2D real-time dynamic coupling hydraulic model, aimed at exploring the applicability of the model in flood simulation of mountainous river basins with rapid economic development. The Luojiang River Basin (Huazhou Section) in Guangdong Province was used as the case study. The model’s ability was validated against the 22 July 2010 and 14 August 2013 inundation events that occurred there. The simulation results show that the output of the flood model is highly similar to the observation and survey results of historical flood events. The research results prove that the 1D/2D coupling model is not only an applicable tool for exploring flood spread characteristics such as flood range, velocity, depth, arrival time, and duration, but also can feed back the impact of water conservancy projects such as dikes on flood spread in the basin. It is of great significance to effectively guide the comprehensive design and management of subsequent wading projects in mountain river basins, and to improve flood prevention and disaster reduction capabilities in mountain areas.

1. Introduction

Mountain torrent disasters refer to the flood disasters caused by rainfall in hilly areas and the debris flows and landslides caused by mountain torrents, which cause losses to the national economy and people’s lives and property [1,2,3]. Hilly areas account for 70% of the total land area in China. Most provinces (regions and cities) in China have hilly areas [4], which are more or less threatened by mountain torrents. Mountain torrents, debris flows and landslides often cause casualties, damage to houses, fields, roads and bridges in the basin, cause river blockages, and form barrier lakes, which pose a great threat to people’s lives and property in the lake area and downstream areas. The following problems can be found from the analysis of mountain torrents and their losses [5,6,7].
(1) Because of the small catchment area and channel storage capacity and steep slope, floods in hilly areas generally have the characteristics of short duration, high peak, concentrated water volume and great destructive power.
(2) The death rate of mountain torrents is higher than that of flood disasters. According to the “China Bulletin on Flood and Drought Disasters 2017”, the proportion of deaths caused by mountain torrents in China exceeded 50% of the total deaths caused by floods in 1991–2017, and the proportion has increased significantly since 1998 (Figure 1). From the analysis of the causes, there was no obvious change in the death toll from mountain torrents in China from 1991 to 2007, but from 2008 to 2017, the death toll from mountain torrents in China decreased significantly, with a large number in 2010 alone [8]. Meanwhile, after 1998, deaths from flood disasters in China decreased significantly. Therefore, the proportion of the deaths from mountain torrents to the total death toll from flood disasters increased significantly.
(3) The construction of flood control projects is difficult. In areas at high risk of mountain torrents and geological disasters, it is not economical to build dikes [9], and the topographic conditions needed to build reservoirs and flood storage and detention areas are generally not available in these areas [10].
Throughout the relevant theories, technologies and practices of mountain torrents prevention all over the world, the understanding of triggering factors and formation mechanism of mountain torrents is still at a relatively macro level and partial qualitative level [11,12,13]. In recent years, systematic research on the formation and disaster-causing dynamics of flash floods in small watersheds, and research on the dynamic characteristics of flash floods [14] and simulation methods and technologies [15] have received widespread attention. In the southeastern coastal watershed in particular, while retaining the natural characteristics of mountainous areas, the rapid economic development in the middle and lower reaches, the accumulation of wealth and the population has magnified the flood risk. Aiming at the rapid development of mountain-type basins in the economy, mature and effective flood numerical simulation technology is explored. Studying this issue can not only improve hydrological theory, but also provide the necessary basis and support for detailed warnings of mountain flood disaster risks.
Because of the limitation of natural and data conditions, the simplest illustration of a floodplain flow is to represent the flow as one-dimensional along the river channel. In early related research, hydrological methods [16,17,18] with clear physical meanings or a one-dimensional hydraulic model [19,20] perform simulation analysis of a flood process. These models are computationally efficient and flexible to set up but are subjected to modeling limitations, such as the inability to simulate flood wave lateral diffusion. This is because during the mountain flood disaster, due to the complex topography of the mountainous area, the river water level rises sharply, which can easily cause the river embankment to break and overflow. When water begins to overflow, it becomes a 2D phenomenon. Compared to the 1D model, 2D models are more reliable for complex flow simulations, which have the capability for reconstructing characteristics of a high-magnitude outburst flood, and the results provide a better understating of spatial and temporal hydraulics and high-magnitude flow phenomena [21,22]. In recent years, two-dimensional hydrodynamic models have made many successful attempts at flood modeling [23,24,25]. However, only two-dimensional hydrodynamic model would face the problems of a large number of model grids and low calculation efficiency [26], which fails to achieve the purpose of rapid forecasting and early warning of floods.
The present study has aimed to combine the advantages of the two models to establish a 1D/2D real-time coupled hydrodynamic model for Luojiang River Basin in the Guangdong Province, southeast coast of China. Two typhoon flooding events of “1003” in 2010 and “1311” in 2013 were used to verify the model’s ability, and to explore the reliability and applicability of the coupled model in mountainous basins. The research results try to provide experience and suggestions for the study of flood propagation laws and numerical simulation methods in similar types of area.

2. 1D/2D Real-Time Dynamic Coupling Flood Model

2.1. 1D River Hydraulic Model

The 1D river hydraulic model uses Saint-Venant equations as governing equations:
{ A t + Q x = q Q t + x ( Q 2 A ) + g A Z x + g Q | Q | C 2 A R = 0
In this formula, x : distance coordinate; t : time coordinate; A : cross-section area; Q : total discharge; q : lateral flow; Z : water level; C : Chezy coefficient; R : hydraulic radius; g : gravity acceleration [27].
When a 1D/2D dynamic coupling model involves lateral discharge from break and overflow, side inflow should be taken into account. The process of water level and discharge in the upstream and downstream of a river is a boundary condition of the 1D/2D dynamic coupling model and lateral discharge is an internal condition of coupling between a 1D model and a 2D model [28].

2.2. 2D Flood-Routing Hydraulic Model

The 2D flood routing hydraulic model uses 2D shallow water dynamic equations as governing equations. This model is as follows:
h t + h u x + h v y = h s
h u t + h u 2 x + h v u 2 y = f v h g h η x h ρ 0 P a x g h 2 2 ρ 0 ρ x + τ s x ρ 0 τ b x ρ 0 1 P ( s x x x + s x x y ) + x ( h T x x ) + x ( h T x y ) + h u s s
h v t + h v x + h v v 2 y = f u h g h η y h ρ 0 P a y g h 2 2 ρ 0 ρ y + τ s y ρ 0 τ b y ρ 0 1 P ( s y x y + s y y x ) + x ( h T y x ) + y ( h T y y ) + h v s s
In this formula, x , y , z : Cartesian coordinate system in space; η : water level; h : still water depth; u , v are the average value of component of velocity in x , y directions respectively; P a : local atmospheric pressure; ρ : water density; ρ 0 : reference water density; f : Coriolis parameter; S x x , S x y , S y x , S y y : radiation stress component; T x x , T x y , T y x , T y y : horizontal viscous stress; τ s x , τ s y , τ b x , τ b y are components of flow shear stress in x , y directions at the boundary between water surface and riverbed respectively; S : source sink item; u s , v s : source-sink flow velocity [29].

2.3. Modified Models of Dry Water Depth and Wet Water Depth Theory

The calculation efficiency can be improved by setting dry water depth and wet water depth in the calculation process. Since flood routing simulation is a problem of shallow water flow, the water depth of each grid is relatively small. Therefore, when the water depth of the grid is less than a certain value, the attributes of the grid can be changed to improve the computational efficiency and stability. Before calculating each time step, it is necessary to judge the water depth of the grid and analyze whether the water depth of each grid reaches the dry water depth or wet water depth. When the water depth of the grid is less than that of the dry water depth, the grid will be removed directly from the calculation without being calculated in the model. When the water depth of the grid is greater than the dry water depth and less than the wet water depth, only the mass flux of the grid is calculated, and the momentum flux of the grid is neglected. When the water depth of the grid is greater than the wet water depth, the mass flux and momentum flux of the grid need to be calculated simultaneously.

2.4. Coupling of 1D and 2D Hydraulic Models

The key to the coupling of 1D and 2D hydraulic models is to find the interface between 1D and 2D models so as to keep the spatial and temporal correlations of 1D and 2D models consistent. Both 1D and 2D models have the exchange of water flow and momentum at any point-in-time. At the coupling point, 1D and 2D models are coupled by the relationship between water level and discharge.

2.4.1. Time Coupling of 1D and 2D Hydraulic Models

At T 1 point, the water level of the 1D model at the coupling point is h 11 , and that of the 2D model is h 21 . The exchange of flow and momentum at the coupling point is judged by comparing h 11 with h 21 and terrain conditions of 1D models with that of 2D models. At T 2 point, which has experienced Δ t time, the flux exchange at coupling point is Δ Q . At the same time, the outer boundary conditions of the 1D model change, and the water level changes Δ h 1 . The water level h 12 of the 1D mode at T 2 point is deduced through h 11 , Δ Q and Δ h 1 . At the same time, the external boundary water level of the 2D model changes Δ h 2 and the water level at T 2 point is deduced through h 21 , Δ Q and Δ h 2 . Similarly, the model situation can be deduced at T n point.

2.4.2. Spatial Coupling of 1D and 2D Hydraulic Models

It is necessary to define the exchange positions of flow and momentum in 1D and 2D hydraulic models for their coupling, that is, to find the mileage at the coupling point of the 1D model and the corresponding grid number of the 2D model. The river section length of the 1D river model cannot be neglected and coupling points do not necessarily locate at the junction of the river and the grid.

3. Data and Methods

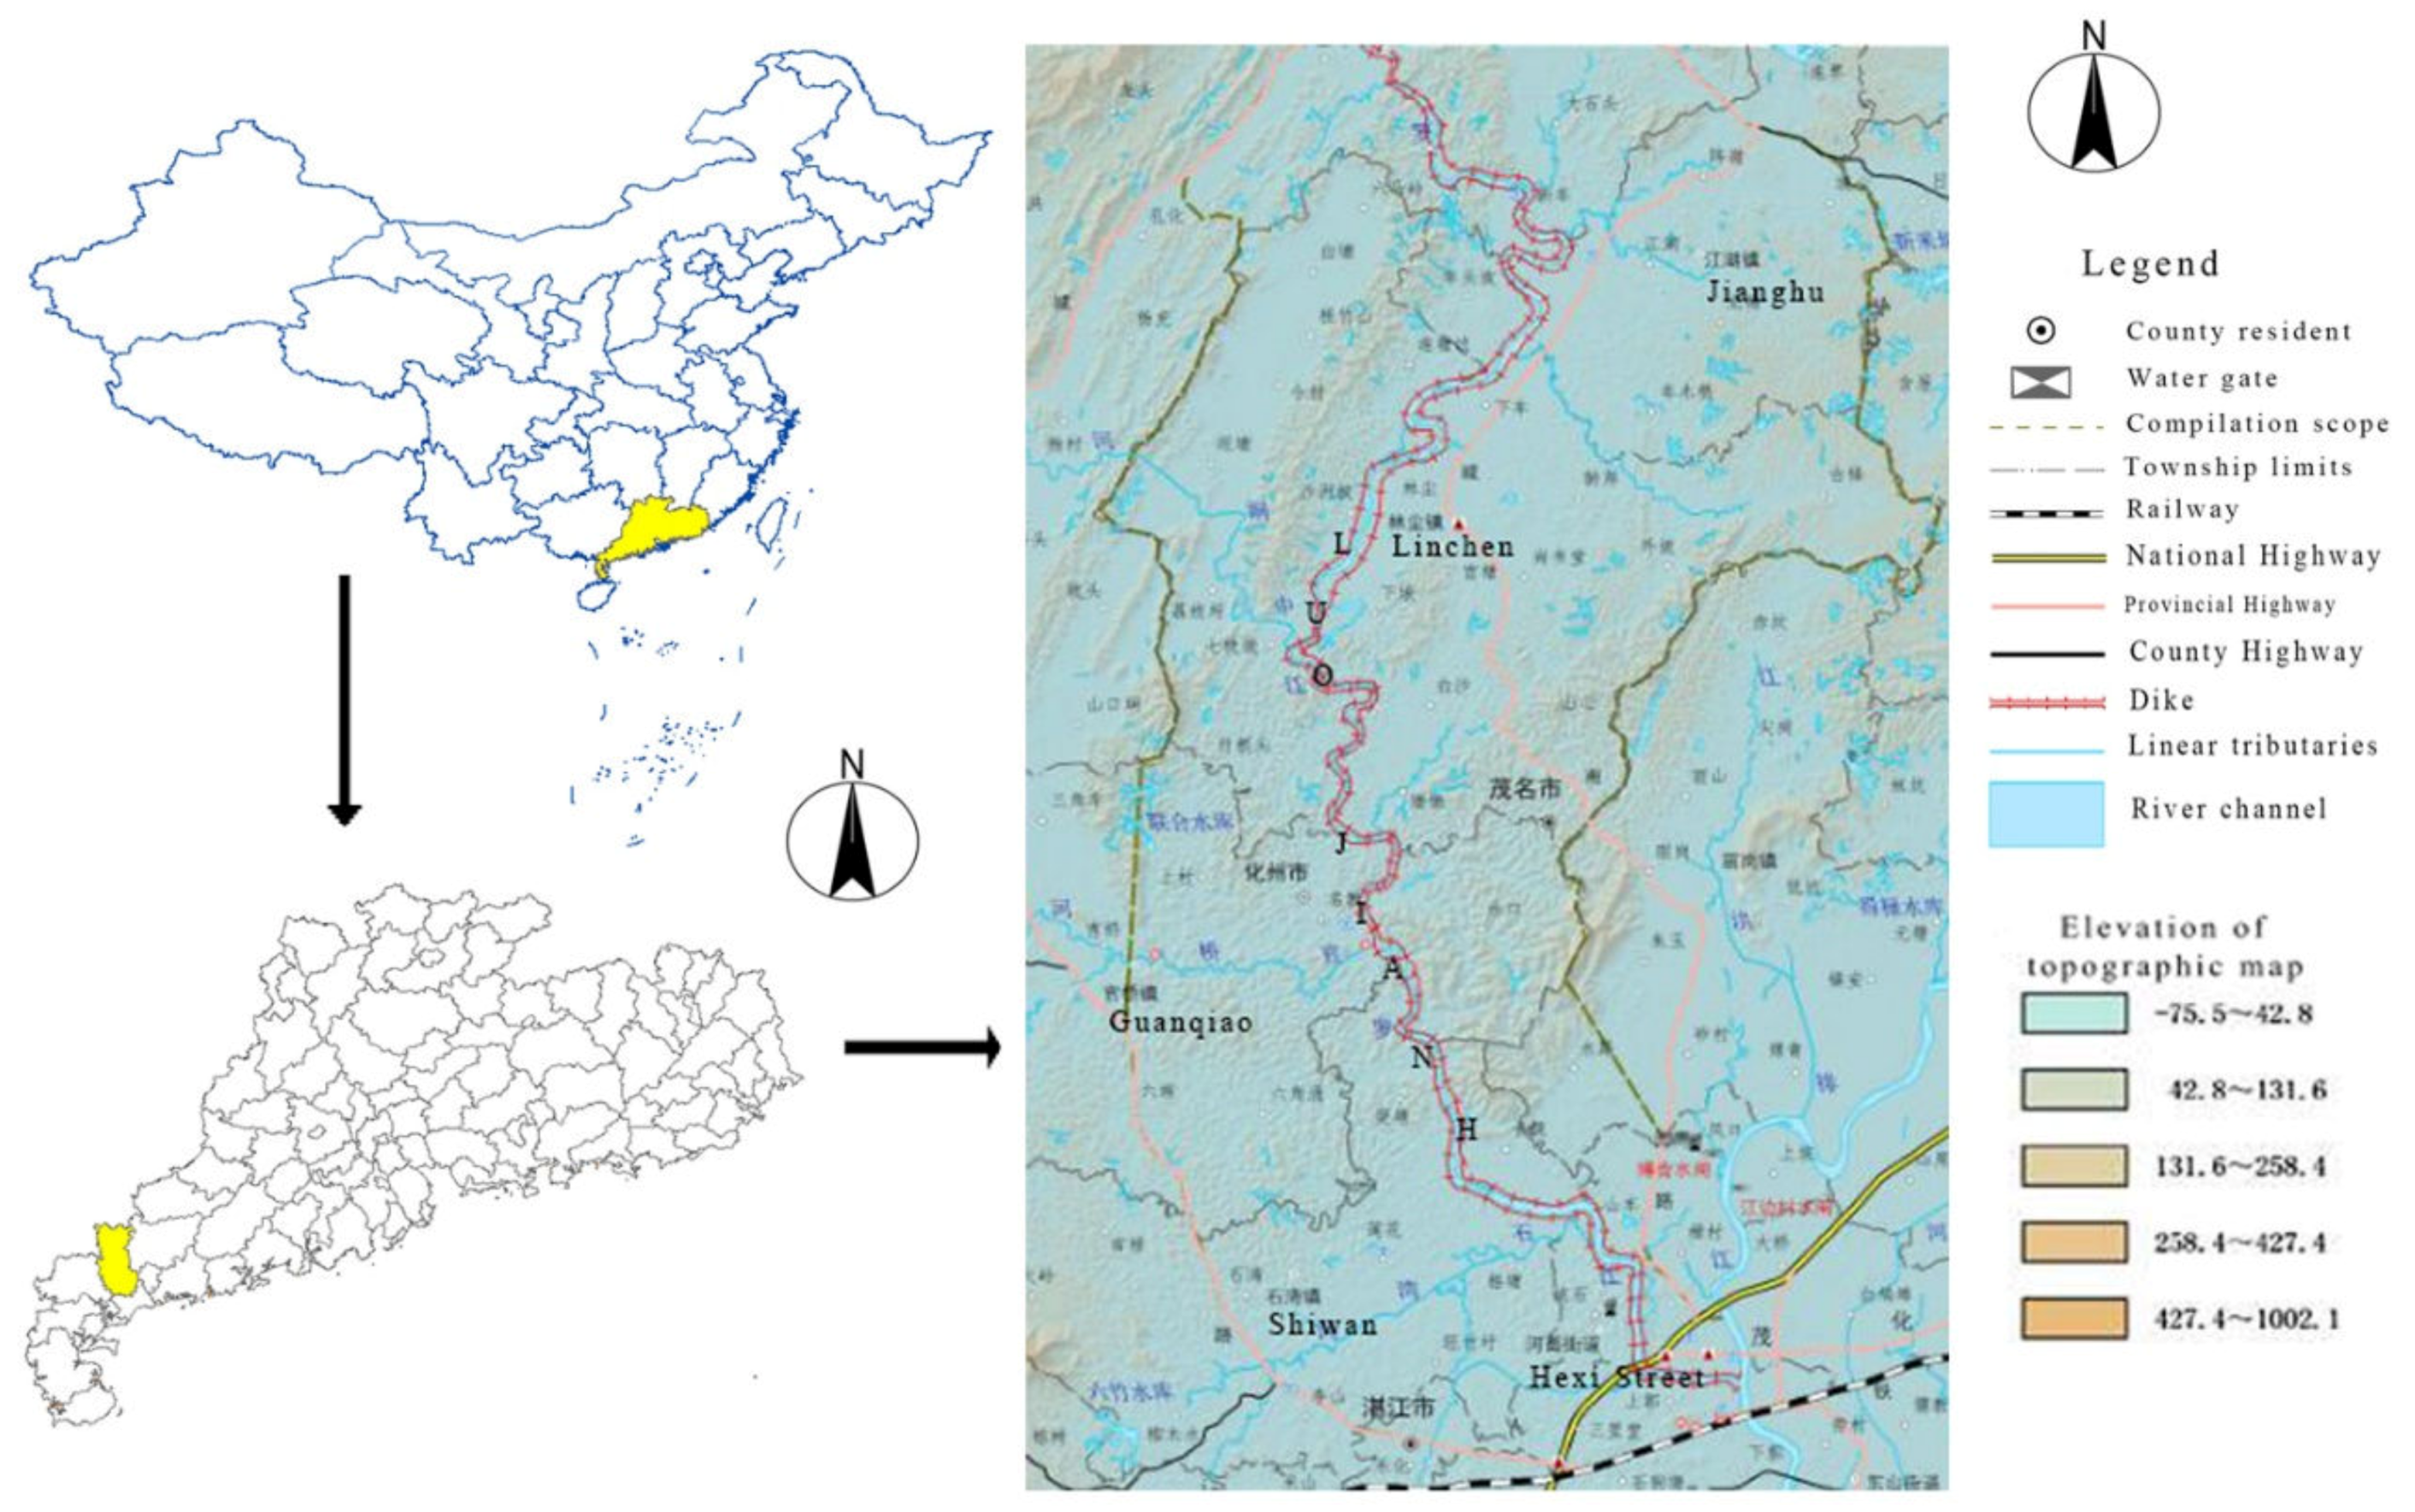
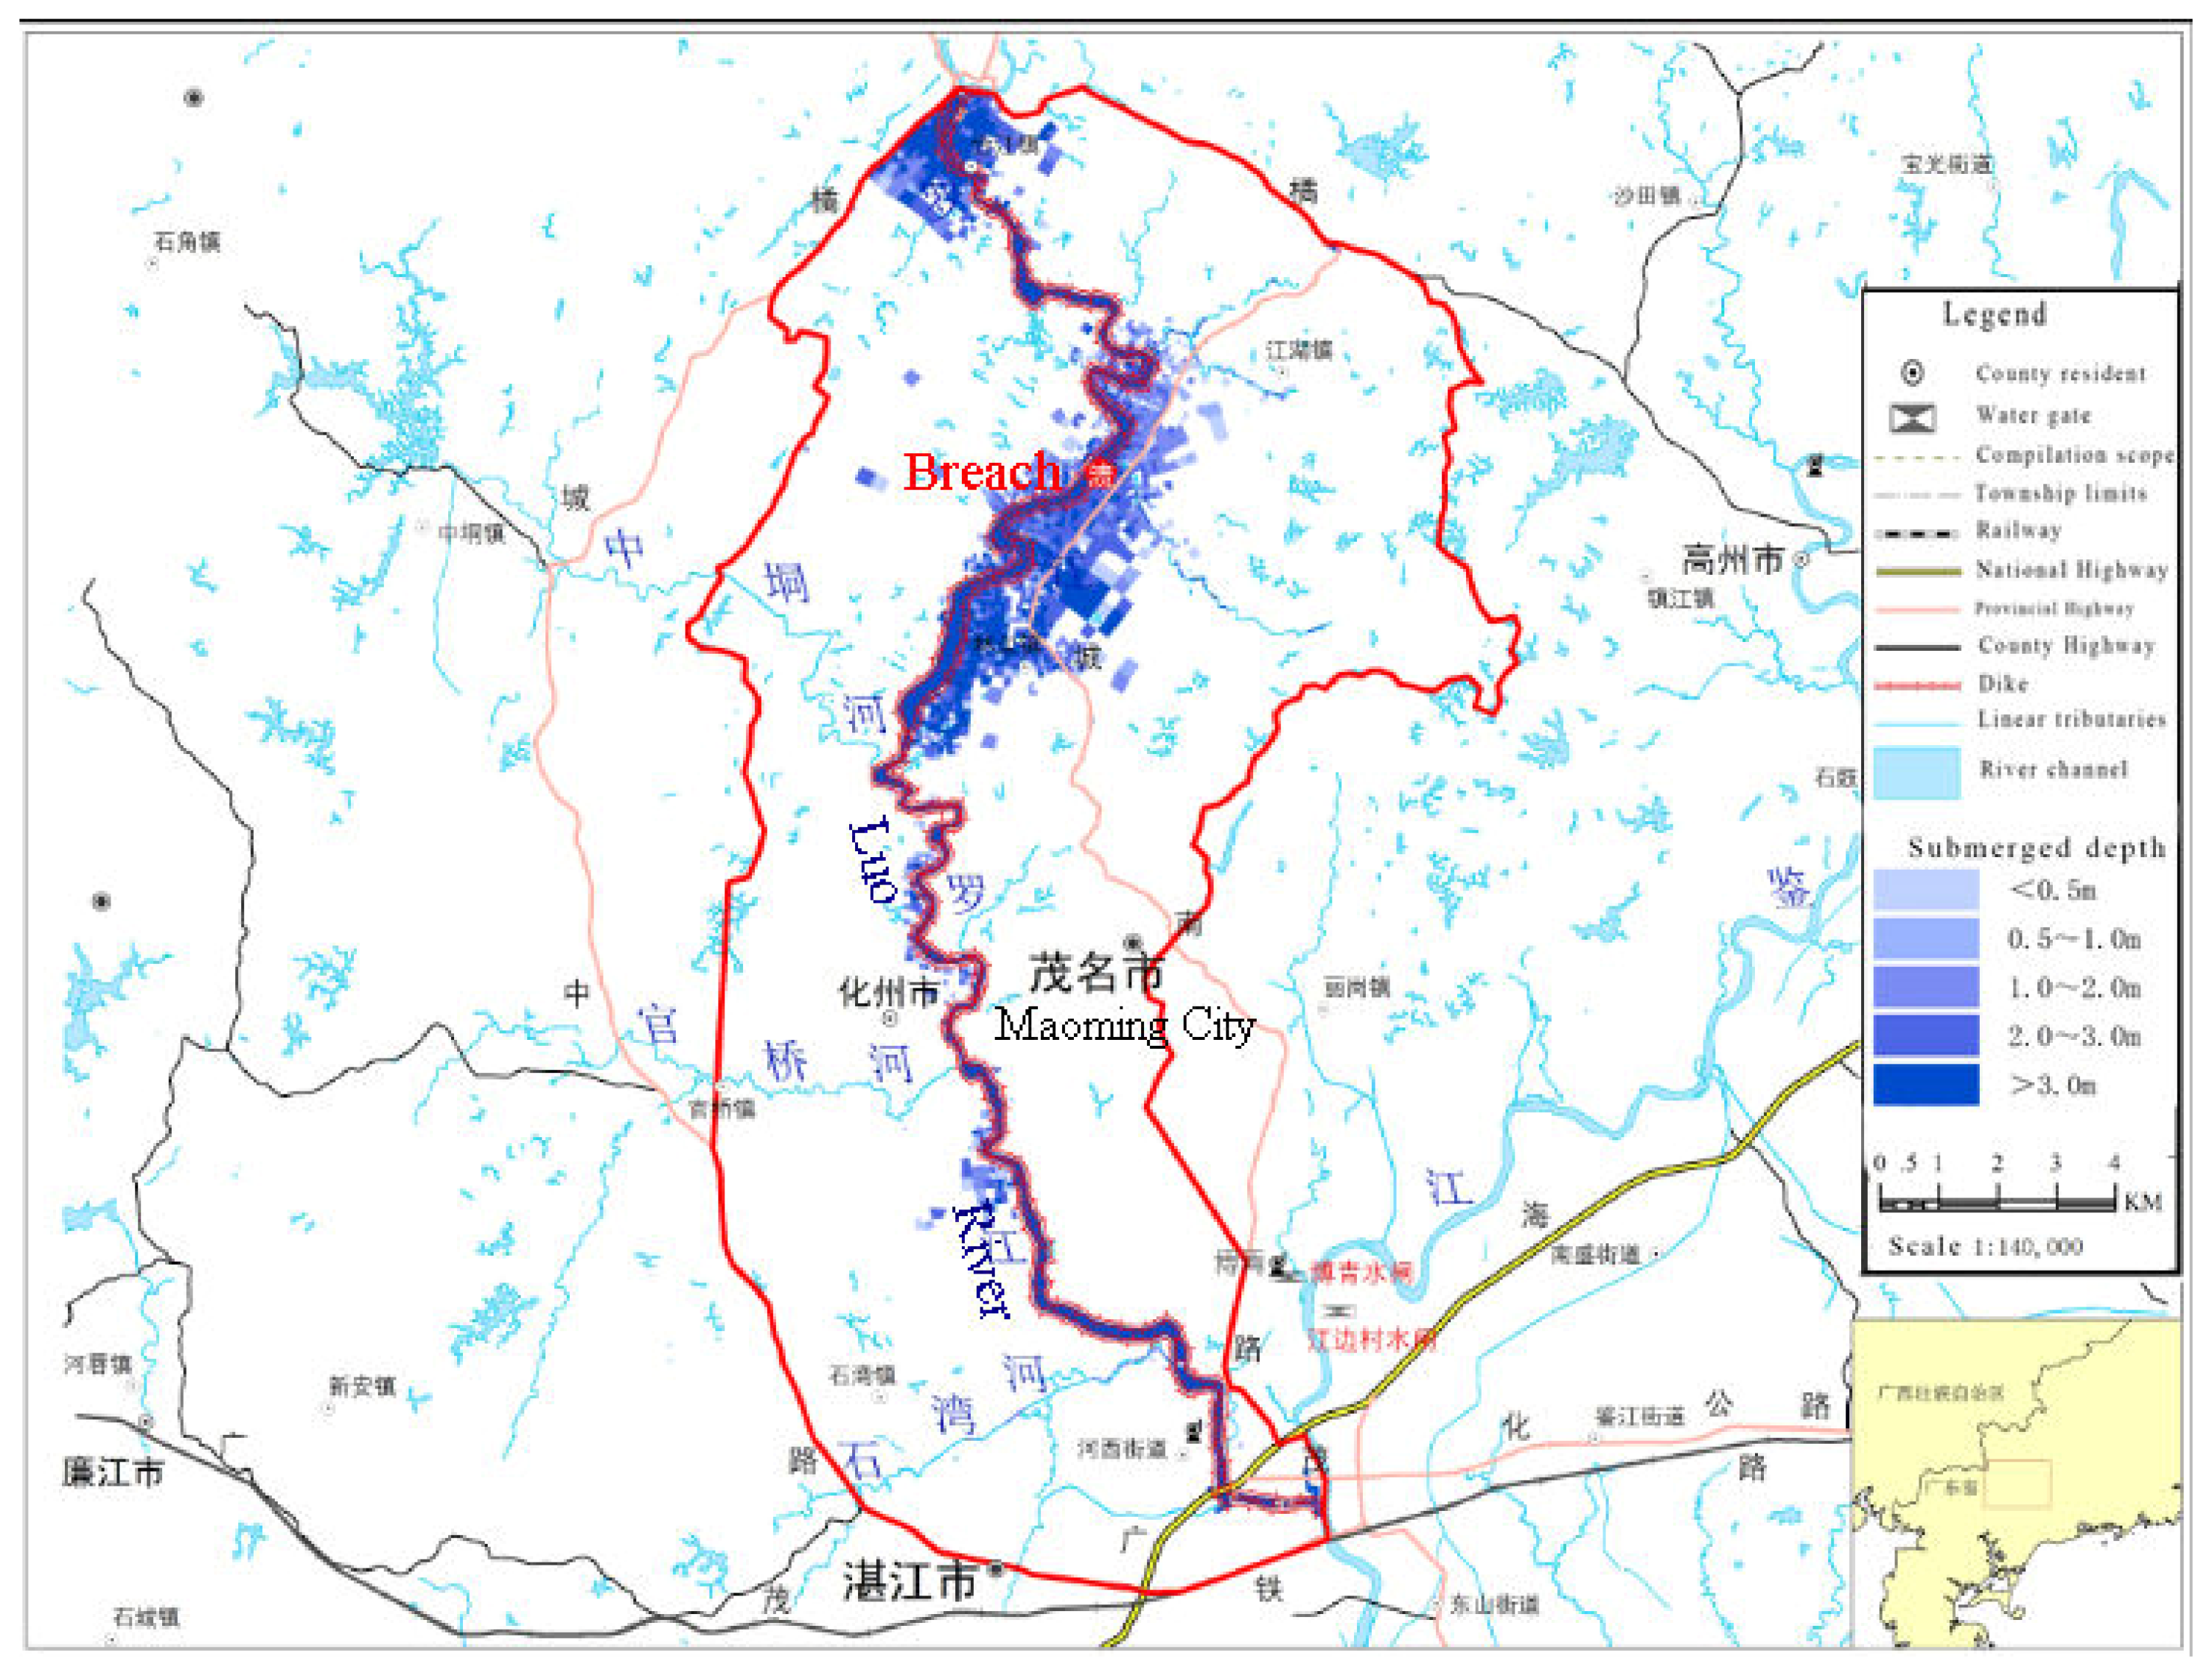
3.1. Research Domain

Luojiang River is the first-level tributary of Jianjiang River and originated in the Guangxi Zhuang Autonomous Region. It flows through Wenlou, Pingding, Hejiang, Jianghu, Linchen, Guanqiao and Huazhou City to join Jianjiang River [30]. The total length is 143 km and the catchment area is 2618 km2. Huazhou City is located in the south of the Tropic of Cancer and belongs to the subtropical monsoon climate zone. It has a long summer and warm winter, abundant light and heat, abundant rainfall and typhoons in summer and autumn. The average annual rainfall in Huazhou City is 1780 mm. It has entered the rainy season since the first 10-day period of April. The annual rainfall is mostly concentrated in April to September, accounting for about 85% of the annual rainfall. The watershed area in Huazhou was selected as the research domain, as shown in Figure 2.
Floods in this area are all caused by typhoons and rainstorms. The annual maximum floods often occur from June to September. Disastrous floods can be roughly divided into three types, short-duration local floods; medium-duration regional floods; long-lasting catchment floods [31,32].
The distinctive feature of the Luojiang River Basin is that the downstream area is represented by urban structure, and its upstream emphasizes the characteristics of natural watersheds. At present, small and medium-sized river basins in China are the key areas for flood-prevention work in various places. Therefore, dikes are built on both sides of the Luojiang River. But embankment standards are uniform. Only dykes within the urban area are constructed according to the 50-year flood standard, while the remaining dykes are only in a 20- or 10-year flood control standard.

3.2. Data

The geographical data including digital elevation model (DEM) data, rivers, roads, buildings, settlements, land/coverage data all come from the Guangdong Geographic Information Center. The data were available in high-resolution form (1:10000 scales).
Rainfall and flow data are important input conditions for model calculations. In this research, two major floods that occurred on 22nd July 2010 and 14th August 2013 were used to calibrate and validate the proposed 1D/2D model, respectively. Hydrological Bureau of Guangdong Province provided the corresponding rainfall and flow records.

3.3. Model Pre-Simulation Processing

3.3.1. Boundary Condition

The river length of the 1D model is 111.5 km. The average slope of riverbed is 4.9‰. The trend of the river course is consistent with the actual trend of the Luo River valley. Each control section is established per 1000 m in the river course. The flood discharge process of Luojiang River is adopted as the upper boundary condition of 1D modeling and the section water level process line is adopted as the lower boundary condition.

3.3.2. Selection of Roughness Value

Roughness coefficient is a parameter indicating the smoothness of steam channel and beach. The greater the coefficient of roughness value, the more obvious the resistance of flow (Table 1). The roughness value is related to the shape of the river section, the gravel properties of riverbed, the straightness of the river, the scouring of the stream channel, the construction and management of artificial buildings and many other factors. It is an important sensitive parameter for hydraulic channel calculation. In this paper, the main river course is determined by comprehensive analysis of the roughness values in the measured section data of the upper reaches and the roughness tables of natural rivers. Roughness value ranges from 0.02 to 0.032 [33,34].

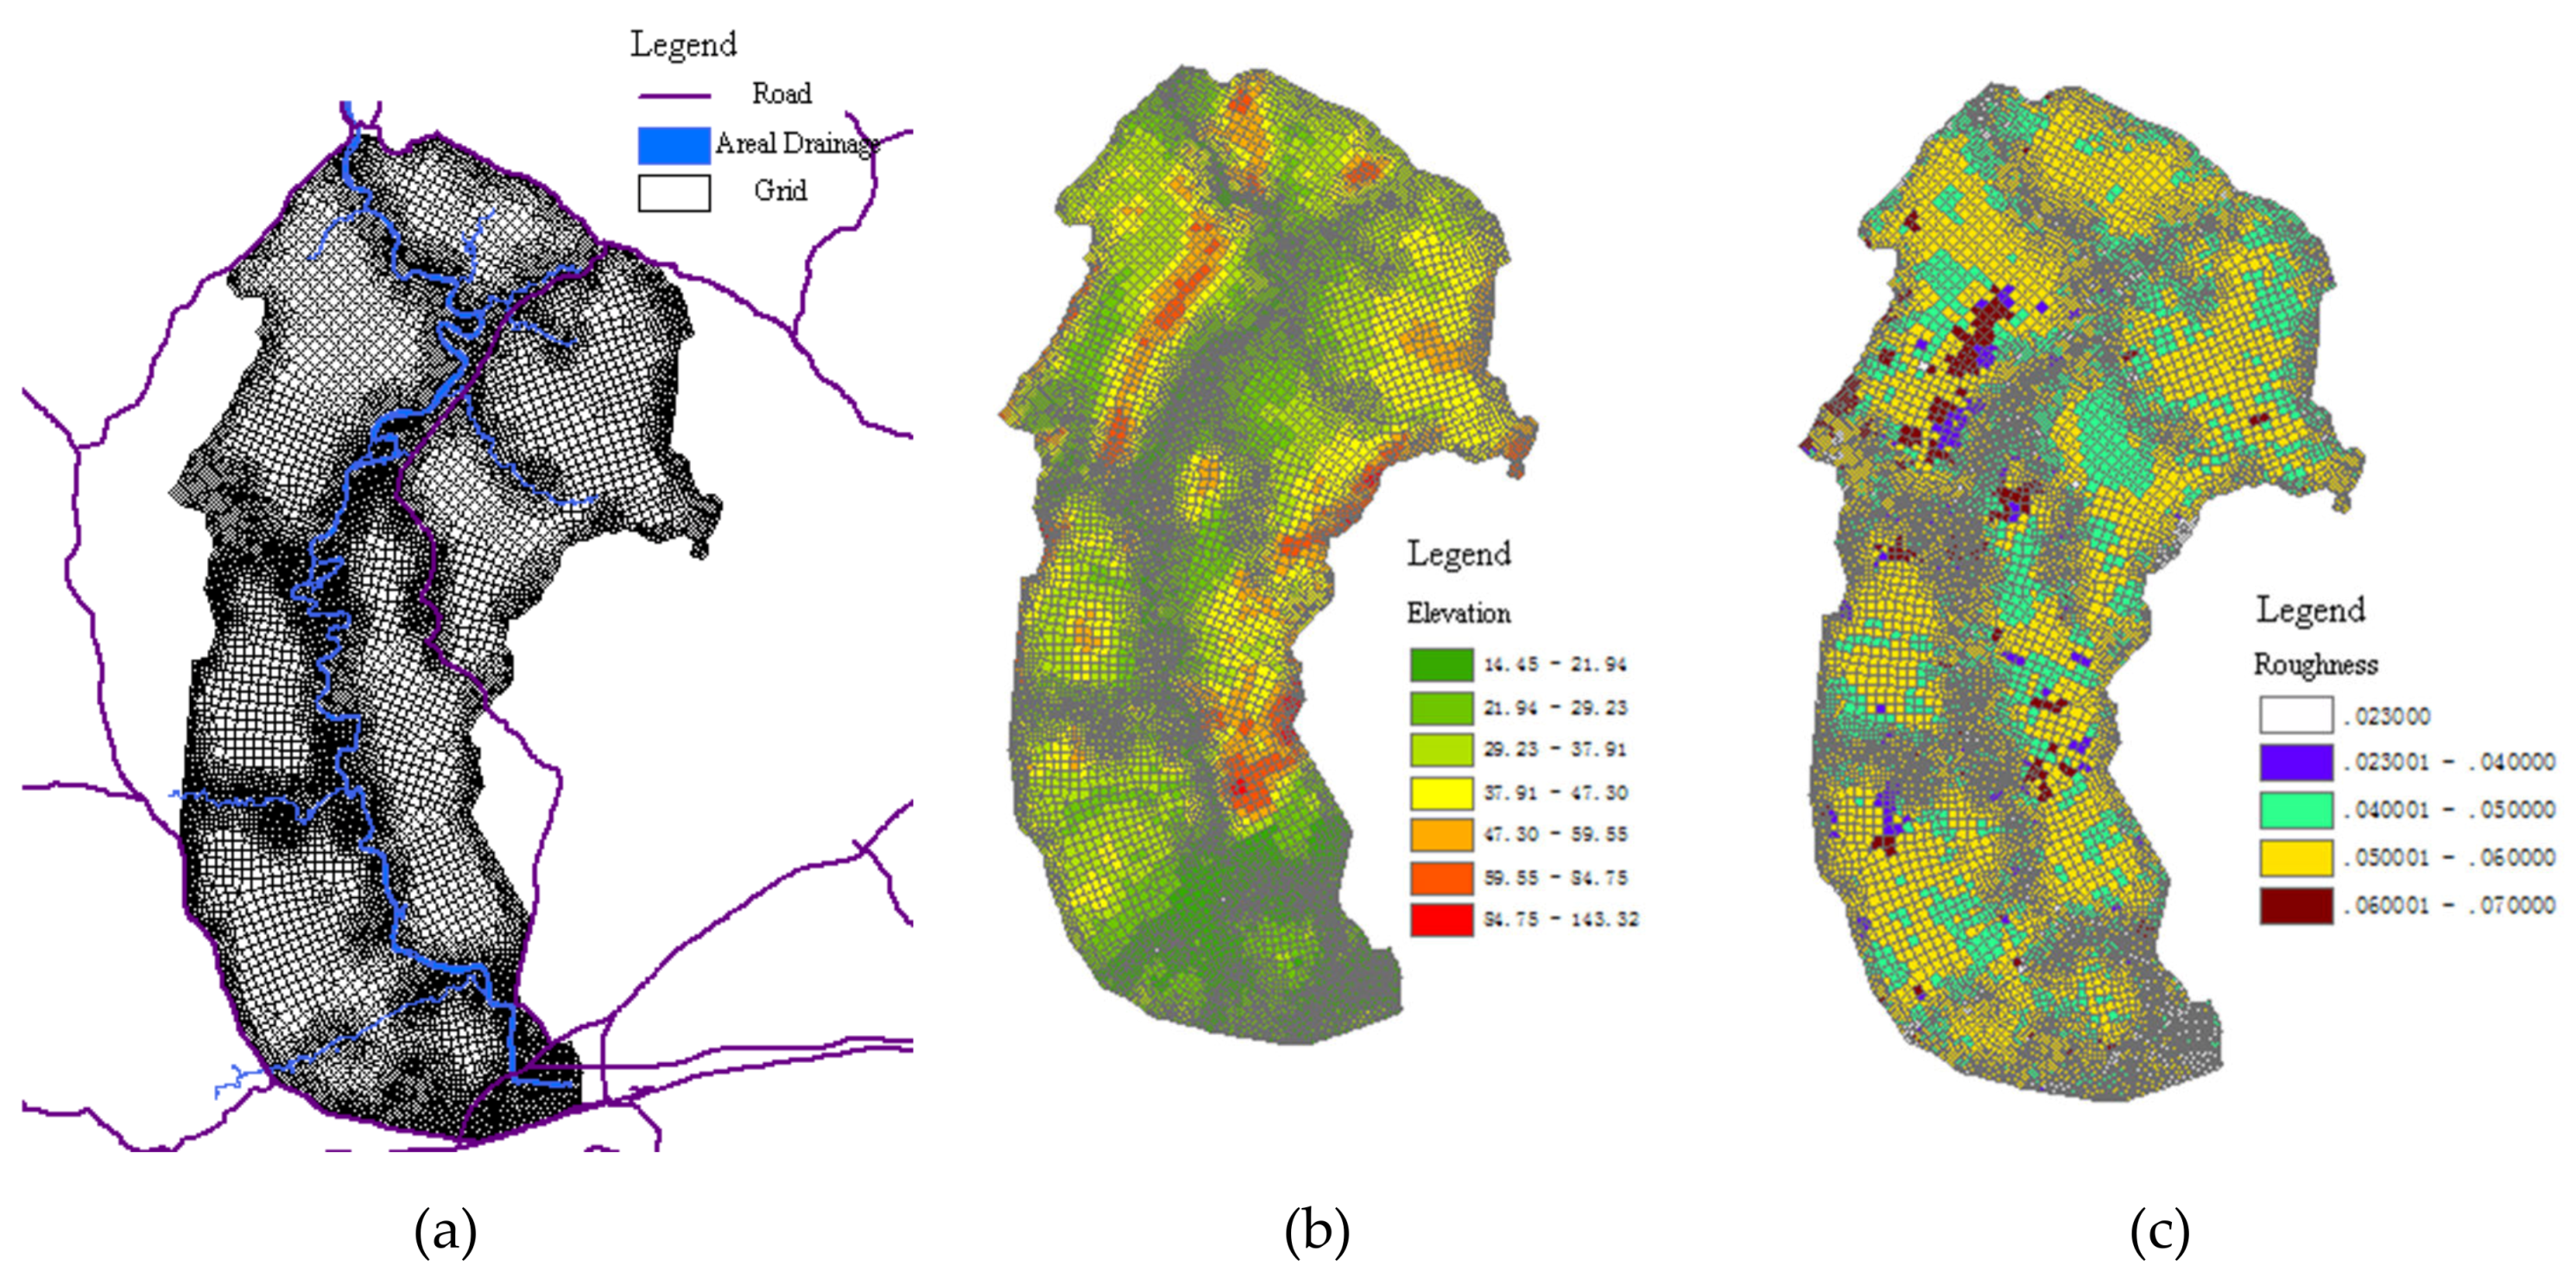
3.3.3. 2D Computation Mesh Construction

The key of the 2D model is terrain data, and the accuracy of terrain description depends on the meshing of terrain. The size and shape of unstructured meshes have a great influence on terrain evaluation [35]. If the size of mesh is too large, the change of terrain may not be generalized and the surrounding terrain will be flattened, resulting in the distortion of the terrain. If the size of mesh is too small, it will cause a huge load on the calculation of the model and easily lead to model divergence. In this paper, firstly, the maximum mesh area and the minimum angle are determined according to the size of the study area; then, an appropriate grid should be refined in economic and population-intensive areas; in the final calculation scheme, the number of grid cells reached 17,009, the average area is 0.02 km2, and the average side length is 180 m. Both the calculation accuracy and efficiency are taken into account. In the process of meshing, the role of important water-blocking structures is taken into account, and important roads and dikes are used as control boundaries. After the meshing is completed, the digital elevation model, land use and high-resolution remote-sensing images are used to attach corresponding attribute values to the mesh, and the final mesh model is determined by trial calculation and optimization adjustment. The grid division and main parameter settings are shown in Figure 3.

4. Results and Analysis

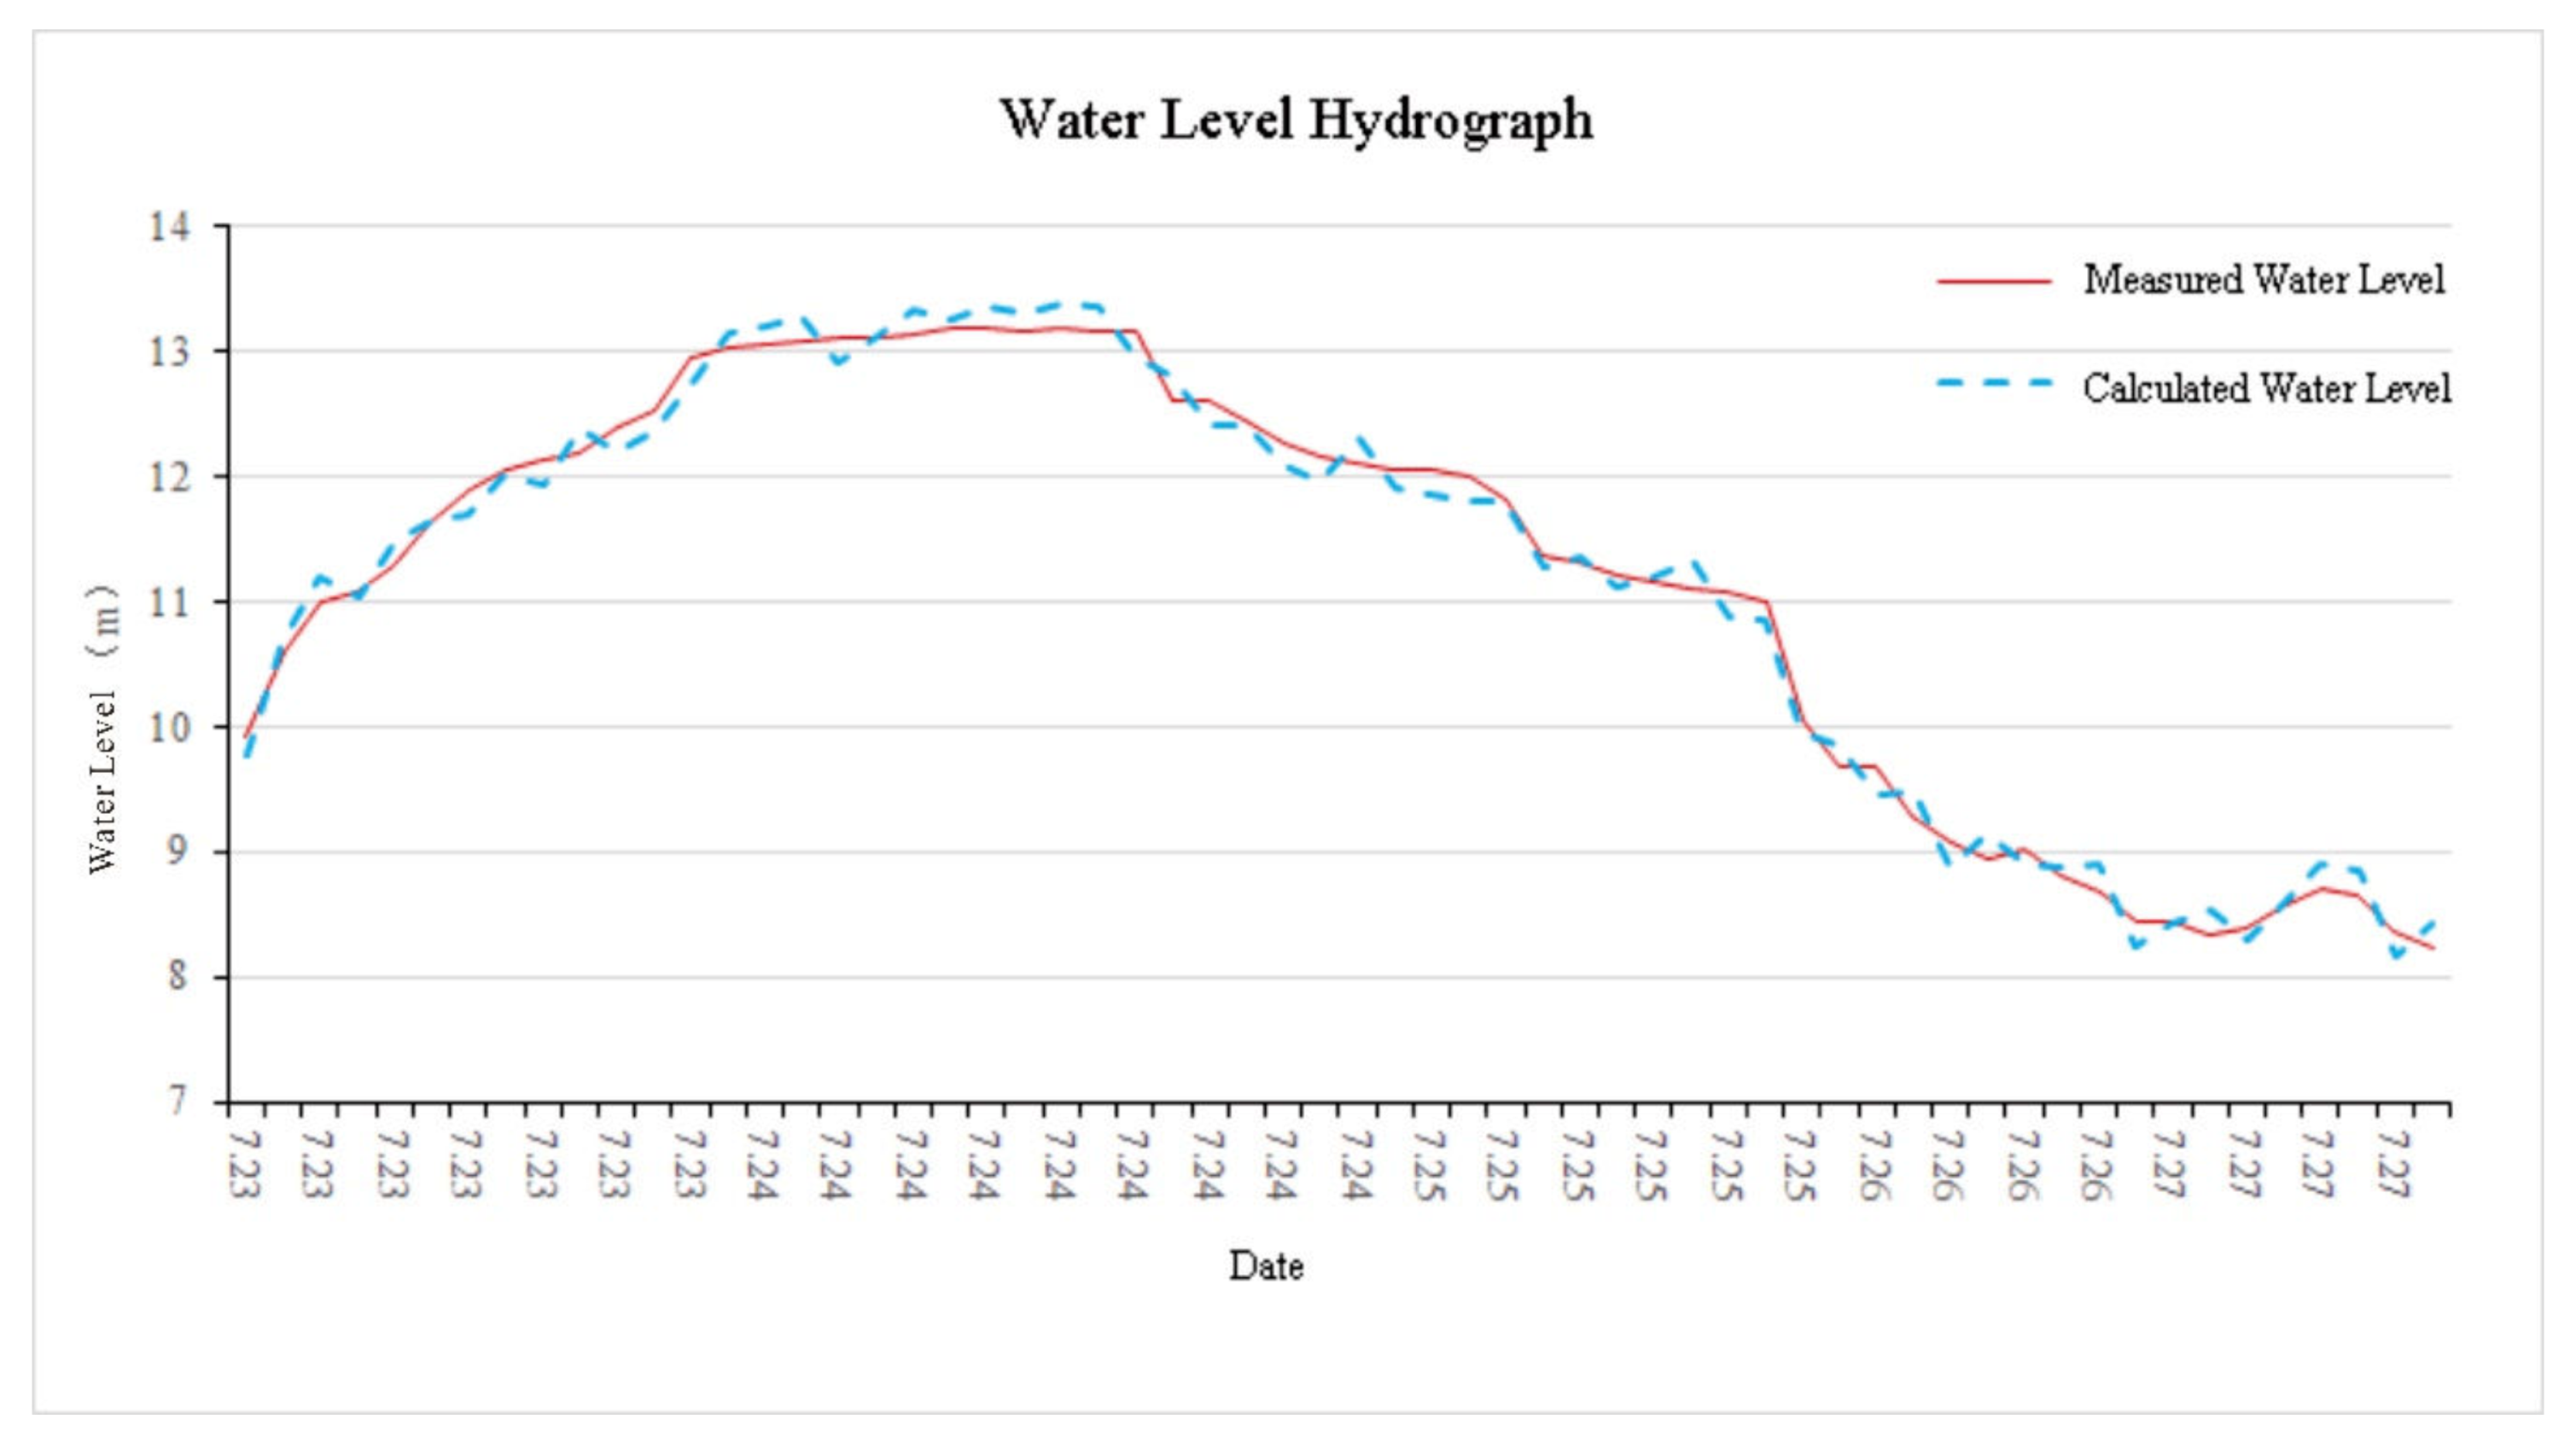
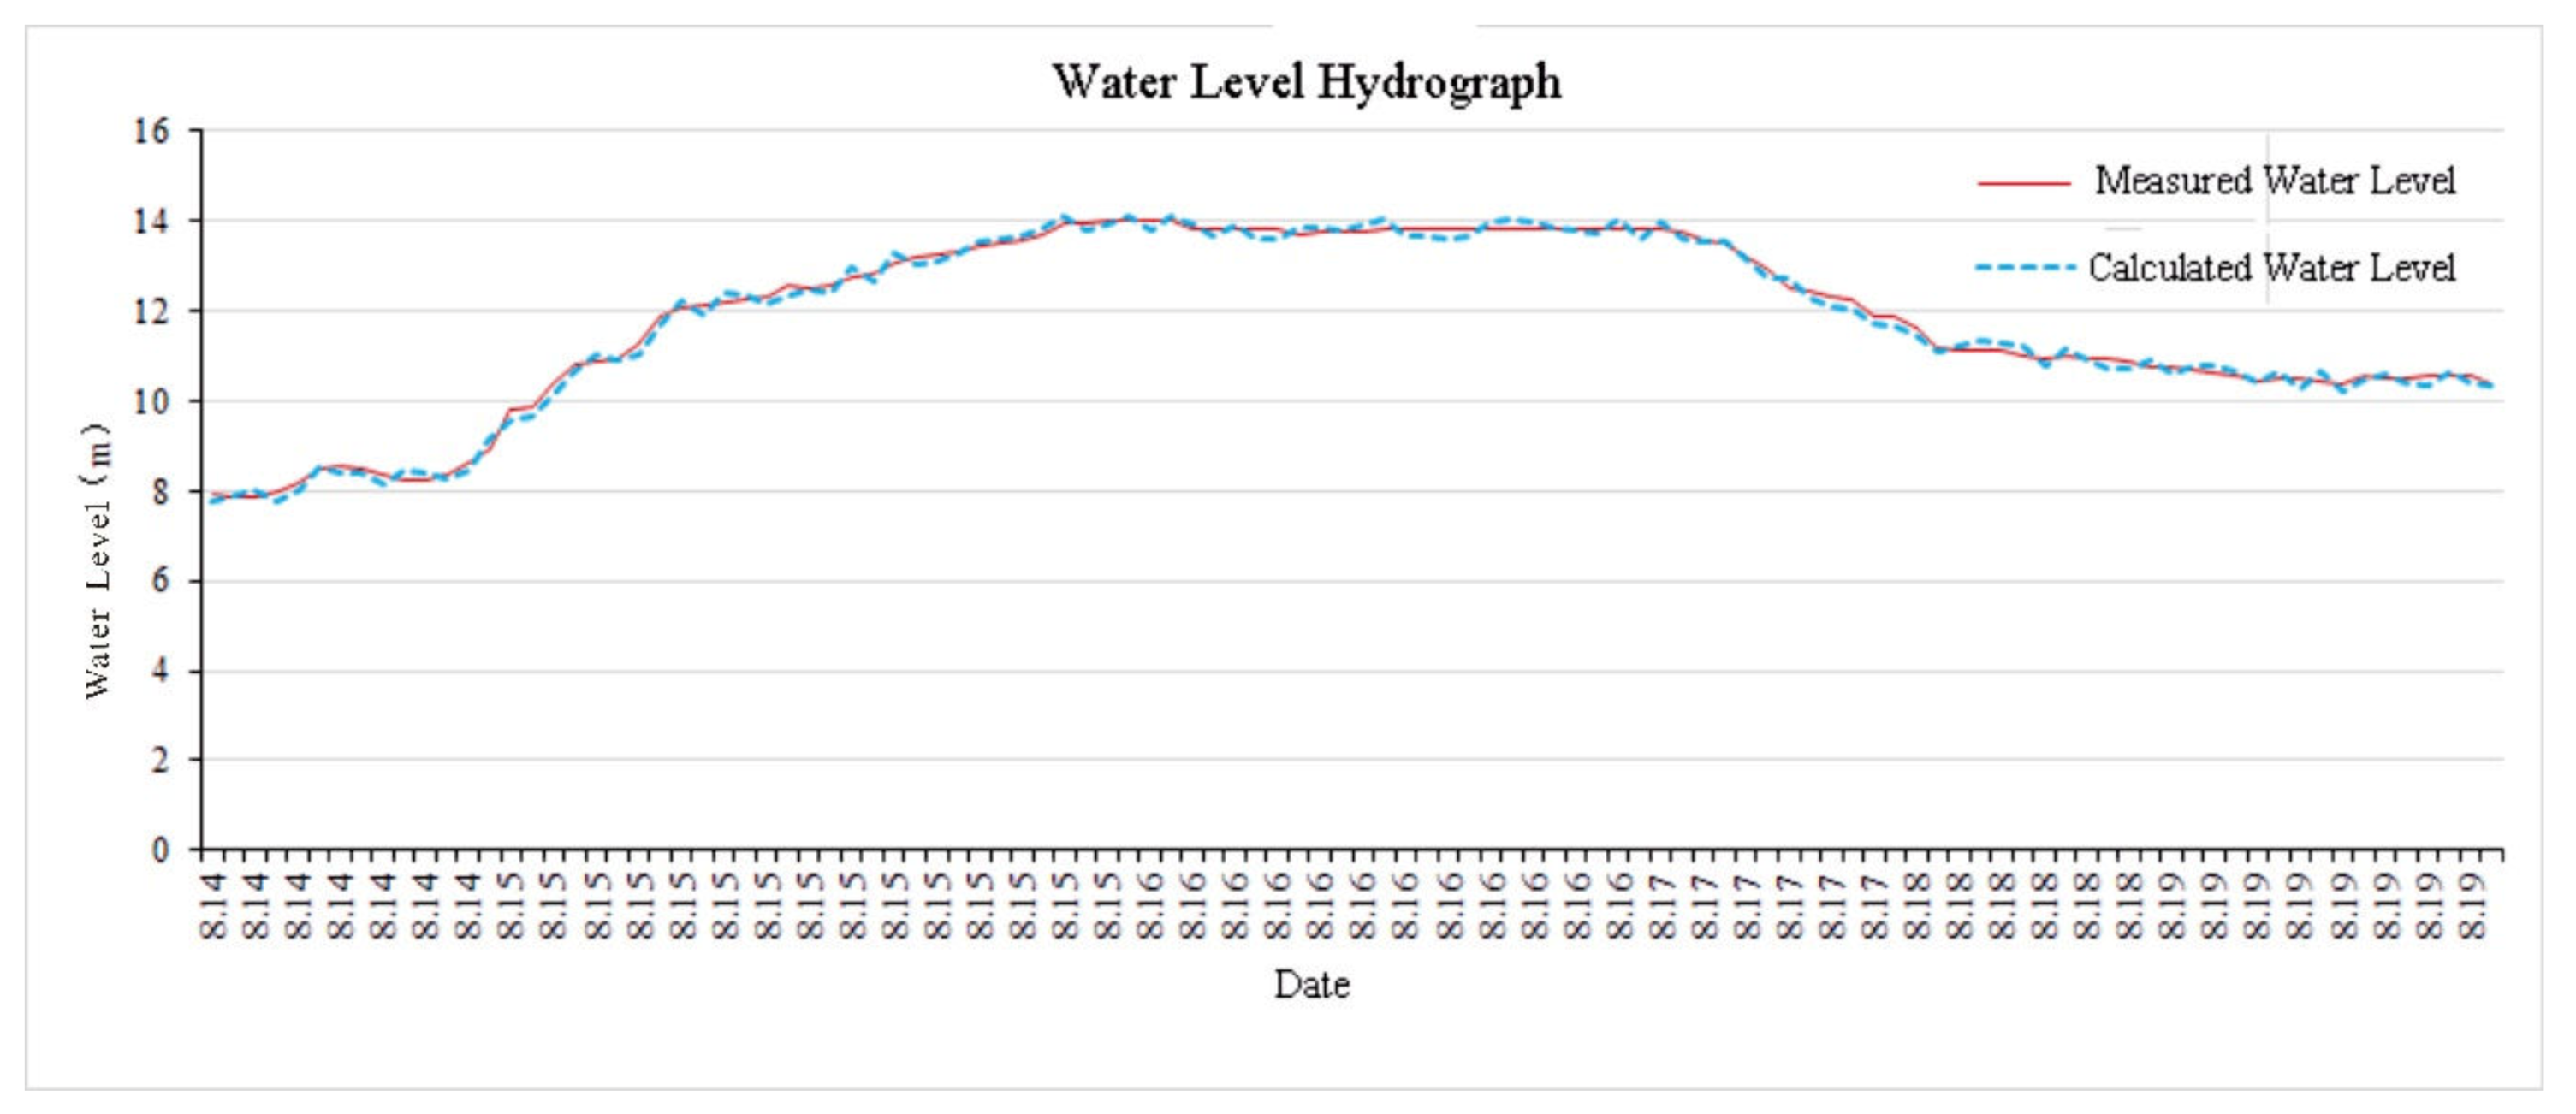
4.1. Flood Simulation under Typhoon ‘Chanthu’ in 2010

Considering the actual conditions of topographic and hydrological data, the flood caused by typhoon “1003” Chanthu in 2010 was selected to calibrate the 1D hydrodynamic mathematical model of Luojiang Huazhou section. The upstream boundary for the model operation is the actual measured discharge data during typhoon “Chanthu”, provided by the Hejiang hydrological Station. The downstream boundary is the actual measured water-level data during typhoon “Chanthu”, provided by the Huazhou hydrological Station. A river cross section was set near the downstream Huazhou Hydrological Station. Use the model to calculate the water level process at the section and compare it with the measured data to evaluate the accuracy of the simulation.
According to an official report from China Central Meteorological Station: Typhoon “1003” Chanthu in 2010: Typhoon “Chanthu” landed at 13:00 on 22 July 2010 in the coastal area of Wuyang Town, Wuchuan. The largest gust of 42.8 m/s (level 14) was recorded in Liangguang station. Extraordinary rainstorm fell all over the city and the average rainfall in the whole city was 303 mm from 8:00 on the 22nd to 8:00 on the 23rd. At 22:00 on the 23rd, the water level of Hejiang Station of Luojiang River Basin was 27.44 m, 4.32 m above the warning level and the corresponding discharge reached 2390 m3/s, which is equivalent to the peak flow of a 50-years’ flood. Huazhou Station of Jianjiang River Basin is the annual maximum flood with a peak water level of 13.11 m [36,37].
(1) Typical Section Water Level
Figure 4 shows the comparison between the measured and calculated results of the typhoon “Chanthu” flood in 2010. From the calculation results, the model can well simulate the hydrodynamic characteristics of flood flow in the main stream of Huazhou reach of Luojiang River Basin. Table 2 shows the comparison between measured water level and model calculation. As listed in the table, the calculated water level of typical section fits the measured water level well.

4.2. Flood Simulation under Typhoon ‘Utor’ in 2013

Considering the actual conditions of topographic and hydrological data, the flood caused by typhoon “1311” Utor in 2013 was selected to validate the 2D hydrodynamic mathematical model of Luojiang Huazhou section. The boundary inflow process is measured flow process at Hejiang Station and the boundary outflow process is the measured water level process at Huazhou Station [38,39].
Flood caused by Typhoon “Utor” in 2013: on 14 August 2013, affected by strong typhoon Utor No. 11, the wind in Huazhou City has increased gradually since the morning of the 14th. The average wind power generally reached level 7 to 10 and the gust reached level 11. The rainstorm of torrential rain fell throughout the region and extraordinary rainstorm occurred in some areas. This was the largest precipitation process in the whole year. The flood peak water level of Huazhou Station reached 13.93 m.
(1) Typical Section Water Level
Figure 5 shows the comparison between the measured and calculated results of the typhoon “1·Utor“ flood in 2013. From the calculation results, the model can well simulate the hydrodynamic characteristics of flood flow in the main stream of Luojiang Huazhou Section. Table 3 shows the comparison between the measured and calculated water level. As listed in the table, the maximum water level error is less than 11 cm, and the calculated water level of a typical section fits the measured water level well. It can basically meet the requirements of model validation.
(2) Comparison of Simulation Results with Actual Disaster Situation
According to the records of Yearbook of Heavy Rain (2010) officially published by the China Meteorological Administration, The actual inundation of the typhoon “Utor” flood in 2013 is as follows (Figure 6.): on 14 August 2013, the towns of Hejiang, Nawu, Linchen, Jianghu, Guanqiao, Shiwan, along Luojiang Rivers, were flooded by the heavy rainfall caused by typhoon Utor. Flooded streets in the urban area were not severe, only 3 square kilometers [40]. More than 358,000 people were affected by the flood. The affected area of crops was 21,062 hectares. The direct economic loss reached 462 million RMB, but fortunately no casualties occurred. Figure 6 shows the simulated results. Compared with the above actual flooding situation, results for the model showed a reasonable fit between model and observations. The flooding areas are mainly distributed in Hejiang, Linchen, Jianghu Towns in the upstream area. There is no large-scale flooding in Guanqiao and Shiwan Towns, and the flooding areas are mainly concentrated on the left bank of the river.

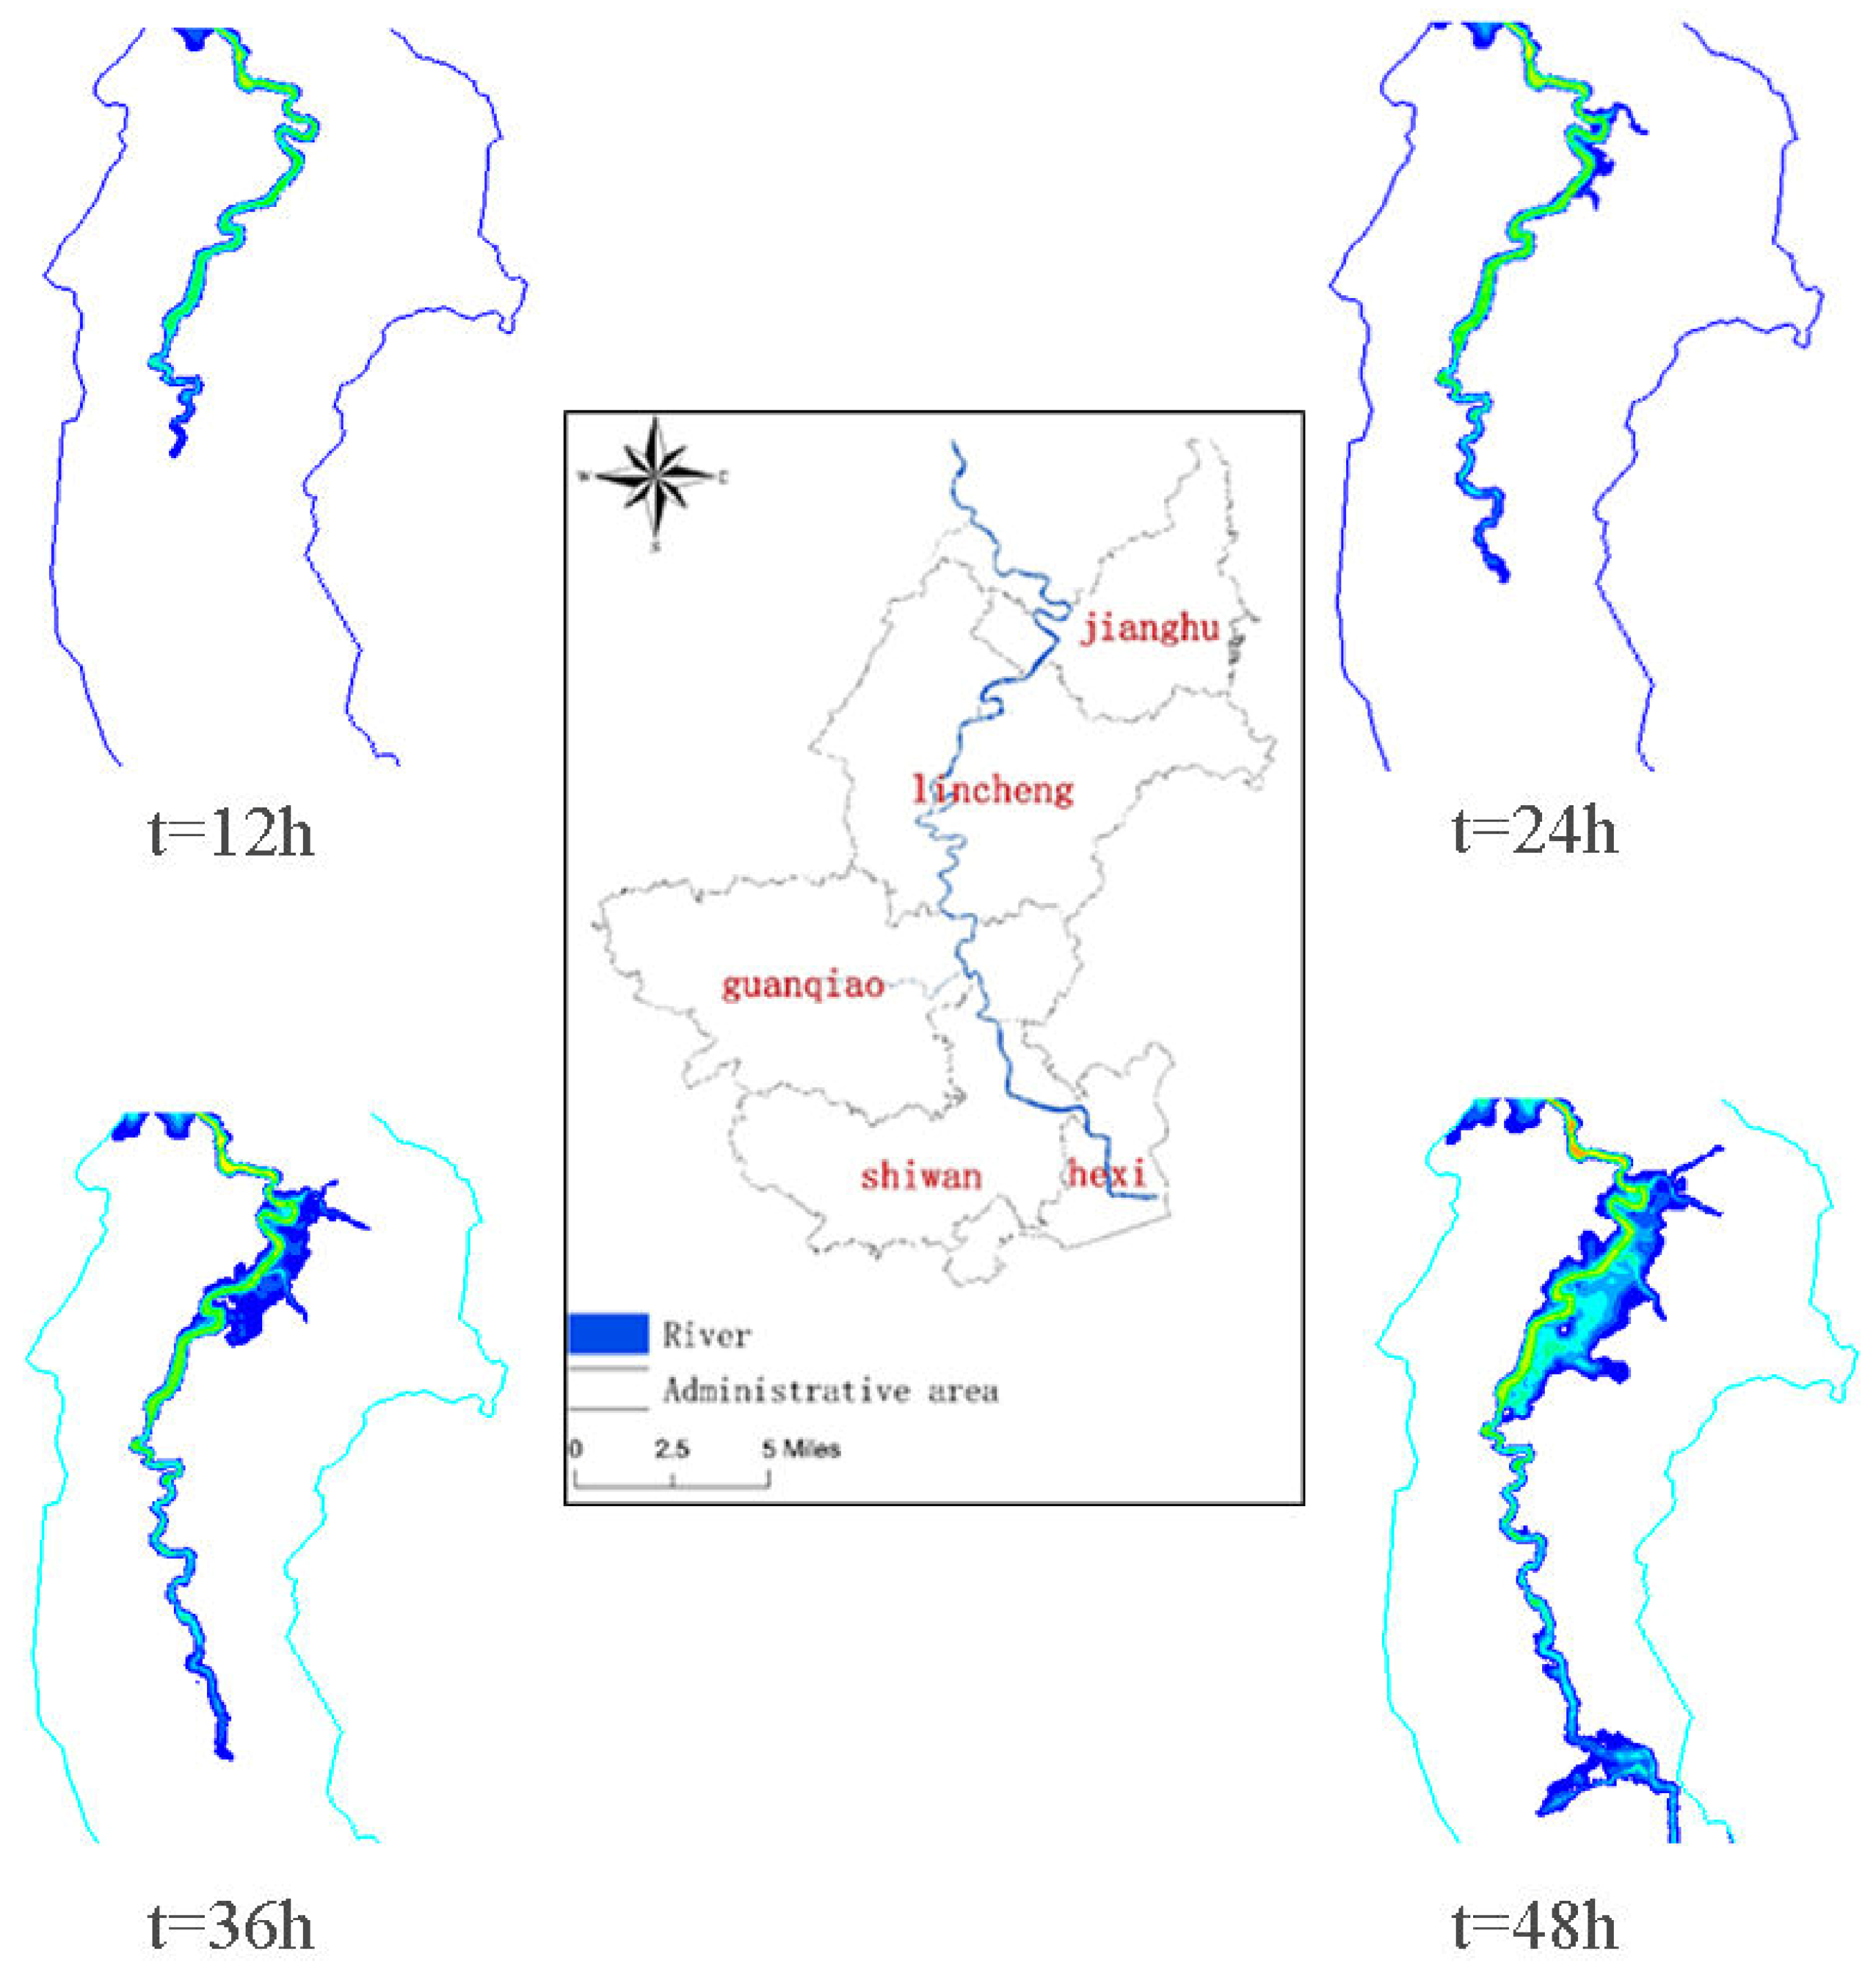
4.3. Simulation Prediction under Different Frequency Flood Conditions

The selection of flood magnitude involves two scenarios: standard flood and over-standard flood. As mentioned above, the levee flood control standards on both sides of the river are inconsistent. In addition to the regular 20-year and 50-year floods, the 100-year extreme frequency floods are also used in model calculations to explore the impact of floods of different magnitudes on the region. Based on the results of the Guangdong Rainstorm Parameter Contour Map (2003 edition) and the Guangdong Rainstorm Runoff Check Chart (1991), the upper boundaries are calculated and the corresponding frequency design flood is calculated. Because of the fragility of embankment works in the study area, the investigation results of past historical floods show that the main pattern of the dike failure of the Luojiang River is often caused by floods over the top of the dike, in addition to the dike’s collapse…, and the flood overtopping situation is more common and the loss caused by flood is much greater than that caused by simple breach. In this paper, the working conditions of the simulation scheme are set as dike overflow. Through model calculation, the flooded area, maximum flooded depth, average flooded depth and other flooded characteristic data of each scheme are calculated, as showed in Table 4 below. As the magnitude of the flood increases, the results show that the resulting submerged area increases, and the submerged depth increases to increase the total water volume in the submerged area. The flood risk map shows that the areas affected seriously by mountain torrents are Hejiang and Jianghu towns in the upper reaches, Guanqiao Town and Chengxi Street near the urban area are the lighter ones.

4.4. Flood Inundation Characteristics under Dike Conditions

The application of one-dimensional and two-dimensional real-time dynamic coupling model is more accurate in describing the risk characteristics of flood arrival time and diffusion path. Taking the dynamic simulation process of flood overflow 20-return-year as an example, the flood (about one hour) arrived at Hejiang and Hetangling reach of Hejiang Town along the river channel without overflow (Figure 7). After 12 h, the flood moved downstream to Guantang in Shiwan and Shuikou in Guanqiao; 24 h later, floods in the upper reaches of Jianghu and Linchen overflowed to both sides of the Taiwan Strait; 36 h later, the flooded areas of Jianghu and Linchen were widened, and the floods further flowed downstream; 48 h later, the process of flood submergence slowed down, affecting the downstream area of the basin. The flood reached the exit of Hexi Street and flooded some areas.
Elaborate simulation can not only reflect the changes of flow rate/discharge, water level and scope, but also reflect the changes of flow pattern and direction accurately. For example, the flow field diagram near the break (as shown in the Figure 8a.) can accurately show the location of the break, the direction of the flow direction, the direction of the outflow, and the continuity of the flow process. In some special terrain areas, such as sudden changes in terrain, river channels, dikes, roads and other boundary locations, the flow field distribution map (as shown in the Figure 8b) can also accurately reflect the water-blocking effect of water-blocking structures or the water-diversion effect of channels.

5. Conclusions

In this study, the 1D river channel model and the 2D floodplain model have realized dynamic coupling in real time, and a case simulation has been carried out in the mountainous watershed in the coastal areas of Southeast China. Based on the comparison analysis between the simulation results and the historical flood investigation and evaluation results, the following conclusions can be drawn:
1. The model parameters were calibrated under the data of typhoon “Chanthu” in 2010, and the simulation results were verified by the historical flood data of the typhoon “Utor” in 2013. The calibrated 1D/2D coupled model can satisfactorily reproduce the river water levels and flooding condition along the sides of the river. The applicability and rationality of the model for flood simulation in mountainous river basins with steep terrain and obvious floodplain characteristics have been proven.
2. The calibrated model further simulated and predicted floods of different frequencies in the region. The simulation results showed in detail the flood flow interactions between the river and the floodplain during dyke breaks, provided the water depth, the path of flood evolution, and other flood risk characteristics, which is of great help for flood forecasting agencies to formulate flood risk maps, to alert people during floods, and to design flood protection projects.
3. The simulation results in this paper accurately reflect the response of human facilities such as roads and dikes to the direction and flow pattern of floods. Dike standards of the upper reaches only can prevent 10-year floods, and there are obvious overflows in many places. The flow of water between the river and the land is obviously exchanged, causing a large flooding area. The dyke in the lower part of the basin has reached the 50-year flood control standard. Under its protection, the extent of flooding was minimal. On the one hand, it shows that the dyke plays a vital role in flooding. On the other hand, it also reflects the fact that the upstream dyke flood control standards are low and there are hidden dangers.
4. The natural properties of the upper reaches of the river basin are obvious, and the hydrological station facilities are not complete, resulting in scarce or even a lack of hydrological data, which may lead to insufficient calculation accuracy of the design flood in the calculation of runoff generation and convergence, which may affect the simulation results of flood inundation. Therefore, how to use modernization technology of water conservancy information to establish a complete basic hydrological data database will be one of our future efforts.

Author Contributions

Conceptualization, W.Z.; methodology, W.Z. and Y.L.; validation, W.T.; formal analysis, J.X.; investigation, Z.F.; resources, Y.L.; data curation, X.Z. and Y.L.; writing—original draft preparation, W.Z. and Y.L.; writing—review and editing, X.Z.; supervision, X.Z.; funding acquisition, W.Z. and X.Z. All authors have read and agreed to the published version of the manuscript.

Funding

The authors acknowledge National key research and development program (Grant: 2019YFC0409000), the Fundamental Research Funds for the Central Universities (Grant: 2019B10714), the National Natural Science Foundation of China (Grant: 41471427, 41101504), Special Basic Research Key Fund for Central Public Scientific Research Institutes (Y517017, Y517018).

Acknowledgments

Great thanks to China scholarship council. The authors also thank the anonymous reviewers for their very valuable comments

Conflicts of Interest

The authors declare no conflict of interest.

References

  1. Gourley, J.J.; Hong, Y.; Flamig, Z.L.; Arthur, A.; Clark, R.; Calianno, M.; Ruin, I.; Ortel, T.; Wieczorek, M.E.; Kirstetter, P.-E.; et al. A unified flash flood database across the United States. Bull. Am. Meteorol. Soc. 2013, 94, 799–805. [Google Scholar] [CrossRef] [Green Version]
  2. Jonkman, S.N.; Kelman, I. An analysis of the causes and circumstances of flood disaster deaths. Disasters 2005, 29, 75–97. [Google Scholar] [CrossRef]
  3. Hapuarachchi, H.A.P.; Wang, Q.J.; Pagano, T.C. A review of advances in flash flood forecasting. Hydrol. Process. 2011, 25, 2771–2784. [Google Scholar] [CrossRef]
  4. Huang, P.N.; Li, Z.J.; Li, Q.L.; Zhang, K.; Zhang, H.C. Application and comparison of coaxial correlation diagram and hydrological model for reconstructing flood series under human disturbance. J. Mt. Sci. 2016, 13, 1245–1264. [Google Scholar] [CrossRef]
  5. He, B.; Huang, X.; Ma, M.; Chang, Q.; Tu, Y.; Li, Q.; Zhang, K.; Hong, Y. Analysis of flash flood disaster characteristics in china from 2011 to 2015. Nat. Hazards 2018, 90, 407–420. [Google Scholar] [CrossRef]
  6. Guo, L.; He, B.; Ma, M.; Chang, Q.; Li, Q.; Zhang, K.; Hong, Y. A comprehensive flash flood defense system in China: Overview, achievements, and outlook. Nat. Hazards 2018, 92, 727–740. [Google Scholar] [CrossRef]
  7. Guo, K.; Liang, G.; He, B. Dynamic critical precipitation flash flood warning method and its application based on API Hydrologic Model. Water Resour. Power 2016, 34, 74–78. [Google Scholar]
  8. National Flood Control and Drought Relief Headquarters Ministry of Water Resources of the People’s Republic of China. Bulletin of Flood and Drought Disasters in China, 1st ed.; China Map Publishing House: Beijing, China, 2018; pp. 19–25. [Google Scholar]
  9. Jonkman, S.N.; Kok, M.; Ledden, M.V.; Vrijling, J.K. Risk-based design of flood defence systems: A preliminary analysis of the optimal protection level for the New Orleans metropolitan area. J. Flood Risk Manag. 2009, 2, 170–181. [Google Scholar] [CrossRef]
  10. Jonkman, S.N.; Kok, M.; Vrijling, J.K. Flood risk assessment in the Netherlands: A case study for dike ring South Holland. Risk Anal. Int. J. 2008, 28, 1357–1374. [Google Scholar] [CrossRef]
  11. Chiang, Y.; Hsu, K.; Chang, F.; Hong, Y.; Sorooshian, S. Merging multiple precipitation sources for flash flood forecasting. J. Hydrol. 2007, 340, 183–196. [Google Scholar] [CrossRef] [Green Version]
  12. Norbiato, D.; Borga, M.; Esposti, S.; Gaume, E.; Anquetin, S. Flash flood warning based on rainfall thresholds and soil moisture conditions: An assessment for gauged and ungauged basins. J. Hydrol. 2008, 362, 274–290. [Google Scholar] [CrossRef]
  13. Lamichhane, N.; Sharma, S. Effect of input data in hydraulic modeling for flood warning systems. Hydrol. Sci. J. 2018, 63, 938–956. [Google Scholar] [CrossRef]
  14. Khaleghi, M.R.; Gholami, V.; Ghodusi, J.; Hosseini, H. Efficiency of the geomorphologic instantaneous unit hydrograph method in flood hydrograph simulation. Catena 2011, 87, 163–171. [Google Scholar] [CrossRef]
  15. Wang, Y.; Liu, R.; Guo, L.; Tian, J.; Zhang, X.; Ding, L.; Wang, C.; Shang, Y. Forecasting and Providing Warnings of Flash Floods for Ungauged Mountainous Areas Based on a Distributed Hydrological Model. Water 2017, 9, 776. [Google Scholar] [CrossRef] [Green Version]
  16. Jasper, K.; Gurtz, J.; Lang, H. Advanced flood forecasting in Alpine watersheds by coupling meteorological observations and forecasts with a distributed hydrological model. J. Hydrol. 2002, 267, 40–52. [Google Scholar] [CrossRef]
  17. Chen, Y.B.; Li, J.; Wang, H.Y.; Qin, J.M.; Dong, L.M. Large-watershed flood forecasting with high-resolution distributed hydrological model. Hydrol. Earth Syst. Sci. 2017, 21, 735–749. [Google Scholar] [CrossRef] [Green Version]
  18. Jia, P.; Liu, R.; Ma, M.; Liu, Q.; Wang, Y.; Zhai, X.; Xu, S.; Wang, D. Flash Flood Simulation for Ungauged Catchments Based on the Distributed Hydrological Model. Water 2019, 11, 76. [Google Scholar] [CrossRef] [Green Version]
  19. Timbadiya, P.; Patel, P.; Porey, P. One-dimensional hydrodynamic modelling of flooding and stage hydrographs in the lower Tapi River in India. Curr. Sci. 2014, 105, 708–716. [Google Scholar]
  20. Rahmati, O.; Zeinivand, H.; Besharat, M. Flood hazard zoning in Yasooj region, Iran, using GIS and multi-criteria decision analysis. Geomat. Nat. Hazards Risk 2016, 7, 1000–1017. [Google Scholar] [CrossRef] [Green Version]
  21. Masood, M.; Takeuchi, K. Assessment of flood hazard, vulnerability and risk of mid-eastern Dhaka using DEM and 1D hydrodynamic model. Nat. Hazards 2012, 61, 757–770. [Google Scholar] [CrossRef]
  22. Cea, L.; Garrido, M.; Puertas, J. Experimental validation of two-dimensional depth-averaged models for forecasting rain-fall-runoff from precipitation data in urban areas. J. Hydrol. 2010, 382, 88–102. [Google Scholar] [CrossRef]
  23. John, F.E.J.; Mark, L.V.; Pierre, Y.J. Two-dimensional simulations of extreme floods on a large watershed. J. Hydrol. 2007, 347, 229–241. [Google Scholar]
  24. Gallegos, H.A.; Schubert, J.E.; Sanders, B.F. Two-dimensional, high-resolution modeling of urban dambreak flooding: A case study of Baldwin Hills, California. Adv. Water Resour. 2009, 32, 1323–1335. [Google Scholar] [CrossRef]
  25. Quiroga, V.M.; Popescu, I.; Solomatine, D.; Bociort, L. Cloud and cluster computing in uncertainty analysis of integrated flood models. J. Hydroinform. 2013, 15, 55–70. [Google Scholar] [CrossRef]
  26. Quiroga, V.M.; Kure, S.; Udo, K.; Mano, A. Application of 2D numerical simulation for the analysis of the February 2014 Bolivian Amazonia flood: Application of the new HEC-RAS version 5. Ribagua 2016, 3, 25–33. [Google Scholar] [CrossRef] [Green Version]
  27. Zhou, H.P.; Wei, Y.S.; Li, J.J. Optimal Model of Hydrodynamic Controlling on Pumps and Slice Gates for Water Quality Improvement. In Applied Mechanics and Materials; Trans Tech Publications Ltd.: Stafa, Zurich, Switzerland, 2013; Volume 316, pp. 732–740. [Google Scholar]
  28. Martins, R.; Leandro, J.; Djordjevic, S. Influence of sewer network models on urban flood damage assessment based on coupled 1D/2D models. J. Flood Risk Manag. 2018, 11, S717–S728. [Google Scholar] [CrossRef]
  29. Liu, Y.Z.; Niu, S.; Zhang, W.T.; Xu, J. Integrated Modeling and Calculation of Urban Surface and Underground Flooding. Ekoloji 2018, 106, 703–711. [Google Scholar]
  30. Zhang, W.T.; Liu, Y.Z. Comprehensive risk assessment of the Luojiang River basin water environment in Western Guangdong Province. Desalin. Water Treat. 2018, 125, 171–178. [Google Scholar] [CrossRef]
  31. Luo, B.Y.; Zhang, C.H.; Li, Y.F.; Li, S.A. Rainfall Contrast betewwn Typhoon Bills and Kaemi 2006. Adv. Mar. Sci. 2009, 27, 74–80. [Google Scholar]
  32. Qi, P.N.; Shen, F.F.; Kou, L.L.; Chu, Z.G.; Xu, D.M. Experiments of assimilating Doppler radar data in forecast of Typhoon Chanthu. J. Trop. Oceanogr. 2019, 38, 20–31. [Google Scholar]
  33. Zhang, X.L.; Xia, J.Q.; Li, N. Impacts of mesh scale and village region roughness on predictions of flood inundation over complex floodplains. J. Hydroelectr. Eng. 2016, 35, 48–57. [Google Scholar]
  34. Casas, A.; Lane, S.N.; Yu, D.; Benito, G. A method for parameterizing roughness and topographic sub-grid scale effects in hydraulic modelling from LiDAR data. Hydrol. Earth Syst. Sci. 2010, 14, 1567–1579. [Google Scholar] [CrossRef] [Green Version]
  35. Liu, Y.Z.; Cui, X.M.; Zhang, W.T. Research and application of reservoir flood emergency operation system. Disaster Adv. 2012, 5, 712–716. [Google Scholar]
  36. Zhang, J.; Feng, W.Z.; Li, G.M.; Xu, W.M. Analysis and numerical simulation of the storm surge caused by the typhoon “Chanthu”. Mar. Sci. Bull. 2011, 30, 367–370. [Google Scholar]
  37. Lang, X.B. Analysis of 201003 typhoon “Chanthu”. Mar. Forecast. 2011, 3, 26–31. [Google Scholar]
  38. Zhao, X.T.; Zhao, Y.C.; Cui, C.G. Analysis on track and intensity changes of STC Utor before and after its landing. Torrential Rain Disaster 2015, 34, 197–205. [Google Scholar]
  39. Xiong, Y.; Li, L.; Wu, X.; Guo, Y.T. Analysis of the process of severe typhoon “Youte” in 2013 affecting the heavy rainfall in Shaoguan. J. Meteorol. Res. Appl. 2014, S2, 156–158. [Google Scholar]
  40. Wang, S.F.; He, L.Y. Comprehensive Analysis of Heavy Rainfall Process of Super Typhoon “Utor” No. 1311. J. Meteorol. Res. Appl. 2016, 37, 20–21. [Google Scholar]
Figure 1. Death toll from mountain torrents and the proportion of deaths caused by mountain torrents against those caused by floods (%).
Water 12 00822 g001
Figure 2. Geographic location of the section of Huazhou City in Luojiang River basin, China.
Water 12 00822 g002
Figure 3. (a) Constructed mesh. (b) Elevation distribution. (c) Roughness distribution.
Water 12 00822 g003
Figure 4. Water level comparison of model calculation results and measured data under the typhoon “Chanthu” flood in 2010.
Water 12 00822 g004
Figure 5. Water level comparing between the measured and calculated results of typhoon “Utor“ flood in 2013.
Water 12 00822 g005
Figure 6. Extent of flood inundation from 1D/2D model under typhoon “Utor”.
Water 12 00822 g006
Figure 7. Simulated flood depth and extent of 1D/2D model at 12 h, 24 h, 36 h, and 48 h after the river dike breach.
Water 12 00822 g007
Figure 8. Flow field distribution: flow field near the breach (a), water-blocking and water-diversion effect of dike and local topography (b).
Water 12 00822 g008
Table 1. Partial roughness values of riverbed.
Partial Roughness Values of Riverbed
River Features
TypeRiverbed Morphology and CharacteristicsRoughness Value
IThe riverbed is made up of sand and its surface is smooth.0.020–0.024
IIThe riverbed is a slab consisting of sand and gravel with a flat surface.0.022–0.026
IIIThe riverbed is sandy and the bottom of the river fluctuates greatly.0.025–0.029
IVThe smooth riverbed is composed of gravel. its terrain is relatively flat.0.025–0.029
VThe riverbed is composed of fine sand with a small amount of vegetation at the bottom.0.030–0.034
VIThe riverbed is composed of gravel and it is undulating.0.030–0.034
VIIThere are pebbles and boulders at the bottom of the river, and the riverbed fluctuates greatly.0.035–0.040
VIIIThe riverbed is pebble, the bottom of the river fluctuates greatly and its shape is irregular.0.04–0.10
Table 2. Comparison between the measured and calculated results of typhoon “Chanthu” flood in 2010.
Serial NumberSectionMeasured Water Level (m)Model Calculation of Water Level (m)Absolute Difference of Water Level (m)
1Luojiang Estuary13.1813.110.07
Table 3. Comparison between the measured and calculated results of the typhoon “Utor” flood in 2013.
Serial NumberSectionMeasured Water Level (m)Model Calculation of Water Level (m)Absolute Difference of Water Level (m)
1Luojiang Estuary14.1914.080.11
Table 4. Flooded characteristic data of each scheme.
Flood FrequencyMaximum Flooded Area (km2)Maximum Flooded Depth (m)Average Maximum Flooded Depth (m)
20-year flood56.587.6172.58
50-year flood66.348.4872.976
100-year flood79.249.5113.39

