Recent Spatio-Temporal Variations of Suspended Sediment Concentrations in the Yangtze Estuary
by
Haifei Yang
1,2,*, 
Bochang Li
1,
Chaoyang Zhang
1,
Hongjie Qiao
1,
Yuting Liu
1,
Junfang Bi
1,
Zhilin Zhang
1 and
Fengnian Zhou
1 1
Changjiang River Estuary Bureau of Hydrological and Water Resources Survey, Bureau of Hydrology, Changjiang Water Resources Commission, Shanghai 200136, China
2
State Key Laboratory of Estuarine and Coastal Research, East China Normal University, Shanghai 200062, China
*
Author to whom correspondence should be addressed.
Water 2020, 12(3), 818; https://doi.org/10.3390/w12030818
Submission received: 30 January 2020
/
Revised: 9 March 2020
/
Accepted: 12 March 2020
/
Published: 14 March 2020
(This article belongs to the Special Issue Observation and Numerical Modeling of Sediment Transport in Coastal Areas)
Abstract
:Water and sediment are two of the most essential elements in estuaries. Their product, suspended sediment concentration (SSC), is involved in hydrology, geomorphology and ecology. This study was focused on the spatial and temporal variations of SSC in the Yangtze Estuary under new situations after the closure of ~50,000 dams in the Yangtze basin, including the Three Gorges Dam (TGD) in 2003. It was found that the SSC first exhibited an increasing and then a decreasing trend longitudinally from Xuliujing Station to the outer estuary with the Turbidity Maximum Zone located in the mouth bar area. Vertically, the SSC in the bottom layers averaged 0.96 kg/m3, about 2.4 times larger than the surface layers (0.40 kg/m3). During spring tides, the SSCs were always higher than those in neap tides, which was fit for the cognition law. As for the seasonal variations in the North Branch and mouth bar area, the SSCs in the dry season were higher than those in the flood season, while in the upper reach of the South Branch and outer estuary, the seasonal variation of SSCs reversed. This phenomenon primarily reflected the competition of riverine sediment flux and local resuspended sediment flux by wind-induced waves. As for the interannual changes, the SSCs demonstrated overall fluctuant downward trends, determined by riverine sediment flux and influenced by waves. This study revealed the new situation of SSC and can be a reference for other related researches in the Yangtze Estuary.
1. Introduction
Rivers are the lifeblood of human civilization and still play critical roles in human daily life. It attracts many studies in all kinds of aspects, such as hydrology, geomorphology, environments, ecology etc. [1,2,3,4,5,6]. Of all the riverine discharges, sediment and water are two of the most basic elements. They are also two necessary observation parameters in modern estuarine and coastal research. Their product, suspended sediment concentration (SSC), is a key factor influencing the nutrient concentration, the illumination intensity and the growth of phytoplankton in the water [5,7,8,9,10]. In sedimentology, SSC determines the erosion/deposition processes at estuarine tidal flats and subaqueous deltas. In the tidal-cycle scale, net erosion/accretion relies on the competition between erosion flux and deposition flux, and deposition flux is positively correlated with SSC [11,12,13].
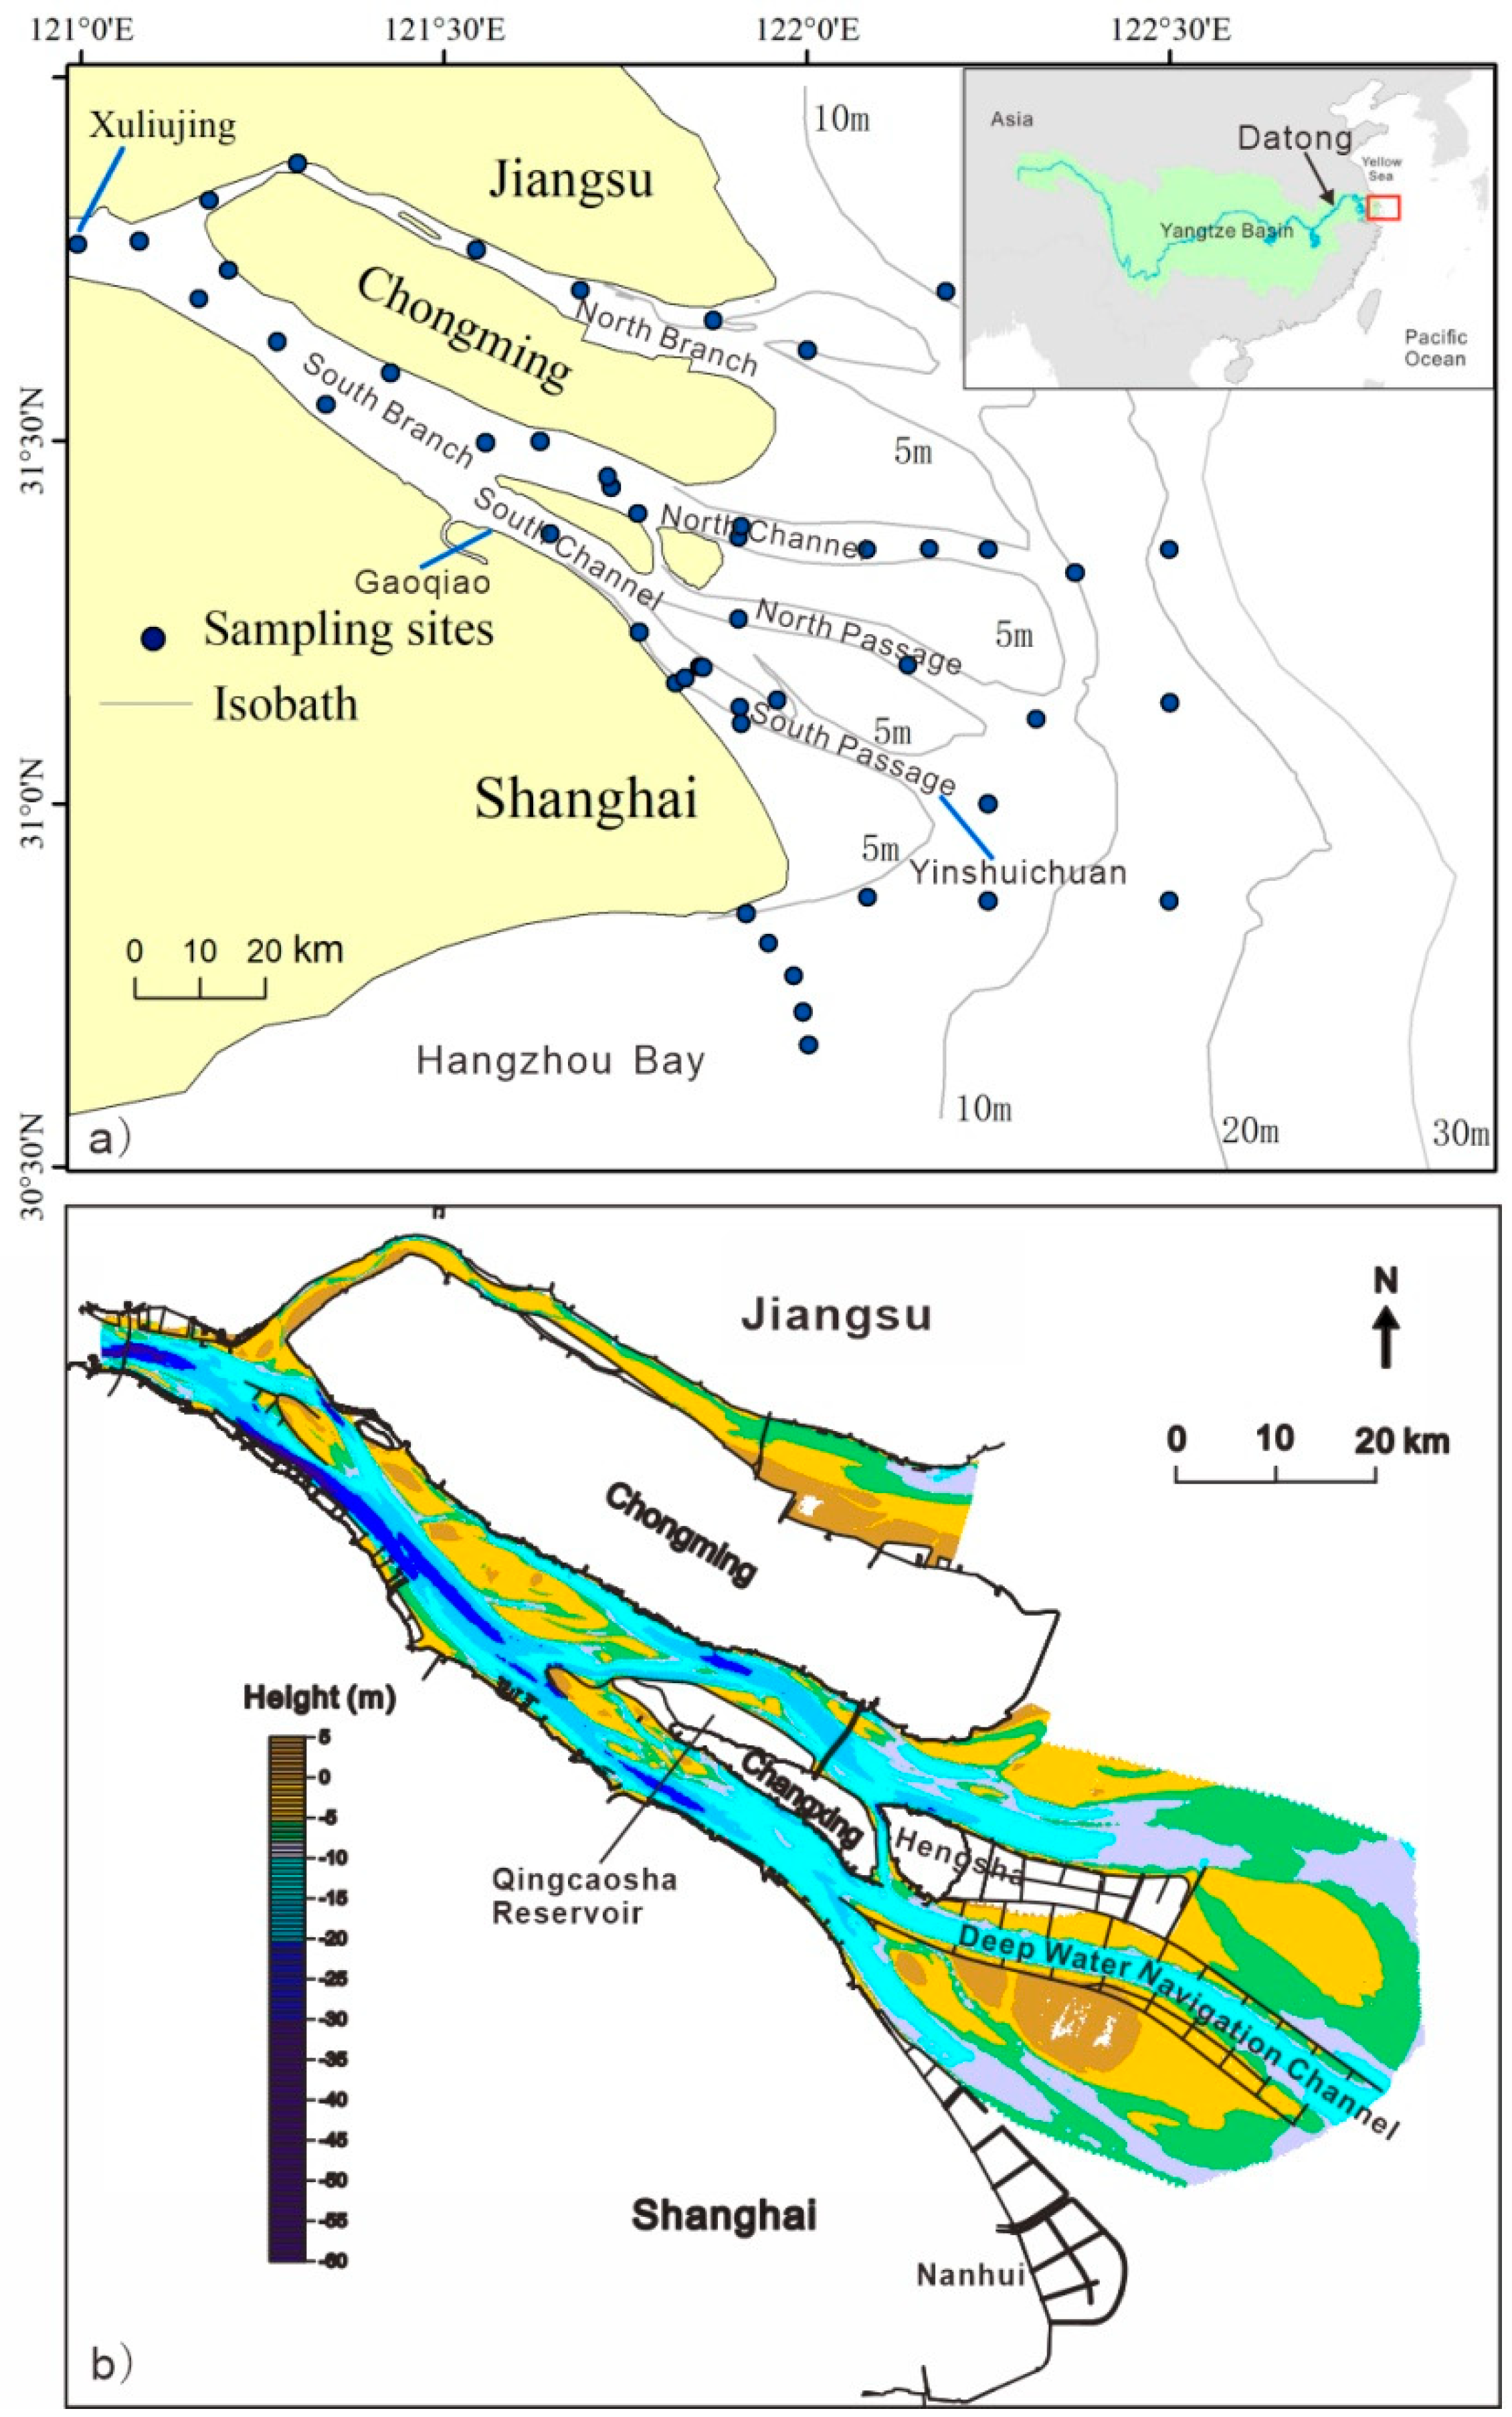
However, there are huge challenges for SSC under new circumstances. As reported by so many studies, sediment fluxes in many rivers, such as the Mississippi, Indus, Yellow and Volta Rivers, have decreased by more than 60% during recent decades. Sediment fluxes have even been almost extinct in Nile, Ebro, Colorado Rivers etc. [14,15,16]. These deltas are now threatened by delta erosion or coastline recession, mainly because of insufficient sediment supply [4,17,18,19,20,21,22]. In the Yangtze River, the water discharge remains relatively stable around 900 km3/yr for years, while the riverine sediment flux during the post-dam period declined by 77% compared to that during the pre-dam period, primarily due to natural and human activities. Moreover, some important human interventions have taken place in the Yangtze Estuary (Figure 1). The Deep Water Navigation Channel project (Figure 1b) and subsequent dredging have been conducted since 1998 in the North Passage. The Qingcaosha Reservoir and the reclamations of East Nanhui and Hengsha shoals (Figure 1b) also have major impacts on the SSC in the Yangtze Estuary [23,24]. Therefore, the Yangtze’s SSC is experiencing a similar evolution as the sediment flux.
It can be imagined that the potential erosion is threatening the Yangtze delta considering the phenomenon of ‘sediment starvation.’ It was reported that erosion had occurred in a region deeper than 20 m in the outer Yangtze Estuary [23,25]. Erosion may not be detected easily in the inner part of the Yangtze Estuary, considering so many anthropogenic activities here, such as sand mining and Deep Navigation Channel Project [26,27,28,29]. However, the evolution trends of SSC could be an early warning of potential erosion. Systematic research on the spatial and temporal variations of SSC in the Yangtze Estuary is therefore expedient.
Some studies have been conducted in the Yangtze Estuary and its adjacent waters to study the SSC in different kinds of aspects [30,31,32,33,34]. Chen et al. [30] studied the SSC variations over a year and found that SSC increased downwards to the sea and the seasonal difference in the inner estuary is opposite to that in the outer estuary. Based on the data in the mouth bar area, most of the vertical distributions of SSC were smoothly concave-up [34]. As for the temporal scale, SSC in the nearshore area in 2003–2011 declined by 21% compared to that in 1985–2002, which can probably be attributed to the constructions of the dams in the Yangtze basin, especially the Three Gorges Dam (TGD) in 2003 [33]. A similar phenomenon was also reported by Li et al., 2012 [35]. Meanwhile, Dai et al. [31] argued that no apparent change of SSC in the surficial water had been found in the mouth bar area yet. In the upper estuary, the SSC showed significant seasonal and annual variations in response to riverine discharge with the method of satellite observation [32]. Under the impact of the Deep Water Navigation Channel project, the SSC between 2008 and 2011 decreased by 14% compared to that between 2000 and 2007 in the upper and lower reaches of the North Passage [33]. Although considerable studies have been conducted in this estuary, they were either only focused on a local scale, or just studied short-term variations. No systematic cognition on SSC in both a spatial and a temporal scale is available in the Yangtze Estuary, including the variations of surface-bottom layers, spring-neap tides, flood-dry seasons, interannual values etc. Considering this, consecutive data spreading all over the Yangtze Estuary were acquired to attempt to elucidate the variations of SSC.
2. Study Area
The Yangtze River, the largest in Asia and the third-largest in the world, originates on the Qinghai-Tibet Plateau and flows 6300 km to the East China Sea [16,36]. After arriving at the estuary, the Yangtze River splits into four major outlets (the North Branch, South Branch, North Channel and South Channel) and grows ~90 km wide in the mouth region (Figure 1). Nowadays, less than 2% of the Yangtze’s discharges go through the North Branch, which means the South Branch has become the major watercourse including three outlets (i.e., the North Channel, the North Passage and the South Passage, Figure 1) [37].
The Yangtze Estuary is controlled by bidirectional flow, and the dominances of tidal currents and river flows differ in different parts of the Yangtze Estuary [37]. Under normal conditions, the bidirectional flow varies from 0–2 m/s and the mean tidal range reaches ~2.5 m in the estuary. Wind-driven waves and swells also play important roles in the Yangtze Estuary. According to the multi-year record, the mean wave heights in the Gaoqiao Station (Figure 1a) and Yinshuichuan Station (Figure 1a) are 0.2 and 1.0 m, respectively [38]. Most of the North Branch is usually shallower than −5 m, while some local region of the North Branch can be deeper than −30 m. In the South Branch, the underwater shoals mainly developed along the north bank, while the deep waterway goes along the south bank primarily. The water depth becomes smaller outward in the mouth bar area (Figure 1b). Muddy deposits are found covering the channel bed in this region, mainly because of the settling process of fine suspended sediments during the slack water period. In the mouth bar area, the depth-averaged SSC at the mouth bar area can reach ~0.3 kg/m3 in a tidal cycle [39].
3. Materials and Methods
To study the spatial and temporal variations of suspended sediments, a total of 48 sampling sites were carefully selected and well distributed in the Yangtze Estuary (Figure 1). At each site, water samples were collected using 1000 mL water bottles at six layers in different depth (i.e., the surface layer, 0.2 H, 0.4 H, 0.6 H, 0.8 H, and the bottom layer, H: the height of the water column). During each field observation, sampling work was conducted hourly for at least one full semidiurnal tidal cycle. Suspended sediments were filtered through 0.45 mm filters from the water samples, dried at 45 °C for 48 h and weighed in a laboratory to measure the SSC. This fieldwork covers the years from 2009 to 2018 in both dry and flood seasons.
Due to sampling capacity limitations, not all samples at every station during both spring and neap tides in both dry and flood seasons were collected every year. To eliminate the influence of wave-energy seasonal variation and get more data, the spatial analysis of SSC mainly adopted the data measured during spring tides in dry seasons of 2002–2004 and 2011. The seasonal variations of SSC in this study were mainly based on the data acquired in 2011. The interannual variations of SSC were based on the data collected in the flood season from 2001 to 2018. To reduce the accidental error from an individual sample, SSC in this study was primarily referred to as the depth-averaged data of 84 samples during a whole tidal cycle, except the analysis of vertical variations of SSC. The Yangtze’s water discharge and sediment flux at Datong Station (tidal limit, Figure 1a) were acquired from the Yangtze Water Resources Commission (YWRC) [40]. Yangtze Sediment Bulletin is available at http://www.cjh.com.cn.
4. Results and Discussions
4.1. Spatial Variations of Suspended Sediment Concentration
4.1.1. Longitudinal and Transverse Variations
Longitudinally, the depth-averaged SSCs for the whole tidal cycle in both the North and South Branches first increased and then decreased from the inner estuary to outer estuary (Figure 2). The maximum of SSC in the Yangtze Estuary was found as 2.15 kg/m3 in the middle reach of the North Branch, and the minimum of SSC was found as only 0.10 kg/m3 in the outer estuary. Transversely, SSC averaged 1.45 kg/m3 in the North Branch, which was 2.6 times larger than the South Branch (0.55 kg/m3, Table 1). Compared to the Yangtze Estuary, SSCs in the Hangzhou Bay were overall larger and averaged 2.15 kg/m3 (Figure 2, Table 1).
As for the South Branch, there were also great spatial differences. SSC was 0.74 kg/m3 in the South Passage and was only 0.15 kg/m3 in the upper reach of the South Branch. In the other regions, SSC ranged from 0.6 to 0.7 kg/m3 (Table 1).
4.1.2. Vertical Variation
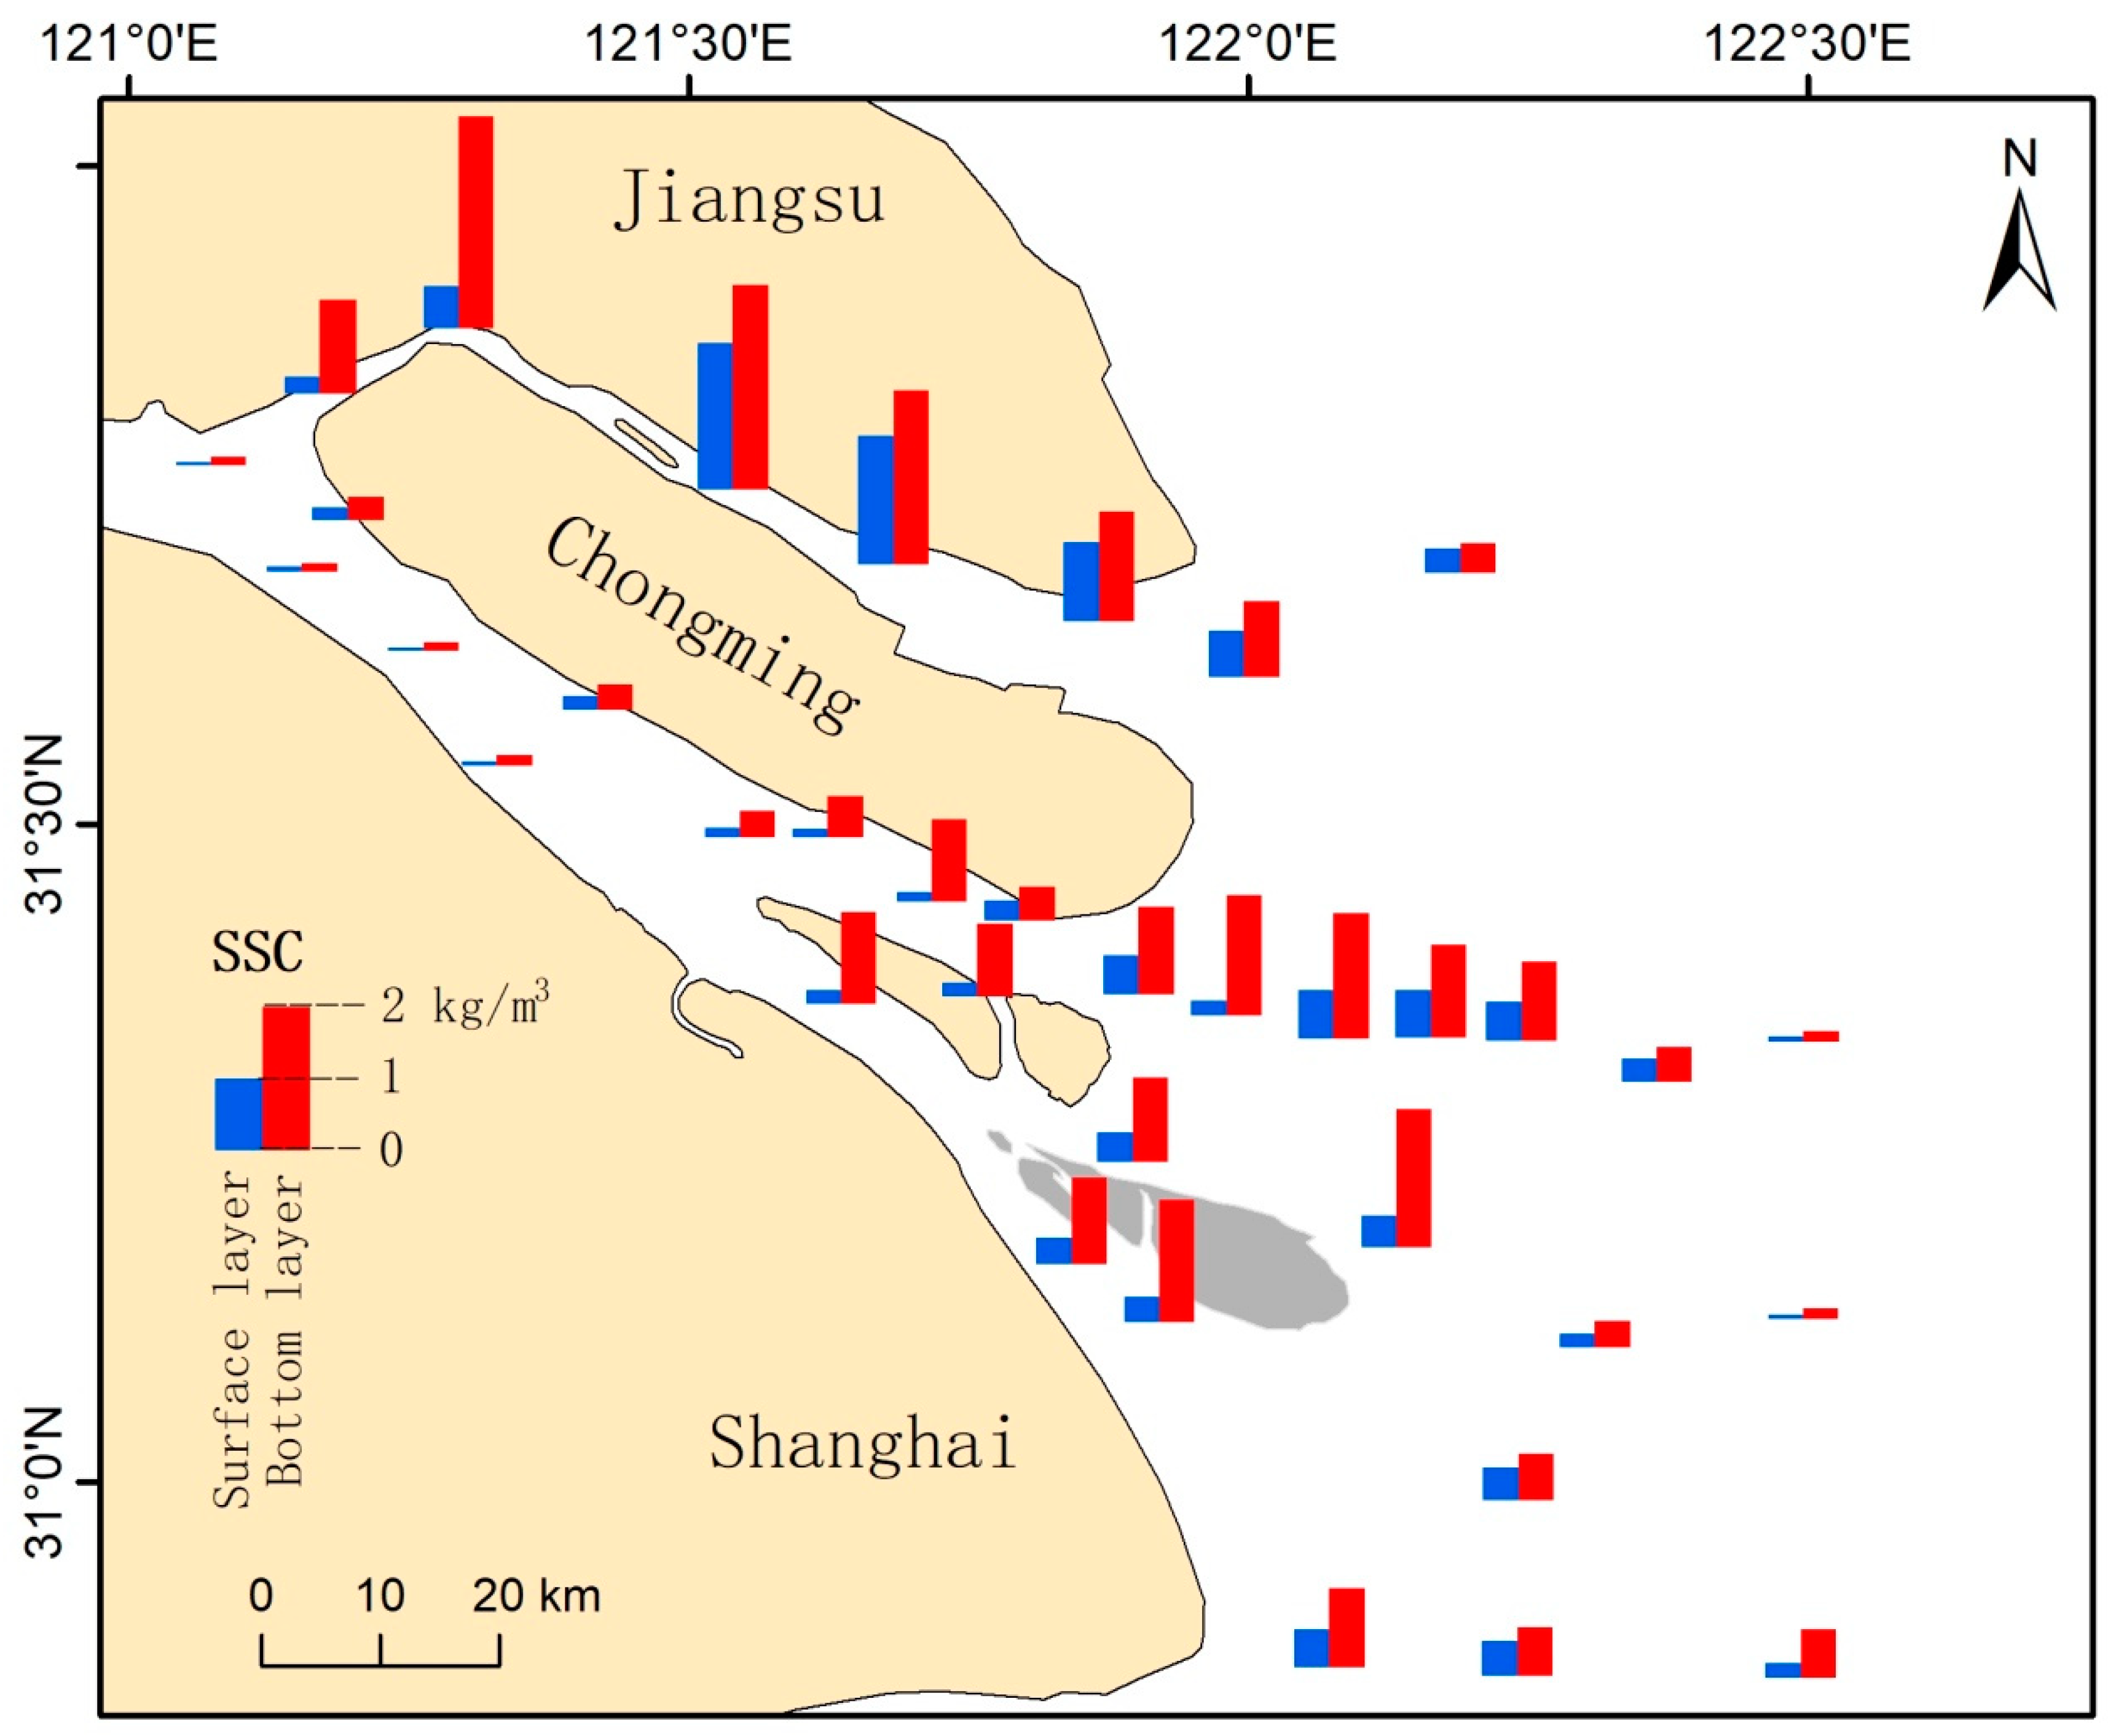
Based on the calculations, SSCs varied from 0.05 to 1.97 kg/m3 in the surficial layers and varied from 0.11 to 2.84 kg/m3 in the bottom layers. SSCs in the bottom layers averaged 0.96 kg/m3, about 2.4 times larger than the surface layers (0.40 kg/m3). The SSC of the bottom layer can even be 9.1 times larger than the surface layer in the North Channel (Figure 3). All these samples were subject to the same patterns as the surficial SSCs were much lower than the bottom layers. This phenomenon is generally known, mainly due to a decreased upward diffusion of suspended sediments [34]. Meanwhile, compared to the inner estuary, the differences of SSCs between the surface and bottom layers were much larger in the North Branch and outer estuary (Figure 3), where either water was shallow or wave energy was strong.
4.2. Temporal Variations of Suspended Sediment Concentration
4.2.1. Differences of Suspended Sediment Concentrations between Spring and Neap Tides
In the Yangtze Estuary and Hangzhou Bay, the depth-averaged SSC was 0.84 kg/m3 during spring tides, more than twice the SSC during neap tides (0.41 kg/m3). Generally, most sites revealed this consistent phenomenon (Figure 4), reflecting the effects of hydrodynamic forces.
The differences of SSCs between spring and neap tides in the North Branch were much larger than the other regions (Figure 4), considering that the North Branch was controlled by tidal forces and the Yangtze’s water discharge into the coastal zone via the North Branch was less than 2%. This difference of SSCs reached its maximum as 1.51 kg/m3 at the bend in the North Branch, mainly due to the combined effects of powerful tidal force during spring tides and large topographic changes.
In the South Branch, SSC varied from 0.08 to 1.17 kg/m3 during spring tides and from 0.04 to 0.61 kg/m3 during neap tides. The differences of SSCs between spring and neap tides in the mouth bar area were much larger than those in the upper reach of South Branch (Figure 4). The variation range of SSC was 0.08–0.26 kg/m3 during spring tides and 0.04–0.10 kg/m3 during neap tides in the upper reach of the South Branch. In the mouth bar area, depth-averaged SSC during spring tides was 0.68 kg/m3, about 2.5 times larger than that during neap tides (0.27 kg/m3). The differences of SSCs between spring and neap tides were small in the region controlled by riverine forces and were large in the region controlled by oceanic forces.
4.2.2. Differences of Suspended Sediment Concentrations between Flood and Dry Seasons
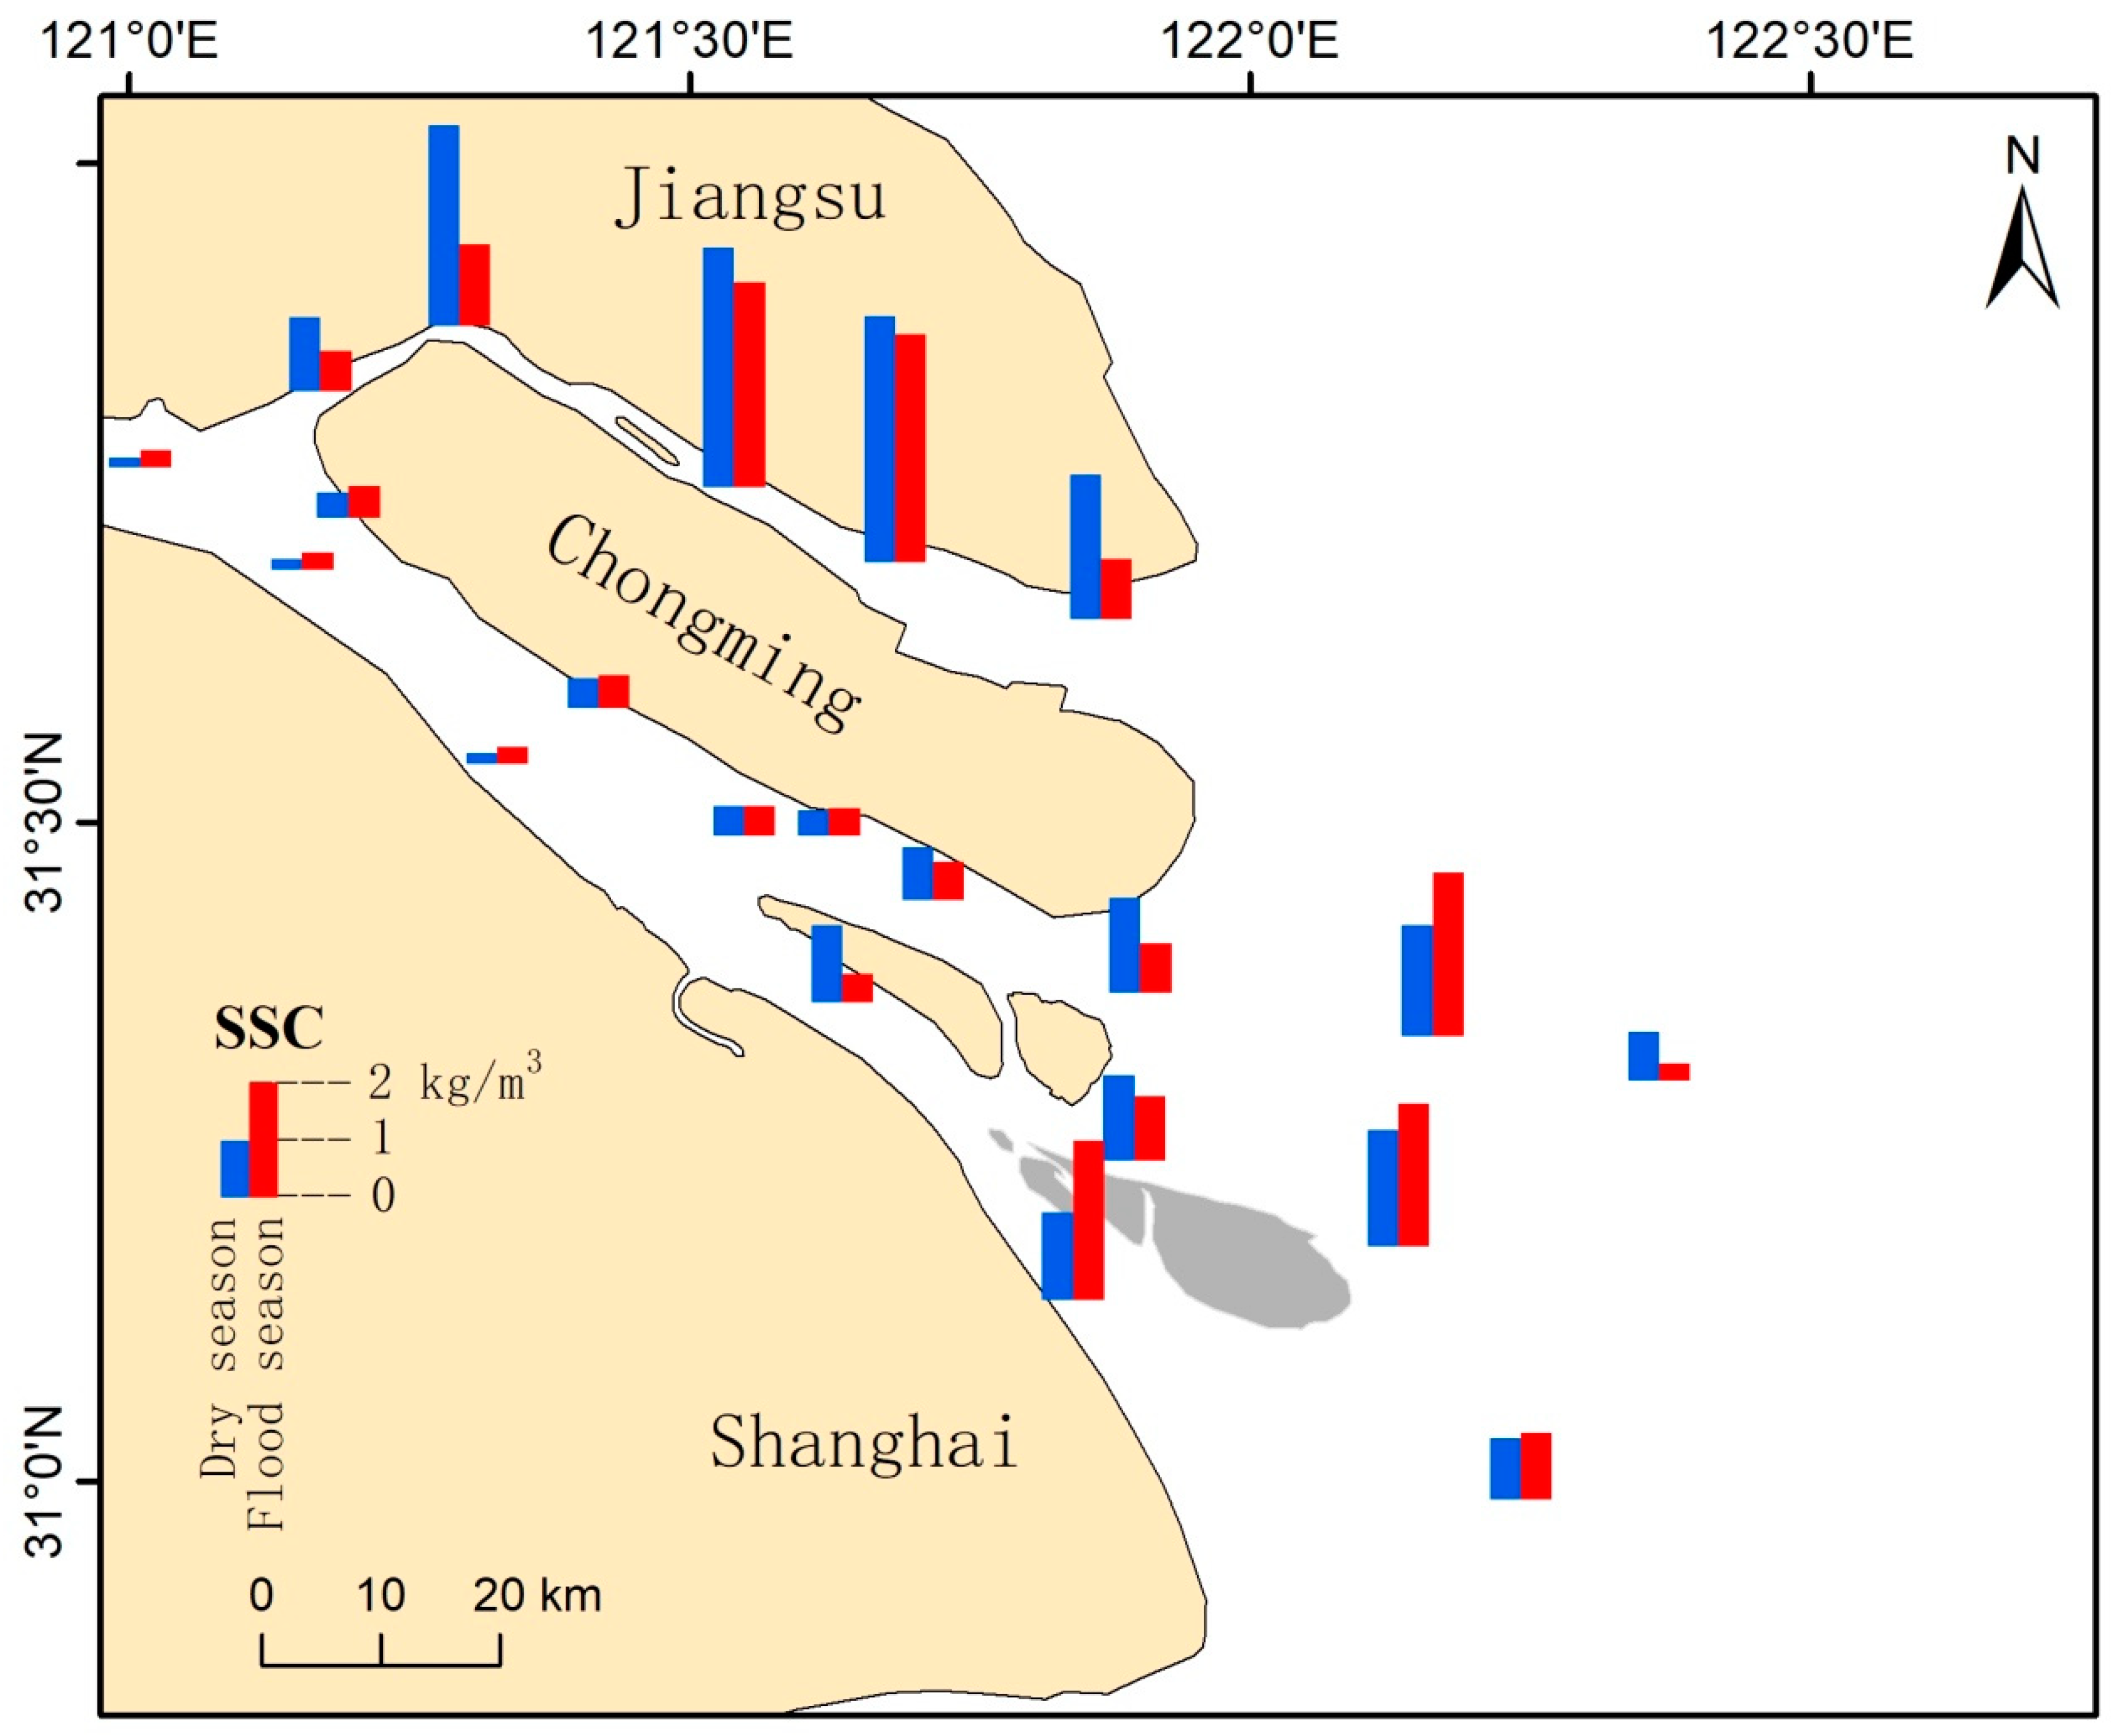
Based on measured data, the mean SSC in the Yangtze Estuary was 0.74 kg/m3 during dry seasons, 17% higher than that in flood seasons (0.63 kg/m3) (Figure 5, Table 2). About half of the measured data exhibited the opposite phenomenon. There were spatial differences in the seasonal variations of SSC (Figure 5).
Based on the five samples in the North Branch, SSCs averaged 1.58 kg/m3 in the dry season, all higher than those in the flood season (1.07 kg/m3). The same seasonal variation also occurred in most of the mouth bar area (Figure 5, Table 2). This phenomenon mainly reflected ocean-dominated sediment dynamics [39]. The Yangtze’s input of suspended sediment flux contributed less to the SSC in these regions than the contribution from re-suspended local sediment flux by ocean-controlled waves and currents. The mouth bar area was open to the sea, where the wind was strong and the water was shallow. Wind-induced waves during dry seasons were usually much stronger than those during flood seasons, while riverine water and sediment discharge during dry seasons were much smaller than those during flood seasons [34,35,44].
According to the data measured during this observation in 2011, the wind speed varied from 2.9 to 4.5 m/s and averaged 4.1 m/s in the flood season, while it varied from 4.6 to 6.0 m/s and averaged 5.3 m/s in the dry season. The river water discharges during the observations in the flood and dry seasons were ~28,200 and 12,800 m3/s, respectively. The water discharge during the flood season was 1.5 times larger than that in the dry season, while the wind speed during the dry season was ~30% larger than that in the flood season. This proved the above mechanism.
This phenomenon reversed in the upper reach of the South Branch and the outer estuary (Figure 5). Only at one site of the upper reach of the South Branch, the SSC in the dry season is around the same level as that in the flood season. At the remaining sites, the SSCs in the flood season were always higher than those in the dry season. The SSCs in this region averaged 0.21 kg/m3 during the flood season, 22% higher than that in the dry season (Figure 5, Table 2). The ocean played a minor role at the upper reach of the South Branch, where water was deep and wind-induced waves from the outer sea were inaccessible. Thus, SSCs in this region were mainly determined by the Yangtze’s riverine suspended sediment flux. The riverine SSC in the flood season was still much higher than that in the dry season, though it decreased by >80% after the closure of all these dams [45]. In the outer estuary, where water was deep, the wave’s energy was too weak to bring sediments into water columns.
4.2.3. Interannual variations of SSC
This part was based on the data collected in the flood season between 2001 and 2018, considering that the sediment flux in the flood season (from June to August) occupied >50% of the total annual amount during the past decades.
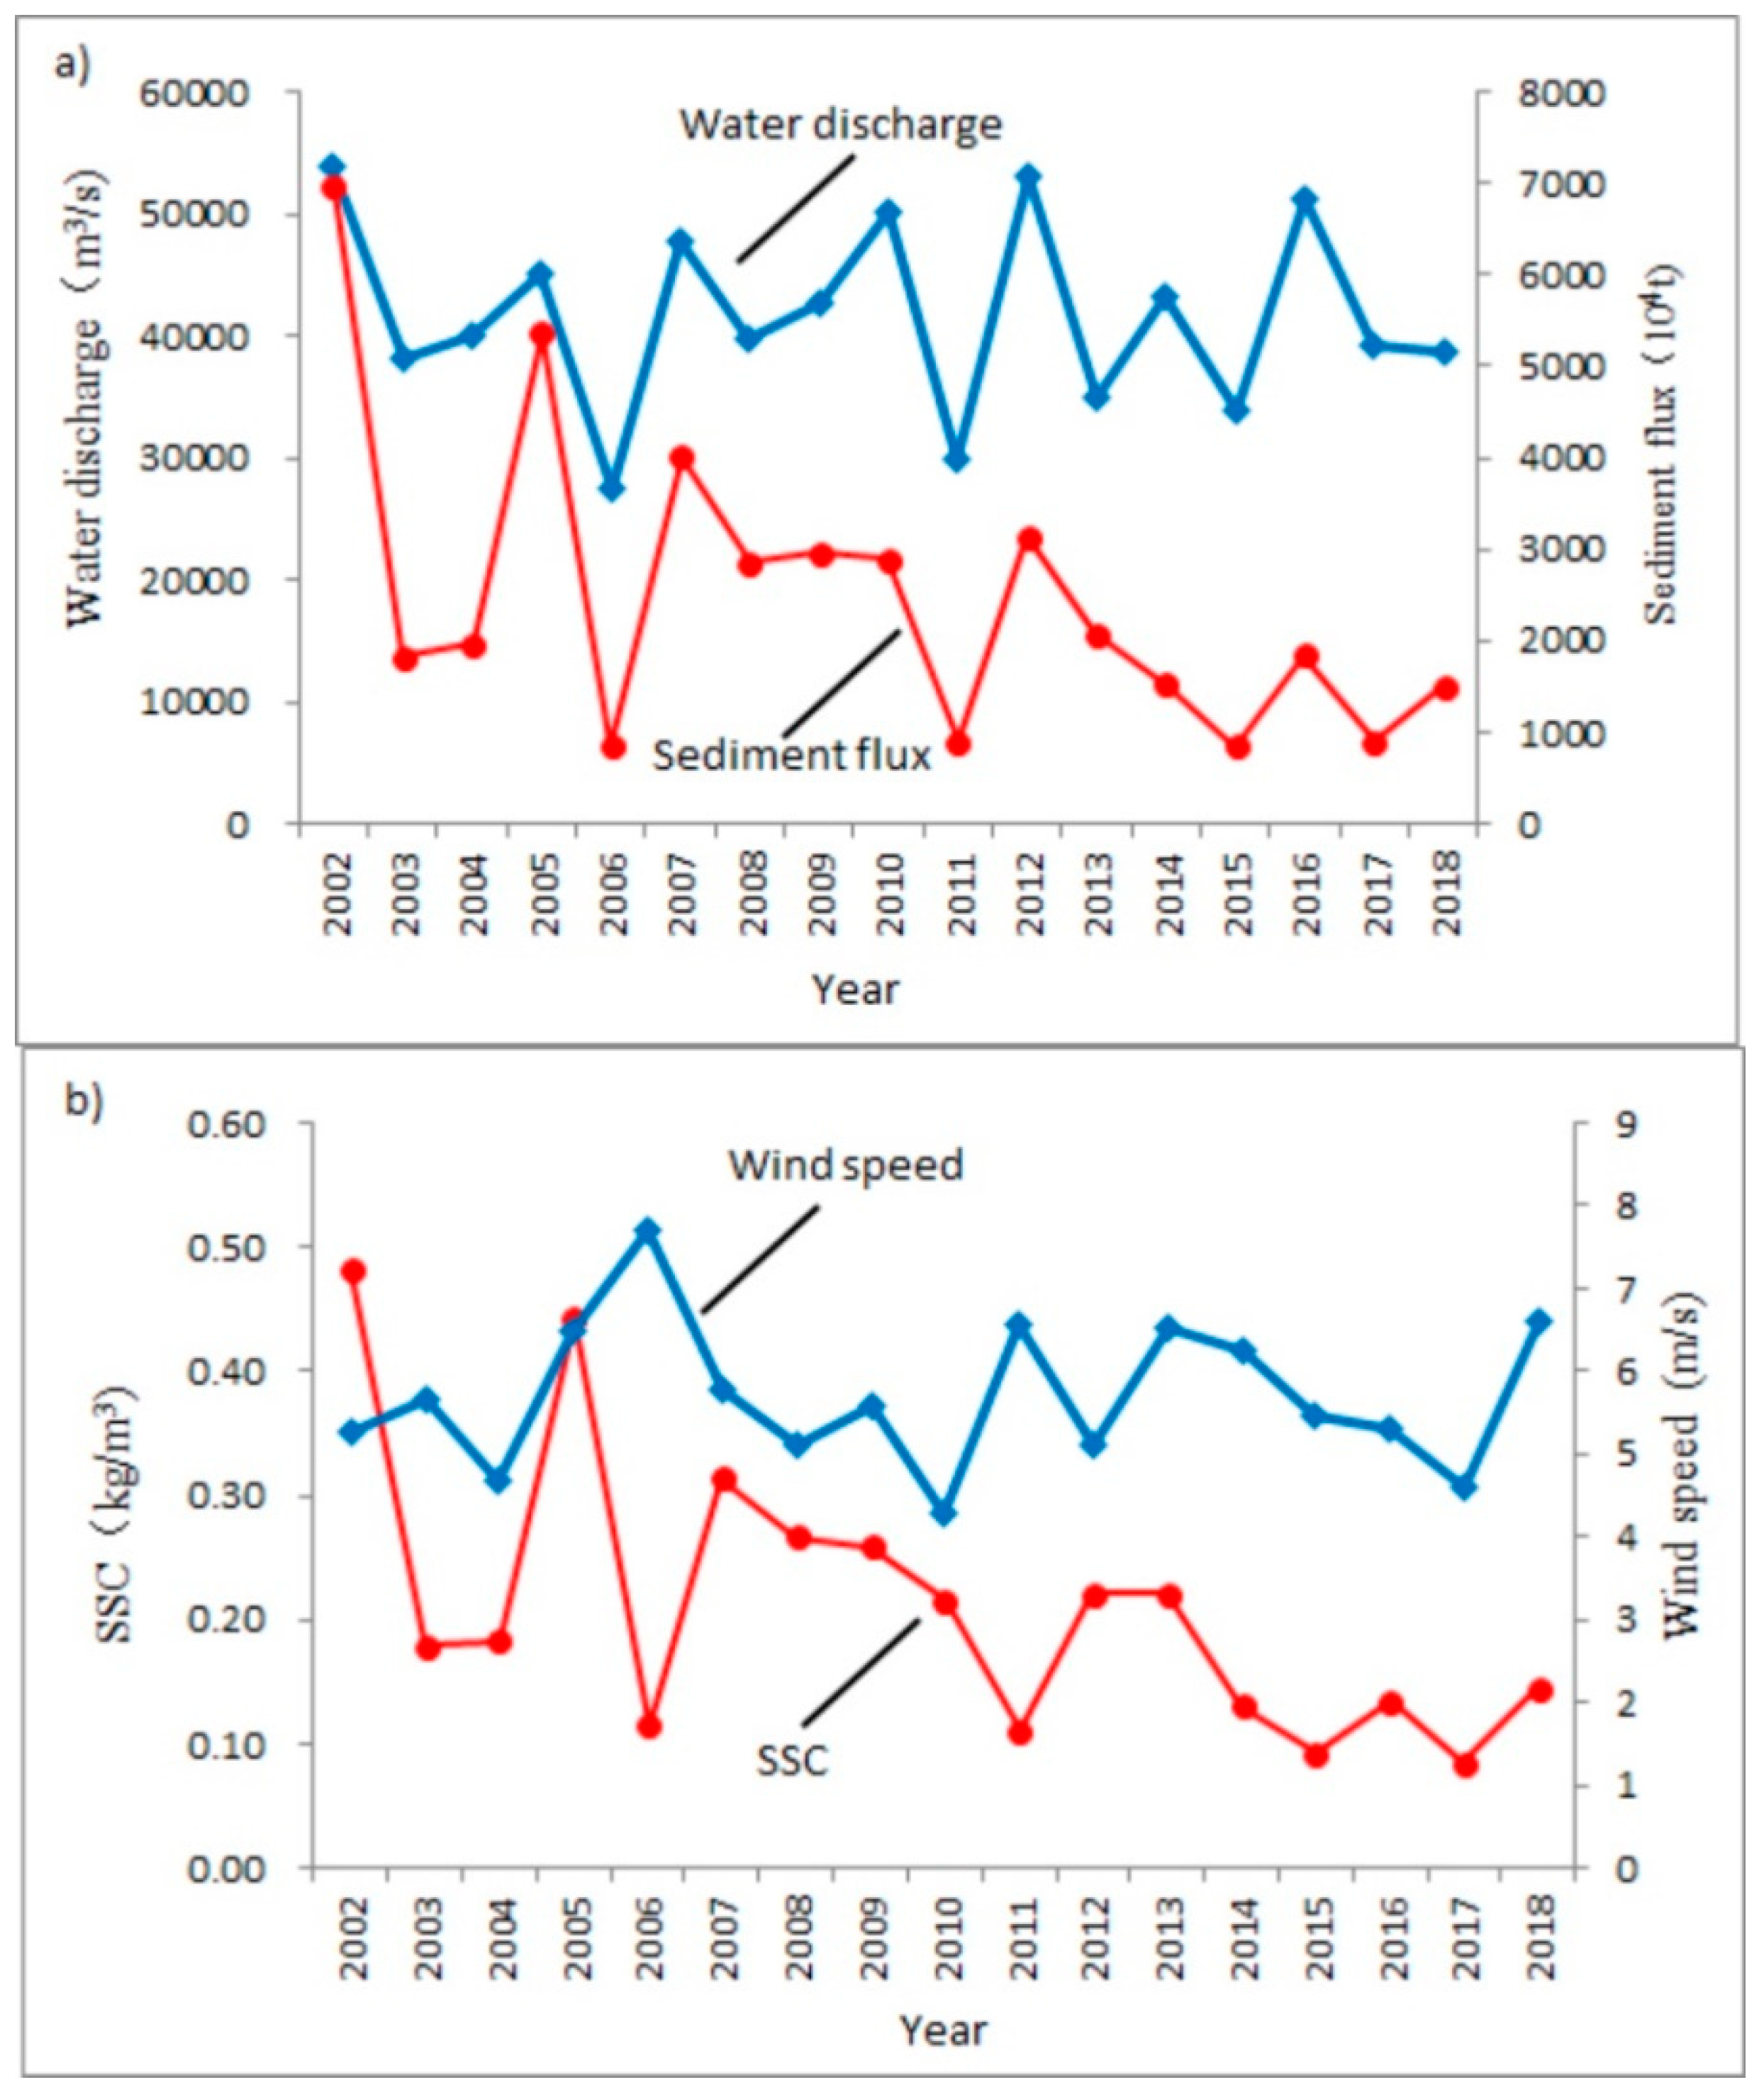
The Yangtze’s water discharge in August has exhibited a periodic oscillation at a relatively stable mean level of around 42,100 m3/s since 2002 (Figure 6a). The Yangtze’s sediment flux in August experienced a similar periodic oscillation with the water discharge (linear-regression analysis: R = 0.7) but displayed an overall downward trend (Figure 6a). Compared to 70 Mt in August 2002, it decreased to only 18 Mt in August 2003, mainly owing to the impoundment of the TGD in June 2003 [23,45]. In the first years after the construction of the TGD, the filling of the reservoir had a significant influence on the discharge regime in the lower Yangtze River. The TGD let the finest sediment (fine silt and clay) pass but retained the morphologically important coarse silt fraction. This might explain the declines in the sediment flux and SSC in the years 2003, 2004 and 2006 (Figure 6). As the input from riverbed erosion downstream of the TGD, the Yangtze’s sediment flux recovered but remained in a downward tendency [25,45].
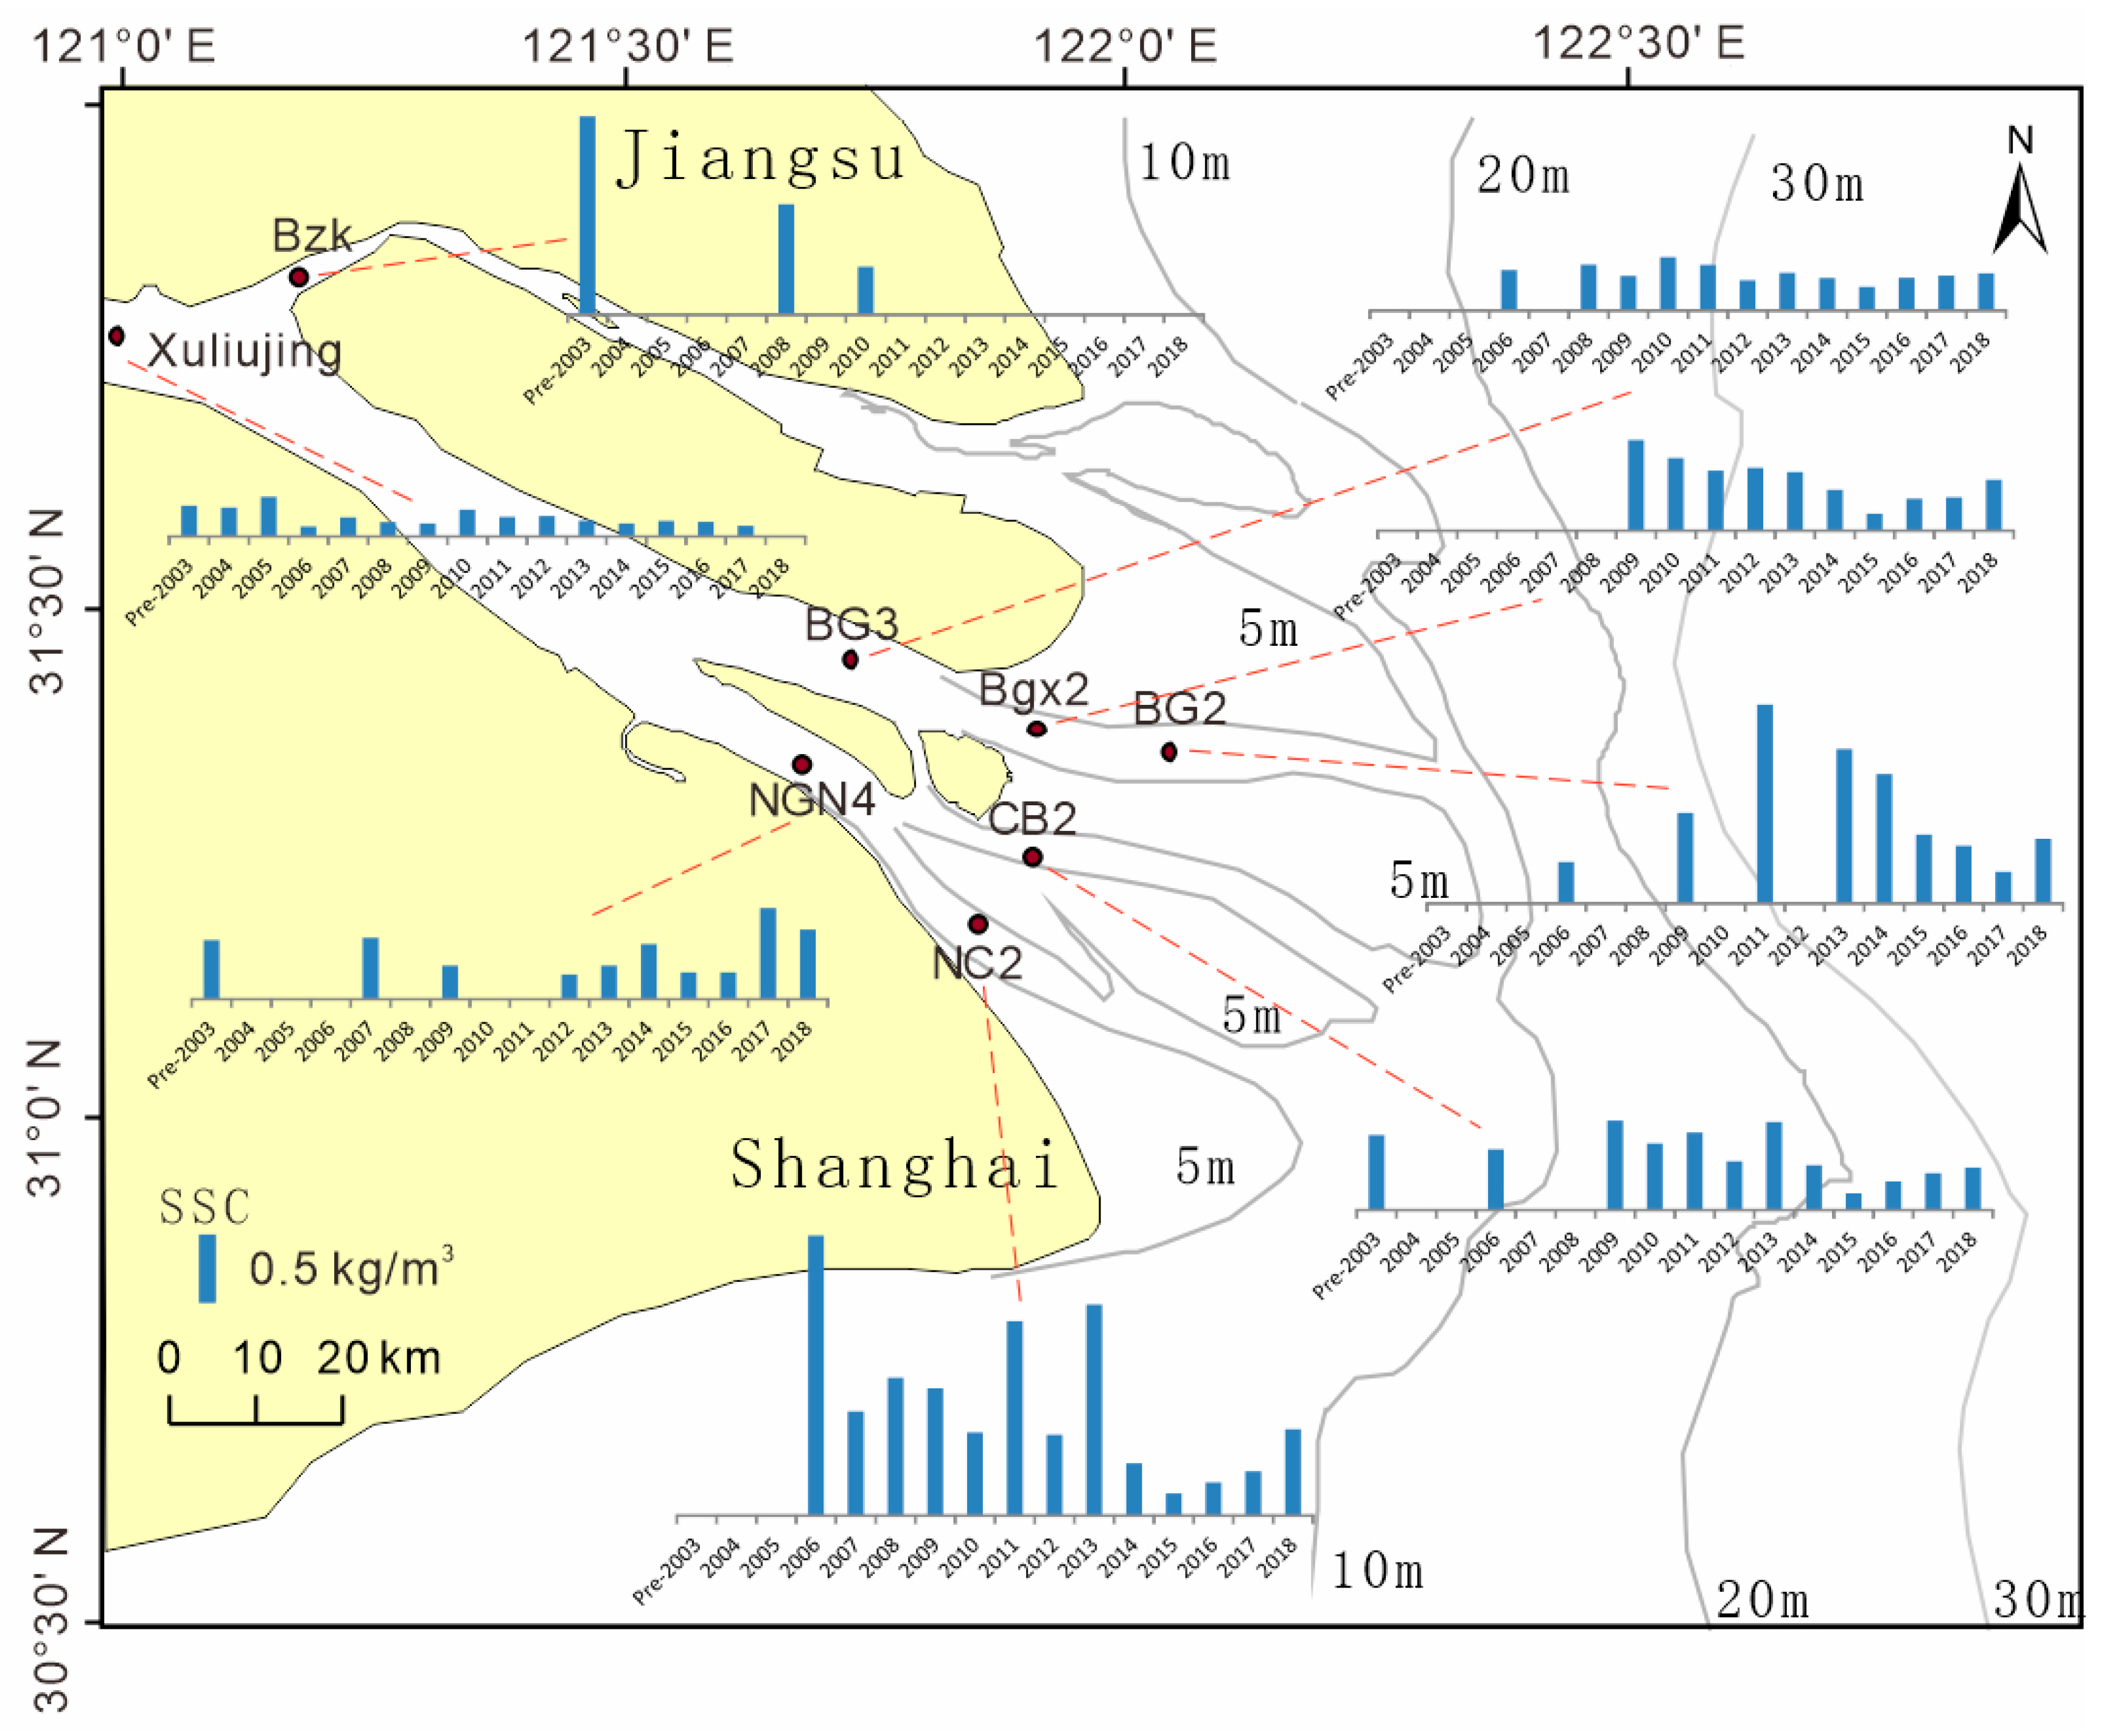
SSC at the Xuliujing Station exhibited an overall decreasing trend (Figure 7). Compared to the pre-2003 level (0.22 kg/m3), the SSC in 2017 (0.08 kg/m3) decreased by 64%. The Yangtze’s sediment flux declined sharply in 2006 (Figure 6a) and the SSC was only 0.07 kg/m3 at an extremely low level (Figure 6b). After 2006, the SSC recovered with the increase of annual riverine sediment flux. The SSCs at the Xuliujing Station have trended down in general since 2010, closely related to the Yangtze’s sediment flux. Due to lack of data in most of the years, the SSC at the Bzk Station (Figure 7) in the North Branch also decreased from 1.42 kg/m3 in the pre-2003 period to 0.79 kg/m3 in 2008, and then to 0.35 kg/m3 in 2010 (Figure 7).
The SSCs in the North and South Channels and the North and South Passages all showed decreasing trends as a whole, including some distinct annual fluctuations before 2016, after which the SSCs rose again (Figure 7). The high values of SSC in the mouth bar area after 2016 might be attributed to the recent increase of August wind velocities (Figure 6b). As mentioned above, the SSC in the reach of the inner estuary was mainly controlled by riverine inputs, while the SSC in the mouth bar area not only reflected the riverine inputs but was also influenced by local wind energies.
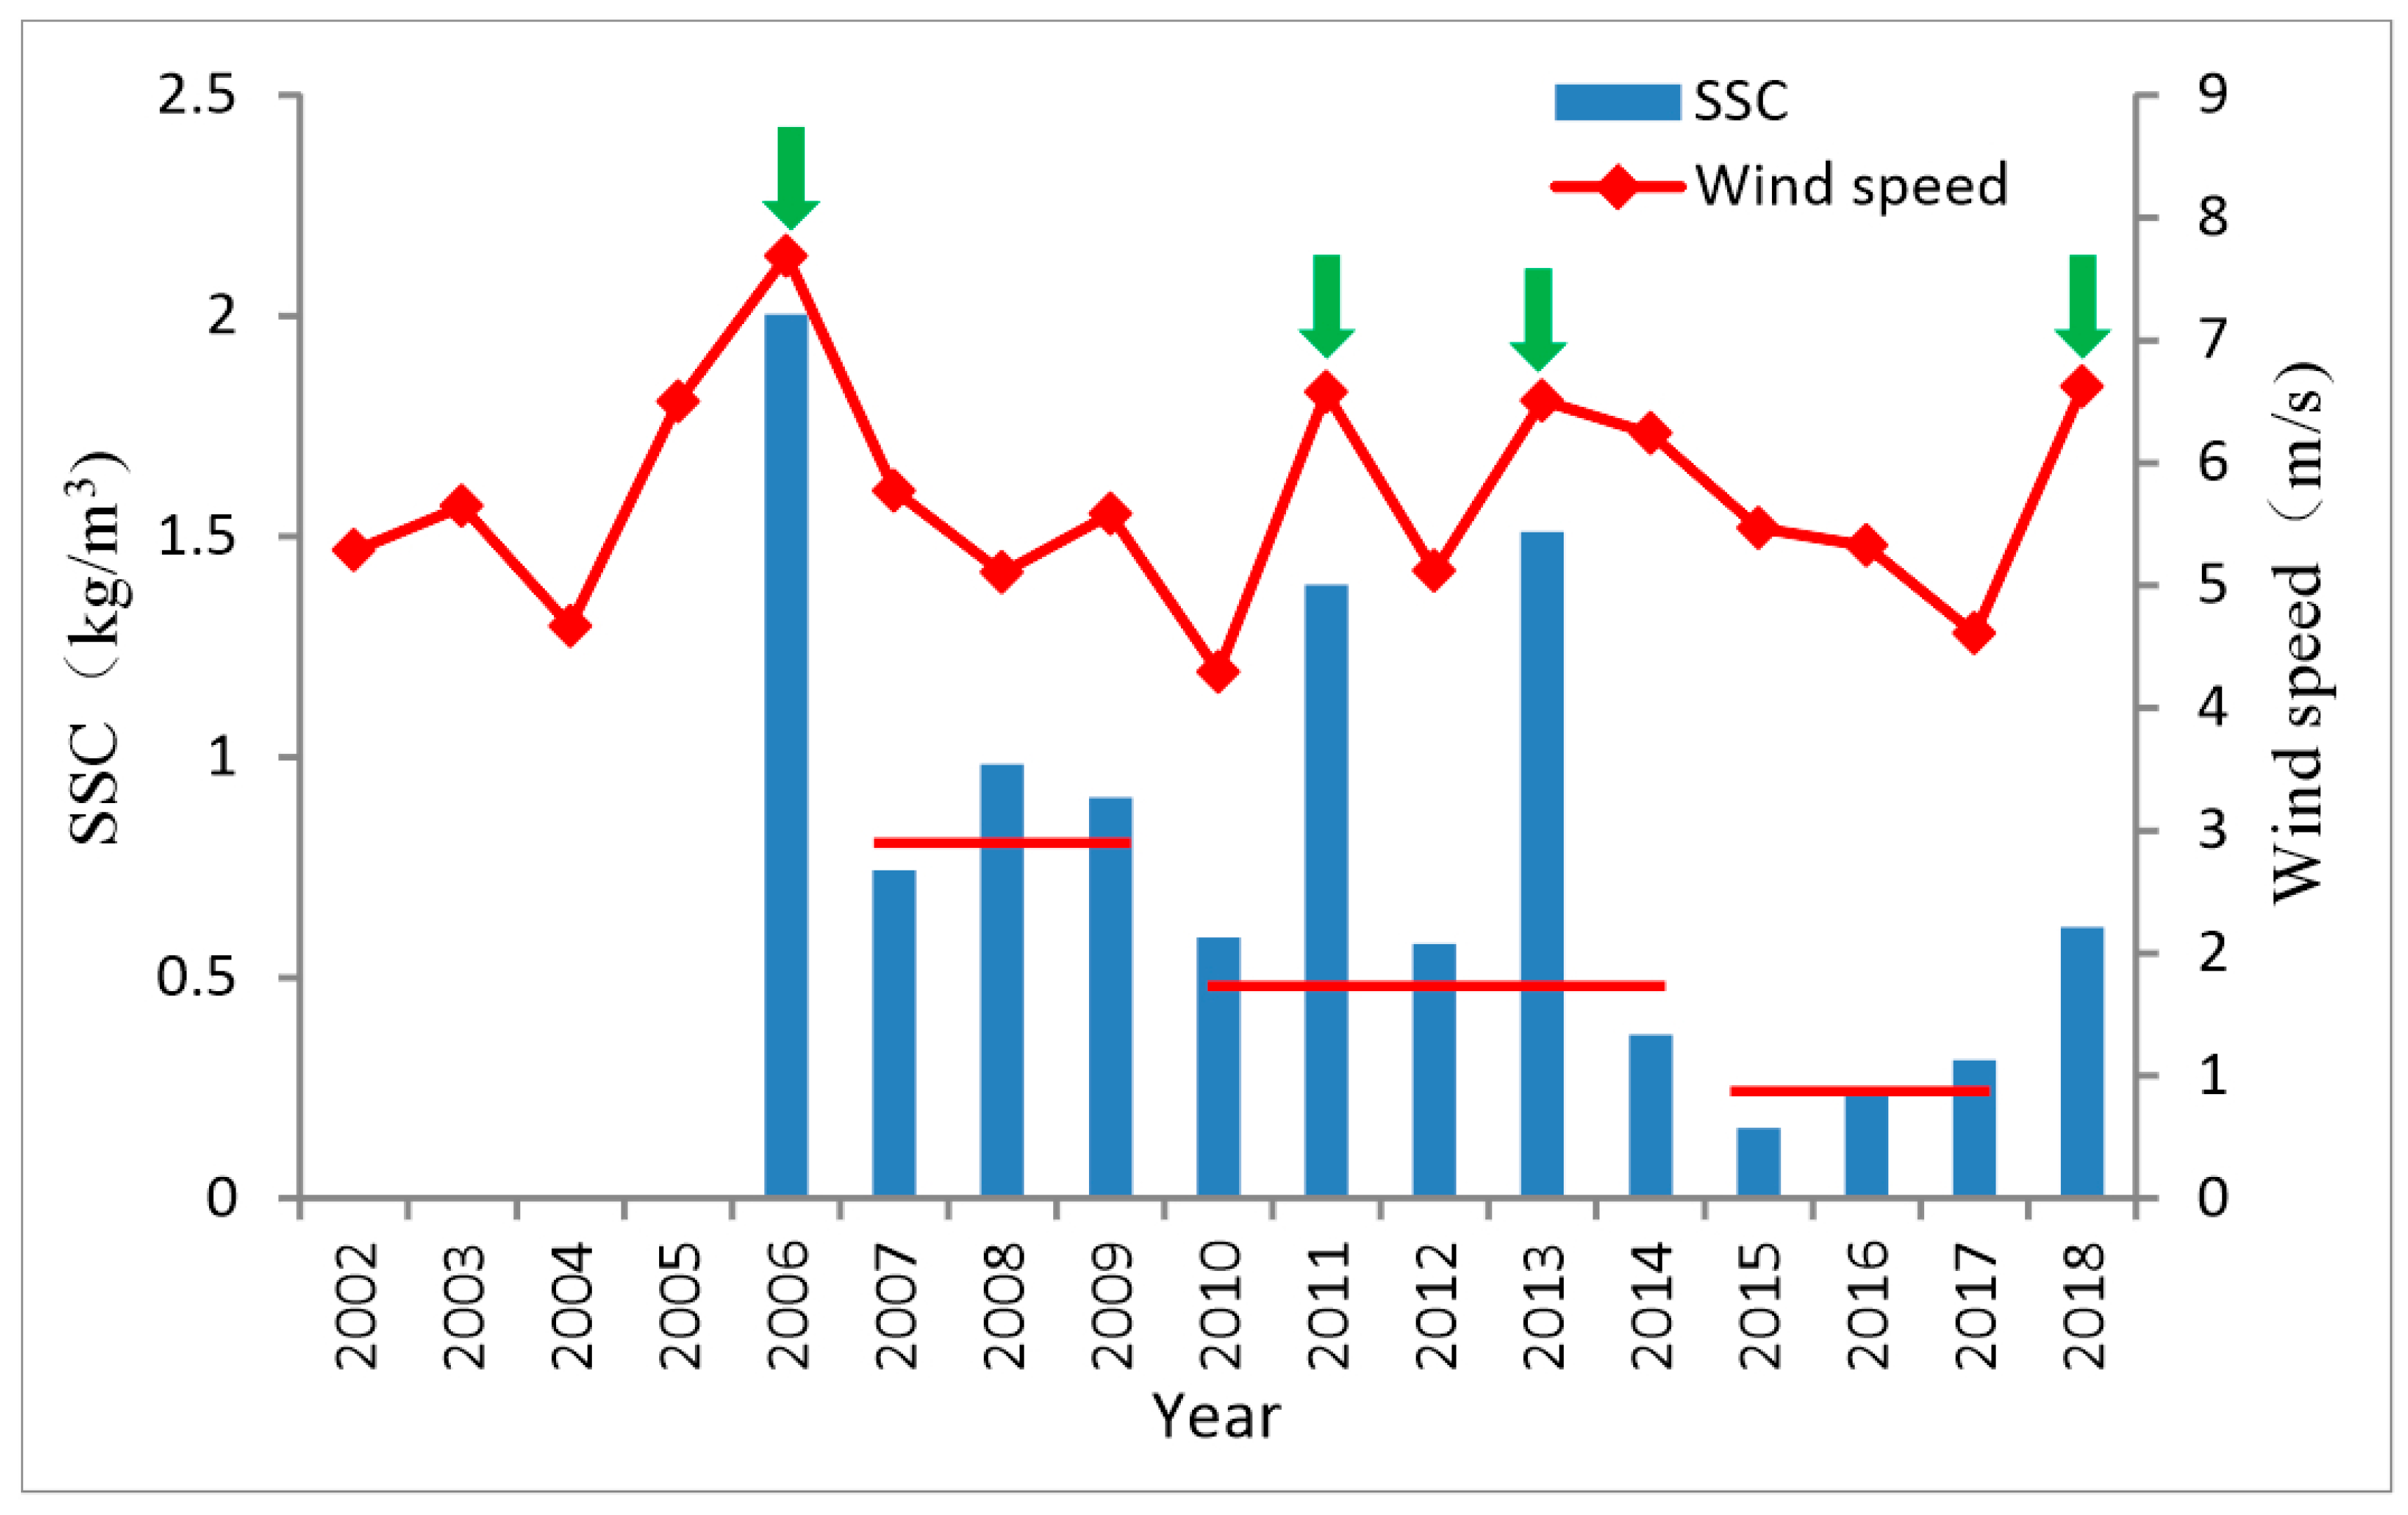
Take, for instance, the interannual variation of SSC at the NC2 Station in the South Passage (Figure 7). In the years of 2006, 2011, 2013 and 2018, the SSCs all responded well to the wind speeds (Figure 8). The input from re-suspended sediment flux by wind-induced waves contributed a large portion to the local SSC, which led to the fluctuation in interannual variations of SSC. This uncertainty associated with wind-induced waves did not change the overall downward trend over time. Compared to the first period (2007–2009: 0.88 kg/m3), the SSC decreased to 0.51 kg/m3 in the second period (2010, 2012 and 2014) and then to 0.24 kg/m3 in the third period (2015–2017); the reductions were 42% and 73%, respectively (Figure 8). Regardless of the fluctuations of SSC, the SSCs in the South Passage decreased in steps during the recent 10 years.
Sediment coarsening of the bed in the mouth bar area was reported by previous studies during the process of the delta’s transition from accumulation to erosion [25,46]. This is primarily ascribed to the re-suspension of the finer portion in bed sediments. The supplementation to local SSC from re-suspended bed sediments especially in the mouth bar area also contributed to this fluctuation of SSC.
Considering there will be more dams and water-soil conservation projects in the Yangtze basin [23,45], while the large lakes connected to the Yangtze and its riverbed may supplement much more sediment, the future of the sediment transport to the estuary will probably be complex. Thus, the evolution process of SSC will be complicated, accompanied by fluctuations resulted from wind-induced waves, especially under strong winds’ impacts during dry seasons. Apart from these factors, human interventions in the Yangtze Estuary including reclamations, reservoirs, water engineering and dredging works also have significant effects on local SSC, which requires further analyses in future studies.
5. Conclusions
Going from the Xuliujing Station to the outer estuary longitudinally, the SSC first tended to increase and then to decrease, mainly due to the existence of the turbidity maximum zone in the mouth bar area. Vertically in the water column, the differences between the surface and the bottom layers were quite large. Though the hydrodynamic force was strong in the Yangtze Estuary, the upward diffusion of SSC in the water column was still weak. In the Yangtze Estuary, the SSC during spring tides were always higher than that during neap tides. As for the seasonal variations, the SSC in the dry seasons were higher than that in the flood season in the North Branch and mouth bar area, mainly reflecting the dominated impactor of wind-induced waves. While in the inner estuary of the South Branch and outer estuary, the seasonal variation of SSC reversed. It mainly reflected the domination of the Yangtze River and weak influence from waves due to land’s cut-off or deep-water environment. The SSCs at most of the stations showed overall decreasing trends on interannual scales, accompanied by some distinct annual fluctuations resulting primarily from increased wind-wave energies. Climatic change is also a vital factor affecting the estuarine SSC, which makes the SSC’s evolution unpredictable and highlights the need for more studies.
Author Contributions
H.Y., Z.Z. and F.Z. conceived this study. B.L., C.Z. and H.Q. conducted the field observation. Y.L. and J.B. finished the data analyses and calculations. H.Y. wrote the draft of the manuscript and prepared the figures. All authors reviewed the manuscript. We appreciate the comments and suggestions from three anonymous reviewers. All authors have read and agreed to the published version of the manuscript.
Funding
This work was supported by the Shanghai Sailing Program (Grant number 19YF1452100), the Project of Shanghai Science and Technology Commission (Grant number 17DZ1204802) and the Open Research Fund of State Key Laboratory of Estuarine and Coastal Research (Grant number SKLEC-PGKF201904).
Conflicts of Interest
The authors declare no conflicts of interest.
References
- Etter, R.J.; Grassle, J.F. Patterns of species diversity in the deep sea as a function of sediment particle size diversity. Nature 1992, 360, 576–578. [Google Scholar] [CrossRef]
- Xu, K.H.; Li, A.; Liu, J.P.; Milliman, J.D.; Yang, Z.S.; Liu, C.S.; Kao, S.J.; Wan, S.M.; Xu, F.J. Provenance, structure, and formation of the mud wedge along inner continental shelf of the East China Sea: A synthesis of the Yangtze dispersal system. Mar. Geol. 2012, 291, 176–191. [Google Scholar] [CrossRef]
- Wu, S.H.; Chen, H.Q.; Xu, Y.J.; Li, J.F.; Zheng, S.W.; Xu, W. Riverbed Micromorphology of the Yangtze River Estuary, China. Water 2016, 8, 190. [Google Scholar] [CrossRef] [Green Version]
- Maloney, J.M.; Bentley, S.J.; Xu, K.; Obelcz, J.; Georgiou, I.; Miner, M. Mississippi river subaqueous delta is entering a stage of retrogradation. Mar. Geol. 2018, 400, 12–23. [Google Scholar] [CrossRef]
- Zhu, X.C.; Zhang, R.F.; Wu, Y.; Zhu, J.R.; Bao, D.Y.; Zhang, J. The Remobilization and Removal of Fe in Estuary—A Case Study in the Changjiang Estuary, China. J. Geophys. Res. Oceans 2018, 123, 2539–2553. [Google Scholar] [CrossRef]
- Wang, J.; Xu, K.; Li, C.; Li, C.Y.; Obelcz, J.B. Forces Driving the Morphological Evolution of a Mud-Capped Dredge Pit, Northern Gulf of Mexico. Water 2018, 10, 1001. [Google Scholar] [CrossRef] [Green Version]
- Stefan, H.G.; Cardoni, J.J.; Schiebe, F.R.; Cooper, C.M. Model of light penetration in a turbid lake. Water Resour. Res. 1983, 19, 109–120. [Google Scholar] [CrossRef]
- Bilotta, G.S.; Brazier, R.E. Understanding the influence of suspended solids on water quality and aquatic biota. Water Res. 2008, 42, 2849–2861. [Google Scholar] [CrossRef]
- Gao, J.; Shi, H.; Dai, Z.; Mei, X.; Zong, H.; Yang, H.; Hu, L.; Li, S. Linkages between the spatial toxicity of sediments and sediment dynamics in the Yangtze River estuary and neighboring East China Sea. Environ. Pollut. 2018, 233, 1138–1146. [Google Scholar] [CrossRef]
- Xu, K.; Corbett, D.R.; Walsh, J.P.; Young, D.; Briggs, J.B.; Cartwright, G.M.; Friedrichs, C.T.; Harris, C.K.; Mickey, R.C.; Mitra, S. Seabed erodibility variations on the Louisiana continental shelf before and after the 2011 Mississippi River flood. Estuar. Coast. Shelf Sci. 2014, 149, 283–293. [Google Scholar] [CrossRef]
- Maan, D.C.; Prooijen, B.C.; Wang, Z.B.; De Vriend, H.J. Do intertidal flats ever reach equilibrium? J. Geophys. Res. 2015, 120, 2406–2436. [Google Scholar] [CrossRef]
- Shi, B.W.; Yang, S.L.; Wang, Y.P. Intertidal erosion and deposition interpreted from field observations of hydrodynamic and sedimentary processes: A case study from an exposed, meso–macrotidal and highly turbid mudflat–saltmarsh transition. Cont. Shelf Res. 2014, 90, 109–116. [Google Scholar] [CrossRef]
- Yang, H.F.; Yang, S.L.; Xu, K.H.; Wu, H.; Shi, B.W.; Zhu, Q.; Zhang, W.X.; Yang, Z. Erosion potential of the Yangtze Delta under sediment starvation and climate change. Sci. Rep. 2017, 7, 10535. [Google Scholar] [CrossRef] [Green Version]
- Vörömarty, C.J.; Meybeck, M.; Fekete, B.; Sharma, K.; Green, P.; Syvitski, J.P. Anthropogenic sediment retention: Major global impact from registered river impoundments. Glob. Planet. Chang. 2003, 39, 169–190. [Google Scholar] [CrossRef]
- Meade, R.H.; Moody, J.A. Causes for the decline of suspended–sediment discharge in the Mississippi River system, 1940–2007. Hydrol. Process. 2010, 24, 35–49. [Google Scholar] [CrossRef]
- Milliman, J.D.; Farnsworth, K.L. River Discharge to the Coastal Ocean: A Global Synthesis; Cambridge University Press: Cambridge, UK, 2011. [Google Scholar]
- Wiegel, R.L. Nile delta erosion. Science 1996, 272, 338–340. [Google Scholar] [CrossRef]
- Giosan, L.; Syvitski, J.; Constantinescu, S.; Day, J. Protect the world’s deltas. Nature 2014, 516, 31–33. [Google Scholar] [CrossRef] [PubMed] [Green Version]
- Tessler, Z.D.; Vörösmarty, C.J.; Grossberg, M.; Gladkova, I.; Aizenman, H.; Syvitski, J.P.; Foufoula-Georgiou, E. Profiling risk and sustainability in coastal deltas of the world. Science 2015, 349, 638–643. [Google Scholar] [CrossRef] [PubMed] [Green Version]
- Zang, Z.C.; Xue, Z.G.; Xu, K.H.; Bentley, S.J.; Chen, Q.; D’Sa, E.J.; Ge, Q. A Two Decadal (1993–2012) Numerical Assessment of Sediment Dynamics in the Northern Gulf of Mexico. Water 2019, 11, 938. [Google Scholar] [CrossRef] [Green Version]
- Ly, C.K. The role of the Akosombo Dam on the Volta River in causing coastal erosion in central and eastern Ghana. Mar. Geol. 1999, 37, 323–332. [Google Scholar] [CrossRef]
- Blum, M.D.; Roberts, H.H. Drowning of the Mississippi Delta due to insufficient sediment supply and global sea-level rise. Nat. Geosci. 2009, 2, 488–491. [Google Scholar] [CrossRef]
- Yang, S.L.; Milliman, J.D.; Li, P.; Xu, K.H. 50,000 dams later: Erosion of the Yangtze River and its delta. Glob. Planet. Chang. 2011, 75, 14–20. [Google Scholar] [CrossRef]
- Yang, S.L.; Milliman, J.D.; Xu, K.H.; Deng, B.; Zhang, X.Y.; Luo, X.X. Downstream sedimentary and geomorphic impacts of the three gorges dam on the Yangtze River. Earth Sci. Rev. 2014, 138, 469–486. [Google Scholar] [CrossRef]
- Luo, X.X.; Yang, S.L.; Zhang, J. The impact of the Three Gorges Dam on the downstream distribution and texture of sediments along the middle and lower Yangtze River (Changjiang) and its estuary, and subsequent sediment dispersal in the East China Sea. Geomorphology 2012, 179, 126–140. [Google Scholar] [CrossRef]
- Li, M.T.; Cheng, H.Q.; Zhou, F.N.; Wu, J.W.; Li, B.C. The effect of sand digging to bedform stability of the Nangang Channel in the Changjiang River Mouth. Hydrogr. Surv. Charting 2011, 31, 50–53. (In Chinese) [Google Scholar]
- Song, D.; Wang, X.H.; Cao, Z.; Guan, W. Suspended sediment transport in the deepwater navigation channel, Yangtze river estuary, China, in the dry season 2009: 1. observations over spring and neap tidal cycles. J. Geophys. Res. Oceans 2013, 118, 5555–5567. [Google Scholar] [CrossRef]
- Luan, H.L.; Ding, P.X.; Wang, Z.B.; Ge, J.Z.; Yang, S.L. Decadal morphological evolution of the Yangtze Estuary in response to river input changes and estuarine engineering projects. Geomorphology 2016, 265, 12–23. [Google Scholar] [CrossRef]
- Luan, H.L.; Ding, P.X.; Wang, Z.B.; Yang, S.L.; Lu, J.Y. Morphodynamic impacts of large-scale engineering projects in the Yangtze River delta. Coast. Eng. 2018, 141, 1–11. [Google Scholar] [CrossRef]
- Chen, S.L.; Zhang, G.A.; Yang, S.L. Temporal and spatial changes of suspended sediment concentration and resuspension in the Yangtze River Estuary. J. Geogr. Sci. 2003, 13, 498–506. [Google Scholar]
- Dai, Z.J.; Chu, A.; Li, W.H.; Li, J.F.; Wu, H.L. Has suspended sediment concentration near the mouth bar of the Yangtze (Changjiang) estuary been declining in recent years? J. Coast. Res. 2013, 29, 809–818. [Google Scholar] [CrossRef]
- Shen, F.; Zhou, Y.; Li, J.; He, Q.; Verhoef, W. Remotely sensed variability of the suspended sediment concentration and its response to decreased river discharge in the Yangtze estuary and adjacent coast. Cont. Shelf Res. 2013, 69, 52–61. [Google Scholar] [CrossRef]
- Yang, Y.P.; Zhang, M.J.; Li, Y.T.; Zhang, W. The variations of suspended sediment concentration in Yangtze River Estuary. J. Hydrodyn. 2015, 27, 845–856. [Google Scholar] [CrossRef]
- Liu, J.H.; Yang, S.L.; Zhu, Q.; Zhang, J. Controls on suspended sediment concentration profiles in the shallow and turbid Yangtze estuary. Cont. Shelf Res. 2014, 90, 96–108. [Google Scholar] [CrossRef]
- Li, P.; Yang, S.L.; Milliman, J.D.; Xu, K.H.; Qin, W.H.; Wu, C.S.; Chen, Y.P.; Shi, B.W. Spatial, temporal, and human-induced variations in suspended sediment concentration in the surface waters of the Yangtze Estuary and adjacent coastal areas. Estuar. Coast. 2012, 35, 1316–1327. [Google Scholar] [CrossRef] [Green Version]
- Yang, Y.P.; Li, Y.T.; Sun, Z.H.; Fan, Y.Y. Suspended sediment load in the turbidity maximum zone at the Yangtze River Estuary: The trends and causes. Acta Geogr. Sin. 2014, 1, 129–142. [Google Scholar] [CrossRef]
- Chen, J.Y.; Zhu, H.F.; Dong, Y.F.; Sun, J.M. Development of the Changjiang estuary and its submerged delta. Cont. Shelf Res. 1985, 4, 47–56. [Google Scholar]
- Yang, S.L. Sedimentation on a growing intertidal island in the Yangtze River mouth. Estuar. Coast. Shelf Sci. 1999, 49, 401–410. [Google Scholar] [CrossRef]
- Yang, H.F.; Yang, S.L.; Xu, K.H. River-sea transitions of sediment dynamics: A case study of the tide-impacted Yangtze River estuary. Estuar. Coast. Shelf Sci. 2017, 196, 207–216. [Google Scholar] [CrossRef]
- Yangtze Water Resources Commission (YWRC). Yangtze Sediment Bulletin. Available online: http://www.cjh.com.cn (accessed on 30 January 2020). (In Chinese).
- An, Q.; Wu, Y.; Taylor, S.; Zhao, B. Influence of the three gorges project on saltwater intrusion in the Yangtze River estuary. Environ. Geol. 2009, 56, 1679–1686. [Google Scholar] [CrossRef]
- Chen, S. Seasonal, neap-spring variation of sediment concentration in the joint area between Yangtze Estuary and Hangzhou Bay. Sci. China Ser. B 2001, 44, 57–62. [Google Scholar] [CrossRef]
- Su, J.L.; Wang, K.S. Changjiang river plume and suspended sediment transport in Hangzhou Bay. Cont. Shelf Res. 1989, 9, 93–111. [Google Scholar]
- Xu, K.H.; Milliman, J.D. Seasonal variations of sediment discharge from the Yangtze River before and after impoundment of the three Gorges dam. Geomorphology 2009, 104, 276–283. [Google Scholar] [CrossRef]
- Yang, H.F.; Yang, S.L.; Xu, K.H.; Milliman, J.D.; Wang, H.; Yang, Z.; Chen, Z.; Zhang, C.Y. Human impacts on sediment in the Yangtze River: A review and new perspectives. Glob. Planet. Chang. 2018, 162, 8–17. [Google Scholar] [CrossRef]
- Yang, H.F.; Yang, S.L.; Meng, Y.; Xu, K.H.; Luo, X.X.; Wu, C.S.; Shi, B.W. Recent coarsening of sediments on the southern Yangtze subaqueous delta front: A response to river damming. Cont. Shelf Res. 2018, 155, 45–51. [Google Scholar] [CrossRef]
Figure 1.
Study area showing the sampling sites (a) and the geography (b) in the Yangtze Estuary.

Figure 2.
The spatial distribution of depth-averaged suspended sediment concentration for the whole tidal cycle in the Yangtze Estuary.
Figure 2.
The spatial distribution of depth-averaged suspended sediment concentration for the whole tidal cycle in the Yangtze Estuary.

Figure 3.
Differences of mean suspended sediment concentrations for the whole tidal cycle between the surface and bottom layers in the Yangtze Estuary.
Figure 3.
Differences of mean suspended sediment concentrations for the whole tidal cycle between the surface and bottom layers in the Yangtze Estuary.

Figure 4.
Differences of depth-averaged suspended sediment concentrations for the whole tidal cycle between spring and neap tides in the Yangtze Estuary.
Figure 4.
Differences of depth-averaged suspended sediment concentrations for the whole tidal cycle between spring and neap tides in the Yangtze Estuary.

Figure 5.
Differences of depth-averaged suspended sediment concentrations for the whole tidal cycle between dry and flood seasons in the Yangtze Estuary.
Figure 5.
Differences of depth-averaged suspended sediment concentrations for the whole tidal cycle between dry and flood seasons in the Yangtze Estuary.

Figure 6.
Variations of annual water discharge (a), sediment flux (a) and suspended sediment concentration (b) at Datong Station, and wind speed (b) in the Yangtze Estuary in August.
Figure 6.
Variations of annual water discharge (a), sediment flux (a) and suspended sediment concentration (b) at Datong Station, and wind speed (b) in the Yangtze Estuary in August.

Figure 7.
Interannual variations of suspended sediment concentration at some typical stations in August in the Yangtze Estuary.
Figure 7.
Interannual variations of suspended sediment concentration at some typical stations in August in the Yangtze Estuary.

Figure 8.
Interannual variations of suspended sediment concentration and wind speed in August in the South Passage.
Figure 8.
Interannual variations of suspended sediment concentration and wind speed in August in the South Passage.


Table 1.
Suspended sediment concentration in the Yangtze Estuary and Hangzhou Bay (kg/m3).
| Region | North Branch | Upper Reach of South Branch | North Channel | South Channel | North Passage | South Passage | Hangzhou Bay | Outer Estuary |
|---|---|---|---|---|---|---|---|---|
| SSC | 1.45 | 0.15 | 0.63 | 0.68 | 0.67 | 0.74 | 2.15 | 0.24 |
Notes: SSC is the depth-averaged value for the whole tidal cycle. It is the mean value of 84 samples, including six samples/hour for 14 h at each site.
Table 2.
Seasonal variations of SSC in the Yangtze Estuary (kg/m3).
| Region | Flood Season | Dry Season |
|---|---|---|
| North Branch | 1.07 | 1.58 |
| Upper Reach of South Branch | 0.21 | 0.18 |
| North Channel | 0.30 | 0.57 |
| South Channel | 0.26 | 0.68 |
| North Passage | 0.56 | 0.74 |
| South Passage | 1.39 | 0.77 |
| Outer Estuary | 1.08 | 0.84 |
© 2020 by the authors. Licensee MDPI, Basel, Switzerland. This article is an open access article distributed under the terms and conditions of the Creative Commons Attribution (CC BY) license (http://creativecommons.org/licenses/by/4.0/).
Share and Cite
MDPI and ACS Style
Yang, H.; Li, B.; Zhang, C.; Qiao, H.; Liu, Y.; Bi, J.; Zhang, Z.; Zhou, F. Recent Spatio-Temporal Variations of Suspended Sediment Concentrations in the Yangtze Estuary. Water 2020, 12, 818. https://doi.org/10.3390/w12030818
AMA Style
Yang H, Li B, Zhang C, Qiao H, Liu Y, Bi J, Zhang Z, Zhou F. Recent Spatio-Temporal Variations of Suspended Sediment Concentrations in the Yangtze Estuary. Water. 2020; 12(3):818. https://doi.org/10.3390/w12030818
Chicago/Turabian StyleYang, Haifei, Bochang Li, Chaoyang Zhang, Hongjie Qiao, Yuting Liu, Junfang Bi, Zhilin Zhang, and Fengnian Zhou. 2020. "Recent Spatio-Temporal Variations of Suspended Sediment Concentrations in the Yangtze Estuary" Water 12, no. 3: 818. https://doi.org/10.3390/w12030818
Note that from the first issue of 2016, this journal uses article numbers instead of page numbers. See further details here.