1. Introduction
To assess and contrast coastal erosion is a rather topical issue, since coastal areas worldwide represent peculiar and very sensitive environments, extending for 1,634,701 km [
1]. The occupation and management of these areas needs to be planned properly, and the territory to be known in all its approaches in order to make decisions. Mapping the territory represents one of these actions and deciding on the proper methods to use becomes a tricky choice.
Map integration, in particular geomorphological mapping, has already been addressed as a potential tool in the evaluation of the resilience assessment of coastal areas procedures [
2,
3]. Moreover, it can be used to produce diagnostic indicators [
4], and new conceptual spatial units to future scenarios and coastal erosion risk assessment [
5]. Nowadays, computing trends of geomorphological variations have been widely tested, and many geomatic technologies [
6,
7] have become economically approachable, especially when taking into account readily available online resources, such as images and open data.
Several approaches regarding risk assessment procedures have been tested on the topic of the evaluation of coastal vulnerability and erosion risk [
8,
9,
10] In this context, the current scientific literature provides us with different physical and morphological parameters that have been proposed to build models to evaluate the sensitivity of coasts [
11,
12]. Unfortunately, even if there is no defined system for resilience assessment in vulnerable coastal areas, often due to a lack of indicators [
13], eventual assessments should generally integrate approaches from quite diverse fields of research and match a heterogeneous set of normative requirements that allow public and private stakeholders to use the coasts.
Some studies investigating the computing of coastal erosion vulnerability have shown how geomorphologic information is crucial in obtaining displacement values of the shoreline, reducing errors in shoreline position estimation, as well as in determining erosive and non-erosive classes in the trend analysis [
6]. However, these parameters have rarely been introduced into coastal erosion risk assessment formulae [
14]. These calculations sometimes produce generalized geomorphological settings of the beaches, because modelling has often been mostly focused on the relationship between economic values and the beach system, without assigning proper metrics [
15].
The vulnerability matrixes and risk analysis consider anthropogenic goods, and their exposition to natural processes [
16], and in this sense, the evaluation of coastal community sensitivity through the use of indexes and models [
17] examines the mechanisms on which the environment–society interaction takes place. On the other hand, an indicator-based approach to coastal vulnerability, which enables us to numerically relate causes and effects in coastal dynamics, and to produce future risk scenarios and resilience analysis [
12,
18,
19], should take into account the morphological trend registering the interaction of the involved matrixes with topography.
This paper proposes a framework that may be used to produce a basic model for the calculation of morphological trends in an Intervention Concerning the Erosion Causes (ICEC) strategy [
20,
21] at a local engineering scale [
12]. Consequently, natural hazard assessment tools that calculate indicators on territorial changes due to coastal infrastructure [
4], and methods that successfully facilitate their application [
22], can be supported in the spatialization of the risk classes. The integration of GIS mapping analysis with the morpho-sedimentological mapping can be useful to support the understanding of medium- and short-term processes. To demonstrate the validity of this framework, the Italian location of San Vincenzo has been selected as a case study. In this vulnerable area suffering from different coastal phenomena during the last decades, the normative at a national [
23] and regional level [
24] has been integrated with GIS procedures [
25] of coastal erosion assessment, taking into account morphological trends to analyze volumetric and linear variations in the sedimentary stock.
2. Materials and Methods
The evaluation of the coastal dynamics at the San Vincenzo test site (Tuscany, Italy), through a GIS procedure, was calculated on a large dataset comprising several kinds of morphometric features. Data were collected by the Department of Earth Sciences of the University of Florence since 2000, to monitor the coastal evolution during the future reshaping phases of the harbor. The dataset (
Table 1 and
Table 2) comprises a total of eight shorelines0F acquired from 2000 to 2018, a total of four bathymetric surveys acquired from 2000 to 2018, and 100 samples of sediment collected in 2014.
A morphological comparative analysis was carried out using a GIS suite (Esri ArcMap) through which shorelines and bathymetric rough data were homogenized and provided with the proper cartographic supports, such as topographic and geological supports.
2.1. Test Site Features
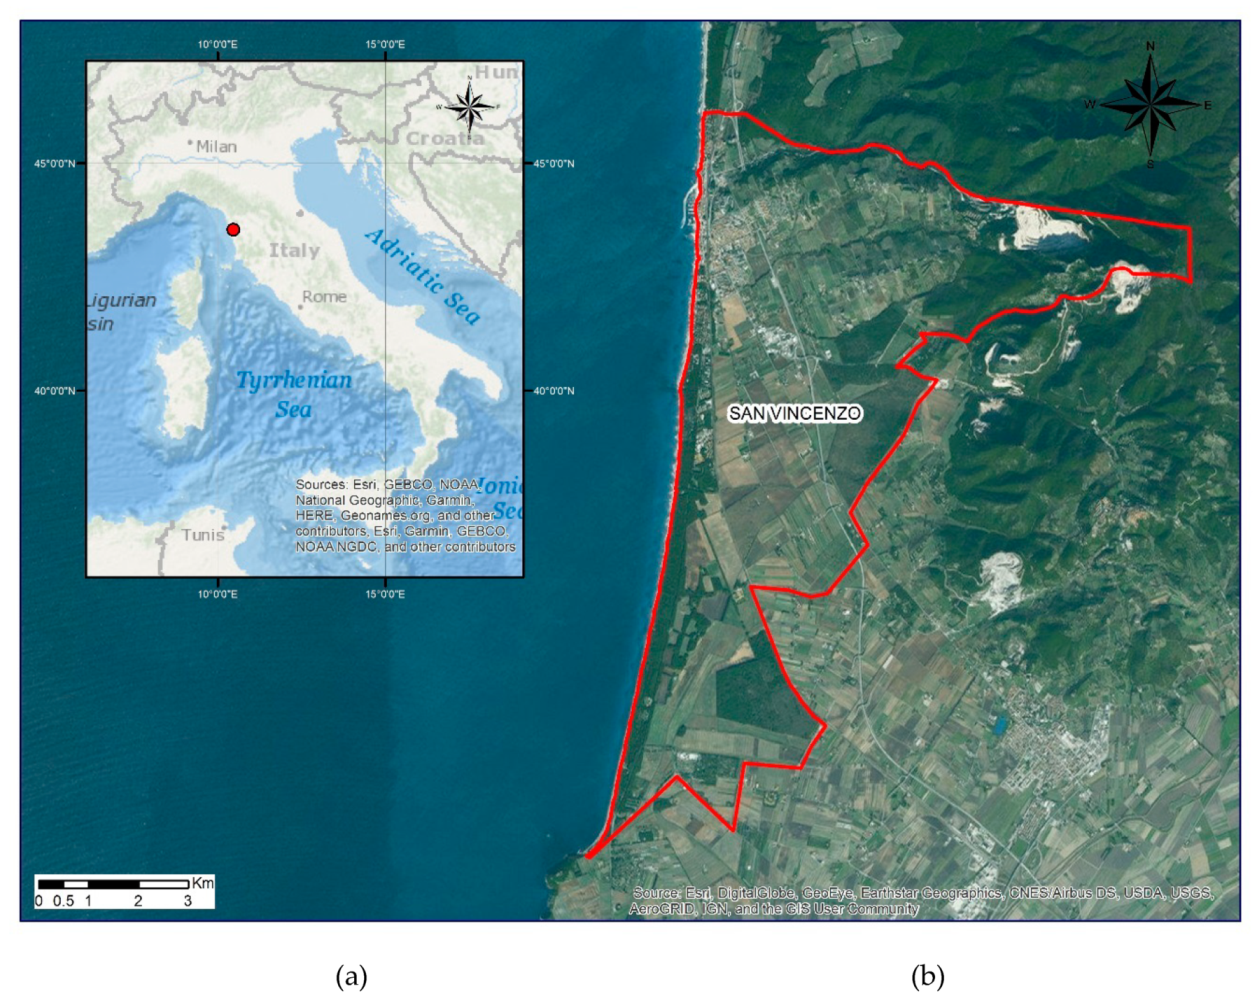
The San Vincenzo coastal area is on the northwestern coast of Italy, in the Mediterranean province of Livorno (
Figure 1). The Livorno province’s coastal area is a typical Mediterranean climate, with average annual temperatures of 15.5 °C [
26,
27]. Rainfall is lower than in the northern zone of the province and amounts to an annual average of 600 mm/year [
27,
28,
29] distributed in almost 60 days (mainly during the autumn winter), which alternate with long dry periods. The prevailing winds come from W to SW during the summer season, especially in anticyclonic conditions. During the period between March and October, the most frequent ones are breezes [
28].
The area of study had a total length of 13 km, is NE–SW oriented, and belongs to the sediment cell extending from Punta Lillatro to Torre Nuova (all locations cited in the paragraph on the Test site features are detailed in the kmz file available as
Supplementary Materials S1). San Vincenzo’s harbor became a small fishing port from 1954, when a first breakwater was built and superimposed on a beach rock deposit, in front of the urban center of San Vincenzo, both to protect the community as well as to provide a dock for vessels. During the second half of the 1970s, the harbor was completed, and the structure remained unchanged from 1977 until 2000, when an enlargement design was studied to transform the original harbor into a tourist one. The largest scale works were carried out between 2000 and 2010, when the tourist harbor was built. They comprised the activities to enlarge the original structure, as well as carrying out minor works such as groins and nourishments on both the sides of the harbor and of a 200-meter-long artificial basin at the harbor’s entrance, built in order to make boat traffic easier.
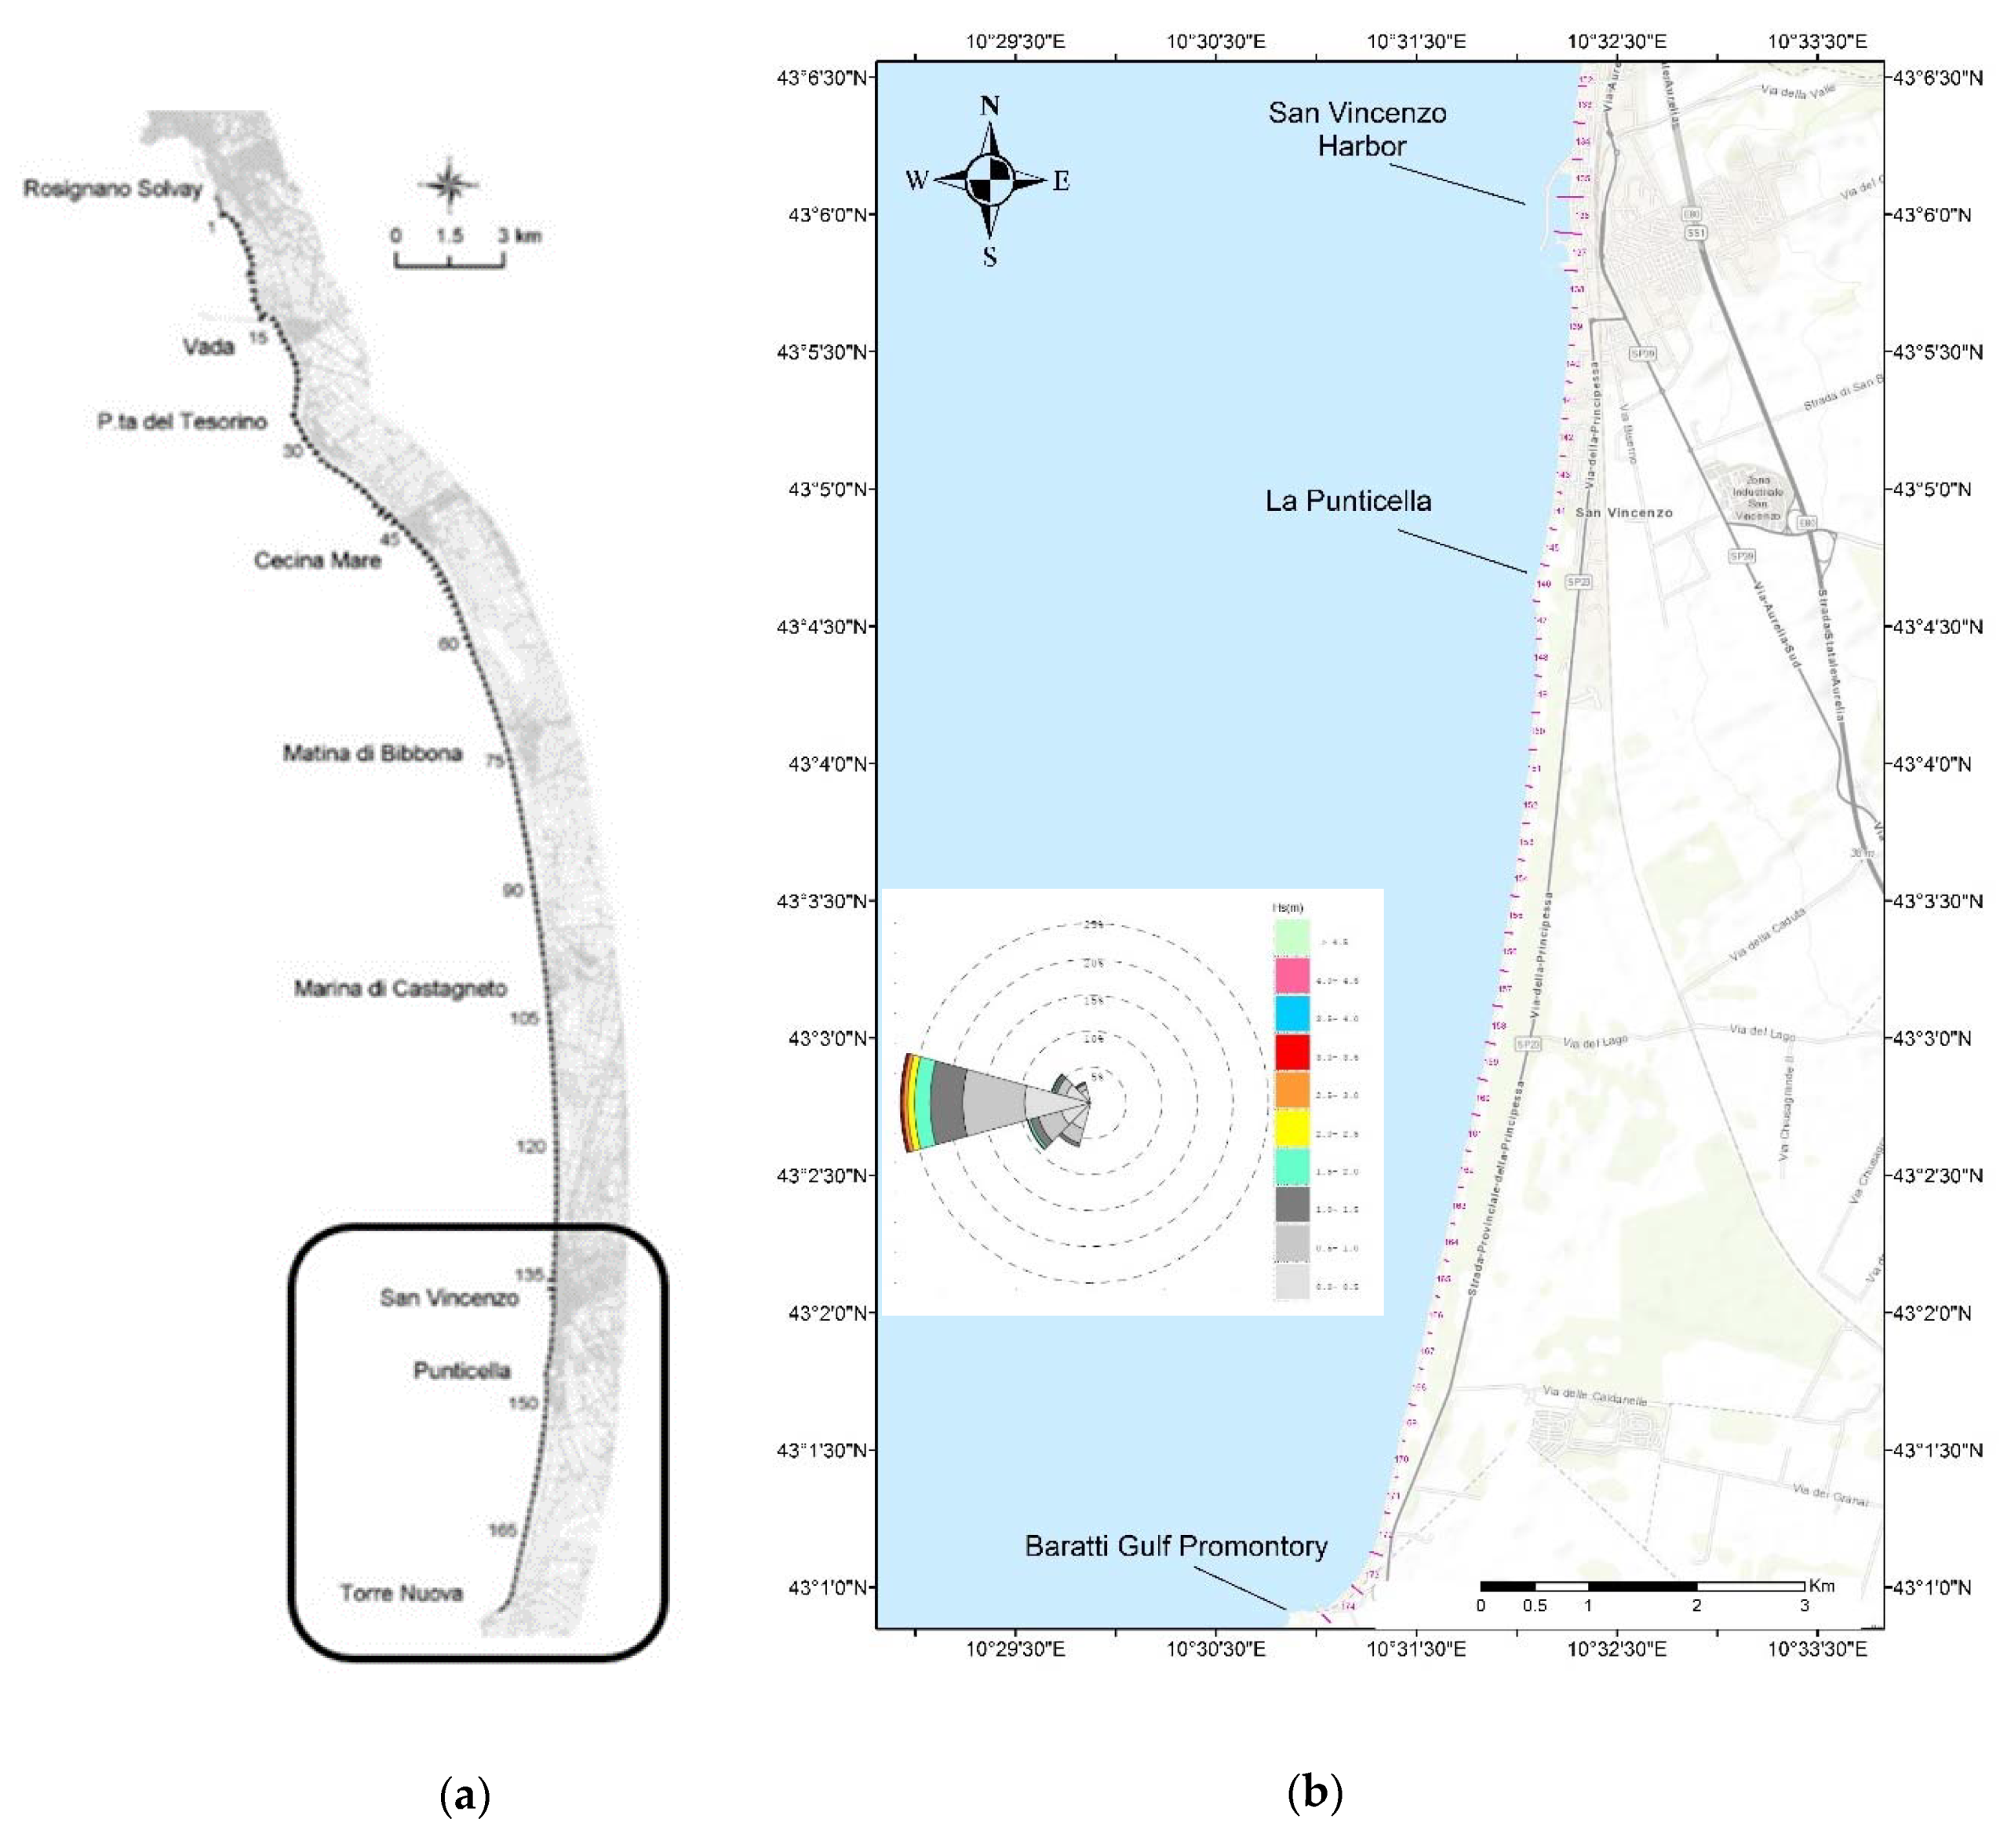
The coastline in the whole sediment cell comprises a sandy coast that contains cliffs just at the lateral edges of the cell. San Vincenzo municipality is located at the southern termination of the sediment cell. The main source of sediment is represented by the Cecina River that flows to the Cecina municipality (Cecina Mare in
Figure 2a). Although the Cecina River supplies most of the sediment to the cell, it has been highlighted that the San Vincenzo area was not affected by the same conditions with regard to erosive trends and sediment supply [
30,
31]. It has been isolated from the main sediment resources by both the appearance of several coastal works over the last 60 years, as well as by the geomorphic configuration that creates some features that fragment the sediment cell into several smaller cells [
32].
Offshore wave data describe wave energy directional distribution essentially coming from southwest [
33]. Based on sea state parameters, sedimentary fluxes have been indicated for extreme waves associated to a 50-year return period around 0 and 1 m high (
Figure 2b) [
34,
35,
36]. The data confirm the presence of a longshore convergence point at la Punticella location [
37,
38,
39].
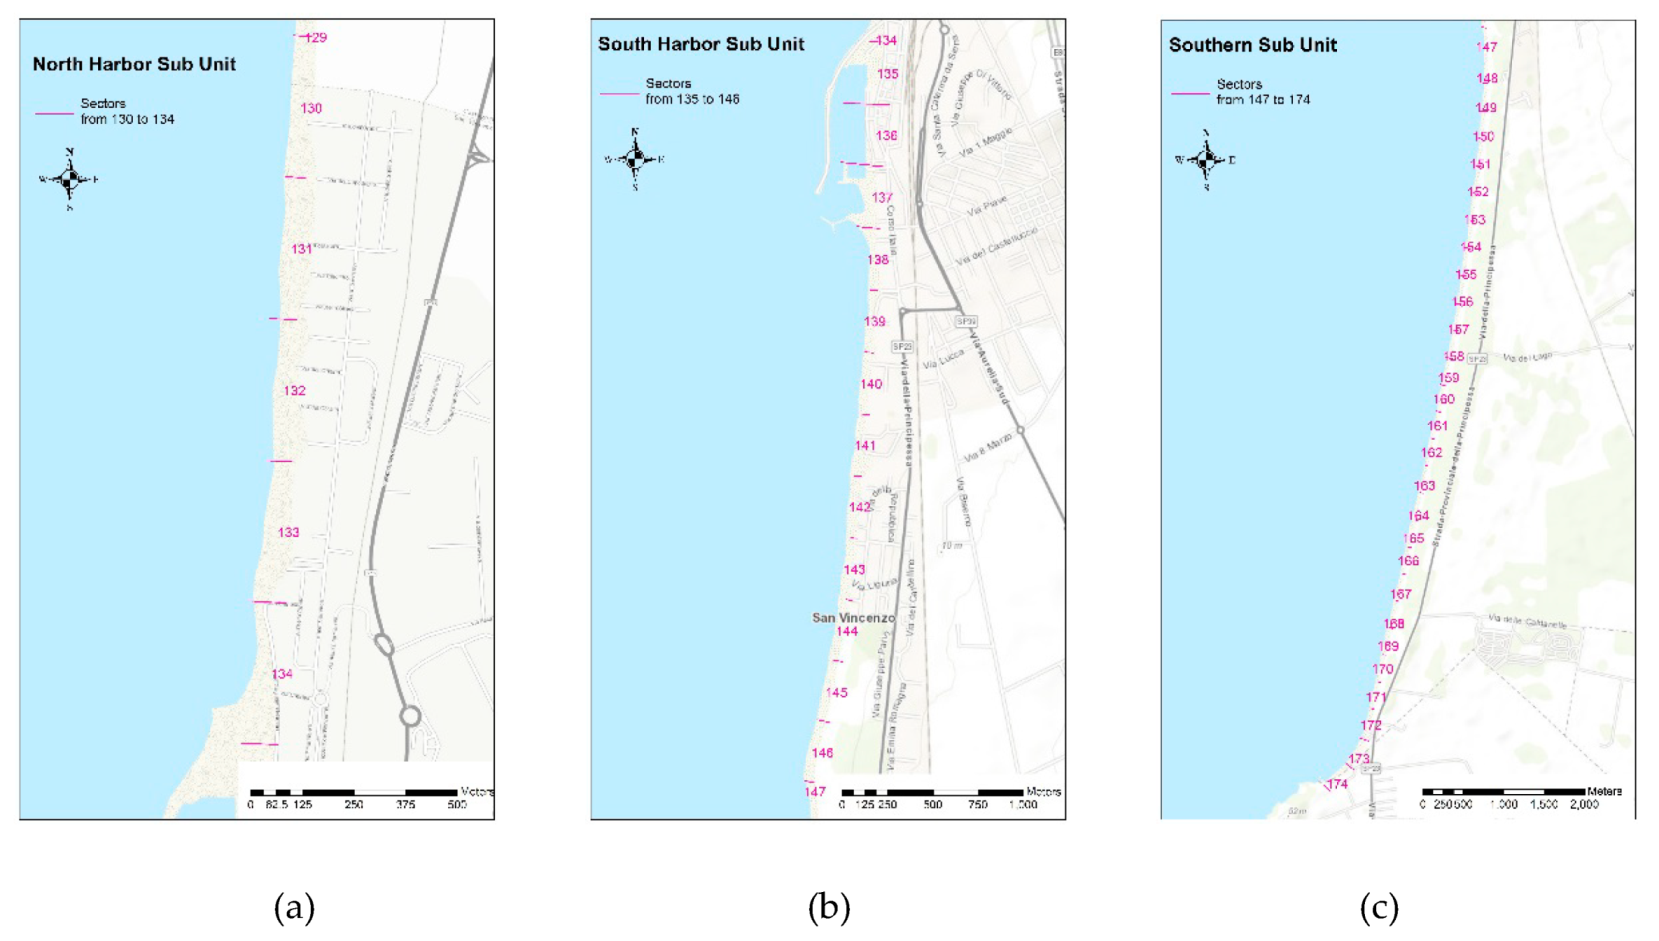
The San Vincenzo subunit lies between the San Vincenzo harbor area northward, and the Baratti Gulf promontory southward. The test site was divided into sectors [
31] and numbered from North to South (
Figure 2b, see
supplementary data for further detail). At a local scale, San Vincenzo’s coastal stripe was further organized into three subunits (
Figure 3), due to the physical limits and hydrodynamic variations, as follows:
North Harbor area, from sector 130 to 134 in the northern part of the municipality’s territory. It is about 1 km long and comprises 22 activities or concessions of the maritime domain (touristic establishments/associations/diving centers, etc.) mostly active during the summer season. It is totally isolated from the rest of the Unit southward by the San Vincenzo’s Harbor.
South Harbor area, from sector 138 to 146. It is 2 km long (sectors from 135 to 137) and hosts the harbor building and 49 concessions that make it the most urbanized area of the San Vincenzo’s coast. The sub-unit is interrupted twice; at sector 138 by a groin and sector 142 by the main channel of the area. At 146 (La Punticella location in the
Figure 2b), the convergence point of the longshore creates the hydrodynamic limit to the Sub-Unit.
Southern area runs from sector 147 to 174, for a total length of almost 7 kilometers. It hosts 10 concessions just in the first kilometer in its northern part, after which the Sub-Unit comprises a Natural Park.
Rather than suffering the crisis that the northern part of the unit showed following the construction of hard structures and water regimentation works, San Vincenzo responded with geomorphological trends dictated by site conditions. Basically, the coastal stripe maintained natural and stable conditions until 1959, when the first breakwater was built to host fishery activities at San Vincenzo [
30]. After 1959, all the further comparisons have highlighted the starting and increasing of erosive trends as the result of anthropogenic activities (i.e., hard structures, wetlands, and backshore management). Erosion rate reached the maximum value of 13 m/year between 1976 and 1977, when a first artificial nourishment was required downdrift in the harbor area. This has been the first soft intervention, after which several others followed during the enlarging phases of the harbor and the building of adaptive hard structures (the last of which ended in 2015).
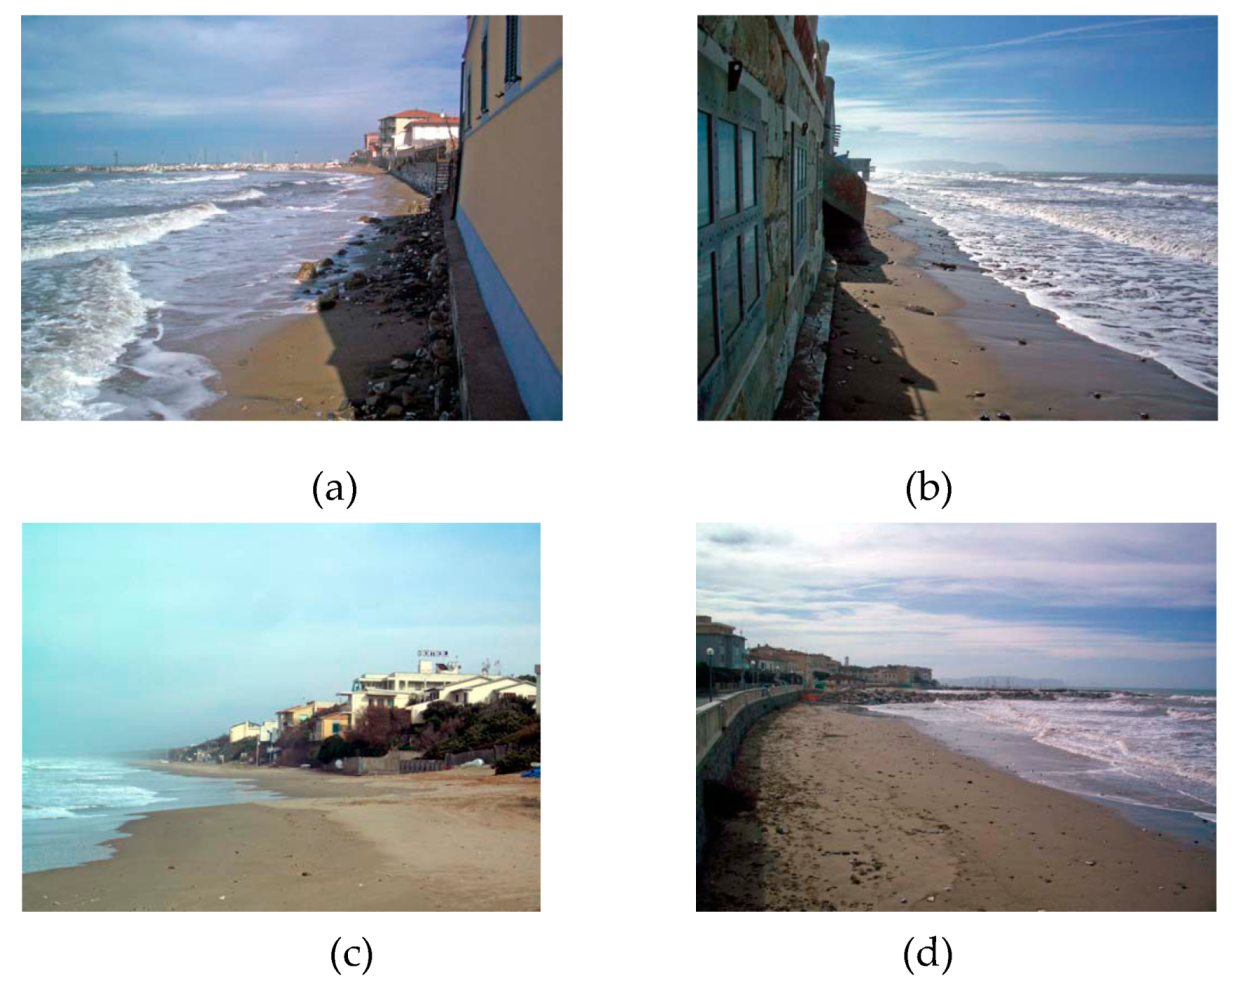
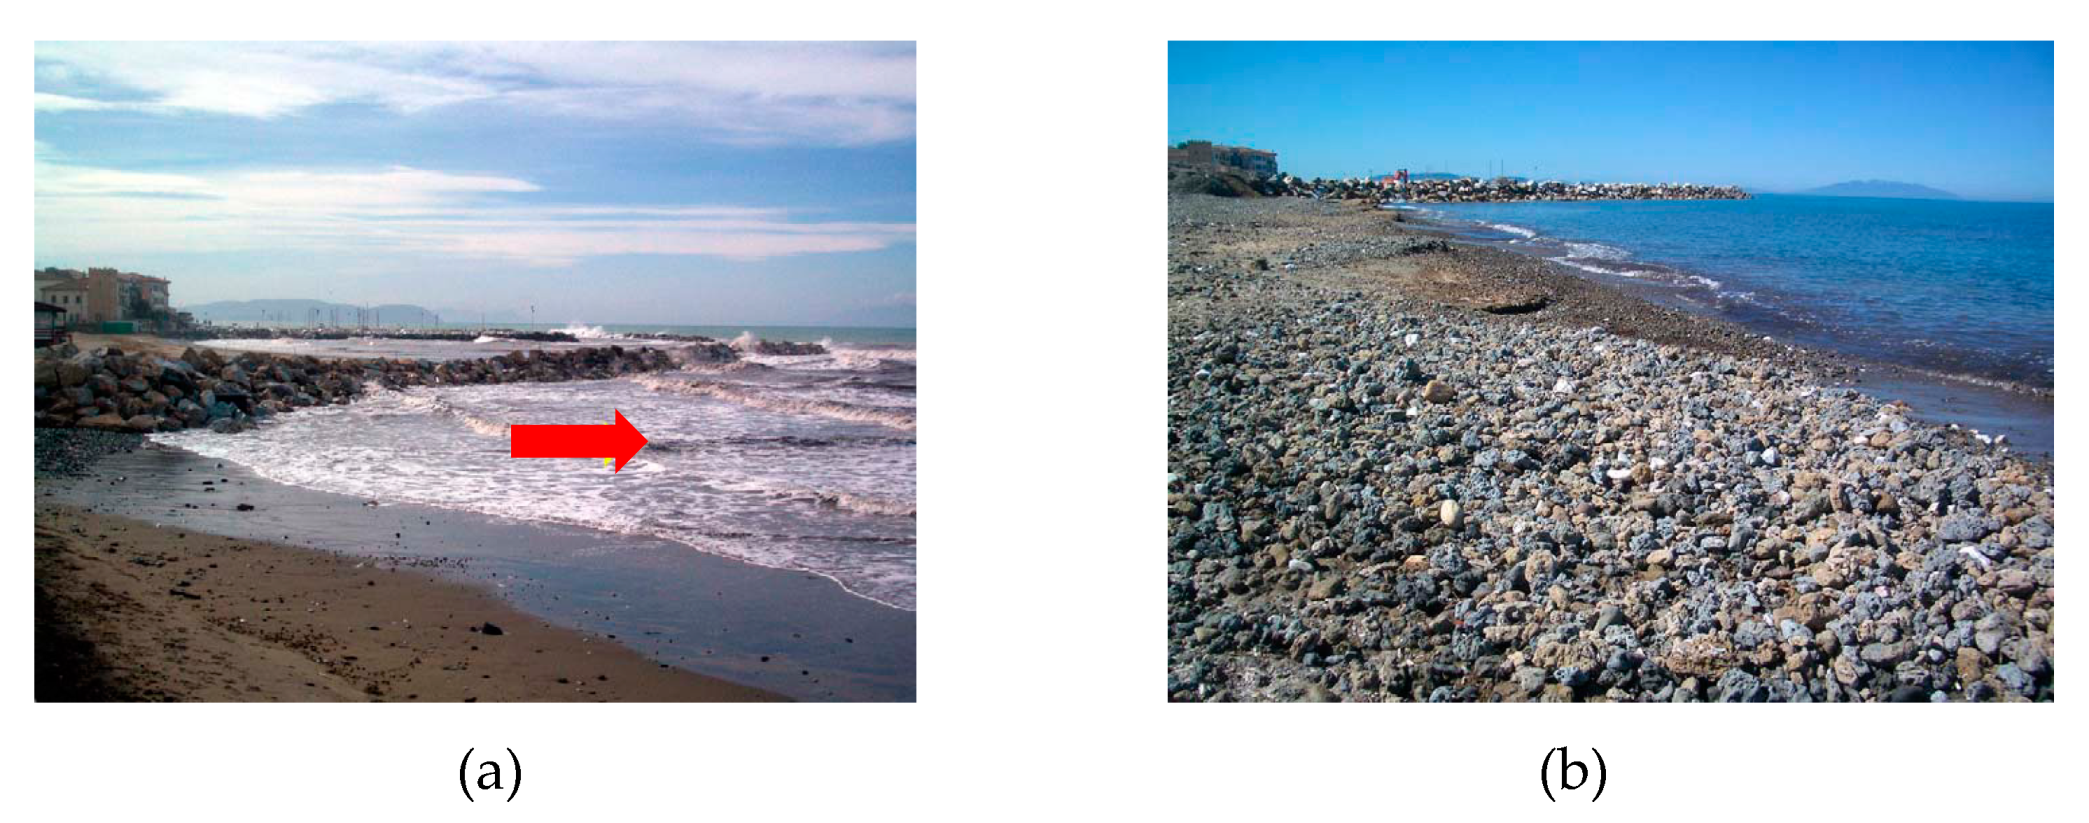
More recent comparisons, for the period of 1996–2006, revealed an average increase of 3.2 m/year in the North harbor area (
Figure 4a), and a retreat of 2.2 m/year in the South harbor area, where the sea reached the tourist buildings during storms (
Figure 4b) [
40,
41].
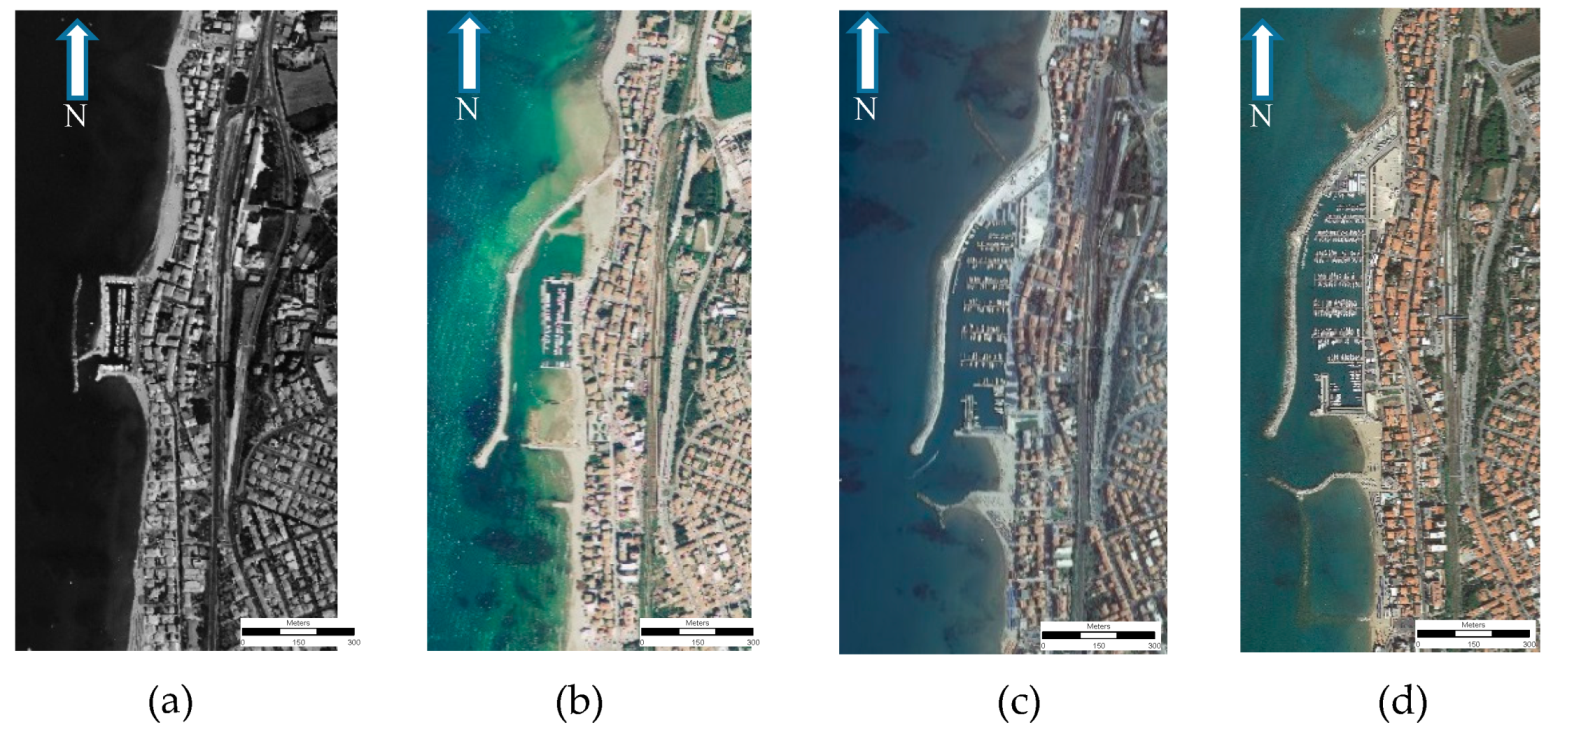
Geomorphic trends in harbor areas are somewhat complicated to investigate, since the statistics can drastically change depending on the way they are applied [
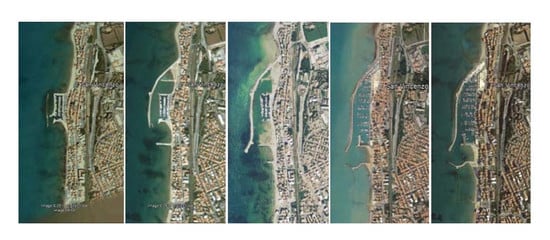
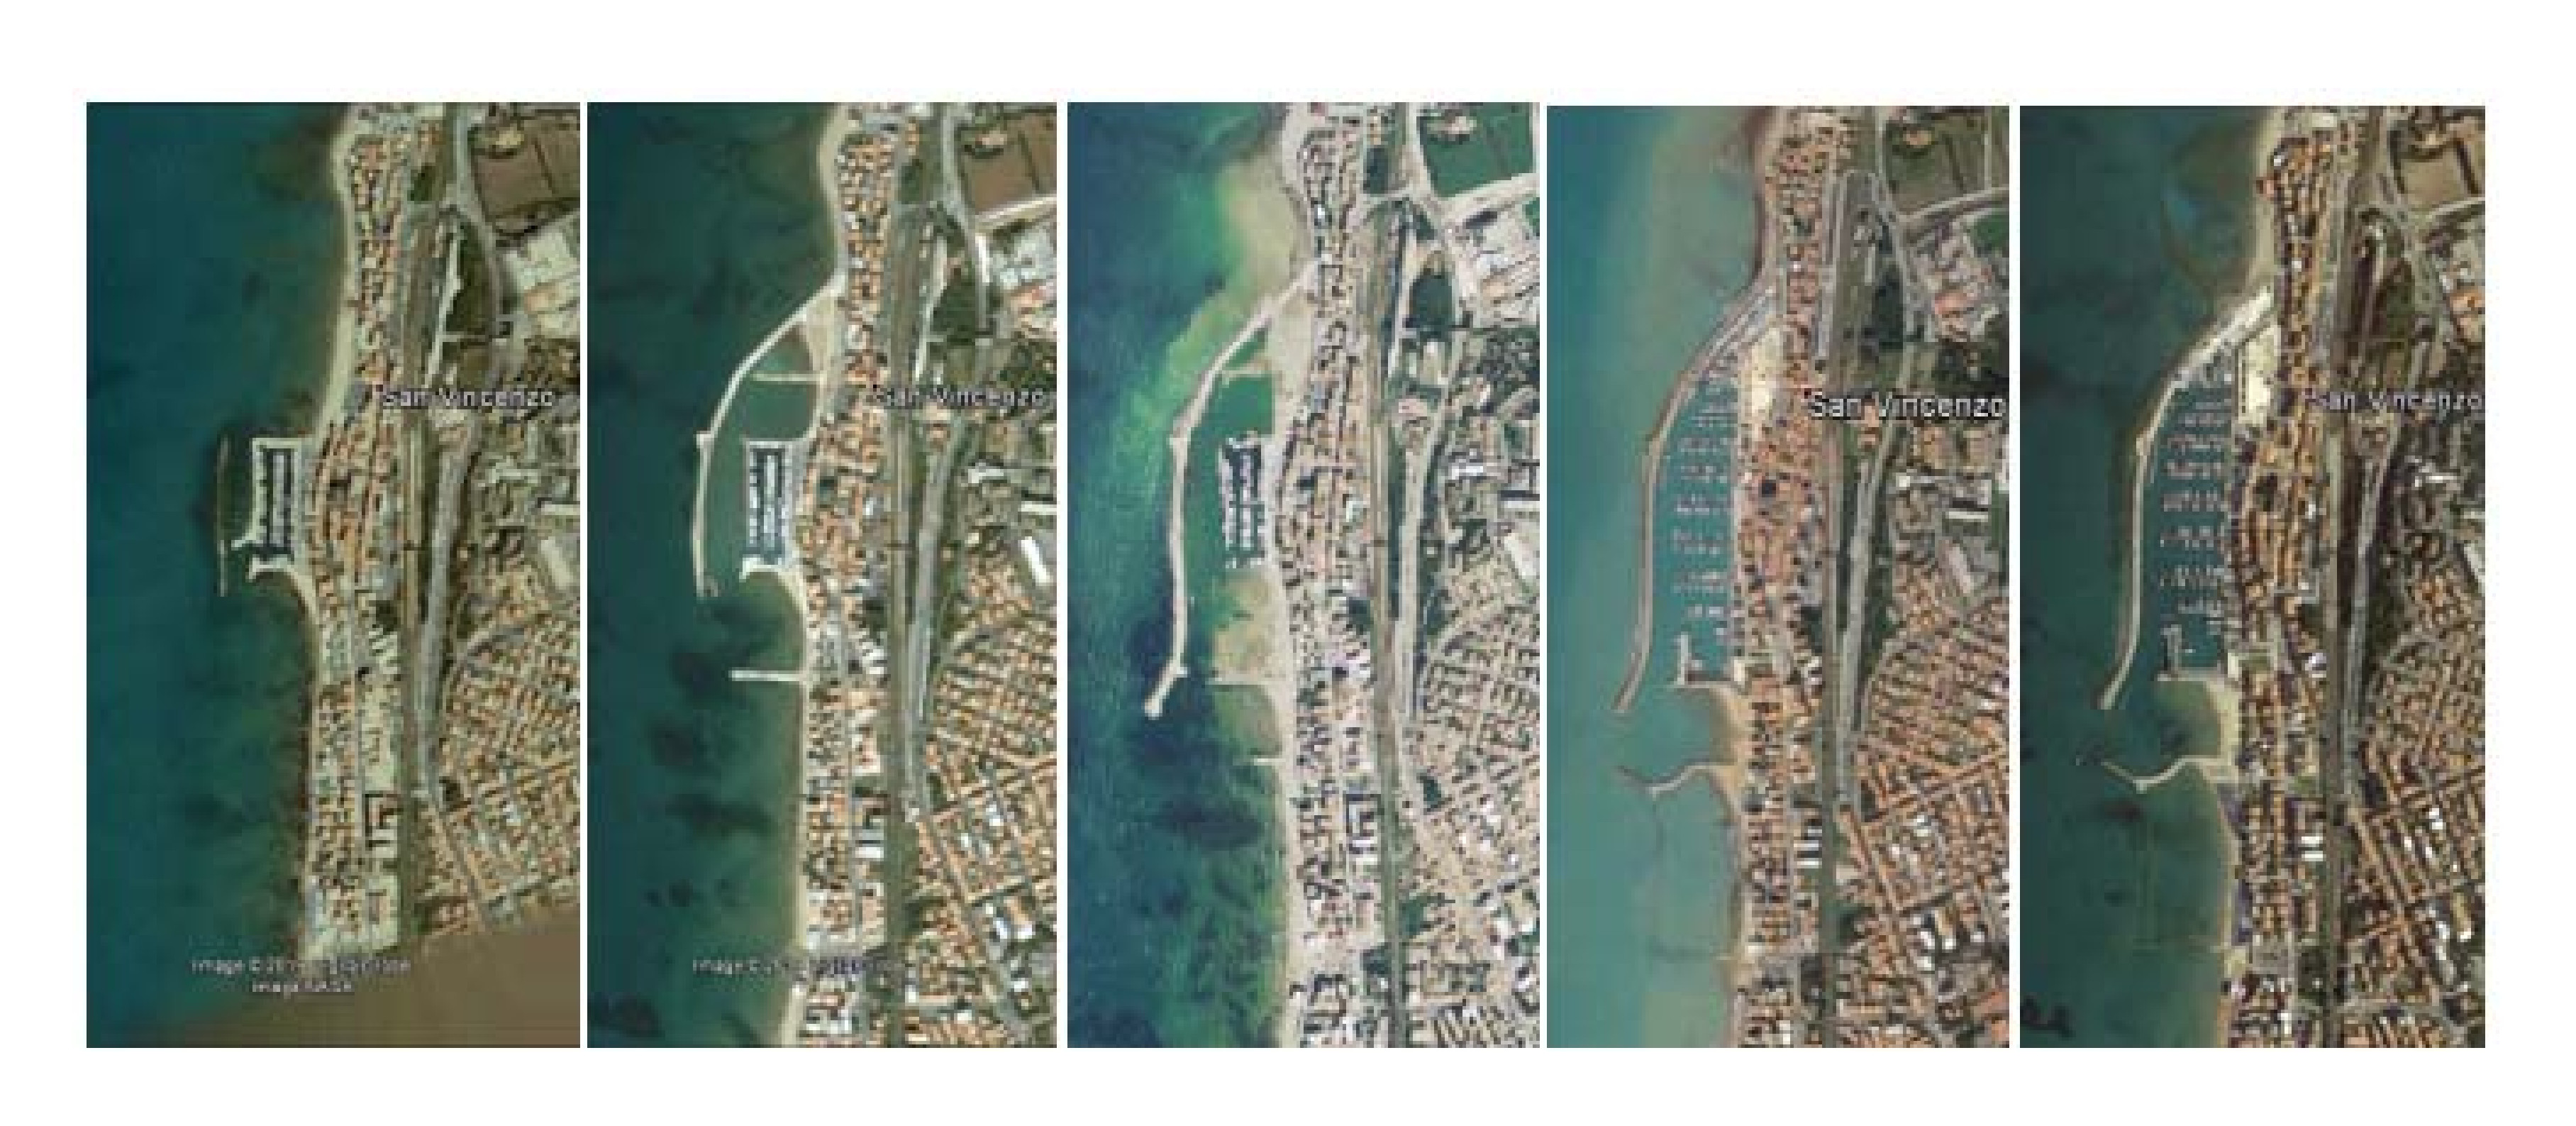
42], and moreover, unquantified sedimentary inputs and outputs are not easy to monitor. In the present study, numerical trends were enriched with qualitative data and mapped. Information on the hard works was extracted from satellite open-source images from the Italian National Cartographic Portal [
43,
44], and from Landsat 8 (
Figure 5). The rest of the quantitative data was inferred from technical reports regarding nourishments and past activities at the test site [
40,
41,
45].
2.2. Methodology
Interpolating support maps and field data, a 1 m × 1 m cell Digital Surface Model (DSM) was created for each bathymetric survey. The coast was divided into sectors, in order to discretize the analysis to homogenic territory portions about 250 m long (North–South). Channel mouths and hard structures always represent limits for sectors and sub sectors (so the sectors sometimes differ in size from the average dimension of 250 m). On the same spatial support, the shorelines acquired in different periods were compared and the average displacement in each sector was calculated.
Each sector is delimited by:
Two lines perpendicular to the shoreline;
One inland reference line;
A closure line seaward, which mainly comprises the closure depth (−7 m);
Shorelines calculated that delimit the emerged and submerged beach.
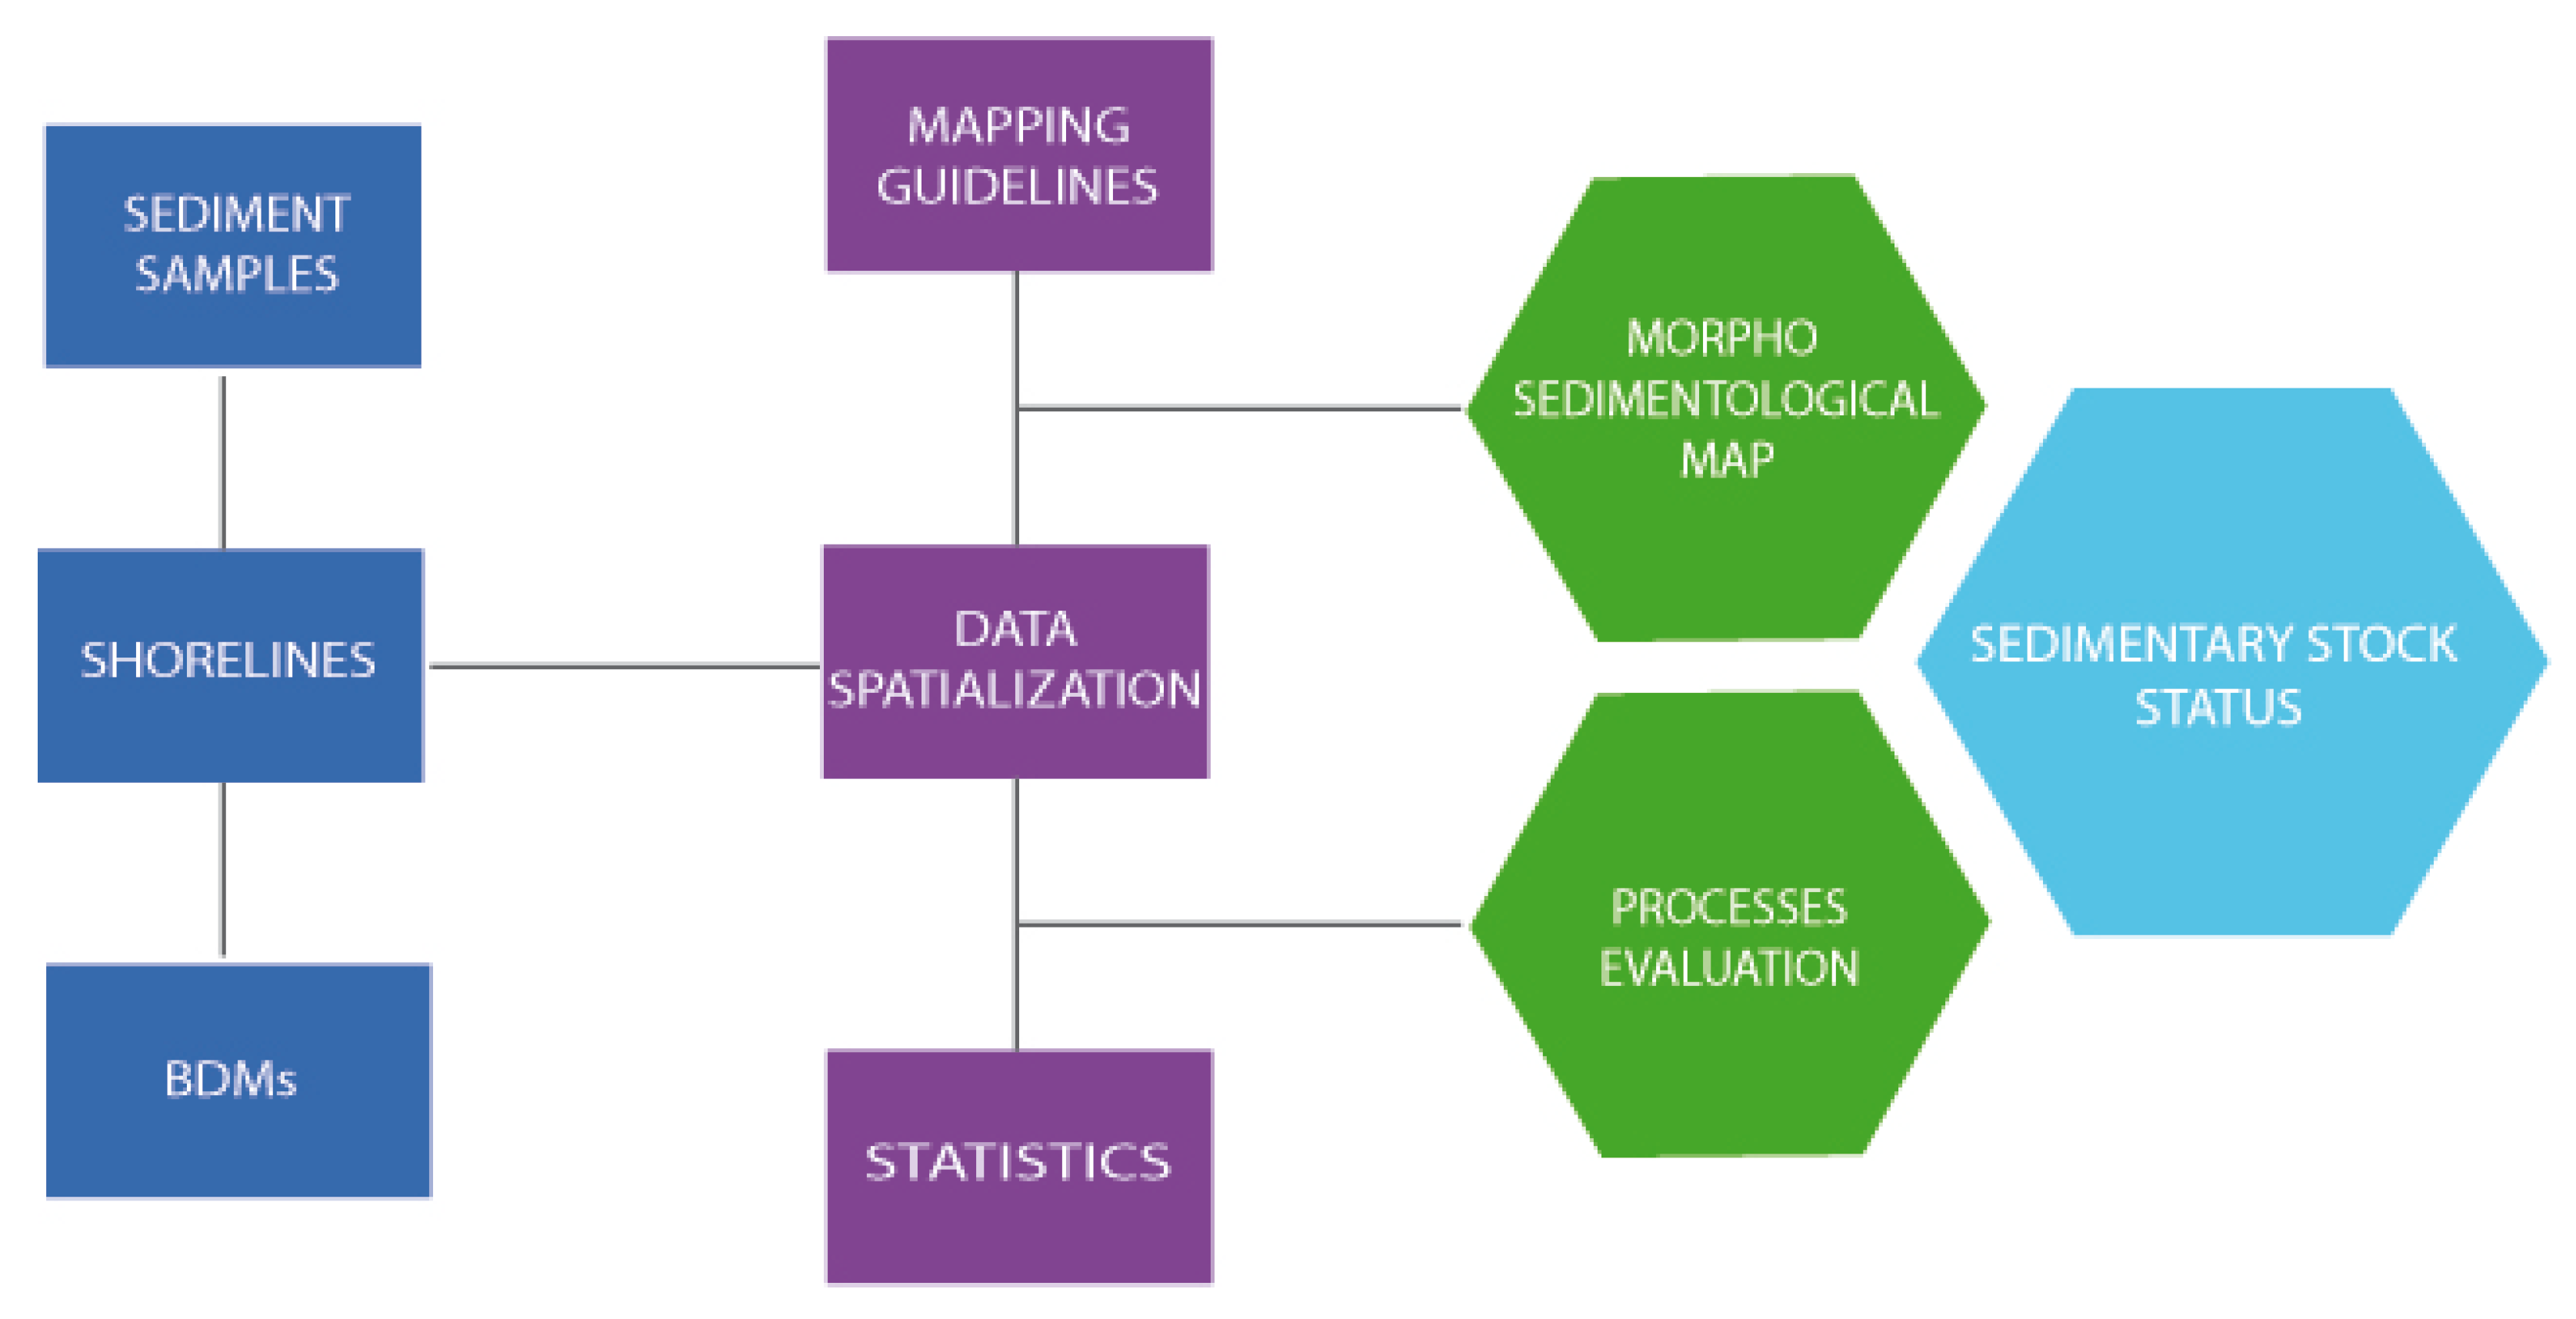
The shorelines and bathymetries acquired were used to spatialize sedimentological properties of the active beach sedimentary coverage. Sediment samples cropped within the harbor area were analyzed and used both to infer information regarding the acting processes as well as to perform the morpho-sedimentological GIS mapping of the coast. The mapping phases took advantage of different regional and national guidelines for geomorphological mapping, as well as of the statistical trends that were extracted from the shorelines and bathymetric fluctuations. A summary of the workflow followed is given in
Figure 6.
2.2.1. GIS Analysis of Bathymetric and Shoreline Displacements
The shoreline displacement analysis was performed for each sector by coupling consecutive (survey date) shorelines and calculating the average displacement (advance/retreat expressed in meters). The resulting data are spatialized in the whole amplitude of a sector, thus solving the criticalities shown on the usage of transect-based analysis (TBA), which was substituted by an area-based analysis (ABA) [
25,
42].
The bathymetric changes analysis was based on the same discretization of the coastal stripe in sectors. Each couple of subsequent bathymetric BDM was calculated through image analysis in order to create a raster model that presents the variation of depth, expressed in meters in each cell of the new raster; the BDM “Input Raster1” is the oldest, while “Input Raster2” is the bathymetric model of the most recent survey, between the two computed ones.
The sedimentary volume in input and output within every sector’s area was calculated for the considered timeframe as:
From these data we can obtain the average rate of lifting/lowering of the seabed, for the period and for the sector considered as:
where:
As well as describing the shoreline displacements, the bathymetric trends can also be plotted in the time and space domains. Changes in the space domain will be presented as a histogram showing a V value of each couple of bathymetric BDMs computed, for each sector. In the second case, V values will represent the changes in time for each sector.
2.2.2. Sedimentological Feature Analysis
The values of the main sedimentological properties such as Sorting (phi), Mean Mz (phi), and Fine fraction (%) were stored in a geodatabase reporting all the samples’ features and used to produce maps of the above-mentioned properties. This analytical phase was carried out integrating the topographic and bathymetric features on which the sedimentological data was spatialized. A series of maps were produced describing the above-mentioned properties of San Vincenzo’s emerged and submerged beach, using the samples collected during a survey carried out by the Department of Earth Sciences of the University of Florence (Italy) in 2014. Furthermore, the same department produced a map of the grain size in 1984, which we digitalized and compared with the 2014 grain-size map. The long-term analysis provided by the two grain-size maps was conducted to investigate the trends in grain-size changes and mobility of the sediment. This enabled us to observe eventual geomorphic drivers in the sediment drifting in both directions—cross shore as well as longshore. The sample collection performed in 2014, after the harbor completion, only covered the harbor area, in order to monitor its impact. Thus, the sedimentological analysis only covered the subunits hosting the harbor.
2.2.3. Mapping Procedures and Guidelines Integration
The process carried out was driven using some normative tools in mapping procedures [
23,
24] and specifications in the main trends analysis [
25], which were merged to obtain a complete overview of the physical conditions of the sedimentary stock. Representing shapes or geological bodies on maps requires providing different information that must respect different codification in symbols, names, descriptions, and furthermore heterogeneous attributes in the database structures. Normative guidelines logically have differing scales and appearances; these were homogenized to represent the San Vincenzo coastal stripe. Spatial data as well as the sedimentological data were entered into a geographic information system through the Esri ArcMap suite; they were standardized into a proper structure in order to allow spatial analysis. Supporting maps, such as the Geological Map [
44,
46], the Regional Technical Cartographic map (CTR), and the geomorphic features at 1:10,000 scale (both available online at the Regional Cartographic web site [
44]) were used to set the cartographic support of the project.
3. Results
In order to integrate the different features and procedures, a morphometric and sedimentological analysis was developed to assess coastal dynamics and sedimentary stock at the San Vincenzo test site. Due to the very dynamic environments created by the sea–land interaction, and to the kind of processes that occupy the emerged and submerged beach, the foreshore area represents the most challenging zones at an engineering scale. This was generally occupied by sediments moved by wave motion and currents, proportionally with the sea state parameters, especially during extreme events. Hydrodynamics in this zone suddenly changed the morphology of the seabed, its depth, and also moved the different class sizes of sediment; such dynamism also entailed a huge task in data collection and reproducibility of the survey conditions. Historical maps and satellite images have been widely used to understand and highlight the main effects during harbor building and the modifications since 1954. Moreover, human-related processes have also been highlighted and inferred from both geomorphological as well as numerical trends. Regarding the physical properties of the samples, they provided the identification of a class of sediments that fits the morpho-dynamic model and the geomorphic evidence extracted from the bathymetric analysis, as well as from the geomorphological analysis. Nonetheless, the distribution of grain sizes, compared with the sample values collected in 1984, provided an overview of the main displacement direction of the recognized granulometric classes.
3.1. Shoreline Displacement
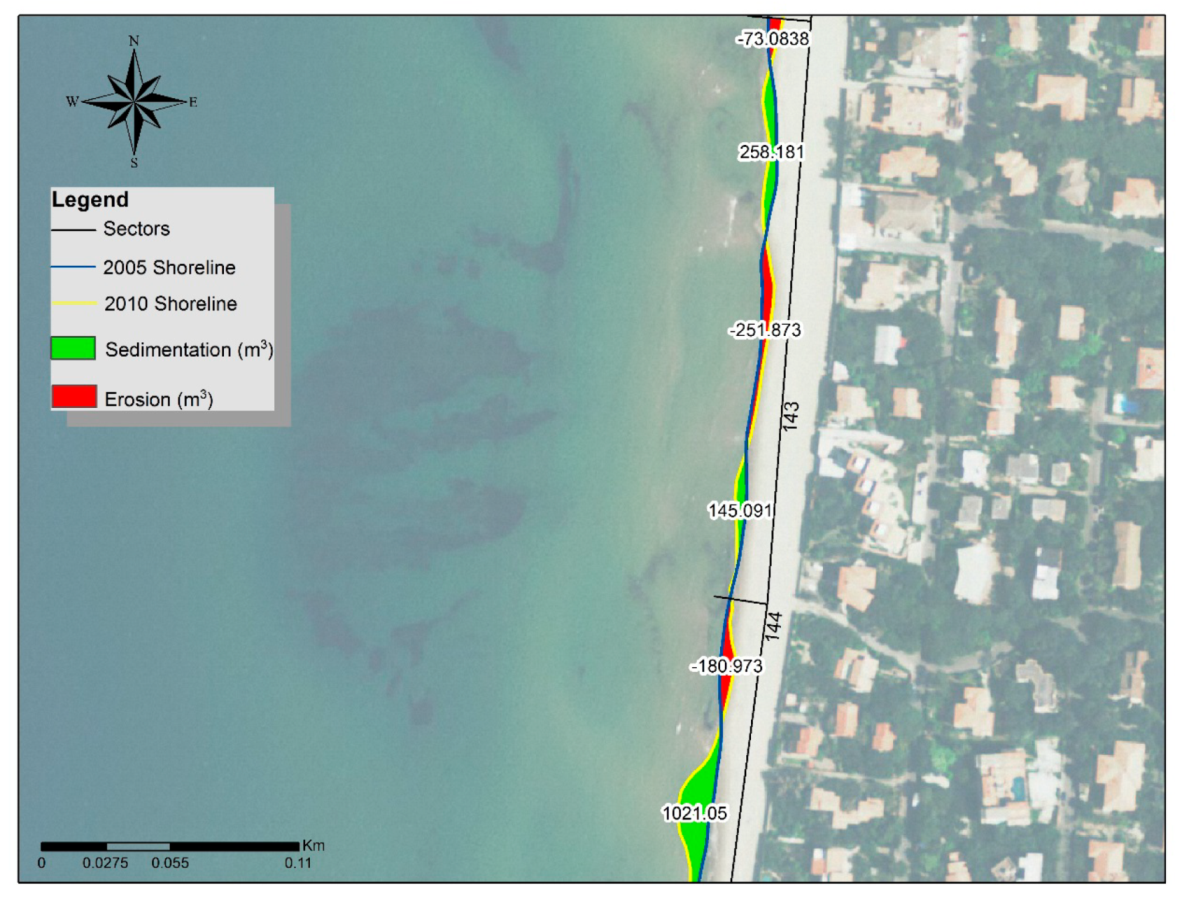
The surveys carried out from 2005 to 2018 have been properly named and georeferenced: The same reference system (WGS84) has been assigned to each dataset. Next, they have been coupled as temporally consecutive, and their differences in level extracted and plotted as graphics (
Figure 7). One example is presented below regarding sector 144: The shorelines acquired in 2005 and 2010 have been compared and eroded/sedimented areas determined. The quantities, in square meters, have been divided by the sector’s amplitude, and average linear variations have been obtained.
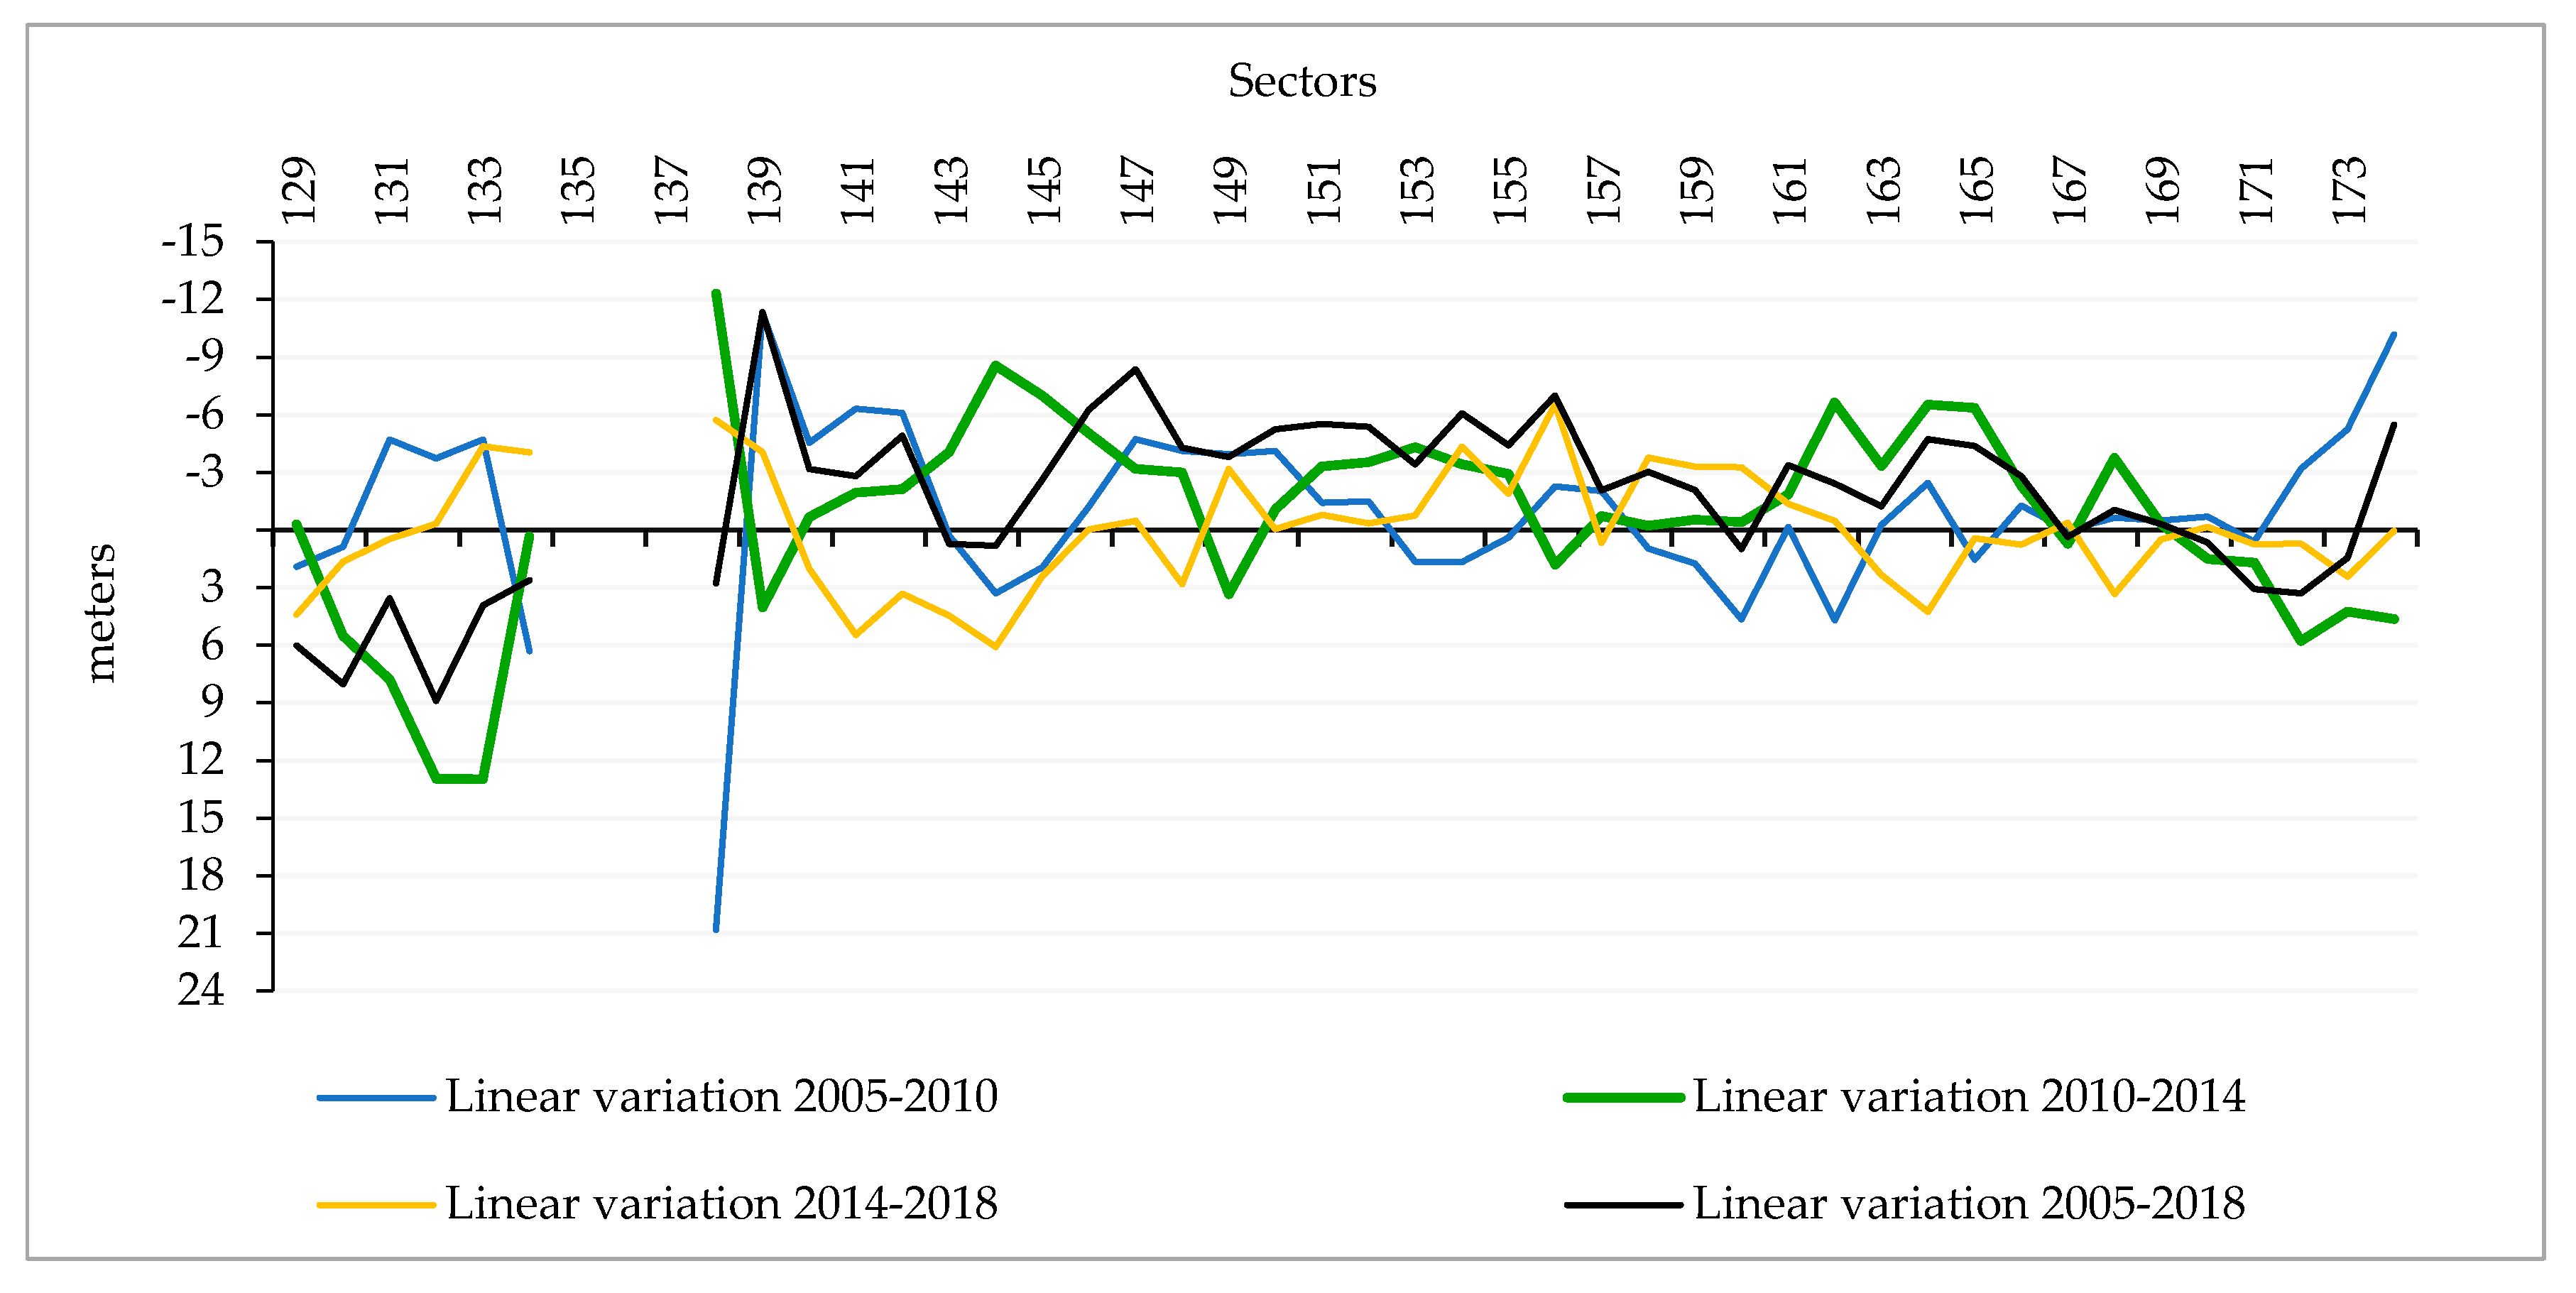
The resulting values can also be plotted graphically to observe the shoreline’s evolution in the considered coastal stripe during consequent timeframes (
Figure 8). The graph shows that the shore at San Vincenzo has been deeply modified, especially in the northern part of the site (sectors from 129 to 146), while the southern part of the unit preserves a more natural, albeit stressed, setting (from sectors 146 to 173). The black line in
Figure 8 represents the longest time frame analysis (2005–2018) in the shoreline position and shows how the biggest differences occur mainly in the sectors close to the harbor structure, and in the last sectors (169–174). The maximum values registered correspond to the shoreline position drawing back 11.3 m at sector 139 and increasing 8.3 m at sector 132.
The further analyzed timeframes also support the premise that sedimentary inputs during those phases have been mostly provided artificially. The several positive peaks exceeding 3 m in all the timeframe lines can in fact be directly related to artificial nourishments as well as to building work or modifications to hard structures (
Figure 9). In particular, small nourishments have been carried out at sector 134 after a breakwater was creating reflected waves, affecting the back shore. A similar situation happened at sector 138 after the building of the groin in front of the port entrance in 2006.
The absence of artificial structures from sectors 140 to 173 reveals, in the mapping phase, some physical peculiarities that alternately accelerate and counteract the erosive processes. This is the case of the beach rock deposits and breccias mapped following the geomorphic supporting maps. Both the cemented deposits have highlighted a strong counteracting character, with respect to erosive effects on the shoreline displacement; they can offer resistance to waves, and a trapping function of the drifting sediment. Otherwise, they are always located at retirement sectors. Furthermore, these deposits have been widely dragged to enlarge the harbor and discharged to the closest sectors (
Figure 10) representing an artificial sedimentary input to morphometric trends.
3.2. Bathymetric Changes
The analysis of bathymetric data through BDMs (
Figure 11) is a tried and tested method used to compare different raster datasets. In our case, the approach has proved useful to obtain volume quantities of the sedimentary stock. The error due to the accuracy of measurements, and to the computing phases of model gridding and georeferencing is considered acceptable, given that the instrumentation used assures a 0.02 m resolution, and the bias in the vertical measure corresponds to 5% of the depth [
25,
47,
48,
49]. Moreover, in our case, it highlights the relations with shoreline displacement trends and geomorphic shapes.
The differences between the 2014 and 2018 level of the seabed are presented in
Figure 11b,c. Changes in the level have been quantified, and the parameters V (volume of sediment) and Q (average rate of lifting/lowering of the seabed) have been calculated for each of the sectors (
Supplementary Materials S1_Table S3 Volumetric variations in the period 2014–2018, in the online resources). As the survey carried out in 2006 only covered the harbor area, the findings regarding the whole unit have been inferred with the 2014–2018 dataset.
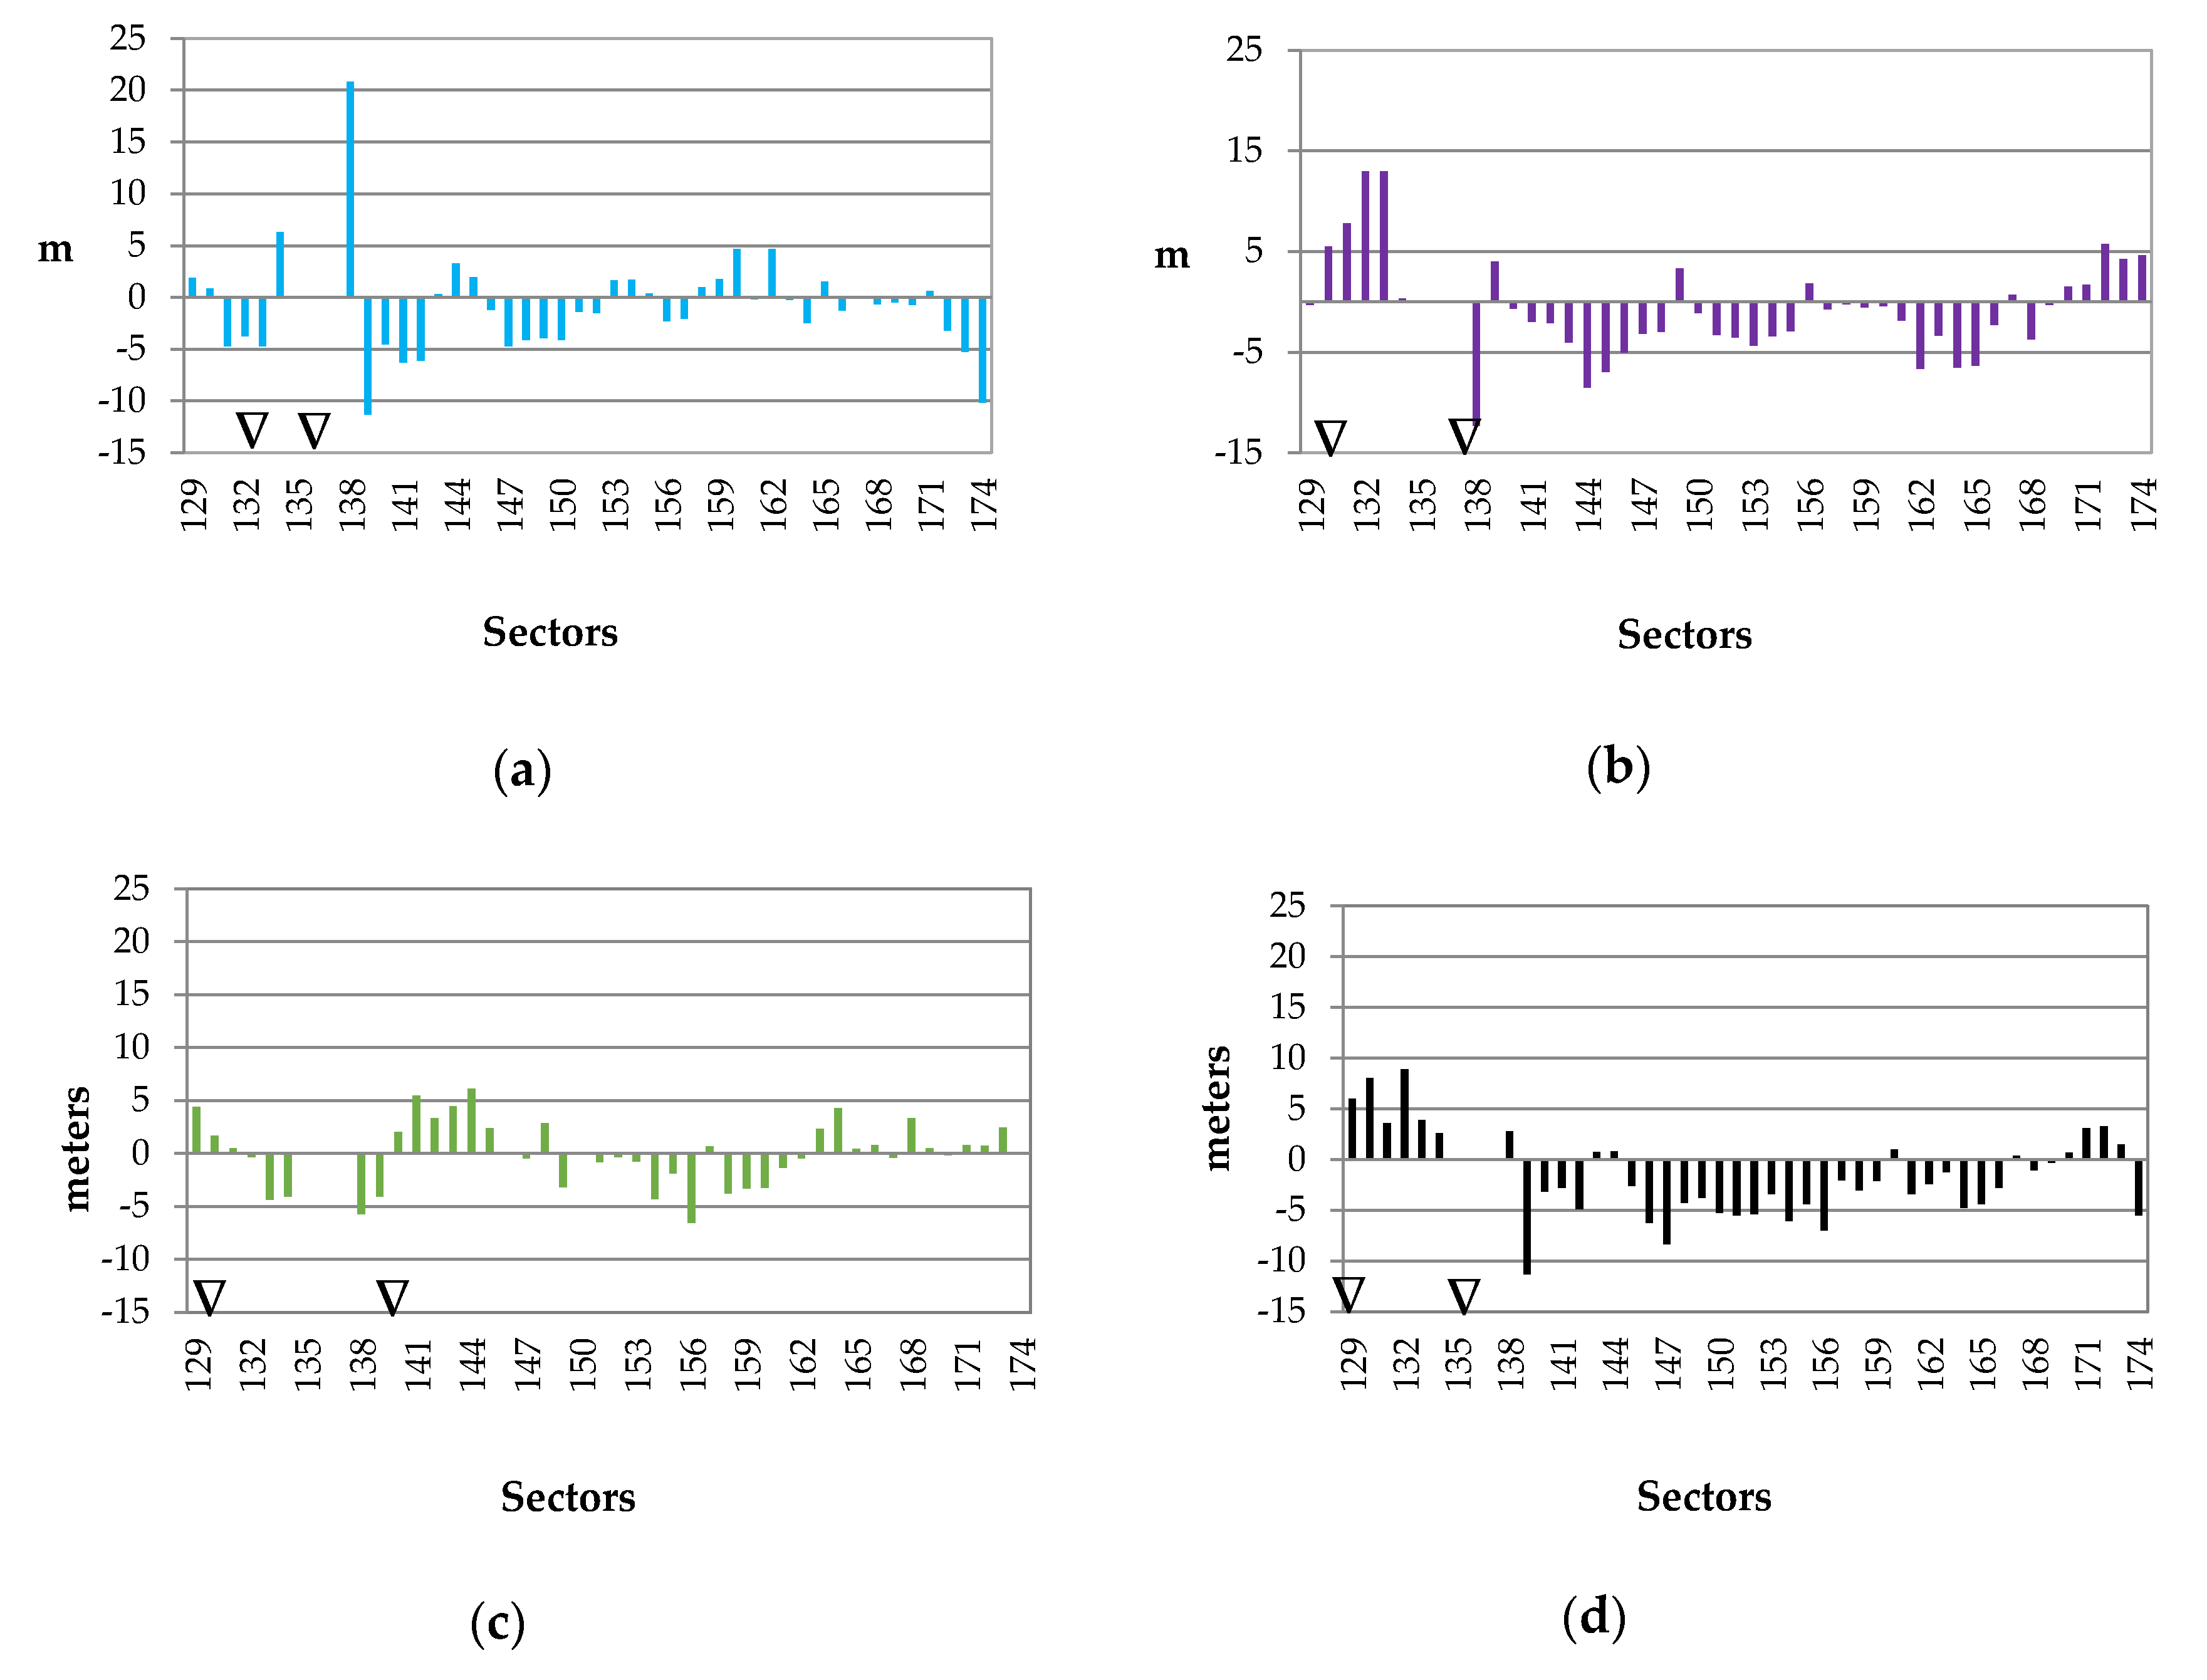
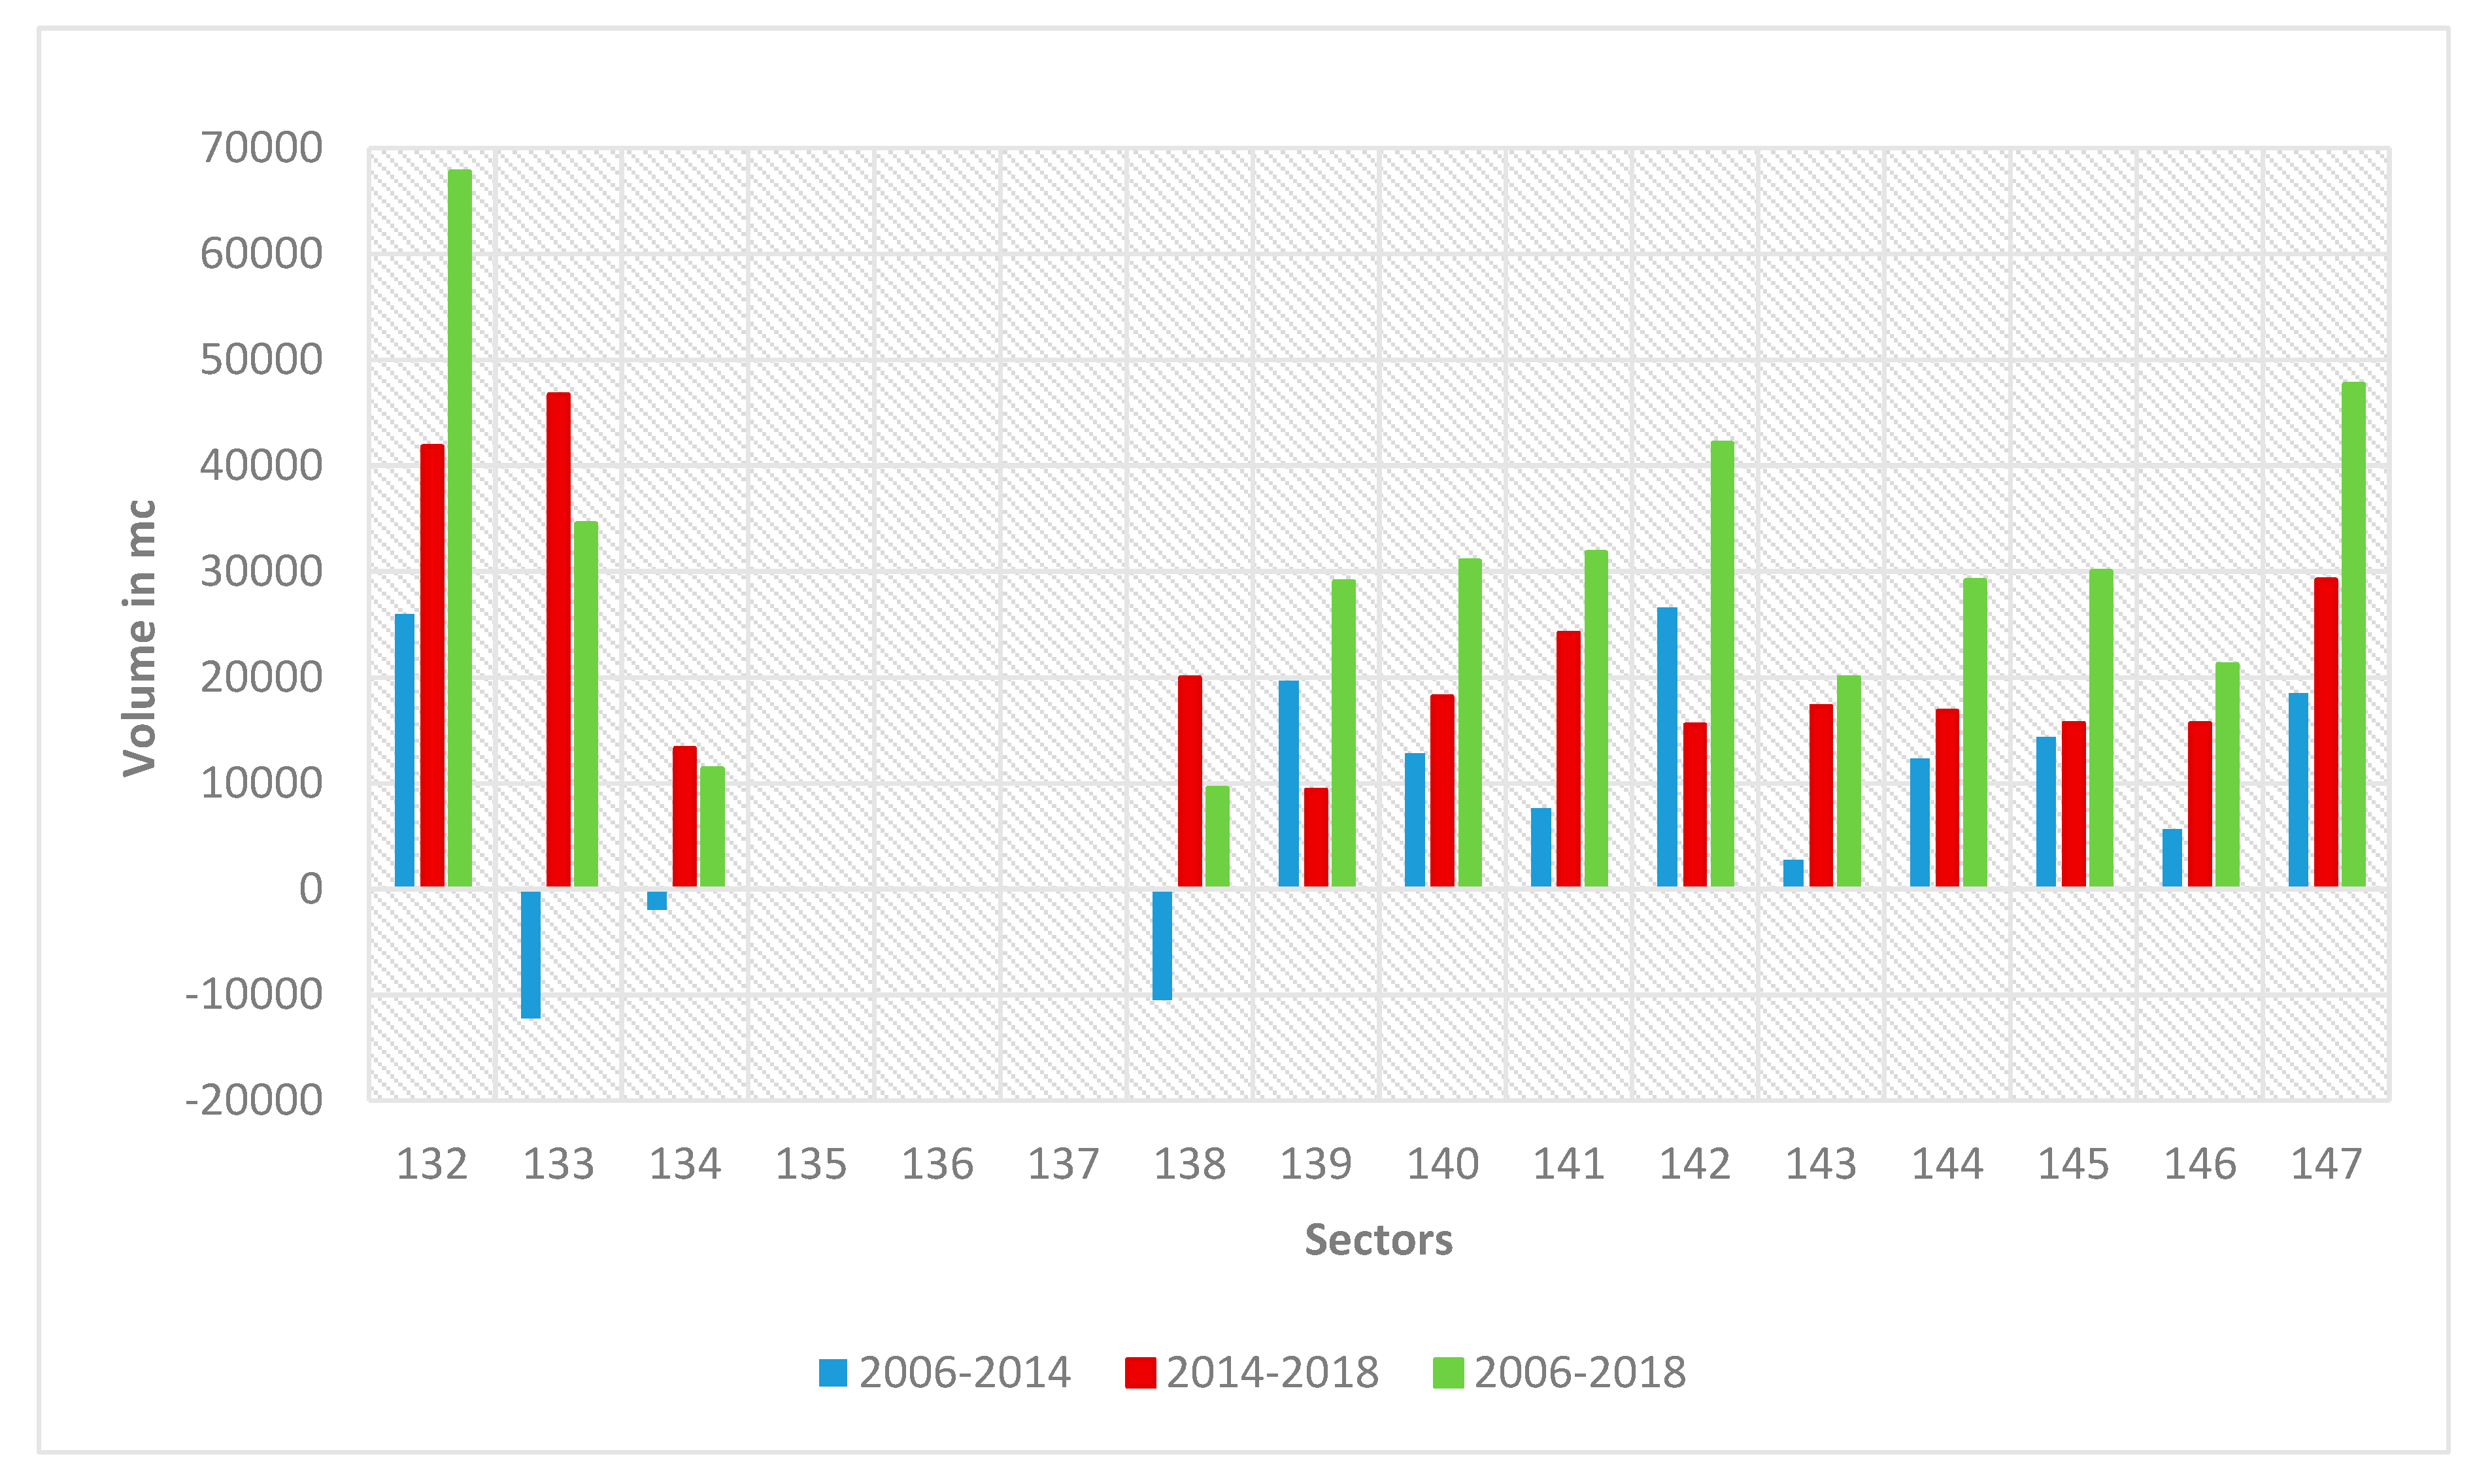
The aforementioned volumetric quantities are shown as histograms in the following figures (
Figure 12 and
Figure 13). The first period of analysis (blue features in
Figure 12) reveals a decrease in the volumes of the submerged beach in the harbor neighborhoods (133 to 138), while in the three sectors from 132 to 135, they increased to 25,000 cubic meters in the last four years. This increasing trend is registered in all the rest of the sectors studied (from 139 to 147). The second period analyzed (2014–2018) represents the first stage after the harbor completion; the data show a general increase of 40,000 cubic meters in sectors 132 and 133, always of at least 10,000 cubic meters, except in sectors 139, 153, 154, and 157. More generally, a bathymetric stripe has been identified in the first three meter of depth; it passed from a balance condition to an increasing trend of the quotes during the last four years analyzed. The same trend was registered from the isobath −5 m seaward, except for sectors 172, 173, and 174, where the old fluvial system was connected to a submerged canyon that could intermittingly drive the discharge process. In the intermediate bathymetric stripe (−3 to −5 m), a peculiar alternation between erosion/sedimentation can be observed. The total amount of volumetric variation for the whole period analyzed (2006–2018) can be lastly observed through green features in the histogram (
Figure 13). These data clearly prove the wide increasing of sediment in the submerged beach in the harbor area.
3.3. Sedimentological Analysis
Spatial data as well as the sedimentological data have been entered into a geographic information system through the Esri ArcMap suite. The chosen structure and information provided enable spatial interrogations (i.e., sorting by location, sample sorting by depth, chronological sorting by survey date, sedimentological sorting through Mean (Mz) expressed in phi Φ, etc.); sedimentological features have been interpreted and mapped using morphological features through geo statistic techniques. An informative table (
Supplementary Materials S1_Table S1) is provided as
Supplementary Materials, in order to show the data structure of the sample dataset.
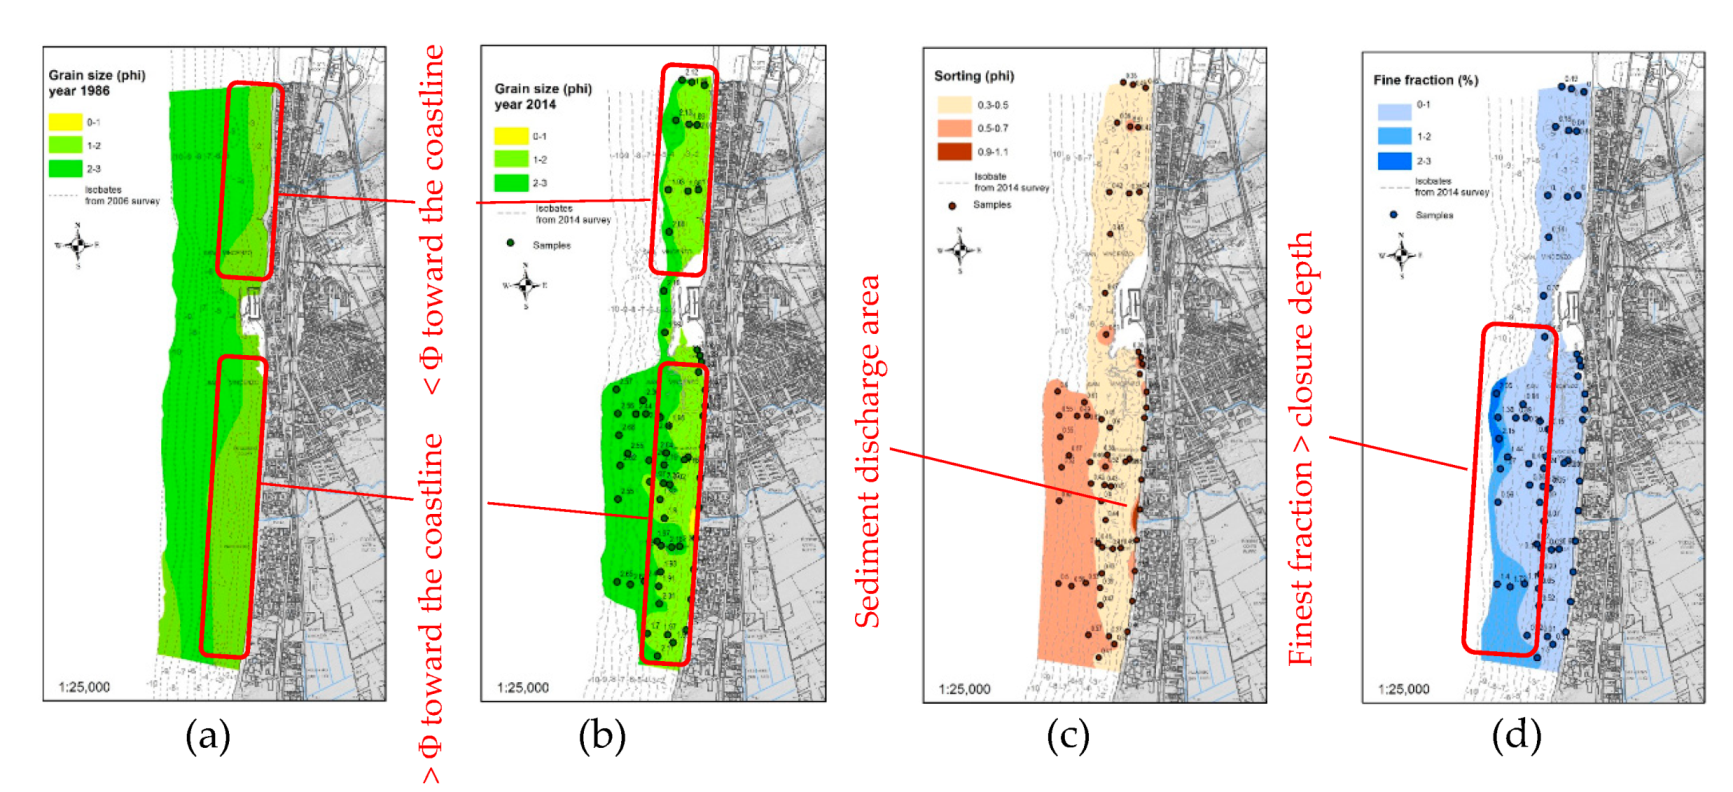
The thematic maps produced have been set down onto the bathymetric features of 2018 for the submerged side of the beach and connected to the regional cartographic map landward (
Figure 14). They only cover the harbor area, since the sampling was carried out to specifically monitor the harbor area upon completion of the building phases.
Through a geostatistical analysis to data spatialization, the sedimentological data have been integrated on a morphological base; the mapping of the beach sediment has been classified using the average diameter (Φ) of samples. Its main sedimentological characteristics are: Sorting (Φ) 0.3–0.5, grain size (Φ) 2, and fine fraction between 0% and 1%. Thus, it can be classified as a medium-to-fine sand, using the Udden–Wentworth sedimentary grain-size scale [
50]. The same grain sizes that were determined in the 1986 report today cover the foreshore, showing a migration of the highest phi values (finest classes) toward the coastline. Moreover, the sorting map has shown that almost all the active beach in the harbor area is covered by a single grain-size class of sediment (0.3–0.5 Φ), and a discharge area is recognized as having a high grain-size class of sediment (0.9–1 Φ) corresponding to the channel’s mouth at South Harbor subunit (see GIS supplementary data for further details). The following map (d), regarding the fine fraction, shows that although the fine fraction content was weak, it was similar in all the active submerged beach. However, its value increased toward the offshore, where values of around two and three have been detected after the closure depth in the southern part of the harbor area. These parameters lead us to think that sediment density is assumed to be constant; moreover, the weak action of the channels (canalized), and the isolation of the area from the main source (Cecina River), allow us to consider that the physical properties of the sediment are constant.
4. Discussion
The geomorphic criterion followed during the present study arises from the need to create an integrated evaluation system for coastal erosion management. In particular, the geomorphological mapping procedures through which we carried out the analysis [
24,
25] require the identification of morphometric attributes that must be supported by quantitative data (i.e., the shoreline displacement rate). Calculating them can offer up different results and requires basic criteria to properly quantify changes [
51]. With this study, we demonstrate how the geomorphological mapping, which already represents a basic phase in the mapping of the landscape since it results from the interaction of different geographic information [
2,
52], can be considered as the starting point for the resilience assessment. The matrixes involved interact with the topography, and as several authors have proposed, their analysis can: (1) Reveal and enable the mapping of natural divisibility of geo-phenomena; (2) provide parametric correlation systematics of elements composing these geo-phenomena; (3) allow a formalization of the elements by measurable characteristics; and (4) integrate verbal, symbolic (symbols and formulas), and graphical (maps legend) data [
3].
The proposed method for bathymetric and shoreline calculation provided the tools needed to spatialize sedimentological data. A comparison between the linear shoreline displacement values and the volumetric variations of the seabed (
Table S3 in Supplementary Materials S1_Tables) in each sector can be observed through the morpho-sedimentological map and supported by graphs. In fact, they have been extracted from the displacement trends, and have provided a sedimentary stock evaluation for each sector of the test site.
Other parametric correlations have been revealed between the main geomorphological processes and the surface area they occupy, explaining the causes and effects from phenomena described in previous studies [
40,
45]. A sand bar system and its physical properties have been determined, which are also facing the effects related to the anthropogenic actions that have affected the beach over the last 13 years. This aspect is particularly relevant because it matches our main topic of integrated coastal resilience assessment. The variations registered through the proposed method are differently related to human actions in the different parts of the unit. In the northern part, the anthropic structures, such as the harbor and submerged structures, drastically change the natural dynamics, showing related effects at sector 134, where the groin built to contrast the reflection of waves on the harbor represents a barrier for the nourished sediment, but can also represent a spreading path toward the off shore. Nowadays, based on the most recent surveys compared, this portion is entirely dependent on human activity, since artificial nourishments represent the only sedimentary inputs that can feed the southern part of the unit. The sectors in the southern harbor area (from 138 to 146) show an increase in the values of the shoreline displacement, right after the nourishments and the breakwater was built. This decreased again once the breakwater had been lowered and the sediment could flow cross shore. The latter dynamic has been managed by isolating the area with a hard, submerged basin (a closed reef) connected to the shore by two groins. These fluctuations in the shorelines have been represented on the morpho-sedimentological map as blue triangles on the shore that express the displacement trends classes suggested by regional guidelines for geomorphological mapping (an erosive trend was considered when the backing value of the shoreline exceeded 0.5 m/year; similarly, the shoreline was considered as stable if this value lies between 0 and 0.5 m/year, and as accretionary when it increased at a rate above 0.5 m/year).
The shoreline displacement results in a constant reduction (especially where the shore is intersected by beach rock deposits). The only events that lead to a shoreline increase correspond to artificial nourishments or modifications to the existing hard structures, while bathymetric changes show an almost constant sedimentation. The sectors just downdrift of the harbor have been dynamically isolated beyond the reef. This avoids the sediment drifting longshore, but at the same time it faces a cross shore migration of the sediments through the gaps in the artificial reef, which had been nourished artificially. The rest of the unit from sectors 146 to 172 still preserves a more natural geomorphic setting related to both the better conservancy of the dune system, and the sand bar system acting between the isobaths−3 and−5.
The presented method has also provided the indication of beach rock deposits (
Supplementary Materials S2__Geological and geomorphological features) both in the submerged and emerged beach, and most importantly it supports the correlation between erosive patterns and geomorphology, just missing where human activities become incipient. Although the resistance it can offer to waves represents a clear resilient element, deeper study into the resilience potential of the beach rock on the Tuscany coastline could represent future research. Its importance as a global and diachronic phenomenon [
53] gives us the chance to study it as a global indicator, and to better understand if beach rocks can set the limit that the beach bed can be eroded to. The case of San Vincenzo shows that they do not set this limit if we consider spatial units as aerial ones using ABA analysis, through which statistics have shown a spatial correlation between the presence of beach rock and erosive patterns. Moreover, some authors confirm the controls on morphology, as well as the increase in beach erosion [
54] due to beach rock. Hence, this could be taken as one of the drivers of coastal erosion or could represent a counteractor to the total disappearance of beaches [
55]. We consider that the sand bar system involves the sand masses avoiding their cross-shore migration (or just for a part of it), in the medium term. The grain-size maps show a phi increment toward the coastline (decrease in grain sizes), for the period 1984–2014 in the southern part of the unit and the south harbor, whilst in the north harbor area, the increase in phi occurs from the coast toward the offshore; in the latter case, the sand bar system is absent. Conversely, the increasing phi toward the shoreline could indicate a finer sediment coming from a different source, or a change in the hydrodynamics (less energetic sectors) or both.
Regarding the channels that intersect the test sites, they have been drastically modified and regimented in order to reclaim the wetlands that were proliferating in the area. The inactivity in the sedimentary supply is proved by the sorting maps; they show just one small area of sediment discharge, as well as a complete dependency on the artificial nourishment, highlighted through statistics. This fact highlights the model’s limit, which could be solved with a proper sampling survey; it could be carried out within the fluvial bodies at a basin scale, or merely for the ones flowing at San Vincenzo (since San Vincenzo results dynamically isolated from the rest of the Unit) [
30].
Therefore, this study represents a phase that connects coastal erosion assessment and the mapping of risk cartography. It has been denoted as the first step to an integrated coastal resilience assessment, demonstrating the efficiency of geomorphology as a tool for engineering and landscape management of natural resources.
The analysis of the processes acting, and the related sedimentary stock involved, provide the basis to consider each process as more or less resilient. Obviously, the geomorphological data can represent “various geo-phenomena directly or indirectly related to the topography” [
3], and GIS suites help to co-register different datasets of different natures and/or timeframes. The study also demonstrates how the normative guidelines can already host the main indications in the resilience assessment process too, and so they could be used to calculate diagnostic indicators. Nevertheless, these indicators need to be set into each territorial context, and the geomorphic approach used represents a valid tool to support quantitative data, also regarding anthropic pressure. This issue should be underscored, especially if the evaluation is raised in the context of a comparative analysis between different areas, as highlighted by different authors for other approaches in coastal areas [
51].
5. Conclusions
The present study focused on using geomorphological mapping as the main tool in an integrated coastal resilience assessment. The sedimentary stock has been analyzed and quantified on San Vincenzo’s coast, in Italy; the processes acting and interacting with it have been distinguished and mapped following various geomorphic and geological mapping guidelines. The geomorphological features helped to place physical boundaries on the recognized structures and source processes, as well as to identify human-pressured areas.
The sedimentary stock represents the matrix on which coastal processes physically interact, and its analysis provided information on the feedback to coastal dynamics due to engineering works. The guidelines considered support the representation of the morphological trends of the shoreline on the basis of their rates of retreat/increase, which in this study, have been calculated from the erosion/sedimentation polygons, thus providing volumetric quantities of the sediment involved, through an ABA methodology.
An ad hoc GIS procedure has been employed to evaluate trends, by comparing field data, and integrating support qualitative data. Some digital models of the active beach have been created, and geomorphological characteristics of the site have been evaluated and mapped through the comparison of different period surveys. The methodology revealed an almost complete overview on coastal dynamics and the related sedimentary quantities involved in this vulnerable coastal area.
This has enabled several relevant features to be added, including the bar system acting on the shoreface, and the mapping of the shoreline dynamics (i.e., stable, accretionary, erosive, etc.) to the regional thematic cartography of San Vincenzo’s coastal area. The comparison between the shoreline variations and the volumetric features related to the sediment input/output for each of the sectors during the period 2006–2018 results inversely related. Basically, in 71% of the sectors (from sector 138 to sector 167) at a shoreline position, drawing back corresponds to an accumulation of sediment in the submerged beach. This trend indicates that the sand masses extracted from the shore remained trapped between the source and the closure depth, in the mean period.
On the other hand, in the short period (from 2014 to 2018), after the completion of the harbor, the trend changed, showing a direct relation between shoreline and bathymetric variations. In that period, 52.3% of the sectors suffered a lowering on the seabed’s level and at the same time, a drawing back of the shoreline, while in the remaining 47.3% of the sectors, both the seabed level and the shoreline position are increasing.


