Trend in Extreme Precipitation Indices Based on Long Term In Situ Precipitation Records over Pakistan

 , , ,
, , ,  ,
,  ,
,
Abstract
:1. Introduction
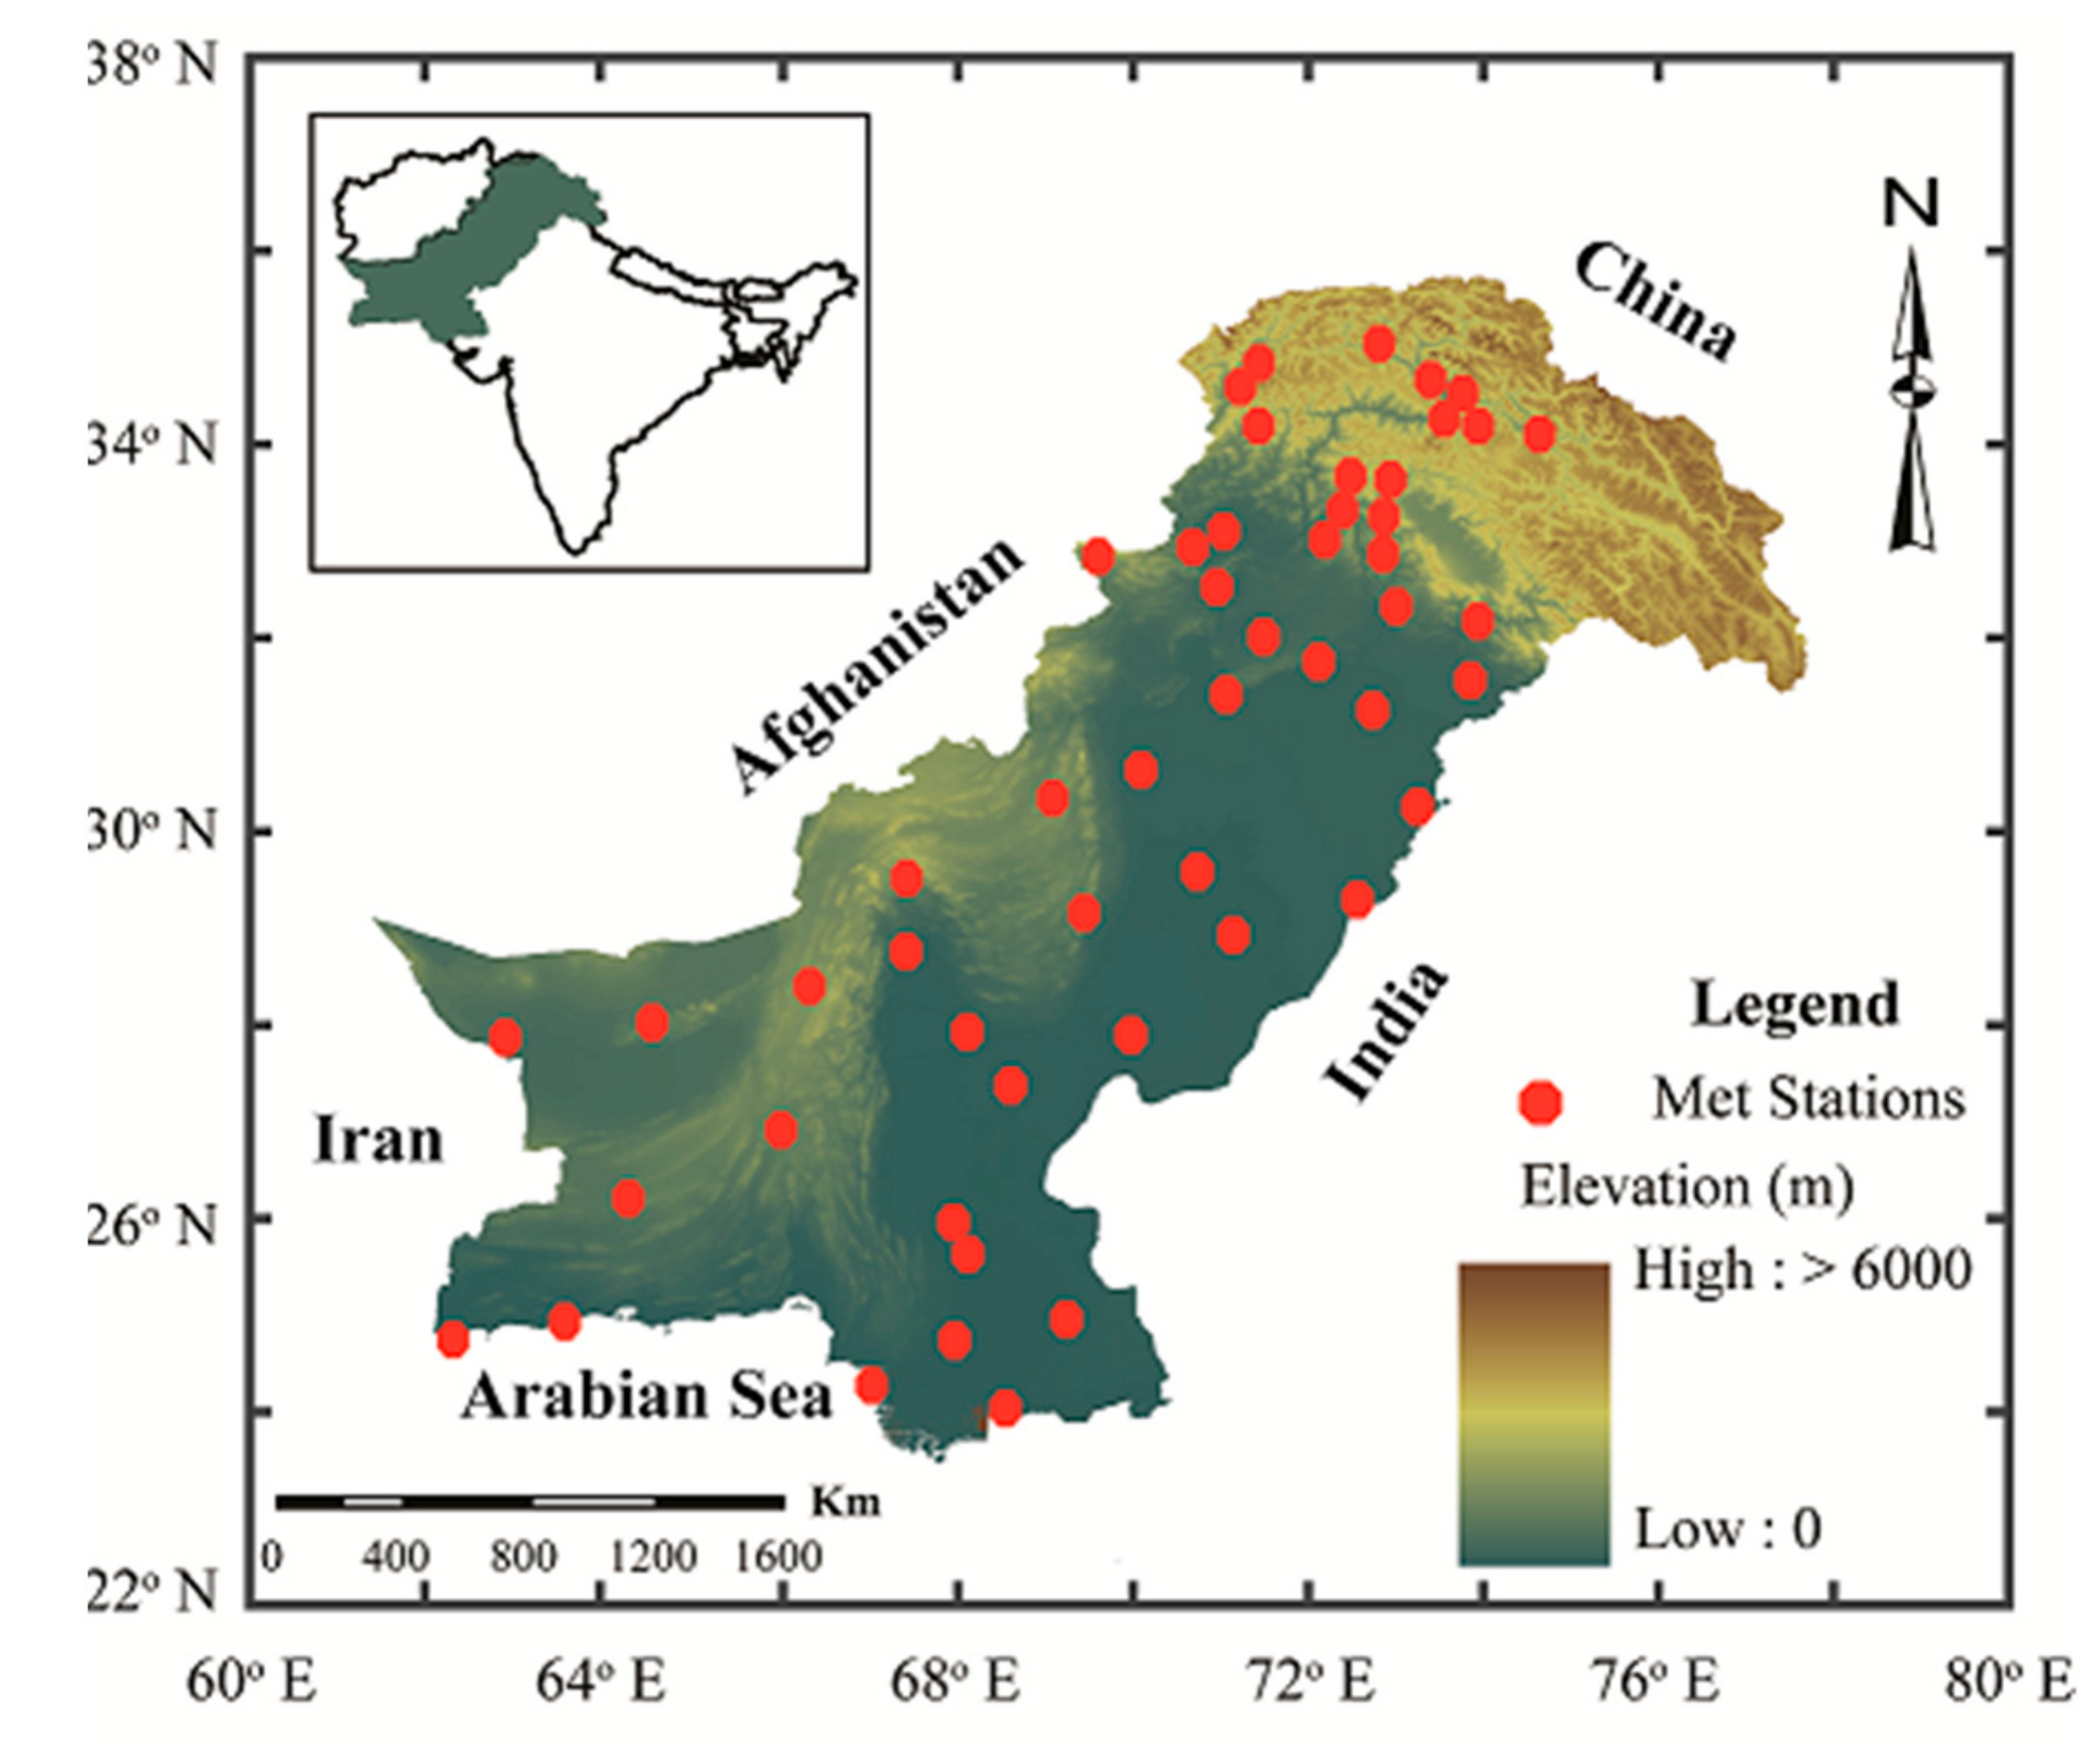
2. Study Area
3. Data and Methods
3.1. Data
3.2. Precipitation Indices
3.3. Statistical Techniques
3.3.1. Mann–Kendall (MK) Test
3.3.2. Sen’s Slope Estimator
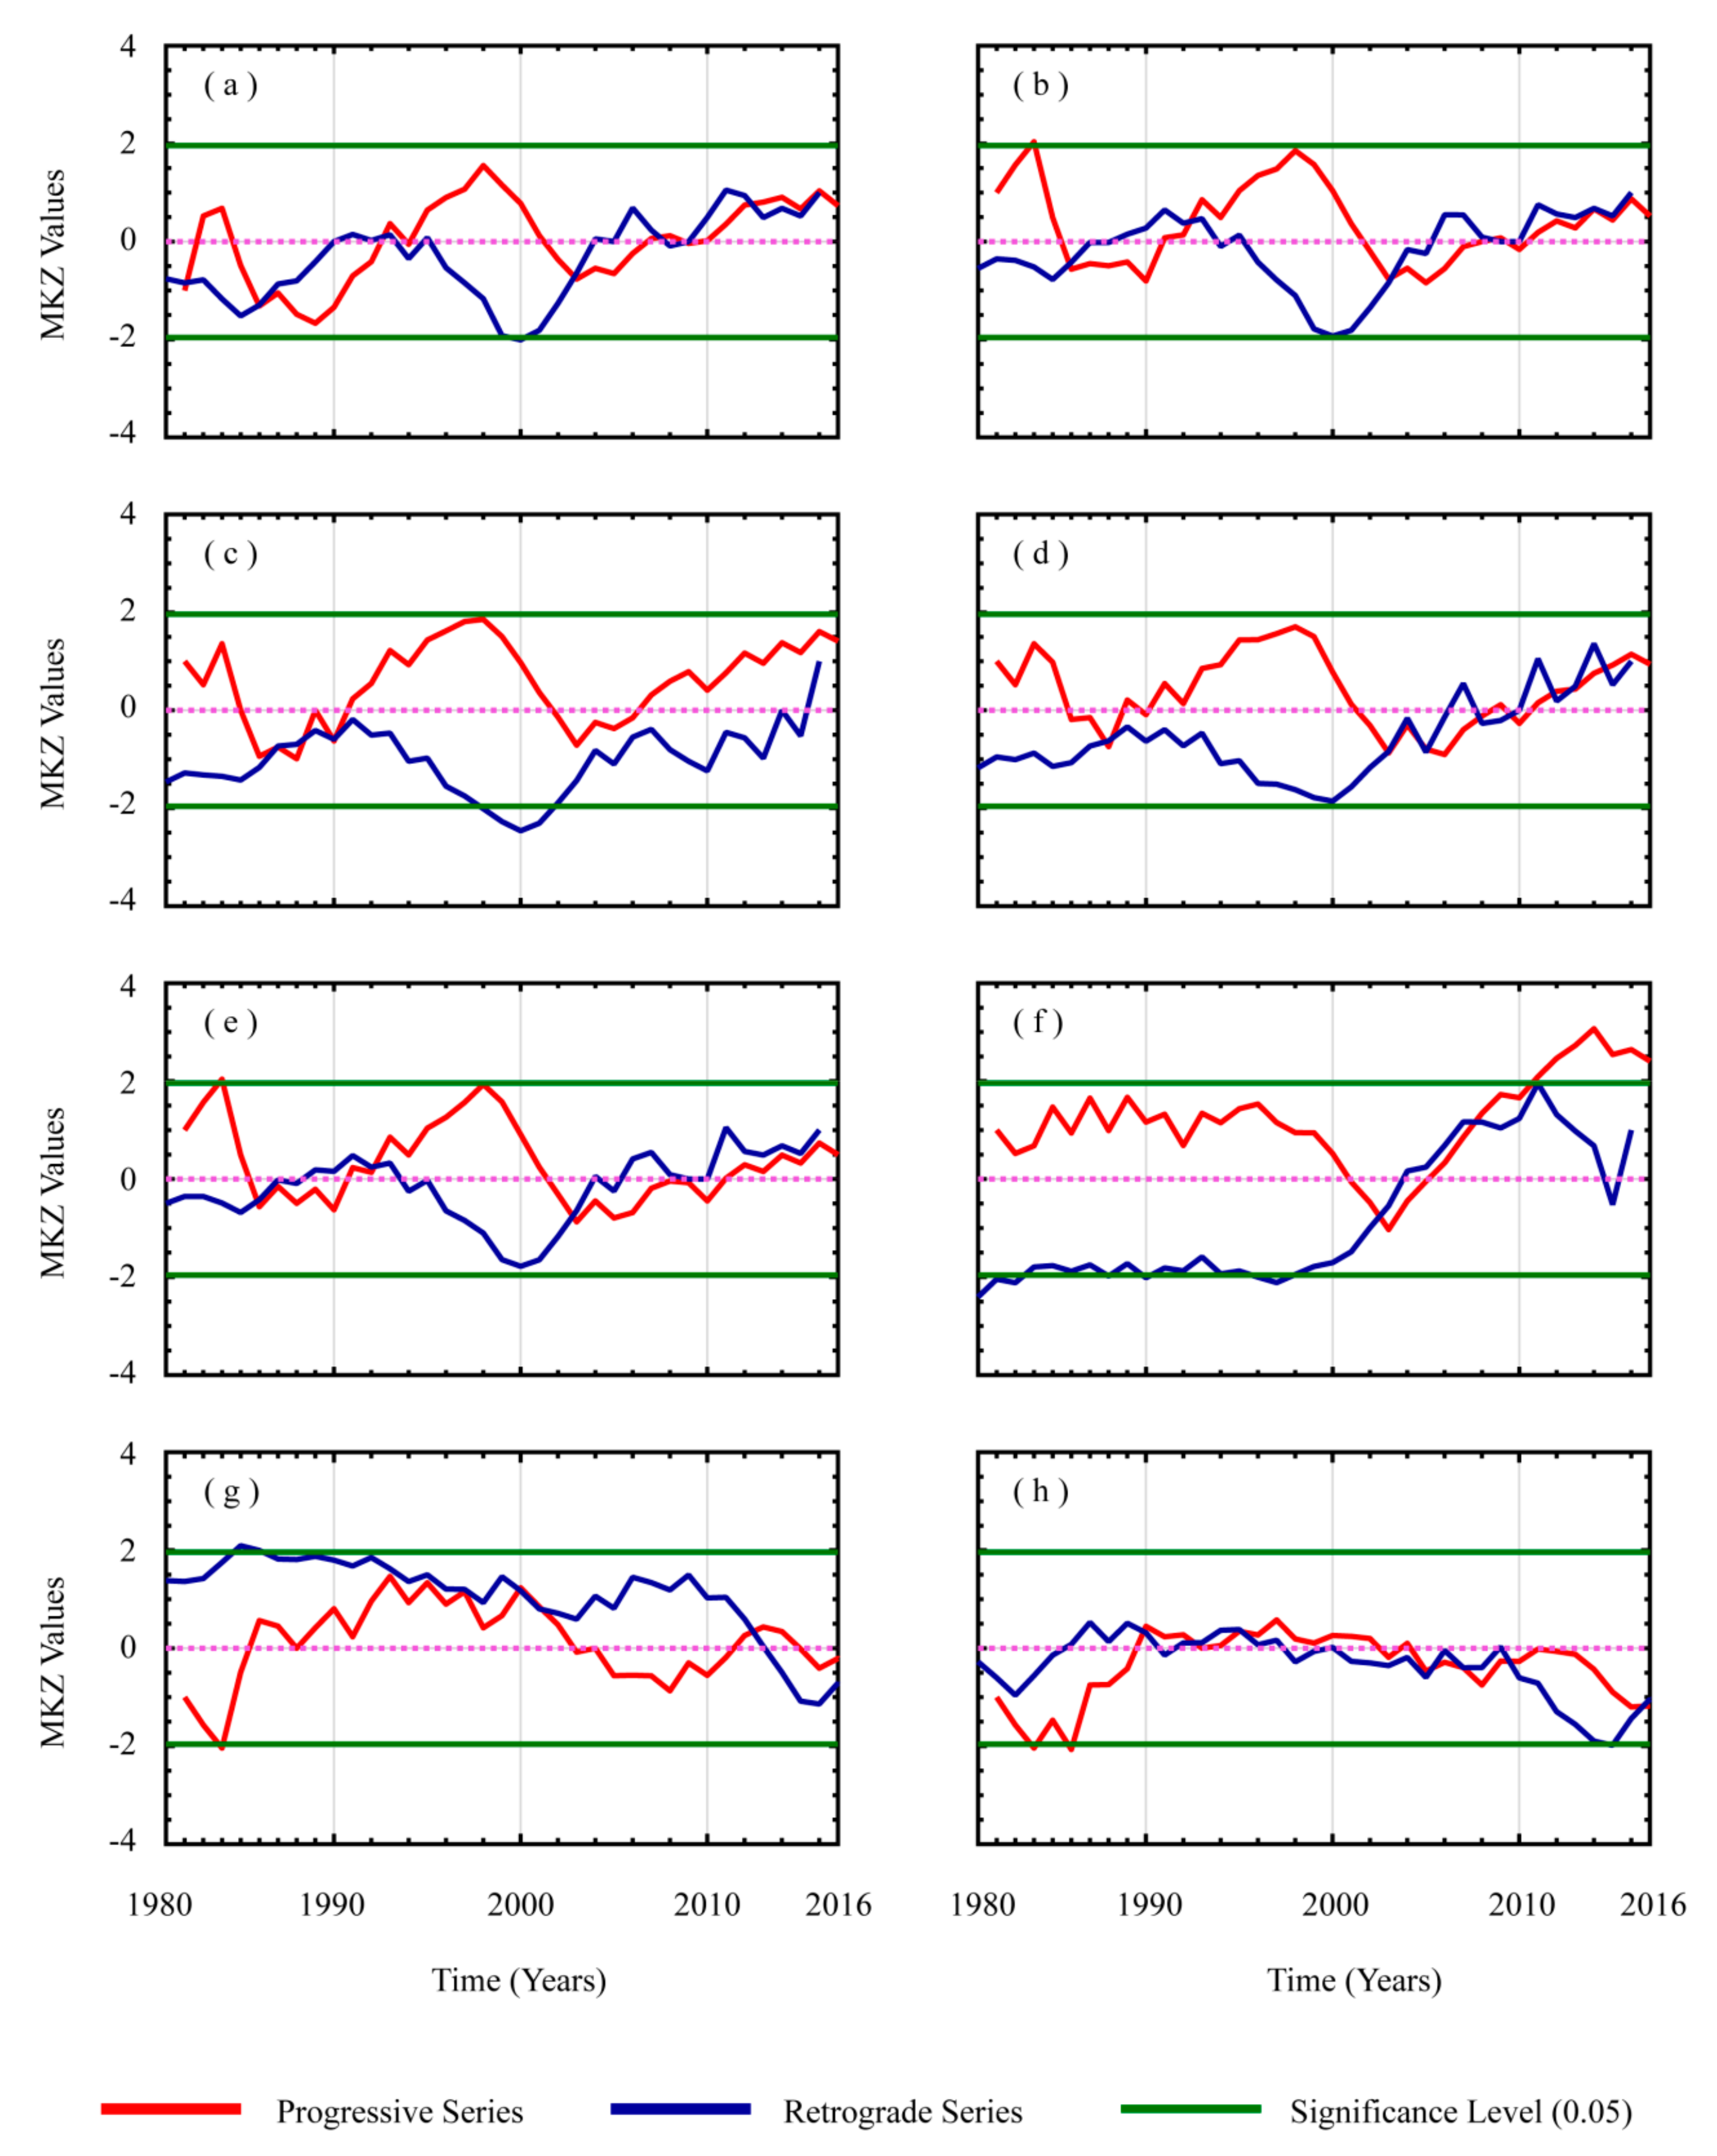
3.3.3. Sequential Mann-Kendall (SqMK) Test
4. Results
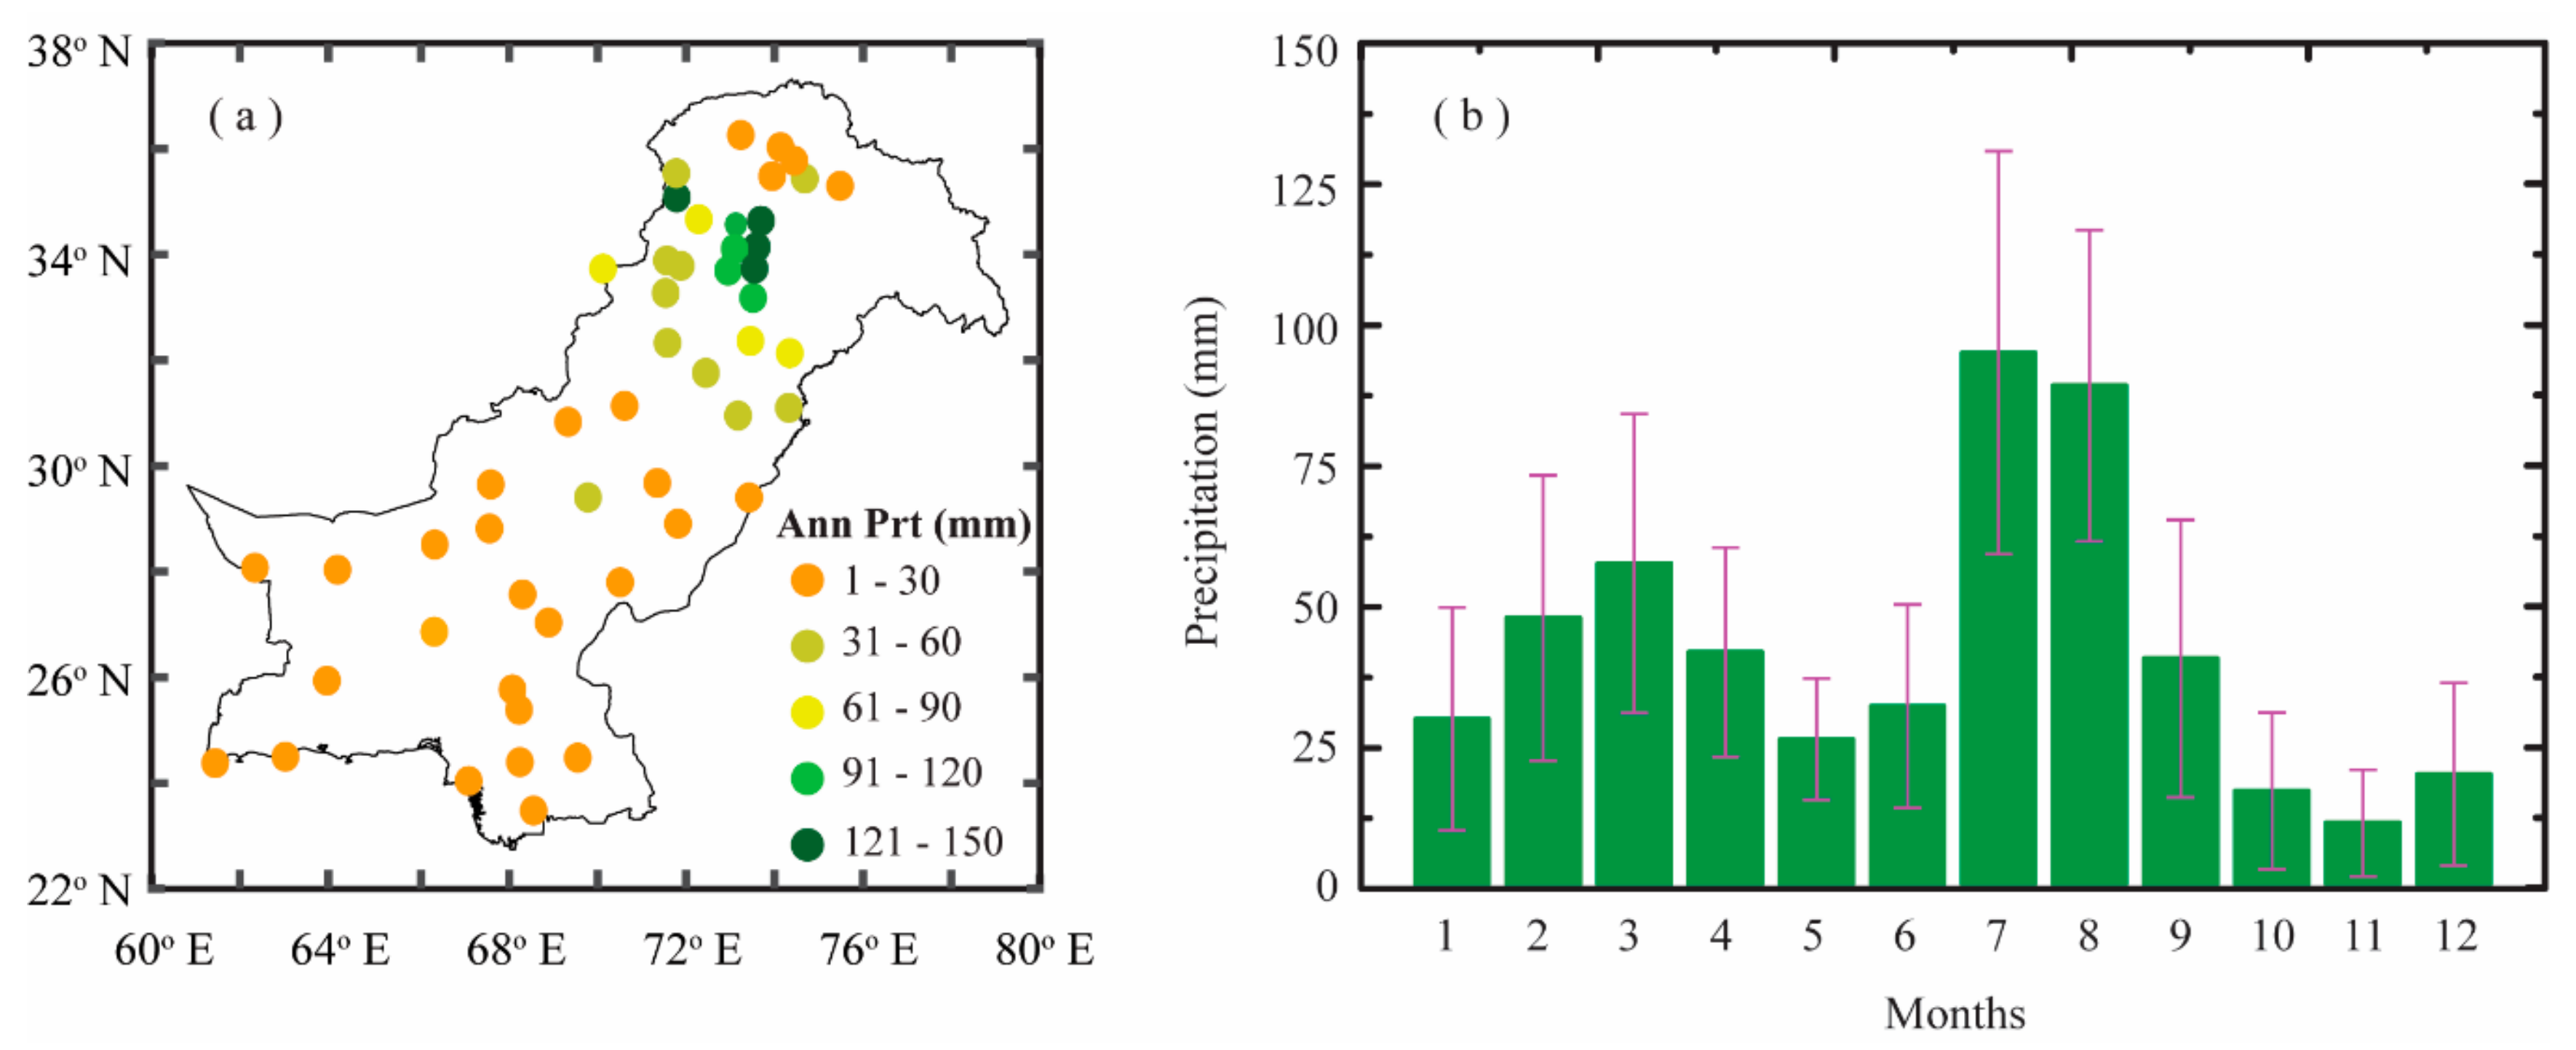
4.1. Long-Term Climatology of Pakistan
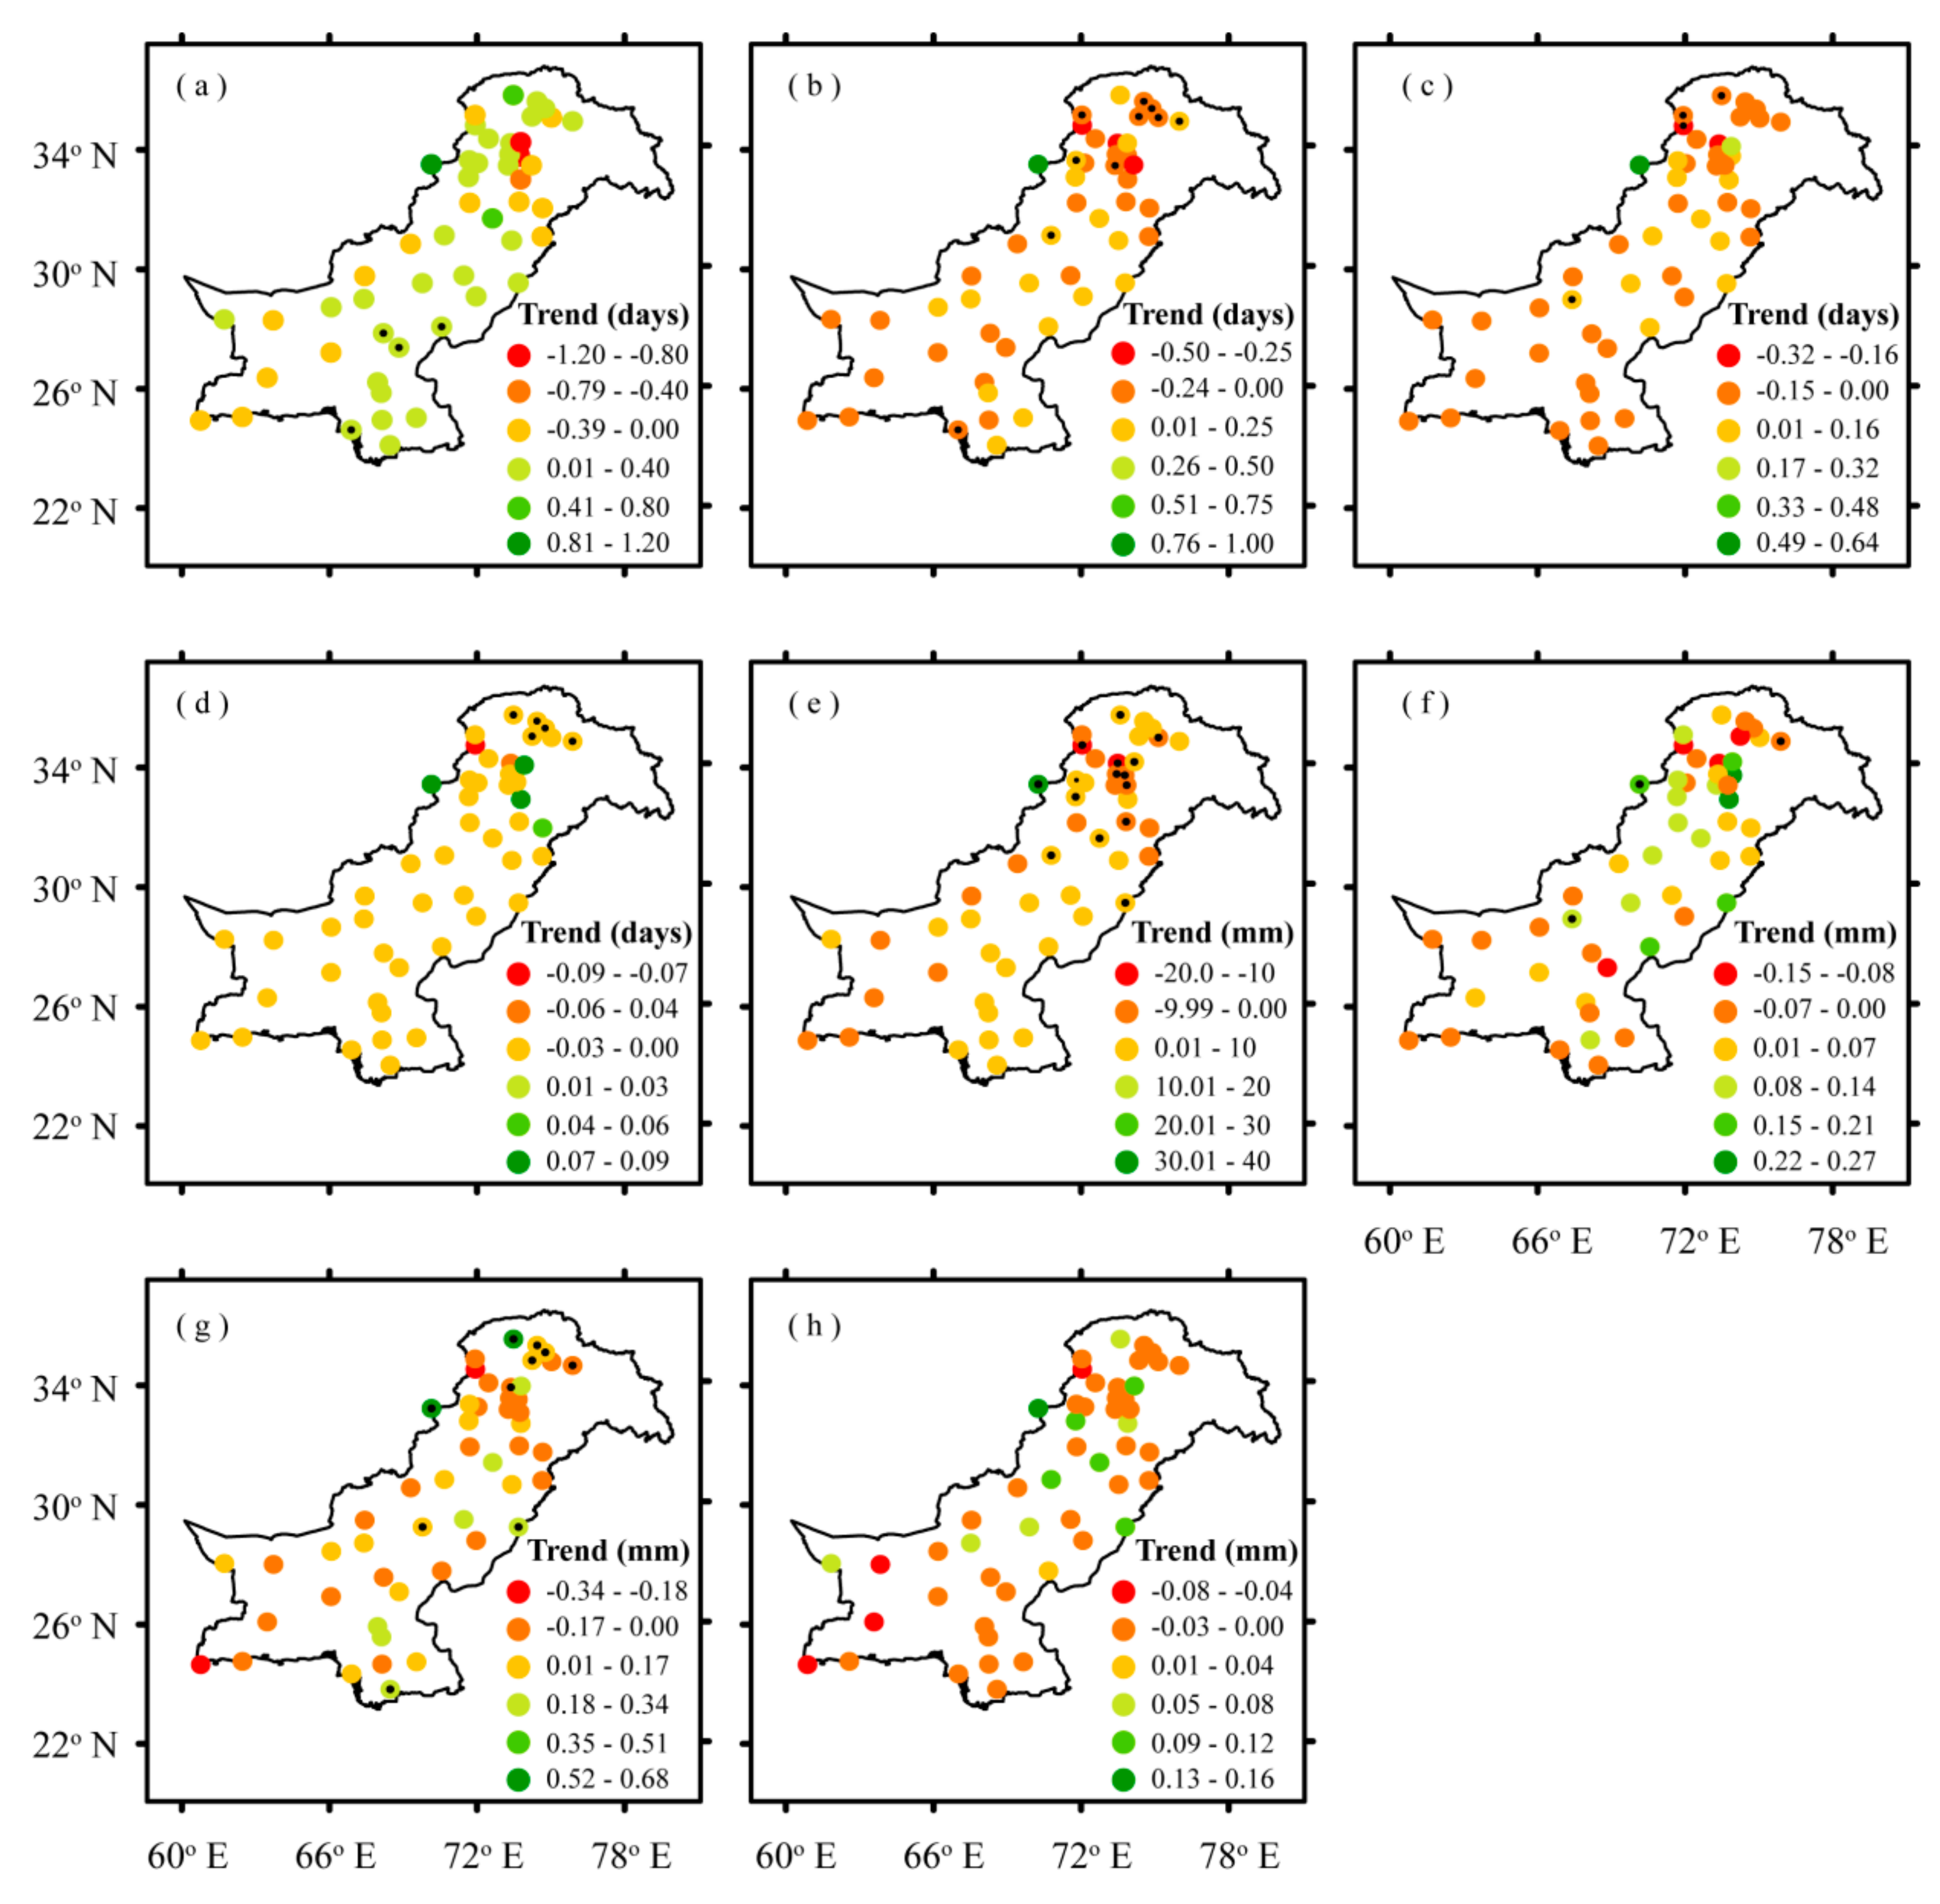
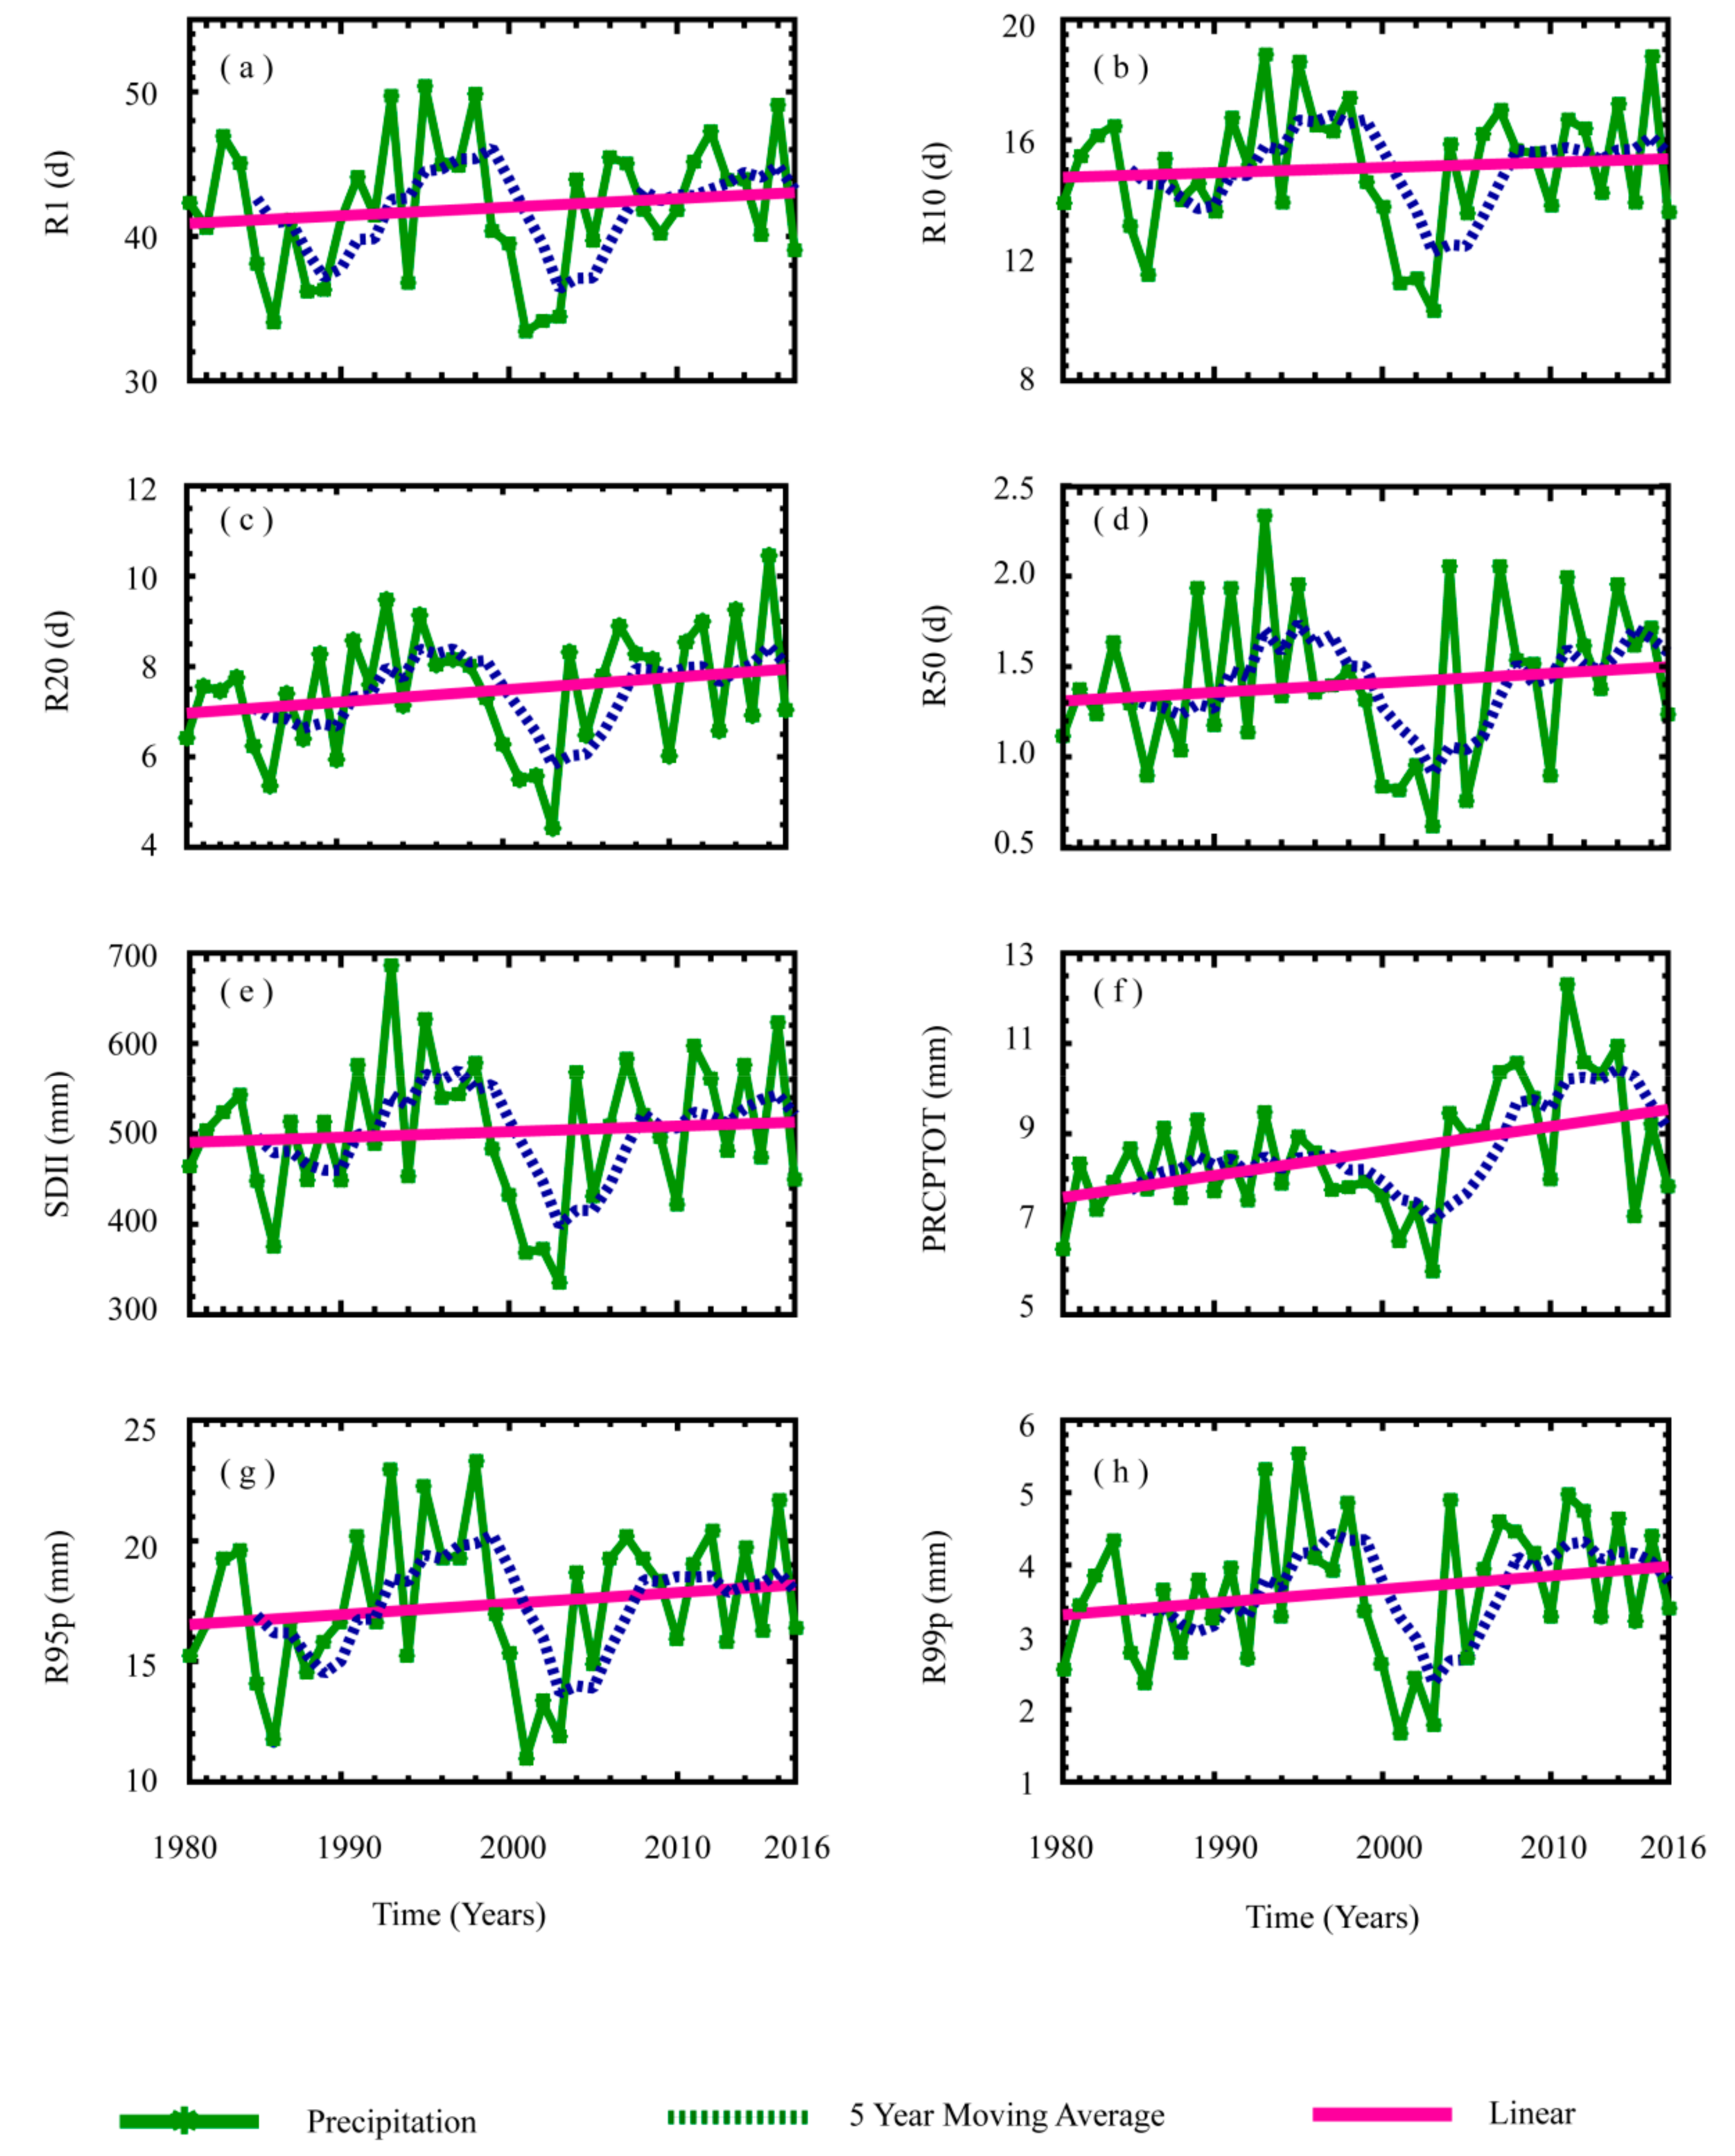
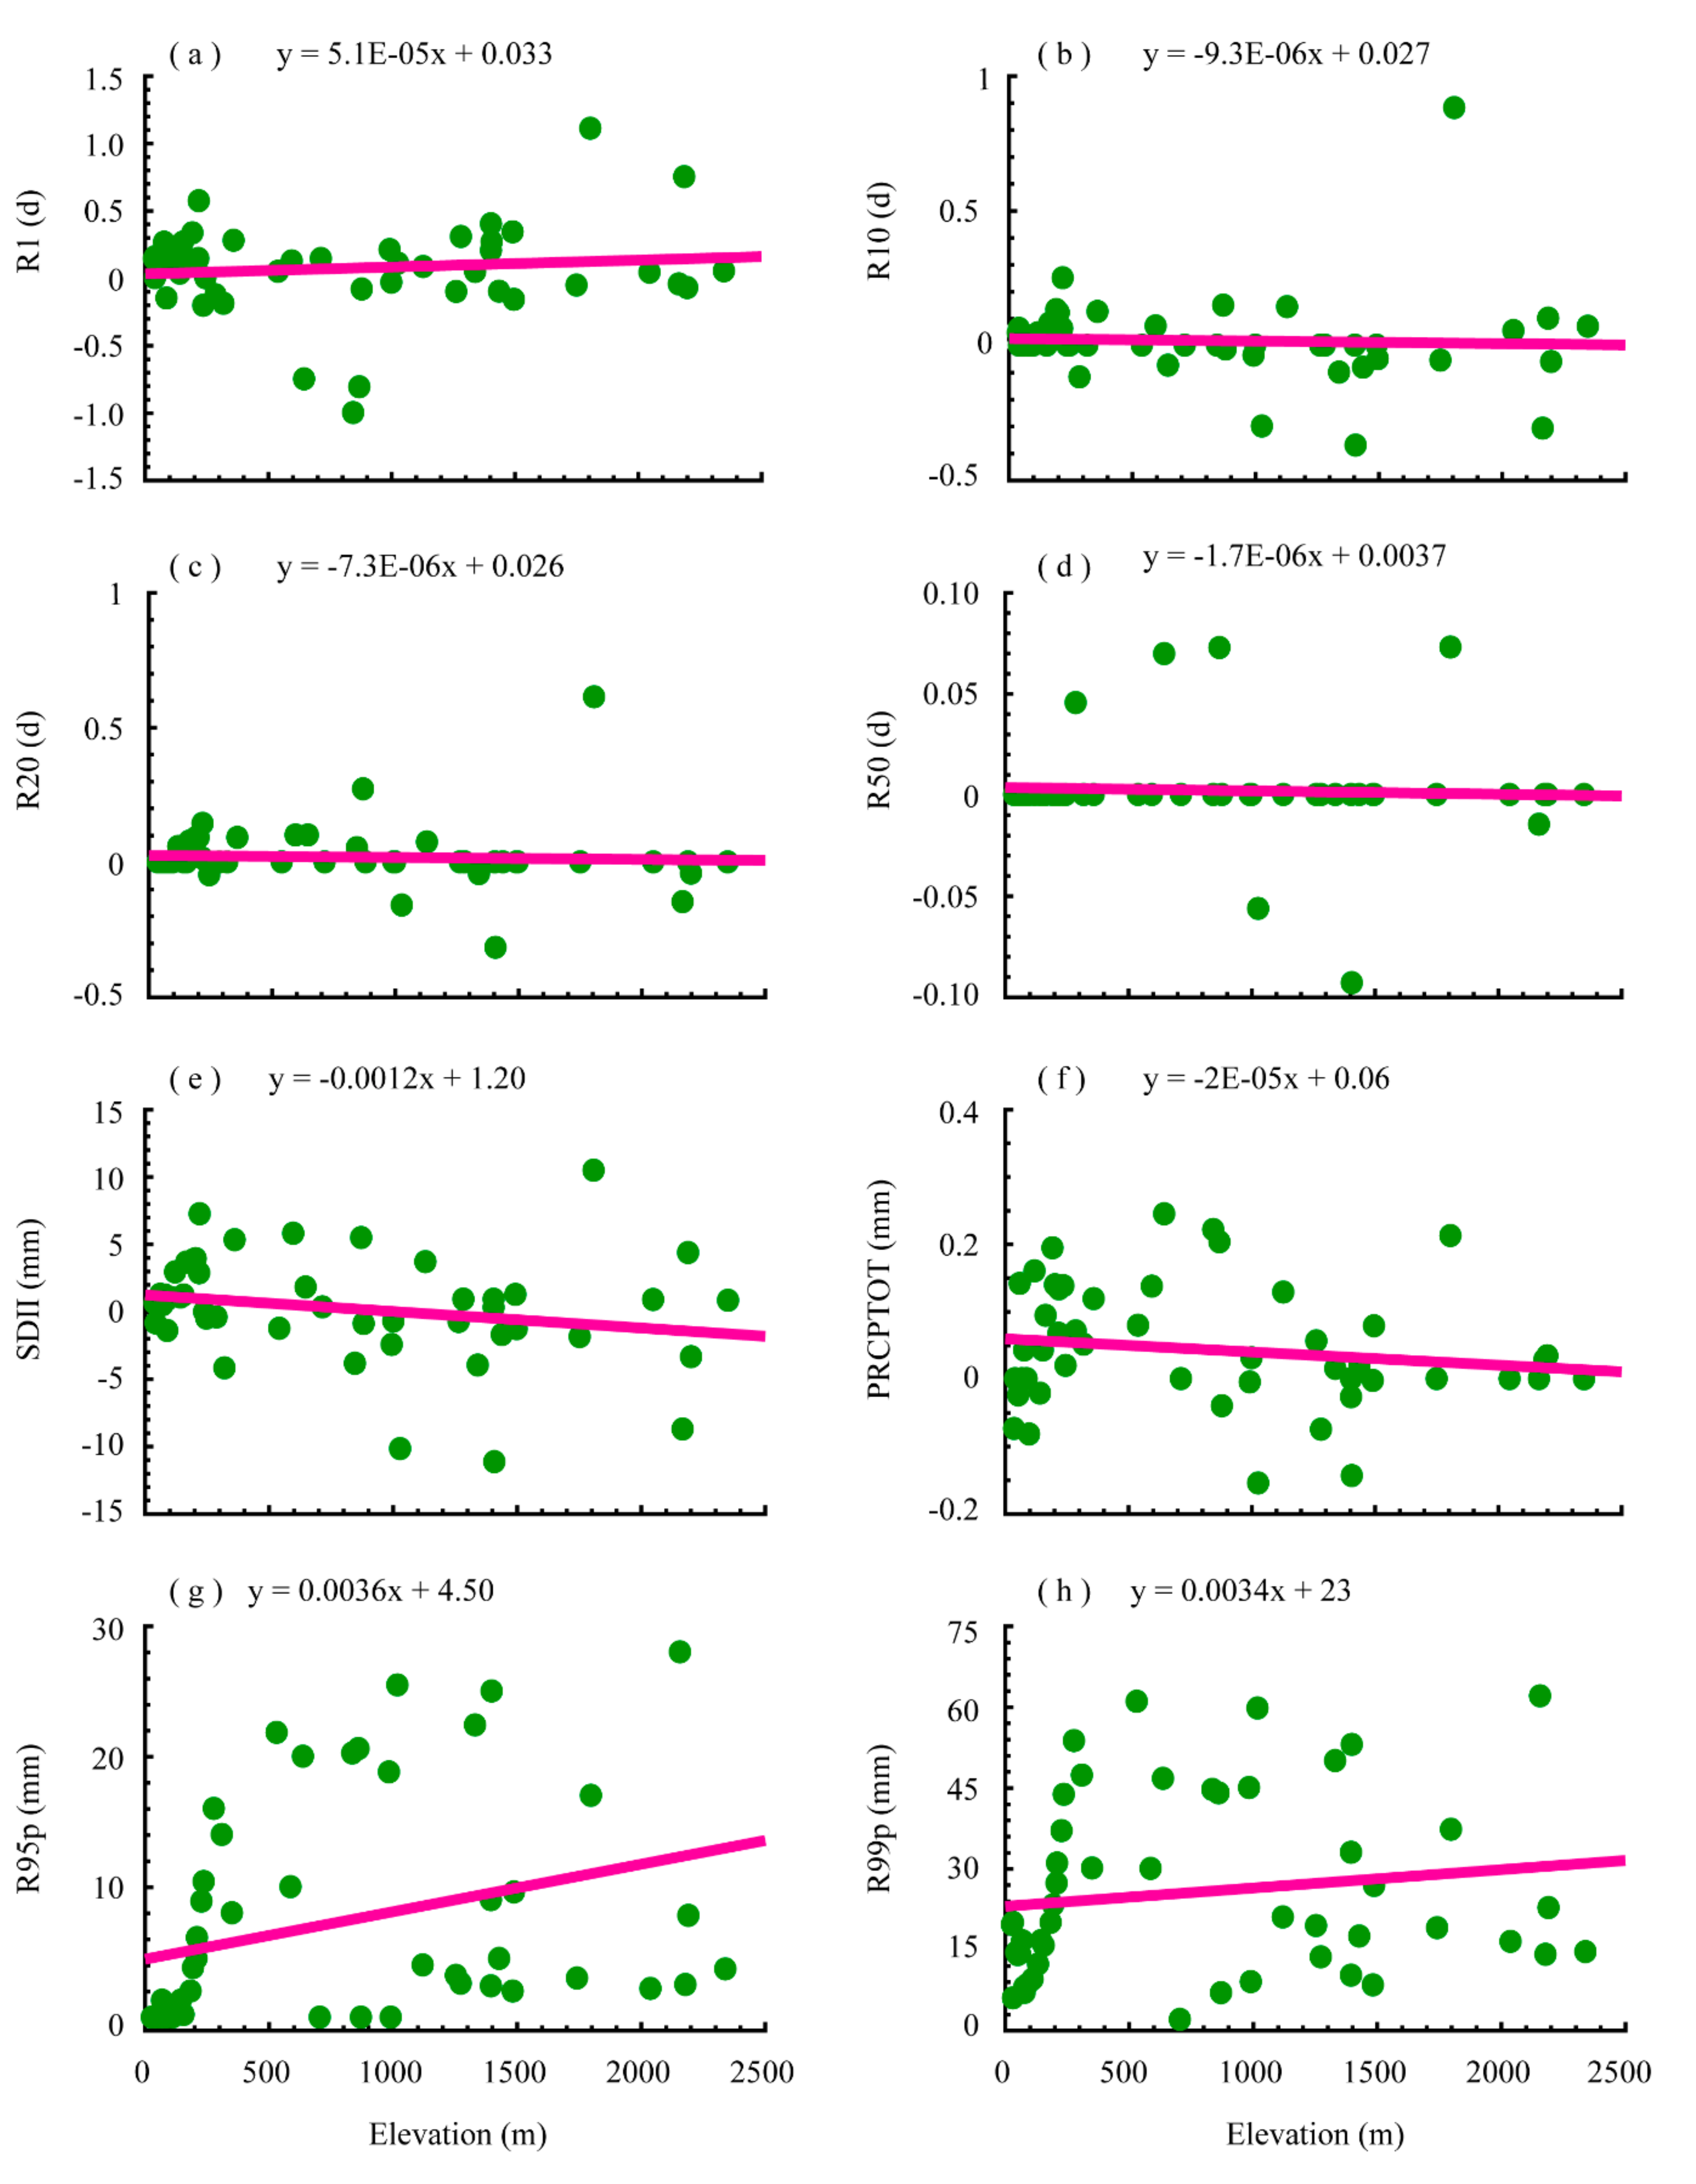
4.2. The Trend in Extreme Precipitation Indices
5. Discussion and Conclusions
Author Contributions
Funding
Acknowledgments
Conflicts of Interest
References
- IPCC. Climate Change 2013: The Physical Science Basis; Cambridge University Press: Cambridge, UK, 2013. [Google Scholar]
- Zhang, Q.; Li, J.; Singh, V.P.; Xiao, M. Spatio-temporal relations between temperature and precipitation regimes: Implications for temperature-induced changes in the hydrological cycle. Glob. Planet. Chang. 2013, 111, 57–76. [Google Scholar] [CrossRef]
- Sillmann, J.; Kharin, V.V.; Zwiers, F.W.; Zhang, X.; Bronaugh, D. Climate extremes indices in the CMIP5 multimodel ensemble : Part 2. Future climate projections. J. Geophys. Res. Atmos. 2013, 118, 2473–2493. [Google Scholar] [CrossRef]
- Cheng, C.S.; Auld, H.; Li, Q.; Li, G. Possible impacts of climate change on extreme weather events at local scale in south-central Canada. Clim. Chang. 2012, 112, 963–979. [Google Scholar] [CrossRef] [Green Version]
- Zhang, Q.; Gu, X.; Singh, V.P.; Kong, D.; Chen, X. Spatiotemporal behavior of floods and droughts and their impacts on agriculture in China. Glob. Planet. Chang. 2015, 131, 63–72. [Google Scholar] [CrossRef]
- Moazami, S.; Golian, S.; Hong, Y.; Sheng, C.; Kavianpour, M.R. Comprehensive evaluation of four high-resolution satellite precipitation products under diverse climate conditions in Iran. Hydrol. Sci. J. 2016, 61, 420–440. [Google Scholar] [CrossRef]
- Sun, Q.; Miao, C.; Duan, Q.; Wang, Y. Temperature and precipitation changes over the Loess Plateau between 1961 and 2011, based on high-density gauge observations. Glob. Planet. Chang. 2015, 132, 1–10. [Google Scholar] [CrossRef]
- Berardy, A.; Chester, M.V. Climate change vulnerability in the food, energy, and water nexus: Concerns for agricultural production in Arizona and its urban export supply. Environ. Res. Lett. 2017, 12, 35004. [Google Scholar] [CrossRef]
- Taxak, A.K.; Murumkar, A.R.; Arya, D.S. Long term spatial and temporal rainfall trends and homogeneity analysis in Wainganga basin, Central India. Weather Clim. Extrem. 2014, 4, 50–61. [Google Scholar] [CrossRef] [Green Version]
- Herring, S.C.; Hoerling, M.P.; Kossin, J.P.; Peterson, T.C.; Stott, P.A. Explaining Extreme Events of 2014 from a Climate Perspective. Bull. Am. Meteorol. Soc. 2015, 96, S1–S172. [Google Scholar] [CrossRef]
- Bintanja, R.; Selten, F.M. Future increases in Arctic precipitation linked to local evaporation and sea-ice retreat. Nature 2014, 509, 479–482. [Google Scholar] [CrossRef]
- Kharin, V.V.; Zwiers, F.W.; Zhang, X.; Wehner, M. Changes in temperature and precipitation extremes in the CMIP5 ensemble. Clim. Chang. 2013, 119, 345–357. [Google Scholar] [CrossRef]
- Scoccimarro, E.; Gualdi, S.; Bellucci, A.; Zampieri, M.; Navarra, A. Heavy precipitation events in a warmer climate: Results from CMIP5 models. J. Clim. 2013, 26, 7902–7911. [Google Scholar] [CrossRef]
- Ahmad, I.; Tang, D.; Wang, T.; Wang, M.; Wagan, B. Precipitation Trends over Time Using Mann-Kendall and Spearman’s rho Tests in Swat River Basin, Pakistan. Adv. Meteorol. 2015, 43, 431860. [Google Scholar] [CrossRef] [Green Version]
- Xu, M.; Kang, S.; Wu, H.; Yuan, X. Detection of spatio-temporal variability of air temperature and precipitation based on long-term meteorological station observations over Tianshan Mountains, Central Asia. Atmos. Res. 2018, 203, 141–163. [Google Scholar] [CrossRef]
- Karpouzos, D.; Kavalieratou, S.; Babajimopoulos, C. Trend analysis of precipitation data in Pieria Region (Greece). Eur. Water 2010, 30, 31–40. [Google Scholar]
- Xu, W.; Ma, L.; Ma, M.; Zhang, H.; Yuan, W. Spatial-temporal variability of snow cover and depth in the Qinghai-Tibetan plateau. J. Clim. 2017, 30, 1521–1533. [Google Scholar] [CrossRef]
- Rahman, G.; Rahman, A.; Sami, U.; Dawood, M. Spatial and temporal variation of rainfall and drought in Khyber Pakhtunkhwa Province of Pakistan during 1971–2015. Arab. J. Geosci. 2018, 11, 46. [Google Scholar] [CrossRef]
- Ullah, W.; Nihei, T.; Nafees, M.; Zaman, R.; Ali, M. Understanding climate change vulnerability, adaptation and risk perceptions at household level in Khyber Pakhtunkhwa, Pakistan. Int. J. Clim. Chang. Strateg. Manag. 2018, 10, 359–378. [Google Scholar] [CrossRef]
- You, Q.; Ren, G.Y.; Zhang, Y.Q.; Ren, Y.Y.; Sun, X.B.; Zhan, Y.J.; Shrestha, A.B.; Krishnan, R. An overview of studies of observed climate change in the Hindu Kush Himalayan (HKH) region. Adv. Clim. Chang. Res. 2017, 8, 141–147. [Google Scholar] [CrossRef]
- Alexander, L.V.; Zhang, X.; Peterson, T.C.; Caesar, J.; Gleason, B.; Klein Tank, A.M.G.; Haylock, M.; Collins, D.; Trewin, B.; Rahimzadeh, F.; et al. Global observed changes in daily climate extremes of temperature and precipitation. J. Geophys. Res. Atmos. 2006, 111. [Google Scholar] [CrossRef] [Green Version]
- Groisman, P.Y.; Knight, R.W.; Easterling, D.R.; Karl, T.R.; Hegerl, G.; Razuvaev, V.N. Trends in Intense Precipitation in the Climate Record. J. Clim. 2005, 18, 1326–1350. [Google Scholar] [CrossRef]
- Ren, Y.Y.; Ren, G.Y.; Sun, X.B.; Shrestha, A.B.; You, Q.L.; Zhan, Y.J.; Rajbhandari, R.; Zhang, P.F.; Wen, K.M. Observed changes in surface air temperature and precipitation in the Hindu Kush Himalayan region over the last 100-plus years. Adv. Clim. Chang. Res. 2017, 8, 148–156. [Google Scholar] [CrossRef]
- Sun, X.B.; Ren, G.Y.; Shrestha, A.B.; Ren, Y.Y.; You, Q.L.; Zhan, Y.J.; Xu, Y.; Rajbhandari, R. Changes in extreme temperature events over the Hindu Kush Himalaya during 1961–2015. Adv. Clim. Chang. Res. 2017, 8, 157–165. [Google Scholar] [CrossRef]
- Sheikh, M.M.; Manzoor, N.; Ashraf, J.; Adnan, M.; Collins, D.; Hameed, S.; Manton, M.J.; Ahmed, A.U.; Baidya, S.K.; Borgaonkar, H.P.; et al. Trends in extreme daily rainfall and temperature indices over South Asia. Int. J. Climatol. 2015, 35, 1625–1637. [Google Scholar] [CrossRef]
- Tank, K.A.M.G.; Peterson C., T.; Quadir, D.A.; Dorji, S.; Zou, X.; Tang, H.; Santhosh, K.; Joshi, U.R.; Jaswal, A.K.; Kolli, R.K.; et al. Changes in daily temperature and precipitation extremes in central and south Asia. J. Geophys. Res. 2006, 111. [Google Scholar] [CrossRef]
- Hartmann, H.; Buchanan, H. Trends in extreme precipitation events in the indus River Basin and flooding in Pakistan. Atmos. Ocean 2014, 52, 77–91. [Google Scholar] [CrossRef]
- Hu, Z.; Zhou, Q.; Chen, X.; Qian, C.; Wang, S.; Li, J. Variations and changes of annual precipitation in Central Asia over the last century. Int. J. Climatol. 2017, 37, 157–170. [Google Scholar] [CrossRef]
- Hu, Z.; Hu, Q.; Zhang, C.; Chen, X.; Li, Q. Evaluation of Reanalysis, Spatially Interpolated and Satellite Remotely Sensed Precipitation Data Sets in Central Asia. J. Geophys. Res. Atmos. 2016, 121, 5648–5663. [Google Scholar] [CrossRef] [Green Version]
- Hu, Z.; Li, Q.; Chen, X.; Teng, Z.; Chen, C.; Yin, G.; Zhang, Y. Climate changes in temperature and precipitation extremes in an alpine grassland of Central Asia. Theor. Appl. Climatol. 2016, 126, 519–531. [Google Scholar] [CrossRef]
- Moberg, A.; Jones, P.D.; Lister, D.; Walther, A.; Brunet, M.; Jacobeit, J.; Alexander, L.V.; Della-Marta, P.M.; Luterbacher, J.; Yiou, P.; et al. Indices for daily temperature and precipitation extremes in Europe analyzed for the period 1901–2000. J. Geophys. Res. Atmos. 2006, 111. [Google Scholar] [CrossRef] [Green Version]
- Tank, K.A.M.G.; Können, G.P. Trends in Indices of daily temperature and precipitation extremes in Europe, 1946–1999. J. Clim. 2003, 16, 3665–3680. [Google Scholar] [CrossRef]
- Donat, M.G.; Peterson, T.C.; Brunet, M.; King, A.D.; Almazroui, M.; Kolli, R.K.; Boucherf, D.; Al-Mulla, A.Y.; Nour, A.Y.; Aly, A.A.; et al. Changes in extreme temperature and precipitation in the Arab region: Long-term trends and variability related to ENSO and NAO. Int. J. Climatol. 2014, 34, 581–592. [Google Scholar] [CrossRef]
- Almazroui, M.; Islam, M.N.; Dambul, R.; Jones, P.D. Trends of temperature extremes in Saudi Arabia. Int. J. Climatol. 2014, 34, 808–826. [Google Scholar] [CrossRef]
- Zhou, B.; Xu, Y.; Wu, J.; Dong, S.; Shi, Y. Changes in temperature and precipitation extreme indices over China: Analysis of a high-resolution grid dataset. Int. J. Climatol. 2016, 36, 1051–1066. [Google Scholar] [CrossRef]
- Sun, W.; Mu, X.; Song, X.; Wu, D.; Cheng, A.; Qiu, B. Changes in extreme temperature and precipitation events in the Loess Plateau (China) during 1960-2013 under global warming. Atmos. Res. 2016, 168, 33–48. [Google Scholar] [CrossRef]
- You, Q.; Kang, S.; Aguilar, E.; Pepin, N.; Flugel, W.A.; Yan, Y.; Xu, Y.; Zhang, Y.; Huang, J. Changes in daily climate extremes in China and their connection to the large scale atmospheric circulation during 1961–2003. Clim. Dyn. 2011, 36, 2399–2417. [Google Scholar] [CrossRef]
- Li, Z.; He, Y.; Wang, P.; Theakstone, W.H.; An, W.; Wang, X.; Lu, A.; Zhang, W.; Cao, W. Changes of daily climate extremes in southwestern China during 1961-2008. Glob. Planet. Chang. 2012, 80–81, 255–272. [Google Scholar]
- Shahid, S. Trends in extreme rainfall events of Bangladesh. Theor. Appl. Climatol. 2011, 104, 489–499. [Google Scholar] [CrossRef]
- Shahid, S.; Wang, X.J.; Harun, S.B.; Shamsudin, S.B.; Ismail, T.; Minhans, A. Climate variability and changes in the major cities of Bangladesh: Observations, possible impacts and adaptation. Reg. Environ. Chang. 2016, 16, 459–471. [Google Scholar] [CrossRef]
- Endo, N.; Matsumoto, J.; Hayashi, T.; Terao, T.; Murata, F.; Kiguchi, M.; Yamane, Y.; Alam, S. Trends in Precipitation Characteristics in Bangladesh from 1950 to 2008. SOLA 2015, 11, 7–11. [Google Scholar] [CrossRef] [Green Version]
- Deshpande, N.R.; Kothawale, D.R.; Kulkarni, A. Changes in climate extremes over major river basins of India. Int. J. Climatol. 2016, 36, 4548–4559. [Google Scholar] [CrossRef]
- Ullah, S.; You, Q.; Ali, A.; Ullah, W.; Jan, M.A.; Zhang, Y.; Xie, W.; Xie, X. Observed changes in maximum and minimum temperatures over China-Pakistan economic corridor during 1980–2016. Atmos. Res. 2019, 216, 37–51. [Google Scholar] [CrossRef]
- Ashiq, M.W.; Zhao, C.; Ni, J.; Akhtar, M. GIS-based high-resolution spatial interpolation of precipitation in mountain-plain areas of Upper Pakistan for regional climate change impact studies. Theor. Appl. Climatol. 2010, 99, 239–253. [Google Scholar] [CrossRef] [Green Version]
- Hussain, M.S.; Lee, S. The regional and the seasonal variability of extreme precipitation trends in Pakistan. Asia-Pac. J. Atmos. Sci. 2013, 49, 421–441. [Google Scholar] [CrossRef]
- Ullah, S.; You, Q.; Ullah, W.; Ali, A. Observed changes in precipitation in China-Pakistan economic corridor during 1980–2016. Atmos. Res. 2018, 210, 1–14. [Google Scholar] [CrossRef]
- Kreft, S.; Eckstein, D.; Junghans, L.; Kerestan, C.; Hagen, U. Global Climate Risk Index. Who Suffers Most from Extreme Weather Events? Weather-related Loss Events in 2013 and 1994 to 2013; German Watch: Bonn, Germany, 2015. [Google Scholar]
- Zhan, Y.J.; Ren, G.Y.; Shrestha, A.B.; Rajbhandari, R.; Ren, Y.Y.; Sanjay, J.; Xu, Y.; Sun, X.B.; You, Q.L.; Wang, S. Changes in extreme precipitation events over the Hindu Kush Himalayan region during 1961–2012. Adv. Clim. Chang. Res. 2017, 8, 166–175. [Google Scholar] [CrossRef]
- Zahid, M.; Rasul, G. Frequency of Extreme Temperature & Precipitation Events in Pakistan 1965–2009. Sci. Int 2011, 23, 313–319. [Google Scholar]
- Abbas, F.; Ahmad, A.; Safeeq, M.; Ali, S.; Saleem, F.; Hammad, H.M.; Farhad, W. Changes in precipitation extremes over arid to semiarid and subhumid Punjab, Pakistan. Theor. Appl. Climatol. 2014, 116, 671–680. [Google Scholar] [CrossRef]
- Abbas, F.; Sarwar, N.; Ibrahim, M.; Adrees, M.; Ali, S.; Saleem, F.; Hammad, H.M. Patterns of climate extremes in the coastal and highland regions of Balochistan—Pakistan. Earth Interact. 2018, 22. [Google Scholar] [CrossRef]
- Abbas, F.; Rehman, I.; Adrees, M.; Ibrahim, M.; Saleem, F.; Ali, S.; Rizwan, M.; Salik, M.R. Prevailing trends of climatic extremes across Indus-Delta of Sindh-Pakistan. Theor. Appl. Climatol. 2018, 131, 1101–1117. [Google Scholar] [CrossRef]
- Hassan, S.A.; Ansari, M.R.K. Hydro-climatic aspects of Indus River flow propagation. Arab. J. Geosci. 2015, 8, 10977–10982. [Google Scholar] [CrossRef]
- Mahmood, R.; Jia, S. Assessment of Impacts of Climate Change on the Water Resources of the Transboundary Jhelum River Basin of Pakistan and India. Water 2016, 8, 246. [Google Scholar] [CrossRef] [Green Version]
- Xie, H.; Ringler, C.; Zhu, T.; Waqas, A. Droughts in Pakistan: A spatiotemporal variability analysis using the Standardized Precipitation Index. Water Int. 2013, 38, 620–631. [Google Scholar] [CrossRef]
- Rahman, A.u.; Khan, A.N. Analysis of flood causes and associated socio-economic damages in the Hindukush region. Nat. Hazards 2011, 59, 1239. [Google Scholar] [CrossRef]
- Gadiwala, M.S.; Burke, F. Climate Change and Precipitation in Pakistan—A Meteorological Prospect. Int. Econ. Environ. Geol. 2013, 4, 10–15. [Google Scholar]
- Arshad, M.; Kächele, H.; Krupnik, T.J.; Amjath-Babu, T.S.; Aravindakshan, S.; Abbas, A.; Mehmood, Y.; Müller, K. Climate variability, farmland value, and farmers’ perceptions of climate change: Implications for adaptation in rural Pakistan. Int. J. Sustain. Dev. World Ecol. 2017, 24, 532–544. [Google Scholar] [CrossRef]
- Ullah, W.; Wang, G.; Ali, G.; Tawia Hagan, D.; Bhatti, A.S.; Lou, D. Comparing Multiple Precipitation Products against In-Situ Observations over Different Climate Regions of Pakistan. Remote Sens. 2019, 11, 628. [Google Scholar] [CrossRef] [Green Version]
- Ullah, S.; You, Q.; Ullah, W.; Hagan, F.D.T.; Ali, A.; Ali, G.; Zhang, Y.; Jan, M.A.; Bhatti, A.S.; Xie, W. Daytime and nighttime heat wave characteristics based on multiple indices over the China—Pakistan economic corridor. Clim. Dyn. 2019, 53, 6329–6349. [Google Scholar] [CrossRef]
- Iqbal, M.F.; Athar, H. Validation of satellite based precipitation over diverse topography of Pakistan. Atmos. Res. 2018, 201, 247–260. [Google Scholar] [CrossRef]
- Waqas, A.; Athar, H. Spatiotemporal variability in daily observed precipitation and its relationship with snow cover of Hindukush, Karakoram and Himalaya region in northern Pakistan. Atmos. Res. 2019, 228, 196–205. [Google Scholar] [CrossRef]
- Ullah, S.; You, Q.; Ullah, W.; Ali, A.; Xie, W.; Xie, X. Observed Changes in Temperature Extremes over China-Pakistan Economic Corridor during 1980-2016. Int. J. Climatol. 2018, 39, 1457–1475. [Google Scholar] [CrossRef]
- Ali, S.; Eum, H.I.; Cho, J.; Dan, L.; Khan, F.; Dairaku, K.; Shrestha, M.L.; Hwang, S.; Nasim, W.; Khan, I.A.; et al. Assessment of climate extremes in future projections downscaled by multiple statistical downscaling methods over Pakistan. Atmos. Res. 2019, 222, 114–133. [Google Scholar] [CrossRef]
- Trenberth, K.E.; Fasullo, J.T. Climate extremes and climate change: The Russian heat wave and other climate extremes of 2010. J. Geophys. Res. Atmos. 2012, 117. [Google Scholar] [CrossRef]
- Thom, H.C.S. Some methods of climatological analysis. WMO Tech. 1966, 81, 55. [Google Scholar]
- Ribeiro, S.; Caineta, J.; Costa, A.C. Review and discussion of homogenisation methods for climate data. Phys. Chem. Earth 2016, 94, 167–179. [Google Scholar] [CrossRef]
- Kang, H.M.; Yusof, F. Homogeneity Tests on Daily Rainfall Series in Peninsular Malaysia. Int. J. Contemp. Math. Sci. 2012, 7, 9–22. [Google Scholar]
- Gonzalez-Rouco, J.F.; Jimenez, J.L.; Quesada, V.; Valero, F. Quality Control and Homogeneity of Precipitation Data in the Southwest of Europe. J. Clim. 2001, 14, 964–978. [Google Scholar] [CrossRef] [Green Version]
- Ongoma, V.; Chen, H.; Gao, C.; Nyongesa, A.M.; Polong, F. Future changes in climate extremes over Equatorial East Africa based on CMIP5 multimodel ensemble. Nat. Hazards 2018, 90, 901–920. [Google Scholar] [CrossRef]
- Zhang, X.; Alexander, L.; Hegerl, G.C.; Jones, P.; Tank, A.K.; Peterson, T.C.; Trewin, B.; Zwiers, F.W. Indices for monitoring changes in extremes based on daily temperature and precipitation data. Wiley Interdiscip. Rev. Clim. Chang. 2011, 2, 851–870. [Google Scholar] [CrossRef]
- Mann, H.B. Nonparametric Tests against Trend. Econometrica 1945, 13, 245–259. [Google Scholar] [CrossRef]
- Kendall, M.G. Rank Correlation Methods, 2nd ed.; Hafner Publishing Co.: Oxford, UK, 1955. [Google Scholar]
- Sen, P.K. Estimates of the Regression Coefficient Based on Kendall’s Tau. J. Am. Stat. Assoc. 1968, 63, 1379–1389. [Google Scholar] [CrossRef]
- Anjum, R.; He, X.; Tanoli, J.I.; Raza, S.T. Contemporary temperature fluctuation in urban areas of pakistan. Atmosphere 2017, 8, 12. [Google Scholar] [CrossRef] [Green Version]
- Qiu, J.; Gao, Q.; Wang, S.; Su, Z. Comparison of temporal trends from multiple soil moisture data sets and precipitation: The implication of irrigation on regional soil moisture trend. Int. J. Appl. Earth Obs. Geoinf. 2016, 48, 17–27. [Google Scholar] [CrossRef]
- Jiang, R.; Wang, Y.; Xie, J.; Zhao, Y.; Li, F.; Wang, X. Assessment of extreme precipitation events and their teleconnections to El Niño Southern Oscillation, a case study in the Wei River Basin of China. Atmos. Res. 2019, 218, 372–384. [Google Scholar] [CrossRef]
- Iqbal, M.A.; Penas, A.; Cano-Ortiz, A.; Kersebaum, K.C.; Herrero, L.; del Río, S. Analysis of recent changes in maximum and minimum temperatures in Pakistan. Atmos. Res. 2016, 168, 234–249. [Google Scholar] [CrossRef]
- Wen, X.; Wu, X.; Gao, M. Spatiotemporal variability of temperature and precipitation in Gansu Province (Northwest China) during 1951–2015. Atmos. Res. 2017, 197, 132–149. [Google Scholar] [CrossRef]
- Martinez, C.J.; Maleski, J.J.; Miller, M.F. Trends in precipitation and temperature in Florida, USA. J. Hydrol. 2012, 452–453, 259–281. [Google Scholar] [CrossRef]
- Rahman, A.; Dawood, M. Spatio-statistical analysis of temperature fluctuation using Mann–Kendall and Sen’s slope approach. Clim. Dyn. 2017, 48, 783–797. [Google Scholar] [CrossRef]
- Wang, G.; Gong, T.; Lu, J.; Lou, D.; Hagan, D.F.T.; Chen, T. On the long-term changes of drought over China (1948–2012) from different methods of potential evapotranspiration estimations. Int. J. Climatol. 2018, 38, 2954–2966. [Google Scholar] [CrossRef]
- Ongoma, V.; Chen, H.; Omony, G.W. Variability of extreme weather events over the equatorial East Africa, a case study of rainfall in Kenya and Uganda. Theor. Appl. Climatol. 2018, 131, 295–308. [Google Scholar] [CrossRef]
- Sneyers, S. On the Statistical Analysis of Series of Observations; Technical Note No. 143, WMO No. 725 415; Secretariat of the World Meteorological Organization: Geneva, Switzerland, 1990. [Google Scholar]
- Ahmed, K.; Shahid, S.; Wang, X.; Nawaz, N.; Khan, N. Spatiotemporal changes in aridity of Pakistan during 1901–2016. Hydrol. Earth Syst. Sci. 2019, 23, 3081–3096. [Google Scholar] [CrossRef] [Green Version]
- Galarneau, T.J.; Hamill, T.M.; Dole, R.M.; Perlwitz, J. A Multiscale Analysis of the Extreme Weather Events over Western Russia and Northern Pakistan during July 2010. Mon. Weather Rev. 2012, 140, 1639–1664. [Google Scholar] [CrossRef] [Green Version]
- Ahmed, K.; Shahid, S.; Nawaz, N. Impacts of climate variability and change on seasonal drought characteristics of Pakistan. Atmos. Res. 2018, 241, 364–374. [Google Scholar] [CrossRef]
- Rasmussen, K.L.; Hill, A.J.; Toma, V.E.; Zuluaga, M.D.; Webster, P.J.; Houze, R.A. Multiscale analysis of three consecutive years of anomalous flooding in Pakistan. Q. J. R. Meteorol. Soc. 2015, 141, 1259–1276. [Google Scholar] [CrossRef]
- Iqbal, M.F.; Athar, H. Variability, trends, and teleconnections of observed precipitation over Pakistan. Theor. Appl. Climatol. 2017, 134, 613–632. [Google Scholar] [CrossRef]
- Dimri, A.P.; Niyogi, D.; Barros, A.P.; Ridley, J.; Mohanty, U.C.; Yasunari, T.; Sikka, D.R. Western Disturbances: A review. Rev. Geophys. 2015, 53, 225–246. [Google Scholar] [CrossRef]
- Haider, S.; Adnan, S. Classification and Assessment of Aridity Over Pakistan Provinces (1960–2009). Int. J. Environ. 2014, 3, 24–35. [Google Scholar] [CrossRef] [Green Version]
- Chen, F.; Chen, J.; Huang, W.; Chen, S.; Huang, X.; Jin, L.; Jia, J.; Zhang, X.; An, C.; Zhang, J.; et al. Westerlies Asia and monsoonal Asia: Spatiotemporal differences in climate change and possible mechanisms on decadal to sub-orbital timescales. Earth Sci. Rev. 2019, 192, 337–354. [Google Scholar] [CrossRef]
- Kotlia, B.S.; Singh, A.K.; Joshi, L.M.; Dhaila, B.S. Precipitation variability in the Indian Central Himalaya during last ca. 4000 years inferred from a speleothem record: Impact of Indian Summer Monsoon (ISM) and Westerlies. Quat. Int. 2015, 371, 244–253. [Google Scholar] [CrossRef]
- Latif, M.; Hannachi, A.; Syed, F.S. Analysis of rainfall trends over Indo-Pakistan summer monsoon and related dynamics based on CMIP5 climate model simulations. Int. J. Climatol. 2018, 38, 577–595. [Google Scholar] [CrossRef]
- Fowler, H.J.; Archer, D.R. Conflicting signals of climatic change in the upper Indus Basin. J. Clim. 2006, 19, 4276–4293. [Google Scholar] [CrossRef] [Green Version]


| Name | ID | Definition |
|---|---|---|
| Wet days | R1 mm | Annual count of days when precipitation ≥ 1 mm |
| Heavy precipitation days | R10 mm | Annual count of days when precipitation ≥ 10 mm |
| Very heavy precipitation days | R20 mm | Annual count of days when precipitation ≥ 20 mm |
| Severe precipitation days | R50 mm | Annual count of days when precipitation ≥ 50 mm |
| Annual total precipitation | PRCPTOT | Annual total precipitation in wet days |
| Simple daily intensity index | SDII | Mean precipitation amount on wet days |
| Very wet days | R95p | Annual precipitation ≥ 95 percentile |
| Extremely wet days | R99p | Annual precipitation ≥ 99 percentile |
© 2020 by the authors. Licensee MDPI, Basel, Switzerland. This article is an open access article distributed under the terms and conditions of the Creative Commons Attribution (CC BY) license (http://creativecommons.org/licenses/by/4.0/).
Share and Cite
Bhatti, A.S.; Wang, G.; Ullah, W.; Ullah, S.; Fiifi Tawia Hagan, D.; Kwesi Nooni, I.; Lou, D.; Ullah, I. Trend in Extreme Precipitation Indices Based on Long Term In Situ Precipitation Records over Pakistan. Water 2020, 12, 797. https://doi.org/10.3390/w12030797
Bhatti AS, Wang G, Ullah W, Ullah S, Fiifi Tawia Hagan D, Kwesi Nooni I, Lou D, Ullah I. Trend in Extreme Precipitation Indices Based on Long Term In Situ Precipitation Records over Pakistan. Water. 2020; 12(3):797. https://doi.org/10.3390/w12030797
Chicago/Turabian StyleBhatti, Asher Samuel, Guojie Wang, Waheed Ullah, Safi Ullah, Daniel Fiifi Tawia Hagan, Isaac Kwesi Nooni, Dan Lou, and Irfan Ullah. 2020. "Trend in Extreme Precipitation Indices Based on Long Term In Situ Precipitation Records over Pakistan" Water 12, no. 3: 797. https://doi.org/10.3390/w12030797