Detailed Quantification of the Reduction Effect of Roof Runoff by Low Impact Development Practices


1
State Key Laboratory of Water Environment, School of Environment, Beijing Normal University, Beijing 100875, China
2
College of Energy and Environmental Engineering, Hebei University of Engineering, Handan 056038, China
3
Key Laboratory for Water and Sediment Sciences of Ministry of Education, Beijing 100875, China
4
Beijing Engineering Research Center for Watershed Environmental Restoration and Integrated Ecological Regulation, Beijing 100875, China
*
Author to whom correspondence should be addressed.
Water 2020, 12(3), 795; https://doi.org/10.3390/w12030795
Submission received: 6 February 2020
/
Revised: 5 March 2020
/
Accepted: 6 March 2020
/
Published: 12 March 2020
(This article belongs to the Section Urban Water Management)
Abstract
:Low impact development (LID) has been widely applied to mitigate urban rainwater problems since the 1990s. However, the effect of LID practices has seldom been evaluated in detail. In this study, the effect of individual and combined LID practices on the reduction of roof runoff are specifically quantified considering the hydrological relationship between LID at the building scale and the campus scale at Beijing Normal University (BNU). The results show that individual and combined LID practices effectively reduce roof runoff for all types of rainfall and for rainfall with return periods from 0.5 to 50 years at the building scale. Combination scenarios maintain good performance with fewer areas of composed LID. Most values for the effect of combination scenarios are between the effects of composed LID. To achieve the highest cost efficiency, low elevation greenbelts should be the first choice, and green roofs should only be selected when low elevation greenbelts and rain barrels cannot be implemented. At the campus scale, individual and combined LID practices effectively reduce the outflow from and the overflow in the campus and combination scenarios have the best reduction performance. This study provides an important reference for urban water management and LID related decision making.
1. Introduction
In recent years, urban floods have become a frequent occurrence worldwide due to rapid urbanization and climate change [1,2,3]. Such floods have already presented great risks to human safety and economic losses to cities worldwide [4,5]. LID, as one urban storm water management approach, has been proposed and widely applied to mitigate this problem since the 1990s [6]. It was also adopted as an important strategy for managing urban runoff in the sponge city policy proposed by the Chinese government in 2013 [7]. LID practice is considered to be a distributed practice that manages storm water close to the source of runoff generation [8], while conventional development is referred to as a centralized practice or end-of-pipe practice.
Roof runoff is an important component of urban runoff because it comprises a large proportion of urban runoff and has many distinctive management characteristics. Redfern et al. [9] suggested that roofs generally convert more rainfall into runoff than roads. Many LID practices can exclusively be applied to control roof runoff, e.g., green roofs and rain barrels. Greenbelts or vegetated filter strips, which offer the advantage of simple design, construction, and maintenance, can also reduce roof runoff and be taken as a kind of LID practice [10]. Low elevation greenbelts with berms deeper than normal lawns were listed as an LID practice in the Technical Guide for Sponge City Construction of Low Impact Development [7]. Green roofs can retain a part of the roof runoff and allow it to transpire into the air. Rain barrels can store runoff and discharge after rainfall. Greenbelts reduce runoff mainly by relying on retention and infiltration. Low elevation greenbelts combine storage, retention and infiltration functions. A combination of LID practices can exert advantages, overcome the drawbacks of composed LID and perform better in coping with high volume rainfall, while the reduction ability of individual LID practices is restricted by local conditions [11,12]. Applying LID by considering local conditions is a good alternative method. Bai et al. [13] reported that infiltration-based practices have a higher runoff reduction rate than storage-based practices. Combining practices based on different mechanisms performed best in terms of peak flow and volume reduction. Shen et al. [14] suggested that source and transportation LID practices should be combined to achieve better control of runoff and nonpoint source pollutants.
The reduction effect of roof runoff by LID practices and their combination need to be evaluated in detail to test their effectiveness and support LID selection, planning and decision making. The hydrological effect of most individual LID practices at the building scale has been fully studied by many previous experimental and observational studies [6,8,15,16,17]. Many models have been used to simulate the effect of individual LID practices, and some of these models can perfectly reproduce the hydrological performance of actual LID [18,19,20]. However, the effect of a combination of LID has seldom been evaluated in detail considering the hydrological relationship between composed LID, especially on a larger scale.
The widely used urban hydrological model, the storm water management model (SWMM), incorporates the LID module. This module has been upgraded many times [21], and the newest version has been demonstrated to satisfactorily reflect the actual hydrological performance of LID such as green roofs [22,23], rain gardens [24] and bioretention [25]. However, in most previous studies, the parameters of the LID module in SWMM were solely set up based on the suggestions from the model handbook or experience, decreasing confidence in the results. To explore the LID effect on a larger scale, the SWMM LID module needs to first be calibrated to precisely reproduce the hydrological reaction of LID practices. Palla and Gnecco [26] proposed a framework to study the effect of LID practices on a larger scale. In this framework, the SWMM LID module and watershed model are validated separately to secure a reliable result for the effect of LID practices on a larger scale.
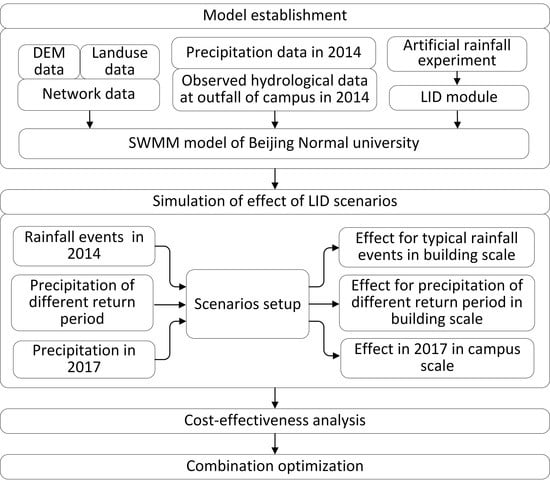
In this study, the effect of LID on roof runoff reduction and their combination was quantified in detail considering the hydrological relationship between LID at the building and campus scales. The SWMM LID and watershed hydrological module were validated separately. The parameters of the SWMM LID module were adjusted based on experimental observational data. The effect of LID and their combination under the precipitation conditions of different rainfall types and return periods was simulated and compared. The life cycle cost-effectiveness of individual and combined LID practices was calculated, and the optimal size and arrangement of LID combinations with the greatest cost efficiency at the building scale was proposed by applying an optimization algorithm. This study lays the foundation for LID planning at the building scale and can provide good support for LID related decision making. The flow chart of this study is shown in Figure 1. The objective of this study is to (1) quantify the effect of LID practices on roof runoff reduction and their combination at the building scale, (2) reveal the performance of individual LID practices and their combination at the campus scale, and (3) explore the best arrangement of LID methods to achieve the highest cost efficiency.
2. Materials and Methods
2.1. Study Area
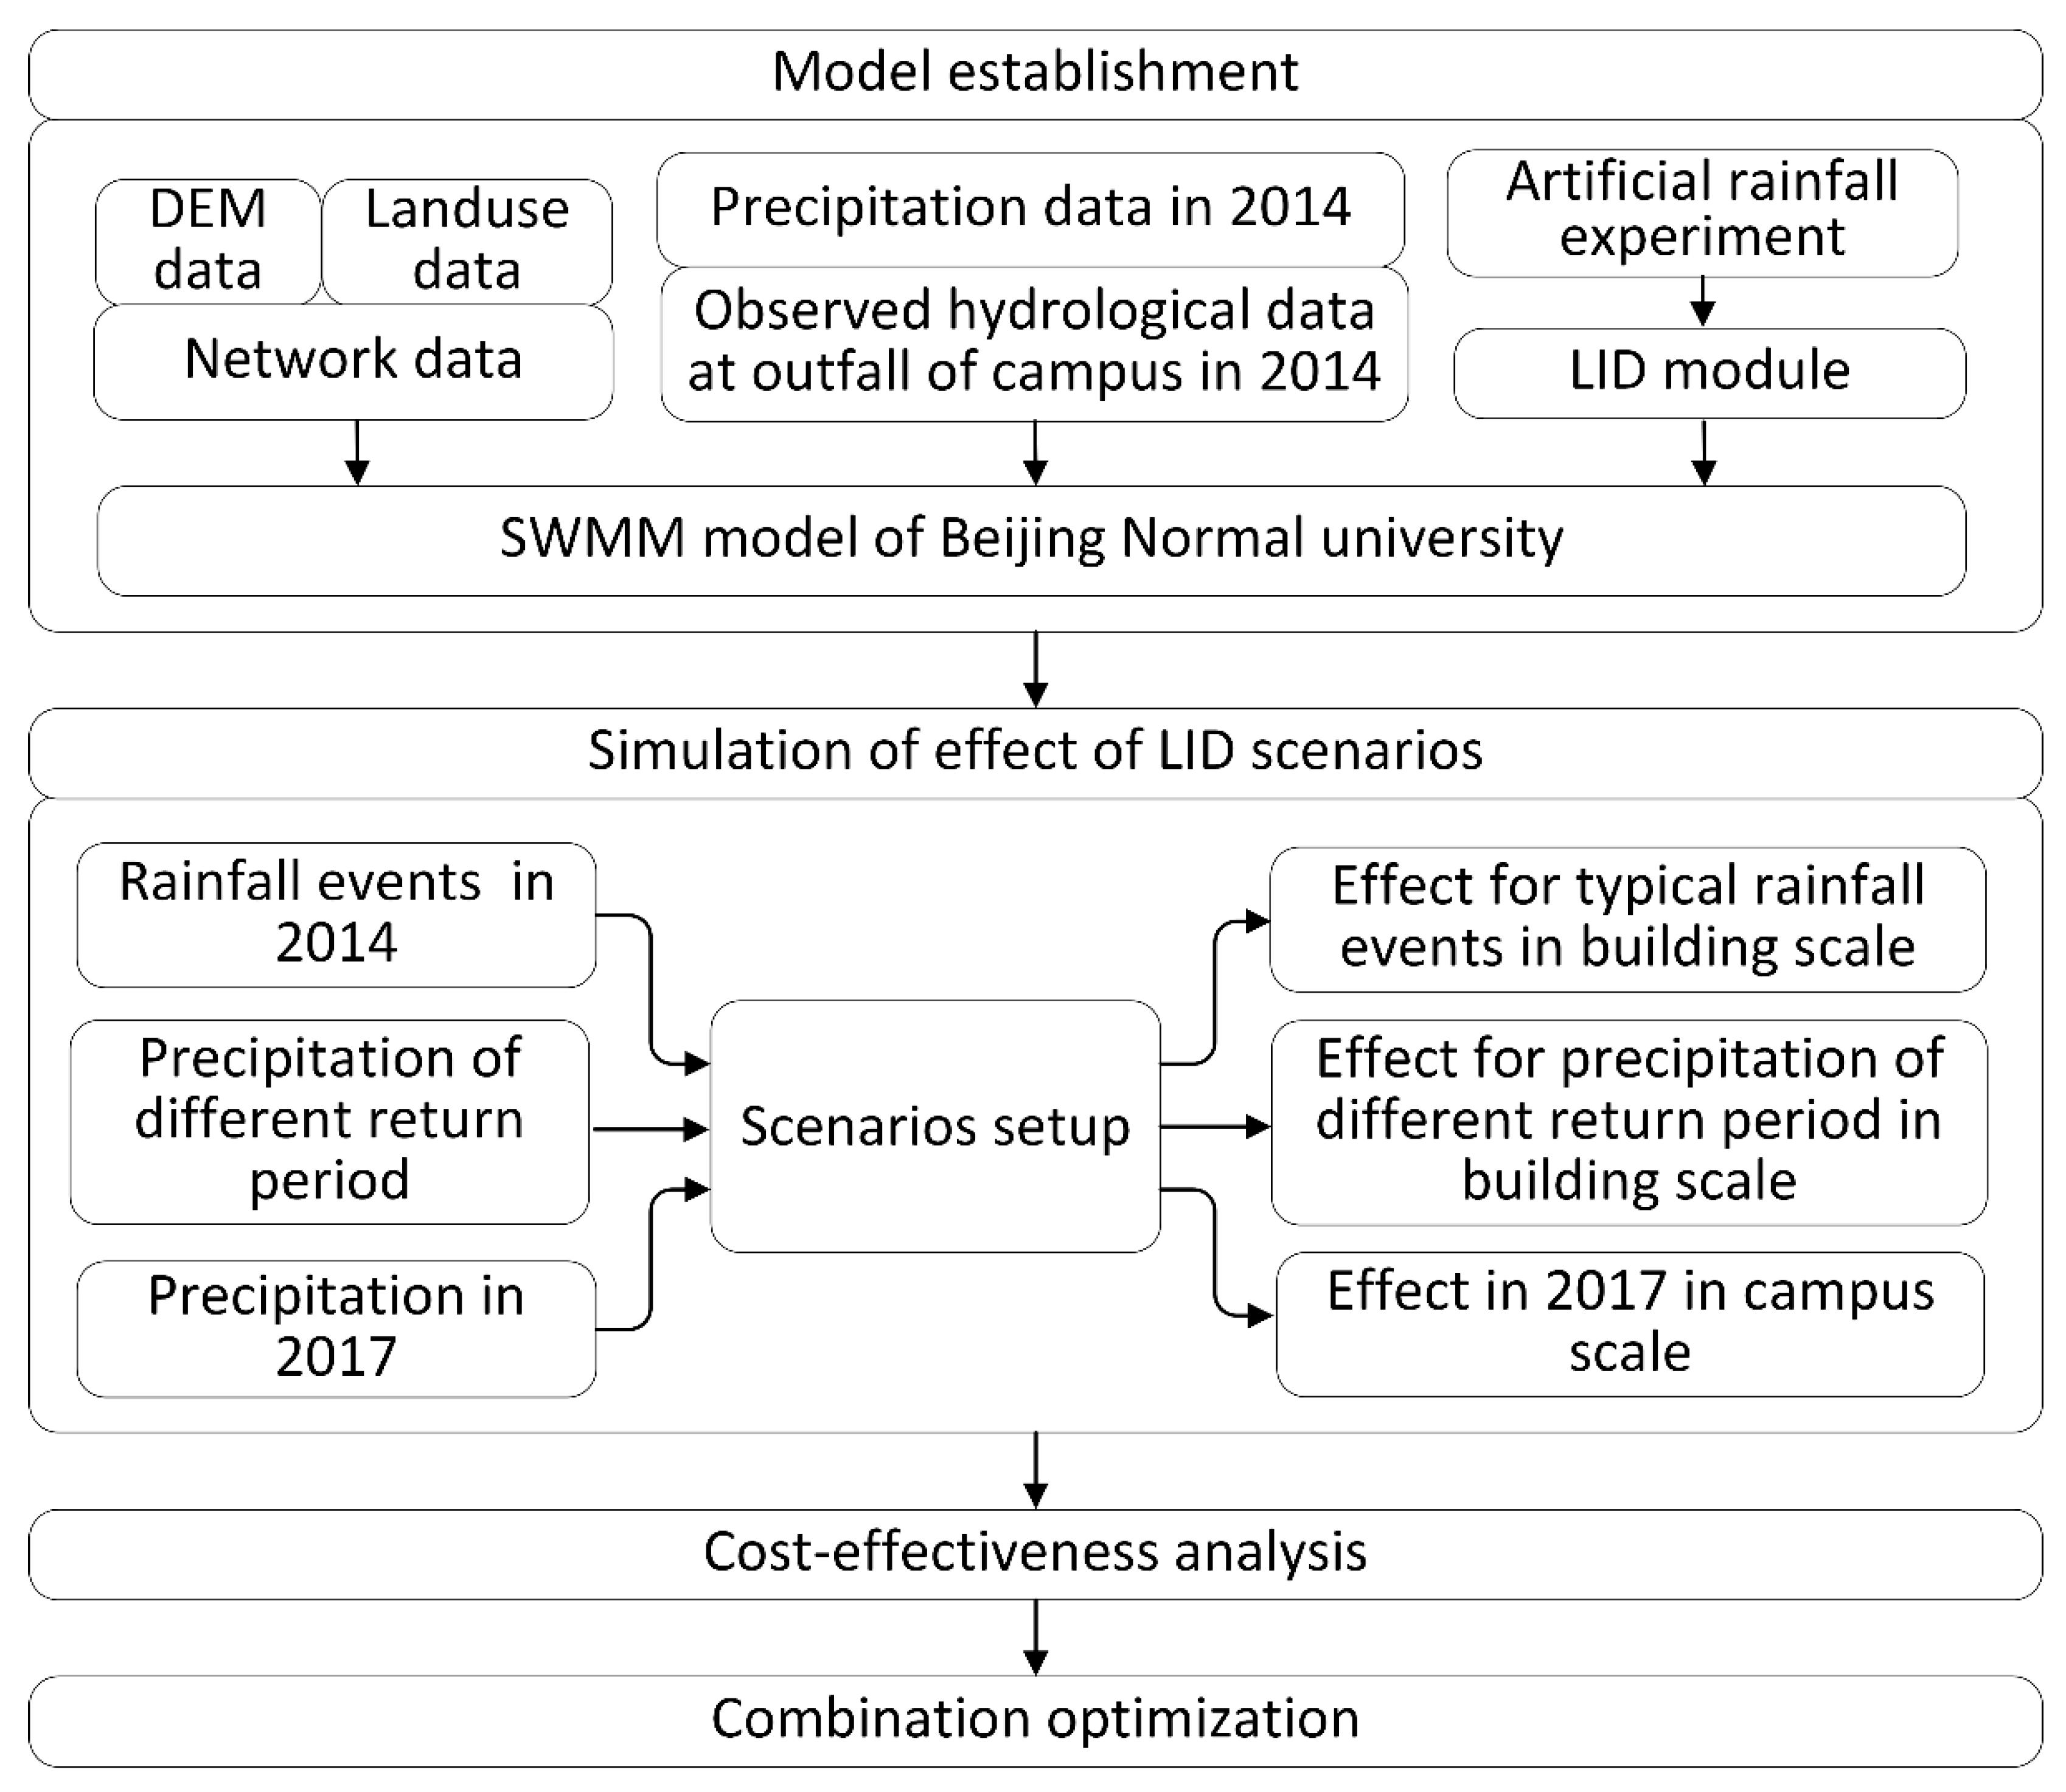
The campus of Beijing Normal University (BNU), located in the central area of Beijing in the Haidian district, was selected as the study area (Figure 2). It covers an area of 58 ha and is a typical urban basin campus with a long history. The campus includes functional areas devoted to commerce, housing, teaching and public service. The three main land use types are pavement, roofs and green fields, which account for 31.9%, 30.3%, and 25.2%, respectively, of the total area of the campus. The campus is flat overall, and its elevation ranges from 47.5 to 52.9 m. It has a separate sewerage system with pipe diameters ranging from 0.1 to 0.9 m. Rainfall runoff is discharged into the municipal drainage network and ultimately into the river. The campus can be divided into five sub-basins, and each sub-basin corresponds to an outfall to discharge rainfall runoff. Sewer overflow sometimes occurs during the flood season as a result of the insufficient discharge capacity of the campus sewer system. One building on the BNU campus, the 4th teaching building, was selected as the site for simulating the effectiveness of LID practices at the building scale. The building has a flat roof with an area of 520 m2 and 8 downspouts. A greenbelt is behind it with an area of 822 m2. Beijing, as the capital of China, is in the North Temperate Zone and has a semi-humid and semiarid continental monsoon climate. Its mean annual temperature is 14 ℃, and its mean annual precipitation is 570 mm. Most rainfall occurs during the end of July and the beginning of August.
2.2. SWMM Description
SWMM was developed by the USEPA in 1971. It is a model used to predict and route the quantity and quality constituents of urban storm water runoff. It has been widely applied in hundreds of studies to simulate hydrology, the water quality of urban storm runoff and the effect of mitigation practices in urban watersheds [27,28,29,30,31,32].
LID practices are represented in the SWMM LID module through a combination of vertical layers, such as the surface, soil and storage layer, and moisture balance is performed within each layer. LID overflow, underdrain and infiltration are simulated separately. The effect of eight kinds of LID, including bioretention cells, rain gardens, green roofs, permeable pavement, infiltration trenches, rain barrels, roof disconnections, and vegetative swales, can be simulated through a different method of layer combination. Their properties are defined on a per-unit-area basis. Therefore, one LID can be applied in subcatchments of different areas by assigning the corresponding coverage areas. Combinations of LID practices can be simulated by setting the outlet of one LID to be another LID. The detailed equation for the LID module can be found in a previous paper [33].
In this study, a commercial-release SWMM version, PCSWMM 2014, was used. This model was developed by Computational Hydraulics International, which combined the latest SWMM engine (SWMM 5.1.012 for this study), has easy-to-use pre- and postprocessors and user-friendly interfaces.
2.3. Source of Data and Model Setup
Detailed pipe network, land use and digital elevation data of the BNU campus were obtained from BNU’s administration. A weather station (HOBO, Onset Computer Corporation, Bourne, MA, USA) was set on the roof of the building of the environmental college in BNU to collect meteorological data, including rainfall depth, temperature and relative humidity, at 5-minute intervals. An automatic logging flowmeter (FL900, HACH, US) was installed in the manhole of outfall-3 to record flow data at 5-minute intervals. Eight rainfall events ranging from light to storm rain with different rainfall patterns and durations were recorded in 2014. Hydrological features of these eight rainfall events are shown in Table 1. Continuous precipitation data from 2017 were also recorded. An interval of 6 hours was set to define separate rainfall events to ensure the independence of each event [34,35,36].
To reliably simulate the response of green roofs and greenbelts to different rainfall events, experimental blocks were established of extensive green roofs and greenbelts with sizes of 0.5 × 0.5 × 0.225 m and 0.5 × 0.5 × 0.3 m, respectively. The experimental green roof was mainly composed of a plant layer, a growing medium (10 cm), a filter layer (geotextile of 3 mm) and a drainage layer (3 cm) with a slope of 2%. Sedum lineare Thunb. was selected as the plant for the plant layer, and mixed soil composed of pearlite, turfy earth, pine needle mulch and local garden soil was used as the growing substrate in the green roof block according to standard [37]. Sedum spectabile and soil derived from farms in Beijing were used in the greenbelt blocks. Indoor artificial rainfall experiments were conducted using artificial rainfall equipment in BNU’s Fangshan experimental base to observe the hydrological response data of green roofs. The rainfall intensity was set at 4 levels of 29 mm/h, 60 mm/h, 92 mm/h and 126 mm/h. The underdrain and overflow were automatically recorded by a HOBO tipping bucket rain gauge at an interval of 5 minutes. The SWMM modules for green roofs and rain gardens were used to simulate the performance of green roofs and greenbelts. The parameters were set based on previous research [38,39,40] and adjusted according to the observed data. The parameters of the rain barrel were set based on the real rain barrel used on the campus, with a basal area of 3 m2 and a height of 2 m for each barrel. The discharge of the rain barrel was set to 6 hours after rainfall, with a discharge rate of 2 m/h. The parameters of the green roof and greenbelt in which the soil parameters must be set are shown in Table 2. The parameters of the low elevation greenbelt were set to be identical to those of the greenbelt except that the berm height was set to 150 mm. The combination of LID practices was simulated by setting the outlet of one LID to be another LID. This method of simulating the combination of LID practices can reproduce the performance of LID combinations as long as the parameters of each LID are appropriately set.
The catchment model was established in our previous study [41] and the network of the catchment can be found in Figure S1 in supplemental material. Dynamic wave routing was used as the routing method, and the catchment and sewer layer were developed based on obtained land use and sewer network data. A total of 749 subcatchments were delineated with roofs, greenbelts, roads, sports fields, asphalt pavement, and concrete pavement types. The eight observed rainfall events and corresponding hydrological data at outfall-3 in 2014 were used to calibrate and validate the BNU SWMM model (four events for calibration and four for validation). The detailed process of model establishment and parameter setting in PCSWMM can be found in our previous study [41].
The Nash-Sutcliffe efficiency coefficient (NSE), deterministic coefficient (R2) and percentage of bias (PBIAS) were calculated to evaluate the model result. The equations of R2 and PBIAS are as follows:
where Oi is the ith observation value, and Si is the ith simulated value. N is the number of observed values. is the mean value of the observed data. is the mean value of the simulation data.
2.4. Scenario Setting
The typical LID practices most frequently used for roof runoff reduction, i.e., green roofs, greenbelts, low elevation greenbelts and rain barrels, were applied in this study. At the building scale, thirteen scenarios were developed: seven for individual LID practices, five for combined LID practices and one for the base scenario. The scenario of normal roof (NR) represents the 4th teaching building without any LID, which was set as the base scenario to calculate the reduction indicator of other scenarios. The scenarios of green roof (GR) was set that green roof covered all roof area of 4th teaching building. The scenario of greenbelt (GB) was set such that roof runoff was directed into the greenbelt behind the building. Greenbelts need to occupy a large area of extra land, but their cost will rise sharply if their area ratio exceeds the percentage of green coverage required by the Chinese government, which is 30% of the total area for new urban residential areas in Beijing based on the greening regulations of Beijing municipality released in 2009. On the BNU campus, the percent of roof area is similar to that of green land. Therefore, the maximum area of the greenbelt was set to be the same as the area of the building roof. The rain barrel scenario (RB) means that roof runoff was directed into the rain barrels. As there are eight downspouts for the building, two RBs were established: the four rain barrels scenario (RB-4), directing roof runoff into four rain barrels, and the eight rain barrels scenario (RB-8), directing roof runoff into eight rain barrels. Three low elevation greenbelt scenarios (LG) were set, i.e., the scenario setting the area of low elevation greenbelt to 25% of the area of 4th teaching building (LG-25%), the scenario setting the area of low elevation greenbelt to 50% of the building roof (LG-50%), and the scenario setting the area of low elevation greenbelt to the same as building roof (LG-100%) to detailed simulate the performance of low elevation greenbelt.
Combination scenarios were set with less area for composed LID based on the commonly used method of setting combined LID scenarios [11]. The specific area of each LID application in the combination scenarios was adjusted according to its reduction performance. The scenario of combined green roof and rain barrel (GR&RB) means that the outflow of 260 m2 green roof and 260 m2 normal roof was directed into two rain barrels. The scenario of combined green roof and low elevation greenbelt (GR&LG) represents that the outflow of 260 m2 green roof and 260 m2 normal roof was directed into low elevation greenbelt of 130 m2. The scenario of combined rain barrel and low elevation greenbelt (RB&LG) represents that roof runoff was directed into two rain barrels and then into low elevation greenbelt of 130 m2. The scenario of combined green roof, rain barrel, and low elevation greenbelt (GR&RB&LG) represents that outflow of 520 m2 green roof was directed into two rain barrels and then into low elevation greenbelt of 130 m2. The scenario of combined 100% of green roof, eight rain barrels and 100% of low elevation greenbelt (GR100%&RB&LG100%) means that outflow of 520 m2 green roof was directed into eight rain barrels and then low elevation greenbelt of 520 m2. The areas covered by LID scenarios are shown in Table 3.
To explore the effect of roof related LID at the campus scale, eight scenarios, five for individual LID practices, two for combined LID practices and one base scenario, were set up for the BNU roofs. NR at campus scale, which was taken as the base scenario, represents that the outflow of roofs in BNU was directed directly into the nearby sewer inlets. GR means that all flat roofs in BNU were covered with green roofs. GB means that roof runoff was directed into adjoining greenbelts. RB-4 and RB-8 mean that roof runoff was directed into four rain barrels and eight rain barrels, respectively, for each roof. Greenbelts in BNU were retrofitted to low elevation greenbelts to receive runoff from the adjoining roofs to enact LG. The scenario of combined green roof, rain barrel, and greenbelt (GR&RB&GB) represents that the outflow of green roof was directed into four rain barrels and then into the adjoining greenbelt for each roof. GR&RB&LG at campus scale means that the outflow of green roof was directed into four rain barrels and then into the adjoining low elevation greenbelt for each roof. The areas covered by LID scenarios on the campus can also be seen in Table 3 and Supplementary Figure S1.
2.5. Assessment and Optimization Methods
2.5.1. Effect Indicators
The effect of LID on runoff reduction is generally reflected by three types of indicators, i.e., volume reduction, peak reduction and peak delay [42,43,44]. The volume reduction rate, the ratio of the volume of LID outflow to the volume of rainfall (or the volume of outflow of the control area), is frequently used to represent the effect of volume reduction. This indicator can directly reflect how much percent of runoff is reduced by LID. However, it has poor performance in reflecting the reduction ability of LID itself, as its value is greatly influenced by rainfall volume. In this study, the volume reduction rate and volume reduction amount were simultaneously used to fully reflect the runoff reduction effect and reduction ability of LID. The peak reduction rate and delayed peak time were also calculated to represent the performance of LID practices in terms of peak reduction and peak delay. These indicators were calculated through a comparison of the hydrological results of the LID scenarios and the base scenario. To better quantify the performance of rain barrels at the building scale, effect indicators for rain barrels were calculated in the time ranges of rainfall events, neglecting the outflow and peak of rain barrel discharge after rainfall. However, in the continuous simulation at the campus scale in 2017 and the optimization process, the inner-event effect of rain barrels has not been calculated specifically to reflect the total effect of rain barrels. At the campus scale, the overflow volume reduction rate and overflow time reduction rate between the LID scenarios and the base scenario were also calculated to reflect the effect of overflow prevention by LID on the BNU campus. The volume capture ratio of rainfall, which is the ratio of the outflow volume of LID scenarios to the rainfall volume, was calculated for comparison with the rainfall control requirement of the Chinese government.
2.5.2. Design Storm of Different Return Periods
Synthetic hyetographs of five return periods (0.5, 1, 5, 10 and 50 years) in 120 min were generated using the Chicago hydrograph model [45] based on the storm intensity formula for Beijing shown as Equations (3) and (4) [46,47]
where i refers to the storm intensity (mm/min), t is rainfall duration (min), P is the return period of the design storm (year), and r in the Chicago model was set to 0.42.
2.5.3. Cost-Effectiveness Analysis
In this study, a cost-effectiveness analysis was conducted for the whole service life by calculating the life cycle cost. The volume reduction in the LID scenarios compared to the NR scenario at the building scale in 2017 was calculated and used to represent the benefits of LID. The present value of the annual cost (AC) of each scenario was calculated as the life cycle cost of scenarios based on the present value of the unit annual average cost (UAAC) of each individual LID. Cost-effectiveness was calculated based on the following equations:
where CEi is the cost-effectiveness of the ith scenario, Bi is the benefit of the ith scenario, ICi is the unit initial cost of the ith LID practice in the period of construction, O&MCt is the AC for operation and maintenance in year t, SVn is the salvage value in the last year of the service life, fr,t is the present value factor of the discount rate r in year t, and fr,n is the present value factor of the discount rate r in the last year n of service life. The US dollar was taken as the unit of cost in this study. The detailed computing formula of fr,t, and SVn can be found in a previous paper [48].
2.5.4. Optimization Algorithm
A nondominated sorting genetic algorithm Ⅱ (NSGA-Ⅱ) was used for LID optimization in this study. NSGA-Ⅱ is a widely used multi-objective optimization algorithm proposed by Deb et al. [49] that uses a rapid nondominated sorting procedure to rank and sort individuals. The elitist strategy is used to secure good individuals into the next generation. The algorithm has the advantage of faster convergence speed and a good quality solution set and has been widely applied in the practice optimization research [50,51,52]. A detailed description of the principle and main loop of this algorithm can be found in a previous article [49].
3. Results and Discussion
3.1. Results of Model Performance
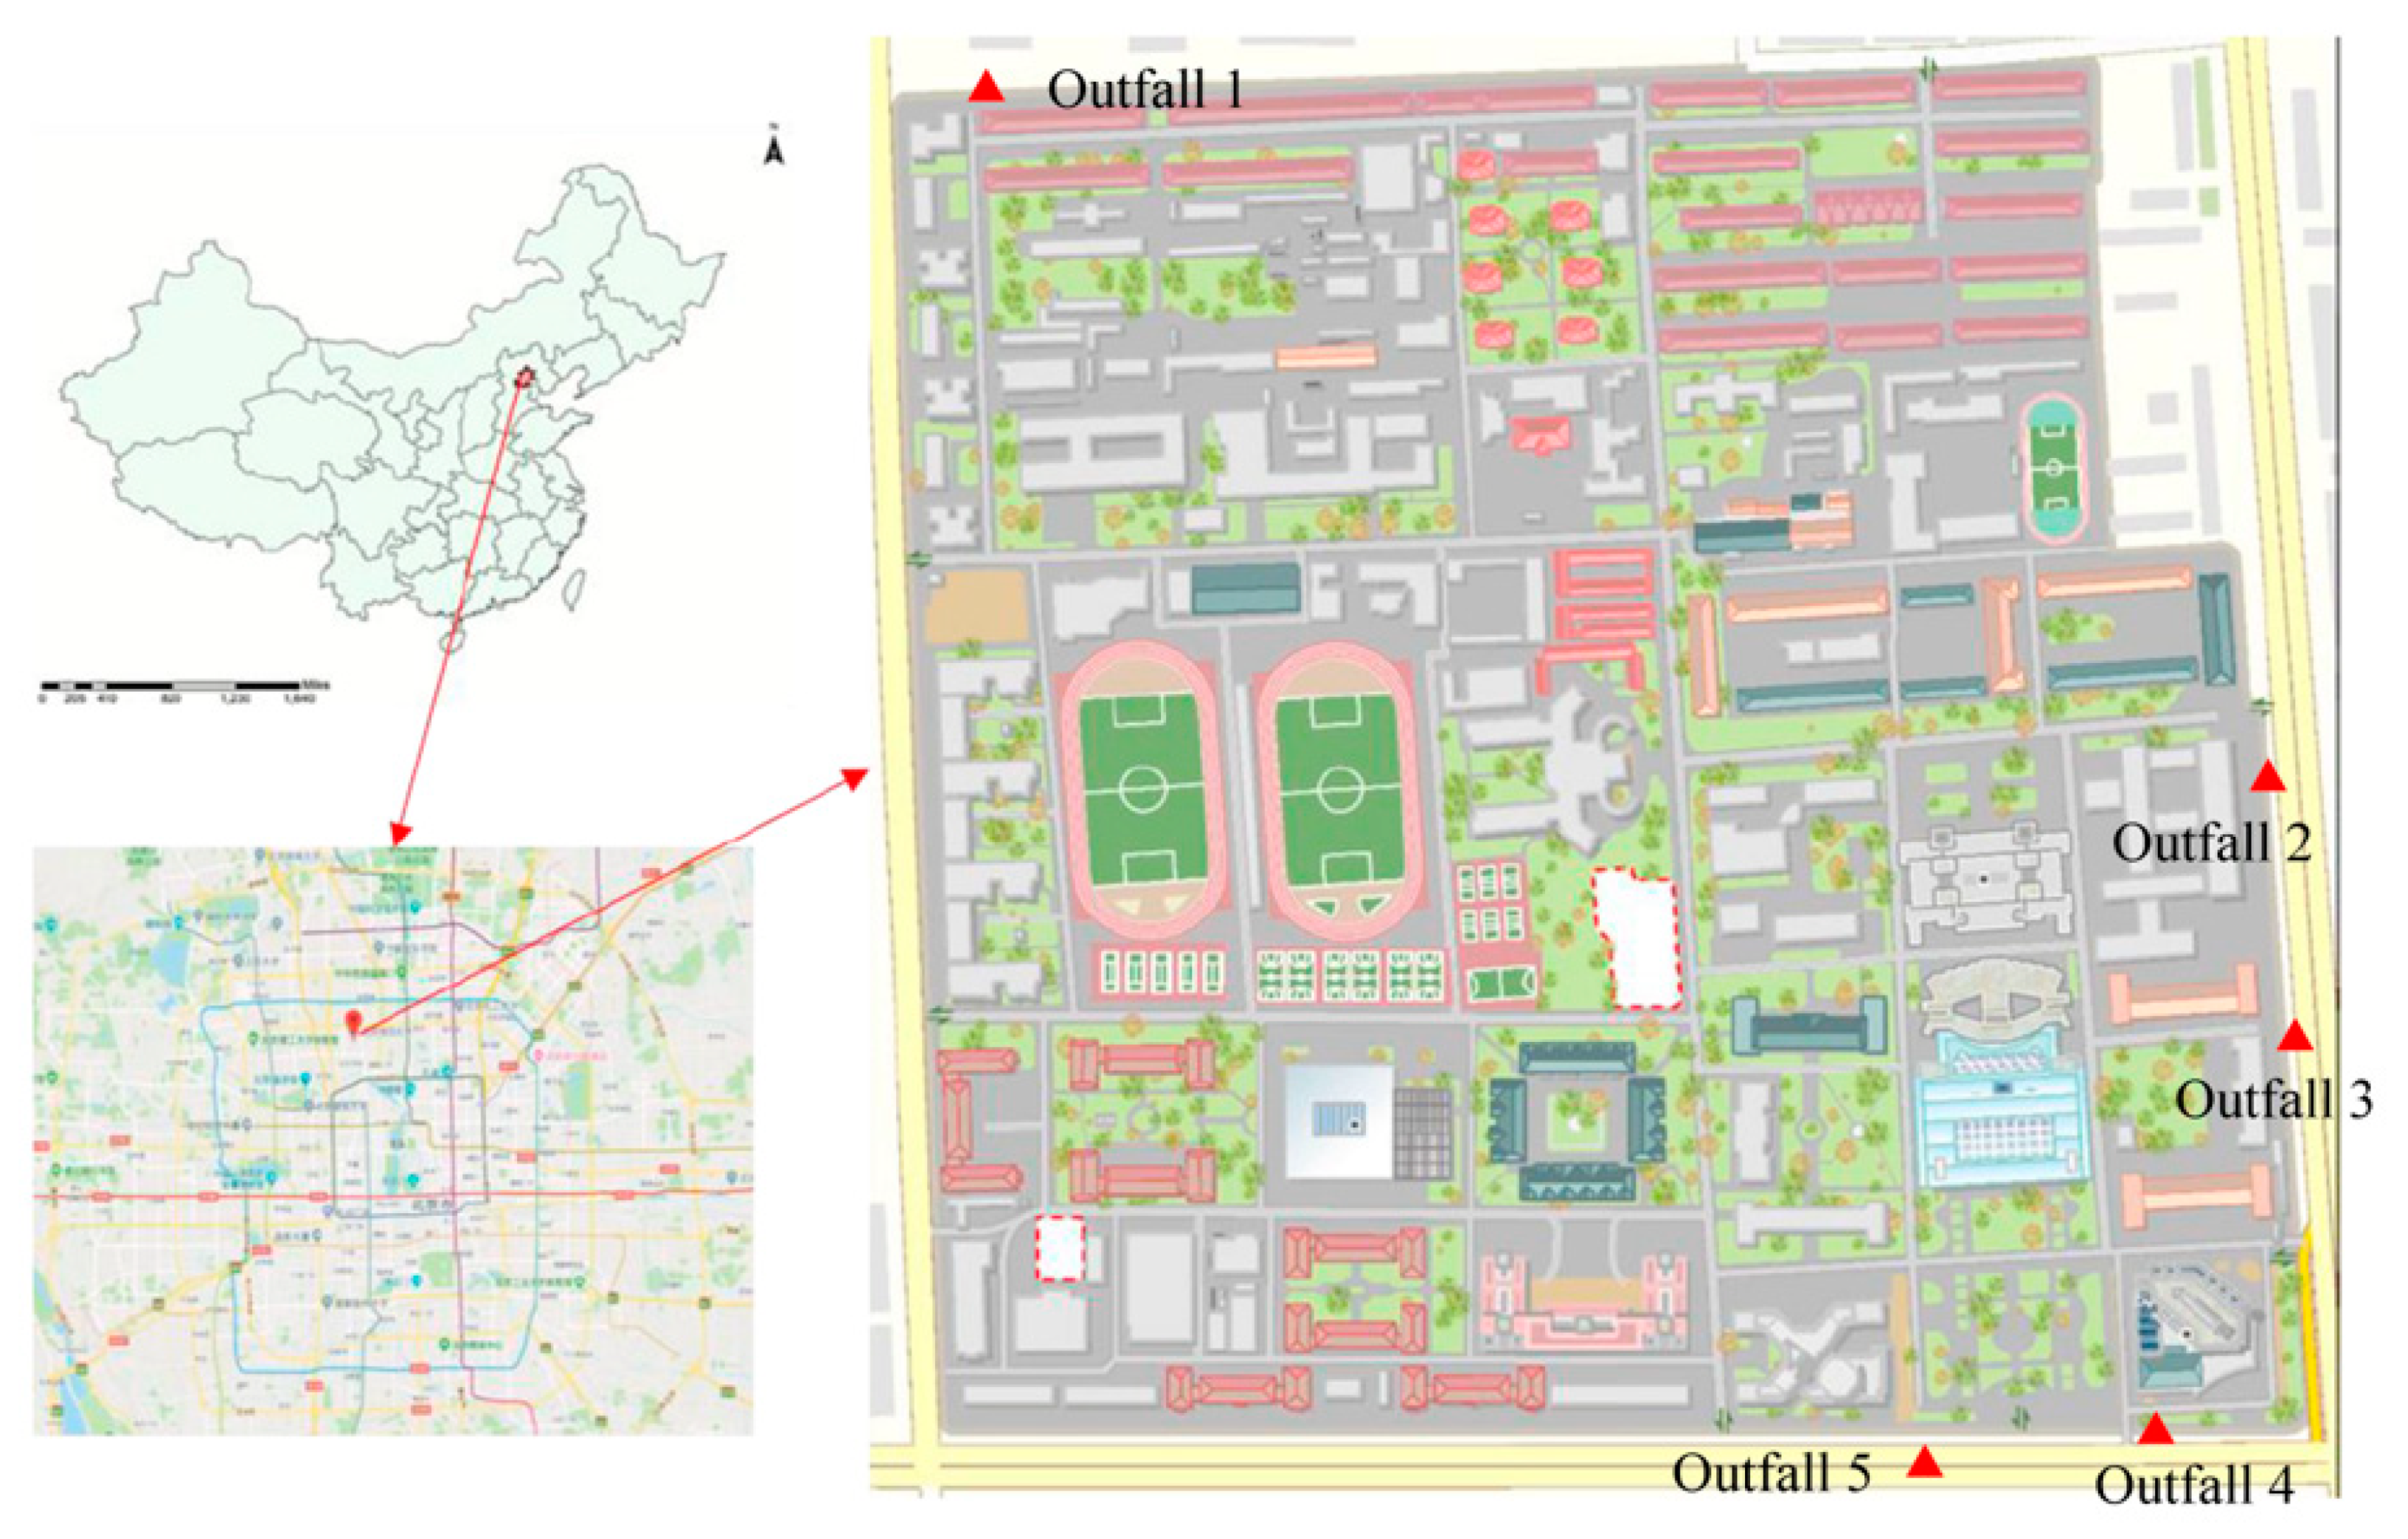
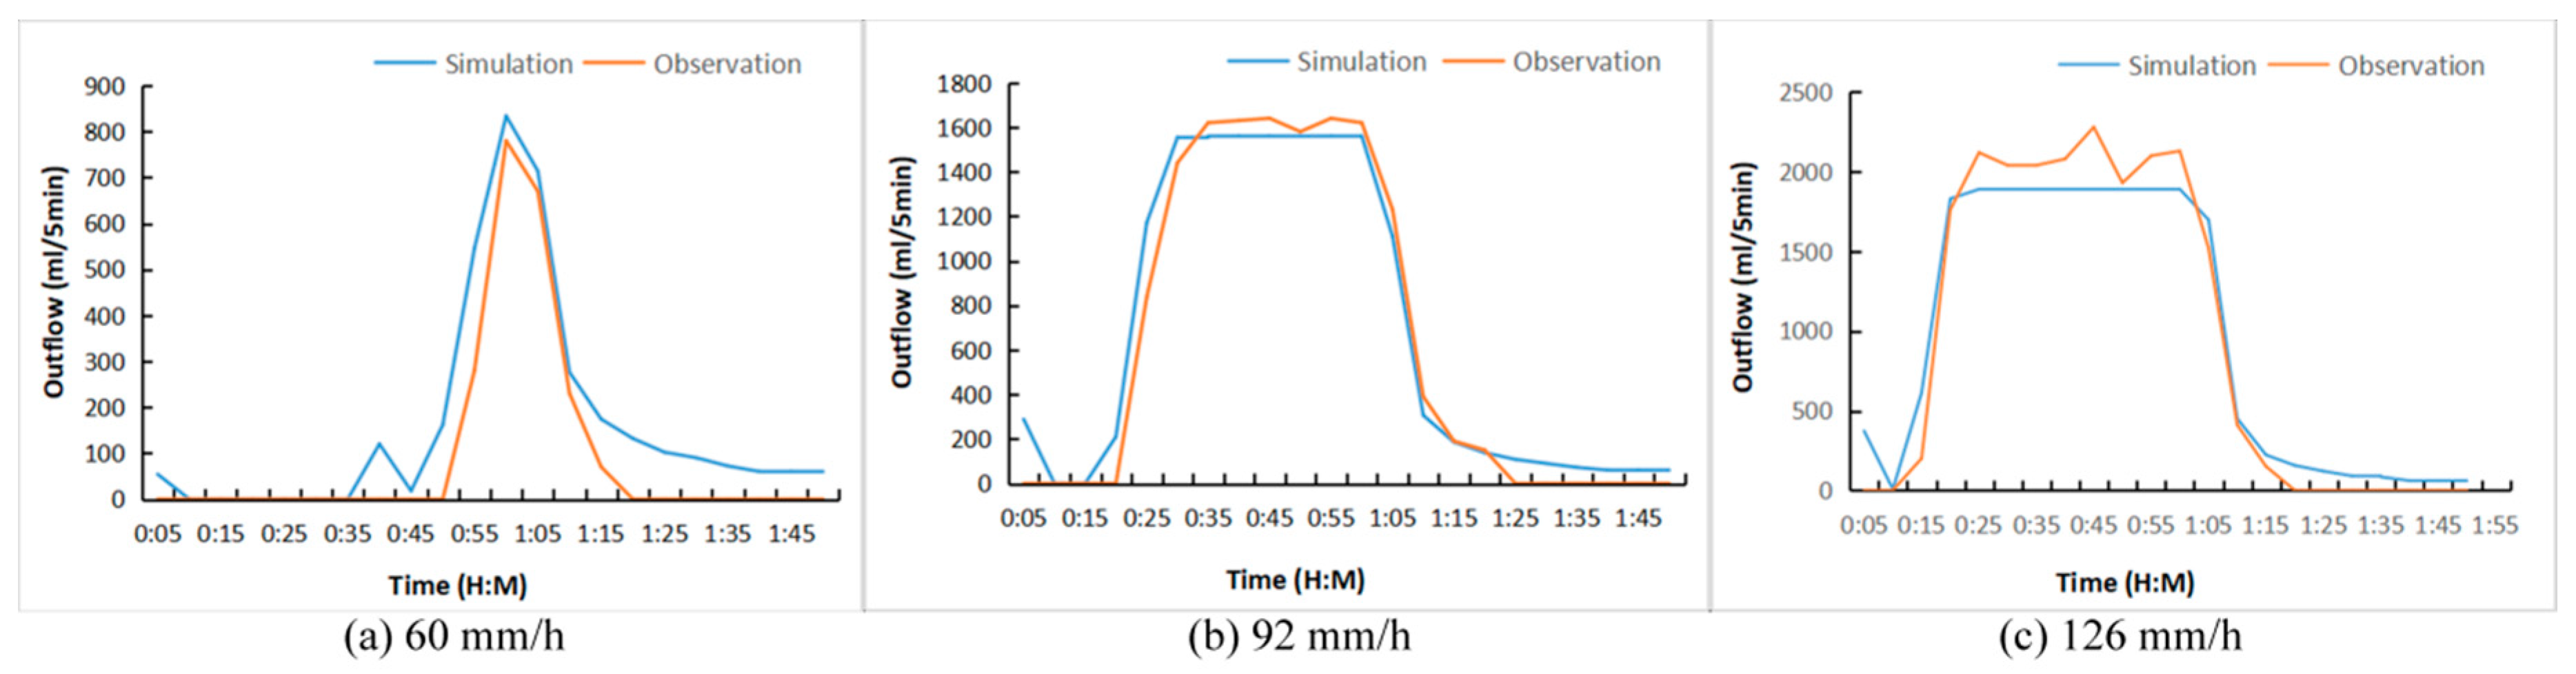
The simulation result of the SWMM green roof module is shown in Figure 3.
While the intensity of artificial rainfall was 29 mm/h, the simulated and observed outflows were all zeros. Figure 3 shows that the simulated hydrological response fits well with the observed values. NSE is 0.816, 0.971, and 0.962, and R2 is 0.923, 0.975, and 0.977, respectively, while rainfall intensity is 60 mm/h, 92 mm/h and 126 mm/h. These results indicate that the performance of the SWMM green roof module is acceptable at a time scale of 5 minutes and at the building scale as long as the parameters of the green roof module are appropriately set.
The information of selected rainfall events, observed outflow at outfall-3, and the results of calibration and validation for the hydrological module of SWMM in BNU are shown in Table 4.
Table 4 shows that NSE ranged from 0.842 to 0.905, PBIAS ranged from −15.96% to 2.26% for rainfall events in 2014 during the calibration process. NSE ranged from 0.793 to 0.907, PBIAS ranged from −17.97% to −1.95% during the validation process. These results show that the simulation results fit well with the observed values and can be used to simulate the outflow in BNU. The model performed worst during the rainfall event of 08-31-2014. This may be because the event was of short duration and continuously heavy, therefore having a larger difference from the events used for calibration.
3.2. Reduction Effect of Individual and Combined LID Practices for Typical Rainfall Events in 2014
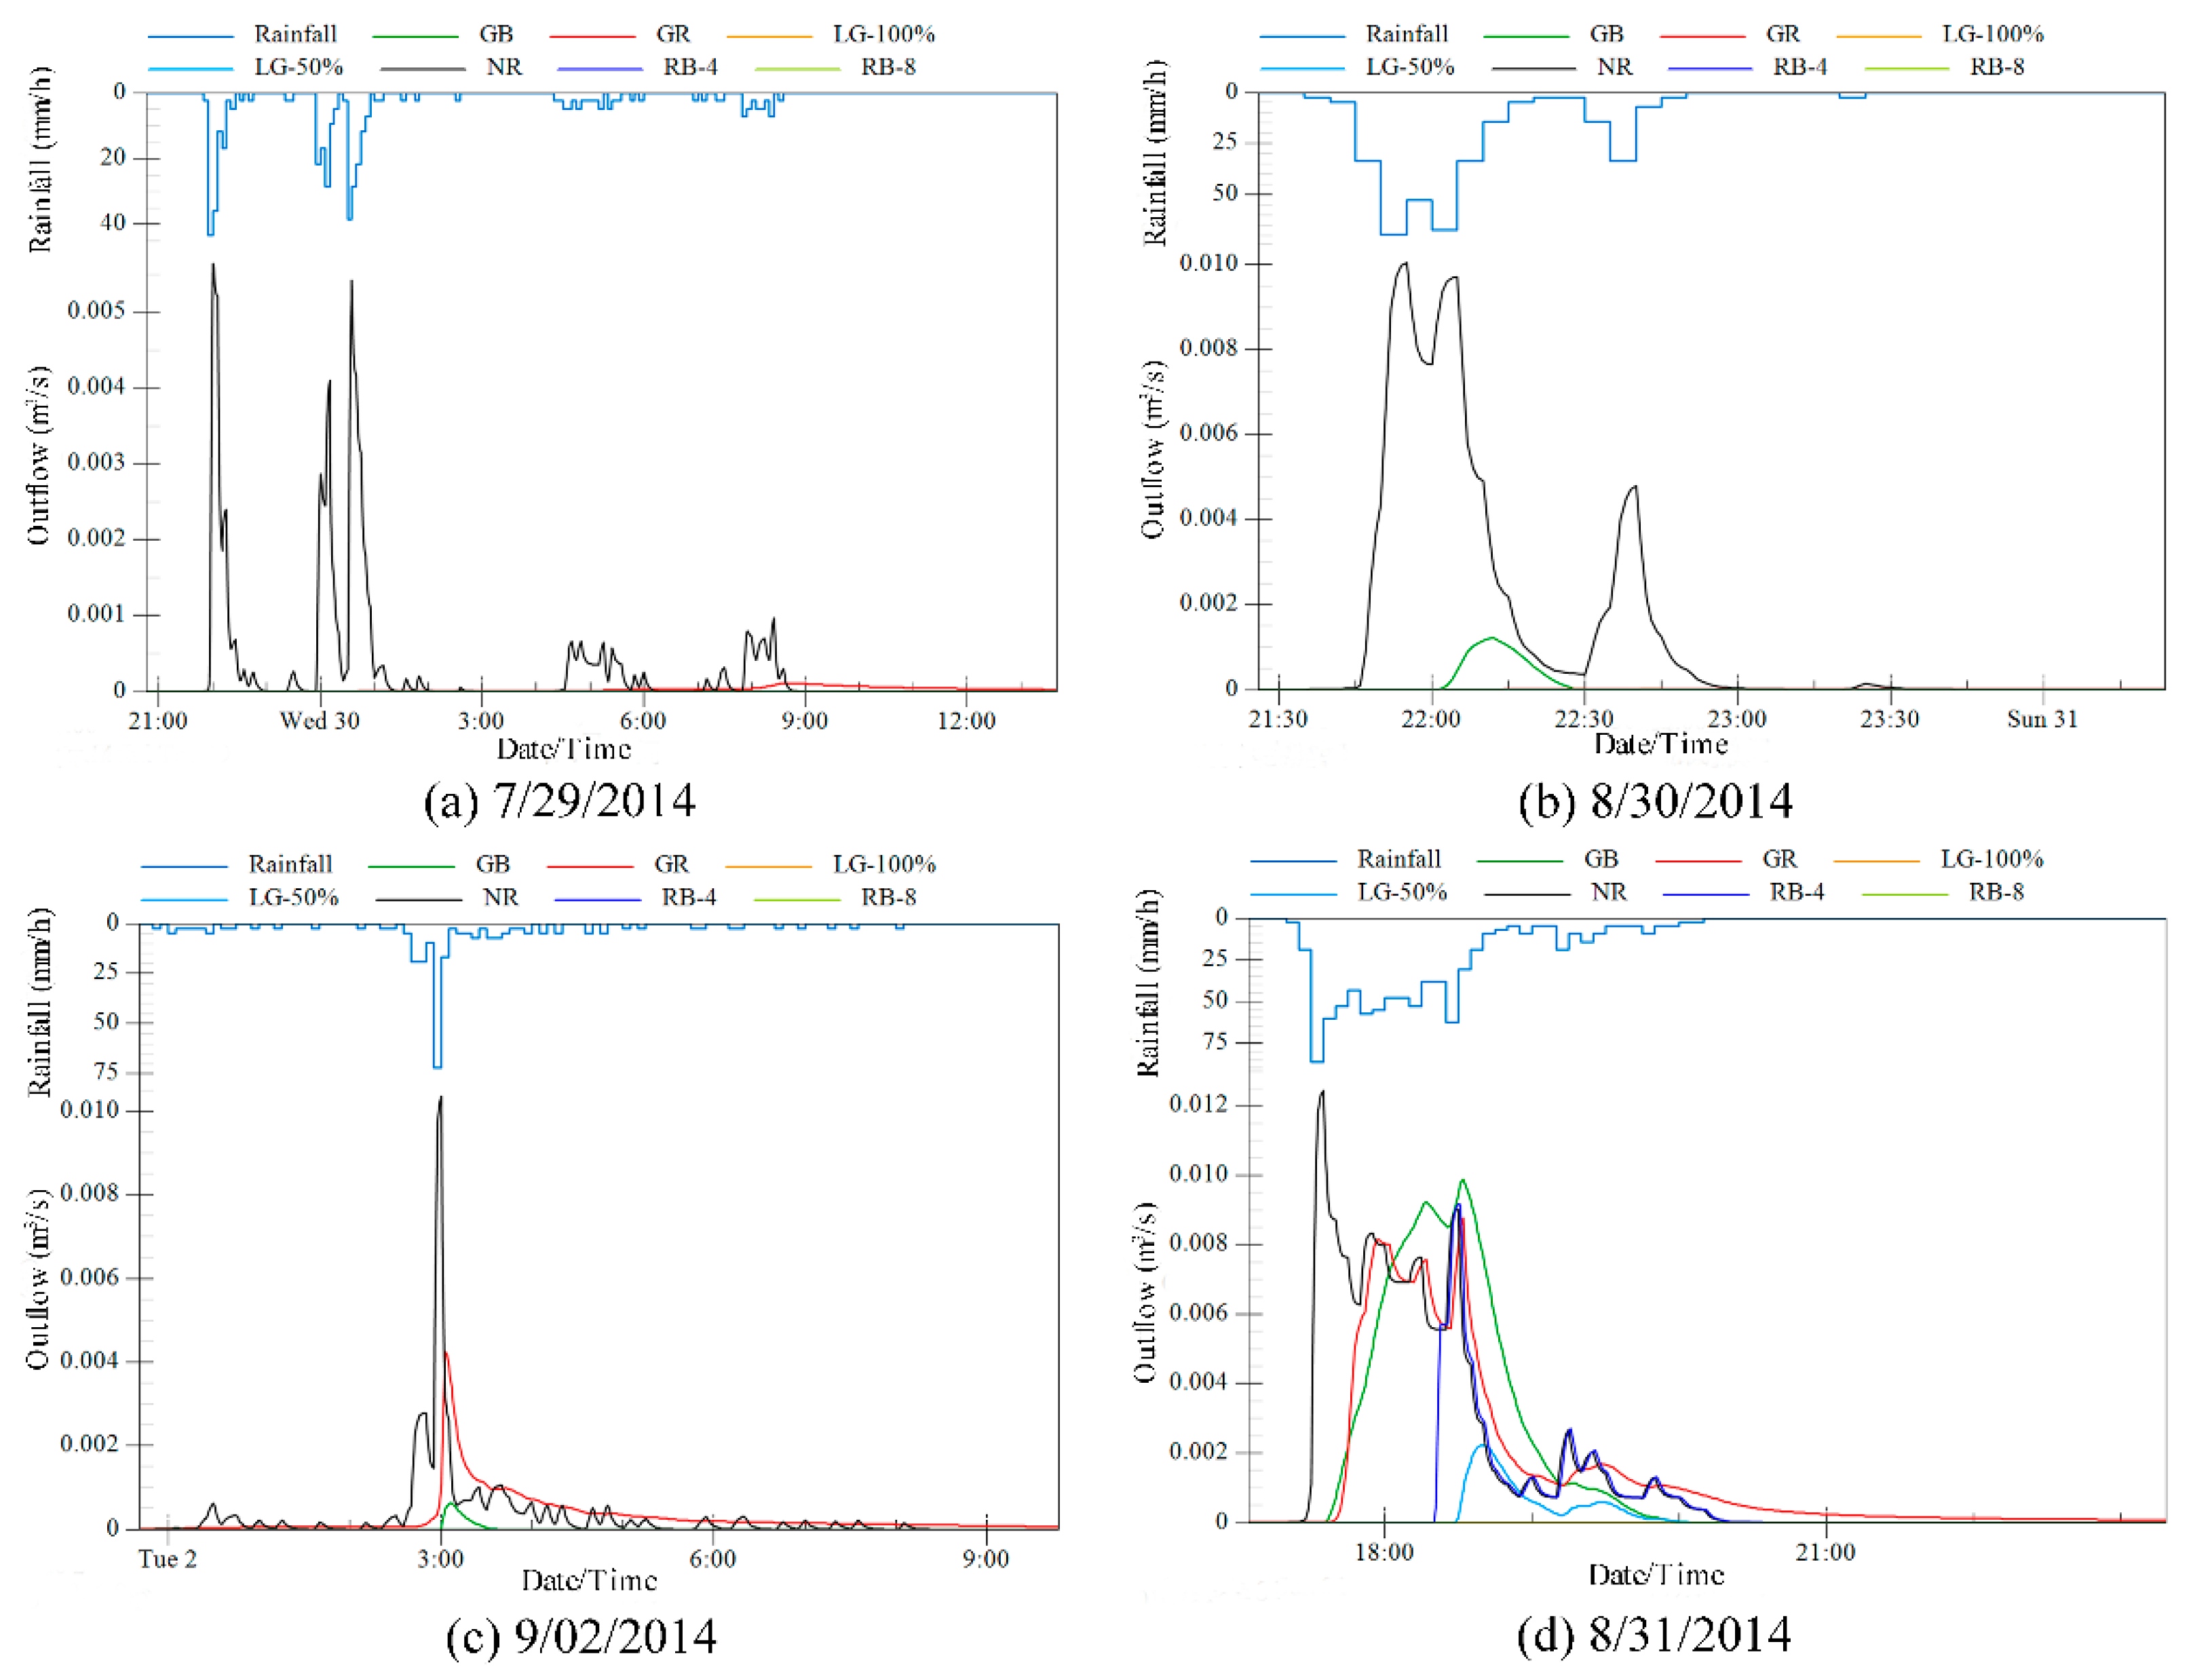
The performance of individual LID practices in three large events, 07-29-2014, 08-30-2014, 09-02-2014, and one storm event, 08-31-2014, in 2014 are shown in Figure 4. For the other four rainfall events, including two small rainfall events and two medium rainfall events, no outflow occurred.
Figure 4 shows that in the event of 07-29-2014, only the GR had outflow. In the event of 08-30-2014, which was characterized by a higher peak and shorter duration, only the GB had outflow. Except for runoff from roofs, greenbelts need to reduce their own runoff. Therefore, for rainfalls of high intensity and short duration, their reduction ability becomes less than that of green roofs. GR and GB still had apparent peak reduction and delay effects for these two events. In another large rainfall event of 09-02-2014, GR and GB both had outflows. These results indicate that the reduction ability of green roofs and greenbelts is worst in applied LID. In the storm event of 08-31-2014, all scenarios had outflow except RB-8 and LG-100%. The reduction effect of GR and GB was not as obvious in this event. It is important for LID to have the ability to effectively reduce runoff of the largest rainfall events during a year, as these events are the main causes of urban floods. RB-4 can effectively remove the front part of heavy rainfall runoff and has little influence on the back part. LG-50% had an apparent reduction effect on the runoff of heavy rainfall.
The reduction effect of individual LID practices is summarized in Table 5.
Table 5 shows that in the event of 08-31-2014, the LID scenarios ranked in the order of volume reduction amount are RB-8 (LG-100%) > LG-50% > RB-4 > GR > GB. Low elevation greenbelts combine the functions of storage, infiltration and soil retention and have the largest volume reduction ability. Green roofs mainly rely on soil retention, and greenbelts mainly rely on soil retention and infiltration to reduce runoff volume. The limited amount of soil in green roofs and restricted infiltration rate for greenbelts constrain the volume reduction abilities of these two practices. Green roof and greenbelt have better peak reduction abilities than rain barrels, as their peak reduction rates were similar to those of rain barrels, while their volume reduction amounts were much lower than those of rain barrels in the event of 08-31-2014. In the events of 08-31-2014 and 09-02-2014, the reduction ability of GR decreased sharply, indicating that previous rainfall events have a large influence on the reduction ability of green roofs because their thin soil layer is easily saturated. Rain barrels have an advantage in that they are not affected by previous rainfall events as long as they are emptied in time. In the event of 08-31-2014, GR and GB had small volume reduction rates and peak reduction rates. However, they still had good performance in peak delay, which is due to the special rainfall pattern of 08-31-2014. This phenomenon demonstrates that the indicator of delayed peak time is easily affected by the rainfall characteristics. The indicator of the volume reduction rate of LID scenarios can only be compared in the same rainfall event, and the volume reduction amount can be compared between rainfall events.
From these results, it can be concluded that individual LID practices can effectively reduce roof runoff in all types of rainfall at the building scale. Green roofs are LID practices that do not need to occupy extra land, whereas greenbelt and low elevation greenbelt does require a large area of extra land. Rain barrels occupy less land than greenbelts. Sometimes land requirements are unsatisfactory, especially when these LID are applied in the center of the city, and the area of land required is too large. In addition, green roofs have other environmental benefits, such as energy consumption reduction, ecological improvement, increased green area and aesthetics [53]. The selection of applied LID should be based on objective and local conditions.
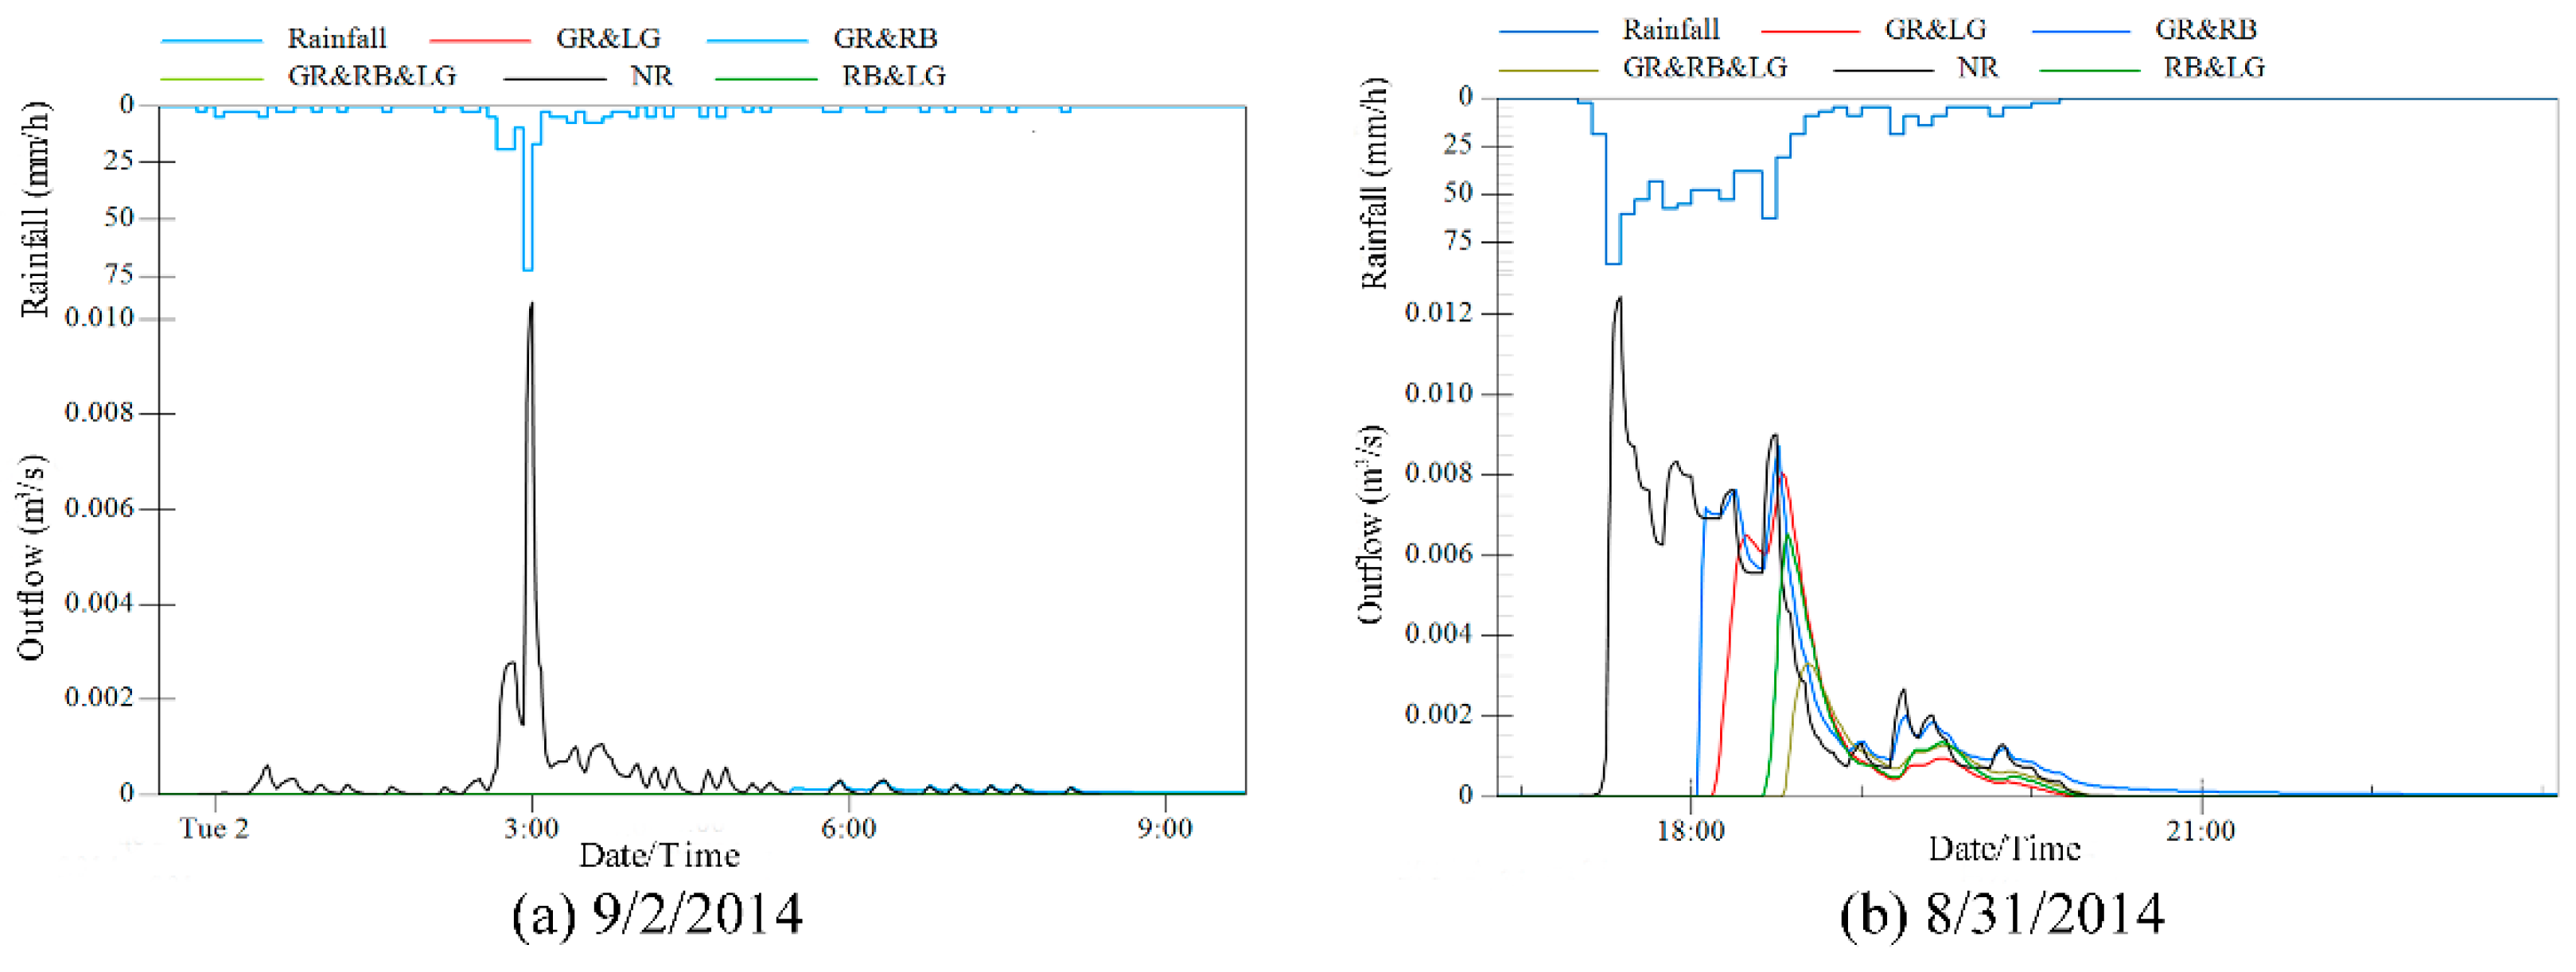
The performance of combined LID practices in the storm events of 08-31-2014 and 09-02-2014 are shown in Figure 5. There was no outflow in the other rainfall events for all combination scenarios.
Figure 5 shows that the combination scenarios can effectively control all rainfall events with fewer areas of composed LID. In the storm event of 09-02-2014, only GR&RB had outflow. In the storm event of 08-31-2014, all combination scenarios had outflow. The performances of the combination scenarios are summarized in Table 6.
It can be seen in Table 6 that most values for the effect of the combination scenarios are between the effects of composed LID except that in 08-31-2014, the peak reduction rate of GR&RB is larger than that of GR and RB. This characteristic makes LID combinations advantageous and avoids the shortcomings of LID practices. For example, the effect of GR&RB is less influenced by previous rainfall compared to that of GR. RB&LG had better performance than GR&RB and GR&LG because it did not contain green roofs, which is the LID practice with the least reduction capacity. In RB&LG and GR&RB&LG, storm water stored in rain barrels can be used for greenbelt irrigation to reduce the runoff discharged by rain barrels and save water resources. Based on the volume reduction amount in the event of 08-31-2014, the ranking of the combination scenarios is GR&RB&LG > RB&LG > GR&LG > GR&RB. The order based on other indicators is the same as above. LID practice combinations are more flexible than single LID practices and can be applied under various local conditions. It can be inferred that combined LID practices can cope with larger rainfall events if the area of composed LID has not been reduced.
3.3. Reduction Effect of Individual and Combined Lid Practices for Precipitation of Different Return Periods
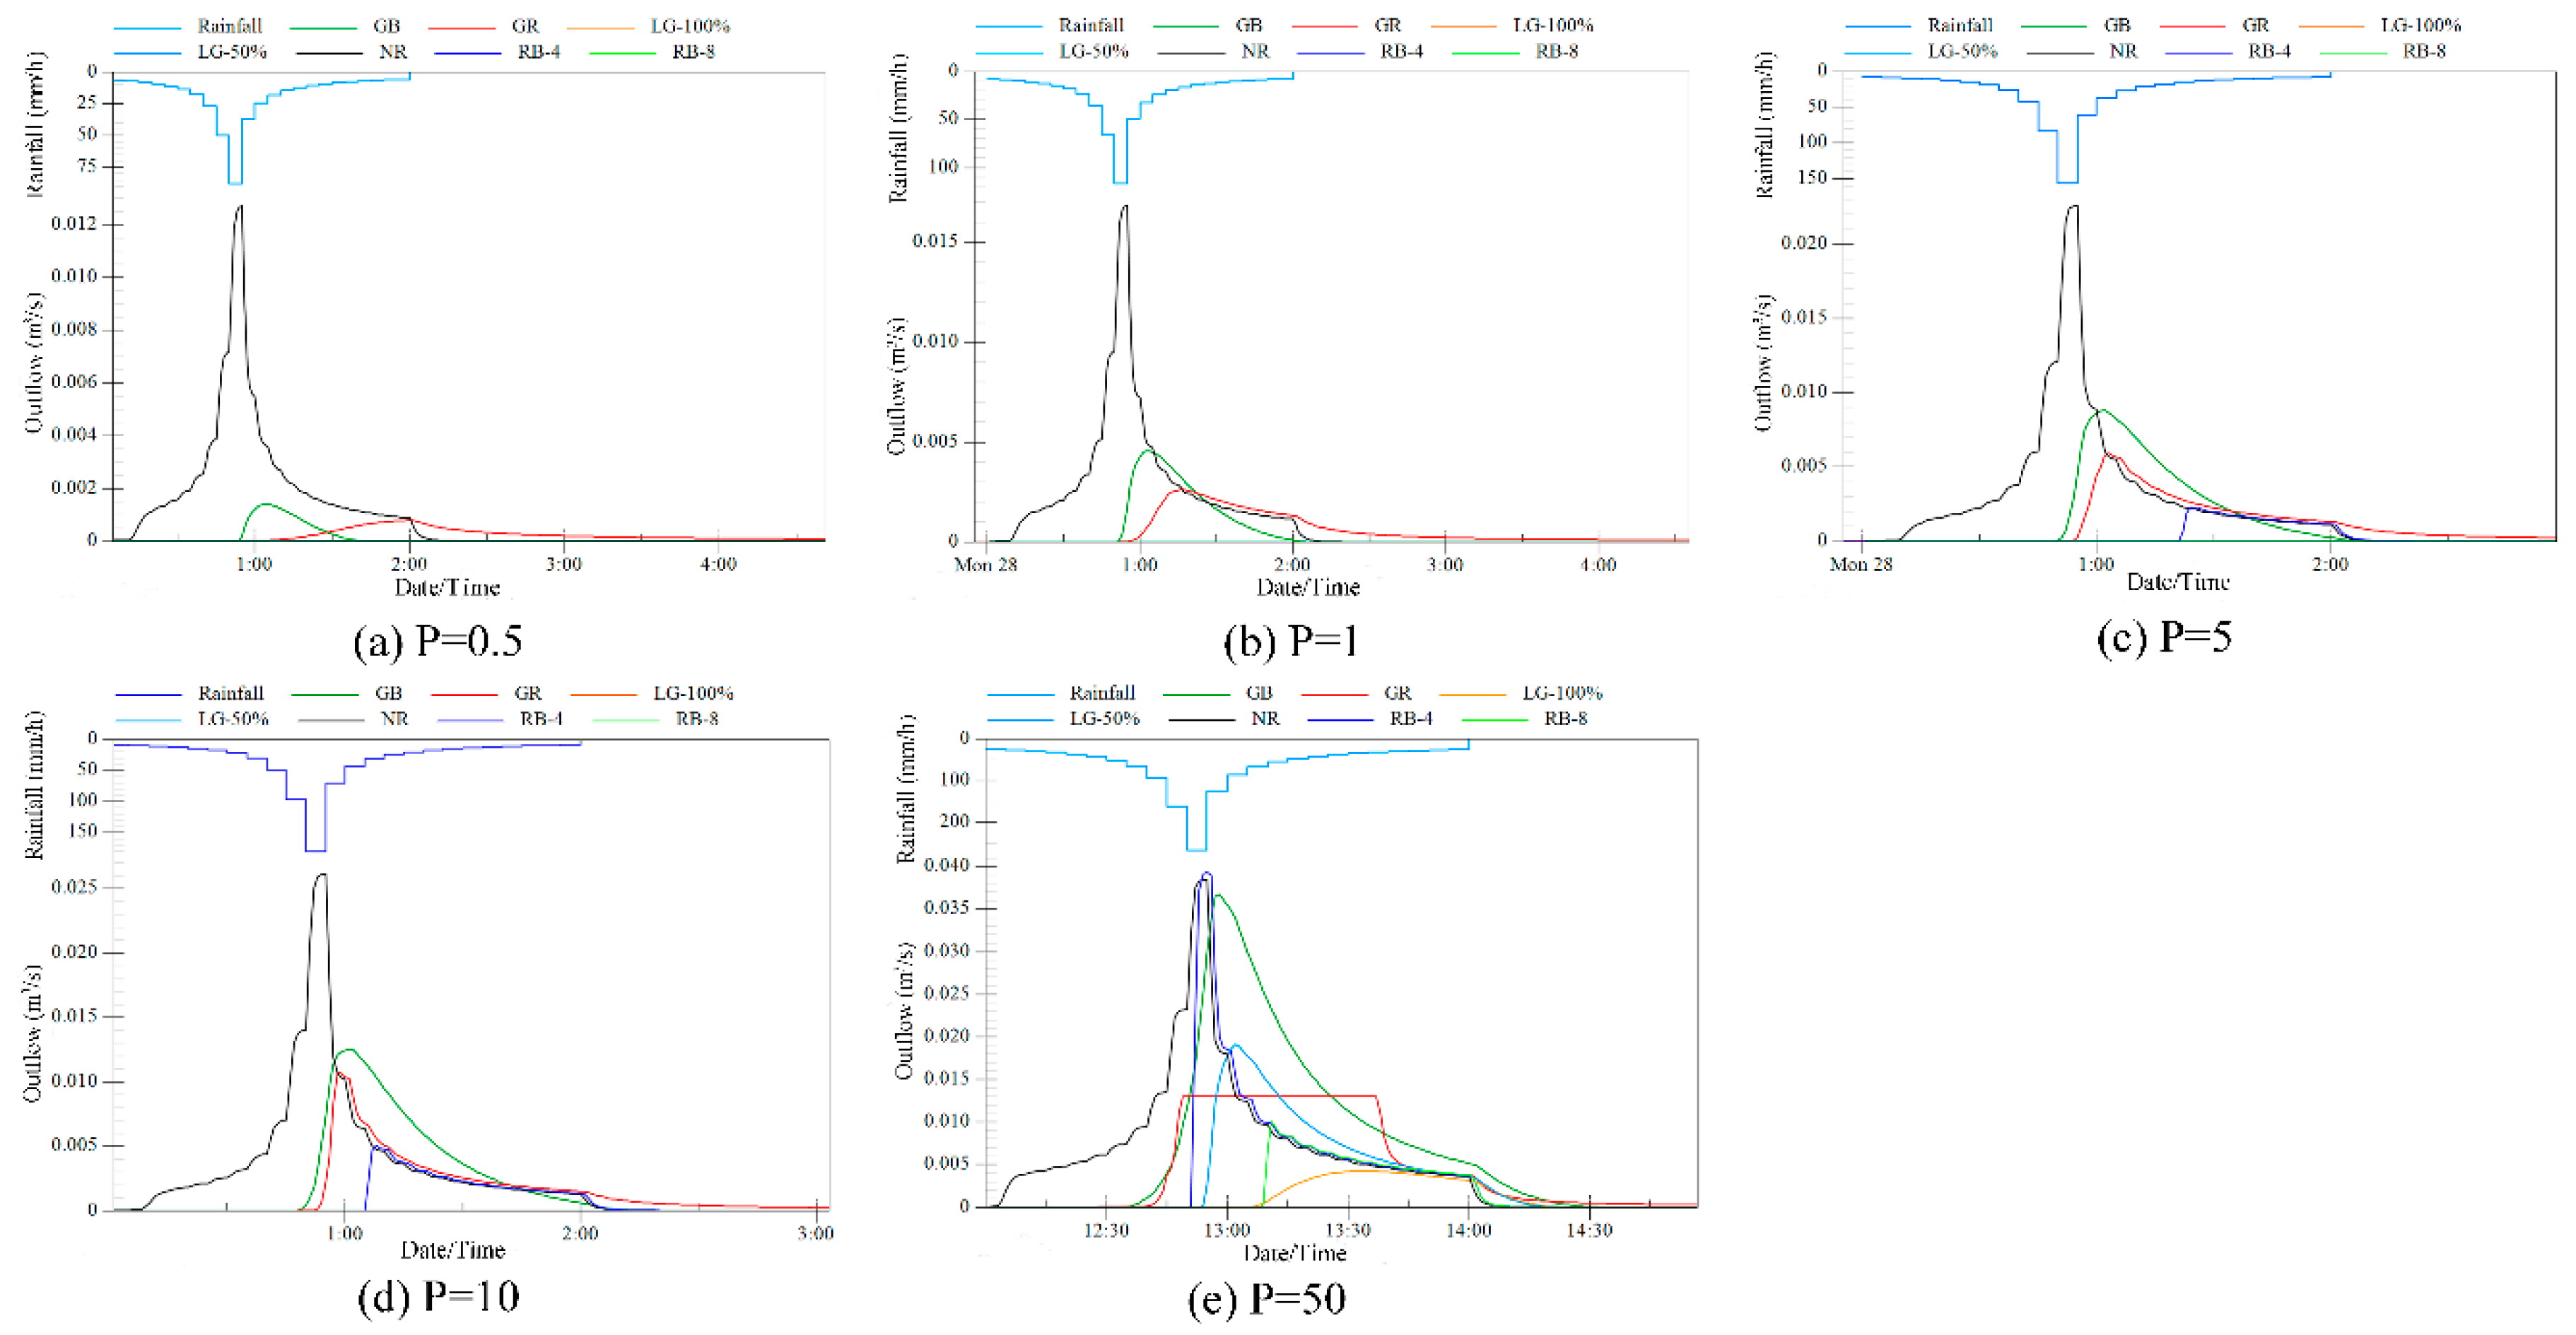
The performances of LID practices in designed two-hour precipitation events with different return periods are shown in Figure 6.
Figure 6 shows that when the return period of rainfall was lower than five years, only GR and GB had outflow. When the return periods were five years and 10 years, GR, GB and RB-4 had outflow. When the return period was 50 years, all scenarios had outflow, but the RB-8 and LG-100% scenarios can effectively reduce runoff volumes and peaks for 50 years of rainfall.
The performances of individual scenarios for precipitation of different return periods are summarized in Table 7.
Table 7 shows that the peak reduction effect of GR is more obvious than its volume reduction effect. Negative values arise for GB with 50 years of precipitation because the outflow indicators of GB were larger than those of NR, as the greenbelt itself had outflow in precipitation events during the 50-year return period. With the increase in the return period, the volume reduction rate and the peak reduction rate decrease obviously, while the volume reduction amount changes little. This result demonstrates that the indicator of the volume reduction amount is more fundamental and appropriate for reflecting the control ability of LID practices themselves. The rank in the reduction ability of LID practices for 50 years of precipitation is the same as the results for typical rainfall events, except that the reduction ability of LG-100% is larger than that of RB-8.
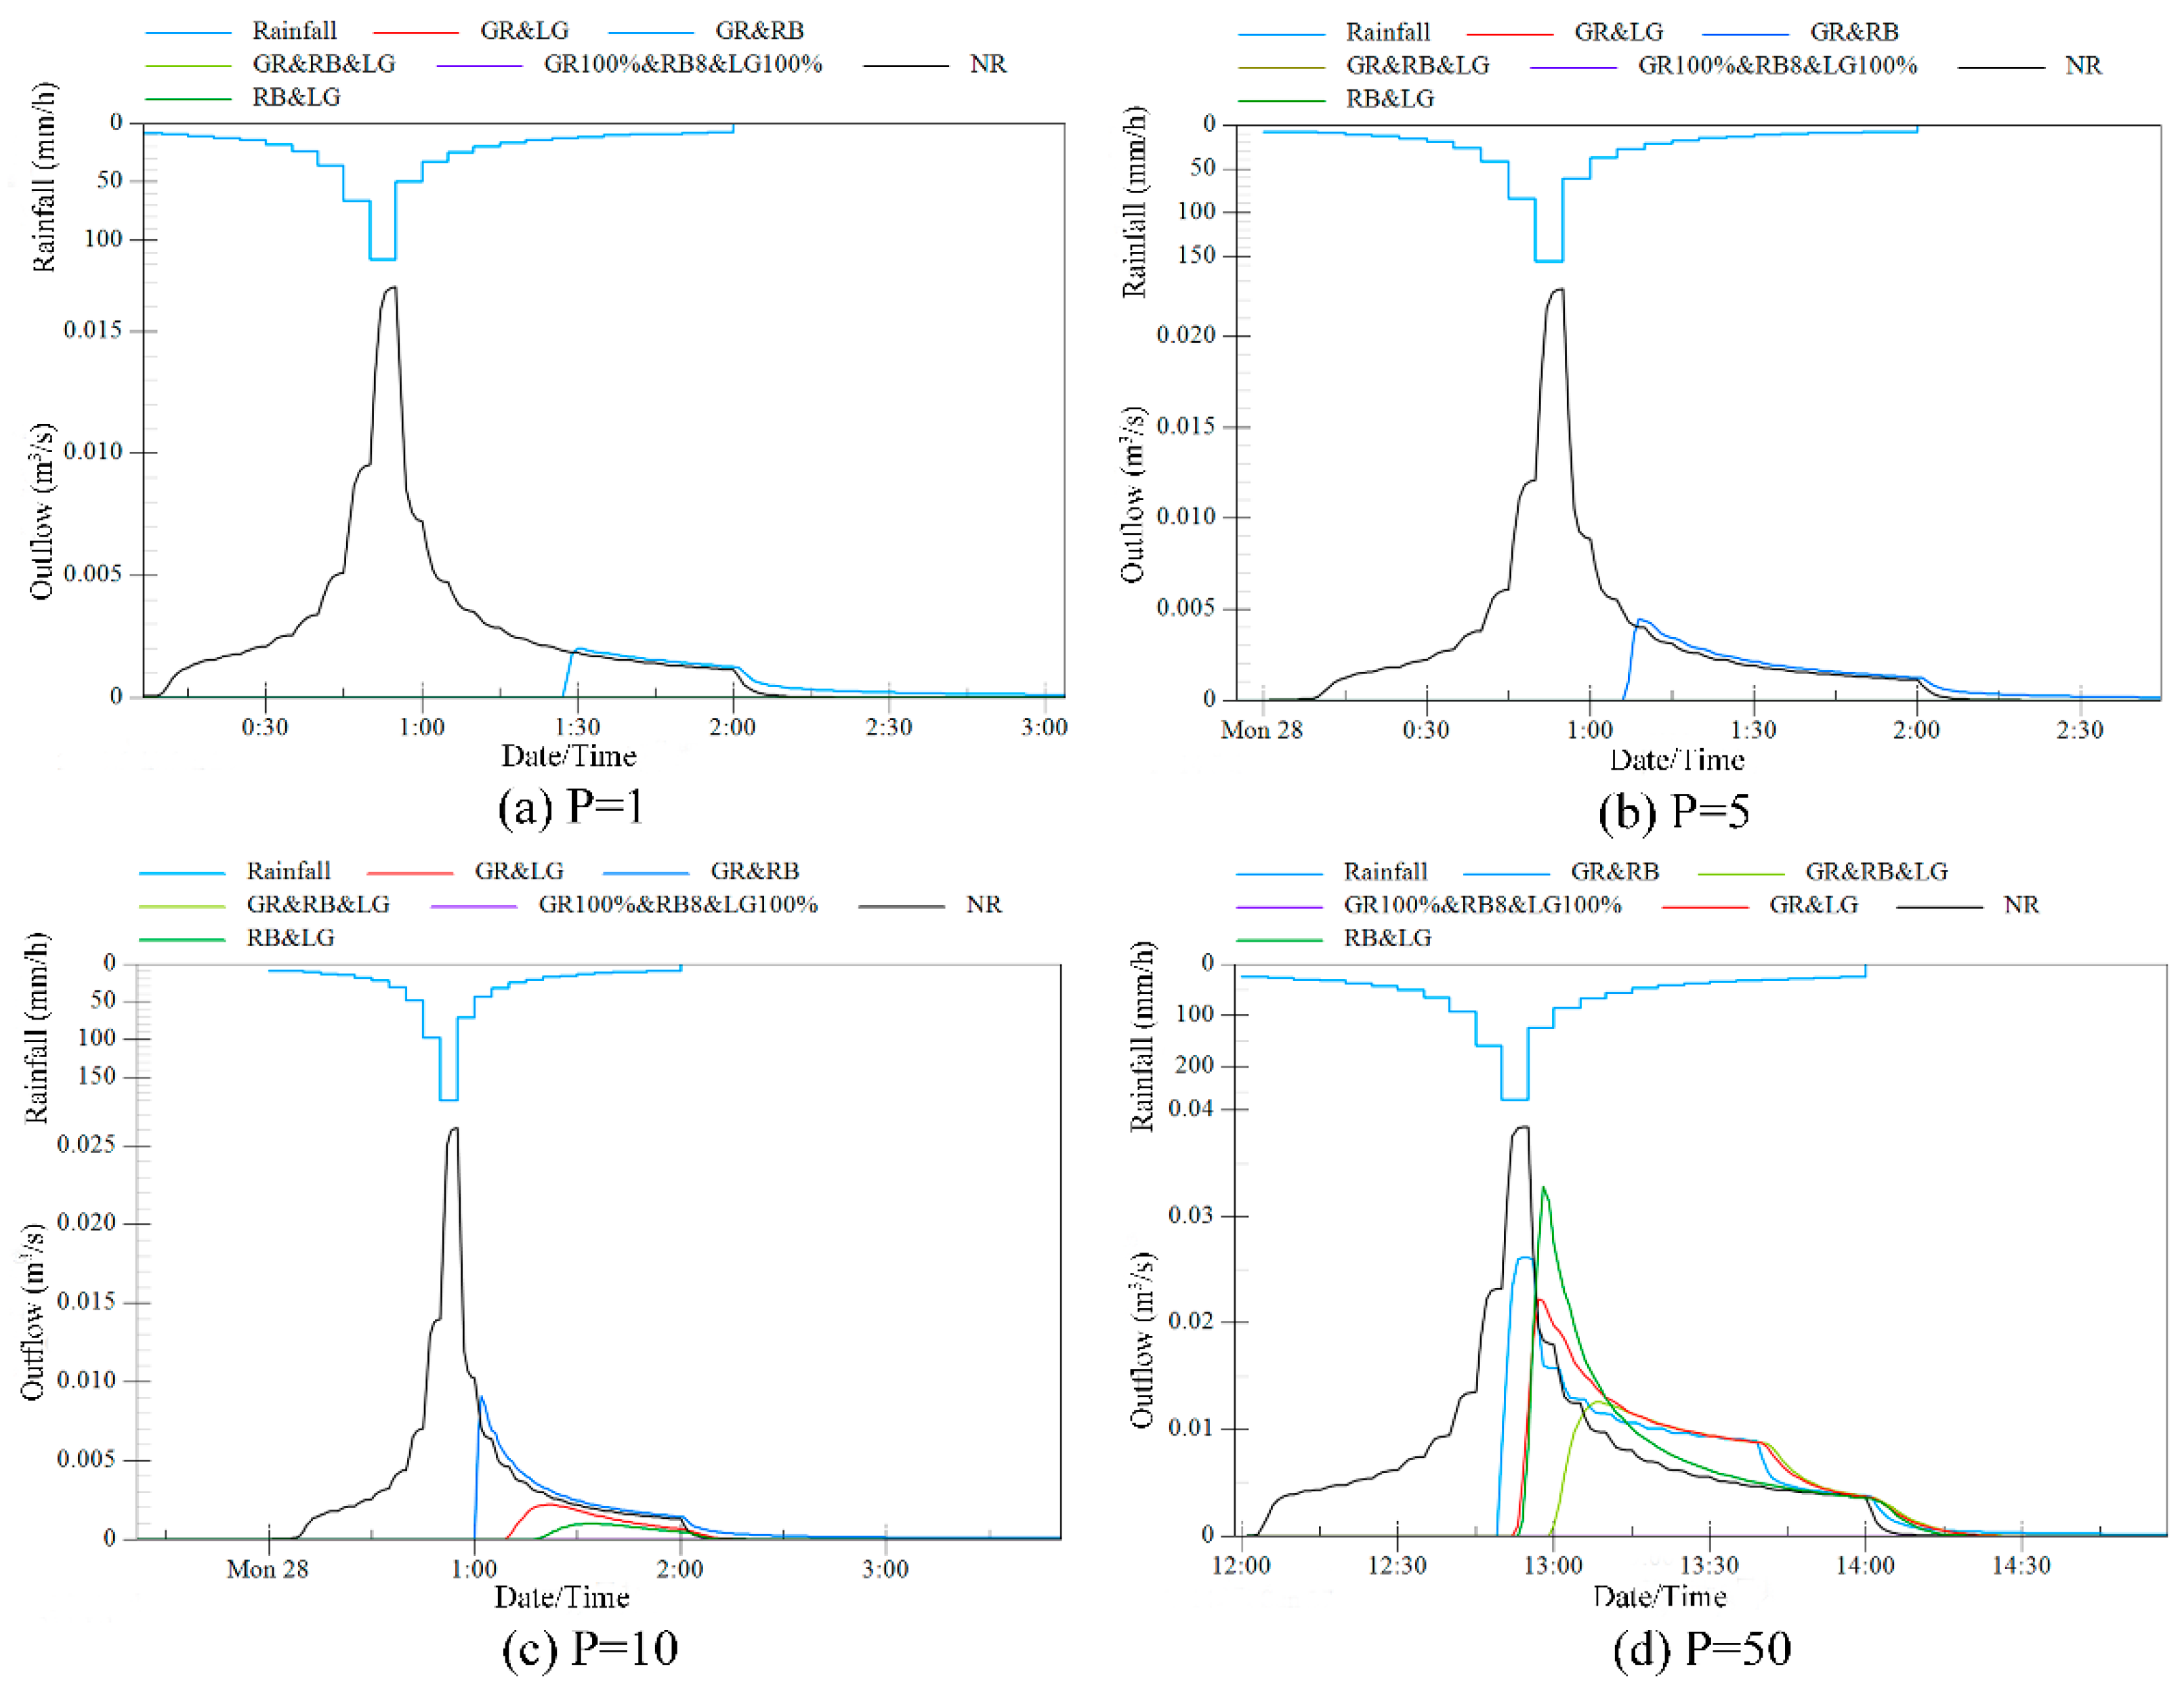
The performances of the combination scenarios in the designed precipitation events with different return periods are shown in Figure 7.
There was no outflow for the combination scenarios when the return period was 0.5 years. Figure 7 shows that for precipitation of one and five years, only GR&RB had outflow. For 10 years of precipitation, GR&LG, GR&RB and RB&LG had outflows. For 50 years of precipitation, all scenarios had outflows except GR100%&RB&LG100%, indicating that the full-scale combination of LID can completely reduce the runoff of 50 years of precipitation.
The performances of the combination scenarios for precipitation for different return periods are summarized in Table 8.
Table 8 shows that for 50 years of precipitation, scenarios with green roofs have a higher peak reduction ability than those without green roofs. GR&RB and RB&LG have larger peak reduction rates than RB-4 (Table 7) and partly overcome the shortcoming of RB-4 in terms of peak reduction. The rankings of the volume reduction amounts and volume reduction rates of the combination scenarios are the same as in the typical rainfall events. The rank of the peak reduction rate is GR&RB&LG > GR&LG > GR&RB > RB&LG.
3.4. Cost-Effectiveness Analysis for Annual Continuous Simulation
The cost-effectiveness of the LID scenarios was analyzed. The UAAC of green roofs and greenbelts was set based on previous research [48]. The UAAC of the low elevation green belt was set to be the same as that of the greenbelt. The UAAC of the rain barrel was calculated according to Equation (6). The unit construction cost and percent of cost for unit operation and maintenance were set to 280–340 dollars/m2 and 1%, respectively [54]. The service life of all LID practices was set to 20 years [48,54]. The outflow volume of LID scenarios was simulated by inputting continuous rainfall data from 2017 into SWMM to calculate the annual reduced volume. The results of the cost-effectiveness analysis are shown in Table 9.
Table 9 shows that the LG-25% has the highest cost efficiency, while GR has the lowest cost efficiency. The cost efficiency of combination scenarios including green roofs is also low. The ranking of LID scenarios based on cost efficiency is LG-25% > RB-4 > RB&LG > LG-50% > RB-8 > GB > GR&LG (GR&RB&LG) > GR&RB > GR. The results suggest that the type of LID practice and area devoted to it should be determined based on local rainfall conditions to achieve the highest cost efficiency. Although the reduction ability of greenbelts is limited, their cost is also very low. In addition, a minimum area of green fields is required by the Chinese government. Therefore, directing roof runoff into greenbelts is a good way to control roof runoff. Low elevation greenbelts can have a good effect, as they occupy less area than greenbelts. It is a promising LID practice for application. Rain barrels also have high cost efficiency and occupy very little land, making them another highly recommended LID practice. The reduction effect of green roofs is poor, and their construction and maintenance costs are high, making them the LID practice with the lowest cost efficiency.
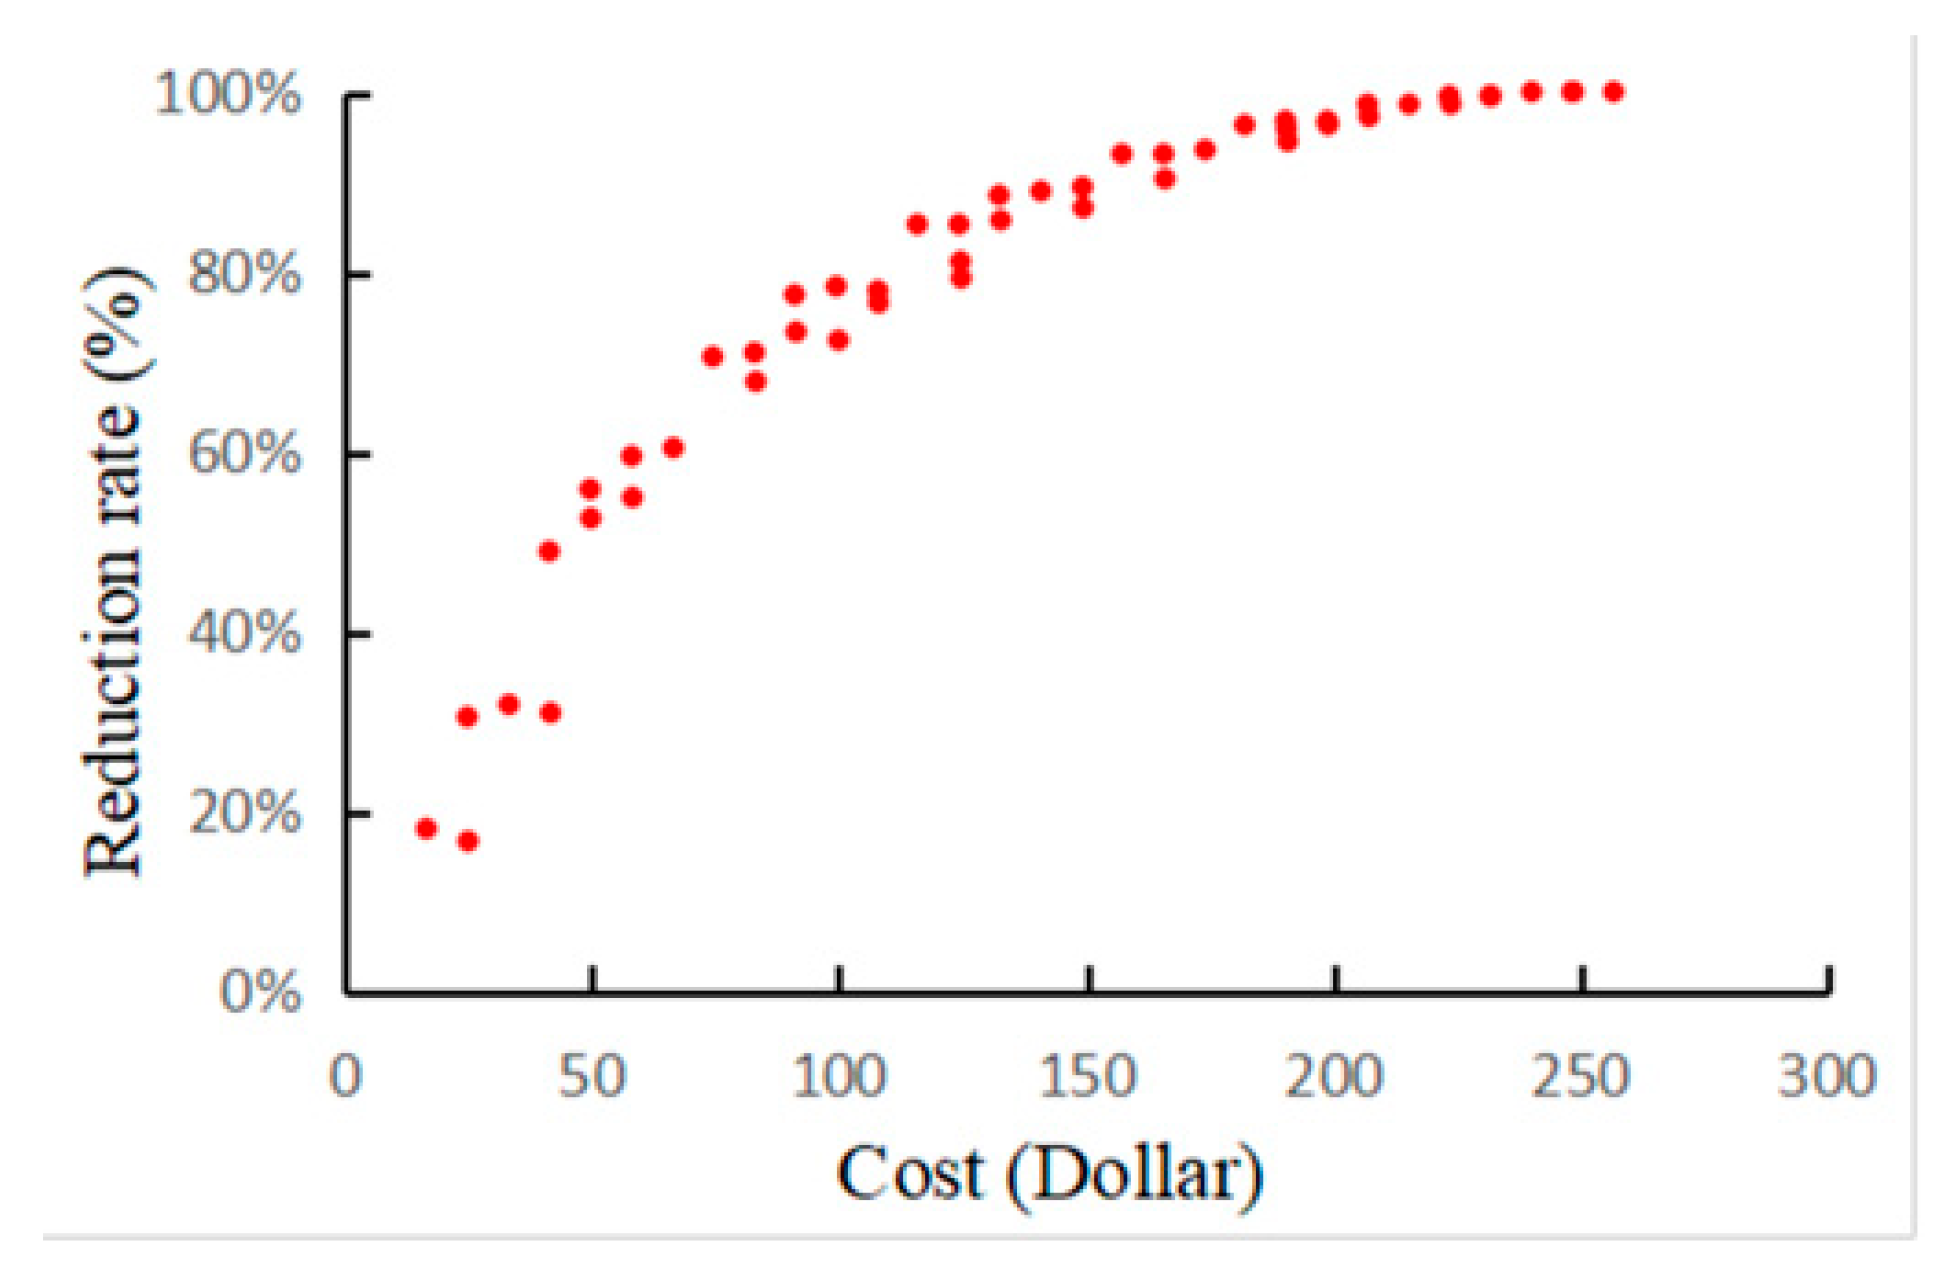
The optimization algorithm was applied to generate the best combination of LID practices with the highest cost efficiency. The SWMM model of GR&RB&LG at the building scale was used for the simulation. The areas of green roofs, rain barrels and low elevation greenbelts were taken as decision variables, with ranges of 0–520, 5.2–260, and 0.48–24, respectively. Cost, volume reduction rate, and peak reduction rate were set as the evaluation factors. The AC of the combination of LID practices was calculated based on the UAAC of LID practices in Table 9 and Equation (7). The optimization algorithm performed searches to identify cost-effective solutions. The optimization results are shown in Figure 8.
Figure 8 shows that the maximum AC of an LID practice combination is 256.6 dollars. If the optimization target is a volume reduction rate larger than 70%, the minimum AC is 74.56 dollars, while the areas of green roofs, rain barrels and low elevation greenbelts are 0, 0.48 m2 and 41.6 m2, respectively. The ranges of green roof, rain barrel and low elevation greenbelt areas are 0 m2, 0.48–2.4 m2 and 5.2–150.8 m2, respectively, in these solutions. If the optimization target is larger than 80%, the minimum cost is 115.90 dollars, while the areas of green roofs, rain barrels and low elevation greenbelts are 0, 0.48 m2 and 67.6 m2, respectively. If the optimization target is larger than 90%, the minimum cost is 157.24 dollars, while the areas of green roofs, rain barrels and low elevation greenbelts are 0, 0.48 m2 and 93.6 m2, respectively. The area of green roof is 0 for all optimum solutions. The area devoted to rain barrels is concentrated in the low value range, as rain barrels have a low ability to reduce the total outflow volume. The results indicate that to achieve the highest cost efficiency, low elevation greenbelts are the first choice, and green roofs should only be selected when low elevation greenbelts and rain barrels cannot be implemented.
3.5. Reduction Effect at Campus Scale
The performances of LID individual and combined practices at the campus scale in 2017 are summarized in Table 10.
It can be seen in Table 10 that individual and combined LID practices implemented to reduce roof runoff effectively reduced the outflow and overflow of the campus in 2017. For individual LID scenarios, LG has the largest volume reduction. Scenarios with rain barrels have the minimal volume reduction ability because they store runoff during rainfall events and discharge all the water after. However, rain barrel scenarios still had an obvious overflow volume and time reduction ability. This result indicates that the effect of LID practices should be evaluated using indicators for different aspects and that LID should be selected based on the main objective of the program. Combination scenarios had the best performance in terms of outflow and overflow reduction, as they fully made use of all the LID practices that can be applied and integrated the advantages of all types of LID practices. It was suggested by the Chinese government that the volume capture ratio of annual runoff should be between 75% and 85% in Beijing [7]. Table 10 indicates that the implementation of combined roof LID practices can almost achieve this objective on the BNU campus.
4. Conclusions
In this study, the effects of individual LID practices and their combinations in reducing roof runoff were carefully quantified at the building and campus scales on the BNU campus considering the hydrological relationship between LID practices. The cost-effectiveness of LID scenarios was then analyzed. The optimization algorithm was applied to generate the best combination with the highest cost efficiency.
The results show that SWMM can satisfactorily reproduce the performance of LID practices at the building scale. Individual and combined LID practices can effectively reduce roof runoff in all types of rainfalls and for return periods of 0.5–50 years at the building scale. The indicator of the volume reduction amount is more fundamental to the control ability of LID practices and more appropriate. The ranking of individual LID scenarios based on their volume reduction amount in the rainfall event of 08-31-2014 and precipitation with a 50-year return period is LG-100%>RB-8 > LG-50% > RB-4 > GR > GB. The ranking for the reduction ability of green roofs and greenbelts would change depending on rainfall type and previous rainfall conditions. Combination scenarios can maintain good performance with fewer areas of composed LID. Most values for the effect of combination scenarios are between those for the effect of composed LID. The ranking of the combination scenarios in terms of the volume reduction amount is GR&RB&LG > RB&LG > GR&LG > GR&RB. It is generally thought that LID is effective when rainfall is low volume and invalid for high-volume rainfall. In this study, it can be concluded that individual and combined LID practices all have the ability to cope with high-volume and storm rainfalls in Beijing as long as they are appropriately set.
Based on the results of the life cycle cost-effectiveness analysis, the ranking of LID scenarios according to cost efficiency is LG-25% > RB-4 > RB&LG > LG-50% > RB-8 > GB > GR&LG (GR&RB&LG) > GR&RB > GR in the precipitation conditions of Beijing. Through optimization by applying NSGA-II, the areas of composed LID can be determined for LID practice combinations with the highest cost efficiency. The result indicates that to achieve the highest cost efficiency, low elevation greenbelts are the first choice, and green roofs should only be selected when low elevation greenbelts and rain barrels cannot be implemented.
At the campus scale, individual and combined LID practices can effectively reduce the outflow from and overflow in the campus. The effect of LID practices should be evaluated using indicators that capture different aspects, and LID practices should be selected based on the main objective of the program. Combination scenarios have the best reduction performance, as they fully make use of all the LID practices that can be applied. Implementing combined roof LID can almost achieve the annual runoff reduction objective suggested by the Chinese government.
Supplementary Materials
The following are available online at https://www.mdpi.com/2073-4441/12/3/795/s1, Figure S1: Network and areas covered by scenarios in the campus of Beijing Normal University.
Author Contributions
Z.S. and L.C. proposed the Conceptualization. P.Z. developed the model applying LIDs, analyzed and discussed the simulation results and drafted the manuscript. X.H. developed the campus model of Beijing Normal University; G.W. provide the software of optimization, X.Z. assisted the experimental research of LIDs and analyzed part of simulation results, Z.S. designed and supervised the study. All authors have read and agreed to the published version of the manuscript.
Funding
This work was funded by the State Key Program of National Natural Science Foundation of China (No. 41530635) and the Interdiscipline Research Funds of Beijing Normal University.
Acknowledgments
The authors are grateful to the artificial rainfall simulation hall of Fangshan experimental base of Beijing normal university for providing place and equipment of artificial rainfall experiment of LID performance.
Conflicts of Interest
The authors declare no conflict of interest.
References
- Muis, S.; Güneralp, B.; Jongman, B.; Aerts, J.C.; Ward, P.J. Flood risk and adaptation strategies under climate change and urban expansion: A probabilistic analysis using global data. Sci. Total Environ. 2015, 538, 445–457. [Google Scholar] [CrossRef]
- Miller, J.D.; Hutchins, M. The impacts of urbanisation and climate change on urban flooding and urban water quality: A review of the evidence concerning the United Kingdom. J. Hydrol. Reg. Stud. 2017, 12, 345–362. [Google Scholar] [CrossRef] [Green Version]
- Zhou, Q.; Leng, G.; Su, J.; Ren, Y. Comparison of urbanization and climate change impacts on urban flood volumes: Importance of urban planning and drainage adaptation. Sci. Total Environ. 2019, 658, 24–33. [Google Scholar] [CrossRef] [PubMed]
- Paprotny, D.; Sebastian, A.; Morales-Nápoles, O.; Jonkman, S.N. Trends in flood losses in Europe over the past 150 years. Nat. Commun. 2018, 9, 1985. [Google Scholar] [CrossRef] [PubMed]
- Zhang, X.; Sheng, W.; Qi, S. Hazards and reflection on Fangshan District extreme rainstorm of 21 July 2012, the urban mountainous region of Beijing, North China. Nat. Hazards 2018, 94, 1459–1461. [Google Scholar] [CrossRef]
- Dietz, M.E. Low impact development practices: A review of current research and recommendations for future directions. Water Air Soil Pollut. 2007, 186, 351–363. [Google Scholar] [CrossRef]
- MHURD. Technical Guide for Sponge Cities-Construction of Low Impact Development (for Trial Implementation); Development, M.O.H.A.U.R., Ed.; Ministry of Housing and Urban Rural Development: Beijing, China, 2014. [Google Scholar]
- Ahiablame, L.M.; Engel, B.A.; Chaubey, I. Effectiveness of low impact development practices: Literature review and suggestions for future research. Water Air Soil Pollut. 2012, 223, 4253–4273. [Google Scholar] [CrossRef]
- Redfern, T.W.; Macdonald, N.; Kjeldsen, T.R.; Miller, J.D.; Reynard, N. Current understanding of hydrological processes on common urban surfaces. Prog. Phys. Geogr. 2016, 40, 699–713. [Google Scholar] [CrossRef] [Green Version]
- Hunt, W.; Hathaway, J.; Winston, R.; Jadlocki, S. Runoff volume reduction by a level spreader–vegetated filter strip system in suburban Charlotte, NC. J. Hydrol. Eng. 2010, 15, 499–503. [Google Scholar] [CrossRef]
- Ahiablame, L.; Shakya, R. Modeling flood reduction effects of low impact development at a watershed scale. J. Environ. Manag. 2016, 171, 81–91. [Google Scholar] [CrossRef]
- Luan, Q.; Fu, X.; Song, C.; Wang, H.; Liu, J.; Wang, Y. Runoff effect evaluation of LID through SWMM in typical mountainous, low-lying urban areas: A case study in China. Water 2017, 9, 439. [Google Scholar] [CrossRef] [Green Version]
- Bai, Y.; Zhao, N.; Zhang, R.; Zeng, X. Storm water management of low impact development in urban areas based on SWMM. Water 2019, 11, 33. [Google Scholar] [CrossRef] [Green Version]
- Shen, Z.-Y.; Chen, L.; Xie, H.; Ma, Y.; Feng, X.; Wei, G.-Y. Low Impact Development on Urban Nonpoint Source Pollution Control: A Review. Geol. Sci. Technol. Inf. 2012, 31, 171–176. [Google Scholar]
- Berndtsson, J.C. Green roof performance towards management of runoff water quantity and quality: A review. Ecol. Eng. 2010, 36, 351–360. [Google Scholar] [CrossRef]
- Purvis, R.A.; Winston, R.J.; Hunt, W.F.; Lipscomb, B.; Narayanaswamy, K.; McDaniel, A.; Lauffer, M.S.; Libes, S. Evaluating the Hydrologic Benefits of a Bioswale in Brunswick County, North Carolina (NC), USA. Water 2019, 11, 1291. [Google Scholar] [CrossRef] [Green Version]
- Silva, M.D.; K Najjar, M.; WA Hammad, A.; Haddad, A.; Vazquez, E. Assessing the Retention Capacity of an Experimental Green Roof Prototype. Water 2020, 12, 90. [Google Scholar] [CrossRef] [Green Version]
- Hilten, R.N.; Lawrence, T.M.; Tollner, E.W. Modeling stormwater runoff from green roofs with HYDRUS-1D. J. Hydrol. 2008, 358, 288–293. [Google Scholar] [CrossRef]
- Brown, R.; Skaggs, R.; Hunt Iii, W. Calibration and validation of DRAINMOD to model bioretention hydrology. J. Hydrol. 2013, 486, 430–442. [Google Scholar] [CrossRef]
- Sun, T.; Bou-Zeid, E.; Wang, Z.-H.; Zerba, E.; Ni, G.-H. Hydrometeorological determinants of green roof performance via a vertically-resolved model for heat and water transport. Build. Environ. 2013, 60, 211–224. [Google Scholar] [CrossRef]
- Peng, Z.; Stovin, V. Independent validation of the SWMM green roof module. J. Hydrol. Eng. 2017, 22, 04017037. [Google Scholar] [CrossRef]
- Cipolla, S.S.; Maglionico, M.; Stojkov, I. A long-term hydrological modelling of an extensive green roof by means of SWMM. Ecol. Eng. 2016, 95, 876–887. [Google Scholar] [CrossRef]
- Krebs, G.; Kuoppamäki, K.; Kokkonen, T.; Koivusalo, H. Simulation of green roof test bed runoff. Hydrol. Process. 2016, 30, 250–262. [Google Scholar] [CrossRef]
- Li, J.; Li, Y.; Li, Y. SWMM-based evaluation of the effect of rain gardens on urbanized areas. Environ. Earth Sci. 2016, 75, 17. [Google Scholar] [CrossRef]
- Gülbaz, S.; Kazezyılmaz-Alhan, C.M. An evaluation of hydrologic modeling performance of EPA SWMM for bioretention. Water Sci. Technol. 2017, 76, 3035–3043. [Google Scholar] [CrossRef] [PubMed]
- Palla, A.; Gnecco, I. Hydrologic modeling of Low Impact Development systems at the urban catchment scale. J. Hydrol. 2015, 528, 361–368. [Google Scholar] [CrossRef]
- Babaei, S.; Ghazavi, R.; Erfanian, M. Urban flood simulation and prioritization of critical urban sub-catchments using SWMM model and PROMETHEE II approach. Phys. Chem. Earth Parts A/B/C 2018, 105, 3–11. [Google Scholar] [CrossRef]
- Randall, M.; Sun, F.; Zhang, Y.; Jensen, M.B. Evaluating Sponge City volume capture ratio at the catchment scale using SWMM. J. Environ. Manag. 2019, 246, 745–757. [Google Scholar] [CrossRef]
- Tuomela, C.; Sillanpää, N.; Koivusalo, H. Assessment of stormwater pollutant loads and source area contributions with storm water management model (SWMM). J. Environ. Manag. 2019, 233, 719–727. [Google Scholar] [CrossRef]
- Niazi, M.; Nietch, C.; Maghrebi, M.; Jackson, N.; Bennett, B.R.; Tryby, M.; Massoudieh, A. Storm water management model: Performance review and gap analysis. J. Sustain. Water Built Environ. 2017, 3, 04017002. [Google Scholar] [CrossRef] [Green Version]
- Minh, H.D. Optimal Planning of Low-Impact Development for TSS Control in the Upper Area of the Cau Bay River Basin, Vietnam. Water 2020, 12, 533. [Google Scholar] [CrossRef] [Green Version]
- Pereira, S.F.; Leite, C.M.E.; Koide, S. Hydrological Modelling and Evaluation of Detention Ponds to Improve Urban Drainage System and Water Quality. Water 2019, 11, 1547. [Google Scholar] [CrossRef] [Green Version]
- Xie, H.; Wu, Y.; Wang, L.; Luo, W.; Zhou, W.; Zhou, H.; Yan, Y.; Liu, J. Comparing simulations of green roof hydrological processes by SWMM and HYDRUS-1D. Water Supply 2019. [Google Scholar] [CrossRef]
- Palermo, S.A.; Turco, M.; Principato, F.; Piro, P. Hydrological effectiveness of an extensive green roof in Mediterranean climate. Water 2019, 11, 1378. [Google Scholar] [CrossRef] [Green Version]
- Stovin, V.; Vesuviano, G.; Kasmin, H. The hydrological performance of a green roof test bed under UK climatic conditions. J. Hydrol. 2012, 414, 148–161. [Google Scholar] [CrossRef]
- Voyde, E.; Fassman, E.; Simcock, R. Hydrology of an extensive living roof under sub-tropical climate conditions in Auckland, New Zealand. J. Hydrol. 2010, 394, 384–395. [Google Scholar] [CrossRef]
- BMBLF. Specification for Roof Greening; Beijing Municipal Bureau of Landscape and Forestry: Beijing, China, 2015; Volume DB11/T 281-2015. [Google Scholar]
- Deletic, A.; Fletcher, T.D. Performance of grass filters used for stormwater treatment—A field and modelling study. J. Hydrol. 2006, 317, 261–275. [Google Scholar] [CrossRef]
- Price, K.; Jackson, C.R.; Parker, A.J. Variation of surficial soil hydraulic properties across land uses in the southern Blue Ridge Mountains, North Carolina, USA. J. Hydrol. 2010, 383, 256–268. [Google Scholar] [CrossRef]
- Rosa, D.J.; Clausen, J.C.; Dietz, M.E. Calibration and verification of SWMM for low impact development. JAWRA J. Am. Water Resour. Assoc. 2015, 51, 746–757. [Google Scholar] [CrossRef]
- Hou, X.; Chen, L.; Liu, X.; Li, M.; Shen, Z. Parameter transferability across spatial resolutions in urban hydrological modelling: A case study in Beijing, China. Front. Earth Sci. 2019, 13, 18–32. [Google Scholar] [CrossRef]
- Jia, H.; Yao, H.; Tang, Y.; Shaw, L.Y.; Field, R.; Tafuri, A.N. LID-BMPs planning for urban runoff control and the case study in China. J. Environ. Manag. 2015, 149, 65–76. [Google Scholar] [CrossRef]
- Guo, X.; Guo, Q.; Zhou, Z.; Du, P.; Zhao, D. Degrees of hydrologic restoration by low impact development practices under different runoff volume capture goals. J. Hydrol. 2019, 578, 124069. [Google Scholar] [CrossRef]
- Zhu, Z.; Chen, Z.; Chen, X.; Yu, G. An assessment of the hydrologic effectiveness of low impact development (LID) practices for managing runoff with different objectives. J. Environ. Manag. 2019, 231, 504–514. [Google Scholar] [CrossRef] [PubMed]
- Keifer, C.J.; Chu, H.H. Synthetic storm pattern for drainage design. J. Hydraul. Div. 1957, 83, 1–25. [Google Scholar]
- Wang, Q.; Zhang, X.; Wei, M.; Zhou, Y.; Li, P.; Bai, G. Research summary of planning and design standards for storm water system in Beijing City. Water Wastewater Eng. 2011, 10. [Google Scholar] [CrossRef]
- Yao, L.; Wei, W.; Chen, L. How does imperviousness impact the urban rainfall-runoff process under various storm cases? Ecol. Indic. 2016, 60, 893–905. [Google Scholar] [CrossRef]
- Mei, C.; Liu, J.; Wang, H.; Yang, Z.; Ding, X.; Shao, W. Integrated assessments of green infrastructure for flood mitigation to support robust decision-making for sponge city construction in an urbanized watershed. Sci. Total Environ. 2018, 639, 1394–1407. [Google Scholar] [CrossRef] [PubMed]
- Deb, K.; Pratap, A.; Agarwal, S.; Meyarivan, T. A fast and elitist multiobjective genetic algorithm: NSGA-II. IEEE Trans. Evol. Comput. 2002, 6, 182–197. [Google Scholar] [CrossRef] [Green Version]
- Xu, T.; Jia, H.; Wang, Z.; Mao, X.; Xu, C. SWMM-based methodology for block-scale LID-BMPs planning based on site-scale multi-objective optimization: A case study in Tianjin. Front. Environ. Sci. Eng. 2017, 11, 1. [Google Scholar] [CrossRef]
- Jeon, D.J.; Ki, S.J.; Cha, Y.; Park, Y.; Kim, J.H. New methodology of evaluation of best management practices performances for an agricultural watershed according to the climate change scenarios: A hybrid use of deterministic and decision support models. Ecol. Eng. 2018, 119, 73–83. [Google Scholar] [CrossRef]
- Geng, R.; Yin, P.; Sharpley, A.N. A coupled model system to optimize the best management practices for nonpoint source pollution control. J. Clean. Prod. 2019, 220, 581–592. [Google Scholar] [CrossRef]
- Shafique, M.; Kim, R.; Rafiq, M. Green roof benefits, opportunities and challenges–A review. Renew. Sustain. Energy Rev. 2018, 90, 757–773. [Google Scholar] [CrossRef]
- Liao, Z.; Chen, H.; Huang, F.; Li, H. Cost–effectiveness analysis on LID measures of a highly urbanized area. Desalin. Water Treat. 2015, 56, 2817–2823. [Google Scholar] [CrossRef]
Figure 1.
Flow chart of this study.

Figure 2.
Location of Beijing Normal University.

Figure 3.
Comparison of observed and simulated outflow of green roofs with artificial rainfall intensities of (a) 60 mm/h, (b) 92 mm/h and (c) 126 mm/h.
Figure 3.
Comparison of observed and simulated outflow of green roofs with artificial rainfall intensities of (a) 60 mm/h, (b) 92 mm/h and (c) 126 mm/h.

Figure 4.
Effect of individual LID for typical rainfall events in 2014.

Figure 5.
Effect of combined LID for typical rainfall events in 2014.

Figure 6.
Effect of individual LID for designed precipitation events with different return periods.

Figure 7.
Effect of combination scenarios for designed precipitation events with different return periods.
Figure 7.
Effect of combination scenarios for designed precipitation events with different return periods.

Figure 8.
Best combination of LID practices with highest cost efficiency.


Table 1.
Hydrological features of eight monitored rainfall events in 2014.
| Date (mm-dd-y) | Rainfall Depth (mm) | Rainfall Duration (min) | Average Intensity (mm/h) | Peak Intensity (mm/h) | Antecedent Dry Days (d) | Rainfall Type |
|---|---|---|---|---|---|---|
| 07-29-2014 | 35.7 | 400 | 5.36 | 43.28 | 5.6 | Large |
| 08-04-2014 | 5.9 | 260 | 1.36 | 9.45 | 4.9 | Light |
| 08-09-2014 | 7.2 | 120 | 3.60 | 24.08 | 2.3 | Light |
| 08-23-2014 | 10.4 | 45 | 13.87 | 38.4 | 2.8 | Medium |
| 08-30-2014 | 29 | 105 | 16.57 | 69.6 | 6.9 | Large |
| 08-31-2014 | 70.76 | 165 | 25.73 | 86.2 | 0.7 | Storm |
| 09-02-2014 | 33.6 | 1880 | 1.07 | 72 | 0.6 | Large |
| 09-26-2014 | 7.8 | 20 | 23.40 | 50.4 | 2.62 | Medium |
Table 2.
Parameter settings of the SWMM LID module.
| LID | Berm Height (mm) | Soil Thickness (mm) | Porosity | Field Capacity | Wilting Point | Conductivity (mm/h) | Conductivity Slope | Suction Head (mm) | Initially, Saturated (%) |
|---|---|---|---|---|---|---|---|---|---|
| Green roof | 20 | 100 | 0.5 | 0.3 | 0.078 | 90 | 50 | 88.9 | 20 |
| Green belt | 10 | 1000 | 0.453 | 0.19 | 0.085 | 20 | 40 | 90 | 23.2 |
Table 3.
Scenarios and occupied areas.
| Scale | Type | Scenarios | Combination of LID and Areas (m2) | Total Area (m2) | |||
|---|---|---|---|---|---|---|---|
| GR | GB | RB | LG | ||||
| Building | Base | NR | |||||
| Individual | GR | 520 | 520 | ||||
| GB | 520 | 520 | |||||
| RB-4 | 12 | 12 | |||||
| RB-8 | 24 | 24 | |||||
| 25%LG | 130 | 130 | |||||
| 50%LG | 260 | 260 | |||||
| 100%LG | 520 | 520 | |||||
| Combined | GR&RB | 260 | 6 | 266 | |||
| GR&LG | 260 | 130 | 390 | ||||
| RB&LG | 6 | 130 | 136 | ||||
| GR&RB&LG | 260 | 6 | 130 | 396 | |||
| GR100%&RB&LG100% | 520 | 24 | 520 | 1064 | |||
| Campus | Base | NR | |||||
| Individual | GR | 105,983 | 105,983 | ||||
| GB | 147,043 | 147,043 | |||||
| RB-4 | 2220 | 2220 | |||||
| RB-8 | 4440 | 4440 | |||||
| LG | 147,043 | 147,043 | |||||
| Combined | GR&RB&GB | 105,983 | 147,043 | 2220 | 255,246 | ||
| GR&RB&LG | 105,983 | 2220 | 147,043 | 255,246 | |||
Table 4.
Fit results for calibration and validation of the BNU model.
| Process | Rainfall Events | Rain Type | Total Outflow (m3) | Peak Flow Rate (m3/s) | NSE | PBIAS (%) |
|---|---|---|---|---|---|---|
| Calibration | 07-29-2014 | Large | 4740 | 0.54 | 0.842 | −0.65 |
| 08-04-2014 | Little | 490.9 | 0.07 | 0.861 | 2.26 | |
| 08-09-2014 | Little | 499.9 | 0.14 | 0.905 | −9.75 | |
| 08-23-2014 | Medium | 989.4 | 0.50 | 0.899 | −15.96 | |
| Validation | 08-30-2014 | Large | 3159 | 1.02 | 0.907 | −17.97 |
| 08-31-2014 | Storm | 7205 | 0.97 | 0.793 | −9.64 | |
| 09-02-2014 | Large | 4098 | 0.70 | 0.888 | −1.95 | |
| 09-26-2014 | Medium | 783 | 0.40 | 0.840 | −9.4 |
Table 5.
Summary of performance for individual LID practices in rainfall events in 2014.
| Rainfall Events | Scenarios | Volume Reduction Amount (m3) | Volume Reduction Rate (%) | Peak Reduction Rate (%) | Delayed Peak Time (H:M) |
|---|---|---|---|---|---|
| 07-29-2014 | GR | 15.19 | 88.94 | 98.03 | 10:42 |
| 08-30-2014 | GR | 14.06 | 97.35 | 99.85 | 1:52 |
| 08-30-2014 | GB | 13.43 | 93.03 | 87.93 | 0:17 |
| 09-02-2014 | GR | 1.01 | 7.12 | 59.00 | 0:03 |
| 09-02-2014 | GB | 13.60 | 96.04 | 93.91 | 0:07 |
| 08-31-2014 | GR | 4.05 | 11.20 | 29.48 | 0:57 |
| 08-31-2014 | GB | 2.80 | 7.74 | 20.51 | 0:57 |
| 08-31-2014 | RB-4 | 23.15 | 64.02 | 26.16 | 0:55 |
| 08-31-2014 | LG-50% | 32.38 | 89.56 | 82.13 | 1:06 |
Table 6.
The statistical results of combined LID performance in rainfall events in 2014.
| Rainfall Events | Scenarios | Volume Reduction Amount (m3) | Volume Reduction Rate (%) | Peak Reduction Rate (%) | Delayed Peak Time(H:M) |
|---|---|---|---|---|---|
| 09-02-2014 | GR&RB | 12.25 | 86.32 | 97.45 | 2:56 |
| 08-31-2014 | GR&RB | 13.59 | 37.58 | 29.75 | 0:56 |
| 08-31-2014 | GR&LG | 20.43 | 56.50 | 35.09 | 0:57 |
| 08-31-2014 | RB&LG | 26.93 | 74.48 | 47.38 | 0:59 |
| 08-31-2014 | GR&RB&LG | 29.18 | 80.70 | 73.37 | 1:06 |
Table 7.
Summary of performances of individual LID scenarios for precipitation events with different return periods.
Table 7.
Summary of performances of individual LID scenarios for precipitation events with different return periods.
| Return Period | Scenarios | Volume Reduction Amount (m3) | Volume Reduction Rate (%) | Peak Reduction Rate (%) |
|---|---|---|---|---|
| 0.5 | GR | 12.92 | 74.39 | 93.79 |
| GB | 15.38 | 88.56 | 89.13 | |
| 1 | GR | 12.95 | 55.82 | 84.32 |
| GB | 14.85 | 64.01 | 72.89 | |
| 5 | GR | 13.06 | 47.87 | 73.74 |
| GB | 12.12 | 44.43 | 61.02 | |
| RB-4 | 23.36 | 85.62 | 89.84 | |
| 10 | GR | 13.44 | 42.48 | 58.96 |
| GB | 9.77 | 30.88 | 51.88 | |
| RB-4 | 23.26 | 73.52 | 80.56 | |
| 50 | GR | 12.87 | 20.39 | 66.09 |
| GB | −11.34 | −17.97 | 4.42 | |
| RB-4 | 22.54 | 35.71 | −2.26 | |
| RB-8 | 45.07 | 71.40 | 73.74 | |
| LG-50% | 26.27 | 41.62 | 50.27 | |
| LG-100% | 50.90 | 80.64 | 88.93 |
Table 8.
Summary of performances of combination scenarios for precipitation events with different return periods.
Table 8.
Summary of performances of combination scenarios for precipitation events with different return periods.
| Return Period | Scenarios | Volume Reduction Amount (m3) | Volume Reduction Rate (%) | Peak Reduction Rate (%) |
|---|---|---|---|---|
| 1 | GR&RB | 18.46 | 79.58% | 88.01% |
| 5 | GR&RB | 18.46 | 67.68% | 80.13% |
| 10 | GR&RB | 18.23 | 57.62% | 65.18% |
| GR&LG | 27.21 | 85.99% | 91.57% | |
| RB&LG | 29.70 | 93.86% | 96.21% | |
| 50 | GR&RB | 17.35 | 27.49% | 31.95% |
| GR&LG | 20.34 | 32.22% | 42.13% | |
| RB&LG | 23.56 | 37.33% | 14.47% | |
| GR&RB&LG | 30.67 | 48.59% | 67.29% |
Table 9.
Cost-effectiveness of LID scenarios.
| Scenarios | Unit Life Cycle Cost ($) | UAAC ($) | AC ($) | Annual Reduced Volume (m3) | Cost- Efficiency (m3/$) |
|---|---|---|---|---|---|
| GR | 317.1 | 15.86 | 8247.20 | 144.94 | 0.02 |
| GB | 31.72 | 1.59 | 826.80 | 207.63 | 0.25 |
| RB-4 | 350.62 | 17.53 | 210.36 | 191.56 | 0.91 |
| RB-8 | 350.62 | 17.53 | 420.72 | 217.20 | 0.52 |
| LG-25% | 31.72 | 1.59 | 206.70 | 214.38 | 1.04 |
| LG-50% | 31.72 | 1.59 | 413.40 | 217.20 | 0.53 |
| GR&RB | - | - | 4228.78 | 180.60 | 0.04 |
| GR&LG | - | - | 4330.30 | 216.33 | 0.05 |
| RB&LG | - | - | 311.88 | 214.34 | 0.69 |
| GR&RB&LG | - | - | 4435.48 | 217.20 | 0.05 |
Table 10.
Performance of LID practices at the campus scale.
| Scenarios | Volume Reduction Amount (m3) | Volume Reduction Rate (%) | Volume Capture Ratio of Rainfall (%) | Overflow Volume Reduction Rate (%) | Overflow Time Reduction Rate (%) |
|---|---|---|---|---|---|
| NR | 0 | 0 | 55.99 | 0 | 0 |
| GR | 24345 | 20.50 | 65.01 | 43.67 | 57.29 |
| GB | 30908 | 26.02 | 67.44 | 46.22 | 67.35 |
| LG | 36430 | 30.67 | 69.49 | 89.91 | 85.40 |
| RB-4 | 3238 | 2.73 | 57.19 | 42.87 | 36.57 |
| RB-8 | 5276 | 4.44 | 57.95 | 43.91 | 36.44 |
| GR&RB&GB | 44504 | 37.47 | 72.48 | 77.28 | 79.38 |
| GR&RB&LG | 48887 | 41.16 | 74.11 | 98.89 | 94.10 |
© 2020 by the authors. Licensee MDPI, Basel, Switzerland. This article is an open access article distributed under the terms and conditions of the Creative Commons Attribution (CC BY) license (http://creativecommons.org/licenses/by/4.0/).
Share and Cite
MDPI and ACS Style
Zhang, P.; Chen, L.; Hou, X.; Wei, G.; Zhang, X.; Shen, Z. Detailed Quantification of the Reduction Effect of Roof Runoff by Low Impact Development Practices. Water 2020, 12, 795. https://doi.org/10.3390/w12030795
AMA Style
Zhang P, Chen L, Hou X, Wei G, Zhang X, Shen Z. Detailed Quantification of the Reduction Effect of Roof Runoff by Low Impact Development Practices. Water. 2020; 12(3):795. https://doi.org/10.3390/w12030795
Chicago/Turabian StyleZhang, Pu, Lei Chen, Xiaoshu Hou, Guoyuan Wei, Xiaoyue Zhang, and Zhenyao Shen. 2020. "Detailed Quantification of the Reduction Effect of Roof Runoff by Low Impact Development Practices" Water 12, no. 3: 795. https://doi.org/10.3390/w12030795
Note that from the first issue of 2016, this journal uses article numbers instead of page numbers. See further details here.