The Cause and Statistical Analysis of the River Valley Contractions at the Xiluodu Hydropower Station, China


1
School of Earth Sciences and Engineering, Hohai University, Nanjing 210098, China
2
College of Hydrology and Water Resources, Hohai University, Nanjing 210098, China
*
Author to whom correspondence should be addressed.
Water 2020, 12(3), 791; https://doi.org/10.3390/w12030791
Submission received: 2 January 2020
/
Revised: 8 March 2020
/
Accepted: 8 March 2020
/
Published: 12 March 2020
(This article belongs to the Section Hydraulics and Hydrodynamics)
Abstract
:The Xiluodu Dam is a concrete double-curvature arch dam with a crest elevation of 610 m and a height of 285.5 m. Since the impoundment of the Xiluodu reservoir, remarkable river valley contractions (RVCs) have been observed upstream and downstream of the reservoir, potentially threatening the safety of the dam. However, the cause of these RVCs remains unclear. Based on an analysis of hydrogeological conditions, the RVCs were determined a result of the expansion of the aquifer, within which the effective stress decreased due to an increase in the hydraulic head after reservoir impoundment. Referring to the hydrostatic seasonal time (HST) model, a groundwater hydrostatic seasonal (GHS) model is proposed for simulating and predicting the development of the RVCs. Unlike the HST model, the GHS model can provide information on aquifer hydraulic diffusivity. The calibration results illustrate that the GHS model can accurately fit the observed RVCs data. The calculation results revealed that the RVCs were mainly affected by the hydraulic head of the confined aquifer, and that seasonal effects gave rise to less than 10% of the total RVCs. Finally, the development of RVCs were predicted using the GHS model. The prediction results demonstrated that the RVCs of most monitoring lines in the Xiluodu reservoir would gradually approach a convergence condition after 6 February 2021. Until the deadline of the prediction on 1 May 2035, there is still one monitoring line that has not reached a convergence condition (whose RVCs are 157.6 mm, and where the RVC growth rate will decrease to 0.005 mm/d by that time). Considering the large amount of RVCs, we think the safety of the dam requires closer consideration.
1. Introduction
A large number of hydropower stations have been built around the world, and engineering problems that occur in reservoirs have been discussed widely. The land-level changes due to reservoir impoundment have been discussed by numerous researchers [1,2,3,4]. However, river valley contractions (RVCs) are rarely reported, which can directly affect the safety and the operability of a dam [5]. RVCs may occur both upstream and downstream of a reservoir and increase due to the impoundment or operational stage of a hydropower station and continue to grow for several years.
A specific case of RVCs occurred in the Zeuzier arch dam, located in Switzerland. These RVCs were first observed after the hydropower station safely operated for 21 years. The RVCs of the Zeuzier Dam ultimately reached approximately 75 mm, which resulted in up to 15 mm wide cracks forming on the downstream face of the dam [6]. The RVCs at the Zeuzier Dam were confirmed to be caused by the settlements of rock masses, which is induced by the groundwater flows out of the rock masses and into the 400 m deep tunnel nearby [7]. Besides the Zeuzier Dam, RVCs also appear in other hydropower stations. The RVCs that occurred in the Jinping-I Dam during the impoundment stage (approximately 10 mm) were supposedly induced by the shrinkage of the yield surface of the reservoir slope [8]. During the excavation period of the AlpTransit Gotthard railway tunnel, valley contractions or expansions up to 14 mm were detected at a deformation monitored site known as Val Termine, and seasonal variations of the water table were proven to be the reason for this deformation [5].
Drastic RVCs have been observed in the Xiluodu hydropower station since the reservoir impoundment, and the largest RVCs recorded have now exceeded 93 mm (26 April 2019). Moreover, the RVCs are continuously growing, which poses a threat to the safety of the dam. There have been some studies on RVCs of the Xiluodu Dam. The reservoir level and temperature were determined by Liang et al. [9] to have little relation to RVCs; Liang et al. analyzed the correlation between the contract process and some impact factors, such as the reservoir level and temperature, using a stepwise regression model. Zhuang et al. [10] simulated the RVCs with an analytical model and determined that the RVCs are highly correlated with changes to the reservoir level. Two-parameter exponential functions were used to fit the RVC data from 20 December 2012 to 19 May 2017. Then, the development of the RVCs were predicted, and the growth rate was determined to be less than 0.001 mm/d by August 2022 [11]. Some studies view RVCs as local phenomena of landslides [12]. Although landslides can decrease river width, no cracks on slope surfaces have been found at the Xiluodu reservoir, and no sliding surface inside the slope has been observed based on all the plumb-line monitoring data.
RVCs directly threaten the safety of the Xiluodu Dam, so it is particularly important to predict RVC development. However, the main factors that influence RVCs of the Xiluodu hydropower station have not been confirmed; there is currently no theory that can explain RVCs completely, nor can any deformation, statistical, or numerical method simulate RVC phenomena accurately.
The HST (hydrostatic–seasonal–time) model is widely used to analyze and predict the behavior of arch dams [13]. The HST model is a statistical technique for analyzing and modelling the relationship between the variables and deformation of dams and has proven to be an effective method for the safety analysis of concrete dams [14]. However, reports on statistical prediction models related to the RVCs of reservoirs, to the authors’ best knowledge, are rare and incomplete. Referring to the HST model, a groundwater hydrostatic seasonal (GHS) model was proposed for studying and predicting the development of RVCs. Unlike the HST model, which approximates the hydrostatic effect as a polynomial function of the reservoir level h, and the irreversible effect of time as exponential, hyperbolic, or polynomial, in the GHS model, the hydrostatic effect is represented by an increase in the hydraulic head of a confined aquifer. The average increase in the hydraulic head is calculated through a groundwater analytical flow model [15], which can reflect the hydraulic hysteresis effect more accurately than the polynomial function.
In this research, we first provide the background of the Xiluodu hydropower station. The RVCs phenomena that occurred in the Xiluodu reservoir is introduced, and the deformation mechanism is discussed. Secondly, an analytical solution for the hydraulic response of the confined aquifer to fluctuations of reservoir level was produced. Finally, a GHS model was proposed based on a groundwater analytical flow model and the model was applied to interpret the RVCs of the Xiluodu hydropower station.
2. Background of the Engineering
The Xiluodu arch dam is located in the Yongsheng synclinal basin in Yunnan province, China. It is a double-curved arch dam, with a height of 285.5 m and a 610 m crest elevation. The Yongsheng basin is 35 km long in the northeast and 25 km in the northwest, with an area of 750 km2, as shown in Figure 1b. The basin is a wide, gentle, and relatively complete tectonic synclinal basin, which has not been cut by regional faults. In this basin, the direction of the synclinal axial line is northeast, and the dip angle of the northwest wing is 10°–15°, while the southeast wing is 20°–35°.
The stratum of the Yongsheng synclinal basin includes three aquitard formations, namely Silurian shale (S), Upper Permian mudstone (P2βn), and Upper Permian sand-shale (P2x), as well as three aquifer formations, namely Lower Permian Yangxin limestone (P1y), Upper Permian Emeishan basalt (P2β), and Quaternary loose deposits (Q). The aquitard and aquifer formations are adjacent to each other from the bottom to the top, and the contact surface of each formation features disconformity. Because the burial depth of the Silurian shale (S) is more than 500 m, the effect of this layer on the hydropower station was not considered in this paper. With a total thickness of 500 m, the Lower Permian Yangxin limestone formation is continuously buried, except for some of the formation exposed on the edge of the basin and part of the upstream channel. From upstream to downstream, the burial depth of the limestone formation increases gradually to about 90 m beneath the dam foundation. The thickness of the Upper Permian mudstone (P2βn) is generally 2 m (not more than 5 m), and its burial depth is 79–163 m near the dam. The Upper Permian Emeishan basalt formation is widely distributed over the Yongsheng synclinal basin, and its rock is dense and hard. The Upper Permian sand-shale (P2x), which is continuously distributed in the region, forms the non-permeable bottom of the top pore aquifer (the Quaternary loose deposits) and plays an impermeable boundary role in groundwater movement. The geological conditions of the Xiluodu Dam area and the Q–Q’ cross-section of the Yongsheng synclinal basin are shown in Figure 1.
The groundwater evolution in the dam area depends on the hydrogeological conditions of the Yongsheng synclinal basin, which is an independent hydrogeological unit [16]. The Jinsha River crosses the Yongsheng synclinal basin, which is the base level of erosion and the drainage area of groundwater and surface water. In this basin, the Lower Permian Yangxin limestone formation forms a confined aquifer with two aquitards: the Silurian shale (S) on the bottom and the Upper Permian mudstone (P2βn) on the top. Above the Upper Permian mudstone, there is a basalt unconfined aquifer. Between the limestone confined aquifer and the basalt unconfined aquifer, there is a hydraulic head difference of 2 m near the riverbed. Hydrogeological investigations revealed some characteristics of the limestone confined aquifer, such as a large circulation depth, a long cycle route, and high salinity and temperature. The limestone confined aquifer receives rainfall recharge in outcropping regions at elevations about 2000 m. The limestone confined aquifer discharges at the bottom of the Jinsha River and numerous small overflow springs along the valley floor (at a 370 m to 400 m elevation above sea level; Figure 1b). The basalt unconfined aquifer is recharged by rainfall at the edge of the basin and is discharged by springs in the Jinsha River. Due to the retardation of the Upper Permian sand-shale (P2x) above the Upper Permian Emeishan basalt formation, the rainfall has difficulty infiltrating into the basalt layer, so the phreatic surface in the basalt layer is minimal. Figure 1b,c illustrate regional groundwater flow in the Yongsheng basin.
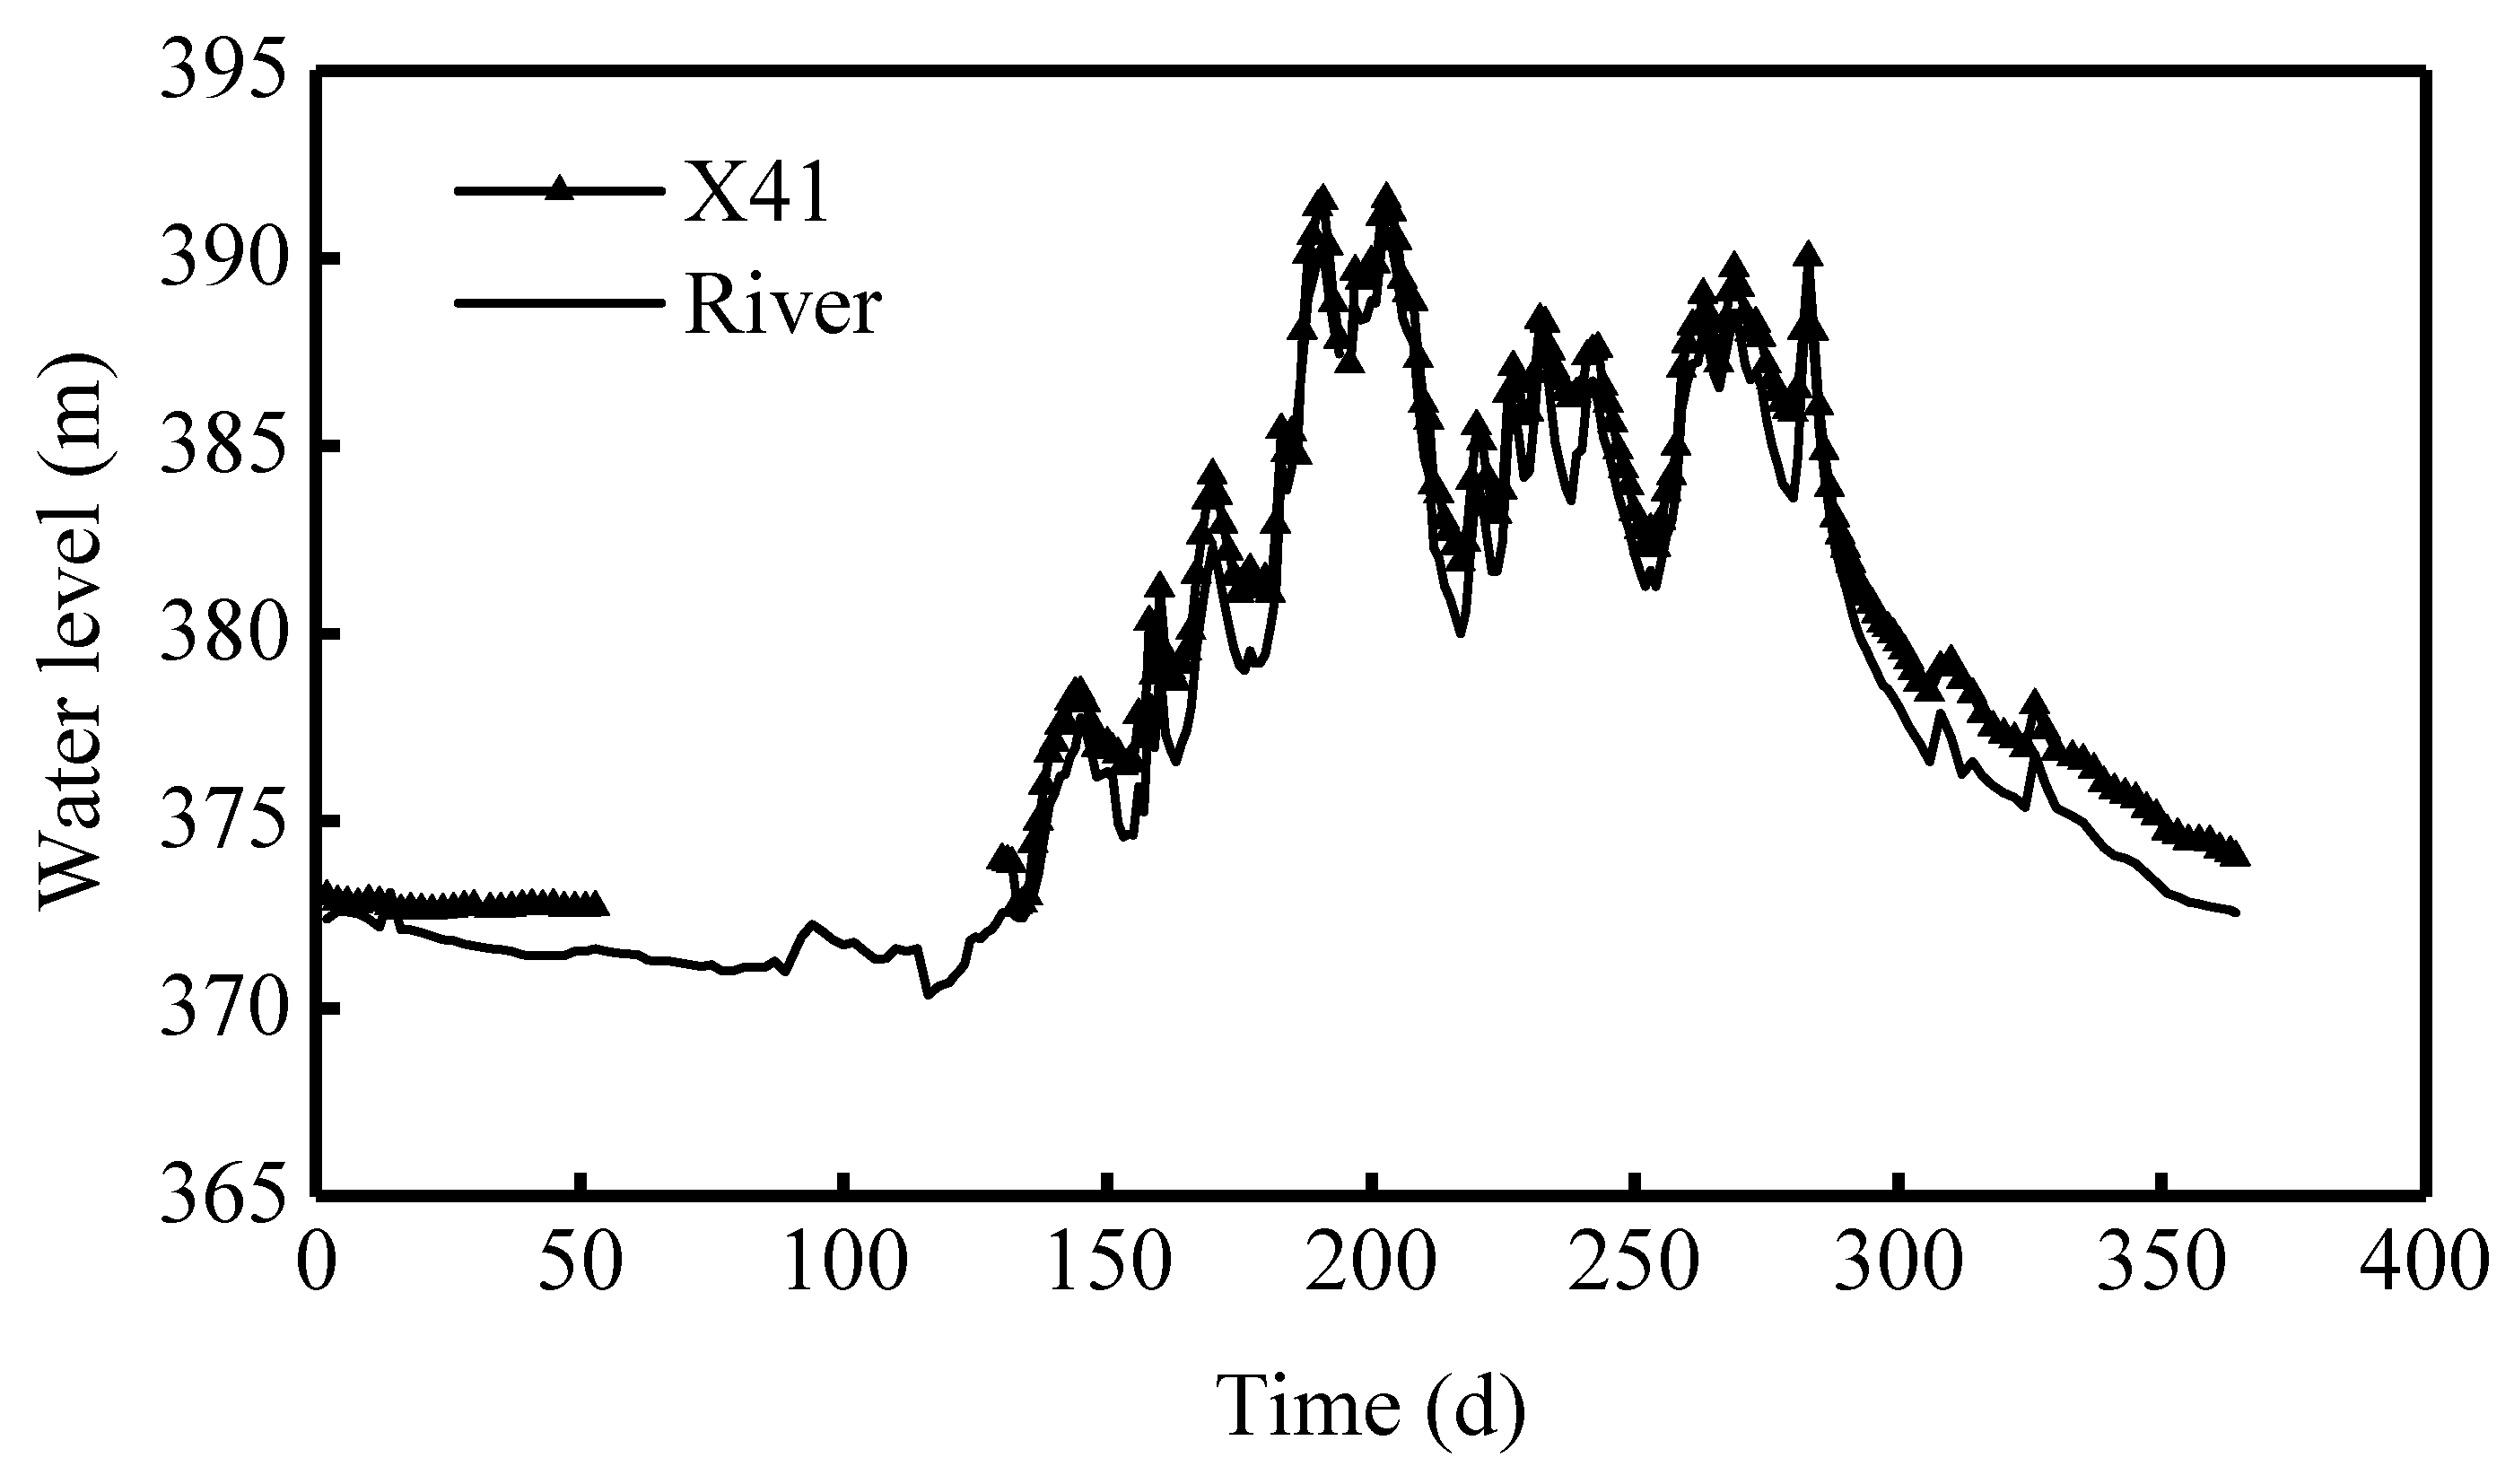
A hydrogeological survey revealed the close relationship between surface and groundwater. Before the construction of the hydropower project, many wells were used to monitor the groundwater level in the basin. Well X41 is located on the right bank of the river, 142 m from the river. The confined aquifer hydraulic head began to be monitored on 2 January 1995 (Figure 2). The fluctuation of the hydraulic head in well X41 shows that the confined aquifer has good synchronization with the rise and fall of the river water level (Figure 2). The synchronization of the well and river water level indicates that the limestone confined aquifer has large hydraulic diffusivity, and the storage space of the limestone rock mass is limited.
3. RVCs of the Xiluodu Dam
Before the construction of the Xiluodu Dam, the river level fluctuated between 370 m and 400 m in a single year. The water impoundment of the reservoir began in November 2012; then, the water level increased from 403.5 m and reached a normal water level of 600 m for the first time on 29 September 2014. During normal operation of the hydropower station, the reservoir level ranged from 550 m to 600 m, giving a maximum fluctuation of 50 m. Nine valley deformation monitoring lines were situated at the Xiluodu hydropower station to measure changes in valley width. Four of the lines are located upstream of the reservoir (namely, VD01, VD02, VD03, and VD04), while the other four are located downstream (namely, VD05, VD06, VD07, and VD08). Further, one is located at the top of the dam crest (VD09). The layout of each monitoring line is shown in Figure 3.
Most valley deformation monitoring lines began in December 2012, except for VD09, VD08, and VD04, which began in January 2016, July 2014, and May 2013, respectively. The VD08 monitoring line is arranged inside the drainage tunnel at a 561 m elevation (about 150 m deep into the rock mass). Observations of all nine monitoring lines reveal that the RVCs occurred in a large area upstream and downstream of the reservoir (Figure 4), and their cumulative deformation is −22.47 mm to about −93.47 mm (26 April 2019). The (+) signs indicate the expansion of the river valley and (−) indicates the contraction of the river valley. The two main characteristics of the RVCs are summarized as follows: (1) the amount of the RVCs is very large; and (2) the amount of RVCs is approximately equal for different monitoring sites and different monitoring elevations.
Since the impoundment, the Xiluodu reservoir has experienced five complete periods of water storage and release. The RVCs of the Xiluodu reservoir grow continually. There are many studies on the mechanisms of the RVCs [11,17,18]. However, none of these studies can explain the contraction phenomenon completely. We infer that the RVCs are induced by the reservoir impoundment based on the development of RVCs and the hydrogeological conditions of the Xiluodu reservoir. During the period of reservoir impoundment, the hydraulic head increased and the effective stress decreased in the limestone confined aquifer, leading to the expansion of the limestone formation. Under the special tectonic structures of the Yongsheng basin, the formations at the two river banks inclined toward the Jinsha River (Figure 1c), and the expansion lead to the bank slope riverward deformation. Three conditions enhance the RVCs of the Xiluodu reservoir: The confined aquifer buried in the basin forms an expansion formation. The sharp increase in the hydraulic head of the confined aquifer after impoundment led to a sharp expansion of the limestone formation. The close hydraulic relationship between the surface water and groundwater led to a rapid rise of the hydraulic head in the confined aquifer. It can thus be concluded that the hydrogeological conditions at Xiluodu were particularly amenable to the RVCs phenomena.
Overall, the impoundment of the reservoir is the main factor that triggered the RVCs. In the forthcoming subsections, we will build a model to calculate the hydraulic head changes of the Yangxin limestone confined aquifer.
4. Hydraulic Response of the Confined Aquifer
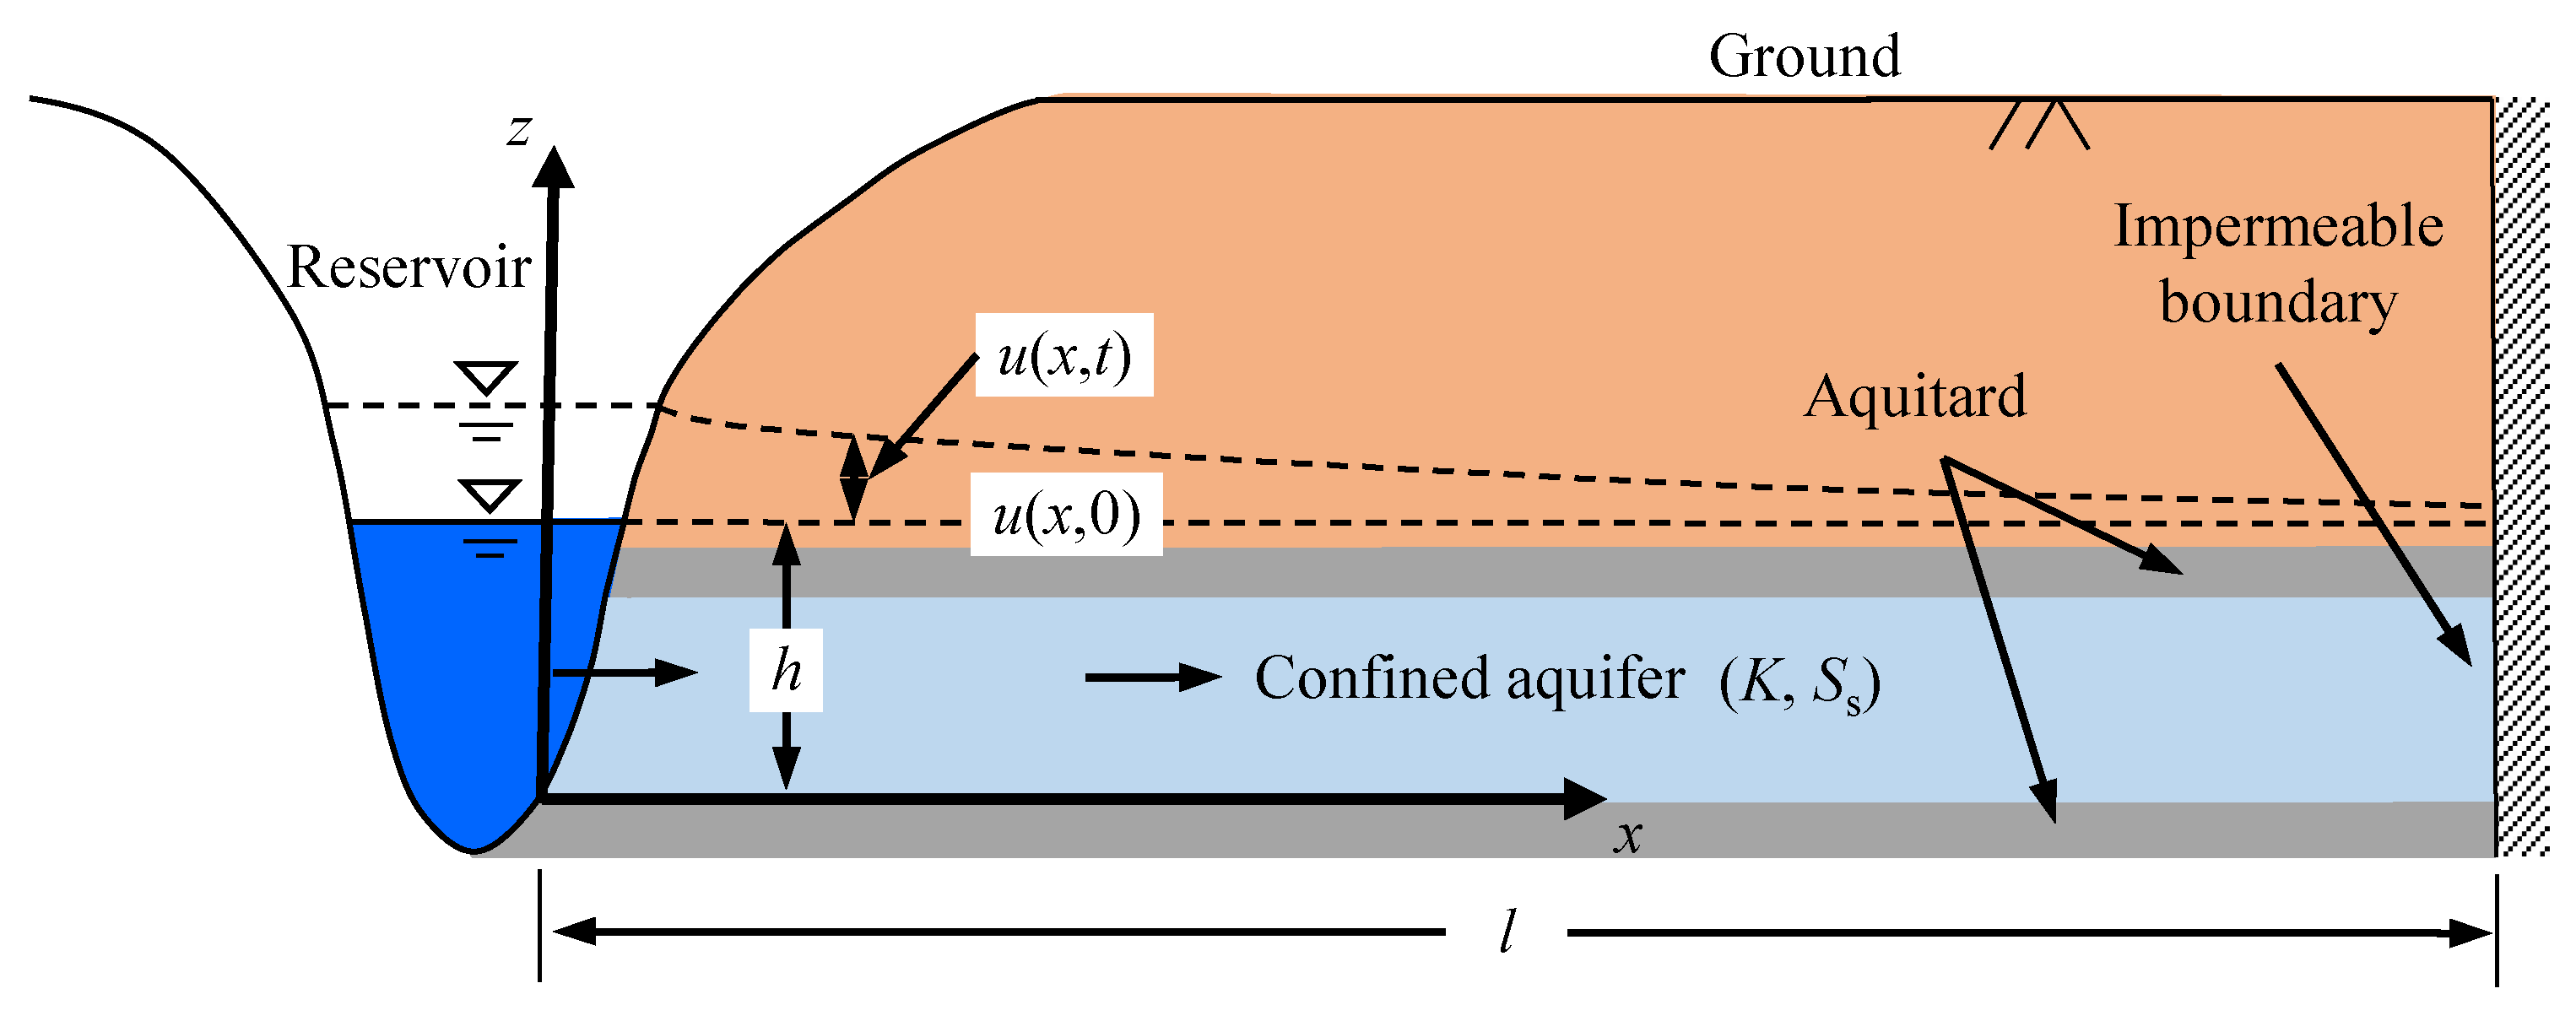
Long-term well data reveal that the groundwater level has a significant correlation with the river level. A one-dimensional confined aquifer model was established to describe the progress of the hydraulic transfer between the Jinsha River and the bank slope. Unlike the traditional model, which approximates river level changes as instantaneous changes that then remain constant or experience periodic fluctuations, we use a piecewise linear function to describe the river-level changes accurately. As shown in Figure 1c, the limestone formation rises sharply at the edge of the basin, and the other boundary condition of the model can be set as the impermeable boundary. The hydraulic response of the one-dimensional limestone confined aquifer to the change in the reservoir water level is shown in Figure 5.
In order to build the model, we make several simplifying assumptions: (1) We consider the confined aquifer to be homogeneous, isotropic, and with a uniform thickness, as well as with a horizontal extension length l; (2) we consider the aquifer as slightly compressible and bounded by the impermeable layer below and above; (3) we consider the hydraulic properties of the confined aquifer to be constant over time; (4) one boundary of the confined aquifer is impermeable, and the other boundary is the dynamic river water level; and (5) under natural conditions, the hydraulic head of the confined aquifer is equal to the river water level.
One dimensional, horizontal groundwater flow in a confined aquifer can be described as
subject to the following initial and boundary conditions:
where u(x, t) represents the variation of the hydraulic head in the confined aquifer at x and time t in the ith time period; a = K/Ss is the hydraulic diffusivity; K is the hydraulic conductivity; Ss is the specific storage; βi is the change rate of reservoir water level in the ith time period; ti is the ith time node; and t0 = 0. Zhuang et al. [19] have provided an analytical solution to the boundary value problem, as shown in Equations (1) to (4), by using the method of separating variables:
where
Since different hydraulic responses occur at different locations in the aquifer, we consider the average hydraulic response of the aquifer. The hydraulic head u was integrated and then divided by the horizontal extension length l [20]. The analytical solution of the average hydraulic response of the confined aquifer is shown below:
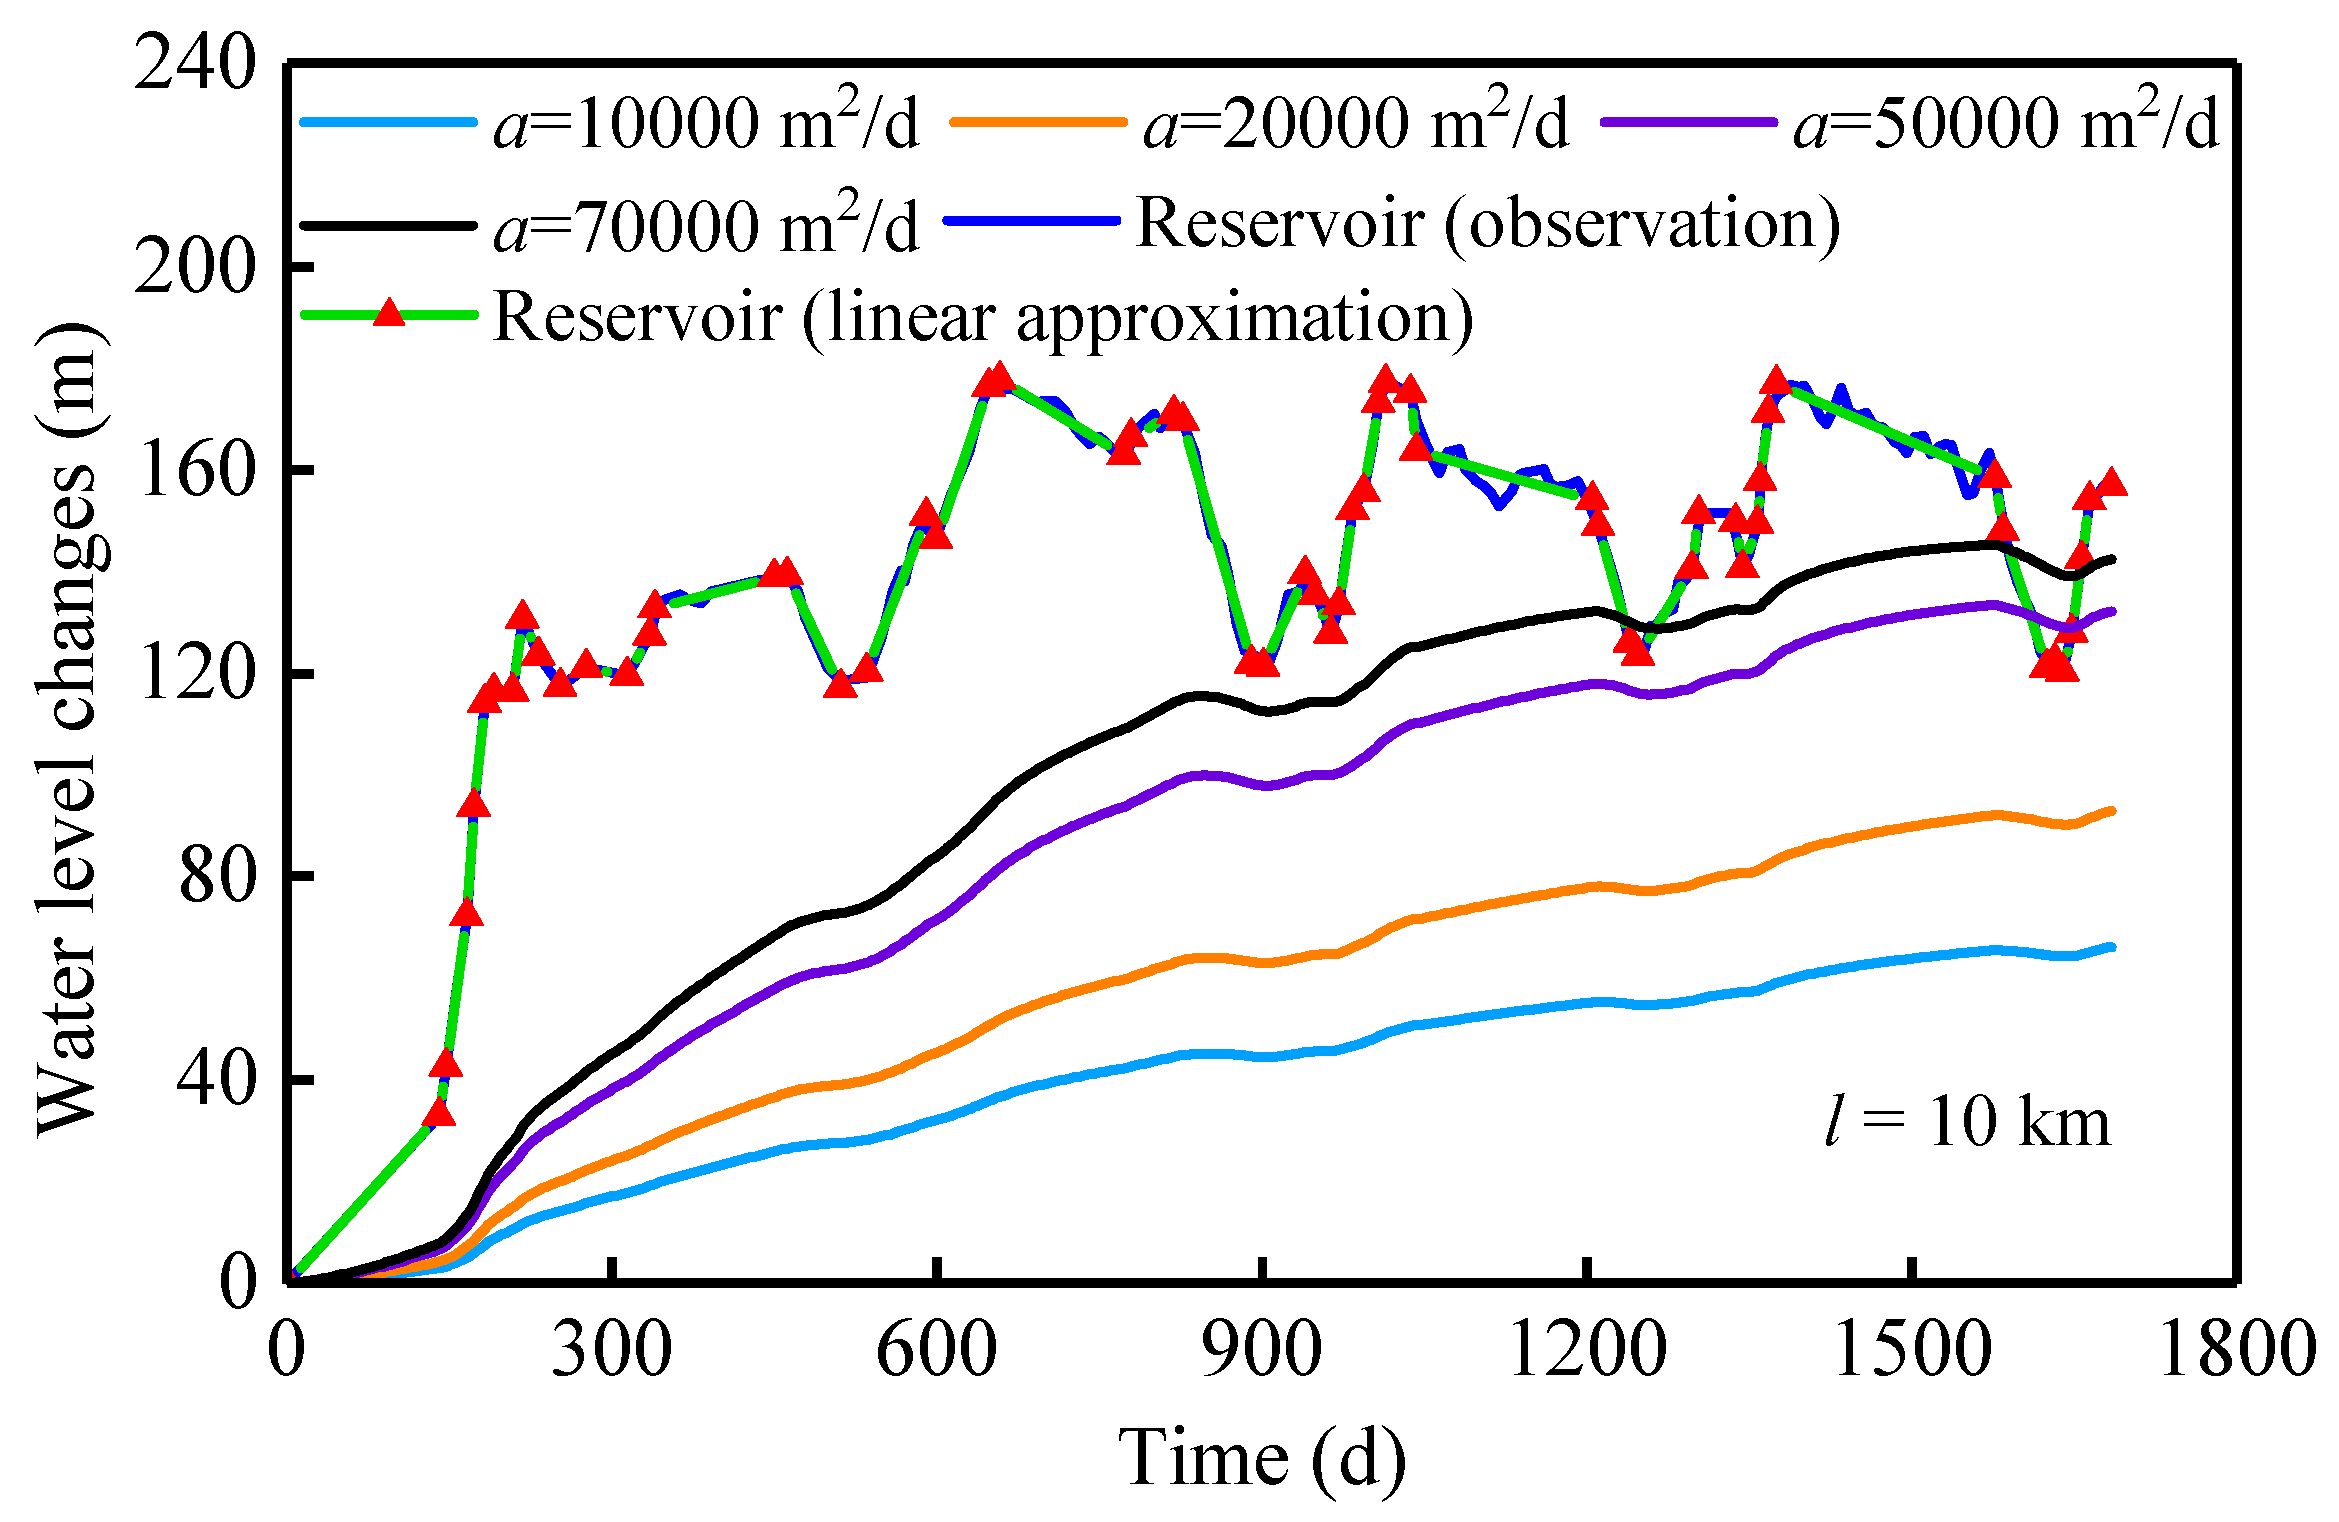
Based on Equation (7), the increase in the confined aquifer hydraulic head can be calculated easily. Taking 20 November 2012 as the initial time and 31 July 2017 as the end time of the research period, the fluctuating water level of the Xiluodu reservoir was fitted with 59 consecutive linear segments, as shown in Figure 6. Assuming that the extended length of the confined aquifer is 10 km, the hydraulic diffusivity is 10,000, 20,000, 50,000, and 70,000 m2/d, respectively, and the average increase in the hydraulic head of the confined aquifer can be calculated using Equation (7), as shown in Figure 6. The calculation results reveal that (1) the average hydraulic head increases with time in the confined aquifer; (2) hydraulic diffusivity has an influence on the increased rate of the average hydraulic head. With a large hydraulic diffusivity, the average hydraulic head increases rapidly and enters a relatively stable stage quickly; and (3) a change in the reservoir water level determines the change of the hydraulic head of the confined aquifer. The average increase in the hydraulic head will approximate the mean value of the reservoir water level increase.
5. HST Model and GHS Model
5.1. The Conventional HST Model for Dam Behavior
The HST (hydrostatic–seasonal–time) model is a statistical model widely used to forecast dam behavior and has the following basic forms [21,22]:
where is the observed deformation, , , and represent the effects of hydrostatic load, seasonality, and time, respectively; is the model error; h the reservoir level; s = 2πd/365; and d represents the number of days since the beginning of the year (January 1), while t is the number of days since the beginning of the analysis [23].
The HST model contains three main parameters: the reservoir level h, the seasonal parameter s, and the time parameter t. Although the HST model has been widely used to analyze the behaviors of dams, this model’s coefficients cannot furnish any relevant information about the dam [24]. In this study, a GHS model was proposed to simulate the process of the RVCs, and the hydraulic head of the confined aquifer and the seasonal parameter s were set as parameters of the model. The improvement of the GHS model is that it establishes the relationship between the model parameters and the aquifer parameters. The hydraulic diffusivity and extension length of the confined aquifer can be obtained using the GHS model’s coefficients.
In the HST model, the increase in the reservoir level will cause the arch dam to move downstream [13]. However, the increase in the reservoir water level does not induce an expansion of the river valley in the Xiluodu reservoir, which means that the dam deformation and the RVCs have different physical mechanisms. Therefore, the HST model is not suitable for studying the RVCs. To calculate the RVCs, the GHS model was established. The increasing reservoir level induced a dramatic increase in the hydraulic head of the confined aquifer, and then led to the RVCs. Consequently, an increase in the hydraulic head was used to represent the hydrostatic effects in the GHS model. Since the bank slope is exposed to seasonal environmental changes, the seasonal effects were added to the GHS model, and it is represented by two sinusoidal functions. In the HST model, the effects of time is mainly related to the dam, including the initial adjustment of the dam and its foundation, the dissipation of the head of hydration, and other effects that may jeopardize structural integrity [14]. Because the bank slope is in a stable state and has been formed over thousands of years, the effects of time will not be considered in the GHS model. Compared with the HST model, the biggest difference of the GHS model is that the hydraulic head of the confined aquifer is used to represent the hydrostatic effects.
5.2. The GHS Model for RVCs
The factors that influence valley contractions include the reservoir water level, the aquifer hydraulic head, temperature, precipitation, tectonic stress, landform, the altitude of the formation, and the mechanical properties of the rock mass. Considering the hydrogeological conditions of the Xiluodu reservoir, we believe that the hydraulic head increase in the confined aquifer is the main reason behind RVCs, although the temperature and precipitation also have some effects. Referring to the HST model, a groundwater hydrostatic season (GHS) model was proposed to analyze and predict the development of RVCs, as follows:
where is the recorded deformation; the hydrostatic term is induced by an increase in the hydraulic head of the confined aquifer; the seasonal term is induced by the temperature and precipitation; b1, b2, b3, b4, and b5 are the coefficients, and they will be estimated through the inversion program; is the average change in the hydraulic head over the whole range of the confined aquifer length, which can be calculated using Equation (7), where b2 = a/10,000, a is the hydraulic diffusivity; b3 = l/1000; l is the length of the aquifer; and t is the number of days since the beginning of the observation; and s = 2πd/365, d is the number of days between the beginning of the year (January 1) and the date of the observation (0 ≤ d ≤ 365).
5.3. Parameter Settings of the GHS Model
Considering the differences in the hydrogeological conditions of each monitoring line, we assume that the regression model GHS is variable for different lines. The unknown parameters of the GHS model can be estimated using the MCMC (Markov chain Monte Carlo) algorithm [25]. During the estimation, the initial parameters of b1 to b5 are taken as (−1, 2, 10, 1, 1), and the parameter range is (−5, 5), (1, 10), (1, 15), (−10, 10), and (−10, 10), respectively. The coefficients b2 and b3 cannot be negative values, as their physical meanings relate to hydraulic diffusivity and the length of the aquifer.
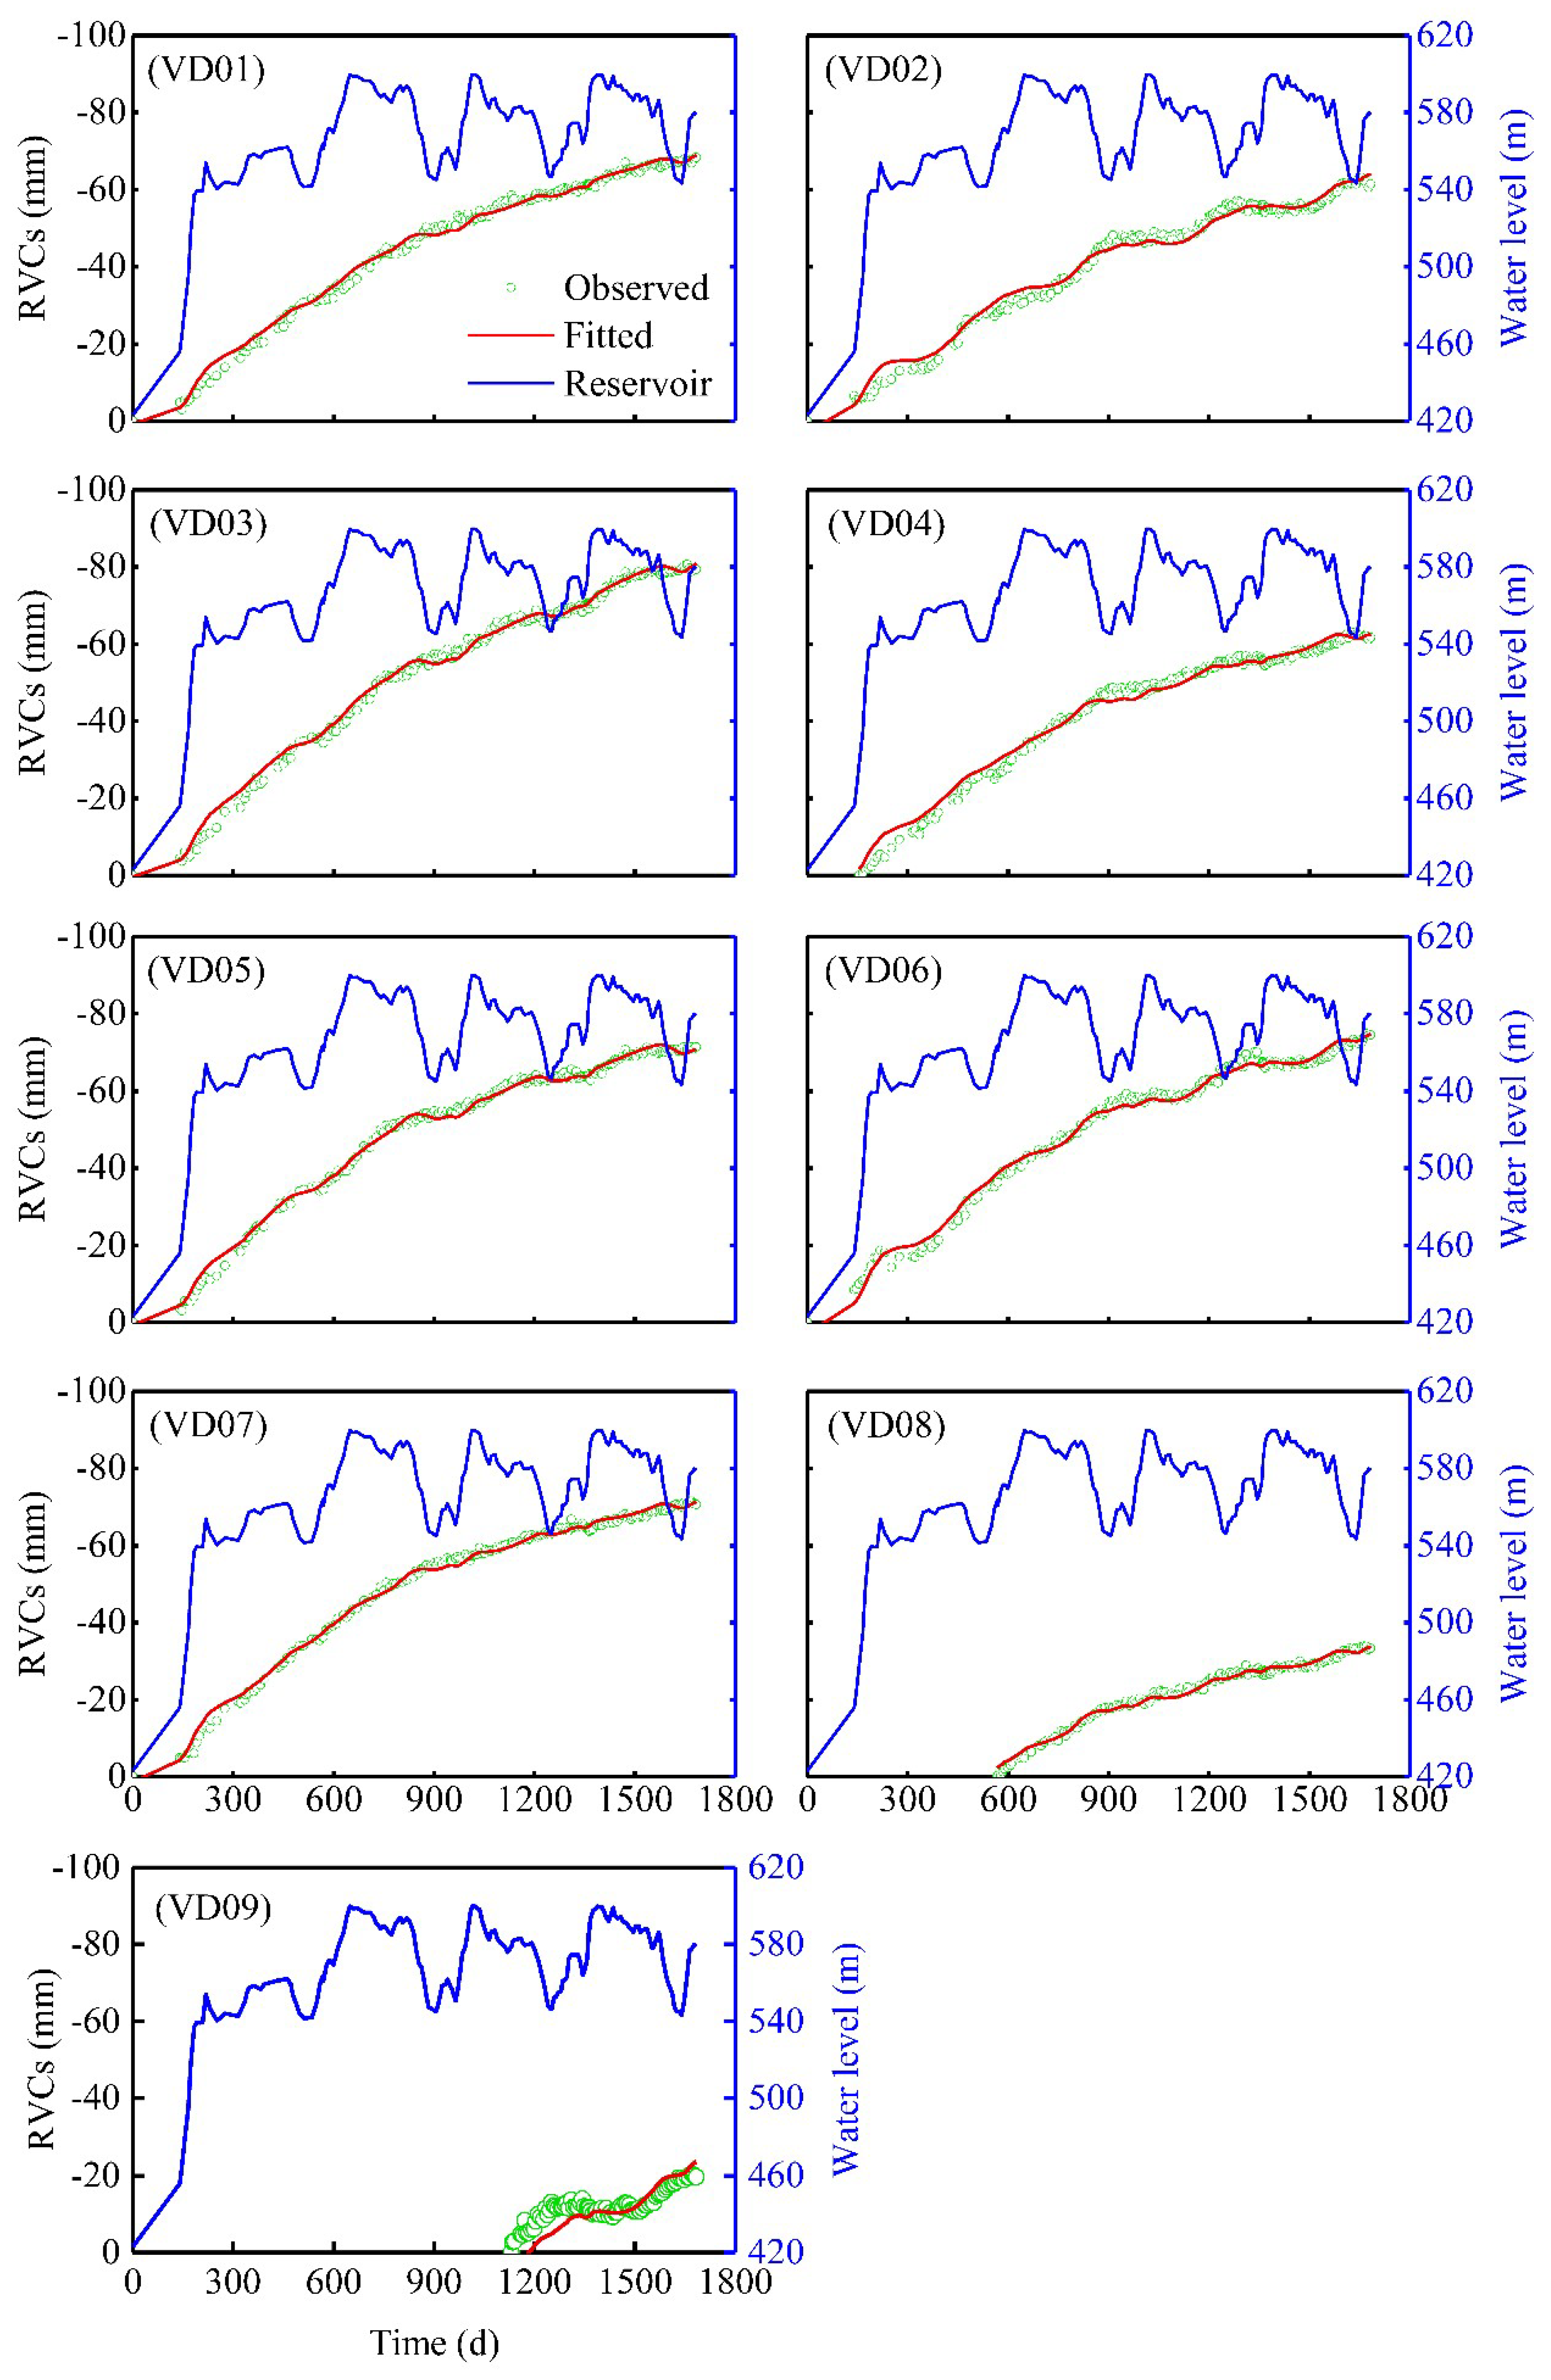
In this study, the observation data from 20 November 2012 to 31 July 2017 (191 observations) are used to estimate the GHS model. The final regression coefficients of b1, b2, b3, b4, and b5, and the 95% confidence interval of each coefficient, are shown in Table 1. The results of the estimation for the GHS model for all monitoring lines are shown in Figure 7. The mean squared error (MSE) is used to estimate the accuracy of the GHS model, which can be calculated as follows:
where N is the total number of the observation data, is the data of the nth observation, and is the data of the nth calculated value.
6. Results
6.1. Estimation Results of the GHS Model
The proposed GHS model is estimated using the MCMC algorithm. The low MSE value of the monitoring lines indicates that the GHS model can fit all lines very well except for VD09, as shown in Table 1. Moreover, the minimal differences between the coefficients for different lines reveal that the hydrogeological conditions and the deformation mechanisms of these lines are similar. It can be concluded that the coefficients of all lines are stable and reliable since their confidence intervals are short and the MCMC chain is steady for all coefficients.
The coefficient b1 reveals the linear relationship between the hydraulic head of the confined aquifer and the RVCs, whose physical meaning contains, but is not limited to, the Young modulus and geometrical factors of the confined aquifer. According to the estimated values of b2 and b3, the characteristics of the confined aquifer can be calculated. The hydraulic diffusivity is about 28,000 m2/d, and the extension length of the aquifer is about 8700 m, according to the inversion results of VD01–VD07. Equations (13) and (14) quantitatively describe the effect degree of the water level and the seasonality on the RVCs. Table 1 reveals that all the hydrostatic coefficients are negative. According to sign conventions, here, a negative sign indicates that increasing hydraulic head increases the RVCs.
In order to discuss the influences of the hydraulic head and the seasonality on the RVCs, here we will investigate the fluctuations of the hydrostatic effects and seasonal effects in Equation (12). The seasonal effects are represented by the ratio of the seasonal term () to the total RVCs (), as shown in Figure 8. Considering that temperature and rainfall have the same seasonal characteristics, we know that the mean temperature is higher in the rainy season and lower in the dry season. The temperature curve is similar to the rainfall curve and it can be used to analyze the effect of seasonality on the RVCs. The ratio curves change synchronously with the air temperature curve, which means that a higher temperature and a higher rainfall increase the RVCs. High temperature and high rainfall cause riverward expansion of the bank slope rock mass, resulting in an increase in the RVCs, and vice versa. The calculation results show that the hydrostatic effects on the RVCs are larger than those of seasonality, as seasonality produces only a 3 mm fluctuation in the RVCs. With the development of the RVCs, the seasonal effects ratio decreased gradually, ultimately reaching less than 10% (June 2017). Due to the poor performance of the model for VD09, the results of the seasonal effects were not plotted in Figure 8. The VD09 line will be discussed in the next section.
6.2. Predication of the RVCs
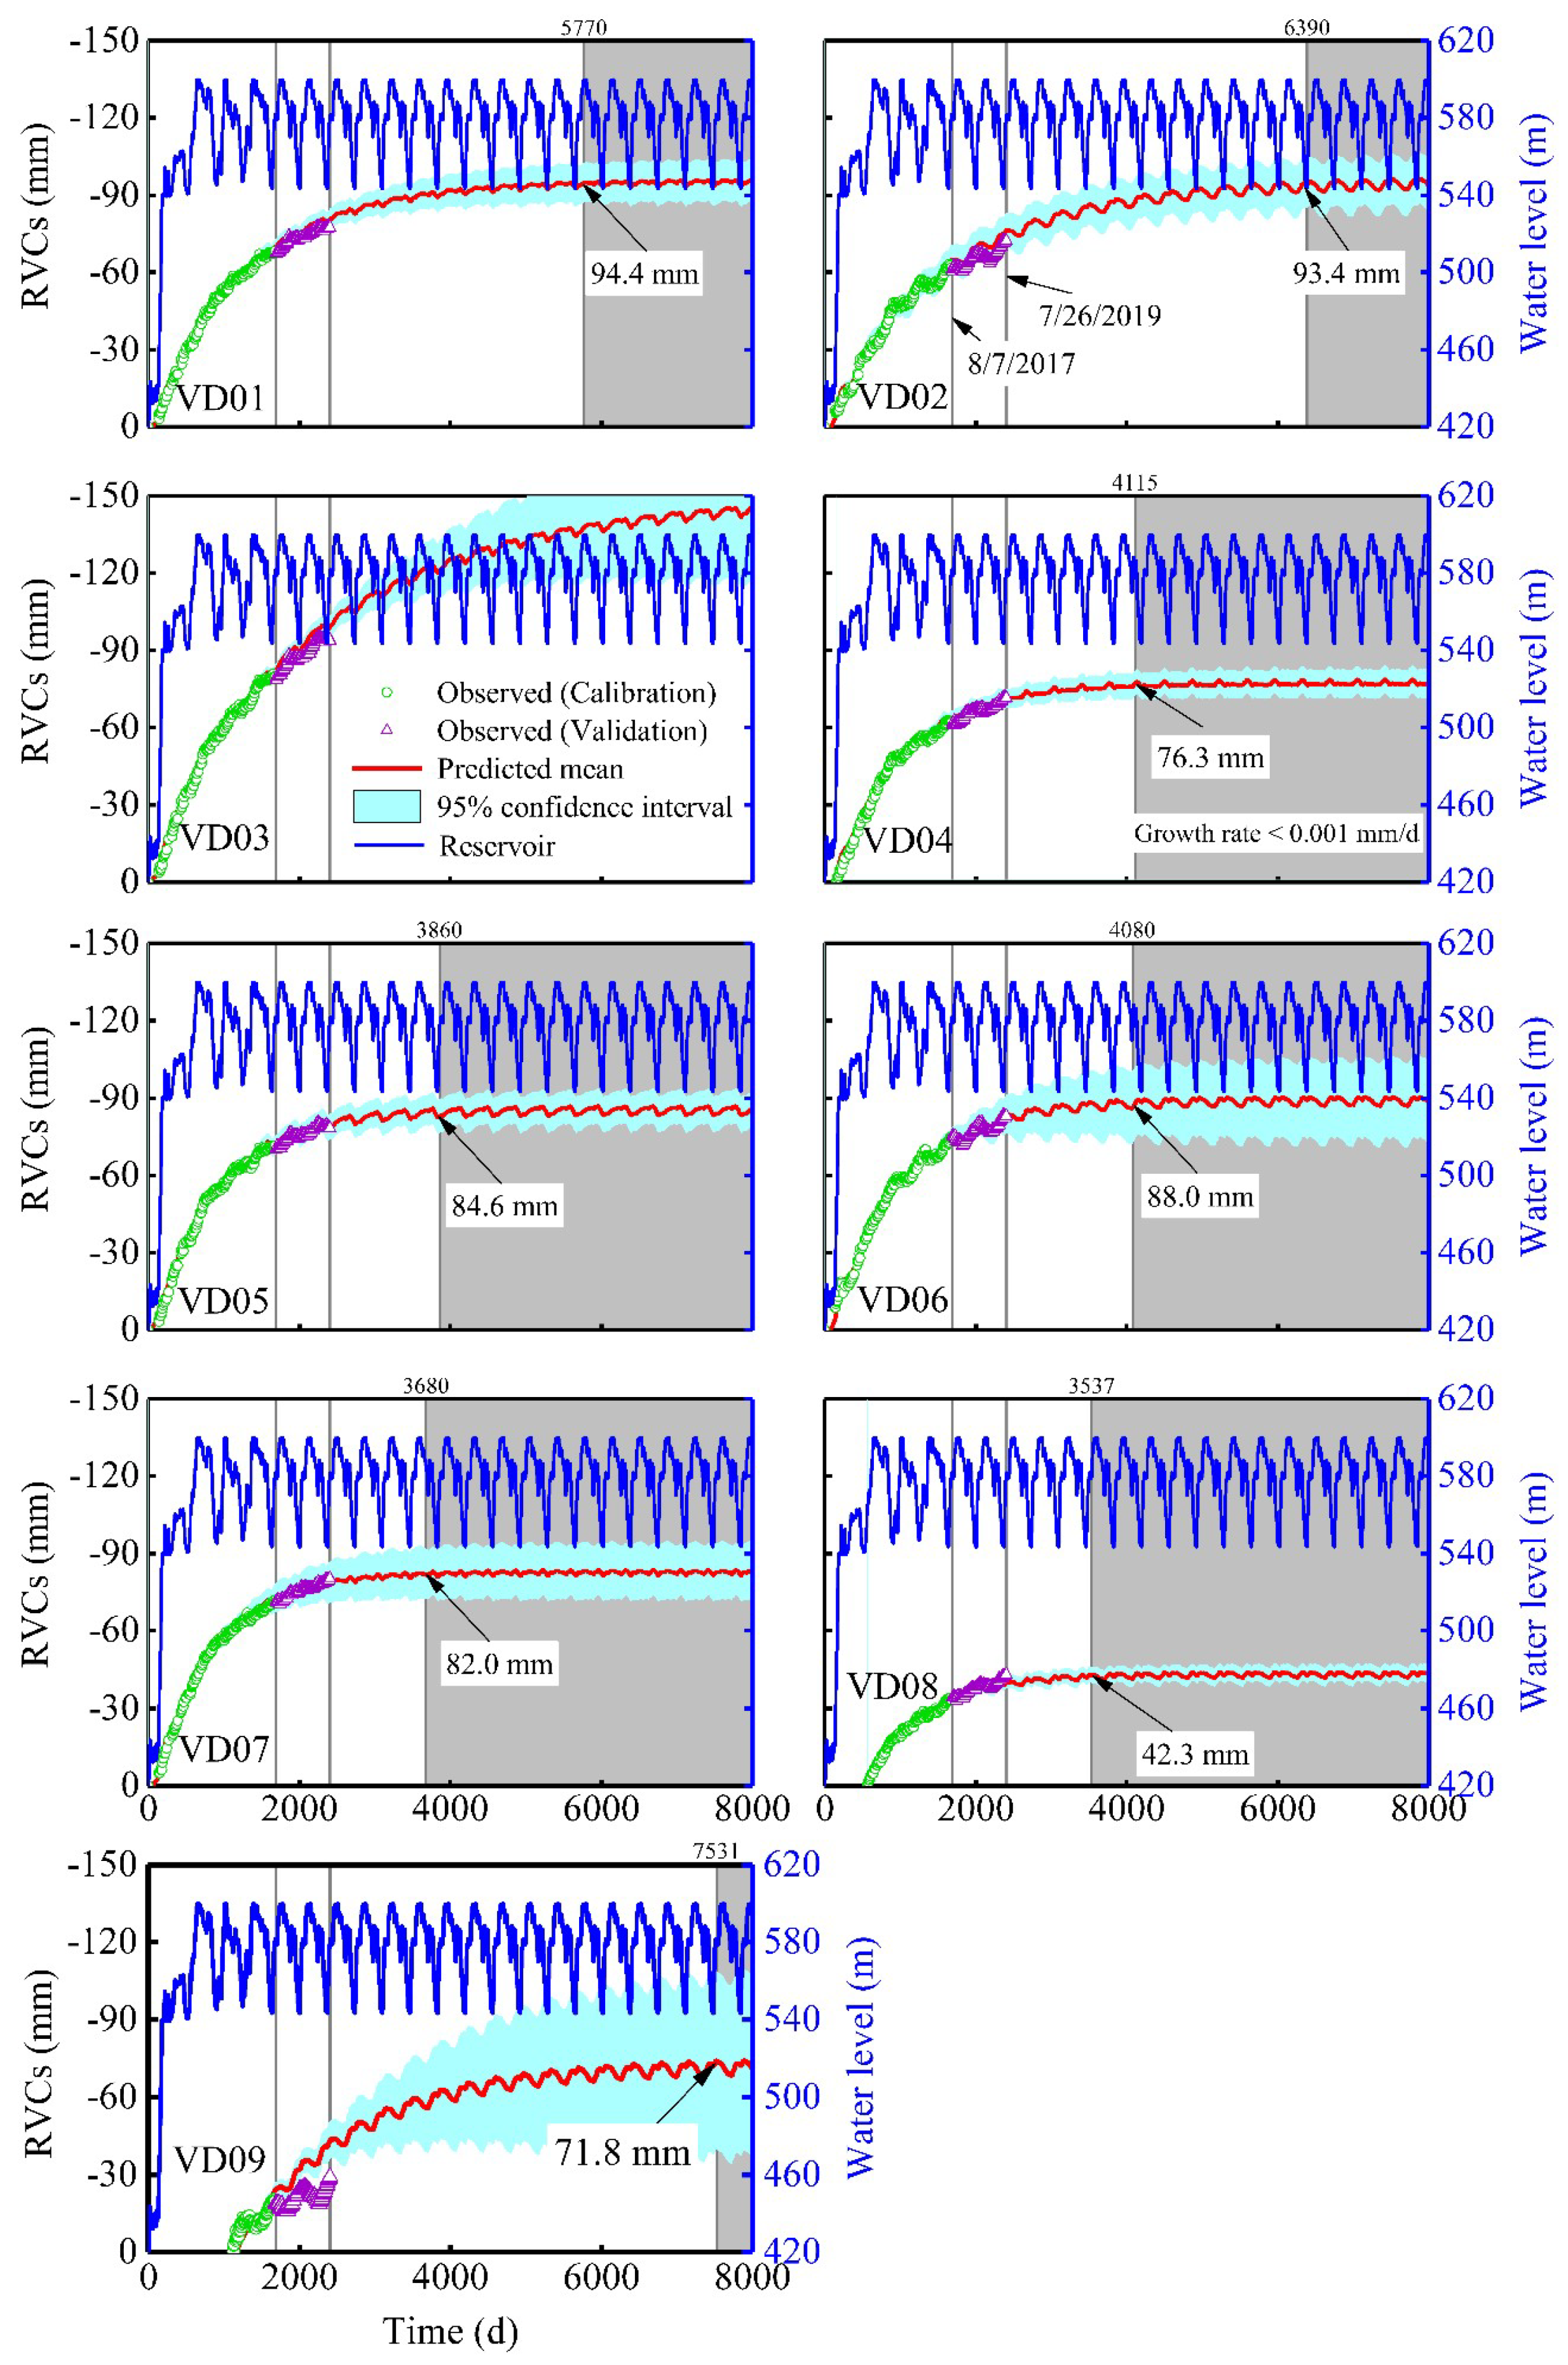
The development of the RVCs poses a direct threat to the Xiluodu Dam and should be carefully predicted. According to the estimated coefficients shown in Table 1, as well as the covariance matrix, the development of the RVCs can be predicted using the “nlpredci.m” (nonlinear regression prediction confidence intervals) function in the MATLAB software. In order to calculate the increase in the hydraulic head of the confined aquifer, it is assumed that the periodic characteristics of the reservoir level are the same as those of the last year, as shown in Figure 9. Then, the fluctuating reservoir level was fitted by 535 consecutive linear segments. The prediction period of RVCs starts from 20 November 2012 to 1 May 2035 (8160 days in total). The observation data from 7 August 2017 to 26 July 2019 (115 observations) were used to validate the performance of the GHS model. The predicted mean value of the RVCs and its 95% confidence interval were calculated and shown in Figure 9. The validation results show that the GHS model can accurately predict the development of RVCs for all lines except VD09.
Figure 9 shows that the RVCs are currently entering a period of slow growth. When the growth rate of the RVCs are less than 0.001 mm/d, the RVCs are considered to have achieved convergence [11]. Considering the fluctuation of the predicted mean value of the RVCs, we use the polynomial function to fit it to obtain the convergence time and value. The calculation result shows that all lines will reach convergence one after another after 6 February 2021, as shown in Figure 9. The VD08 line has the smallest convergence value, −42.3 mm, and its convergence time is 6 February 2021. The VD01 line will reach its maximum convergence value of −94.4 on 7 October 2028. Until the deadline of prediction (1 May 2035), the VD03 line (whose RVCs increases to −157.6 mm and whose growth rate decreases to 0.005 mm/d by that date) will not achieve a convergence condition. Considering the large value of the RVCs, we think the safety of the dam needs to be more carefully considered.
The development of VD09 should be carefully predicted using the GHS model, because VD09 is located on the dam axis line (Figure 3), and the arch dam is an obstacle to the RVCs growth. The monitoring data indicate that the force of the dam increased during the RVCs process. Thus, the GHS model does not fit the VD09 line very well.
In engineering practice, to provide more accurate predictions, newly observed data should be constantly added to the calibration of the GHS model to shorten the prediction period. Although the proposed GHS model is adequate for predicting the development of the RVCs, this model could be improved. The GHS model simplifies the hydrogeological conditions of the Xiluodu Dam, including (1) the distribution of the Lower Permian Yangxin limestone confined layer (simplified as horizontal); and (2) the hydraulic conductivity of the limestone was simplified as homogeneous. In order to increase the reliability of the model, future work should accurately describe the hydrogeological conditions of the area, and an elaborated model should be adopted to calculate the hydraulic response of the limestone aquifer to river-level changes.
7. Discussion
Some regression models have been established to interpret the RVCs of the Xiluodu hydropower station [10,11,21]. Liang [21], for example, added the hydraulic hysteresis effects to the HST model and studied the RVCs. He pointed out that it is necessary to consider the hydraulic hysteresis effect in the regression model. Liang supposed that the reservoir water level and temperature have little relationship with the RVCs. However, Liang used the reservoir water level at three specific time points (30, 60, and 90 days before calculation time) to reflect the hydraulic hysteresis effects, which is a very rough calculation. We proposed a GHS model and interpreted the RVCs. In the GHS model, the hydrostatic effect is calculated using a groundwater analytical flow model, which can accurately reflect the hydraulic hysteresis effects.
Our calculation results demonstrate that the increase in the hydraulic head of confined aquifer is the main cause of the RVCs, and that seasonal effects gave rise to less than 10% of the RVCs. These findings extend those of Liang, confirming that the reservoir water level affects the hydraulic head of the confined aquifer through hydraulic transfer, and the increase in the hydraulic head induced the RVCs. In addition, the proposed GHS model describes the RVCs with the aquifer parameters, which can be used to calculate the hydraulic diffusivity of the confined aquifer. This study indicates that the RVCs may occur in a wider range both sides of the river than the monitoring results, and the hydraulic transfer is the key factor affecting the RVCs. Our results reveal the main causes of the RVCs and predict its final amount, which provides a reference for engineering measures to protect the safety of the dam. However, some limitations are worth noting. Although our GHS model can simulate RVCs, the groundwater analytical flow model is simple, and it deviates from the real one. Future work should, therefore, adopt a more accurate groundwater analytical flow model. The physical mechanism of the RVCs caused by the increase in the hydraulic head of the confined aquifer needs to be further studied.
8. Conclusions
RVCs (river valley contractions) are rare phenomena that directly threaten the safety of the Xiluodu Dam, so it is particularly important to predict RVCs development. However, the main factors influencing the RVCs of the Xiluodu hydropower station have not been confirmed, nor can any theories completely explain RVC phenomena. Likewise, no statistical or numerical methods can simulate RVC phenomena accurately.
In this paper, we have presented a statistical study of the RVCs of the Xiluodu hydropower station. A novel model has been introduced to analyze the RVC phenomena. We found that the reservoir water level is closely related to RVCs. We infer that the RVCs of the Xiluodu Dam were developed through the expansion of the limestone confined aquifer. The main reason for this limestone expansion is the decrease in effective stress following the hydraulic head increase after the impoundment of the reservoir. Under specific syncline basin geological conditions, the expansion of the limestone formation induced the RVC phenomena. It can be concluded that the hydrogeological conditions at the Xiluodu Dam are particularly prone to RVC phenomena. The study of RVCs shows that the proposed GHS model can accurately reproduce the RVC process and predict its development. Therefore, the proposed GHS model can be applied to analyze the RVC phenomena that occur in similar reservoirs.
Author Contributions
Conceptualization, Z.Z.; methodology, C.Z.; software, C.Z.; validation M.L.; formal analysis, Z.Z.; investigation, M.L.; resources, Z.Z.; data curation, M.L.; writing—original draft preparation, M.L.; writing—review and editing, Z.Z., C.Z., Y.X., M.C. and J.W.; visualization, M.L.; supervision, Z.Z.; All authors have read and agreed to published version of the manuscript.
Funding
This work was supported by the Major Research Program of the National Natural Science Foundation of China (Grant No. 91747204), the National Natural Science Foundation of China (Grant No. 41902244), and the China Three Gorges Corporation (No. 20188019316).
Conflicts of Interest
The authors declare that they have no conflicts of interest.
References
- Kaufmann, G.; Amelung, F. Reservoir-induced deformation and continental rheology in vicinity of Lake Mead, Nevada. J. Geophys. Res. Solid Earth 2000, 105, 16341–16358. [Google Scholar] [CrossRef]
- Wang, H. Surface vertical displacements and level plane changes in the front reservoir area caused by filling the Three Gorges Reservoir. J. Geophys. Res. Solid Earth 2000, 105, 13211–13220. [Google Scholar] [CrossRef]
- Gahalaut, V.; Yadav, R.K.; Sreejith, K.; Gahalaut, K.; Bürgmann, R.; Agrawal, R.; Sati, S.; Bansal, A. InSAR and GPS measurements of crustal deformation due to seasonal loading of Tehri reservoir in Garhwal Himalaya, India. Geophys. J. Int. 2017, 209, 425–433. [Google Scholar] [CrossRef]
- Schleiss, A.J.; Franca, M.J.; Juez, C.; De Cesare, G. Reservoir sedimentation. J. Hydraul. Res. 2016, 54, 595–614. [Google Scholar] [CrossRef]
- El Tani, M.; Bremen, R. Val Termine cyclic deformation due to seasonal variation of water table. In Proceedings of the Golden Rocks 2006, The 41st US Symposium on Rock Mechanics (USRMS), Golden, CO, USA, 17–21 June 2006; pp. 1–8. [Google Scholar]
- Lombardi, G. The FES rock mass model-Part 2: Some examples. Dam Eng. 1992, 3, 201–221. [Google Scholar]
- Lombardi, G. Ground-Water induced settlements in rock masses and consequences for dams. In Proceedings of the Integrity Assessment of Large Concrete Dams (IALAD), Zurich, Switzerland, 24–25 September 2004; pp. 1–17. [Google Scholar]
- Cheng, L.; Liu, Y.R.; Yang, Q.; Pan, Y.W.; Lv, Z. Mechanism and numerical simulation of reservoir slope deformation during impounding of high arch dams based on nonlinear FEM. Comput. Geotech. 2017, 81, 143–154. [Google Scholar] [CrossRef]
- Liang, G.H.; Hu, Y.; Fan, Q.X.; Li, Q.B. Analysis on valley deformation of Xiluodu high arch dam during impoundment and its influencing factors. J. Hydroelctr. Eng. 2016, 35, 101–110. (In Chinese) [Google Scholar] [CrossRef]
- Zhuang, C.; Zhou, Z.; Li, M.; Wang, J. Prediction of valley shrinkage deformation in Xiluodu Hydropower Plant based on the hydraulic responses of a confined aquifer. Chin. J. Geotech. Eng. 2019, 41, 1472–1480. (In Chinese) [Google Scholar] [CrossRef]
- Yang, X.C.; Gao, K.J.; Zhao, W.G.; Wang, R.K.; Zhang, J.H. Analysis of the influence of valley deformation on the safety of Xiluodu arch dam. In Proceedings of the 2017 International Conference on Electronic, Control, Automation and Mechanical Engineering, Sanya, China, 19–20 November 2017; pp. 580–588. [Google Scholar]
- Zhao, B.C.; Xu, W.Y.; Meng, Y.D.; Liang, G.L. Security monitoring of a large-scale and complex accumulation slope: An application in the Xiluodu hydropower station. Bull. Eng. Geol. Environ. 2014, 74, 327–335. [Google Scholar] [CrossRef]
- Li, F.; Wang, Z.; Liu, G.; Fu, C.; Wang, J. Hydrostatic seasonal state model for monitoring data analysis of concrete dams. Struct. Infrastruct. Eng. 2015, 11, 1616–1631. [Google Scholar] [CrossRef]
- Léger, P.; Leclerc, M. Hydrostatic, temperature, time-displacement model for concrete dams. J. Eng. Mech. 2007, 133, 267–277. [Google Scholar] [CrossRef]
- Bear, J. Dynamics of Fluids in Porous Media; Courier Corporation: New York, NY, USA, 2013. [Google Scholar]
- Zhou, Z.; Wang, J. Dynamics of Fluids in Fractured Media; China Water & Power Press: Beijing, China, 2004. [Google Scholar]
- Fan, Q.; Liu, Y.; Zhang, G.; Cheng, H.; Xiang, J.; Zhou, Q. Analysis on the cause of valley width shrinkage of an ultra-high arch dam and its influence on dam safety risk. In Proceedings of the 2018 7th International Conference on Energy, Environment and Sustainable Development (ICEESD 2018), Shenzhen, China, 30–31 March 2018; pp. 811–819. [Google Scholar]
- Liu, Y.R.; Wang, W.Q.; He, Z.; Lyv, S.; Yang, Q. Nonlinear creep damage model considering effect of pore pressure and analysis of long-term stability of rock structure. Int. J. Damage Mech. 2019, 1–22. [Google Scholar] [CrossRef]
- Zhuang, C.; Zhou, Z.F.; Zhan, H.B.; Wang, G.Y. A new type curve method for estimating aquitard hydraulic parameters in a multi-layered aquifer system. J. Hydrol. 2015, 527, 212–220. [Google Scholar] [CrossRef]
- Liang, X.; Zhang, Y.K. Analytical solution for drainage and recession from an unconfined aquifer. Groundwater 2012, 50, 793–798. [Google Scholar] [CrossRef] [PubMed]
- Liang, G.; Hu, Y.; Li, Q. Safety monitoring of high arch dams in initial operation period using vector error correction model. Rock Mech. Rock Eng. 2018, 51, 2469–2481. [Google Scholar] [CrossRef]
- Mata, J.; Castro, A.N.T.D.; Costa, J.S.D. Constructing statistical models for arch dam deformation. Struct. Control. Health Monit. 2014, 21, 423–437. [Google Scholar] [CrossRef] [Green Version]
- Mata, J. Interpretation of concrete dam behaviour with artificial neural network and multiple linear regression models. Eng. Struct. 2011, 33, 903–910. [Google Scholar] [CrossRef]
- De Sortis, A.; Paoliani, P. Statistical analysis and structural identification in concrete dam monitoring. Eng. Struct. 2007, 29, 110–120. [Google Scholar] [CrossRef]
- Haario, H.; Laine, M.; Mira, A.; Saksman, E. DRAM: Efficient adaptive MCMC. Stat. Comput. 2006, 16, 339–354. [Google Scholar] [CrossRef]
Figure 1.
Geological overview of the dam area. (a) Location of the Xiluodu Dam. (b) Overview of the study area. (c) Cross-section of the Yongsheng synclinal basin. ((a) and (b) are from OvitalMap software.)
Figure 1.
Geological overview of the dam area. (a) Location of the Xiluodu Dam. (b) Overview of the study area. (c) Cross-section of the Yongsheng synclinal basin. ((a) and (b) are from OvitalMap software.)

Figure 2.
Dynamics of the Jinsha River level and the hydraulic head of the Yangxin limestone confined aquifer.
Figure 2.
Dynamics of the Jinsha River level and the hydraulic head of the Yangxin limestone confined aquifer.

Figure 3.
Locations of the monitoring lines of the river valley contractions (RVCs) at the Xiluodu Dam.
Figure 3.
Locations of the monitoring lines of the river valley contractions (RVCs) at the Xiluodu Dam.

Figure 4.
Transient variations of the RVCs and the reservoir water level for the Xiluodu Dam.

Figure 5.
Schematic diagram of the hydraulic responses of the one-dimensional confined aquifer.

Figure 6.
Approximation of the Xiluodu reservoir level variations by piecewise linear segments and the average increment of the hydraulic head of the confined aquifer.
Figure 6.
Approximation of the Xiluodu reservoir level variations by piecewise linear segments and the average increment of the hydraulic head of the confined aquifer.

Figure 7.
Simulated versus observed RVCs development.

Figure 8.
Fluctuations of the ratio of seasonal effects to the total RVCs.

Figure 9.
Prediction of RVC development. The red line represents the predicted mean value of the RVCs and the blue line represents the reservoir water level. Green circles and purple triangles represent observed RVCs.
Figure 9.
Prediction of RVC development. The red line represents the predicted mean value of the RVCs and the blue line represents the reservoir water level. Green circles and purple triangles represent observed RVCs.


Table 1.
Estimated results of the GHS model parameters.
| Lines | MSE | Estimated Results | ||||||||||||||
|---|---|---|---|---|---|---|---|---|---|---|---|---|---|---|---|---|
| b1 | b2 | b3 | b4 | b5 | ||||||||||||
| Mean | 95% CI | Mean | 95% CI | Mean | 95% CI | Mean | 95% CI | Mean | 95% CI | |||||||
| VD01 | 2.045 | −0.600 | −0.601 | −0.599 | 2.961 | 2.952 | 2.971 | 9.658 | 9.650 | 9.665 | 0.136 | 0.130 | 0.142 | 0.839 | 0.831 | 0.848 |
| VD02 | 3.566 | −0.599 | −0.603 | −0.596 | 2.289 | 2.279 | 2.299 | 9.658 | 9.651 | 9.666 | 0.543 | 0.539 | 0.548 | 3.109 | 3.084 | 3.134 |
| VD03 | 2.513 | −0.938 | −0.942 | −0.935 | 1.919 | 1.902 | 1.937 | 10.611 | 10.542 | 10.679 | −0.247 | −0.255 | −0.240 | 0.268 | 0.262 | 0.275 |
| VD04 | 3.894 | −0.511 | −0.511 | −0.510 | 3.526 | 3.513 | 3.539 | 8.855 | 8.840 | 8.870 | −0.363 | −0.375 | −0.352 | 1.755 | 1.748 | 1.763 |
| VD05 | 1.460 | −0.537 | −0.538 | −0.536 | 2.986 | 2.982 | 2.991 | 7.795 | 7.787 | 7.802 | −0.704 | −0.708 | −0.700 | 0.566 | 0.558 | 0.574 |
| VD06 | 2.305 | −0.560 | −0.562 | −0.558 | 1.227 | 1.222 | 1.232 | 5.227 | 5.202 | 5.252 | 0.443 | 0.437 | 0.448 | 3.091 | 3.080 | 3.103 |
| VD07 | 1.423 | −0.520 | −0.521 | −0.519 | 4.961 | 4.952 | 4.969 | 9.639 | 9.627 | 9.651 | 0.221 | 0.209 | 0.233 | 1.497 | 1.491 | 1.503 |
| VD08 | 0.958 | −0.483 | −0.483 | −0.482 | 8.658 | 8.630 | 8.687 | 12.784 | 12.766 | 12.801 | 0.389 | 0.385 | 0.393 | 2.154 | 2.148 | 2.160 |
| VD09 | 14.015 | −1.012 | −1.015 | −1.009 | 3.385 | 3.347 | 3.422 | 11.303 | 11.251 | 11.355 | 1.181 | 1.176 | 1.186 | 4.438 | 4.418 | 4.458 |
CI: Confidence Interval.
© 2020 by the authors. Licensee MDPI, Basel, Switzerland. This article is an open access article distributed under the terms and conditions of the Creative Commons Attribution (CC BY) license (http://creativecommons.org/licenses/by/4.0/).
Share and Cite
MDPI and ACS Style
Li, M.; Zhou, Z.; Zhuang, C.; Xin, Y.; Chen, M.; Wu, J. The Cause and Statistical Analysis of the River Valley Contractions at the Xiluodu Hydropower Station, China. Water 2020, 12, 791. https://doi.org/10.3390/w12030791
AMA Style
Li M, Zhou Z, Zhuang C, Xin Y, Chen M, Wu J. The Cause and Statistical Analysis of the River Valley Contractions at the Xiluodu Hydropower Station, China. Water. 2020; 12(3):791. https://doi.org/10.3390/w12030791
Chicago/Turabian StyleLi, Mingwei, Zhifang Zhou, Chao Zhuang, Yawen Xin, Meng Chen, and Jian Wu. 2020. "The Cause and Statistical Analysis of the River Valley Contractions at the Xiluodu Hydropower Station, China" Water 12, no. 3: 791. https://doi.org/10.3390/w12030791
Note that from the first issue of 2016, this journal uses article numbers instead of page numbers. See further details here.