Using the Freshwater Health Index to Assess Hydropower Development Scenarios in the Sesan, Srepok and Sekong River Basin

 , , , ,
Abstract
:1. Introduction
2. Materials and Methods
2.1. Application of the Freshwater Health Index
2.2. Common Data Sets
2.3. Calculation of Ecosystem Vitality Indicators
2.3.1. Water Quantity
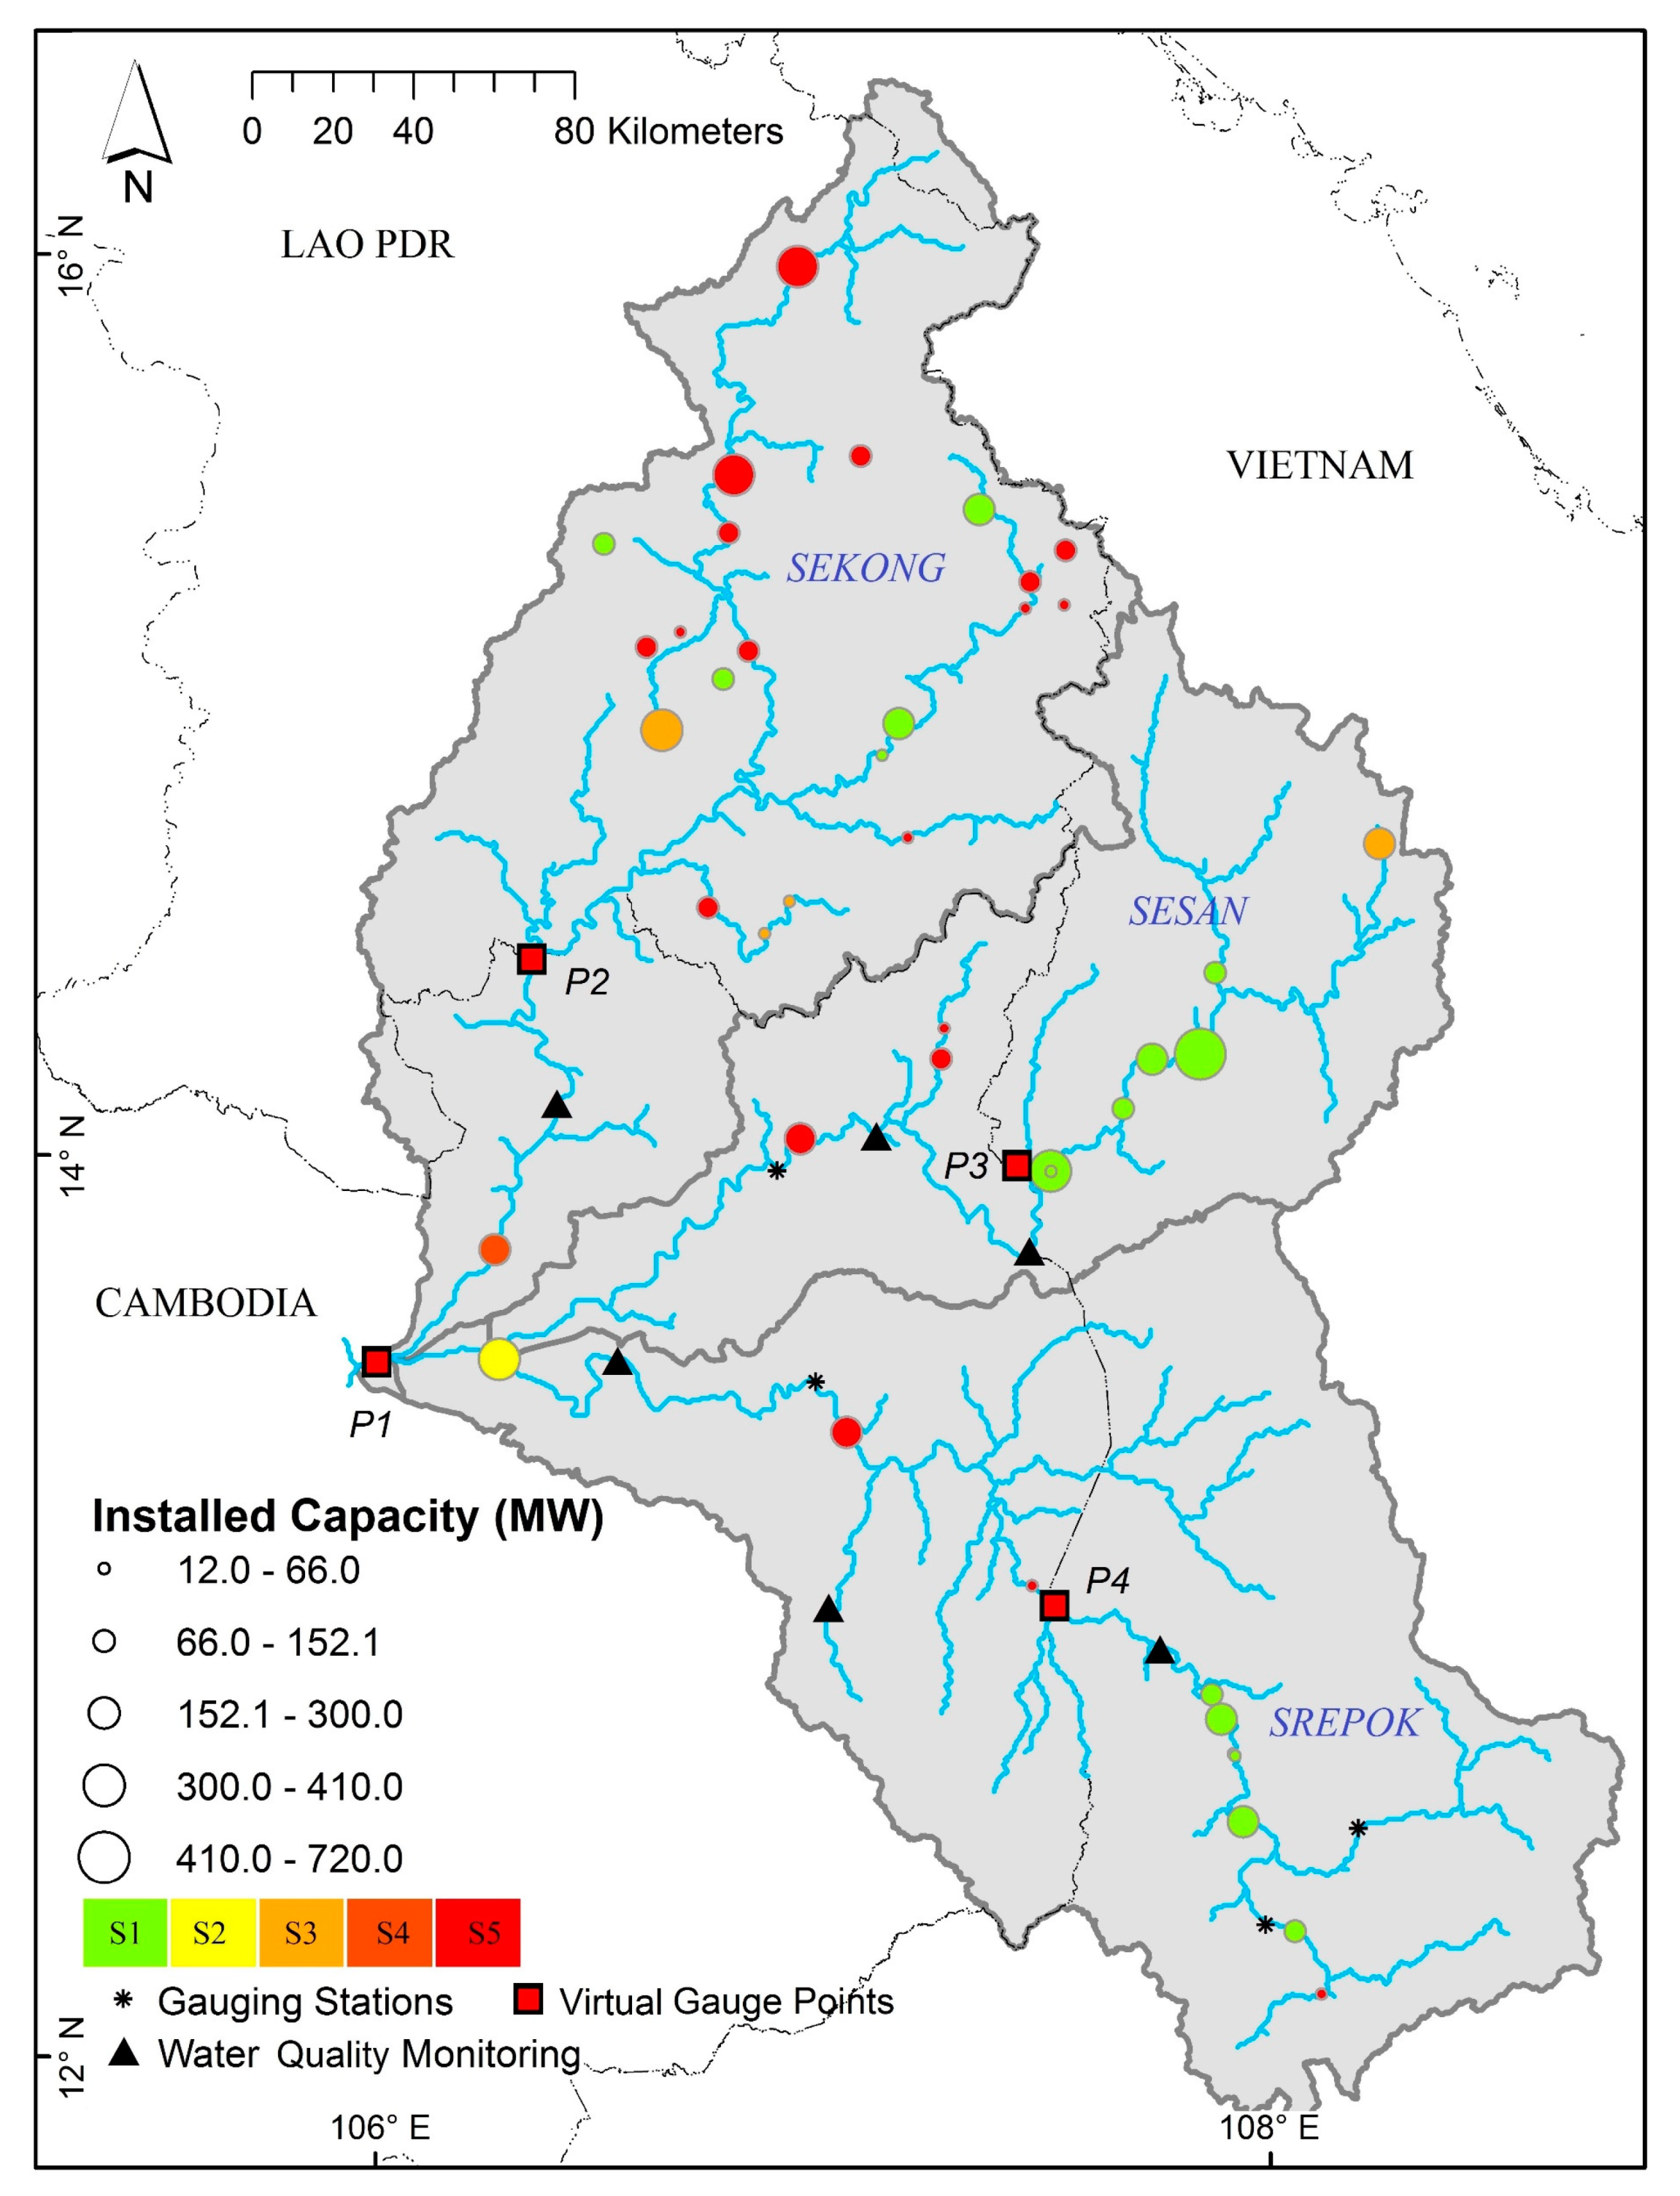
- (P1)
- the 3S outlet to the Mekong;
- (P2)
- the Sekong at the Cambodian/Lao PDR border;
- (P3)
- the Sesan at the Vietnam/Cambodia border; and
- (P4)
- the Srepok at the Vietnam/Cambodia border.
2.3.2. Water Quality
2.3.3. Drainage Basin Condition
2.3.4. Biodiversity
2.4. Calculation of Ecosystem Services Indicators
2.4.1. Provisioning
- 0 migratory fish species;
- 4–7 migratory fish species (if migratory species were present the minimum number present was 4);
- 8–11 migratory fish species;
- 12–15 migratory fish species;
- 16–20 migratory fish species; and
- 21–25 migratory fish species.
2.4.2. Regulation and Support
2.4.3. Cultural and Aesthetic
2.5. Calculation of the Governance & Stakeholders Indicators
2.6. Stakeholder Weighting Exercise
3. Results
3.1. Ecosystem Vitality
3.1.1. Deviation from Natural Flow Regime
3.1.2. Water Quality
3.1.3. Drainage Basin Condition
3.1.4. Biodiversity
3.2. Ecosystem Services
3.2.1. Provisioning
3.2.2. Regulation and Support
3.2.3. Cultural and Aesthetic
3.3. Governance & Stakeholders
4. Discussion
4.1. Baseline Assessment for Freshwater Health
4.2. Development in the Basin: Insights from Scenarios
4.3. Linking the Social, Ecological and Hydrological Systems in Practice
5. Conclusions
Supplementary Materials
Author Contributions
Funding
Acknowledgments
Conflicts of Interest
References
- Reed, P.M.; Kasprzyk, J. Water resources management: The myth, the wicked, and the future. J. Water Resour. Plan. Manag. 2009, 135, 411–413. [Google Scholar] [CrossRef] [Green Version]
- Ratna Reddy, V.; Syme, G.J. Social sciences and hydrology: An introduction. J. Hydrol. 2014, 518, 1–4. [Google Scholar] [CrossRef]
- Levy, M.C.; Garcia, M.; Blair, P.; Chen, X.; Gomes, S.L.; Gower, D.B.; Grames, J.; Kuil, L.; Liu, Y.; Marston, L.; et al. Wicked but worth it: Student perspectives on socio-hydrology. Hydrol. Process 2016, 30, 1467–1472. [Google Scholar] [CrossRef] [Green Version]
- Lovejoy, T.E. Eden no more. Sci. Adv. 2019, 5, eaax7492. [Google Scholar] [CrossRef] [PubMed] [Green Version]
- Pahl-Wostl, C. Water Governance in the Face of Global Change: From Understanding to Transformation; Springer International Publishing: Cham, Switzerland, 2015. [Google Scholar]
- Sivapalan, M.; Savenije, H.H.G.; Blöschl, G. Socio-hydrology: A new science of people and water. Hydrol. Process. 2012, 26, 1270–1276. [Google Scholar] [CrossRef]
- Sivapalan, M.; Konar, M.; Srinivasan, V.; Chhatre, A.; Wutich, A.; Scott, C.A.; Wescoat, J.L.; Rodriguez-Iturbe, I. Socio-hydrology: Use-inspired water sustainability science for the anthropocene. Earth’s Future 2014, 2, 225–230. [Google Scholar] [CrossRef] [Green Version]
- Vollmer, D.; Shaad, K.; Souter, N.J.; Farrell, T.; Dudgeon, D.; Sullivan, C.A.; Fauconnier, I.; MacDonald, G.M.; McCartney, M.P.; Power, A.G.; et al. Integrating the social, hydrological and ecological dimensions of freshwater health: The Freshwater Health Index. Sci. Total Environ. 2018, 627, 304–313. [Google Scholar] [CrossRef]
- Peterson, G.D.; Cumming, G.S.; Carpenter, S.R. Scenario planning: A tool for conservation in an uncertain world. Conserv. Biol. 2003, 17, 358–366. [Google Scholar] [CrossRef] [Green Version]
- Meynell, P.-J. The Sekong River in Viet Nam, Lao PDR and Cambodia: An Information Sourcebook for Dialogue on River Flow; IUCN: Bangkok, Thailand, 2014. [Google Scholar]
- Arias, M.E.; Piman, T.; Lauri, H.; Cochrane, T.A.; Kummu, M. Dams on Mekong tributaries as significant contributors of hydrological alterations to the Tonle Sap floodplain in Cambodia. Hydrol. Earth Syst. Sci. 2014, 18, 5303–5315. [Google Scholar] [CrossRef] [Green Version]
- Adamson, P.T.; Rutherfurd, I.D.; Peel, M.C.; Conlan, I.A. The Hydrology of the Mekong River. In The Mekong: Biophysical Environment of an International River Basin; Campbell, I.C., Ed.; Elsevier: Amsterdam, The Netherlands, 2009; pp. 53–76. [Google Scholar]
- Koehnken, L. IKMP Discharge and Sediment Monitoring Programme Review; Recommendations and Data Analysis; Parts 1 and 2: Vientiane, Laos, 2012. [Google Scholar]
- Arias, M.E.; Cochrane, T.A.; Kummu, M.; Lauri, H.; Holtgrieve, G.W.; Koponen, J.; Piman, T. Impacts of hydropower and climate change on drivers of ecological productivity of Southeast Asia’s most important wetland. Ecol. Modell. 2014, 272, 252–263. [Google Scholar] [CrossRef]
- Campbell, I.C.; Say, S.; Beardall, J. Tonle Sap Lake, the Heart of the Lower Mekong. In The Mekong; Campbell, I.C., Ed.; Elsevier Inc.: New York, NY, USA, 2009; pp. 251–272. [Google Scholar]
- Manh, N.V.; Dung, N.V.; Hung, N.N.; Merz, B.; Apel, H. Large-scale suspended sediment transport and sediment deposition in the Mekong Delta. Hydrol. Earth Syst. Sci. 2014, 18, 3033–3053. [Google Scholar] [CrossRef] [Green Version]
- Ziv, G.; Baran, E.; Nam, S.; Rodriguez-Iturbe, I.; Levin, S.A. Trading-off fish biodiversity, food security, and hydropower in the Mekong River Basin. Proc. Natl. Acad. Sci. USA 2012, 109, 5609–5614. [Google Scholar] [CrossRef] [PubMed] [Green Version]
- ADB. Sesan, Sre Pok and Sekong River Basins Development Study in Kingdom of Cambodia; Lao People’s Democratic Republic, and Socialist Republic of Viet Nam; Asian Development Bank: Bangkok, Thailand, 2010. [Google Scholar]
- Giang, T.T.; Wang, G.; Yan, D. Evaluation the factors leading to poverty issue in Central Highlands of Vietnam. Mod. Econ. 2014, 5, 432–442. [Google Scholar] [CrossRef] [Green Version]
- Constable, D. Atlas of the 3S Basins; IUCN: Bangkok, Thailand, 2015. [Google Scholar]
- Kandulu, J.M.; Connor, J.D. Improving the effectiveness of aid: An evaluation of prospective Mekong irrigation investments. Int. J. Water Resour. Dev. 2017, 33, 270–291. [Google Scholar] [CrossRef]
- Grumbine, R.E.; Dore, J.; Xu, J. Mekong hydropower: Drivers of change and governance challenges. Front. Ecol. Environ. 2012, 10, 91–98. [Google Scholar] [CrossRef] [Green Version]
- Piman, T.; Cochrane, T.A.; Arias, M.E.; Green, A.; Dat, N.D. Assessment of flow changes from hydropower development and operations in Sekong, Sesan, and Srepok rivers of the Mekong basin. J. Water Resour. Plan. Manag. 2013, 139, 723–732. [Google Scholar] [CrossRef]
- Kummu, M.; Lu, X.X.; Wang, J.J.; Varis, O. Basin-wide sediment trapping efficiency of emerging reservoirs along the Mekong. Geomorphology 2010, 119, 181–197. [Google Scholar] [CrossRef]
- Wild, T.B.; Loucks, D.P. Managing flow, sediment, and hydropower regimes in the Sre Pok, Se San, and Se Kong rivers of the Mekong basin. Water Resour. Res. 2014, 50, 5141–5157. [Google Scholar] [CrossRef]
- Schmitt, R.J.P.; Bizzi, S.; Castelletti, A.; Kondolf, G.M. Improved trade-offs of hydropower and sand connectivity by strategic dam planning in the Mekong. Nat. Sustain. 2018, 1, 96–104. [Google Scholar] [CrossRef]
- Ngor, P.B.; Legendre, P.; Oberdorff, T.; Lek, S. Flow alterations by dams shaped fish assemblage dynamics in the complex Mekong-3S river system. Ecol. Indic. 2018, 88, 103–114. [Google Scholar] [CrossRef]
- Souter, N.; Vollmer, D.; Shaad, K.; Farrell, T.; Regan, H.; Arias, M.E.; Cochrane, T.A.; Andelman, S. Planning for Climate Change and Mechanisms for Co-opearation in Southeast Asia’s Sesan, Sekong and Srepok Transboundary River Basin. In Water Security in Asia: Opportunities and Challenges in the Context of Climate Change; Babel, M.S., Haarstrick, A., Ribbe, L., Shinde, V., Dichtl, N., Eds.; Springer International Publishing: Berlin/Heidelberg, Germany, 2020. [Google Scholar]
- Shrestha, B.; Cochrane, T.A.; Caruso, B.S.; Arias, M.E. Land use change uncertainty impacts on streamflow and sediment projections in areas undergoing rapid development: A case study in the Mekong basin. L. Degrad. Dev. 2018, 29, 835–848. [Google Scholar] [CrossRef]
- Wyatt, A.B.; Baird, I.G. Transboundary impact assessment in the Sesan river basin: The case of the Yali falls dam. Int. J. Water Resour. Dev. 2007, 23, 427–442. [Google Scholar] [CrossRef]
- Sithirith, M. Dams and state security: Damming the 3S rivers as a threat to Cambodian state security. Asia Pac. Viewp. 2016, 57, 60–75. [Google Scholar] [CrossRef] [Green Version]
- Hirsch, P.; Wyatt, A. Negotiating local livelihoods: Scales of conflict in the Se San River Basin. Asia Pac. Viewp. 2004, 45, 51–68. [Google Scholar] [CrossRef]
- Vaenkeo, S. Govt to Inspect All Dam Standards, Shelve New Hydro Projects. Available online: http://www.vientianetimes.org.la/FreeContent/FreeConten_Govt_183.php (accessed on 3 December 2018).
- IUCN. BRIDGE in the Sekong, Sesan and Sre Pok River Basins (BRIDGE 3S). Available online: https://www.iucn.org/regions/asia/our-work/regional-projects/bridge-sekong-sesan-and-sre-pok-river-basins-bridge-3s (accessed on 17 July 2019).
- Mekong River Commission (MRC). Transboundary Water Resources Management Issues in the Sesan and Srepok River Basins; Mekong River Commission: Vientiane, Laos, 2017. [Google Scholar]
- ICEM. Measuring, Understanding and Adapting to Nexus trade-offs in the 3S River Basins. Available online: http://icem.com.au/portfolio-items/measuring-understanding-and-adapting-to-nexus-trade-offs-in-the-3s-river-basins/ (accessed on 19 June 2019).
- Lehner, B.; Grill, G. Global river hydrography and network routing: Baseline data and new approaches to study the world’s large river systems. Hydrol. Process. 2013, 27, 2171–2186. [Google Scholar] [CrossRef]
- Lehner, B.; Verdin, K.; Jarvis, A. HydroSHEDS Technical Documentation, Version 1; World Wildlife Fund: Washington, DC, USA, 2006. [Google Scholar]
- Mekong River Commission (MRC). Hydropower Database; Mekong River Commission: Vientiane, Laos, 2017. [Google Scholar]
- WLE Mekong. Dam Maps. Available online: https://wle-mekong.cgiar.org/maps/ (accessed on 19 September 2016).
- Open Development Cambodia. Hydropower dam (1993–2014). Available online: https://opendevelopmentcambodia.net/dataset/?id=hydropower-2009–2014 (accessed on 1 January 2016).
- Gehrke, P.C.; Brown, P.; Schiller, C.B.; Moffatt, D.B.; Bruce, A.M. River regulation and fish communities in the Murray-Darling river system, Australia. Regul. Rivers Res. Manag. 1995, 11, 363–375. [Google Scholar] [CrossRef]
- Gippel, C.J.; Zhang, Y.; Qu, X.; Kong, W.; Bond, N.R.; Jiang, X.; Liu, W. River Health Assessment in China: Comparison and Development of Indicators of Hydrological Health; International Water Centre: Brisbane, Australia, 2011. [Google Scholar]
- Ly, K.; Larsen, H. 2014 Lower Mekong Regional Water Quality Monitoring Report; Mekong River Commission: Vientiane, Laos, 2016. [Google Scholar]
- Hart, B.T.; Maher, B.; Lawrence, I. New generation water quality guidelines for ecosystem protection. Freshw. Biol. 1999, 41, 347–359. [Google Scholar] [CrossRef]
- Canadian Council of Ministers of the Environment Canadian Water Quality Guidelines for the Protection of Aquatic Life: CCME Water Quality Index 1.0 User’s Manual. In Canadian Environmental Quality Guidelines, 1999; Canadian Council of Ministers of the Environment: Winnipeg, MB, Canada, 2001; pp. 1–5.
- Asian Disaster Preparedness Center. Reservoir Mapping Tool. Available online: https://servir.adpc.net/tools/reservoir-mapping-tool (accessed on 19 June 2019).
- USA Department of the Interior. Landsat Missions. Available online: https://www.usgs.gov/land-resources/nli/landsat (accessed on 19 June 2019).
- Cote, D.; Kehler, D.G.; Bourne, C.; Wiersma, Y.F. A new measure of longitudinal connectivity for stream networks. Landsc. Ecol. 2009, 24, 101–113. [Google Scholar] [CrossRef] [Green Version]
- Shaad, K.; Souter, N.J.; Farrell, T.; Vollmer, D.; Regan, H.M. Evaluating the sensitivity of dendritic connectivity to fish pass efficiency for the Sesan, Srepok and Sekong tributaries of the Lower Mekong. Ecol. Indic. 2018, 91, 570–574. [Google Scholar] [CrossRef]
- Baran, E.; Saray, S.; Teoh, S.J.; Tran, T.C. Fish and fisheries in the Sesan, Sekong and Srepok River basins (Mekong watershed). In On Optimizing the Management of Cascades or System of Reservoirs at Catchment Level; ICEM: Hanoi, Vietnam, 2014; p. 61. [Google Scholar]
- Angermeier, P.L. The natural imperative for biological conservation. Conserv. Biol. 2000, 14, 373–381. [Google Scholar] [CrossRef] [Green Version]
- Machado, A. An index of naturalness. J. Nat. Conserv. 2004, 12, 95–110. [Google Scholar] [CrossRef]
- Paracchini, M.L.; Capitani, C. Implementation of a EU Wide Indicator for the Rural-Agrarian Landscape; EUR 25114; Publications Office of the European Union: Luxembourg, 2011. [Google Scholar]
- Mekong River Commission (MRC). Land Cover Map 2010 (Dry) of the Lower Mekong Basin. Available online: http://portal.mrcmekong.org/search/search (accessed on 25 July 2017).
- Mekong River Commission (MRC). Land Cover Map 2010 (Wet) of the Lower Mekong Basin. Available online: http://portal.mrcmekong.org/search/search (accessed on 25 July 2017).
- IUCN. IUCN Red List Categories and Criteria: Version 3.1., 2nd ed.; IUCN: Gland, Switzerland; Cambridge, UK, 2012. [Google Scholar]
- IUCN. Spatial Data Download. Available online: https://www.iucnredlist.org/resources/spatial-data-download (accessed on 19 June 2019).
- Birdlife International. Data Zone. Available online: http://datazone.birdlife.org/home (accessed on 19 June 2019).
- Millennium Ecosystem Assessment. Ecosystems and Human Well-Being: Synthesis; Island Press: Washington, DC, USA, 2005; Volume 5, ISBN 1597260401. [Google Scholar]
- Van der Schrier, G.; Barichivich, J.; Briffa, K.R.; Jones, P.D. A scPDSI-based global data set of dry and wet spells for 1901–2009. J. Geophys. Res. Atmos. 2013, 118, 4025–4048. [Google Scholar] [CrossRef]
- Osborn, T.; Barichivich, J.; Harris, I.; van der Schrier, G.; Jones, P. Monitoring global drought using the self-calibrating Palmer Drought Severity Index [in “State of the Climate in 2015”]. Bull. Am. Meteorol. Soc. 2016, 97, S32–S36. [Google Scholar]
- Urbani, C.; Sinoun, M.; Socheat, D.; Pholsena, K.; Strandgaard, H.; Odermatt, P.; Hatz, C. Epidemiology and control of mekongi schistosomiasis. Acta Trop. 2002, 82, 157–168. [Google Scholar] [CrossRef]
- Muth, S.; Sayasone, S.; Odermatt-Biays, S.; Phompida, S.; Duong, S.; Odermatt, P. Schistosoma mekongi in Cambodia and Lao People’s Democratic Republic. In Advances in Parasitology; Elsevier Ltd.: London, UK, 2010; Volume 72, pp. 179–203. [Google Scholar]
- Attwood, S.W.; Fatih, F.A.; Campbell, I.; Upatham, E.S. The distribution of Mekong schistosomiasis, past and future: Preliminary indications from an analysis of genetic variation in the intermediate host. Parasitol. Int. 2008, 57, 256–270. [Google Scholar] [CrossRef]
- Dickin, S.K.; Schuster-Wallace, C.J.; Elliott, S.J. Developing a vulnerability mapping methodology: Applying the water-associated disease index to dengue in Malaysia. PLoS ONE 2013, 8, e63584. [Google Scholar] [CrossRef] [Green Version]
- Fick, S.; Hijmans, R.J. WorldClim Version 2. Available online: http://worldclim.org/version2 (accessed on 1 March 2017).
- FAO. Global Population Density Estimates. Available online: http://www.fao.org:80/geonetwork/srv/en/resources.get?id=14053&fname=Map_2_3.zip&access=private (accessed on 1 March 2017).
- Dickin, S.K.; Schuster-Wallace, C.J. Assessing changing vulnerability to dengue in northeastern Brazil using a water-associated disease index approach. Glob. Environ. Chang. 2014, 29, 155–164. [Google Scholar] [CrossRef]
- QGIS Development Team. QGIS Geographic Information System. Available online: https://www.qgis.org/en/site/ (accessed on 3 January 2017).
- Open Development Cambodia. Natural Protected Areas. Available online: https://opendevelopmentcambodia.net/profiles/natural-protected-areas/ (accessed on 17 September 2016).
- IUCN and UNEP-WCMC. The World Database on Protected Areas (WDPA). Available online: www.protectedplanet.net (accessed on 2 March 2017).
- CBD Secretariat. Aichi Biodiversity Targets. Available online: https://www.cbd.int/sp/targets/ (accessed on 19 June 2019).
- Saaty, T.L. How to make a decision: The analytic hierarchy process. Eur. J. Oper. Res. 1990, 48, 9–26. [Google Scholar] [CrossRef]
- Goepel, K.D. Implementing the analytic hierarchy process as a standard method for multi-criteria decision making in corporate enterprises—A new AHP excel template with multiple inputs. In Proceedings of the International Symposium on the Analytic Hierarchy Process, Kuala Lumpur, Malaysia, 23–26 June 2013; pp. 1–10. [Google Scholar]
- Ty, T.V.; Babel, M.S.; Sunada, K.; Oishi, S.; Kawasaki, A. Utilization of a GIS-based water infrastructure inventory for water resources assessment at local level: A case study in mountainous area of Vietnam. Hydrol. Res. Lett. 2009, 3, 27–31. [Google Scholar] [CrossRef] [Green Version]
- MWBP/RSCP. Invasive Alien Species in the Lower Mekong Basin: Current State of Play; IUCN: Colombo, Sri Lanka, 2006. [Google Scholar]
- Gnim, S. Monitoring of Fish in 3S River Network in Ratanakiri Province and Stung Treng Province of Cambodia; The Royal University of Phnom Penh: Phnom Penh, Cambodia, 2014. [Google Scholar]
- Nuov, S.; Viseth, H.; Vibol, O. Present status of alien species in aquaculture and aquatic ecosystem in Cambodia. In International Mechanisms for the Control and Responsible Use of Alien Species in Aquatic Ecosystems. Report of an Ad Hoc Expert Consultation, Xishuangbanna, People’s Republic of China, 27–30 August 2003; Bartley, D.M., Bhujel, R.C., Funge-Smith, S., Olin, P.G., Phillips, M.J., Eds.; FAO: Rome, Italy, 2005; pp. 75–85. [Google Scholar]
- Schmitt, R.J.P.; Kittner, N.; Kondolf, G.M.; Kammen, D.M. Deploy diverse renewables to save tropical rivers. Nature 2019, 569, 330–332. [Google Scholar] [CrossRef]
- Liu, X.; Souter, N.J.; Wang, R.Y.; Vollmer, D. Aligning the freshwater health index indicator system against the transboundary water governance framework of Southeast Asia’s Sesan, Srepok, and Sekong River Basin. Water 2019, 11, 2307. [Google Scholar] [CrossRef] [Green Version]
- FHI. Freshwater Health Index User Manual. Version 1. Available online: http://www.freshwaterhealthindex.org/resources (accessed on 18 December 2019).
- Ty, T.V.; Sunada, K.; Ichikawa, Y.; Oishi, S. Scenario-based impact assessment of land use/cover and climate changes on water resources and demand: A case study in the Srepok river basin, Vietnam–Cambodia. Water Resour. Manag. 2012, 26, 1387–1407. [Google Scholar] [CrossRef]
- Piman, T.; Cochrane, T.A.; Arias, M.E.; Dat, N.D.; Vonnarart, O. Managing hydropower under climate change in the Mekong tributaries. In Managing Water Resources under Climate Uncertainty; Shrestha, S., Anal, A.K., Salam, P.A., van Der Valk, M., Eds.; Springer International Publishing: Cham, Switzerland, 2015; pp. 223–248. [Google Scholar]


| Components/Major Indicators | Sub-Indicators |
|---|---|
| Ecosystem Vitality | |
| Water Quantity | Deviation from Natural Flow Regime |
| Groundwater Storage Depletion | |
| Water Quality | Suspended Solids in Surface Water |
| Total Nitrogen in Surface and Groundwater | |
| Total Phosphorous in Surface and Groundwater | |
| Indicators of Major Concern | |
| Drainage-Basin Condition | Bank Modification |
| Flow Connectivity | |
| Land Cover Naturalness | |
| Biodiversity | Changes in Number (i.e., species number) and Population Size of Species of Concern |
| Changes in Number and Population Size of Invasive and Nuisance Species | |
| Ecosystem Services | |
| Provisioning | Water Supply Reliability Relative to Demand |
| Biomass for Consumption | |
| Regulation and Support | Sediment Regulation |
| Deviation of Water Quality Metrics from Benchmarks | |
| Flood Regulation | |
| Exposure to Water-Associated Diseases | |
| Cultural/Aesthetic | Conservation/Cultural Heritage Sites |
| Recreation | |
| Governance & Stakeholders | |
| Enabling Environment | Water Resource Management |
| Rights to Resource Use | |
| Incentives and Regulations Technical Capacity | |
| Financial Capacity | |
| Stakeholder Engagement | Information Access and Knowledge |
| Engagement in Decision-Making Processes | |
| Vision and Adaptive Governance | Strategic Planning and Adaptive Governance Monitoring and Learning Mechanisms |
| Effectiveness | Enforcement and Compliance |
| Distribution of Benefits from Ecosystem Services | |
| Water-Related Conflict |
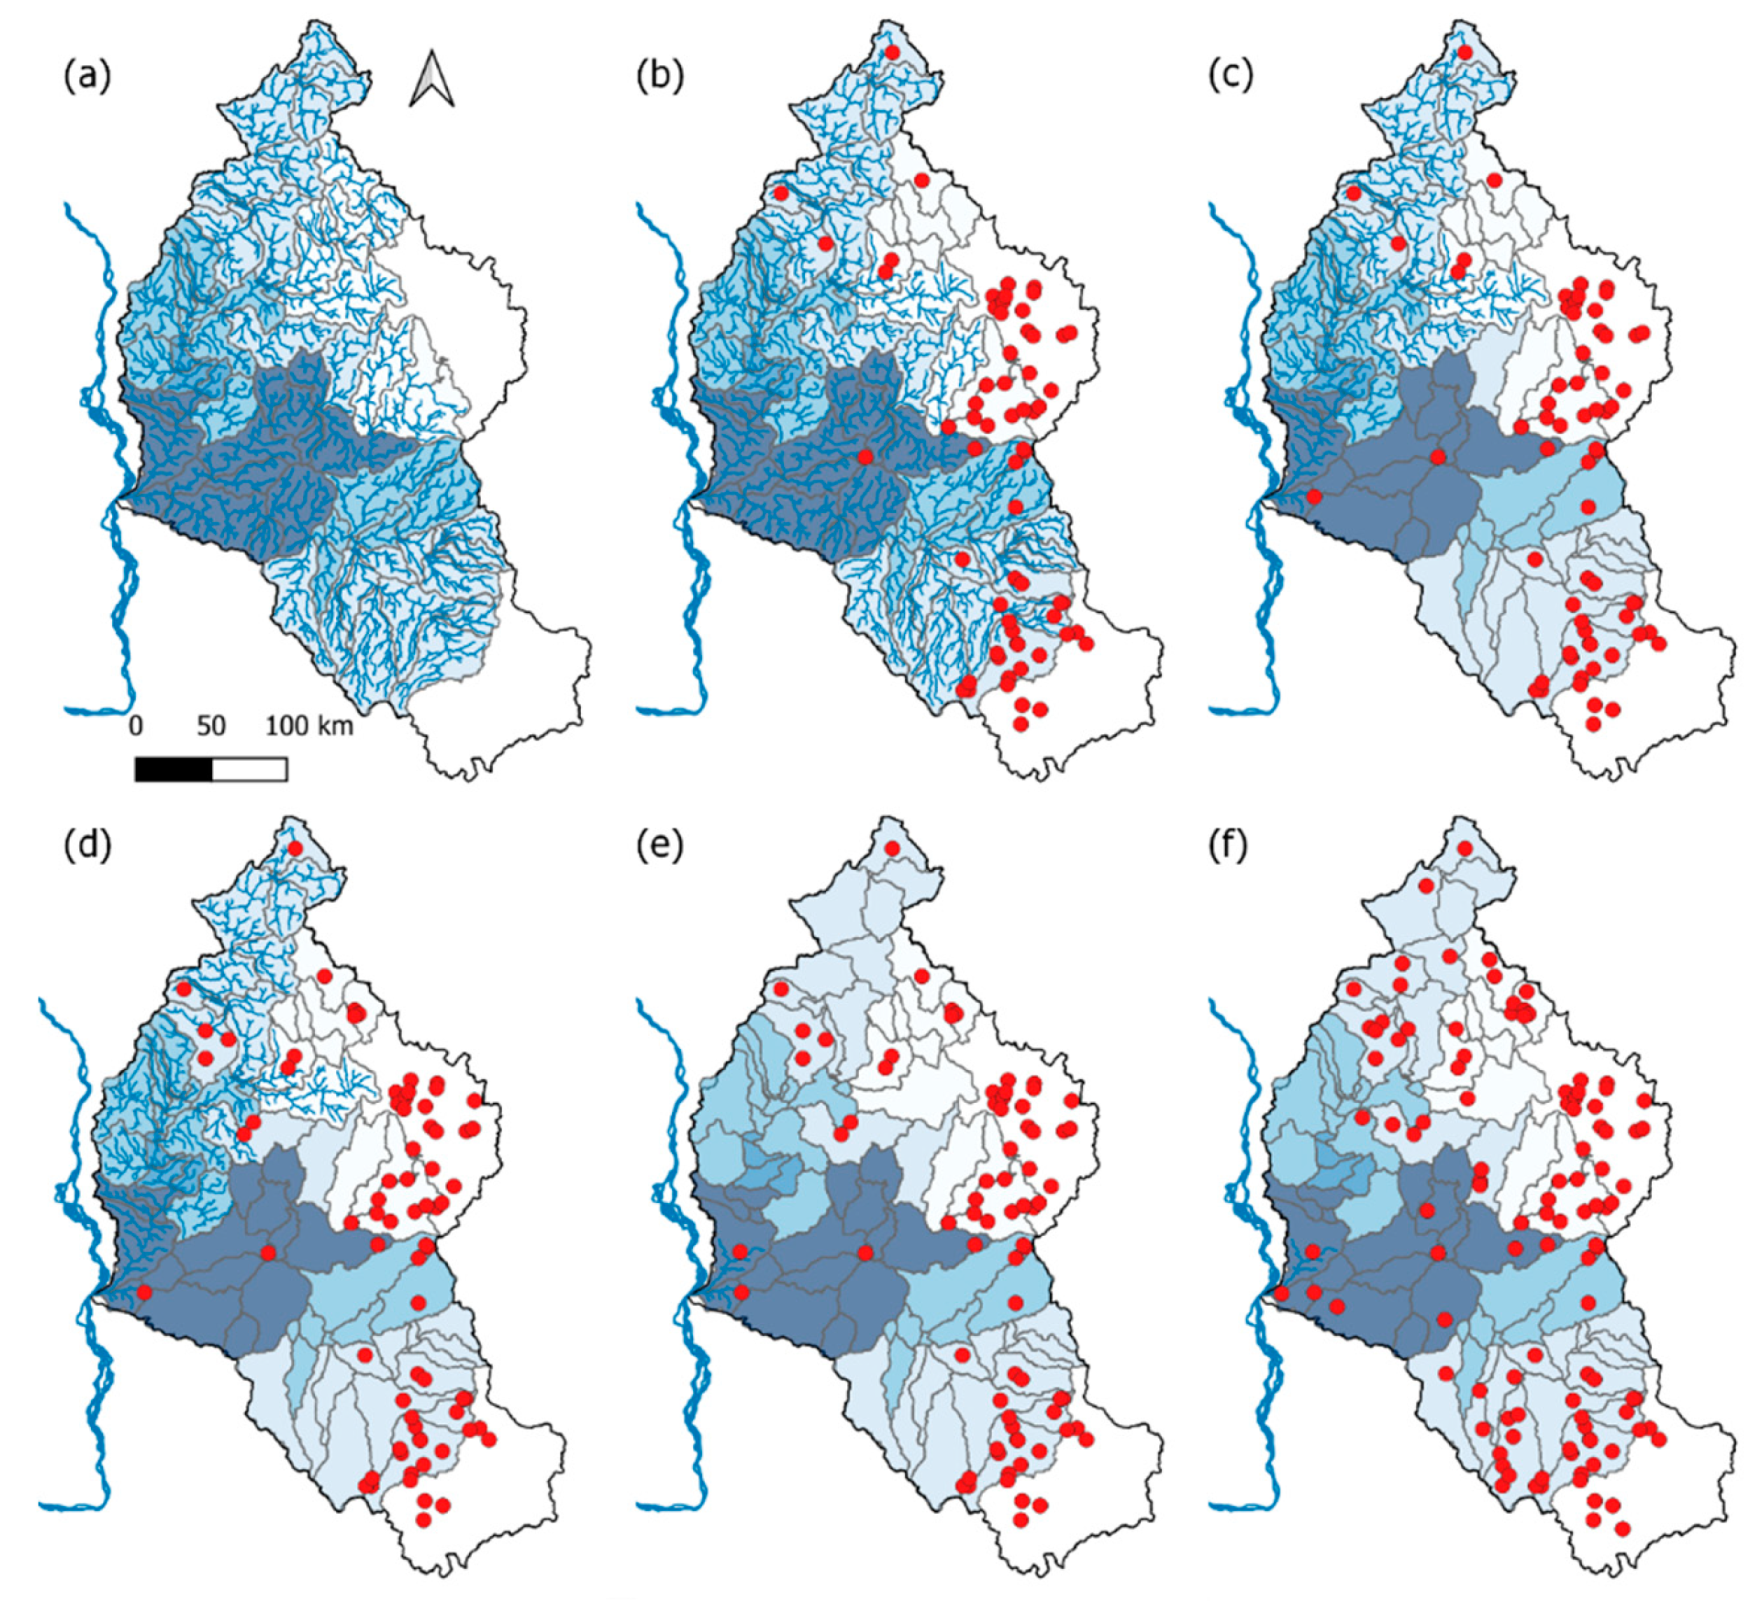
| Scenario | Number of Dams | Description |
|---|---|---|
| 1. December 2016 | 65 | The 65 dams operating as of 31 December 2016. |
| 2. Lower Sesan II | 66 | The 65 scenario 1 dams plus the Lower Sesan II dam which was commissioned on 25 September 2017. |
| 3. Under construction | 74 | The 66 dams in scenario 2, plus eight dams under construction. |
| 4. Lower Sekong | 75 | The 74 dams in scenario 3 plus the prospective Lower Sekong dam in Cambodia. |
| 5. Full development | 111 | The 75 dams in scenario 4 plus the remaining 37 licensed and potential dams. This scenario presents an extreme end point upon which we assessed the other scenarios. |
| LULC Type from MRC Data | Score | Degree of Naturalness | Water Cycle Modification | Pollution Emissions | Vegetation Characteristics |
|---|---|---|---|---|---|
| Natural water body | 100 | Natural and semi-natural | None | None to Low | Native |
| Marshes/swamps | 100 | ||||
| Mangrove | 100 | ||||
| Coniferous forest | 100 | ||||
| Bamboo forest | 100 | ||||
| Broadleaved evergreen forest | 100 | ||||
| Broadleaved deciduous forest | 100 | ||||
| Flooded forest | 100 | ||||
| Shrubland | 60 | Cultural assisted system | Low | Low | Mixed, high diversity |
| Shifting cultivation | 60 | ||||
| Forest plantation | 50 | Transformed system | Low to Moderate | Permanent cover with atypical species | |
| Industrial plantation | 50 | ||||
| Orchard | 50 | ||||
| Grassland | 40 | Moderate to High | Seasonal cover with atypical species | ||
| Paddy rice | 30 | Moderate to High | |||
| Reservoirs | 30 | ||||
| Annual crop | 20 | ||||
| Bare soil | 10 | Completely artificial | High | Sparse to no cover | |
| Urban area | 1 | High |
| Component | Dengue WADI Factor | Data Source |
|---|---|---|
| Climate | Maximum temperature; precipitation | WorldClim version 2 global climate surfaces [67]. |
| Land environment | Types of land use | MRC 2010 dry and wet season land cover [55,56]. |
| Human environment | Population density | FAO Global population density estimates 2015 [68]. |
| Exposure Indicator Factor | Dimension | Exposure Value |
|---|---|---|
| Population density (people/sq. km) | <10 | 0 |
| 10–49 | 0.25 | |
| 50–99 | 0.5 | |
| 100–199 | 0.75 | |
| ≥200 | 1 | |
| Land cover component | Urban areas | 1 |
| Annual crop | 0.5 | |
| Paddy rice | 0.5 | |
| Orchard | 0.5 | |
| Industrial Plantation | 0.5 | |
| Marshes swamp area | 0.5 | |
| Shifting cultivation | 0.25 | |
| Grassland | 0.25 | |
| Bare soil | 0.25 | |
| Shrubland | 0 | |
| Broadleaved deciduous forest | 0 | |
| Broadleaved evergreen forest | 0 | |
| Bamboo forest | 0 | |
| Coniferous forest | 0 | |
| Water body | 0 | |
| Temperature | Maximum monthly temperature, lag of 2 months | 20 °C and ≤34 °C: linear increase in exposure up to 1; ≤2 0 °C and >34 °C: 0 exposure |
| Precipitation | Monthly cumulative precipitation, lag of 2 months | <300 mm precipitation: linear increase in exposure up to 1; >300 mm monthly precipitation: 0 exposure |
| Assessment Month | Temperature/Precipitation | Land Use |
|---|---|---|
| January | November | Dry season |
| February | December | Dry season |
| March | January | Dry season |
| April | February | Dry season |
| May | March | Dry season |
| June | April | Wet season |
| July | May | Wet season |
| August | June | Wet season |
| September | July | Wet season |
| October | August | Wet season |
| November | September | Wet season |
| December | October | Dry Season |
| Ecosystem Vitality Major and Sub-Indicators (Italics) | December 2016 | Lower Sesan II | Under Construction | Lower Sekong | Full Development |
|---|---|---|---|---|---|
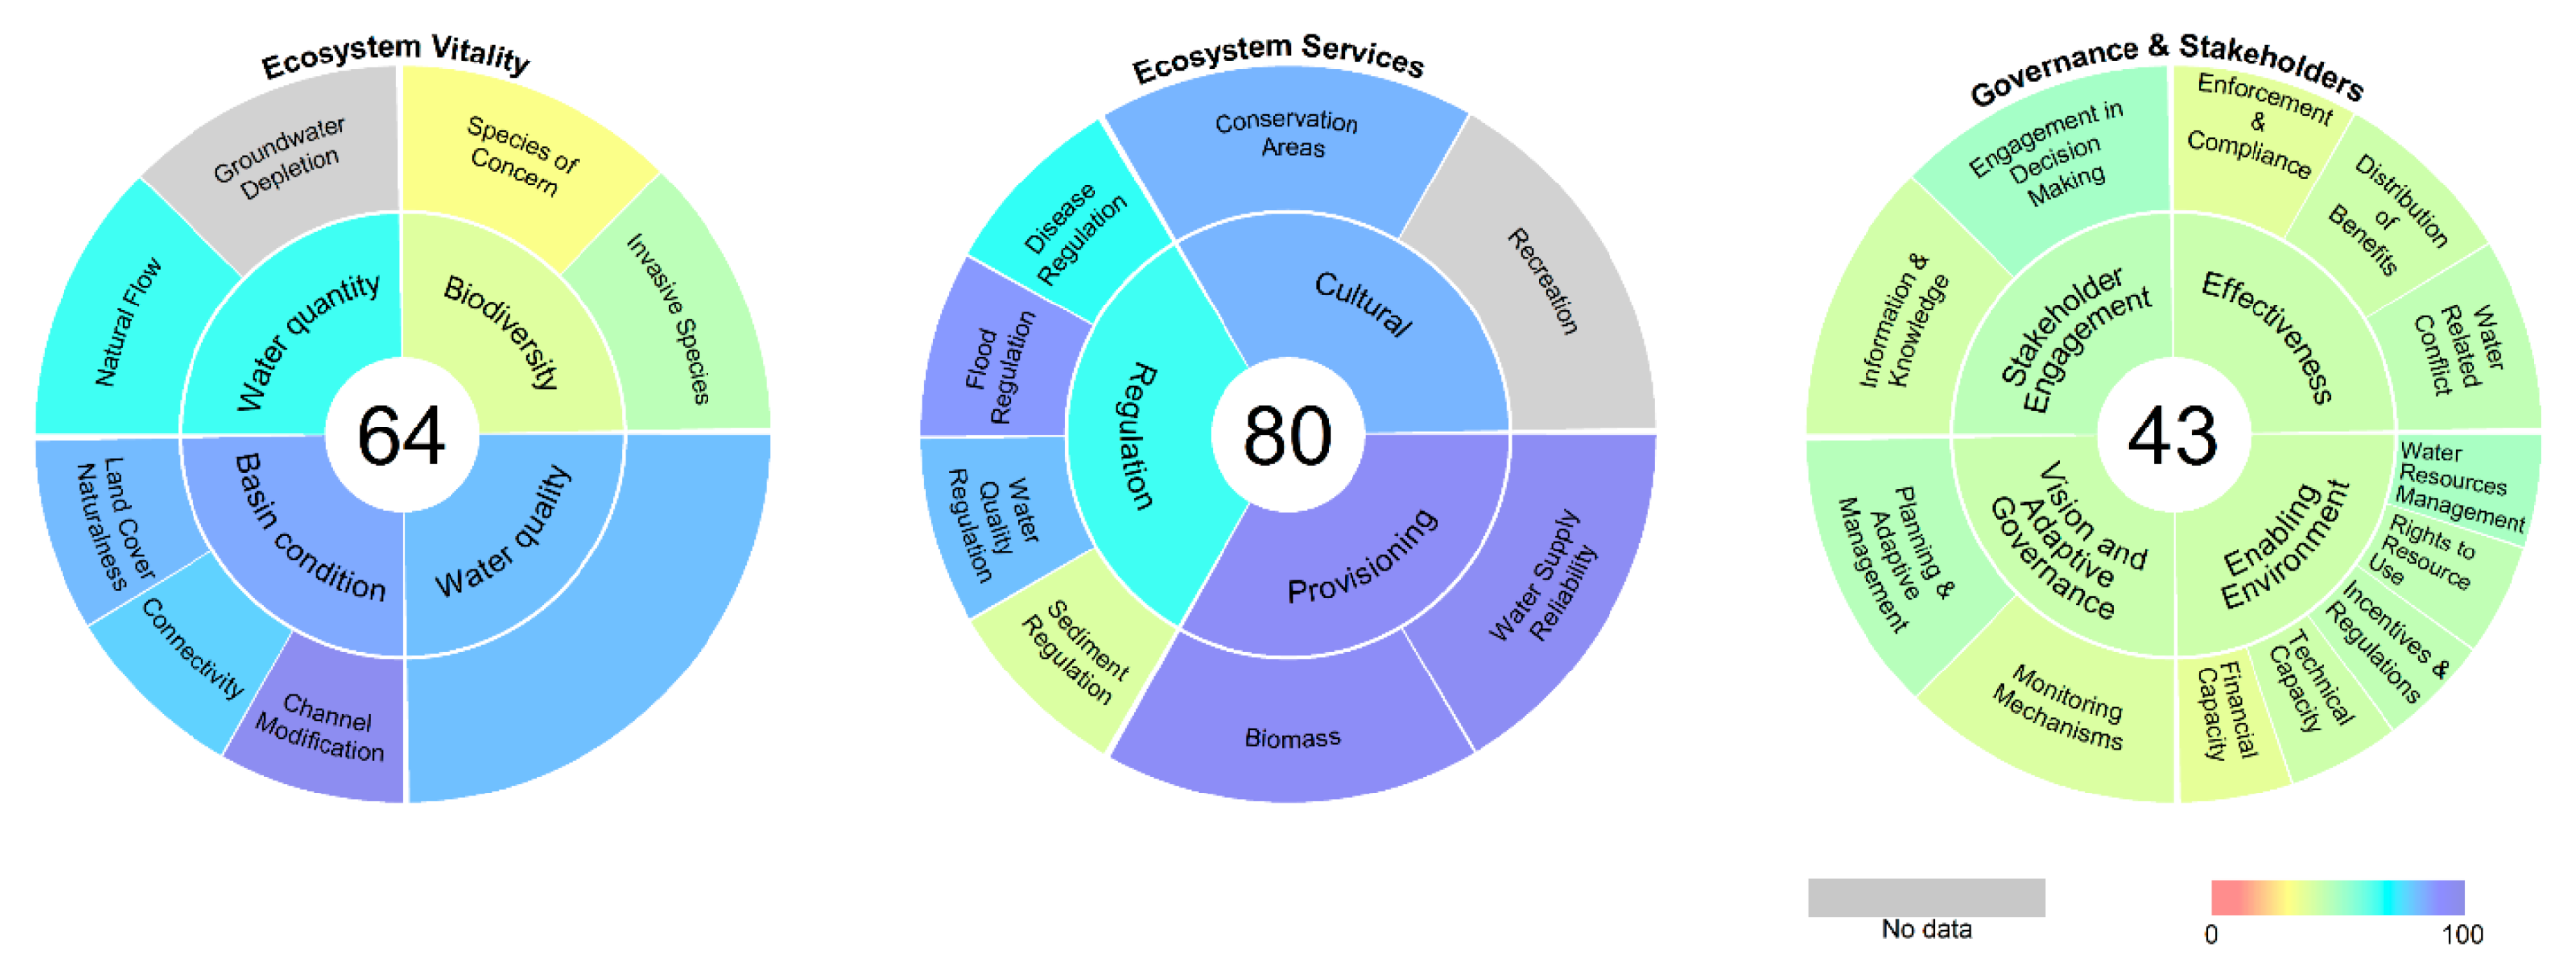
| Aggregate score | 64 | 61 | 59 | 57 | 40 |
| Water Quantity | 66 | 66 | 61 | 61 | 22 |
| Water Quality | 81 | - | - | - | - |
| Drainage-Basin Condition | 85 | 67 | 66 | 58 | 36 |
| Bank Modification | 96 | 95 | - | - | - |
| Flow Connectivity | 78 | 38 | 36 | 25 | 6 |
| Land Cover Naturalness | 82 | - | - | - | - |
| Biodiversity | 38 | - | - | - | - |
| Species of Concern | 31 | ||||
| Invasive and Nuisance Species | 46 |
| Scenario | Basin Outlet (P1) | Sekong, Lao-Cambodia Border (P2) | Sesan, Vietnam-Cambodia Border (P3) | Srepok, Vietnam-Cambodia Border (P4) | Basin Score |
|---|---|---|---|---|---|
| December 2016 | 68.6 | 69.7 | 42.1 | 53.9 | 66.0 |
| Lower Sesan II | 68.0 | 69.7 | 42.1 | 53.9 | 65.6 |
| Under construction | 64.4 | 58.7 | 41.4 | 53.9 | 60.8 |
| Sekong dam | 64.0 | 58.7 | 41.4 | 53.9 | 60.6 |
| Full development | 20.1 | 14.6 | 41.4 | 42.9 | 21.9 |
| Scenario | cDCI | Normalized cDCI |
|---|---|---|
| Natural | 71.7 | 100 |
| December 2016 | 55.6 | 77.5 |
| Lower Sesan II | 27.3 | 38.0 |
| Under construction | 25.9 | 36.1 |
| Sekong dam | 17.8 | 24.7 |
| Full development | 4.3 | 6.0 |
| Red List Category | Actinopterygii | Aves | Reptilia | Amphibia | Mollusca | Mammalia | Odonata | Plantae | Decapoda | Total |
|---|---|---|---|---|---|---|---|---|---|---|
| CR | 8 | 3 | 1 | - | - | - | - | - | - | 12 |
| EN | 19 | 4 | - | 9 | - | - | - | - | - | 32 |
| VU | 19 | 4 | - | 7 | 14 | 2 | - | - | - | 46 |
| NT | 13 | 12 | - | 11 | 33 | 1 | - | - | - | 70 |
| LC | 295 | 72 | 5 | 79 | 100 | - | 127 | 7 | 17 | 702 |
| Total | 354 | 95 | 6 | 106 | 147 | 3 | 127 | 7 | 17 | 862 |
| Invasive Species | Reference |
|---|---|
| Common Tilapia (Oreochromis mossambicus) | [51,77] |
| Nile Tilapia (Oreochromis niloticus) | [51,78] |
| Silver Carp (Hypophthalmichthys molitrix) | [51,79] |
| Bighead Carp (Hypophthalmichthys nobilis) | [51] |
| Rohu (Labeo rohita) | [51,79] |
| Common Carp (Cyprinus carpio) | [51,79] |
| African walking catfish (Clarias gariepinus) | [51] |
| Golden Apple Snail (Pomacea canaliculate) | [77]; Jeremy Carew-Reid, pers. comm. |
| Giant mimosa (Mimosa pigra) | Peter John Meynell, personal observation. |
| Ecosystem Service Major and Sub-Indicators (Italics), [Stakeholder Weightings] | December 2016 | Lower Sesan II | Under Construction | Lower Sekong | Full Development |
|---|---|---|---|---|---|
| Aggregate score | 80 | 65 | 63 | 17 | 16 |
| Provisioning [0.34] | 94 | 50 | 49 | 1 | 1 |
| Water Supply Relative to Demand [0.57] | 95 | - | - | - | - |
| Biomass for Consumption [0.43] | 94 | 26 | 26 | 0.01 | 0.01 |
| Regulation and Support [0.35] | 66 | 66 | 61 | 61 | 54 |
| Sediment Regulation [0.21] | 39 | 39 | 29 | - | 17 |
| Deviation from Water Quality Metrics from Benchmarks [0.32] | 81 | - | - | - | - |
| Flood Regulation [0.25] | 88 | - | - | - | - |
| Exposure to Water associated Diseases [0.22] | 67 | - | - | - | - |
| Cultural/Aesthetic [0.31] | 83 | - | - | - | - |
| Scenario | F1 | F3 | Biomass for Consumption Score |
|---|---|---|---|
| December 2016 | 13.9 | 2.63 | 93.9 |
| Lower Sesan II | 54.2 | 100 | 26.4 |
| Under construction | 55.6 | 100 | 25.5 |
| Sekong dam | 100 | 100 | 0.01 |
| Full development | 100 | 100 | 0.01 |
| Scenario | F1 | F3 | SR |
|---|---|---|---|
| December 2016 | 51.2 | 73.6 | 38.7 |
| Lower Sesan II | 51.2 | 73.9 | 38.6 |
| Under construction | 61.0 | 83.7 | 28.6 |
| Sekong dam | - | - | - |
| Full development | 80.1 | 85.6 | 17.2 |
| Water Quality Parameter | F1 | F3 | DvWQ Score |
|---|---|---|---|
| TSS | 100.0 | 4.6 | 78.6 |
| TP | 100.0 | 17.9 | 57.6 |
| TN | 33.3 | 0.4 | 96.4 |
| pH | 66.7 | 0.1 | 97.6 |
| EC | 0.0 | 0.0 | 100 |
| DO | 50.0 | 0.4 | 95.6 |
| COD | 66.7 | 1.0 | 91.9 |
| NO2 + NO3 | 0.0 | 0.0 | 100 |
| NH3 | 0.0 | 0.0 | 100 |
| NH4 | 100.0 | 12.9 | 64.1 |
| Ca | 100.0 | 6.1 | 75.2 |
| Mg | 100.0 | 3.1 | 82.4 |
| Na | 66.7 | 2.9 | 86.1 |
| K | 100.0 | 16.2 | 59.8 |
| Alkalinity | 100.0 | 4.8 | 78.1 |
| Cl | 33.3 | 0.3 | 96.8 |
| SO4 | 100.0 | 8.2 | 71.4 |
| Ca/Mg | 66.7 | 3.6 | 84.5 |
| Na/Cl | 100.0 | 2.6 | 83.9 |
| Na/K | 100.0 | 13.6 | 63.1 |
| Ca/SO4 | 100.0 | 10.8 | 67.1 |
| Month | Mean (mg/L) | Minimum (mg/L) | Maximum (mg/L) |
|---|---|---|---|
| January | 26.3 | 2.0 {4.5} | 131.0 |
| February | 18.1 | 2.0 | 47.0 {23.3} |
| March | 17.1 | 1.0 | 42.5 {18.2} |
| April | 15.8 | 0.7 | 53.0 {13.8} |
| May | 63.2 | 8.0 {13.6} | 354.0 |
| June | 68.7 | 10.0 {3.3} | 166.0 {3.3} |
| July | 97.9 | 20.5 {4.5} | 566.0 |
| August | 107.4 | 25.0 {10.0} | 381.0 |
| September | 105.6 | 22.5 {4.5} | 347.0 |
| October | 43.4 | 13.0 | 118.0 {10.0} |
| November | 40.3 | 6.0 | 128.0 |
| December | 25.8 | 2.5 | 102.0 {3.3} |
| Month | Mean (mg/L) | Minimum (mg/L) | Maximum (mg/L) |
|---|---|---|---|
| January | 0.06 | 0.01 {9.1} | 0.30 {4.5} |
| February | 0.04 | 0.02 | 0.08 |
| March | 0.03 | 0.001 {9.1} | 0.18 {9.1} |
| April | 0.06 | 0.01 | 0.19 |
| May | 0.08 | 0.02 | 0.21 |
| June | 0.13 | 0.03 | 0.47 {3.3} |
| July | 0.12 | 0.04 | 0.43 {9.1} |
| August | 0.14 | 0.07 | 0.25 |
| September | 0.10 | 0.03 | 0.18 |
| October | 0.11 | 0.001 {16.7} | 0.24 |
| November | 0.07 | 0.005 {18.2} | 0.18 |
| December | 0.08 | 0.01 | 0.23 |
| Water Associated Disease | F1 | F2 | F3 | WADI Score |
|---|---|---|---|---|
| Mekong schistosomiasis | 11 | 20.8 | - | 83.4 |
| Dengue fever | 100 | - | 97.1 | 1.5 |
| Governance & Stakeholders Major and Sub-Indicators (Italics), [Stakeholder Weightings] | Scores | |||
|---|---|---|---|---|
| Overall (N = 26) | Cambodia (N = 8) | Lao P.D.R (N = 6) | Vietnam (N = 10) | |
| Aggregate score | 43 | |||
| Enabling Environment [0.27] | 42 | 42 | 44 | 42 |
| Water Resources Management [0.23] | 50 | 59 | 44 | 48 |
| Rights to Resource Use [0.19] | 45 | 44 | 47 | 46 |
| Incentives and Regulations [0.18] | 45 | 42 | 53 | 43 |
| Technical Capacity [0.20] | 42 | 40 | 50 | 42 |
| Financial Capacity [0.19] | 36 | 33 | 40 | 39 |
| Stakeholder Engagement [0.27] | 46 | 48 | 57 | 37 |
| Information and Knowledge [0.50] | 41 | 43 | 53 | 34 |
| Engagement in Decision-Making [0.50] | 51 | 54 | 63 | 40 |
| Vision and Adaptive Governance [0.24] | 43 | 47 | 51 | 34 |
| Monitoring and Learning Mechanisms [0.51] | 39 | 41 | 41 | 33 |
| Strategic Planning and Adaptive Governance [0.49] | 47 | 54 | 64 | 34 |
| Effectiveness [0.22] | 43 | 40 | 45 | 45 |
| Enforcement and Compliance [0.33] | 37 | 29 | 37 | 45 |
| Distribution of Benefits from Ecosystem Services [0.36] | 42 | 41 | 42 | 45 |
| Water-Related Conflict [0.31] | 45 | 49 | 50 | 39 |
© 2020 by the authors. Licensee MDPI, Basel, Switzerland. This article is an open access article distributed under the terms and conditions of the Creative Commons Attribution (CC BY) license (http://creativecommons.org/licenses/by/4.0/).
Share and Cite
Souter, N.J.; Shaad, K.; Vollmer, D.; Regan, H.M.; Farrell, T.A.; Arnaiz, M.; Meynell, P.-J.; Cochrane, T.A.; Arias, M.E.; Piman, T.; et al. Using the Freshwater Health Index to Assess Hydropower Development Scenarios in the Sesan, Srepok and Sekong River Basin. Water 2020, 12, 788. https://doi.org/10.3390/w12030788
Souter NJ, Shaad K, Vollmer D, Regan HM, Farrell TA, Arnaiz M, Meynell P-J, Cochrane TA, Arias ME, Piman T, et al. Using the Freshwater Health Index to Assess Hydropower Development Scenarios in the Sesan, Srepok and Sekong River Basin. Water. 2020; 12(3):788. https://doi.org/10.3390/w12030788
Chicago/Turabian StyleSouter, Nicholas J., Kashif Shaad, Derek Vollmer, Helen M. Regan, Tracy A. Farrell, Mike Arnaiz, Peter-John Meynell, Thomas A. Cochrane, Mauricio E. Arias, Thanapon Piman, and et al. 2020. "Using the Freshwater Health Index to Assess Hydropower Development Scenarios in the Sesan, Srepok and Sekong River Basin" Water 12, no. 3: 788. https://doi.org/10.3390/w12030788