Influence of Local Habitat and Climatic Factors on the Distribution of Fish Species in the Tonle Sap Lake


1
Laboratoire Evolution & Diversité Biologique, UMR5174 EDB CNRS-Université Paul Sabatier-ENFA, F-31062 Toulouse, France
2
Centre for Biodiversity Conservation, Royal University of Phnom Penh, Russian Confederation Blvd, Phnom Penh 12000, Cambodia
3
Wonders of the Mekong Project, #186, Preah Norodom Blvd., P.O. Box 582, Phnom Penh 12000, Cambodia
4
Department of Biology, University of Nevada, 1664 N. Virginia Street, Reno, NV 89557, USA
5
Inland Fisheries Research and Development Institute, Fisheries Administration, #186, Preah Norodom Blvd., P.O. Box 582, Phnom Penh 12000, Cambodia
*
Author to whom correspondence should be addressed.
Water 2020, 12(3), 786; https://doi.org/10.3390/w12030786
Submission received: 14 February 2020
/
Revised: 27 February 2020
/
Accepted: 3 March 2020
/
Published: 12 March 2020
(This article belongs to the Special Issue Channels for Change: Integrating Multiple Disciplines for New Frontiers in Managing the Mekong River Basin)
Abstract
:Tonle Sap Lake (TSL) is a highly productive system and hosts a high fish diversity and is of paramount importance for sustaining protein supply for over 15 million Cambodians. Nevertheless, the ecology and factors influencing the spatial distribution of many fishes within the lake remain poorly understood. Using commercial fishing lot catch data from 1994/1995 to 1999/2000, fishing seasons and environmental data (land cover and bioclimatic variables), we describe spatial distribution of the eight most commercially important fish species, and investigate the effects of environmental factors on their distributions in the TSL. We found a strong variability in fish biomass across areas and between species. Specifically, Channa micropeltes was most abundant in the southern and northern sections of the TSL. Channa striata and Trichopodus microlepis were more common in the northern part of the TSL. Cyclocheilos enoplos, Barbonymus gonionotus, Pangasianodon hypophthalmus, and Gymnostomus spp. were abundant in the southern areas of the TSL while Phalacronotus spp. were abundant in few areas in both the north and the south. Flooded forest positively explained the variation in the biomass of P. hypophthalmus, C. striata, C. enopolos, and Phalacronotus spp. Likewise, the lake’s open water positively affects the biomass of P. hypophthalmus, C. enopolos, and Phalacronotus spp., while the agricultural field negatively impacts Gymnostomus spp. biomass distribution. We also found that some areas consistently hosted high fish biomass (e.g., lot 2, Kampong Thom; lot 6, Pursat; lot 2, Battambang, etc.). We, therefore, suggest that fisheries management and conservation planning focus on those areas, considering those areas significance as core fish habitat and important for catching fish.
1. Introduction
The Mekong River is the largest river in Southeast Asia and covers a drainage area of 795,000 km2 [1]. It lies within the Indo-Burma biodiversity hotspot [2] and is the second most diverse river system in the world, after the Amazon River [3,4]. The Mekong River is also one of the most productive inland fisheries in the world [4]. The annual estimated fisheries yield for the Lower Mekong Basin is approximately 2.6 million metric tons [5], providing food sources and animal protein for more than 60 million people living in the region [6]. A substantial part of the Mekong fishery yields come from the Tonle Sap Lake (TSL), the largest natural inland lake in Southeast Asia [1]. This lake is the world’s fourth most productive inland fishery [4] and its fisheries resources represent approximately 60% of Cambodia’s total annual production of inland capture fisheries of 767,000 metric tons [7]. The TSL, therefore, plays a crucial role in supplying fish products and protein to nearly two million people living in and around the TSL that rely on the fisheries as their primary food and economic resources [8]. Moreover, the TSL fisheries account for 60% of the total protein intake of approximately 15 million Cambodian people [8,9]. The TSL hosts a diverse fish fauna, with 296 fish species [10] and it is, therefore, considered to be a biodiversity hotspot [2] and has had the status of a UNESCO world heritage biosphere reserve since 1997 [11].
Despite the ecological, biological, and economic importance of the TSL, knowledge on its fish distribution patterns and factors driving those patterns is still limited. Recently, there has been an increase in studies related to fish diversity, community structure, and spatiotemporal distribution patterns in the TSL, e.g., [12,13], fish stock assessement [14,15], indiscriminate fishing effects [16,17,18], and fish response to flow seasonality and predictability [19,20]. To date, there have been no studies that have investigated the relationship between the environmental factors and the spatial distribution of the fish species within the TSL, although habitat–fish relationship is crucial for species management in lake fisheries [21,22,23].
In this study, we present information on the spatial distribution of the eight most abundant fish species in commercial-scale fishing lot catches, over the entire TSL. Then, we relate the distribution of each species to habitat and climate descriptors that are known as being influential on species distribution patterns [24,25].
2. Materials and Methods
2.1. Study Area
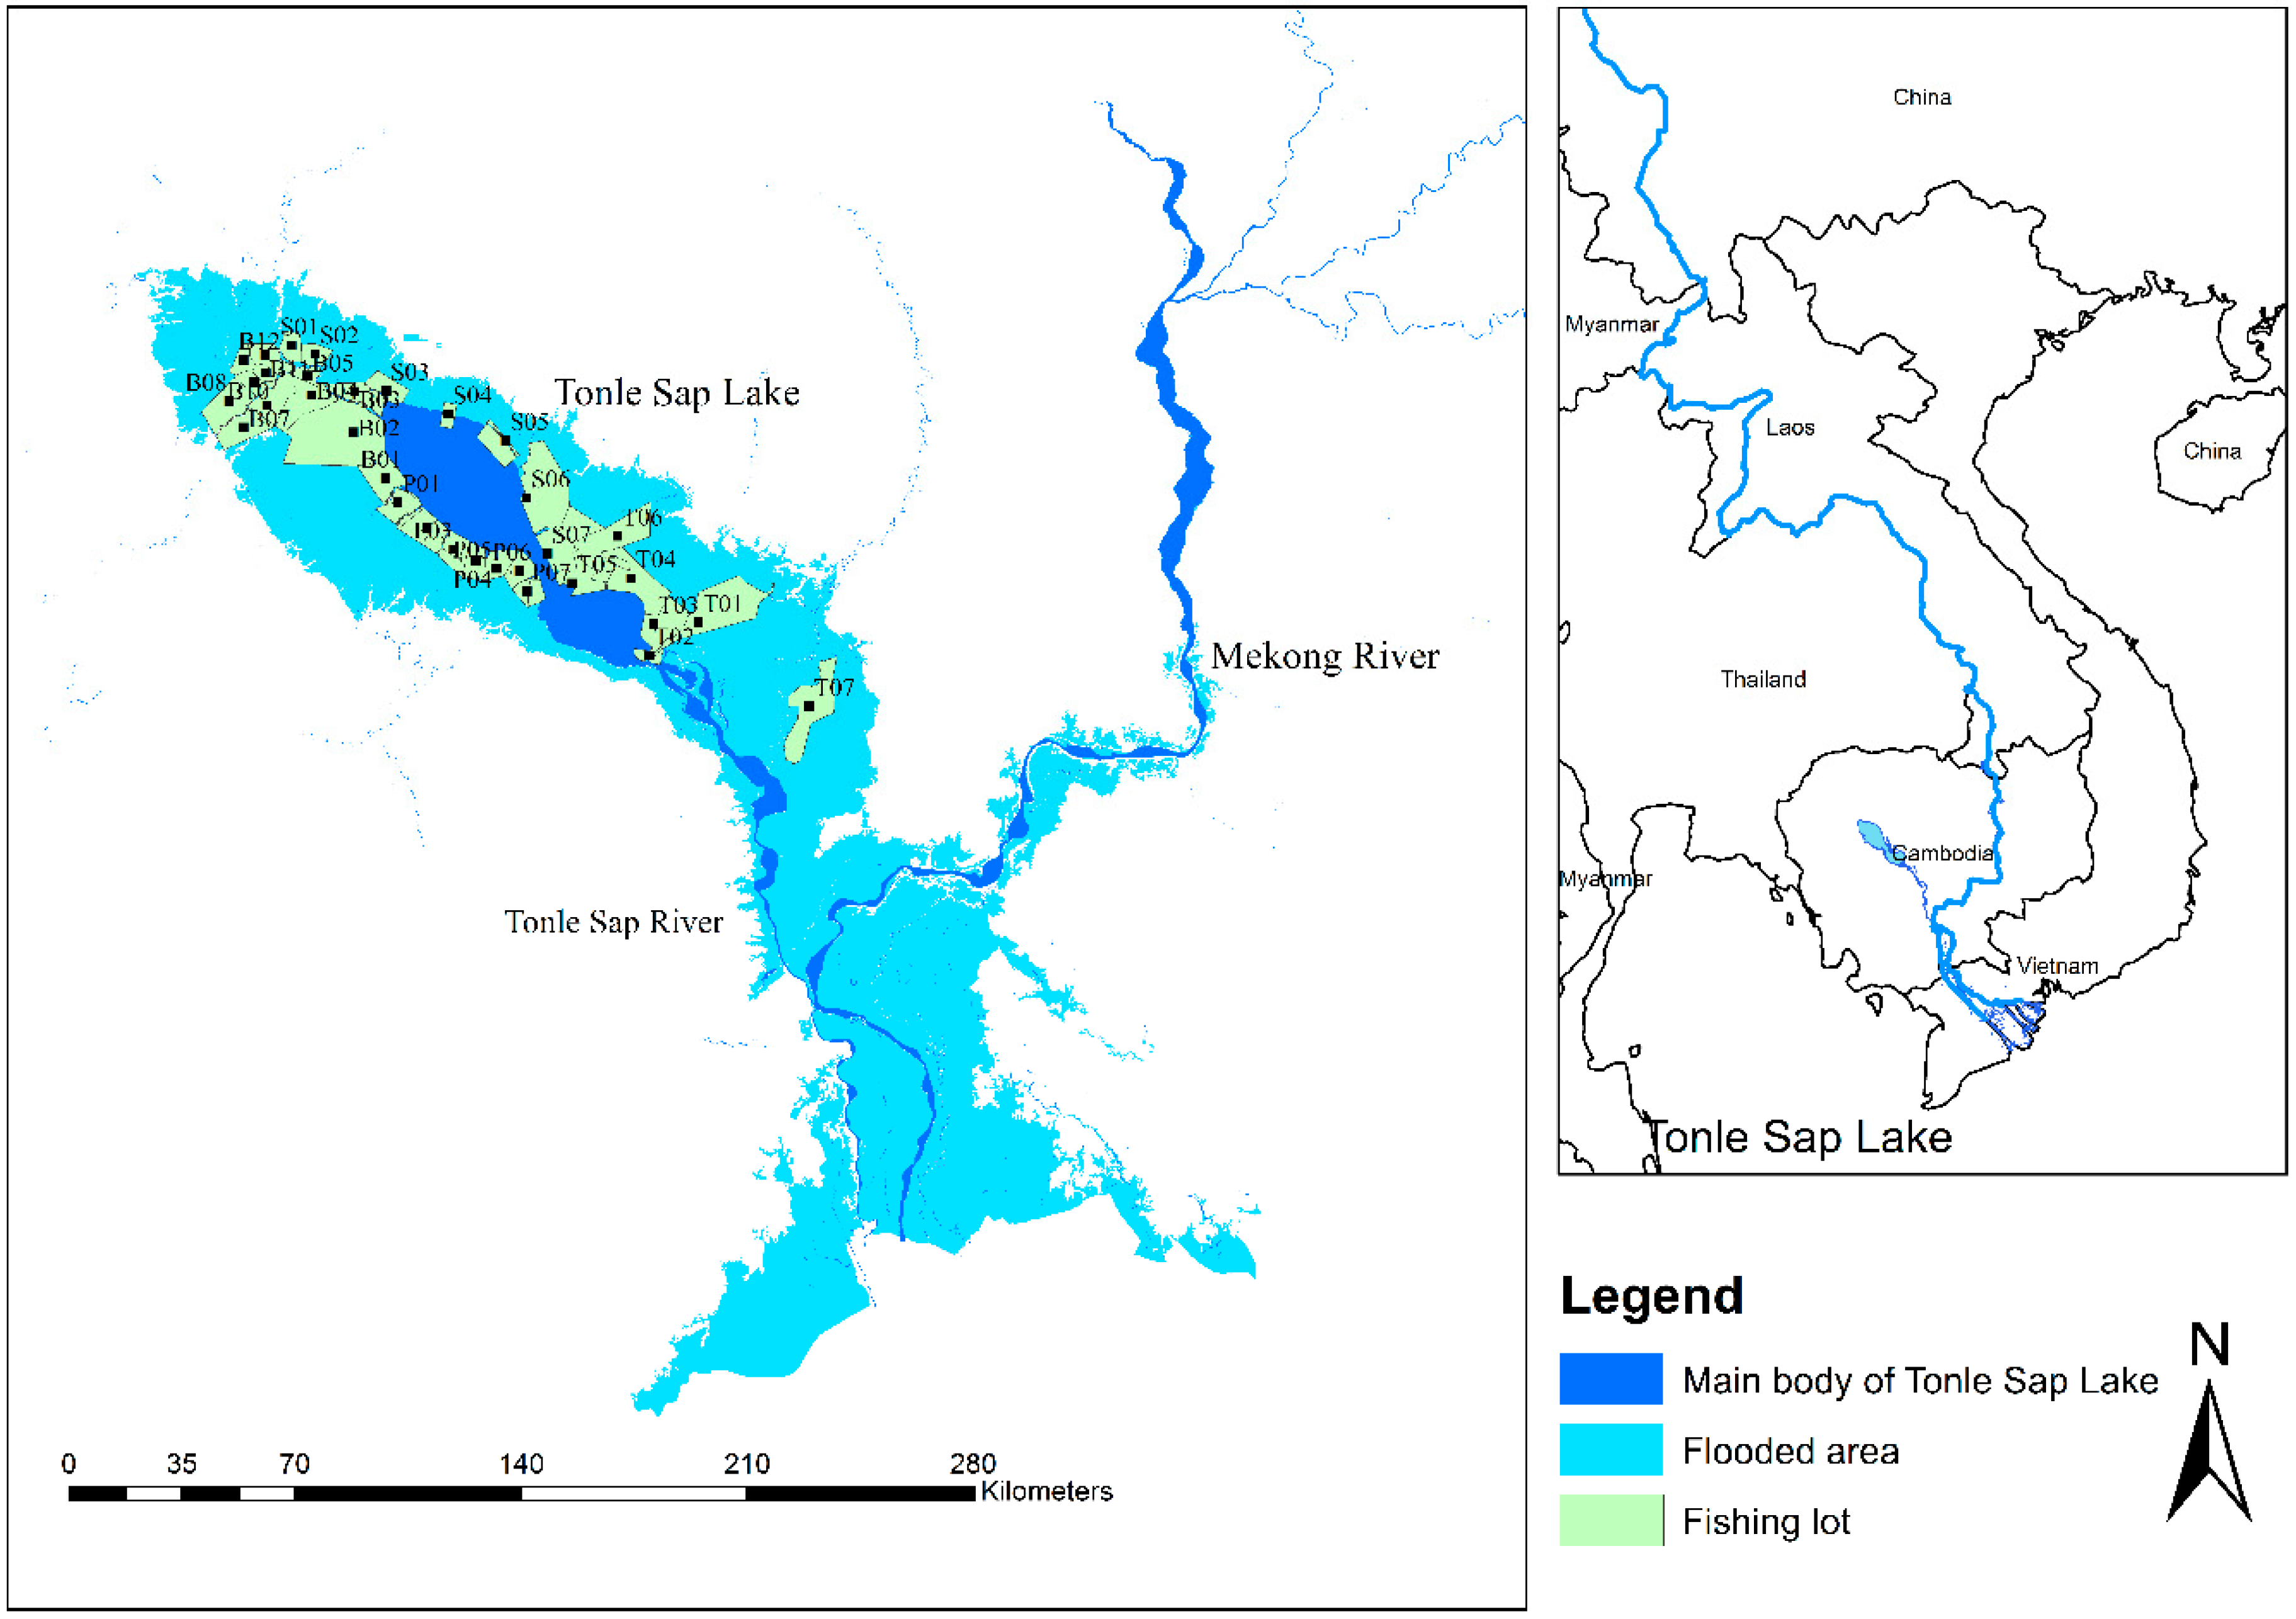
The study has been implemented in the TSL in the central part of Cambodia (Figure 1). It constitutes the largest wetland area in Southeast Asia [26], and is connected to the Mekong River by the Tonle Sap River (TSR). The TSL area is characterized by a tropical monsoon climate [27], with a seasonal periodicity in hydrological flows, making the TSL a flood-pulse system. In the wet season (May–October), the water flows into the TSL through the TSR due to increased water levels in the Mekong River; whereas, in the dry season (November–April), a reverse flow occurs through the TSR again, due to the receding water level in the Mekong River [1]. The surface area of the TSL seasonally fluctuates from 2500 km2 to 15,000 km2, driven by seasonal flood pulse from the Mekong River [1,28]. The water levels vary highly between seasons; the water depth ranges from 0.5 meters in April (dry season) to almost 10 meters in September–October (rainy season). This fluctuation leads to a varied surface area of the TSL throughout the year and, thus, creates heterogeneous habitats [1] that are inhabited by a variety of aquatic and terrestrial plant and animal species [13].
2.2. Data Collection
This study used the commercial-scale fishing lot catch assessment data provided by the Mekong River Commission (MRC) and the Inland Fisheries Research and Development Institute, Fisheries Administration, Cambodia. The MRC fish catch assessment program was implemented by the Cambodian Department of Fisheries (DoF), currently known as the Fisheries Administration (FiA), in cooperation with their sub-national counterparts at provincial and commune levels, and was funded by the Danish International Development Agency (DANIDA) through the MRC’s Project for the Management of Freshwater Capture Fisheries of Cambodia that led this study, in technicality [29]. The fish catch weight was assessed for thirty-three fishing lots in the TSL, over the period of 1994 to 2000 (Figure 1). Fishing lots were usually situated in the most productive fishing ground, and the licenses to operate the lots between October through May, each year, were obtained through a public auction, the procedures of which were defined in a government sub-decree [30]. The fishing lots were referred to as “geographically defined locations on a stretch of the river, river beach, or temporarily flooded land, which may or may not include flooded forest areas” [31] (see Figure 1 for the map showing the fishing lot areas in the TSL). The most common large-scale fishing gears used in the fishing lot system to harvest fish were (i) fence systems with pens, (ii) dragged seine nets and bamboo fences, and (iii) river barrages with u-shaped nets; the operations, photos, gear illustrations, and specification details of which are given in [32].
The river barrage with u-shaped nets (yor) was used in river and stream habitats in the fishing lot areas. To assess the yor’s catches, time stratification in each fishing month was applied, based on the lunar phase, the bright moon period where the peak catch occurred in a time window of about day 7 to day 14, after the new moon and dark moon period where the catch from this fishing operation was comparatively much lower and lasted for the rest of the month (about 23 days), over the study period. The daily number of hauls for the u-shaped net were also recorded. In addition, five samples on overall catch and catch by species per haul (catch per unit effort—CPUE) were taken per month per fishing lot, three of which were taken during the peak period and two during the dark moon (low) period, to estimate the monthly catch and catch composition for the river barrage with the u-shaped net fishery. The monthly sampling took place for the entire fishing season (six months), over the six-year study period from October 1994–May 1995 and from October 1999–May 2000.
A fence system with pens was used in the flooded forest and open area of the TSL to harvest fish. They were installed perpendicular to the receding waters in the drawdown period and parallel to the edge of the flood forest that borders the lake. The fence system could be several kilometers long and often formed arrow-shaped fences with pens connected to them. Sampling for this fishing gear was taken each month at the time when fishers harvested fish from the pens in each fishing season (six months), over the six-year study period (see below for the sample sizes taken for this fishing gear for the catch estimate).
Dragged seine nets and bamboo fences were used at the end of the fishing lot season. Overall fish catch per fishing time and the monthly frequencies of this fishing operation were recorded for the monthly catch estimate for each fishing season, over the six-year study period. At least 4 samples per fishing lot per month were taken for the catch composition estimate for both ‘dragged seine nets and bamboo fences’ and the ‘fence system with pens’ [29].
The overall catch and catch composition for each fishing gear used inside each fishing lot were estimated on a monthly basis and then aggregated to obtain the seasonal catch estimate, over the six-year study period.
This study included the eight most commercially important fish species from the fishing lot database, namely giant snakehead Channa micropeltes (Cuvier, 1831), striped catfish Pangasianodon hypophthalmus (Sauvage, 1878), striped snakehead Channa striata (Bloch, 1793), Cyclocheilos enoplos (Bleeker, 1849) (synonym of Cyclocheilichthys enoplos), small mude carp Gymnostomus spp. (synonym of Henicorhynchus spp.), comprising mainly Gymnostomus lobatus (Smith, 1945) and G. siamensis (Sauvage, 1881), Barbonymus gonionotus (Bleeker, 1849), sheatfish Phalacronotus spp. (synonym of Micronema spp.), and gourami Trichopodus microlepis (Günther, 1861) (synonym of Trichogaster microlepis). These study species account for an average seasonal catch of 6,507.47 metric tons (see Supporting Information Table S1), or 64.44% of the average seasonal total catch of all species estimated for all commercial fishing lots in the TSL, over a six-year fishing season from 1994/1995 to 1999/2000 [33]. Seasonal mean catches of the study species per fishing lot (for all 33 fishing lots in the TSL) for the entire assessment period is given in the Supporting Information Table S2. These fish species are among the most commercially important species for the Cambodian inland fisheries [34,35] and among the most dominant species in the TSL [12,16,36]. Moreover, the species chosen for this study contained both riverine (longitudinal migratory) species (i.e., P. hypophthalmus, C. enoplos, Gymnostomus spp., B. gonionotus, and Phalacronotus spp.) and floodplain residents (i.e., C. micropeltes, C. striata, and T. microlepis) that utilize the Tonle Sap floodplains, seasonally during their life cycles. Specifically, P. hypophthalmus and C. enoplos are omnivorous and highly migratory, whereas C. micropeltes and C. striata are carnivorous and more sedentary with localized or lateral migrations. Further, Gymnostomus spp. (i.e., G. lobatus and G. siamensis) and B. gonionotus are migratory fishes that prefer general habitats for spawning [37,38].
To ensure high quality field data, fisheries research officers at the central and provincial DoF received training in fish identification, sampling and sub-sampling techniques, data recording, catch assessment protocols, and use of the catch assessment software. Catch per unit effort (CPUE), overall catch, and catch composition were computed following concepts and formulas outlined in [39]. Fish were identified to the species level using the keys in [40] and was updated using [41] for this study.
2.3. Data Preparation
Fish catch was standardized across fishing lots as the average annual fish biomass per hectare (kg/ha) to account for the differences in the sizes of fishing lots. ArcGIS version 10.2.03348 was used to determine the surface area of the three main land-cover types in each fishing lot, namely flooded forest (FF), lake’s open water (OW), and agricultural field (AF), within the TSL floodplain. Given that the fishing lot size was not uniform, each land cover type was expressed as a percentage cover (%). Land-cover data were extracted from the Cambodian Land Use 1993 map that best fit with the fish catch period (1994–2000) (Table 1). Moreover, these data were strongly correlated with the data extracted from the land-use 2002 map for the flooded forest (Pearson correlation, r = 0.979, p < 0.001) and agricultural field (r = 0.837, p < 0.001), indicating that the land use did not strongly change during the sampling period. Additionally, nineteen bioclimatic variables were extracted from the 1-km2-resolution WorldClim layers for the period of 1950–2000 (Table 2) [42]. Despite the limited spatial range of this study (approximately 200 × 200 km), climate variables differed across the lake; thus, these variables are relevant for analyzing the correlations between the fish biomass and climate features (Table 2). The 19 bioclimatic variables were summarized using a Principal Component Analysis (PCA), and the first three axes of the PCA accounted for 90.3% of the total variance in the climate data (64.60%, 15.15%, and 10.79%, respectively (see Figure 2)). The first axis (clim1) represents the temperature and precipitation range, with higher values corresponding to higher temperature and precipitation. The second axis (clim2) represents the temperature range in the warm season, and the higher values correspond to the high temperature in the warm season. The third axis (clim3) represents the precipitation range in the wet season, and the higher values correspond to the high precipitation in the wet season. The PCA axis selection was based on the eigenvalue value higher than 1.
2.4. Statistical Analyses
Generalized Linear Models (GLMs) were used to investigate the relationships between the spatial distribution of each species and the local habitat factors. GLM is an extension of linear regression. The explanatory variables were local habitats (FF, OW, and AF; see Table 1) and regional climatic variables (three variables summarized from the PCA; see Figure 2). Before building the GLM models, the local habitat variables were standardized to zero mean and unit variance (ranging from –2 to +2), to get the same scale as the variables obtained from the PCA score using the “vegan” package [43]. The response variable was the mean value of the annual fish biomass per hectare (kg/ha) for each species.
All statistical analyses were performed using the R program v.3.3.3 for the Windows statistical software package (http://www.r-project.org) [44].
3. Results
3.1. Spatial Distribution
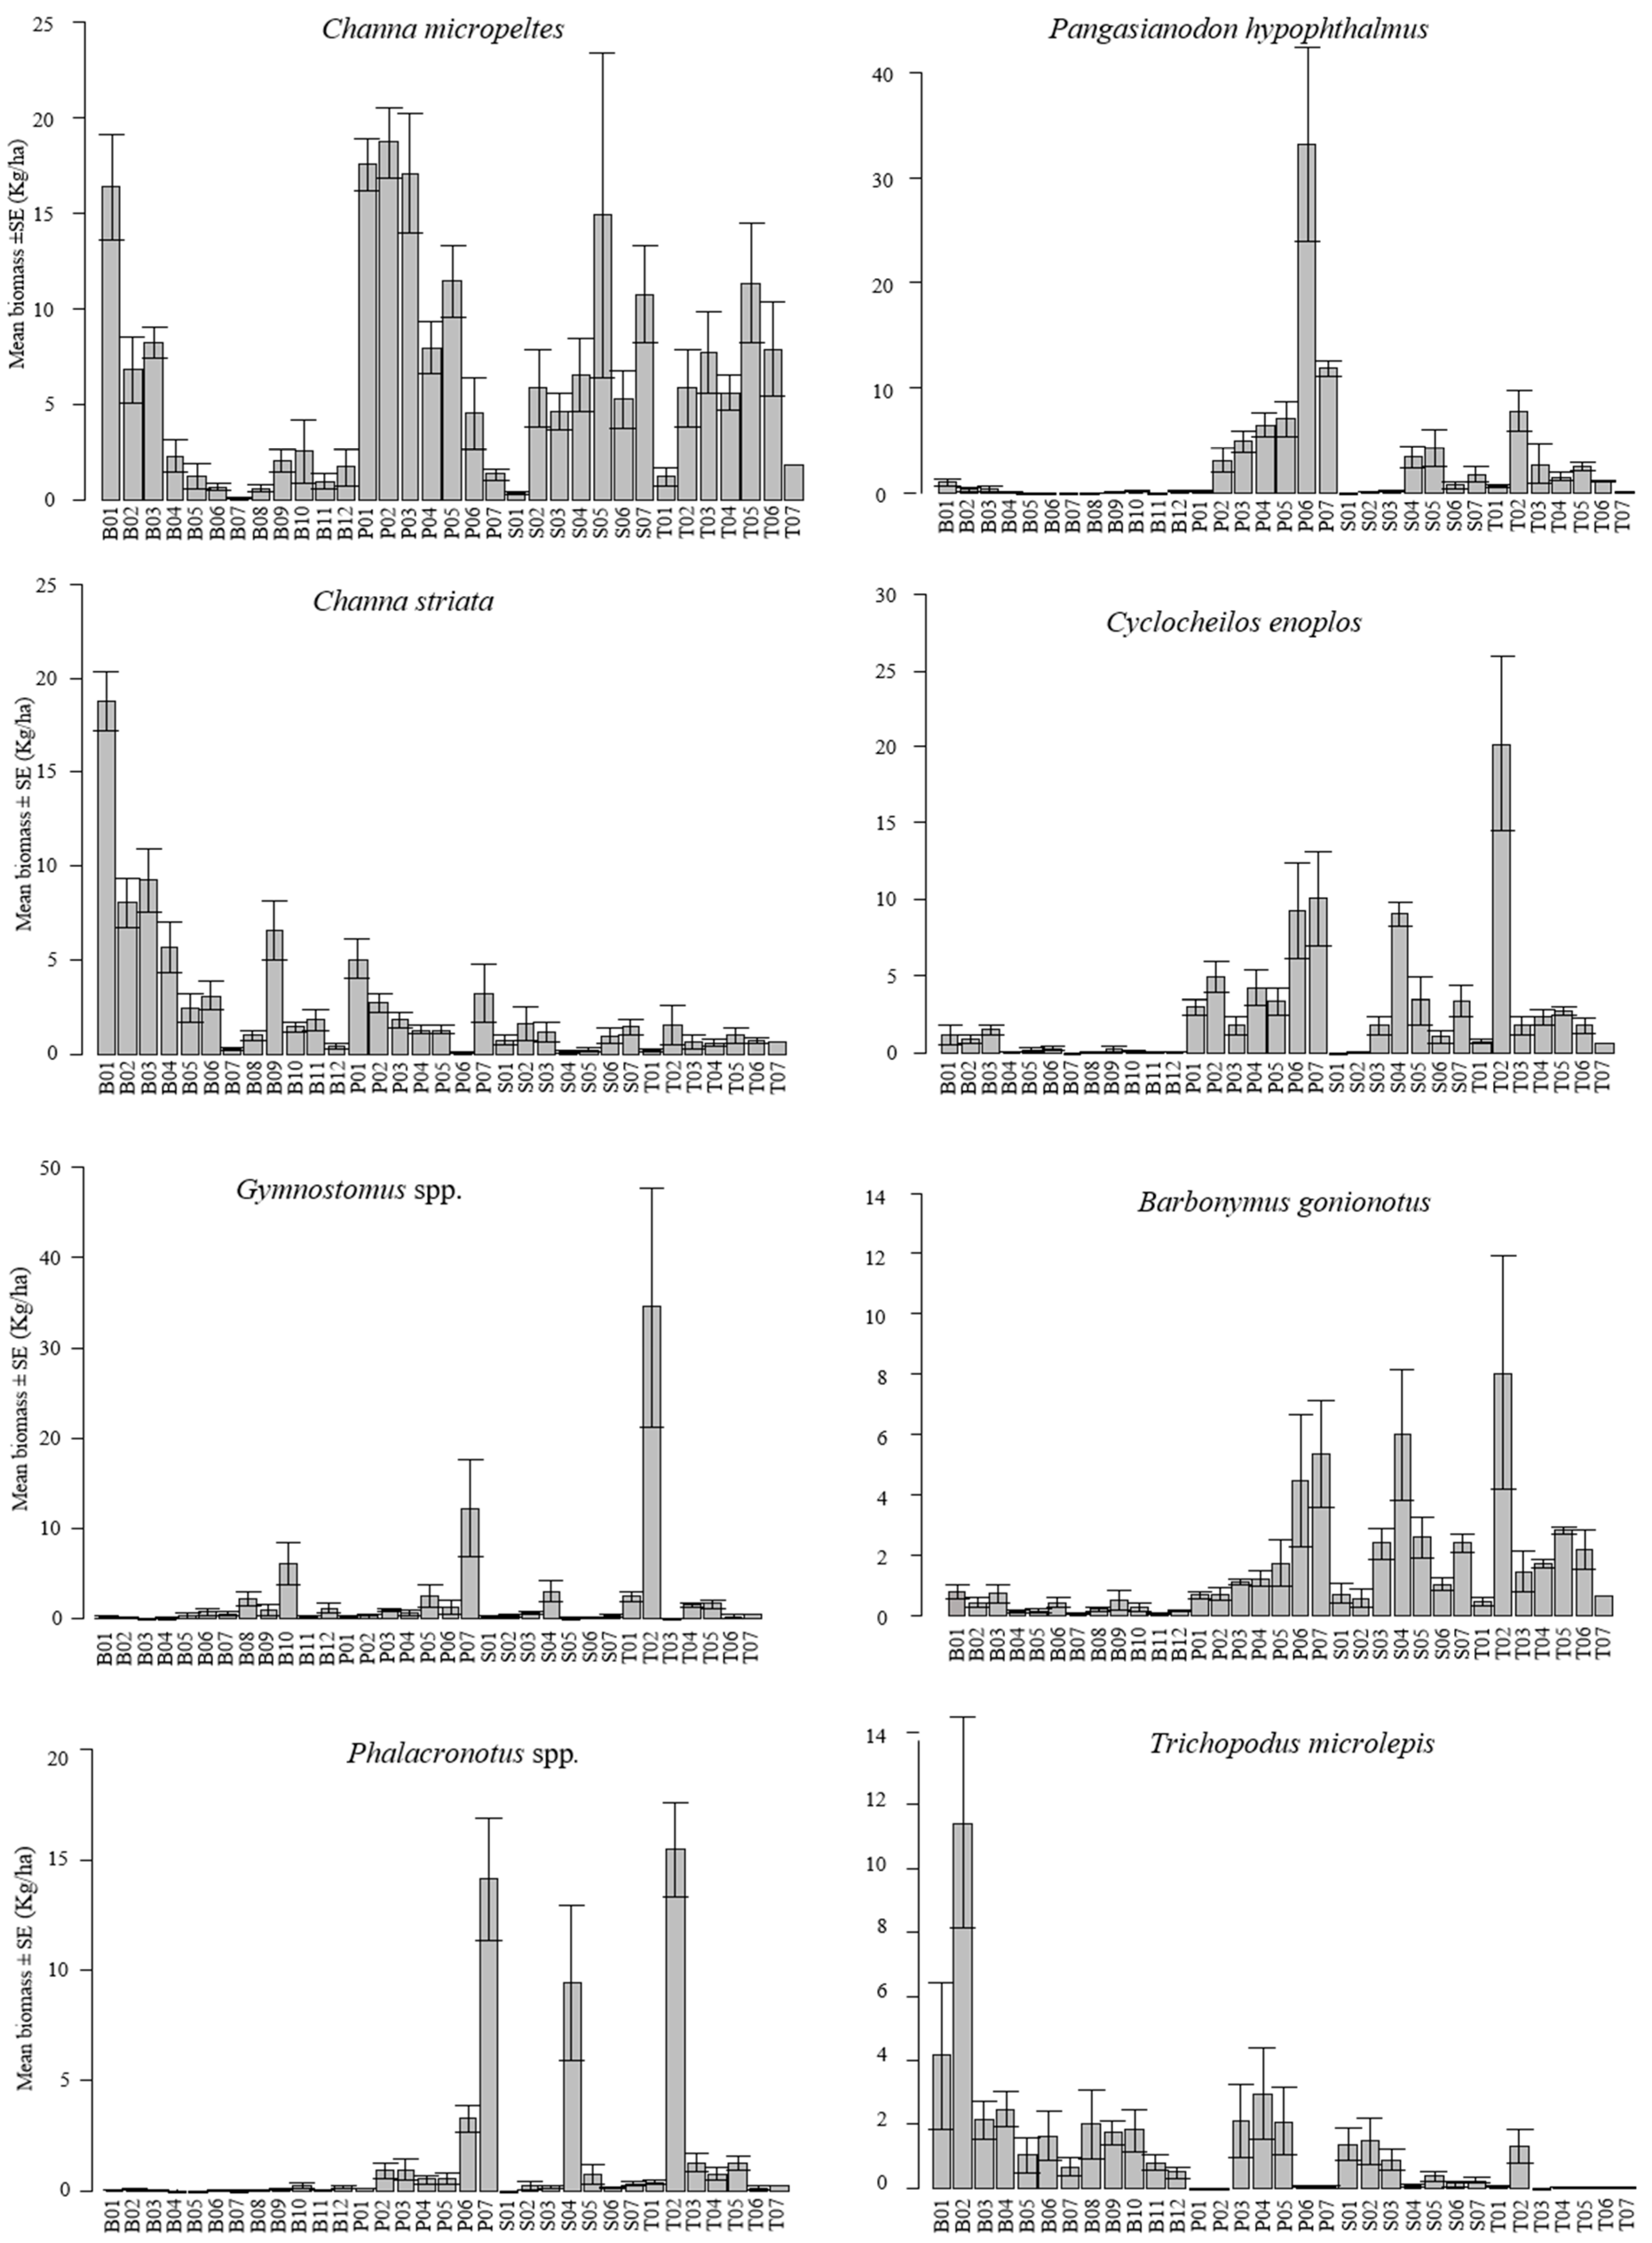
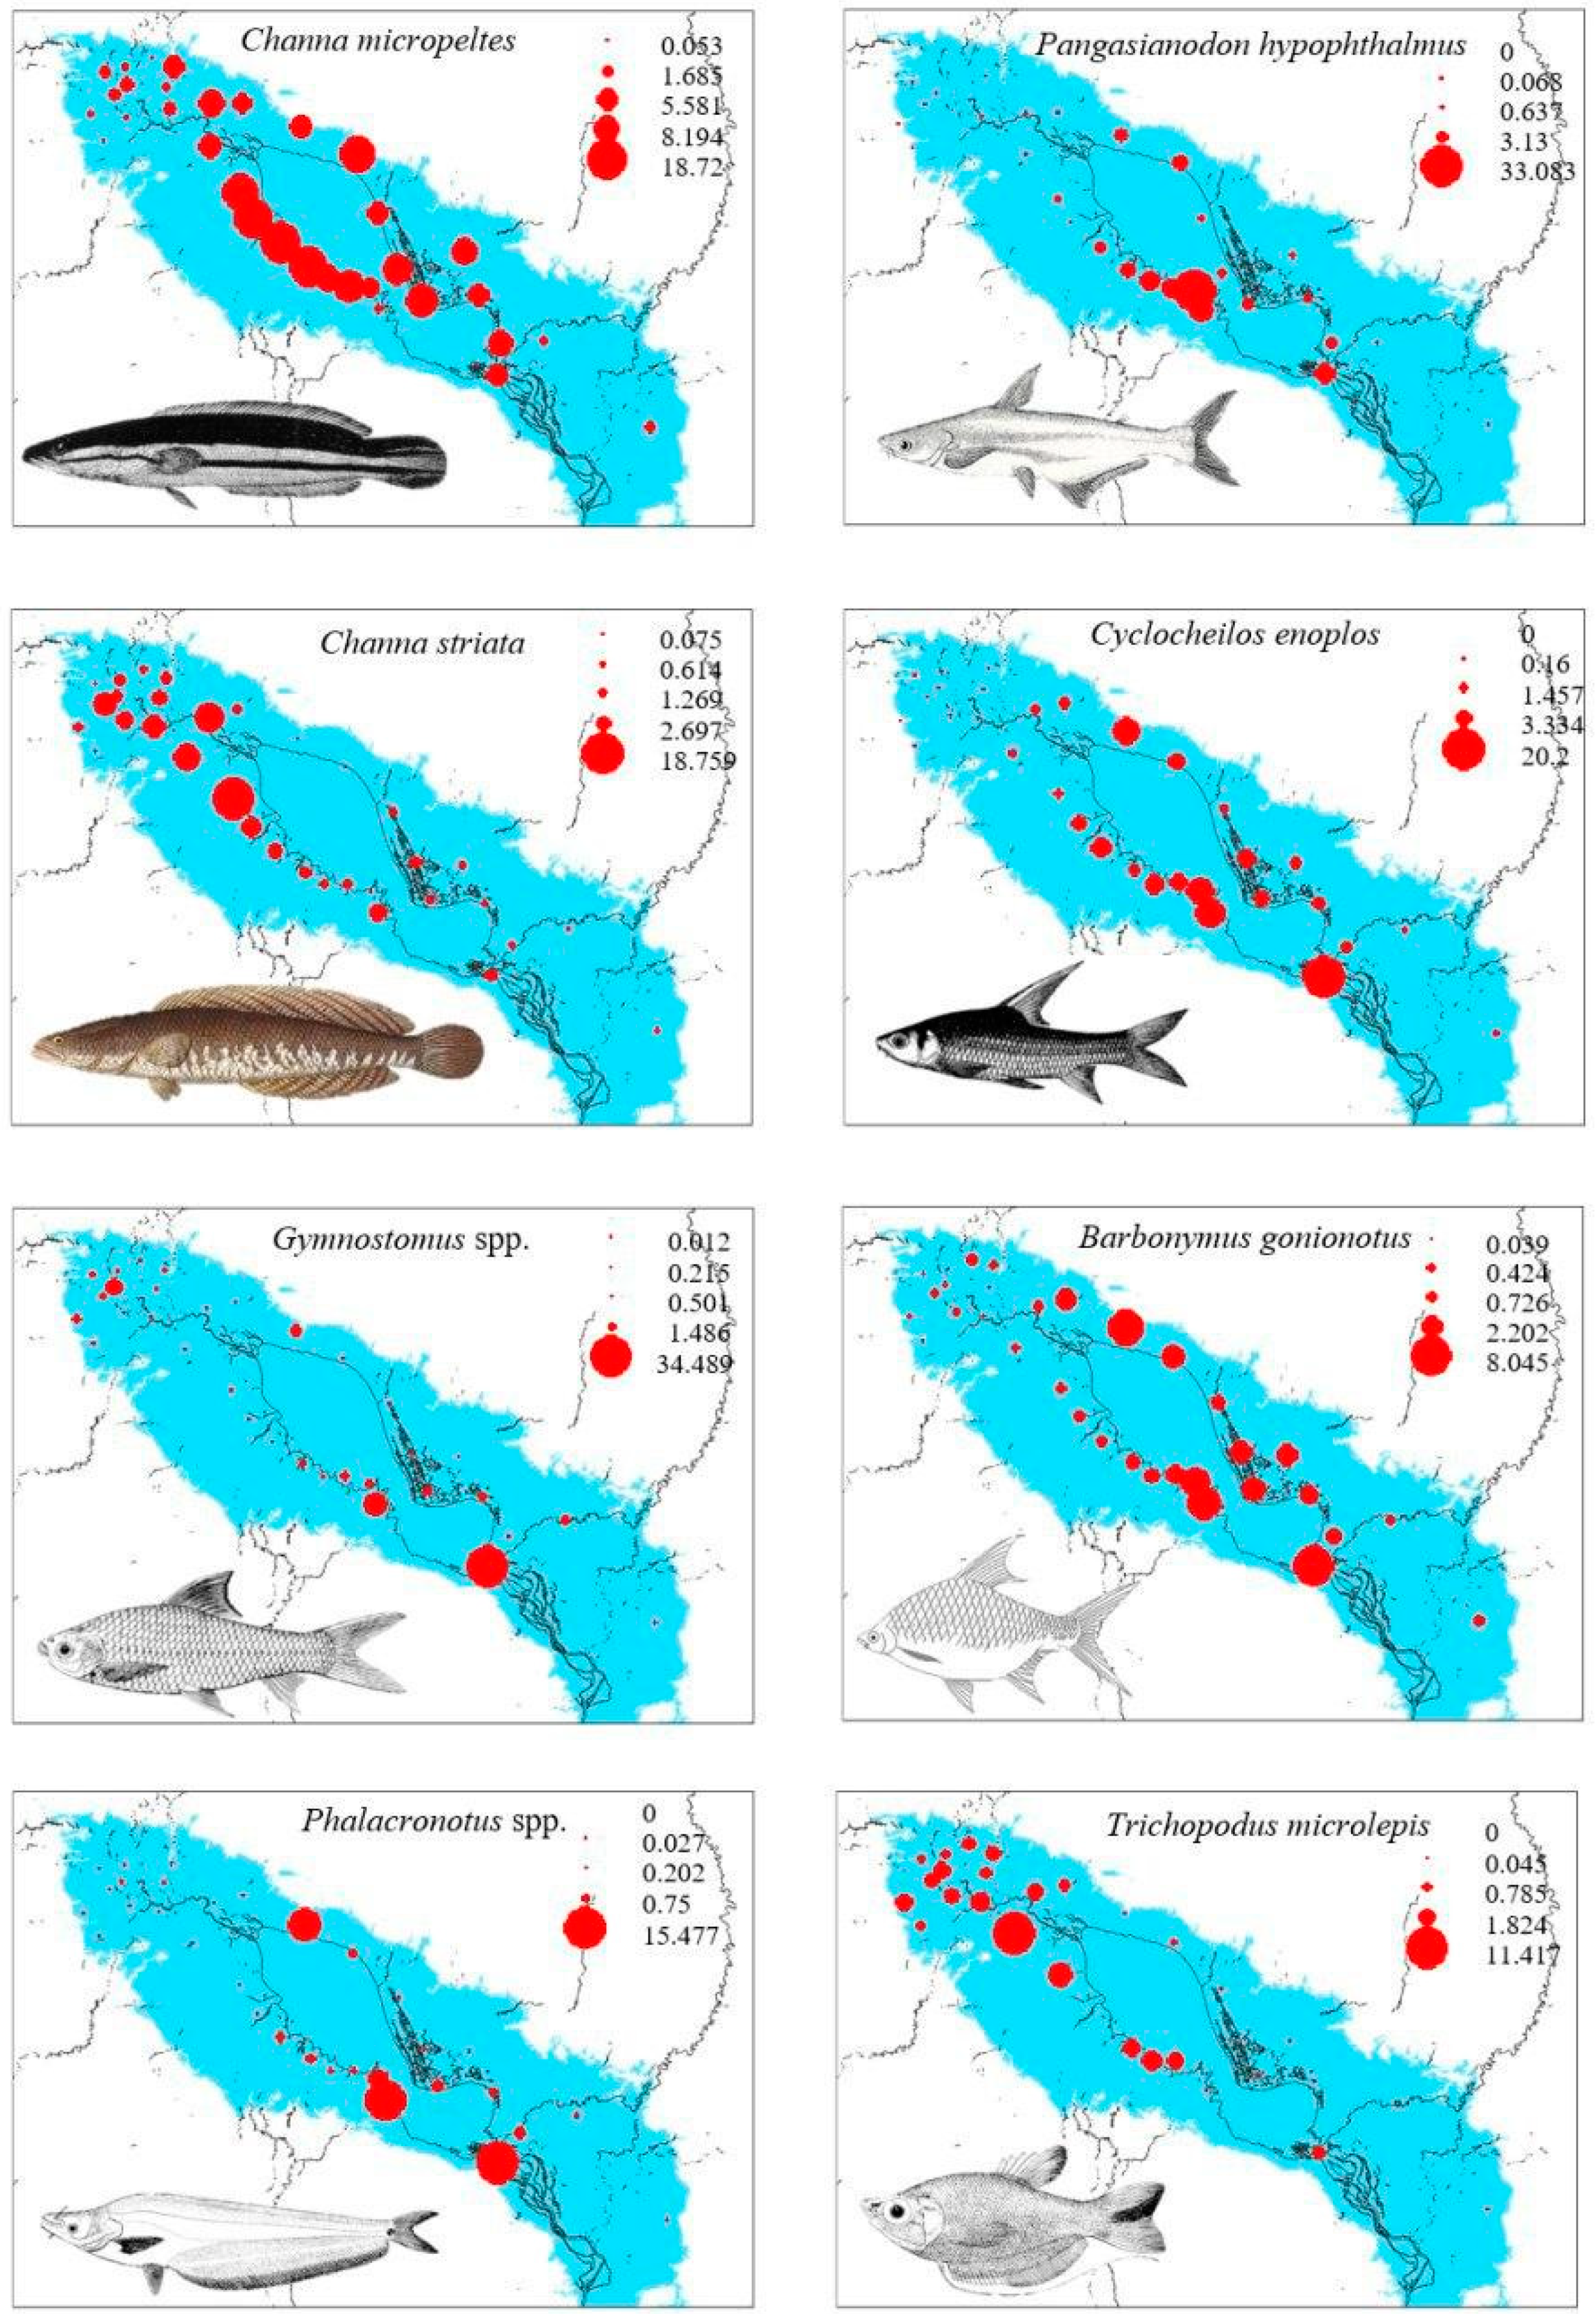
Figure 3 shows a strong variability in the study species’ biomass per hectare across fishing lots. Moreover, some lots consistently had similar mean seasonal fish biomass per hectare, whereas other lots showed quite variable fish biomass levels over the six-year study period. Most high biomass fishing lots, despite a substantial temporal variability among the mean seasonal catches, consistently had high biomass levels for most study species (Figure 3). From a spatial perspective, C. micropeltes was abundant from the southern to northern part, along the lake’s ecological gradient, although low abundances occurred in the most northern area of the lake (Figure 3 and Figure 4). C. striata and T. microlepis revealed a similar pattern of the species’ biomass distribution. They were more abundant in the northern part of the lake. In contrast, C. enoplos, B. gonionotus, P. hypophthalmus, and Gymnostomus spp. had their high biomass levels distributed from the central to the most southern section of the lake. Phalacronotus spp. were abundant in few southern areas of the lake (Kampong Thom and Pursat Provinces) and also occupied few areas in the northern part of the lake in the Siem Reap Province (Figure 1 and Figure 4).
3.2. Relationships between Fish Distribution and Local Habitat and Climatic Factors
The GLM models that predicted species biomass from the land cover type and climate data, albeit being significant for all species, showed an important variability in the model quality among the study species, with model’s coefficient of determination (adjusted-R2) ranging from 0.509 for T. microlepis to 0.836 for C. enoplos (Table 3). Then, the influence of each variable on the fish species was assessed by the standardized regression coefficients of the variables in the GLMs. The biomass of C. enoplos was positively correlated with the percentage cover of the flooded forest, the percentage cover of open water and the temperature and precipitation range. The biomass of P. hypophthalmus was significantly associated with a high value of the percentage cover of the flooded forest, the percentage cover of open water, and the temperature and precipitation range, but was negatively associated with a temperature range in the warm season. The biomass of C. striata was positively correlated with the percentage cover of the flooded forest, but negatively related to the temperature and precipitation range, temperature range in the warm season and the precipitation range in the wet season. In addition, the biomass of Phalacronotus spp. had a significantly positive correlation with the percentage cover of the flooded forest, the percentage cover of open water, and the precipitation range in the wet season. The biomass of B. gonionotus was positively associated with the percentage cover of open water and the precipitation range in the wet season. The biomass of Gymnostomus spp. was negatively linked with the percentage cover of the agricultural field, but positively connected with temperature and precipitation range, and temperature range in the warm season. Additionally, the biomass of C. micropeltes was negatively associated with temperature range in the warm season. Finally, the biomass of T. microlepis was negatively correlated with temperature range in the warm season and precipitation range in the wet season. The summary of the GLM standardized regression coefficients and the relationship between the variables is given in Table 3.
4. Discussion
Our results demonstrated that, based on the standardized biomass per unit area (kg/ha) of each species across all 33 fishing lots, the eight study fishes had heterogeneous distribution patterns within the lake. Channa micropeltes was distributed throughout the lake, whereas Channa striata and Trichopodus microlepis occurred more in the northern part of the lake. In contrast, Pangasianodon hypophthalmus, Gymnostomus spp., Cyclocheilos enoplos, Barbonymus gonionotus, and Phalacronotus spp. were distributed from the central to the southern area of the lake. Our findings are consistent, and indeed strengthen the results of previous studies that found floodplain resident or non-migratory fishes were more abundant in the northern section of the lake [12,33,45], the area that is predominantly covered by flooded forest, swampy and shrub land, aquatic vegetation and rice fields [14]. Those floodplain residents spend most of their lifespans in the flooded forest, inhabiting the lake or swamps during the dry season and migrating to the flooded and open areas of the lake during the wet season for spawning and foraging [13]. In contrast, the transitional zone (ecotone) between the TSL and TSR (southern lake) are colonized preferentially by migratory fishes, e.g., C. enoplos, Gymnostomus spp., B. gonionotus, and Phalacronotus spp. that use the TSR as a seasonal migration corridor in their life cycles between the Mekong River and the TSL.
The observed fish distribution patterns were correlated with different habitats and climatic characteristics, supporting the hypothesis that fish responses to their environmental determinants are species-specific [46]. In temperate rivers and lakes, the local environmental condition is a major determinant of the fish spatial distribution [47,48,49,50]. Such a pattern also applies to tropical rivers such as the Mekong [51,52]. Within the TSL, we showed that the percentage cover of open water is positively correlated with the biomass of P. hypophthalmus, C. enoplos, B. gonionotus, and Phalacronotus spp., indicating that the open water is likely a preferred habitat for these species. This result is consistent with previous studies demonstrating that open water is an important habitat for P. hypophthalmus, C. enoplos, B. gonionotus, and Phalacronotus spp. [40,53,54,55,56]. These species are usually intolerant to low oxygenated water, and need oxygenated water in the open water area of the lake as this area is exposed to wind mixing with water currents [12]. Moreover, these fishes are known to feed in the lake’s open area on zooplankton, insect larvae, and crustaceans [37].
Our results also showed positive correlation between P. hypophthalmus, C. striata, C. enoplos, and Phalacronotus spp., and flooded forest areas because the areas are likely important habitats for these species to rear and forage. The inundated forest might indeed constitute an appropriate feeding ground providing a large diversity of terrestrial prey (insects, frogs, small mammals) for opportunistic predators, such as Phalacronotus spp. and C. striata [35]. Specifically, the flooded riparian forest is also the principal spawning grounds for some floodplain species, such as C. striata [37,40,55]. C. striata actually needs flooded vegetations for breeding and hatching [40,57].
Interestingly, Gymnostomus spp., the most abundant species in the Lower Mekong Basin, were found to negatively associate with agricultural field. This might suggest that the agricultural fields are not surrogate to the flooded forest areas, but adversely impact species abundance. Gymnostomus spp. are migraters, and are not likely to tolerate poor water quality, e.g., low oxygenated and polluted waters. Pesticides, herbicides, and chemical fertilizers are widely applied to intensify the rice production in the TSL floodplains [58]. This indeed pollutes waters and deteriorates water quality, and thus, negatively affects the species distribution patterns.
Apart from the physical environment, fish distribution was also related to climate factors. Although the link between climate and fish distribution is obvious in temperate rivers and streams [59,60], it has rarely been investigated in tropical environments, and the results of this study, together with those of Chea and his colleague [61] on the lower Mekong mainstream, revealed that temperature and precipitation gradients associate with fish distributions in both the Mekong River and the TSL. For instance, this study found that catches of floodplain species, e.g., C. striata were negatively correlated with the temperature and precipitation, while the migraters, such as P. hypophthalmus, C. enoplos, and Gymnostomus spp. biomass were positvely correlated with temperature and precipitation. Therefore, fewer floodplain residents were caught when the temperature is warmer because these floodplain residents might hibernate in holes, tree roots, or flooded forests to avoid the heat effect. The floodplain residents mostly live in the lakes and marshes or swamps on the floodplains near the river channels, and migrate to flooded areas only during the flooded season [62]. Indeed, floodplain residents such as C. striata and C. microlepis have developed their external organs to breath the air and, thus, could adapt to the low oxygen or harsh environmental conditions that enables them to survive in swamps and small floodplain lakes during the dry season [62]. In contrast, longitudinal migratory fishes appeared to be positively correlated with a temperature range because, during the dry season, when the water level recedes, longitudinal migratory fishes have to migrate from the TSL back to the Mekong River to escape adverse environmental conditions in the floodplain and the lakes, to better water quality and deep pools for the dry season refuge [35].
Furthermore, the precipitation range in the wet season had a significantly positive correlation with longitudinal migratory species, e.g., Gymnostomus spp., B. gonionotus, and Phalacronotus spp., but negatively associated with floodplain residents, i.e., C. striata and T. microlepis. Indeed, early tropical monsoon rainfalls were identified as a migration trigger where many Mekong fishes start to disperse for spawning and longitudinally migrate down the Mekong River to lower floodplain habitats such as the TSL and the area south of Phnom Penh, for feeding [1,63]. Fishes are prone to be captured on their migration routes during the period. Both species abundance and richness were also found to increase in the catch composition during this early wet season in the Mekong and TSR [19]. In contrast, the floodplain residents migrate more locally in the floodplain area and, thus, is less likely to be vulnerable to high fishing pressure, during the high precipitation period.
The spatial heterogeneity of the fish biomass levels found in this study provides important information for fisheries management in the TSL. First, some areas consistently had high fish biomass across years. For example, lot T02 was characterized by high biomass of C. enoplos, B. gonionotus, Gymnostomus spp., and Phalacronotus spp because this lot possessed two main habitats, i.e., flooded forest (70%) and open water (30%). The large percentage cover of the flooded forest and open water might, therefore, be of particular importance to sustain the biomass of these species. Thus, specific attention should be given to the conservation of the environmental quality of this lot to maintain the productivity of these fishes. Second, we observed that some specific lots could be very important for one species but not for others. For instance, lot P06 contained the highest biomass of P. hypothalamus (31%) of all fishing lots. This was because the lot was composed of two important habitats—flooded forest (50%) and open water (45%), while the agricultural field was made up of only 5% of the total land cover. The local habitat, i.e., flooded forest and open water is a key contributing factor sustaining the high abundance of P. hypothalamus in this lot. Third, only C. micropeltes was observed to distribute widely across the lake, and the seven other study species had much more restricted distributions. Overall, this information confirms that it is worthwhile focusing conservation actions on a few, well-designed lots that have high fish biomass in order to sustain fish yields in the TSL.
Understanding the species–habitat relationships provides useful information to better understand fish environmental requirements, which is important to conserve fish biological diversity and productivity. This information might also be used to inform conservation policy to increase fish yields in some areas of the lake that experiences lower fish biomass levels. For instance, we indicated that none of the fish species benefitted from the agricultural landscapes, and therefore, these agricultural lands were not equivalent to flooded forests to sustain fish populations. We, therefore, encourage not only conserving flooded forest areas that are crucial for tropical aquatic ecosystem functioning [64,65], but also maintaining adequate habitats for most fish species that benefit from the flooded forest in the TSL.
Finally, the results, based on 1994–2000 fish catch data, might not reflect the current situation in the TSL, since human pressure has substantially changed the ecology and the surrounding environments over the past two decades [66,67], with likely consequences on both aquatic habitats and land-use. It would, therefore, be useful to determine the extent to which the spatial distribution of current fish catches fit with the patterns we reveal and to analyze land-use changes experienced in the TSL during the past two decades. Similarly, climate change likely affected fish distributions, and as demonstrated here, temperature and precipitation likely affected different species in different manners. However, as indicated in our discussion, our results are still consistent with some recent studies examining the fish distribution patterns, diversity and assemblage structure in the TSL, e.g., [12,19] and elsewhere, such as in the floodplain-lake of the Amazon, where fisheries yields were significantly varied in accordance with the amount of flooded forest habitats [68]. The results presented in this paper could also serve as a reference point to quantify the changes in fish biomass and distributions in the lake. For future work, it is important to establish spatial and temporal trends on fish biomass and the drivers of change in the TSL for a better investigation into the contemporary spatial and temporal distribution patterns of fish species utilizing the TSL ecosystem.
5. Conclusions
The TSL supports high fisheries resources sustaining food security for over 15 million Cambodians, for thousands of years. Determining the spatial distribution of fish species and drivers affecting their distribution patterns are of crucial importance for fisheries management and conservation actions. Using commercial fishing lot fish catch and environmental data, we found a strong variability in biomass across the lake. We found some fishing lots had high biomass levels, eventhough a strong temporal variability was observed over the study period. We also found that the distributions of the eight observed fish species in the TSL are heterogenous across the lake’s areas, and differred between species. Furthermore, the spatial distributions of these study species in the TSL were found to be largely regulated by local habitat characteristics (i.e., flooded forest, open water, agricultural field) and climatic factors (i.e., precipitation, temperature) across the lake. Different fish species were found to respond differently to these environment drivers. Therefore, local habitat and climatic factors play a pivotal role in driving the heterogeneous spatial distribution of eight economically important study fish species in the TSL. We, therefore, suggested that environmental requirements for each species be considered to effectively manage fish diversity and resources, and that areas with high fish biomass should be the focus of fisheries management and conservation planning in the TSL. The information found in this study is, to a certain extent, still useful for management decision to sustainably manage the lake’s fish resources that are economically and nutritionally crucial to a large part of the Cambodian people and the Mekong Basin [8,9].
Supplementary Materials
The following are available online at https://www.mdpi.com/2073-4441/12/3/786/s1, Table S1: Total fish biomass (metric ton) of the eight study species and their relative biomass to the total catches of all 33 fishing lots in Tonle Sap Lake assessed for six fishing seasons from October, 1994 – May 1995 to October 1999 – May 2000. For species codes, see Table 1, Table S2: Mean ± standard error of fish biomass (metric ton) per fishing lot of the eight study species in Tonle Sap Lake for the six fishing seasons from October, 1994 – May, 1995 to October, 1999 – May, 2000. For species codes, see Table 1.
Author Contributions
For research articles with several authors, a short paragraph specifying their individual contributions must be provided. The following statements should be used “conceptualization, B.C., S.B. and S.L.; Methodology, B.C. and S.L.; Software, B.C.; Validation, S.B., S.L. and Z.S.H.; Formal analysis, B.C. and S.L.; Investigation, P.B.N. and Z.S.H.; resources, P.B.N.; Data curation, P.N.; Writing—original draft preparation, B.C.; Writing—review and editing, P.B.N., S.B., Z.S.H. and S.L.; Visualization, P.B.N., S.B. and Z.S.H.; supervision, S.L.; Project administration, S.L. and Z.S.H.; Funding acquisition, S.L. and Z.S.H.”, please turn to the CRediT taxonomy for the term explanation. Authorship must be limited to those who have contributed substantially to the work reported. All authors have read and agreed to the published version of the manuscript.
Funding
The study was financially supported by the Erasmus Mundus Program (Lotus+ Project), Belmont-Forum (TLSCC Project), the USAID-supported project: Wonders of the Mekong, and Laboratoire Evolution & Diversité Biologique (EDB), Université Paul Sabatier-Toulouse III. The EDB lab is supported by the “Investissement d’Avenir” grants (CEBA, ref. ANR-10-LABX-0025; TULIP, ref. ANR-10- LABX-41).
Acknowledgments
We are also grateful to the Inland Fisheries Research and Development Institute (IFReDI) of the Cambodia Fisheries Administration and the Fisheries Program of the Mekong River Commission (MRC) for providing datasets used in this study.
Conflicts of Interest
The authors declare no conflict of interest.
References
- Mekong River Commission (MRC). Overview of the Hydrology of the Mekong Basin; Red Plough International Co. Ltd., Ed.; Mekong River Commission: Vientiane, Laos, 2005; ISSN 17283248. [Google Scholar]
- Allen, D.J.; Smith, K.G.; Darwall, W.R.T (Compilers). The Status and Distribution of Freshwater Biodiversity in Indo-Burma; IUCN: Cambridge, UK; Gland, Switzerland, 2012; ISBN 9782831714240. [Google Scholar]
- Brosse, S.; Beachard, O.; Blanchet, S.; Durr, H.H.; Grenouillet, G.; Hugueny, B.; Lauzeral, C.; Leprieur, F.; Tedesco, P.A.; Villeger, S.; et al. Fish-SPRICH: A database of freshwater fish species richness throughout the World. Hydrobiologia 2013, 700, 343–349. [Google Scholar] [CrossRef]
- Baran, E. Cambodian Inland Fisheries: Facts, Figures and Context; WorldFish Center: Penang, Malaysia; Inland Fisheries Research and Development Institute: Phnom Penh, Cambodia, 2005; ISBN 983-2346-38-X. [Google Scholar]
- Hortle, K.G. Consumption and the Yield of Fish and Other Aquatic Animals from the Lower Mekong Basin; Mekong River Commission: Vientiane, Laos, 2007; 87p. [Google Scholar]
- Mekong River Commission (MRC). State of the Basin Report 2010; Mekong River Commission: Vientiane, Laos, 2010; ISBN 978-993-208-057-1. [Google Scholar]
- Hortle, K.G.; Bamrungrach, P. Fisheries Habitat and Yield in the Lower Mekong Basin; Mekong River Commission: Phnom Penh, Cambodia, 2015; ISSN 1683-1489. [Google Scholar]
- Ahmed, M.; Hap, N.; Ly, V.; Tiongco, M. Socioeconomic Assessment of Freshwater Capture Fisheries in Cambodia: Report on a Household Survey; Mekong River Commission: Phnom Penh, Cambodia, 1998; 186p. [Google Scholar]
- Lieng, S.; Zalinge, V.N. Fish Yield Estimation in the Floodplains of the Tonle Sap Great Lake and River; Mekong River Commission: Phnom Penh, Cambodia, 2001. [Google Scholar]
- Baran, E.; So, N.; Degen, P.; Chen, X.-Y.; Starr, P. Updated information on fish and fisheries in the Mekong Basin. Catch Cult. 2013, 19, 24–25. [Google Scholar]
- UNESCO. Tonle Sap Biosphere Reserve. Available online: http://www.unesco.org/new/en/phnompenh/natural-sciences/biosphere-reserves/tonle-sap-biosphere-reserve/ (accessed on 12 January 2018).
- Ngor, P.B.; Grenouillet, G.; Phem, S.; So, N.; Lek, S. Spatial and temporal variation in fish community structure and diversity in the largest tropical flood-pulse system of South-East Asia. Ecol. Freshw. Fish 2018, 27, 1087–1100. [Google Scholar] [CrossRef]
- Campbell, I.C.; Poole, C.; Giesen, W.; Valbo-Jorgensen, J. Species diversity and ecology of Tonle Sap Great Lake, Cambodia. Aquat. Sci. 2006, 68, 355–373. [Google Scholar] [CrossRef]
- Enomoto, K.; Ishikawa, S.; Hori, M.; Hort, S.; Srun, L.S.; Nao, T.; Kurokura, H. Data mining and stock assessment of fisheries resources in Tonle Sap Lake, Cambodia. Fish. Sci. 2011, 77, 713–722. [Google Scholar] [CrossRef]
- Yen, N.T.H.; Sunada, K.; Oishi, S.; Ikejima, K.; Iwata, T. Stock assessment and fishery management of Henicorhynchus spp., Cyclocheilichthys enoplos and Channa micropeltes in Tonle Sap Great Lake, Cambodia. J. Gt. Lakes Res. 2009, 35, 169–174. [Google Scholar] [CrossRef]
- Ngor, P.B.; McCann, K.S.; Grenouillet, G.; So, N.; McMeans, B.C.; Fraser, E.; Lek, S. Evidence of indiscriminate fishing effects in one of the world’s largest inland fisheries. Sci. Rep. 2018, 8, 1–12. [Google Scholar] [CrossRef] [Green Version]
- McCann, K.S.; Gellner, G.; McMeans, B.C.; Deenik, T.; Holtgrieve, G.; Rooney, N.; Hannah, L.; Cooperman, M.; Nam, S.; Giacomini, H. Food webs and the sustainability of indiscriminate fisheries. Can. J. Fish. Aquat. Sci. 2015, 73, 1–10. [Google Scholar] [CrossRef]
- KC, K.B.; Bond, N.; Fraser, E.D.G.; Elliott, V.; Farrell, T.; McCann, K.; Rooney, N.; Bieg, C. Exploring tropical fisheries through fishers’ perceptions: Fishing down the food web in the Tonlé Sap, Cambodia. Fish. Manag. Ecol. 2017, 24, 452–459. [Google Scholar] [CrossRef]
- Ngor, P.B.; Oberdorff, T.; Phen, C.; Baehr, C.; Grenouillet, G.; Lek, S. Fish assemblage responses to flow seasonality and predictability in a tropical flood pulse system. Ecosphere 2018, 9, e02366. [Google Scholar] [CrossRef] [Green Version]
- Sabo, J.L.; Ruhi, A.; Holtgrieve, G.W.; Elliott, V.; Arias, M.E.; Ngor, P.B.; Räsänen, T.A.; Nam, S. Designing river flows to improve food security futures in the Lower Mekong Basin. Science 2017, 358, eaao1053. [Google Scholar] [CrossRef] [PubMed] [Green Version]
- Boulangeat, I.; Gravel, D.; Thuiller, W. Accounting for dispersal and biotic interactions to disentangle the drivers of species distributions and their abundances. Ecol. Lett. 2012, 15, 584–593. [Google Scholar] [CrossRef] [PubMed]
- Peoples, B.K.; Frimpong, E.A. Biotic interactions and habitat drive positive co-occurrence between facilitating and beneficiary stream fishes. J. Biogeogr. 2016, 43, 923–931. [Google Scholar] [CrossRef]
- Olden, J.D.; Jackson, D.A. Fish—Habitat relationships in lakes: Gaining predictive and explanatory insight by using artificial neural networks. Trans. Am. Fish. Soc. 2001, 130, 878–897. [Google Scholar] [CrossRef]
- Pont, D.; Hugueny, B.; Oberdorff, T. Modelling habitat requirement of European fishes: Do species have similar responses to local and regional environmental constraints? Can. J. Fish. Aquat. Sci. 2005, 62, 163–173. [Google Scholar] [CrossRef] [Green Version]
- Jackson, D.A.; Peres-Neto, P.R.; Olden, J.D. What controls who is where in freshwater fish communities—The roles of biotic, abiotic, and spatial factors. Can. J. Fish. Aquat. Sci. 2001, 58, 157–170. [Google Scholar]
- Mekong River Commission (MRC). State of the Basin Report: 2003; Executive Summary; Mekong River Commission: Phnom Penh, Cambodia, 2003; ISSN 1728:3248. [Google Scholar]
- Arias, M.E.; Cochrane, T.A.; Norton, D.; Killeen, T.J.; Khon, P. The flood pulse as the underlying driver of vegetation in the largest wetland and fishery of the Mekong Basin. AMBIO 2013, 42, 864–876. [Google Scholar] [CrossRef] [Green Version]
- Kummu, M.; Tes, S.; Yin, S.; Adamson, P.; Józsa, J.; Koponen, J.; Richey, J.; Sarkkula, J. Water balance analysis for the Tonle Sap Lake-floodplain system. Hydrol. Process. 2014, 28, 1722–1733. [Google Scholar] [CrossRef]
- Ly, S.; VanZalinge, N.P. Catch Statistics of Cambodian Freshwater Fisheries 1994–1997; Report for Project: The Management of the Freshwater Capture Fisheries of Cambodia Phase 1; Mekong River Commission: Phnom Penh, Cambodia, 1998; p. 146. [Google Scholar]
- Fisheries Administration (FiA). Law on Fisheries; Unofficial Translated by ADB/FAO; Fisheries Administration (FiA): Phnom Penh, Cambodia, 2006. [Google Scholar]
- Degen, P.; Nao, T. Historical, cultural and legal perspectives on the fishing lot system in Cambodia. In Proceedings of the Common Property in the Mekong: Issues of Sustainability and Subsistence; Ahmed, M., Hirsch, P., Eds.; ICLARM Stud. Rev.: Phnom Penh, Cambodia, 2000; pp. 49–60. [Google Scholar]
- Deap, L.; Degen, P.; VanZalinge, N. Fishing Gears of the Cambodian Mekong; Inland Fisheries Research and Development Institude of Cambodia (IFRdDI): Phnom Penh, Cambodia, 2003; ISSN 1726-3972. [Google Scholar]
- Chan, B.; Ngor, P.B.; So, N.; Lek, S. Spatial and temporal changes in fish yields and fish communities in the largest tropical floodplain lake in Asia. Ann. Limnol. Int. J. Lim. 2017, 53, 485–493. [Google Scholar] [CrossRef] [Green Version]
- Chheng, P.; Touch, B.T.; Baran, E.; Leng, S.V. Biological Reviews of Important Cambodian Fish Species, Based on FishBase 2004; Inland Fisheries Research and Development Institude of Cambodia (IFRdDI): Phnom Penh, Cambodia, 2005; Volume 1, p. 127. ISBN 983-2346-48-7. [Google Scholar]
- Poulsen, A.F.; Hortle, K.G.; Chan, S.; Chhuon, C.K.; Viravong, S.; Bouakhamvongsa, K.; Suntornratana, U.; Yoorong, N.; Nguyen, T.T.; Tran, B.Q. Distribution and Ecology of Some Important Riverine Fish Species of the Mekong River Basin; Mekong River Commission: Phnom Penh, Cambodia, 2004; Volume 89, ISSN 1683-1489. [Google Scholar]
- Ngor, P.B.; Chheng, P.; So, N. Declines in catches of some large and medium-sized species in Tonle Sap River. In Proceedings of the Catch and Culture; Mekong River Commission: Phnom Penh, Cambodia, 2015; Volume 21, pp. 4–7. [Google Scholar]
- Froese, R.; Pauly, D. FishBase. World Wide Web Electronic Publication. Available online: www.fishbase.org (accessed on 10 February 2017).
- Ngor, P.B.; Legendre, P.; Oberdorff, T.; Lek, S. Flow alterations by dams shaped fish assemblage dynamics in the complex Mekong-3S river system. Ecol. Indic. 2018, 88, 103–114. [Google Scholar] [CrossRef]
- Stamatopoulos, C. Sample-Based Fishery Surveys: A Technical Handbook; Food and Agriculture Organization of the United Nations: Rome, Italy, 2002; ISBN 9251046999. [Google Scholar]
- Rainboth, W.J. FAO Species Identification Field Guide for Fishery Purposes: Fish of the Cambodian Mekong; Niem, V.H., Carpenter, K.E., Angelis, N.D., Eds.; Food and Agriculture Organization of the United Nations: Rome, Italy, 1996; 265p, ISBN 92-5-103743-4. [Google Scholar]
- So, N.; Utsugi, K.; Shibukawa, K.; Thach, P.; Chhuoy, S.; Kim, S.; Chin, D.; Nen, P.; Chheng, P. Fishes of the Cambodian Freshwater Bodies; Inland Fisheries Research and Development Institute, Fisheries Administration: Phnom Penh, Cambodia, 2018; 197p. [Google Scholar]
- Hijmans, R.J.; Cameron, S.E.; Parra, J.L.; Jones, P.G.; Jarvis, A. Very high resolution interpolated climate surfaces for global land areas. Int. J. Climatol. 2005, 25, 1965–1978. [Google Scholar] [CrossRef]
- Oksanen, J.; Blanchet, F.G.; Kindt, R.; Legendre, P.; Minchin, P.R.; O’Hara, R.B.; Simpson, G.L.; Solymos, P.; Stevens, H.H.H.; Wagner, H. Vegan: Community Ecology Package; R Package Version 2.5-6, 2019. Available online: https://CRAN.R-project.org/package=vegan (accessed on 9 March 2020).
- R Core Team. R: A Language and Environment for Statistical Computing 2017; European Environment Agency: København K, Denmark, 2017. [Google Scholar]
- Lim, P.; Lek, S.; Touch, S.T.; Mao, S.; Chhouk, B. Diversity and spatial distribution of freshwater fish in Great Lake and Tonle Sap river (Cambodia, Southeast Asia). Aquat. Living Resour. 1999, 12, 379–386. [Google Scholar] [CrossRef]
- Kolosa, J. Ecological systems in hierarchical perspective: Breaks in community structure and other consequences. Ecology 1989, 70, 36–47. [Google Scholar] [CrossRef]
- Angermeier, P.L.; Winston, M.R. Local vs. regional influences on local diversity in stream fish communities of Virginia. Ecology 1998, 79, 911–927. [Google Scholar] [CrossRef]
- Dunham, J.B.; Cade, B.S.; Terrell, J.W. Influences of spatial and temporal variation on fish—Habitat relationships defined by regression quantiles. Trans. Am. Fish. Soc. 2002, 131, 86–98. [Google Scholar] [CrossRef]
- Brosse, S.; Lek, S.; Dauba, F. Predicting fish distribution in a mesotrophic lake by hydroacoustic survey and artificial neural networks. Limnol. Oceanogr. 1999, 44, 1293–1303. [Google Scholar] [CrossRef] [Green Version]
- Brosse, S.; Grossman, G.D.; Lek, S. Fish assemblage patterns in the littoral zone of a European reservoir. Freshw. Biol. 2007, 52, 448–458. [Google Scholar] [CrossRef]
- Mekong River Commission (MRC). Monitoring fish abundance and diversity in the Mekong Basin. Catch Cult. 2008, 14, 24–25.
- Lammert, M.; Allan, J. Assessing biotic integrity of streams: Effects of scale in measuring the influence of land use/cover and habitat structure on fish and macroinvertebrates. Environ. Manag. 1999, 23, 257–270. [Google Scholar] [CrossRef] [Green Version]
- Talwar, P.K.; Jhingran, A.G. Inland Fishes of India and Adjacent Countries; A.A. Balkema: Rotterdam, The Netherlands, 1991; Volume 2. [Google Scholar]
- Kottelat, M. Fishes of the Nam Theun and Xe Bangfai basins, Laos, with diagnoses of twenty-two new species (Teleostei: Cyprinidae, Balitoridae, Cobitidae, Coiidae and Odontobutidae). Ichthyol. Explor. Freshw. 1998, 9, 1–128. [Google Scholar]
- Kottelat, M.; Widjanarti, E. The fishes of Danau Sentarum National Park and the Kapuas Lakes area, Kalimantan Barat, Indonesia. Raffles Bull. Zool. 2005, Supplement 13, 139–173. [Google Scholar]
- Singhanouvong, D.; Soulignavong, C.; Vonghachak, K.; Saadsy, B.; Warren, T.J. The Main Wet-Season Migration Through Hoo Som Yai, a Steep-Gradient Channel at the Great Fault Line on the Mekong River, Champassack Province, Southern Lao PDR; Ministry of Agriculture-Forestry: Vientiane, Laos, 1996; 115p. [Google Scholar]
- Menon, A.G.K. Checklist freshwater fishes of India. Rec. Zool. Surv. India 1999, 17, 1–366. [Google Scholar]
- Un, B.; Pech, S.; Baran, E. Aquatic Agricultural Systems in Cambodia: National Situation Analysis; Program Report: AAS-2015-13; CGIAR Research Program on Aquatic Agricultural Systems: Penang, Malaysia, 2015. [Google Scholar]
- Heino, J. Concordance of species richness patterns among multiple freshwater taxa: A regional perspective. Biodivers. Conserv. 2002, 11, 137–147. [Google Scholar] [CrossRef]
- Buisson, L.; Blanc, L.; Grenouillet, G. Modelling stream fish species distribution in a river network: The relative effects of temperature versus physical factors. Ecol. Freshw. Fish 2008, 17, 244–257. [Google Scholar] [CrossRef]
- Chea, R.; Lek, S.; Ngor, P.; Grenouillet, G. Large-Scale patterns of fish diversity and assemblage structure in the longest tropical river in Asia. Ecol. Freshw. Fish 2016, 26, 575–585. [Google Scholar] [CrossRef]
- Poulsen, A.F.; Ouch, P.; Viravong, S.; Suntornratana, U.; Nguyen, T.T. Fish Migrations of the Lower Mekong River Basin: Implications for Development, Planning and Environmental Management; Mekong River Commission: Phnom Penh, Cambodia, 2002; 62p, ISSN 1683-1489. [Google Scholar]
- Baran, E. Fish Migration Triggers in the Lower Mekong Basin and Other Tropical Freshwater Systems; Mekong River Commission: Vientiane, Cambodia, 2006; ISBN 1683-1489. [Google Scholar]
- Hughes, F. The Flooded Forest: Guidance for Policy Makers and River Managers in Europe on the Restoration of Floodplain Forests, FLOBAR2; Department of Geography, University of Cambridge: Cambridge, UK, 2003; 96p. [Google Scholar]
- World Wide Fund for Nature (WWF). Mekong Flooded Forest Ecosystem Health Synthesis Report; World Wide Fund for Nature (WWF): Phnom Penh, Cambodia, 2017; 19p. [Google Scholar]
- Baran, E.; Gallego, G. Cambodia’s fisheries: A decade of changes and evolution. Catch Cult. 2015, 21, 28–31. [Google Scholar]
- National Institute of Statistics (NIS). Cambodian Inter-Census Population Survey 2013; National Institute of Statistics, Ministry of Planning: Phnom Penh, Cambodia, 2013; 142p. [Google Scholar]
- Castello, L.; Hess, L.L.; Thapa, R.; McGrath, D.G.; Arantes, C.C.; Renó, V.F.; Isaac, V.J. Fishery yields vary with land cover on the Amazon River floodplain. Fish Fish. 2018, 19, 431–440. [Google Scholar] [CrossRef]
Figure 1.
Map of the sampling sites in Tonle Sap Lake floodplain. The minimal area of the Tonle Sap Lake during the dry season is in dark blue and light blue represents the maximal area of the Tonle Sap Lake during the flooded season. Fishing lots are in light green. The first letter of the code of the fishing lot represents the province name: B (Battambang), S (Siem Reap), P (Pursat), and T (Kampong Thom). The two other characters represent the fishing lot number within each province.

Figure 2.
(A) PCA summarizing the nineteen bioclim variables. (A) The first and second axes of the PCA. (B) The first and third axes of the PCA. (C) The second and third axes of the PCA. (D) Eigenvalues of the PCA indicating three important axes contributing to the total variance of climatic variables. The description of each variable is given in Table 2.

Figure 3.
Mean ± SE bar plots showing the temporal variability in biomass (kg/ha) of the eight most abundant fish species within each fishing lot from the fishing season of 1994/1995 to 1999/2000 in the Tonle Sap Lake. The first letter of the code on the x-axis represents the province name: B (Battambang), S (Siem Reap), P (Pursat), and T (Kampong Thom); and the last two-digit number corresponds to the name or number (ID) of a fishing lot in each province. The location of each fishing lot within the lake is shown in Figure 1.

Figure 4.
Bubble plots showing the spatial distribution of fish mean biomass of the eight most abundant fish species in Tonle Sap Lake. The unit for the legends in the upper right of each plot is the mean annual fish biomass (kg/hectare). The light blue represents a maximal area of Tonle Sap Lake during the flooded season. The photos of fishes were redrawn from [40] and [37].


Table 1.
Summary of land cover (local habitat) types (%) in each fishing lot. Codes for fishing lot locations within the lake area shown in Figure 1.
Table 1.
Summary of land cover (local habitat) types (%) in each fishing lot. Codes for fishing lot locations within the lake area shown in Figure 1.
| Fishing Lot | The Percentage Cover of Flooded Forest (%) | The Percentage Cover of Open Water (%) | The Percentage Cover Agricultural Field (%) |
|---|---|---|---|
| B01 | 74.064 | 13.687 | 12.249 |
| B02 | 92.391 | 1.426 | 6.183 |
| B03 | 90.654 | 9.213 | 0.133 |
| B04 | 97.378 | 0.832 | 1.789 |
| B05 | 99.658 | 0.000 | 0.342 |
| B06 | 97.873 | 0.000 | 2.127 |
| B07 | 10.200 | 0.000 | 89.800 |
| B08 | 70.178 | 0.000 | 29.822 |
| B09 | 99.982 | 0.000 | 0.018 |
| B10 | 100.000 | 0.000 | 0.000 |
| B11 | 89.754 | 0.000 | 10.246 |
| B12 | 80.466 | 0.000 | 19.534 |
| P01 | 82.462 | 17.538 | 0.000 |
| P02 | 63.546 | 34.188 | 2.266 |
| P03 | 68.851 | 31.149 | 0.000 |
| P04 | 62.047 | 37.953 | 0.000 |
| P05 | 33.271 | 65.598 | 1.131 |
| P06 | 48.506 | 46.976 | 4.518 |
| P07 | 44.987 | 48.856 | 6.157 |
| S01 | 96.130 | 0.000 | 3.870 |
| S02 | 96.314 | 0.000 | 3.686 |
| S03 | 92.187 | 2.330 | 5.483 |
| S04 | 34.507 | 55.821 | 9.672 |
| S05 | 11.215 | 73.477 | 15.308 |
| S06 | 83.347 | 11.307 | 5.347 |
| S07 | 77.499 | 22.501 | 0.000 |
| T01 | 74.825 | 2.359 | 22.816 |
| T02 | 70.327 | 29.673 | 0.000 |
| T03 | 72.863 | 9.697 | 17.440 |
| T04 | 54.281 | 32.006 | 13.714 |
| T05 | 75.308 | 24.692 | 0.000 |
| T06 | 66.186 | 16.696 | 17.118 |
| T07 | 32.346 | 3.633 | 64.020 |
Table 2.
Summary of climatic variables extracted from the Worldclime database with their minimum and maximum values.
Table 2.
Summary of climatic variables extracted from the Worldclime database with their minimum and maximum values.
| Variable | Unit | Variable Type | Minimum | Maximum |
|---|---|---|---|---|
| B1 | (°C) | annual mean temperature | 27.3 | 27.7 |
| B2 | (°C) | mean diurnal range (mean of monthly (max temp–min temp)) | 8.8 | 9.6 |
| B3 | % | isothermality (B2/B7) (*100) | 56 | 58 |
| B4 | (°C*100) | temperature seasonality (standard deviation *100) | 1424 | 1731 |
| B5 | (°C) | max temperature of the warmest month | 34.7 | 35.5 |
| B6 | (°C) | min temperature of the coldest month | 18.4 | 19.9 |
| B7 | (°C) | temperature annual range (B5–B6) | 15 | 16.9 |
| B8 | (°C) | mean temperature of the wettest quarter | 27.2 | 27.5 |
| B9 | (°C) | mean temperature of the driest quarter | 25.3 | 25.9 |
| B10 | (°C) | mean temperature of the warmest quarter | 29.2 | 29.4 |
| B11 | (°C) | mean temperature of coldest quarter | 24.7 | 25.7 |
| B12 | mm | annual precipitation | 1169 | 1481 |
| B13 | mm | precipitation of the wettest month | 221 | 279 |
| B14 | mm | precipitation of the driest month | 1 | 6 |
| B15 | mm | precipitation seasonality (coefficient of variation) | 70 | 79 |
| B16 | mm | precipitation of the wettest quarter | 549 | 696 |
| B17 | mm | precipitation of the driest quarter | 22 | 41 |
| B18 | mm | precipitation of the warmest quarter | 209 | 369 |
| B19 | mm | precipitation of the coldest quarter | 73 | 117 |
Table 3.
Generalized Linear Model’s standardized regression coefficients for the eight study fish populations. Significant variables (p < 0.05) are in bold. Plus ‘+’ and minus ‘−’ signs indicate the positive and negative relationships between variables, respectively. Model performance for each species is indicated as the adjusted R2. Chm = Channa micropeltes. Pah = Pangasianodon hypophthalmus. Chs = Channa striata. Cye = Cyclocheilos enoplos. Gys = Gymnostomus spp. Bag = Barbonymus gonionotus. Phs = Phalacronotus spp. Trm = Trichopodus microlepis. Significant levels are as follows: ‘*’: p <0.05, ‘**’: p < 0.01, ‘***’: p < 0.001.
| Variables | Chm | Pah | Chs | Cye | Gys | Bag | Phs | Trm |
|---|---|---|---|---|---|---|---|---|
| Percentage cover of the flooded forest (FF) α | +0.70 | +4.11 *** | +1.88 * | +2.71 ** | −0.63 | +1.67 | +3.14 ** | −0.85 |
| Percentage cover of the open water (OW) α | +0.48 | +5.98 *** | +0.28 | +4.03 *** | +1.59 | +2.72 ** | +4.86 *** | −1.51 |
| Percentage cover of the agricultural field (AF) α | −0.74 | +1.38 | +1.01 | −0.49 | −2.19 * | −0.19 | −0.64 | −1.1 |
| Temperature and precipitation range (clim1) β | +1.66 | +2.68 ** | −2.57 ** | +2.58 ** | +4.25 *** | +1.20 | +0.97 | −1.34 |
| Temperature range in the warm season (clim2) β | −6.66 *** | −2.23 * | −3.14 ** | −1.68 | +4.62 *** | −0.33 | +1.50 | −2.35 * |
| Precipitation range in the wet season (clim3) β | +0.39 | +0.57 | −3.46 *** | +1.77 | −1.07 | +1.95 * | +1.97 * | −2.70 ** |
| Adj-R2 | 0.68 | 0.833 | 0.62 | 0.83 | 0.709 | 0.74 | 0.76 | 0.50 |
Note: α = “local” land cover variables; β = “regional” climatic variables.
© 2020 by the authors. Licensee MDPI, Basel, Switzerland. This article is an open access article distributed under the terms and conditions of the Creative Commons Attribution (CC BY) license (http://creativecommons.org/licenses/by/4.0/).
Share and Cite
MDPI and ACS Style
Chan, B.; Brosse, S.; Hogan, Z.S.; Ngor, P.B.; Lek, S. Influence of Local Habitat and Climatic Factors on the Distribution of Fish Species in the Tonle Sap Lake. Water 2020, 12, 786. https://doi.org/10.3390/w12030786
AMA Style
Chan B, Brosse S, Hogan ZS, Ngor PB, Lek S. Influence of Local Habitat and Climatic Factors on the Distribution of Fish Species in the Tonle Sap Lake. Water. 2020; 12(3):786. https://doi.org/10.3390/w12030786
Chicago/Turabian StyleChan, Bunyeth, Sébastien Brosse, Zeb S. Hogan, Peng Bun Ngor, and Sovan Lek. 2020. "Influence of Local Habitat and Climatic Factors on the Distribution of Fish Species in the Tonle Sap Lake" Water 12, no. 3: 786. https://doi.org/10.3390/w12030786
Note that from the first issue of 2016, this journal uses article numbers instead of page numbers. See further details here.