Article

Treatment of Produced Water in the Permian Basin for Hydraulic Fracturing: Comparison of Different Coagulation Processes and Innovative Filter Media

Civil Engineering Department, New Mexico State University, Las Cruces, NM 88003, USA
*
Author to whom correspondence should be addressed.
Water 2020, 12(3), 770; https://doi.org/10.3390/w12030770
Submission received: 2 January 2020 / Revised: 6 March 2020 / Accepted: 9 March 2020 / Published: 11 March 2020

Abstract

:
Produced water is the largest volume of waste product generated during oil and natural gas exploration and production. The traditional method to dispose of produced water involves deep well injection, but this option is becoming more challenging due to high operational cost, limited disposal capacity, and more stringent regulations. Meanwhile, large volumes of freshwater are used for hydraulic fracturing. The goal of this study is to develop cost-effective technologies, and optimize system design and operation to treat highly saline produced water (120–140 g/L total dissolved solids) for hydraulic fracturing. Produced water was collected from a salt water disposal facility in the Permian Basin, New Mexico. Chemical coagulation (CC) using ferric chloride and aluminum sulfate as coagulants was compared with electrocoagulation (EC) with aluminum electrodes for removal of suspended contaminants. The effects of coagulant dose, current density, and hydraulic retention time during EC on turbidity removal were investigated. Experimental results showed that aluminum sulfate was more efficient and cost-effective than ferric chloride for removing turbidity from produced water. The optimal aluminum dose was achieved at operating current density of 6.60 mA/cm2 and 12 min contact time during EC treatment, which resulted in 74% removal of suspended solids and 53–78% removal of total organic carbon (TOC). The energy requirement of EC was calculated 0.36 kWh/m3 of water treated. The total operating cost of EC was estimated $0.44/m3 of treated water, which is 1.7 or 1.2 times higher than CC using alum or ferric chloride as the coagulant, respectively. The EC operating cost was primarily associated with the consumption of aluminum electrode materials due to faradaic reactions and electrodes corrosions. EC has the advantage of shorter retention time, in situ production of coagulants, less sludge generation, and high mobility for onsite produced water treatment. The fine particles and other contaminants after coagulation were further treated in continuous-flow columns packed with different filter media, including agricultural waste products (pecan shell, walnut shell, and biochar), and new and spent granular activated carbon (GAC). Turbidity, TOC, metals, and electrical conductivity were monitored to evaluate the performance of the treatment system and the adsorption capacities of different media. Biochar and GAC showed the greatest removal of turbidity and TOC in produced water. These treatment technologies were demonstrated to be effective for the removal of suspended constituents and iron, and to produce a clean brine for onsite reuse, such as hydraulic fracturing.

1. Introduction

1.1. Challenges and Opportunities Associated with Produced Water

Produced water represents the largest waste stream generated during oil and gas production. When petroleum hydrocarbons are extracted, formation water is brought up to the surface contributing to produced water [1]. The composition of produced water varies considerably depending on the geographic location of the field, the type of hydrocarbons being extracted, the extraction method employed, and the minerals present in the bearing geologic formation [2,3,4,5,6,7,8,9]. Produced water is typically saline with high total dissolved solids (TDS; e.g., Na+, Ca2+, Mg2+, Cl, and SO42−). Organic compounds are some of the main contaminants in produced water, including oil and grease (free, dispersed or emulsified); volatile and semi-volatile organics, such as BTEX (benzene, toluene, ethylbenzene, and xylenes); and PAHs (polycyclic aromatic hydrocarbons). Contaminants in small amounts include dissolved gases (e.g., ammonia and hydrogen sulfide), and chemical additives used to improve drilling and production operations. Additionally, heavy metals and naturally-occurring radioactive materials (NORMs) can be found in produced water.
The most common methods to manage produced water consist of disposal into permitted salt water disposal (SWD) wells within deep saline underground formations, or reinjection into conventional reservoirs for enhanced oil recovery operations [3,10]. However, deep well injection has become more challenging because of limited capacity and potential seismic hazard caused by anthropogenic fluid injections [11,12].
Millions of gallons of water are used for hydraulic fracturing with the addition of a complex mixture of chemical additives known as fracturing fluids that are injected to the ground to induce and maintain fractures in the geological formation. Produced water can be treated and reused for onsite hydraulic fracturing to reduce the use of fresh or brackish water for unconventional oil and gas operations and decrease the need for the deep well injection of produced water. Fracturing companies may have different water quality requirements depending on fracturing methods and chemical formula, but in general it requires low in suspended solids, organic matter, and multivalent metals (in particular Fe3+), and bacteria counts. Hydraulic fracturing can use brackish water for its operation [13]. Therefore, desalination may not be needed or treated produced water can be blended with other water sources to meet the TDS requirement for fracturing.
Coagulation-flocculation-sedimentation-filtration processes can significantly remove suspended solids and colloidal particles from water. The most common chemical coagulants employed include aluminum sulfate (alum), ferric chloride, iron sulfate, and calcium hydroxide (lime) [14]. Wang et al. showed that flocculation of oilfield produced water using some of the most common coagulant agents was effective for trapping and removing suspended solids [14]. Dastgheib et al. combined two coagulants in different proportions to remove suspended solids in produced water with TDS values around 100,000 mg/L [15]. High turbidity removal was achieved by combinations of coagulants such as high alum–low lime, moderate alum–high lime, and moderate ferric chloride–low lime. When these chemicals were combined, pH was not impacted drastically [15]. Younker and Walsh reported a coagulation pretreatment employing ferric chloride reduced oil and grease concentration of produced water from 100 mg/L to below 30 mg/L [16]. Ferric chloride was used at a 10 mg/L concentration, and the salinity level of produced water was 32,000 mg/L. In the same study, Younker and Walsh also used organoclay adsorption as pretreatment for produced water and found that disperse oil could be greatly removed if the dose of organoclay increased up to 1000 mg/L and the mixing time was no less than 45 min. When combining coagulation with organoclay adsorption for removal of oil and grease from produced water, chemical coagulation played a significant role as pretreatment.
One of the main drawbacks of chemical coagulation (CC) is the large amount of residual sludge formed at the end of the process, because counterions are added to the solution along with the metal cations that serve to form the flocs. In addition, chemical coagulants contain very little coagulating agent on a mass basis. For example, 1 ton of alum as Al2(SO4)3·18(H2O) contains only 81 kg of Al(III), while 1 ton of ferric chloride FeCl3·6(H2O) provides 210 kg of Fe(III). Therefore, chemical coagulation requires the handling of larger amounts of chemicals and sludge.
Electrocoagulation (EC) utilizes sacrificial anodes to generate active coagulants to remove contaminants by precipitation and flotation. The most common metals employed as electrodes for EC are aluminum and iron, because these are easily available (abundant), have a low cost, and are not toxic. The same metal is usually used for both the anode and cathode in an EC reactor. When electricity is applied, the anode is oxidized into cations, while in the cathode water is reduced into hydrogen gas and hydroxyl anions (Figure 1). The gas generated removes pollutants by flotation, and the coagulant agents generated in the anode cause floc formation and precipitation as sludge [17]. EC produces about half the sludge of CC.
EC is an attractive technology and has been used for treating different types of water and wastewater, such as surface water; tannery and textile wastewater; pulp and paper industry wastewater; oily wastewater; food industry wastewater; and other types of wastewater containing heavy metals, cyanide, and other contaminants [18]. EC can be directly powered by solar photovoltaic [19].
EC efficiency depends on the conductivity and ionic content of water. Salinity, one of the most remarkable problems of produced water, can become an advantage for EC treatment [20,21]. EC has been reported to be effective at removing organic matter, turbidity, trace metals, and boron in produced water. Millar et al. demonstrated the treatment of coal seam produced water using EC with aluminum electrodes arranged in bipolar mode [20,21]. Higher current density, longer contact time and elevated pH in solution benefited better reduction of hardness, silica, barium, and iron. Flocs formed in EC were porous and lighter than flocs formed by conventional CC treatments. Zhao et al. experimented the use of EC as pretreatment for produced water obtained from an oil field in Saskatchewan, Canada [22]. They focused on the removal of hardness, oil and grease content in terms of chemical oxygen demand (COD), and turbidity. At the operating conditions of pH 7.36, a reaction time of 31 min, and a current density of 5.9 mA/cm2, the removal of hardness, COD, and turbidity reached 85.8%, 66.6%, and 93.8%, respectively [22].
EC technology utilized in full-scale applications, such as the CleanWave® water treatment mobile device (Halliburton, Houston, TX, USA), can treat up to 26,000 barrels (4100 m3) of produced water per day with a low energy consumption. This equipment can reduce total suspended solids (TSS) by 99% while bringing turbidity to <10 NTU. The TDS range in which the device is completely functional is 100–300,000 mg/L [23]. Some studies show the feasibility of combining EC and biological processes to treat produced water and specifically address organic contaminants such as total petroleum hydrocarbons (TPH) [24].
Table 1 summarizes the operating conditions and parameters selected for EC reactors in laboratory and pilot scale for produced water treatment. Although EC has been employed for produced water treatment, there is limited knowledge regarding the optimal design and operating parameters during treatment of highly saline produced water, so as to enable more economical full-scale applications [22,25].
A variety of media have been employed for produced water filtration to remove organic matter and suspended solids. Dastgheib et al. [15] employed sand, anthracite coal, and walnut shell to filter oilfield produced water. They found that the media with the greatest capacity to remove suspended particles was sand, while the best to remove oil droplets was anthracite coal. Although walnut shell showed the potential to remove particles and oil components, it had a lower adsorption capacity and reached turbidity breakthrough faster than anthracite and sand. For the removal of dissolved organic carbon (DOC), anthracite coal, walnut, and sand removed 70%, 60%, and 45% respectively after 15 h of operation. These experiments proved the effectiveness of filtration for saline produced water with a TDS concentration of 100,000 mg/L [15]. Zhang et al. also utilized walnut shell in a packed-bed arrangement to filter produced water as a pretreatment prior to membrane distillation [29]. This study showed ≥95% removal of organic compounds such as BTEX.
Adsorption is usually conducted using organoclay and granular activated carbon (GAC) as adsorbent materials. The use of GAC is recommended over organoclay, because GAC has a greater specific surface area which removes greater quantities of DOC from produced water [15,30]. Adsorption technologies, including the use of a chitosan polymer extracted from shrimp shell, also showed promising potential to remove oil from produced water [31].
The effective media such as GAC can be costly; developing innovative, low-cost filter media is important to reduce the treatment costs for produced water reuse. These media may include agricultural waste products, such as various woodchips, nut shells, biochar, and spent GAC from drinking water treatment plants of which the adsorption capacity may be exhausted but can still be used as a filter media for removal of suspended solids during produced water treatment.

1.2. Research Objective

It is critical to develop produced water treatment alternatives to reduce the amount of produced water for disposal and reuse it as a valuable water resource. Innovative approaches are needed to lower treatment costs and improve efficiency for produced water treatment. The objective of this study is to assess different technologies to remove suspended solids, organic matter, and other constituents in produced water, to generate a clean brine for the hydraulic fracturing operation of unconventional oil and gas reservoirs. EC and conventional CC methods using alum and ferric chloride as coagulants were compared in terms of removal efficiency and operating costs. EC has the advantages of working effectively for saline produced water and creating coagulant species in situ without the hassle of chemical transport, handling, and storage. Besides conventional GAC, innovative low-cost filter media were evaluated, including agricultural waste products (pecan shell, walnut shell, and biochar), and spent GAC from a local drinking water treatment plant. This study aims to provide recommendations and optimization of operating and design parameters for treatment of highly saline produced water (~120–140 g/L salinity) in the Permian Basin for onsite reuse.

2. Materials and Methods

2.1. Produced Water

Produced water samples were collected from a salt water disposal facility in Jal, New Mexico. This site has basic treatment to remove suspended solids that may clog disposal wells. The chemical composition of the produced water collected from the Permian Basin is summarized in Table 2. The TDS concentration of the produced water varied between 120 and 140 g/L with electrical conductivity between 200 and 300 mS/cm. The major constituents in the produced water included Na+ (42,720 ± 2093 mg/L), Ca2+ (4247 ± 752 mg/L), Mg2+ (727 ± 54 mg/L), K+ (805 ± 230 mg/L), Sr2+ (257 ± 20 mg/L), Cl (65,800 ± 1600 mg/L), SO42− (1010 ± 9 mg/L), Br (591 ± 16 mg/L), and SiO2 (32 ± 2 mg/L). The pH was 7.30 ± 0.21 with alkalinity of 2345 ± 329 mg/L as CaCO3. The total organic carbon (TOC) concentration varied in the range of 83.1 ± 30.8 mg/L. The produced water also contained high concentration of ammonia (655 ± 77 mg/L). The produced water tested in this study represents the typical produced water quality in the Permian Basin, in which the TDS concentration varies from 20 to 300 g/L with an average of 90 g/L [2,4,7].
Throughout the study, electrical conductivity and pH were measured using an OAKTON meter (Vernon Hills, Il, USA). Turbidity was measured using a HACTH 2100N Turbidimeter (Loveland, CO, USA). Alkalinity was measured employing a HATCH Digital Titrator model 16,900, Method 8203 (Loveland, CO, USA). The major ions were analyzed by a DIONEX ion chromatography system model ICS-2100 (Dionex, Sunnyvale, CA, USA). TOC was determined by the non-purgeable organic carbon (NPOC) analysis using a Shimadzu TOC analyzer model VCSH (Shimadzu TOC-L, Kyoto, Japan). The trace metals analysis was conducted employing inductively coupled plasma–optical emission spectrometry (ICP-OES, Perkin Elmer Optima 4300 DV, Norwalk, CT, USA).

2.2. Produced Water Treatment

2.2.1. Chemical coagulation (CC)

Standard jar testing was conducted using ferric chloride and alum as coagulant agents; both were analytical grade and obtained from Fisher Scientific. Chemicals were added to produced water in different concentrations ranging from 250 to 1321 mg/L. For the operational parameters of jar testing, rapid mixing was performed 1 min at 100 rpm; the flocculation stage lasted 25 min at 40 rpm; then 40 min settling prior to taking water samples for analysis. The parameters monitored were pH and turbidity to determine and compare the removal capacity of each chemical.

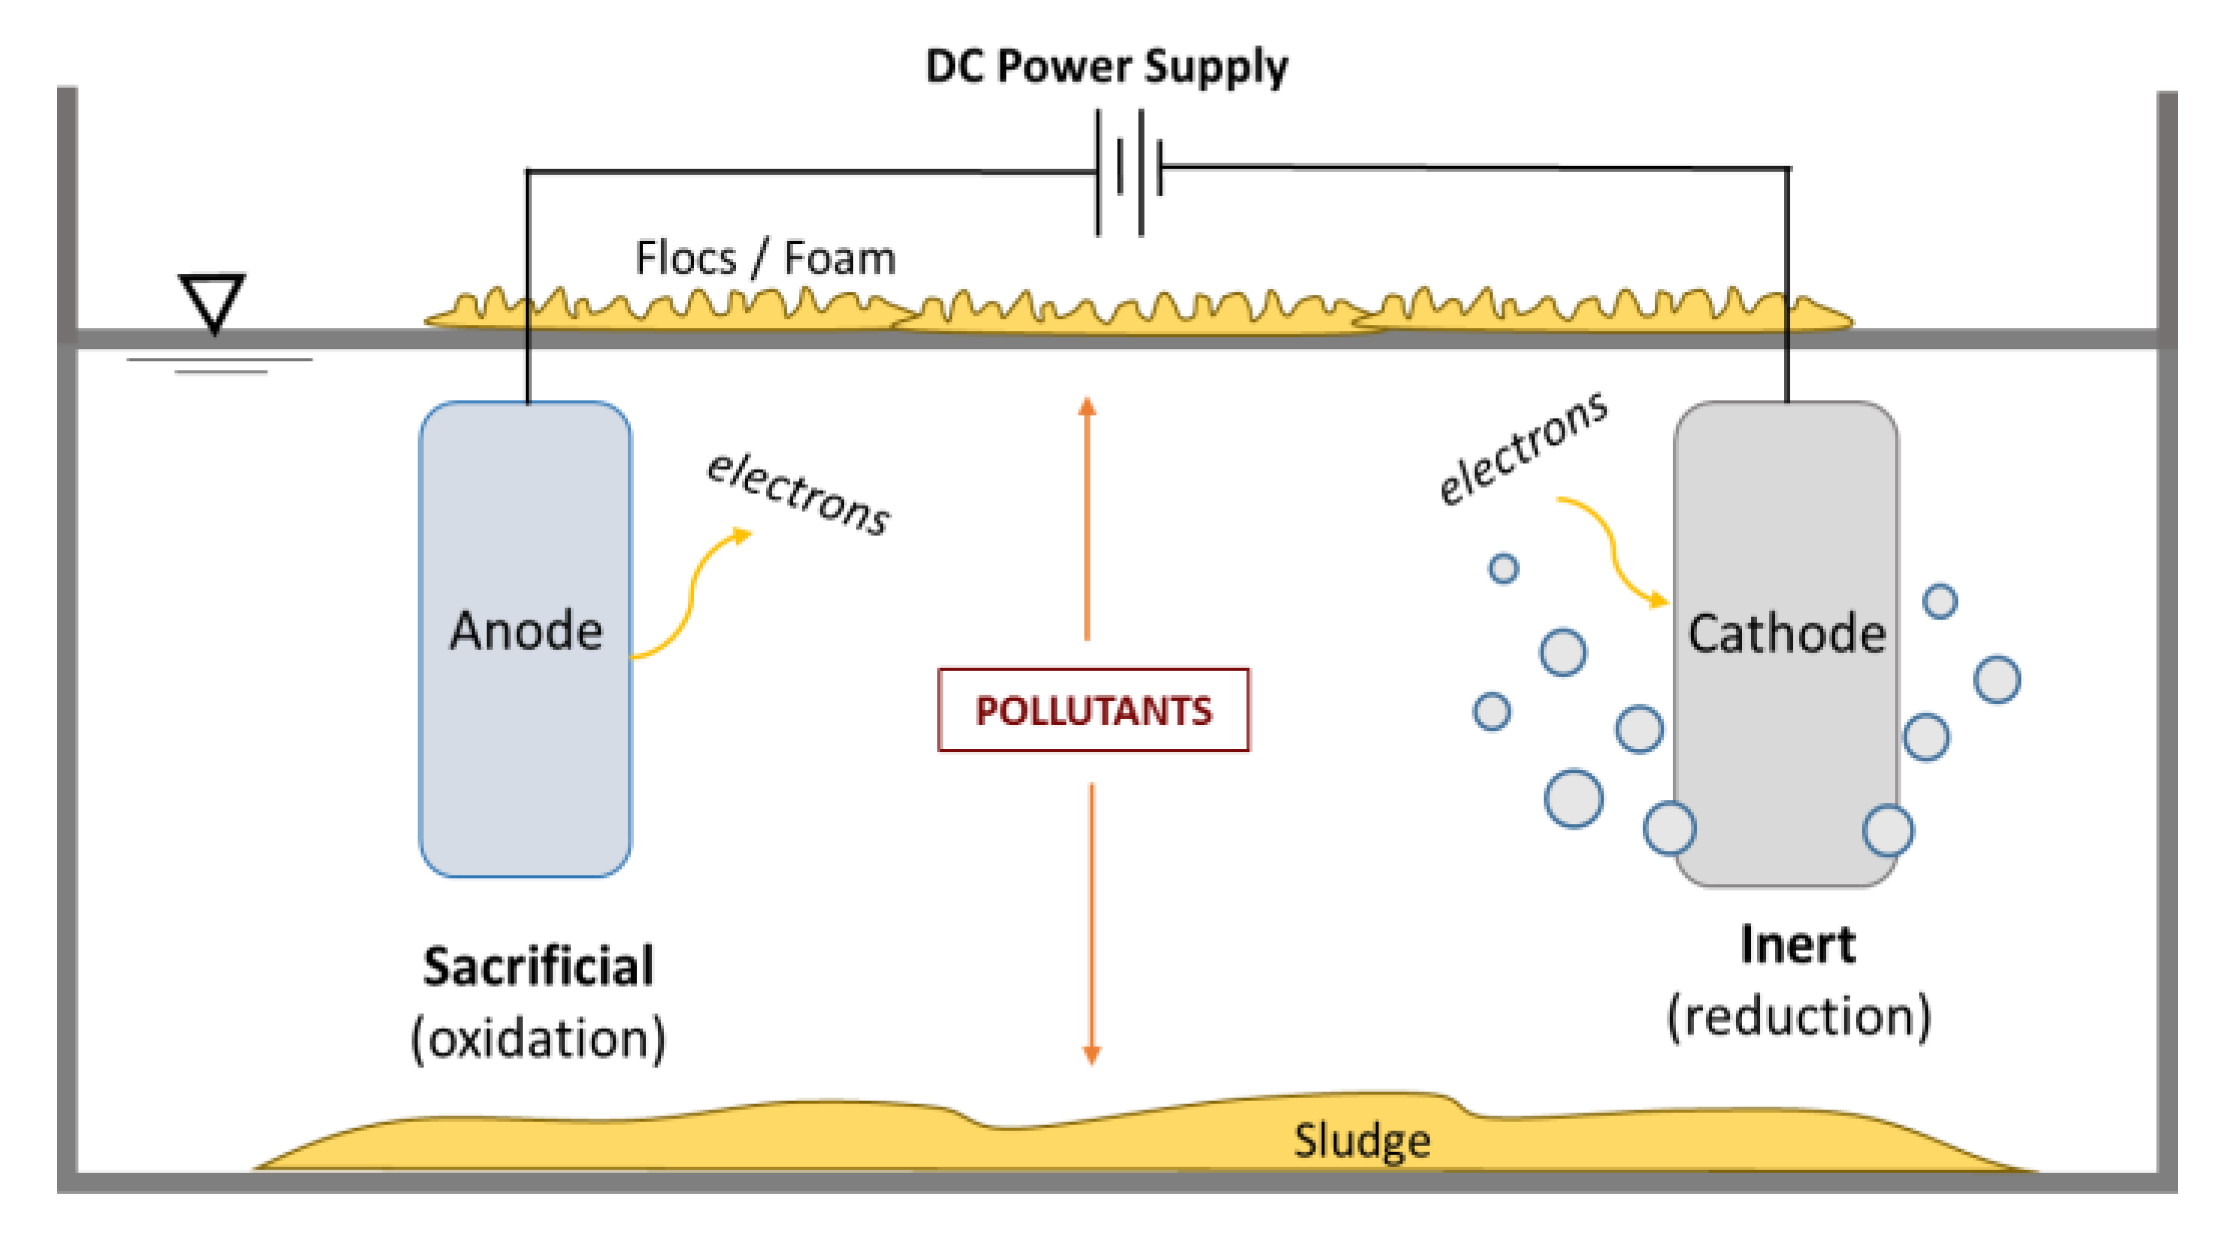
2.2.2. Electrocoagulation (EC)

The EC unit included a set of eight aluminum plate electrodes (10.2 × 16 × 1.3 cm) assembled in parallel. Electricity was applied to the electrodes by a direct current power supply LH110-3 (Sorensen, San Diego, CA, USA). Electrodes were placed in a 2.5 L cylindrical reactor made of clear acrylic material. The surface area of electrodes in contact with produced water was 379 cm2, and the distance between each electrode was 2 cm (Figure 2).
Batch EC experiments were designed to study the effect of current density and electrocoagulation time (ECT) on turbidity removal from produced water. In this study, ECT was defined as the time (in minutes) that produced water was in direct contact with the aluminum electrodes during an EC batch experiment. Before every batch experiment, electrodes were gently polished using sandpaper to remove deposits and smooth out any sharp spots [28].
To study the effect of current density applied during EC on turbidity removal, an electric current ranged from 0.5 to 3.0 amperes (A) with 0.5 A intervals (equivalent to current density of 1.32–7.92 mA/cm2) applied to the electrodes in individual experiments. For each experiment, ECT was set at 25 min with a sedimentation time of 40 min, and the volume of produced water treated was 2.5 L. The optimal current density value obtained after these experiments was employed to study the effect of ECT in further electrocoagulation batch experiments.
To determine an optimal ECT, six batch experiments were conducted at ECT of 3, 6, 9, 12, 15, and 20 min. For each experiment, sedimentation time was 40 min and the volume of produced water treated was 2.5 L. The optimal ECT was employed as hydraulic retention time (HRT) for the EC stage during continuous-flow experiments.
In the EC cell, the fundamental oxidation and reduction processes occurring can be represented as follows [27].
Anode, aluminum is oxidized from solid metal (s) to ionic species in aqueous solution (aq):
Al(s) → Al3+(aq) + 3e
Cathode, water is reduced to hydrogen gas and hydroxyl ions:
2H2O + 2e → H2(gas) + 2OH(aq)
After the oxidation of aluminum in the anode, different polymeric species form and eventually transform into Al(OH)3(s), as shown in Equation (3) [27]:
Al3+(aq) + 3H2O → Al(OH)3(s) + 3H+(aq)
In produced water, Al(OH)3(s) flocs can capture particles and adsorb metals and organic contaminants. Flocs can be further removed by hydrogen gas flotation or by sedimentation after EC treatment.
The amount of aluminum generated during the EC operation can be calculated theoretically using Faraday’s law. The mass of metal m is a function of the electrolysis time t and of the electric current I:
m = (M × I × t)/(z × F)
where m is the mass in grams of aluminum generated at a specific current applied (I), amperes; M is the atomic weight of aluminum, 26.98 g/mol; t is the operating time, s; z is the number of electrons transferred per aluminum atom; and F is Faraday’s constant, 96,486 C/mol.

2.2.3. Filtration

Packed-column filtration experiments were carried out using 2-inch I.D. (5.1 cm) by 15-inch length (38 cm) acrylic columns. Types of filter media used for experiments were walnut shells, pecan shells, biochar, new and spent GAC. Walnut shells and pecan shells were obtained as agricultural wastes from farmers in Las Cruces area, and biochar was obtained from Wakefield Agricultural Carbon LLC, which was produced through thermal treatment of wood chips. Biochar, walnut and pecan shells were sieved to obtain particle size of 1.68–2 mm. The specific surface area of biochar was measured 370 g/m2 [32]. The new GAC was FILTRASORB 816 from Calgon Carbon Corporation (Moon Township, PA, USA). The GAC has an effective particle size of 1.2–1.3 mm, specific surface area of 900–1000 m2/g, and iodine number of 900 mg/g. The spent GAC was the same type but had been used for nine years in a conventional surface water treatment plant. The GAC was used for potable water production and is deemed non-hazardous. The spent GAC can be either disposed of to landfill or returned to the manufacturer for re-activation.
Prior to packing the columns, all the filter media (except spent GAC) were washed with distilled water and dried overnight at 105 °C. To pack each column, a 2-inch thick gravel layer was set in the base; then a 5.5-inch thick media layer was packed on top (Figure 2). For the operation of the columns in continuous-flow mode, a Masterflex peristaltic pump was used to pump produced water through the columns at a flow rate of 20 mL/min with an empty bed contact time (EBCT) of 19 min.

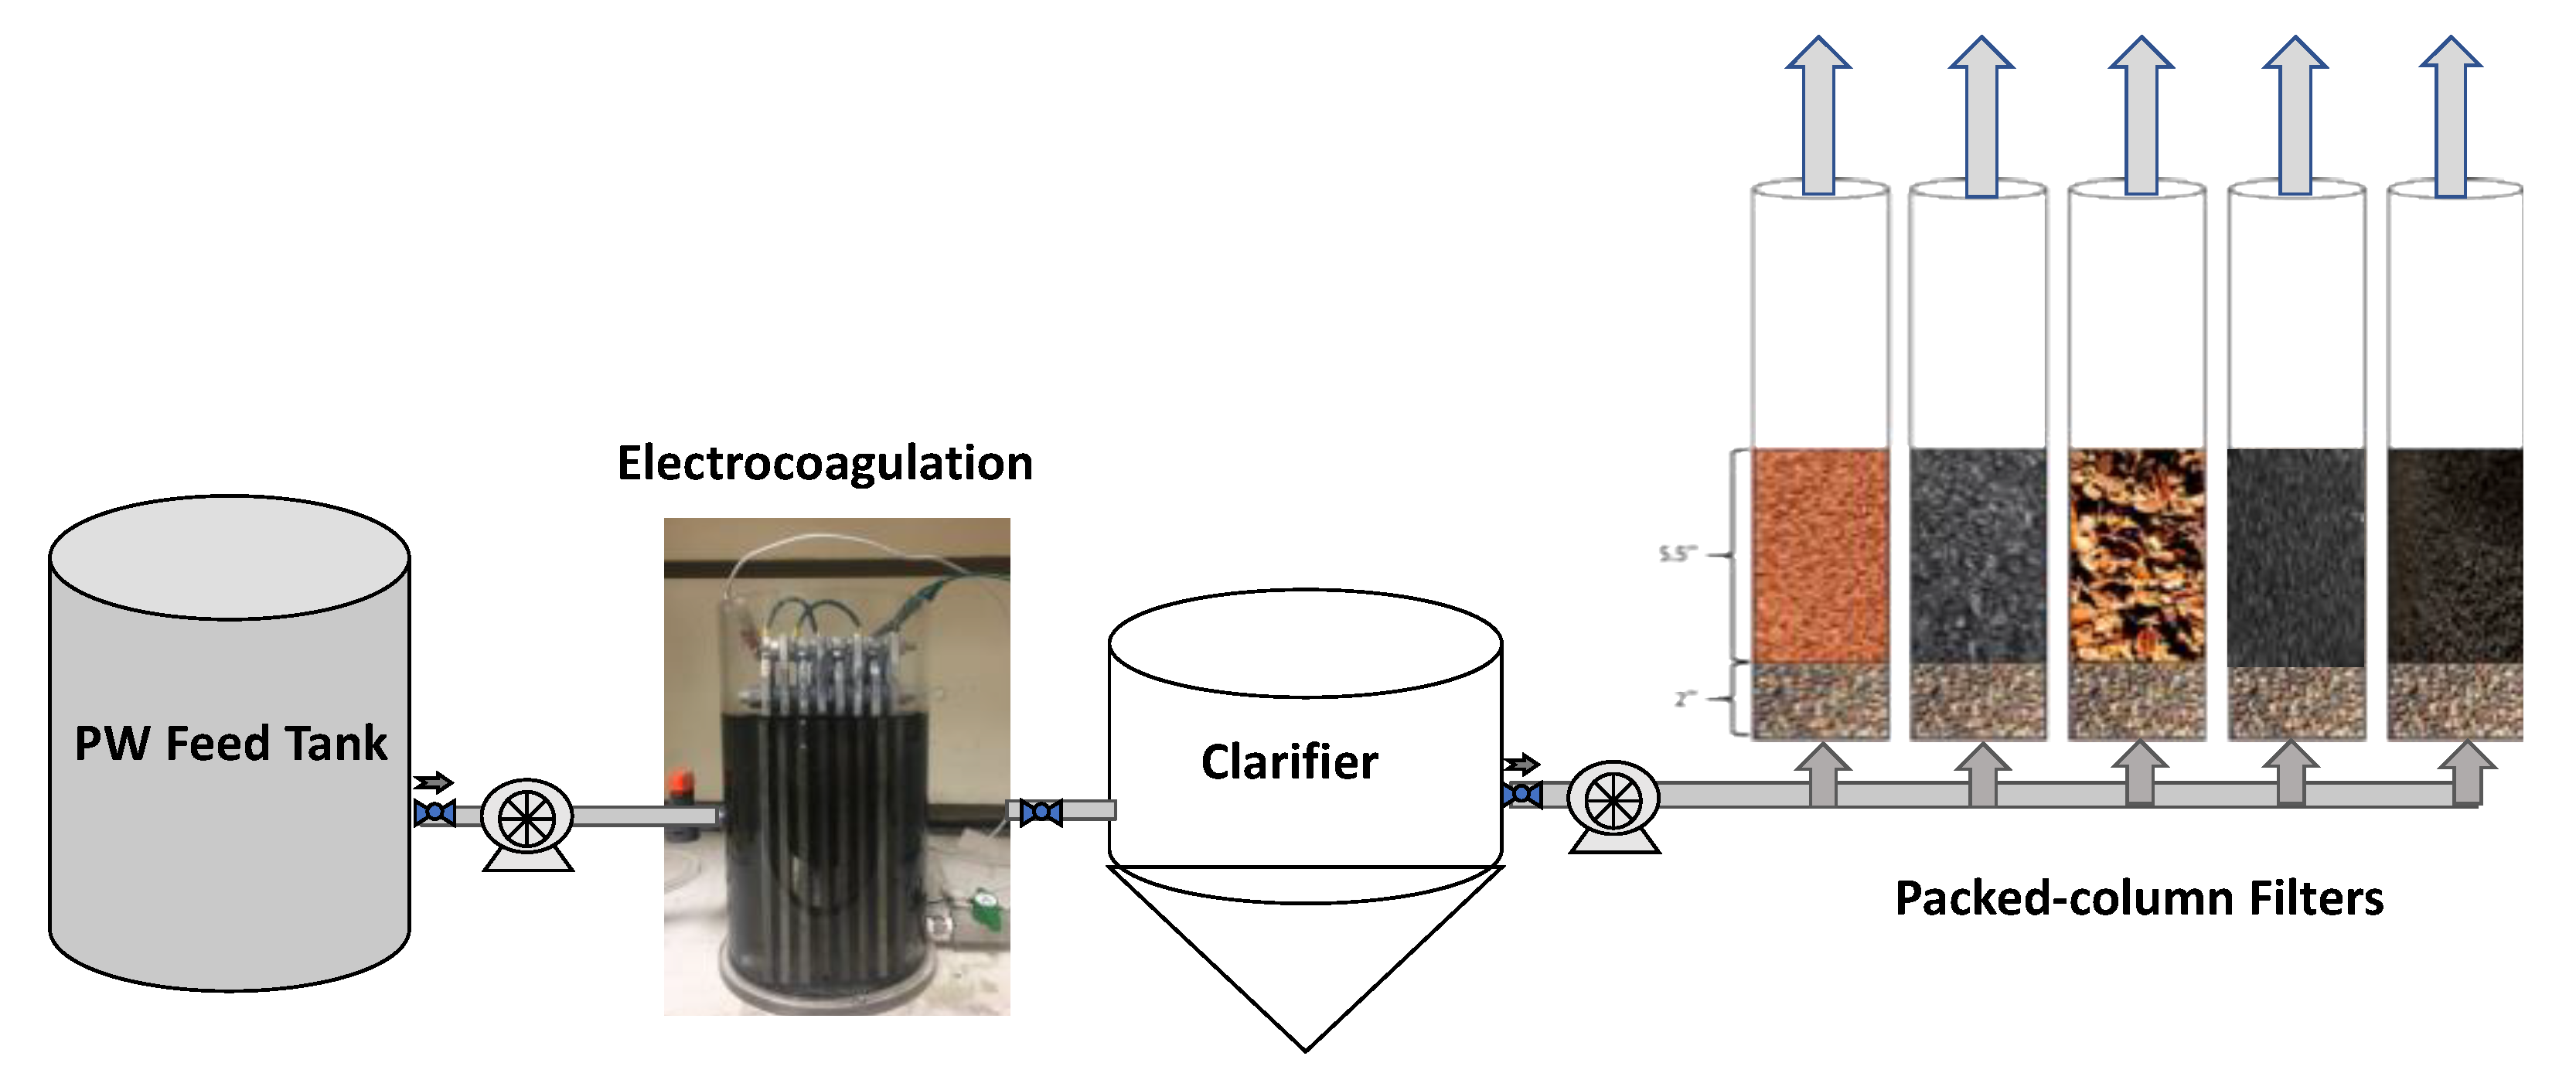
2.3. Continuous-Flow Experiments

Batch experiments were conducted for CC and EC to study and evaluate their performances. Once the optimal conditions were defined, continuous-flow experiments were conducted. The experimental set up was composed of EC stage as pretreatment for filtration. Produced water flowed through the EC reactor at 208 mL/min rate based on the optimal ECT determined during batch experiments.

3. Results

3.1. Chemical Coagulation (CC)

Alum was demonstrated to have a higher efficacy than ferric chloride to remove suspended solids from produced water (Figure 3a). While added in the same molar concentration, the turbidity removal by Al(III) could be up to 1.5 times higher than by Fe(III). Over 80% turbidity was removed at Al(III) dose of 2.6 mmol (71 mg/L), while 60% of turbidity was removed by Fe(III) at dose of 2.4 mmol (135 mg/L). The consumption of alkalinity in produced water to form Al(OH)3 and Fe(OH)3 flocs was the same, and the pH drop by using alum as coagulant exhibited the same trend as using ferric chloride (Figure 3b).
Recently, Chang et al. [33] employed both alum and ferric chloride to coagulate flowback and produced water. At an optimal dose of 900 mg/L, ferric chloride showed a greater capacity to remove turbidity and organics. Alum exhibited a slightly inferior efficiency, which is different from the results obtained in the current study. The difference, however, resides in the fact that Chang et al. [33] compared the efficiency of the chemicals added in mg/L of the chemical molecules and not the molar concentration of the metal itself. If the coagulant dose is converted to molar concentrations, Chang et al.’s study reached the same conclusion as this study: that Al(III) coagulant outperformed Fe(III) for better removal of turbidity.
Nadella et al. reported that the zeta-potential of colloids present in the raw produced water collected in the Permian Basin was slightly negatively charged and near neutral owing to its high ionic strength and the presence of high concentrations of multivalent cations, such as Mg, Ca, and Fe [34]. During coagulation, the positively charged metal coagulant is attracted to the negatively charged colloids via electrostatic interaction. Flocs form during the charge neutralization process, and particle collisions occur. Adding excess coagulant beyond charge neutralization results in the formation of metal coagulant precipitates (e.g., Al(OH)3 or Fe(OH)3). Colloidal contaminants in produced water were entrained or swept down by the precipitates as they settled in the suspension. This study showed alum was more effective for charge neutralization and enmeshment/entrainment of colloidal particles in produced water than ferric chloride.
Considering the current market prices of coagulants (US $500–$590/metric ton for alum and US $460–$800/ton for ferric chloride), the use of alum as a coagulant for produced water represents an economic advantage. For example, to achieve 60% removal of turbidity from the produced water, it requires 36 mg/L Al(III) (444 mg/L Al2(SO4)3⋅8H2O) and 134 mg/L Fe(III) (650 mg/L FeCl3 ⋅6H2O) as coagulant. Assuming the price for both coagulants would be $500/ton, the chemical cost of using Fe(III) as coagulant ($0.325/m3 water) is 1.46 time higher than using Al(III) as coagulant ($0.222/m3 water). For a conventional CC, the energy consumption required for mixing in coagulation and flocculation processes was estimated to be 0.4 kWh/m3 [35]. Assuming the electrical cost is $0.10 kWh, the electrical power cost of CC is estimated to be $0.04/m3. The total operating costs for Al and Fe coagulation are approximately $0.26/m3 and $0.37/m3, respectively.

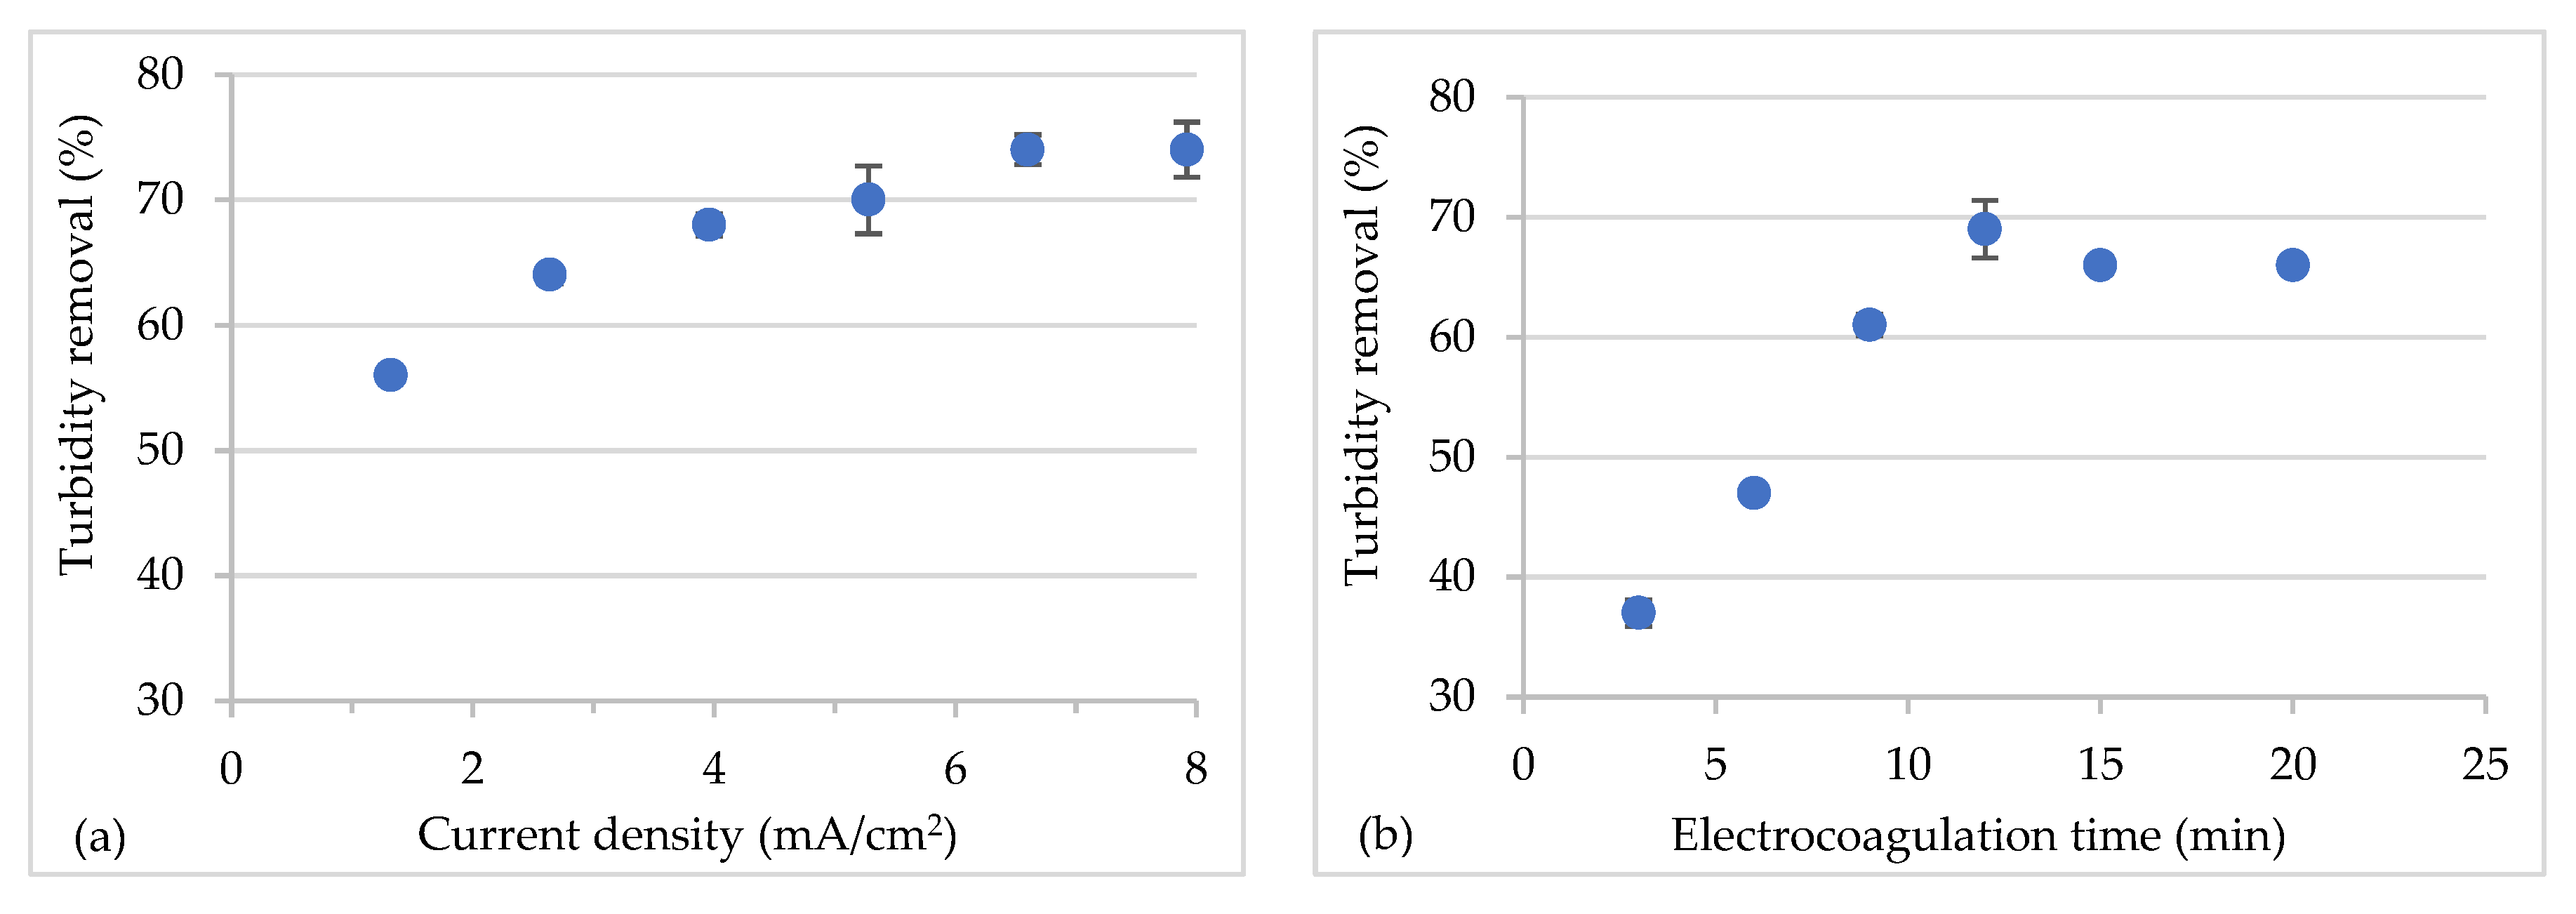
3.2. Electrocoagulation (EC)

Aluminum electrodes were selected over iron electrodes for EC based on the CC test results and because hydraulic fracturing requires low concentration of iron. Figure 4 shows the experimental results to optimize Al(III) dose through changing current density and hydraulic retention time in EC process. The optimal Al(III) dose achieved 74 ± 1.2% turbidity removal at current density of 6.6 mA/cm2 (1.8 volts). Further increase of current density levels did not have significant improvement in turbidity removal.
Once current density was optimized, the effect of ECT on turbidity removal was studied, as shown in Figure 4b. The optimal ECT was determined to be 12 min because turbidity removal reached the highest at 70%. ECT longer than 12 min did not improve turbidity removal. Therefore, for continuous-flow experiments, the design parameters were set at the current density 6.6 mA/cm2 and an ECT of 12 min.
pH dropped from 7.47 to 6.41 after 20 min of operation due to the consumption of hydroxyl anions during the formation of aluminum hydroxide, which precipitates as flocs according to Equation (3). The organic carbon concentration in the EC effluent was considerably variable, with a value of 26.78 ± 14.71 mg/L, representing a TOC removal of 53–78%. Due to relatively low pH during EC operation, the removal of hardness was marginal: 6.4% ± 2.8% for calcium and 2.1% ± 0.5% for magnesium.
Based on the Faraday’s law, the theoretical amount of Al(III) generated from anode at optimal conditions (i.e., 6.6 mA/cm2 and 12 min ECT) is estimated to be 67 mg/L of Al(III). The EC calculation result is comparable with the optimal alum dose obtained from CC, where at Al(III) dose of 80 mg/L, 80% of turbidity was removed; in EC, 74% of turbidity was removed at the theoretical Al(III) dose of 67 mg/L. Meanwhile, pH dropped to 6.4 in both coagulation processes. The actual consumption of aluminum electrodes is higher than the theoretical value, due to electrochemical corrosion of both the anode and cathode that contributes to the extra-faradaic aluminum dosing [36]. Picard et al. demonstrated cathodic dissolution in the EC process due to chemical attack by hydroxyl ions generated during water reduction [37]. The actual coagulant dose in Al-EC can be 1.2 to 2.2 times higher than the calculated faradaic aluminum amount [36,37].
The unit operating costs for EC can be estimated by adding the electrical costs and the costs for the sacrificial anodes. To achieve 70% turbidity recovery, the energy requirement was calculated to be 0.36 kWh/m3 of water treated; this value is 2–10 times lower than other EC studies generating the same amount of aluminum dose during treatment of synthetic water and wastewater [35,36,37], because higher salinity of produced water reduced the electrical resistance of the solution during EC. Given an electrical cost of $0.10/kWh, the electrical power cost was estimated $0.036/m3. The current market price for aluminum sheets (thickness 0.2 to 200 mm) varies in the range of $1000–$3000 per ton. Assuming aluminum electrode cost is ∼$3.00/kg, and the actual blade consumption is two times higher than the theoretical amount (i.e., 2 × 67 = 134 mg/L) due to electrode dissolution [35], the cost of aluminum electrode consumed is estimated $0.40/m3 of treated water. Therefore, the total operating costs for EC were estimated $0.44/m3 of treated water, which is 1.7 and 1.2 times higher than using alum and ferric chloride as chemical coagulants ($0.26/m3 and $0.37/m3), respectively. The EC operating costs can be reduced and comparable to CC by using low-cost aluminum electrodes. It should be noted that the costs for chemical handling and waste disposal were not included in this preliminary cost analysis.

3.3. Continuous-Flow Filtration

Filtration experiments were conducted for 60 h to evaluate the impacts of different filter media on the removal of suspended solids and adsorption of contaminants. Samples were taken after 0.5, 1, 2, 4, 8, 12, 18, 24, 30, 36, 48, 54, and 60 h filtration, for turbidity measurement. Since the EC stage removed about 70% of initial turbidity, the packed-columns had a turbidity of 14.1 ± 5.3 NTU. In addition to turbidity, TOC analysis was conducted for samples from 0 to 36 h of operation, since all filter media had reached turbidity breakthrough (defined as below 50% removal in this study) by around that point. Figure 5 illustrates the removal of turbidity and TOC over time in different media filters.
Removal of salts was negligible because the conductivity reduction was less than 4% in all media filters. None of the filter media had a significant impact on pH, as all the columns reduced it to a range where the lowest value was 6.92. This indicates that there was no significant consumption of alkalinity or generation of chemical species that affected pH during filtration.

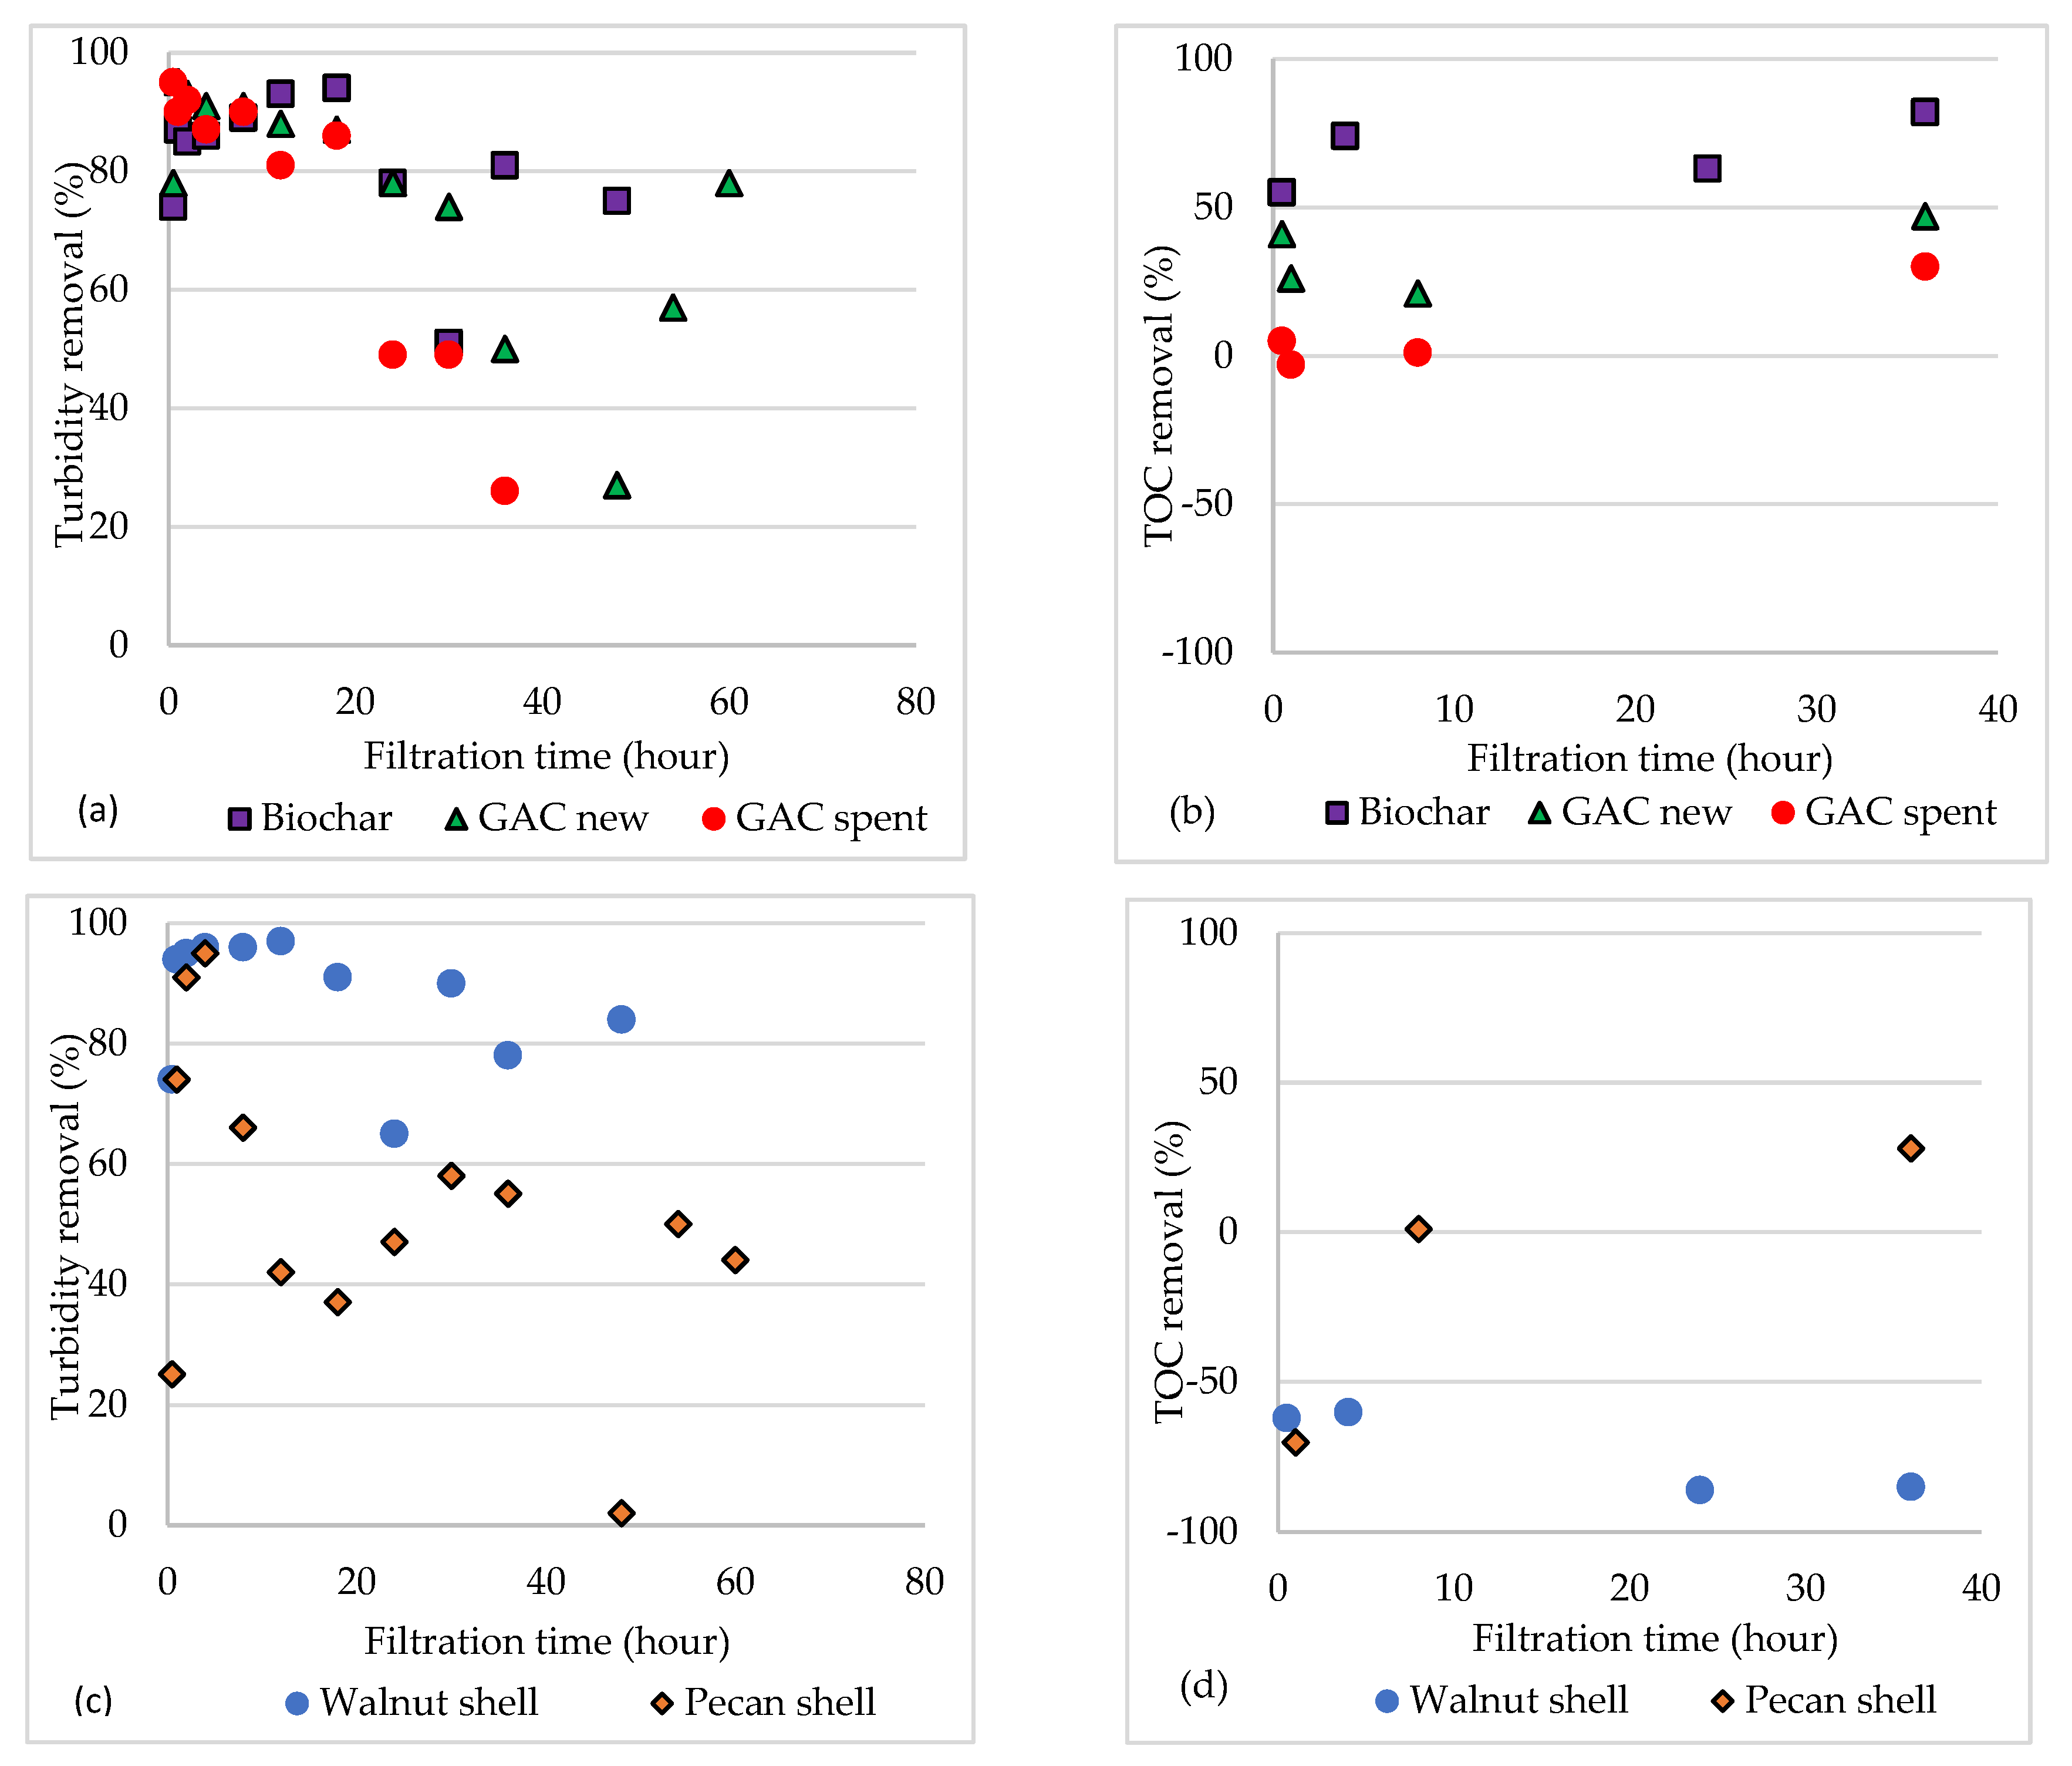
3.3.1. New and Spent GAC

New GAC removed 80% turbidity during the first 24 h of filtration and the removal dropped to ~50% after 36 h (Figure 5a,b). Organic contaminants were reduced by 21% during the first 8 h of filtration, and the removal increased to 47% after 36 h. The results obtained in this study are similar to that Dastgheib et al. [15] reported; for GAC in a column experiment with EBCT of 6 min, the greatest removal of organics occurred at 24 h of operation, reaching ~55% removal. The EBCT of the GAC packed-column was designed and operated in this study for 19 min. When comparing these EBCT time to general standards, they all fit to commonly applied values because according to the U.S. Environmental Protection Agency (EPA), typical EBCT for water treatment applications of activated carbon ranges between 5 to 25 min [38].
In addition to the use of new GAC, this study explored an innovative use of spent GAC. One of the advantages of using this media is the low cost. When GAC is no longer useful for filtration in conventional water treatment plants, it becomes a waste; therefore, there is no cost related to acquiring spent GAC for filtration in this study.
According to the results obtained, the spent GAC demonstrated potential for produced water treatment; it reached half turbidity breakthrough after 24 h of operation compared to 36 h for the new GAC. Turbidity removal rates are acceptable at least in the first few hours of operation, since both new and spent GAC achieved over 90% during the first 8 h of operation and maintained greater than 80% after 18 h.
The main differences between new and spent GAC rely on their capacity to remove organics. Because the adsorption capacity of the spent GAC was exhausted during 9-year filtration of surface water, it barely adsorbed organic matter (5%) during the first 8 h of filtration. After 8 h it started showing a TOC removal of 30%.
Leaching test was conducted to investigate the release of adsorbed contaminants into deionized water from the spent GAC in comparison with new GAC. The conductivity of new GAC and spent GAC leachates was 16.4 µS/cm and 57.6 µS/cm after 24-h shaking, respectively. Release of organics from the GAC was 21-times of new GAC. The turbidity of new GAC and spent GAC leachates was 1.98 NTU and 6.72 NTU. The leaching experimental results imply that spent GAC was not as effective as new GAC to remove organic matter.

3.3.2. Walnut and Pecan Shell

Walnut media had great turbidity removal capacity during the first 18 h of operation reducing turbidity from 16.6 NTU to 0.49 NTU (Figure 5c,d). Turbidity breakthrough was reached after 24 h of operation. In terms of organics, TOC increased in the filter effluent right after starting the column operation due to the leaching of organic matter from the media. In contrast, literature reports that walnut shell filtration can decrease produced water turbidity from 33 to 0.02 NTU and remain stable for about 80 h of operation, with an average removal rate of organics of 60% [15]. This difference may be related to the media particle size and EBCT. In this study, the particle size of walnut shell was 1.68–2 mm and the EBCT was 19 min. Dastgheib et al. employed a particle size much smaller of 0.30–0.42 mm and a greater EBCT of 47 min, which may be attributable to the different removal results [15]. Smaller particle size and longer EBCT result in better removal but it increases the operating cost of filtration. Longer operation time for the columns can also represent a disadvantage in larger scale applications due to requirements of larger filters and footprint. Cost-benefit analysis should be conducted before selecting operating parameters for walnut shell.
There are limited studies reporting the use of pecan shell in produced water filtration. Although it reached good turbidity removal during the first 4 h (from 16.6 to <1 NTU), the removal was not maintained thereafter. In addition, pecan shell presented organic leaching during the first hour of operation, increasing TOC concentration in the effluent (Figure 5d). The leaching was visibly observed as the effluent from pecan shell had a light-yellow color during the first couple of hours of operation. Pretreatment procedures for pecan shell would need to be researched and tested to reduce the organic leaching and improve the TOC removal from produced water.

3.3.3. Biochar

Biochar was the filter media that took the longest to reach its best turbidity removal rate (Figure 5a,b). It took 8–12 h to get to 93%, while other filter media like new GAC and walnut shell removed the same percentage only after 1–2 h of operation. Biochar turbidity removal started to decrease after 24 h and reached half turbidity breakthrough.
The greatest advantage of filtering produced water with biochar is its outstanding capacity of removing organic matter. Biochar removed 74% TOC within the first 4 h of operation and maintained the removal rate for 36 h. It was the best filter media to remove organics, since new GAC was the closest to biochar and it only removed <50% of TOC. In this study, the adsorbent capacity of biochar turned out to be the greatest for organic matter removal.
It has been reported some biochars have stronger adsorption and binding affinities to organic contaminants than commercial GACs [39,40]. Our previous study investigated the factors affecting the use of biochar as an alternative adsorbent to treat pharmaceuticals from desalination concentrate in comparison with commercial GAC [32]. The adsorption capacity of biochar was comparable to GAC and achieved higher removal for some organic chemicals. High salinity and electrolyte ions in feedwater improved adsorption process due to neutralization of the negative charge of biochar with cations and compression of electrical double layer near the surface. Also, divalent cations (Ca2+ and Mg2+) in produced water can form complex compound with organics via O-, N-, S- donors—such as carboxyl, hydroxyl, and phenolic functional groups, which benefits the interaction with a negatively charged biochar (coordinates with carboxyl groups on the biochar surface). Although biochar has a less-specific surface area than GAC, biochar achieved comparable turbidity removal and better TOC removal. Further studies are needed to elucidate the mechanisms of contaminants removal from highly saline produced water.
Moreover, biochar could be a low-cost alternative. The biochar used in this study is $287/m3, which could be 5 or 6 times less expensive than GACs, and thus could significantly reduce water treatment costs.

3.3.4. Removal of metals

The removal of metals was monitored in biochar and walnut column filters, given they showed the best performance in TOC and turbidity removal, respectively (Table 3). Both biochar and walnut filter media showed great potential of removing iron from produced water to the level below the instrumental detection limit. These media also removed SiO2 to higher than 50% during filtration. There was no removal of other metals in filters.

3.4. Potential for Onsite Produced Water Reuse

Hydraulic fracturing is a highly water intensive process that requires cross-linked gel fluids for vertical wells and slick-water fluids for horizontally drilled wells. The cross-linked gel fluid usually has a high viscosity to transport sand, ceramics, and other proppant materials to induce fractures in the formation. The slick-water has lower viscosity but contains other friction reducers and chemical additives. Despite their differences in composition and purposes within the fracking process, both fluids can use brackish water [13] instead of freshwater for its operation, such as clean brine. In this study, after EC and filtration, the turbidity of the treated produced water reached less than 1 NTU, and iron was not detected. With the advances in hydraulic fracturing, the high salinity in produced water may not be a limiting factor for reuse. For example, Schlumberger tested the fluid in a variety of mix waters with salinity levels ranging from 43,000 to 350,000 mg/L of TDS from formations in the Marcellus Shale and the Permian Basin. Identical formulations showed improved performance as the salinity increased [41].

4. Conclusions

This study aims to generate a clean brine with low suspended solids, iron, and organic matter, which can be reused onsite for hydraulic fracturing process. Reuse of produced water can significantly reduce the current freshwater consumption during unconventional oil and gas exploration, and decrease the volume of produced water for deep well disposal. This study evaluated different alternatives for produced water treatment, including through a comparison between chemical and electro-coagulation, and different low-cost filter media.
During chemical coagulation, alum exhibited higher removal of turbidity than ferric chloride at the same molar concentration, resulting in lower chemical demand and cost. To achieve 60% removal of turbidity from the produced water, it requires 36 mg/L Al(III) (444 mg/L Al2(SO4)3⋅18H2O) and 134 mg/L Fe(III) (650 mg/L FeCl3 ⋅6H2O) as the coagulant. The total operating costs, including the electrical power cost and chemical cost for Al and Fe coagulation, were estimated approximately $0.26/m3 and $0.37/m3, respectively.
EC removed 70% of turbidity and an average of 63% of TOC from the produced water under optimal Al dose (current density of 6.60 mA/cm2 and EC treatment time of 12 min). The energy requirement was calculated 0.36 kWh/m3 of water treated, which is much lower than EC treatment of lower salinity water and wastewater. EC has the advantage of shorter retention time, no need for additional chemicals, lesser sludge generation, and high mobility for onsite produced water treatment. Assuming the aluminum electrodissolution yield of 200% due to faradaic reaction and electrode corrosion, the total operating cost of EC was estimated $0.44/m3 of treated water, which is 1.7 or 1.2 times higher than CC using alum or ferric chloride as the coagulant.
After EC, media filtration contributed to further turbidity removal: up to 97% for walnut shell, 95% for new GAC, and 94% for biochar. In terms or organic removal, only biochar and new GAC were considered effective. Spent GAC had very low organic matter removal rates, and walnut and pecan shell leached out organics which caused an increase rather than a removal. All of these occur with reasonable pH changes (reducing from 7.44 to 6.92). Regarding metals in filtrate from walnut shell and biochar, iron was reduced to an undetectable level; SiO2 was reduced by 50%; and other elements, such as calcium, sodium, and magnesium, were not significantly removed.
The use of agricultural waste products (e.g., pecan, walnut shell, and biochar) for packed-column filtration represents a promising economic advantage. Although walnut shell had a greater contaminant removal capacity compared to pecan shell, both can contribute to treating produced water into a clean brine. The economic investment of applying these filter media would be minimal, as the costs related are energy (pumping water) and materials. Spent shells after useful lifetime could be landfilled or used as fuels to generate energy.

Author Contributions

A.Z.R. conducted experiments; A.Z.R., P.X., and H.W. wrote the original draft; A.Z.R., P. X., H.W., L.H., and Y.Z. reviewed and edited the manuscript. P.X. managed the research project. All authors have read and agreed to the published version of the manuscript.

Funding

The authors thank the Mexican Energy Department and the National Council for Science and Technology for providing the funds to conduct this study through the scholarship CONACYT–SENER Sustentabilidad Energética, Quinto Periodo.

Conflicts of Interest

The authors declare no conflict of interest. The funders had no role in the design of the study; in the collection, analyses, or interpretation of data; in the writing of the manuscript, or in the decision to publish the results.

References

  1. Veil, J.U.S. Produced Water Volumes and Management Practices in 2012; Veil Environmental, LLC: Annapolis, MD, USA, 2015. [Google Scholar]
  2. Arthur, J.D.; Dillon, L.W.; Frazan, D.J.; Hochheiser, W.H. Management of Produced Water from Oil and Gas Wells; National Petroleum Council: Washington, DC, USA, 2011. [Google Scholar]
  3. Jiménez, S.; Micó, M.M.; Arnaldos, M.; Medina, F.; Contreras, S. State of the art of produced water treatment. Chemosphere 2018, 192, 186–208. [Google Scholar] [CrossRef] [PubMed]
  4. Khan, N.A.; Engle, M.; Dungan, B.; Holguin, F.O.; Xu, P.; Carroll, K.C. Volatile-organic molecular characterization of shale-oil produced water from the Permian Basin. Chemosphere 2016, 148, 126–136. [Google Scholar] [CrossRef] [PubMed]
  5. Dahm, K.G.; Guerra, K.L.; Xu, P.; Drewes, J.E. Composite geochemical database for coalbed methane produced water quality in the Rocky Mountain region. Environ. Sci. Technol. 2011, 45, 7655–7663. [Google Scholar] [CrossRef] [PubMed]
  6. Xu, P.; Drewes, J.E.; Heil, D. Beneficial use of co-produced water through membrane treatment: Technical-economic assessment. Desalination 2008, 225, 139–155. [Google Scholar] [CrossRef]
  7. Chaudhary, B.K.; Sabie, R.; Engle, M.A.; Xu, P.; Willman, S.; Carroll, K.C. Produced Water Quality Spatial Variability and Alternative-Source Water Analysis Applied to the Permian Basin, USA. Hydrogeol. J. 2020, 27, 2889–2905. [Google Scholar] [CrossRef]
  8. USEPA. U.S. Environmental Protection Agency. Study of Oil and Gas Extraction Wastewater Management Under the Clean Water Act. EPA-821-R19-001. Available online: https://www.epa.gov/sites/production/files/2019-05/documents/oil-and-gas-study_draft_05-2019.pdf (accessed on 29 January 2019).
  9. Hu, L.; Yu, J.; Luo, H.; Wang, H.; Xu, P.; Zhang, Y. Simultaneous recovery of ammonium, potassium and magnesium from produced water by struvite precipitation. Chem. Eng. J. 2020, 382, 123001. [Google Scholar] [CrossRef]
  10. Liden, T.; Santos, I.C.; Hildenbrand, Z.L.; Schug, K.A. Treatment modalities for the reuse of produced waste from oil and gas development. Sci. Total Environ. 2018, 643, 107–118. [Google Scholar] [CrossRef]
  11. Guglielmi, Y.; Cappa, F.; Avouac, J.P.; Henry, P.; Elsworth, D. Induced seismicity. Seismicity triggered by fluid injection-induced aseismic slip. Science 2015, 348, 1224–1226. [Google Scholar] [CrossRef] [Green Version]
  12. Scanlon, B.R.; Reedy, R.C.; Xu, P.; Engle, M.; Nicot, J.P.; Yoxtheimer, D.; Yang, Q.; Ikonnikova, S. Can we beneficially reuse produced water from oil and gas extraction in the U.S.? Sci. Total Environ. 2020, 717, 137085. [Google Scholar] [CrossRef]
  13. Reyes, F.R.; Engle, M.; Lixin, J.; Jacobs, M.A.; Konter, J.G. Hydrogeochemical controls on brackish groundwater and its suitability for use in hydraulic fracturing: The Dockum Aquifer, Midland Basin, Texas. Environ. Geosci. 2018, 25, 37–63. [Google Scholar] [CrossRef]
  14. Wang, M.; Wang, M.; Chen, D.; Gong, Q.; Yao, S.; Jiang, W.; Chen, Y. Evaluation of pre-treatment techniques for shale gas produced water to facilitate subsequent treatment stages. J. Environ. Chem. Eng. 2019, 7, 102878. [Google Scholar] [CrossRef]
  15. Dastgheib, S.A.; Knutson, C.; Yang, Y.; Salih, H.H. Treatment of produced water from an oilfield and selected coal mines in the Illinois Basin. Int. J. Greenh. Gas Control 2016, 54, 513–523. [Google Scholar] [CrossRef] [Green Version]
  16. Younker, J.M.; Walsh, M.E. Bench-scale investigation of an integrated adsorption–coagulation–dissolved air flotation process for produced water treatment. J. Environ. Chem. Eng. 2014, 2, 692–697. [Google Scholar] [CrossRef]
  17. Hakizimana, J.N.; Gourich, B.; Chafi, M.; Stiriba, Y.; Vial, C.; Drogui, P.; Naja, J. Electrocoagulation process in water treatment: A review of electrocoagulation modeling approaches. Desalination 2017, 404, 1–21. [Google Scholar] [CrossRef]
  18. Kuokkanen, V.; Kuokkanen, T.; Rämö, J.; Lassi, U. Recent Applications of Electrocoagulation in Treatment of Water and Wastewater—A Review. Green Sustain. Chem. 2013, 3, 89–121. [Google Scholar] [CrossRef] [Green Version]
  19. Valero, D.; Ortiz, J.M.; Expósito, E.; Montiel, V.; Aldaz, A. Electrocoagulation of a synthetic textile effluent powered by photovoltaic energy without batteries: Direct connection behaviour. Sol. Energy Mater. Sol. Cells 2008, 92, 291–297. [Google Scholar] [CrossRef]
  20. Jain, P.; Sharma, M.; Dureja, P.; Sarma, P.M.; Lal, B. Bioelectrochemical approaches for removal of sulfate, hydrocarbon and salinity from produced water. Chemosphere 2017, 166, 96–108. [Google Scholar] [CrossRef]
  21. Millar, G.J.; Lin, J.; Arshad, A.; Couperthwaite, S.J. Evaluation of electrocoagulation for the pre-treatment of coal seam water. J. Water Process Eng. 2014, 4, 166–178. [Google Scholar] [CrossRef]
  22. Zhao, S.; Huang, G.; Cheng, G.; Wang, Y.; Fu, H. Hardness, COD and turbidity removals from produced water by electrocoagulation pretreatment prior to Reverse Osmosis membranes. Desalination 2014, 344, 454–462. [Google Scholar] [CrossRef]
  23. CleanWave-FactSheet. CleanWaveSM Water Treatment Service. In Mobile Service for Produced and Flow Water; Halliburton: Houston, TX, USA, 2017. [Google Scholar]
  24. Mousa, I.E. Total petroleum hydrocarbon degradation by hybrid electrobiochemical reactor in oilfield produced water. Mar. Pollut. Bull. 2016, 109, 356–360. [Google Scholar] [CrossRef]
  25. Camarillo, M.K.; Domen, J.K.; Stringfellow, W.T. Physical-chemical evaluation of hydraulic fracturing chemicals in the context of produced water treatment. J. Environ. Manag. 2016, 183, 164–174. [Google Scholar] [CrossRef] [PubMed] [Green Version]
  26. Gomes, J.; Cocke, D.; Das, K.; Guttula, M.; Tran, D.; Beckman, J. Treatment of produced water by electrocoagulation. In Proceedings of the PD Congress 2009: Proceedings of sessions and symposia held during TMS 2009 Annual Meeting & Exhibition, San Francisco, CA, USA, 15–19 February 2009; pp. 459–466. [Google Scholar]
  27. Ezechi, E.H.; Isa, M.H.; Kutty, S.R.M.; Yaqub, A. Boron removal from produced water using electrocoagulation. Process Saf. Environ. Prot. 2014, 92, 509–514. [Google Scholar] [CrossRef]
  28. Shamaei, L.; Khorshidi, B.; Perdicakis, B.; Sadrzadeh, M. Treatment of oil sands produced water using combined electrocoagulation and chemical coagulation techniques. Sci. Total Environ. 2018, 645, 560–572. [Google Scholar] [CrossRef] [PubMed]
  29. Zhang, Z.; Du, X.; Carlson, K.H.; Robbins, C.A.; Tong, T. Effective treatment of shale oil and gas produced water by membrane distillation coupled with precipitative softening and walnut shell filtration. Desalination 2019, 454, 82–90. [Google Scholar] [CrossRef]
  30. Kusworo, T.D.; Aryanti, N.; Qudratun; Utomo, D.P. Oilfield produced water treatment to clean water using integrated activated carbon-bentonite adsorbent and double stages membrane process. Chem. Eng. J. 2018, 347, 462–471. [Google Scholar] [CrossRef]
  31. Hosny, R.; Fathy, M.; Ramzi, M.; Abdel Moghny, T.; Desouky, S.E.M.; Shama, S.A. Treatment of the oily produced water (OPW) using coagulant mixtures. Egypt. J. Pet. 2016, 25, 391–396. [Google Scholar] [CrossRef] [Green Version]
  32. Lin, L.; Jiang, W.; Xu, P. Comparative study on pharmaceuticals adsorption in reclaimed water desalination concentrate using biochar: Impact of salts and organic matter. Sci. Total Environ. 2017, 601, 857–864. [Google Scholar] [CrossRef]
  33. Chang, H.; Liu, B.; Yang, B.; Yang, X.; Guo, C.; He, Q.; Liang, S.; Chen, S.; Yang, P. An integrated coagulation-ultrafiltration-nanofiltration process for internal reuse of shale gas flowback and produced water. Sep. Purif. Technol. 2019, 211, 310–321. [Google Scholar] [CrossRef]
  34. Nadella, M.; Sharma, R.; Chellam, S. Fit-for-purpose treatment of produced water with iron and polymeric coagulant for reuse in hydraulic fracturing: Temperature effects on aggregation and high-rate sedimentation. Water Res. 2020, 170, 115330. [Google Scholar] [CrossRef]
  35. Cañizares, P.; Martínez, F.; Jiménez, C.; Sáez, C.; Rodrigo, M.A. Technical and economic comparison of conventional and electrochemical coagulation processes. J. Chem. Technol. Biotechnol. 2009, 84, 702–710. [Google Scholar] [CrossRef]
  36. Gu, Z.; Liao, Z.; Schulz, M.; Davis, J.R.; Baygents, J.C.; Farrell, J. Estimating Dosing Rates and Energy Consumption for Electrocoagulation Using Iron and Aluminum Electrodes. Ind. Eng. Chem. Res. 2009, 48, 3112–3117. [Google Scholar] [CrossRef]
  37. Picard, T.; Cathalifaud-Feuillade, G.; Mazet, M.; Vandensteendam, C. Cathodic dissolution in the electrocoagulation process using aluminium electrodes. J. Environ. Monit. 2000, 2, 77–80. [Google Scholar] [CrossRef] [PubMed]
  38. EPA, U.S. Granular Activated Carbon. Available online: https://iaspub.epa.gov/tdb/pages/treatment/treatmentOverview.do?treatmentProcessId=2074826383#content (accessed on 29 January 2019).
  39. Ahmad, M.; Lee, S.S.; Dou, X.; Mohan, D.; Sung, J.-K.; Yang, J.E.; Ok, Y.S. Effects of pyrolysis temperature on soybean stover-and peanut shell-derived biochar properties and TCE adsorption in water. Bioresour. Technol. 2012, 118, 536–544. [Google Scholar] [CrossRef] [PubMed]
  40. Tong, X.J.; Li, J.Y.; Yuan, J.H.; Xu, R.K. Adsorption of Cu(II) by biochars generated from three crop straws. Chem. Eng. J. 2011, 172, 828–834. [Google Scholar] [CrossRef]
  41. Whitfield, S. Permian, Bakken Operators Face Produced Water Challenges. J. Pet. Technol. 2017, 69, 48–51. [Google Scholar] [CrossRef]
Figure 1. General schematic representation of electrocoagulation (EC).
Water 12 00770 g001
Figure 2. Schematic diagram of the continuous-flow experimental set up. The packed columns employed different media, from left to right: walnut shell, biochar, pecan shell, new GAC, and spent GAC.
Water 12 00770 g002
Figure 3. Turbidity removal (a) and pH change (b) during chemical coagulation of produced water.
Water 12 00770 g003
Figure 4. Effect of applied current density (a) and electrocoagulation time (b) during electrocoagulation on turbidity removal. The error bars represent the variability of duplicate experiments.
Water 12 00770 g004
Figure 5. Removal of turbidity (a) and (c), and removal of TOC (b) and (d) in different media filters.
Water 12 00770 g005
Table 1. Electrocoagulation technologies applied in produced water treatment: design parameters.
Ref.HRT (min)Experimental
Set up/Arrangement
Current Density (mA/cm2)Produced Water Characteristics
[26]4Continuous flow goes 4 times through the reactor (each time 1 min), Al and Fe electrodes10 and 20Conductivity 150–160 mS/cm, COD 27 mg/L, 68% COD removal
45Batch operation
PW 400 mL, Al and Fe electrodes
13.9Conductivity 160–167 mS/cm, COD 32 mg/L, 67% COD removal
[22]30Continuous flow, pilot scale
PW 80 L
Fe electrodes
5.56COD 280 mg/L, Turbidity 135 NTU; Max. turbidity removal 93.8% and 67% COD removal
[21]1Continuous flow at 1.14 L/min
Al electrodes
Coal seam PW
0.8Turbidity 8.5 NTU, DOC 6.4 mg/L; 54% DOC removal
Significant removal in scale formation species
[27]15–90Batch operation
PW 500 mL
Aluminum electrodes
1.2–3.6TDS 15 g/L, boron 10mg/L
15 min removes 60% boron; 90 min removes 98% boron
[28]30–90Batch operation,
Volume of oil sands PW 1.5 L
Al and Fe electrodes; AlCl3 added
6–30TDS 1.7 g/L
TOC 475–720 mg/L
39% TOC removal
COD—chemical oxygen demand; DOC—dissolved organic carbon; HRT—hydraulic retention time; NTU—nephelometric turbidity units; PW—produced water; TDS—total dissolved solids; TOC—total organic carbon.
Table 2. Chemical characteristics of the produced water from the Permian Basin, Jal, NM.
ParameterUnitValue
pH 7.30 ± 0.21
Alkalinitymg/L as CaCO32345 ± 329
Electrical conductivitymS/cm201.2 ± 13.3
Total dissolved solidsg/L129.3 ± 8.5
Total organic carbonmg/L83.1 ± 30.8
Total phosphorus mg/L<0.1
TurbidityNTU53.4 ± 5.0
Ammoniummg/L655 ± 77
Arsenicmg/L1.1 ± 0.0
Bariummg/L1.0 ± 0.0
Bromidemg/L591 ± 16
Calciummg/L4247 ± 752
Chloridemg/L65,800 ± 1600
Ironmg/L11 ± 9
Lithiummg/L18.8 ± 0.3
Magnesiummg/L727 ± 54
Manganesemg/L0.66 ± 0.02
Nickelmg/L0.02 ± 0.004
Potassiummg/L805 ± 230
Silicamg/L32 ± 2
Sodiummg/L42,720 ± 2093
Strontiummg/L257 ± 20
Sulfatemg/L1010 ± 9
Table 3. Metal concentrations in filtrate from biochar and walnut column filters.
Water SampleTime (Hours)As (mg/L)Ba (mg/L)Fe (mg/L)Ca (mg/L)Mg (mg/L)SiO2 (mg/L)Na (mg/L)
Filter influent01.121.0313.4379952934.733,190
Biochar0.250.982.18ND294344814.326,840
0.51.041.25ND368252713.233,840
361.040.95ND390753918.434,840
Walnut0.251.031.29ND380755516.933,990
0.51.151.01ND383755013.734,310
361.010.940.3393355317.935,140
MDL 0.10.0010.02870.0160.240.0150.0483
ND: non-detectable; MDL: minimum detectable level.

