Trends in Ozonation Disinfection By-Products—Occurrence, Analysis and Toxicity of Carboxylic Acids
by
Rama Pulicharla
1, 
François Proulx
1,
Sonja Behmel
2,
Jean-B. Sérodes
3 and
Manuel J. Rodriguez
1,* 1
École Supérieure D’aménagement du Territoire et de Développement Régional, Pavillon Félix-Antoine-Savard, bureau 1616, 2325, rue des Bibliothèques, Université Laval, Québec, QC G1V 0A6, Canada
2
AGIRO, 433 Delage, Québec, QC G3G 1H4, Canada
3
Département de Génie Civil et Génie des Eaux, Pavillon Pouliot, Université Laval, Québec, QC G1V 0A6, Canada
*
Author to whom correspondence should be addressed.
Water 2020, 12(3), 756; https://doi.org/10.3390/w12030756
Submission received: 13 February 2020
/
Revised: 28 February 2020
/
Accepted: 29 February 2020
/
Published: 9 March 2020
(This article belongs to the Section Water Quality and Contamination)
Abstract
:Ozonation is becoming a common disinfection method for drinking water treatment. This has prompted the investigation of ozonation disinfection by-products (ODBPs) in drinking water. Ozonation generates a diverse range of carbonyl disinfection by-products, including carboxylic acids, aldehydes, ketones and aldo-ketoacids. Among these ODBPs, carboxylic acid by-products (CABPs) are observed in higher concentrations compared to other carbonyl by-products. However, relatively little research has been conducted on CABPs, including their precursors, formation and occurrence, methods of detection and toxicity. This review outlines the occurrence and variability of CABPs in a number of water sources treated and disinfected with ozonation. It considers the effect of ozonation parameters, including ozone dose, temperature and time of ozonation on the formation of CABPs. The review also discusses the various analytical approaches for CABP quantification, as well as their possible toxicity in drinking water.
1. Introduction
Chlorine is the most widely used and studied disinfectant in water treatment plants (WTPs) [1]. However, the discovery of chlorination disinfection by-products (DBPs) such as halogenated DBPs (trihalomethanes (THMs) and haloacetic acids (HAAs)) has led to a revolutionary change in water disinfection practices due to their potential disease-causing effects [2,3]. To balance disinfection (risks of microbial contamination) and the potential health impacts of DBPs in drinking water, many countries such as Canada, USA, Japan, European countries (Netherlands and Sweden), South Africa, New Zealand and the United Kingdom, as well the World Health Organization (WHO), have imposed maximum limits for THM and HAA concentrations. As well as, alternative and advanced disinfectants such as ozone, chloramines, chlorine dioxide and ultraviolet radiation have been evaluated to meet the regulatory requirements of THMs and HAAs [4,5]. Among these disinfectants, ozonation has been emerging as an efficient disinfection method.
Water disinfection using ozonation was first introduced in France in 1886 [6]. Ozone is a versatile and valuable disinfectant due to its powerful oxidizing capacity, its ability to be applied at different stages throughout the treatment plant. Many WTPs have started to utilize ozone disinfection in order to tackle the halogenated DBPs that are formed by disinfection with chlorine. A recent review by Loeb et al. [7] predicted a 0.6% to 34.9% growth in ozonation facilities across the world by 2016. Only a few studies have been conducted to identify, quantify and measure the toxicity of ozonation DBPs (ODBPs) compared to chlorination DBPs. The reported ODBPs can be divided into two main categories: (1) inorganic ODBPs, whose formation relies mainly on the bromide levels in raw water; and (2) organic ODBPs, whose formation mainly relies on the characteristics of natural organic matter (NOM), ozone dose and contact time. A multitude of organic ODBP types have been reported, including aldehydes, ketones, carboxylic acids, hydroxy acids, alcohols, esters, ketoaldehydes, aldo acids, keto acids and alkanes [8,9]. Limited toxicity data are available for these organic ODBPs, which puts into question the safety of ozonated water [10].
Organic ODBPs have been classified into three major classes: aldehydes, ketones and carboxylic acids (CAs; including aldo-acid and keto-acid DBPs). The majority of studies have been focused on aldehyde and ketone ODBPs due to their easy extraction and toxic nature [10,11]. Extracting CAs is challenging due to their high solubility. Regardless, limited data is available concerning the effects of CA by-products (CABPs) on living organisms. Screening for ODBPs has revealed relatively higher levels of CABPs in ozonated water compared to other classes of ODBPs in WTPs [12]. Higher levels of CABPs have been shown to form with higher ozone doses [13] and water treatment processes are less effective at removing CABPs in comparison to other classes of ODBPs [8].
This review investigates the current levels of CABPs in drinking water, as a result of ozonation. We discuss the effects of various parameters on the formation of CABPs, such as temperature, NOM concentration and composition, ozone dose and contact time. We also review details about the analytical advancements for quantifying CABPs. This review also addresses the removal of CABPs in water treatment plants and the challenges in evaluating their toxicity.
2. Precursors of CABPs
Organic matter (OM) in water sources is the main precursor for the formation of DBPs [14]. The primary sources of OM are the metabolic processes of phytoplankton and zooplankton and also human activities such as agricultural and forestry (pesticides and fertilizers), industrial (processing effluents, waste disposal sites) and technological (municipal landfill, mining, construction and transport) activities. These numerous sources contribute the complexity of OM, due to the daily, regional and global variations associated with each activity. It is therefore very difficult to accurately characterize OM. In general, natural organic matter (NOM) is divided into humic substances (hydrophobic humic acids (HAs) and hydrophilic fulvic acids (FAs)) and humins, based on its solubility. HAs are only soluble at a pH above 2, FAs are soluble at all pH values and humins are insoluble at all pH values [15]. The composition of humic substances differs depending on the source water, such as surface water (rivers, lakes or watersheds), wastewater or groundwater with varying types of human activity. Because of this structural and compositional complexity, the mechanism of DBP’s generation from OM remains uncertain [16,17].
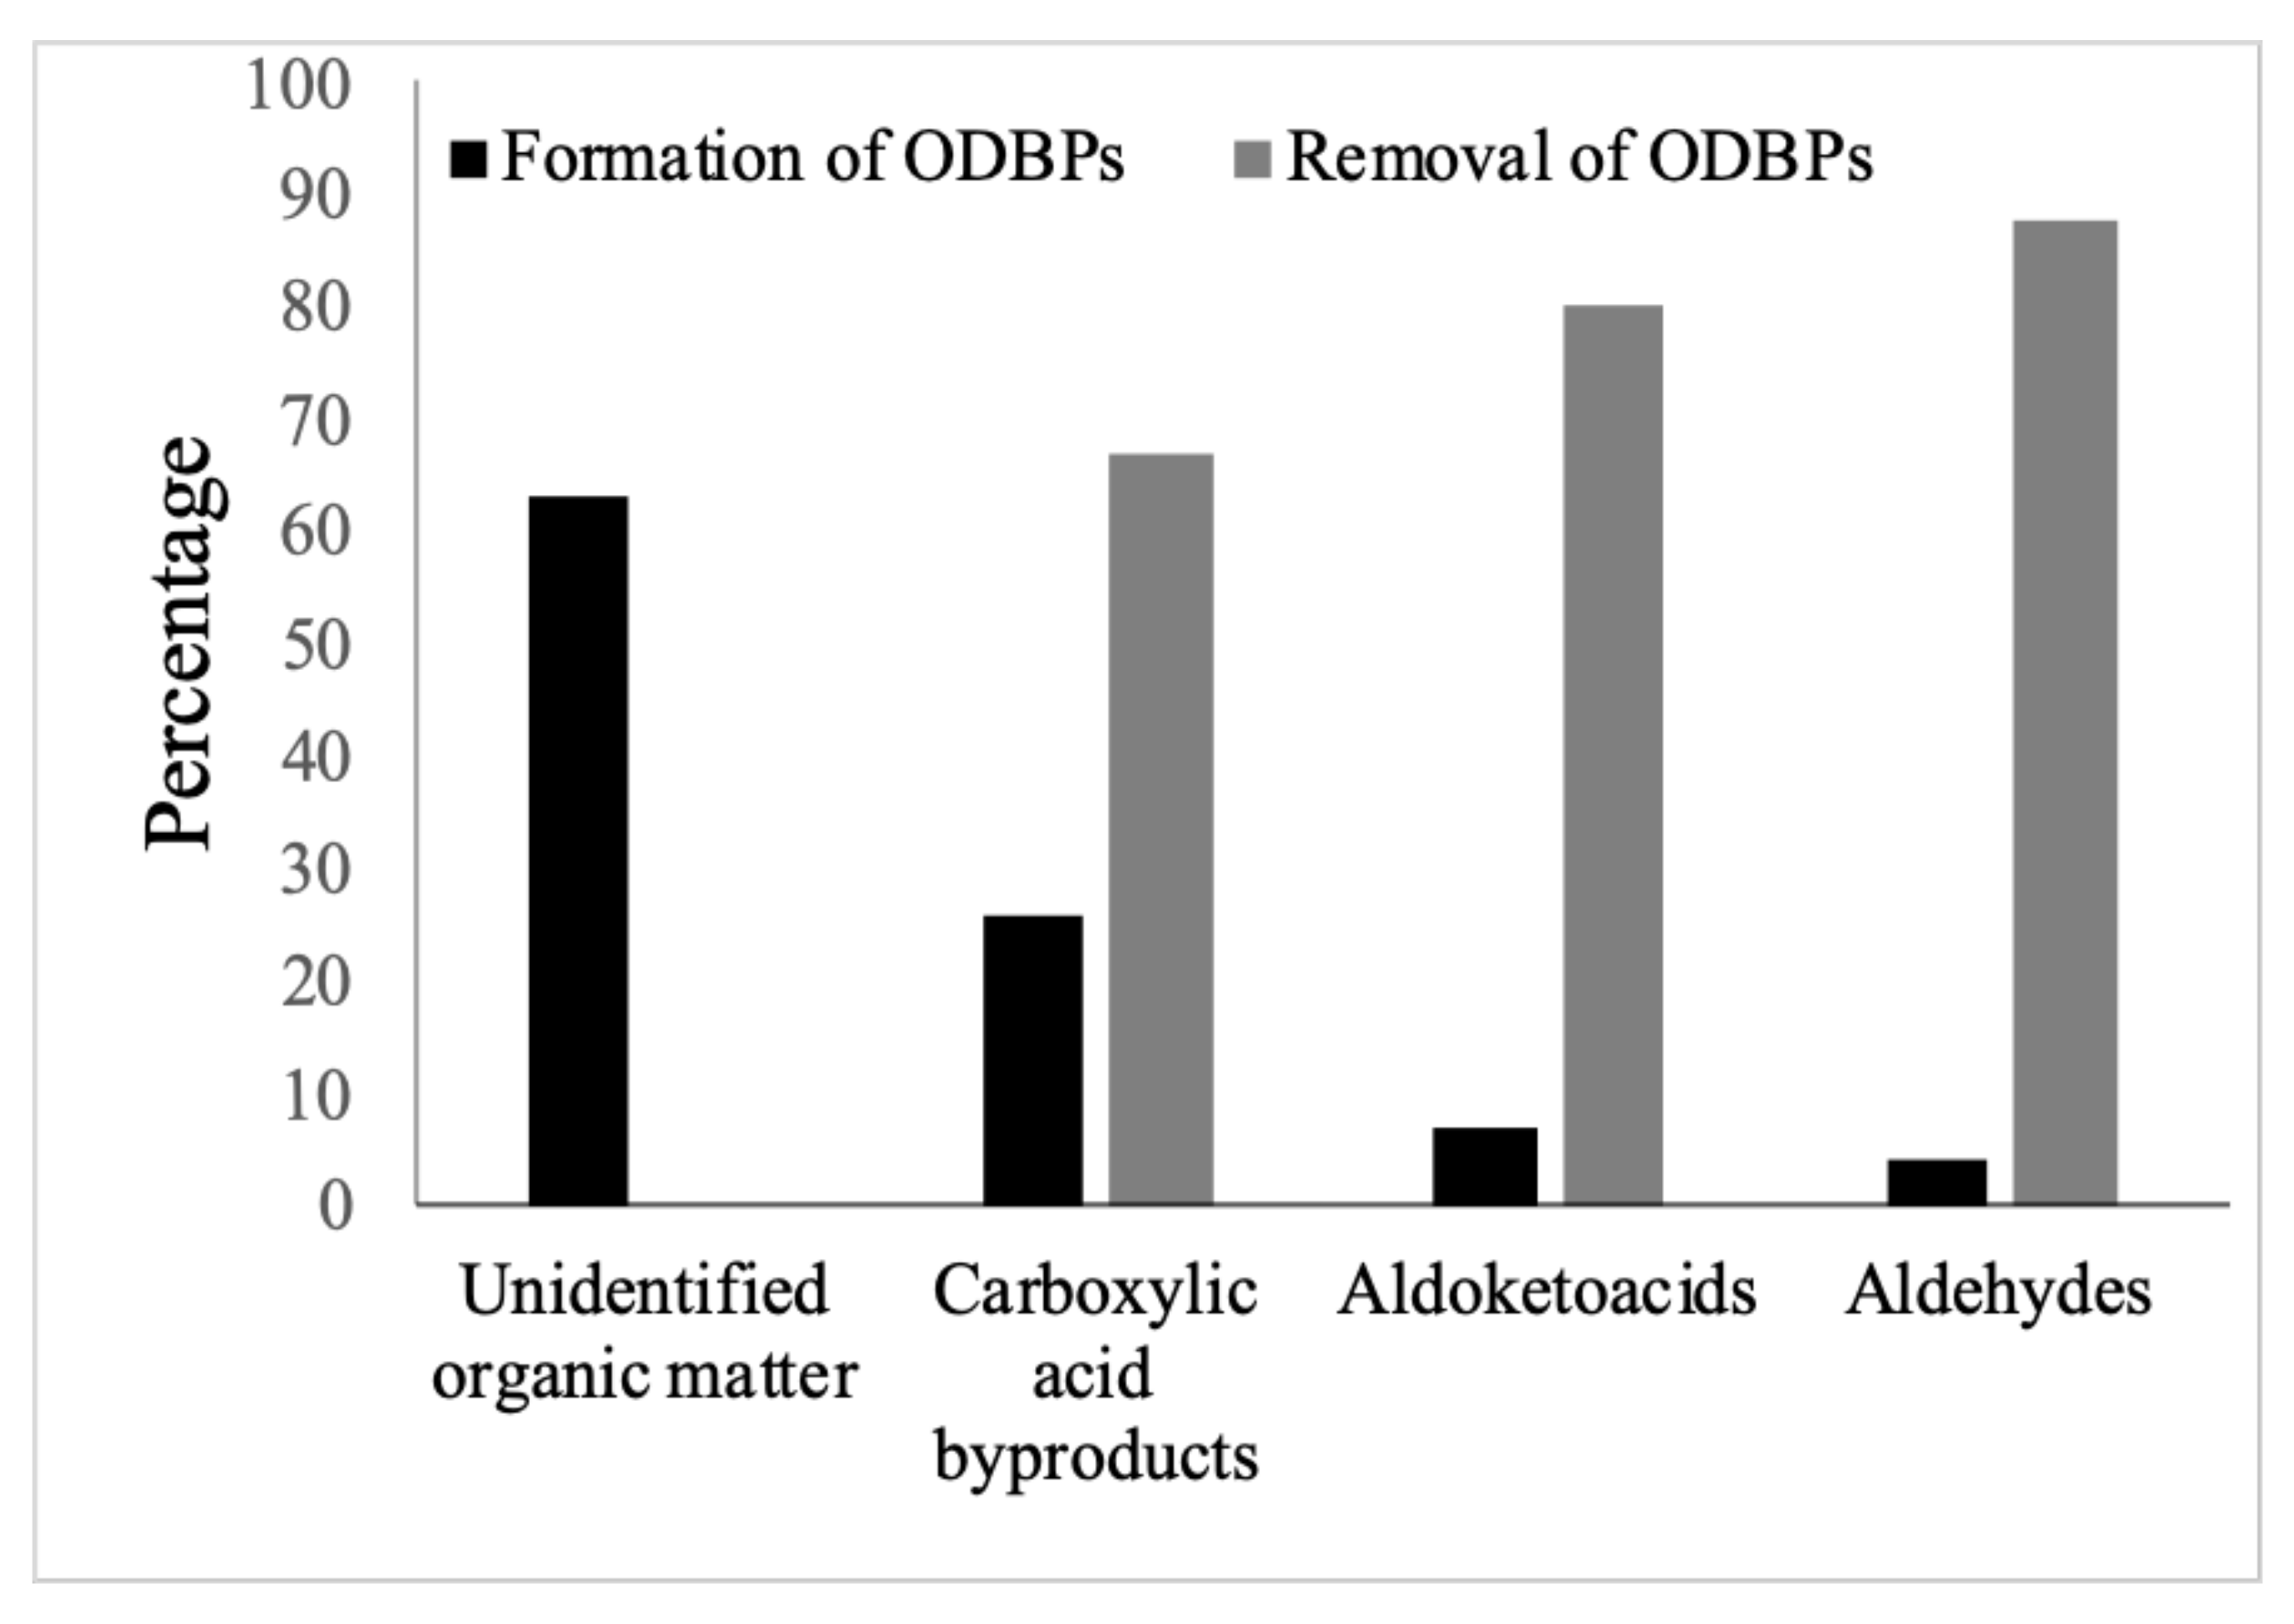
In case of Ozonation, ozone and hydroxide radicals (formed by ozone decomposition) can oxidize NOM to form readily biodegradable ODBPs [18]. The quantity and type of ODBPs formed are highly unpredictable. Various factors, in particular the composition and the concentration of NOM, disinfection conditions (ozone dose, contact time) and other treatment processes in WTPs largely control the formation of ODBPs. As presented in Figure 1, different types and amounts of ODBPs have been reported, including CABPs, aldo- and keto- acids and aldehydes [19]. More than 60% of organic matter was unidentified during ozonation disinfection. Among the identified organic matter (40%), 26–33% belong to CABPs [20]. According to experimental research by Krasner et al. (1996), 67% of CABPs were removed by water treatment processes, whereas other classes of ODBPs were removed >80–85% [19,21]. The higher levels of formation and lower levels of CABP removal in WTPs have generated additional interest in CABPs research.
To identify the precursors of CABPs, studies have used NOM extracted from water sources, such as surface water and groundwater or commercial humic substances, for ozonation. Xie and Reckhow [22] isolated and purified fulvic acids (DOC: 4 mg/L) from the Thousand Acre Reservoir in the USA. The ozonation of isolated fulvic acid led to the formation of ketoacids (CABPs; glyoxylic acid, pyruvic acid, and ketomalonic acid). Additionally, the concentration of ketoacids increased with the ozone dose (0–3 mg/L). Griffini et al. [23] observed a similar increase in these CABPs along with increased ozone doses, using water from Arno River for their experiments. These studies concluded that the fulvic acids from NOM might be responsible for the formation of ketoacid CABPs upon ozonation. However, these studies did not mention the actual mechanism or pathways for ketoacid formation. On the other hand, ozonating the hydrophobic extract of NOM (humic acids) has generated higher levels of aldehydes than hydrophilic NOM (fulvic acids). A large number of studies have reported that aldehydes also act as significant precursors of CABPs formation [24,25,26]. A recent study by Li et al. [14] has highlighted the equal importance of hydrophilic and hydrophobic NOM in the formation of ODBPs such as acids, aldehydes and hydrocarbons during ozonation. Therefore, despite the fact that current studies could not confirm the specific precursors or mechanisms for the formation of CABPs, they do emphasize that CABPs are a common DBPs formed by the ozonation of NOM.
Based on what is currently known, it is not yet possible to definitively identify the precursors of CABPs since both fulvic acid (itself a precursor) as well as the oxidized BPs of humic acid (aldehydes) can act as CABP precursors. In addition to the humic substances, CABPs can also be formed by the direct oxidation of aldehydes that are present in raw water. Therefore, the generation of CABPs is typically influenced by the characteristics of NOM, such as its concentration and structural composition [27,28].
3. Formation and occurrence of CABPs in Drinking Water
CABPs have a carboxylic acid functional group, which can undergo further oxidation to form carbon dioxide and water. In general, the process of CABP formation by oxidation takes place as follows: alcohol (–OH) → ketone (–C = O) → aldehyde (–HC = O) → ester (–COOR) → carboxylic acid (–COOH). Many studies have confirmed the formation and have measured the concentration of aldehyde byproducts upon ozonation but few studies have reported the presence of CABPs along with aldehydes. Among the reported CABPs, some were identified in full-scale studies while others were identified in pilot-scale and bench-scale experiments where extracted NOM or humic substances were ozonated. Table 1 presents the current levels of CABPs that have been detected before and after ozonation of surface water. The sum of the quantified CAs has been calculated and presented in the Table 1 to compare the levels of CABPs before and after ozonation. Most of the studies showed that the sum of CABPs concentrations increased after ozonation.
3.1. Parameters Effecting the Formation of CABPs
3.1.1. Ozone Dose and Organic Carbon
As shown in Table 1 (row no. 8), Gagnon et al. [33] studied the effects of ozone dose (1.8–4 mg/L), organic carbon (4–6.3 mg/L) and temperature (2.8–22 °C) on six short–chain CABPs undergoing full-scale ozonation in the Mannheim Water Treatment Plant in Kitchener, Ontario [34]. Among the six CABPs, only glycolic acid formation (33–49 µg/L) showed significant correlations with temperature (2.8–22 °C) and ozone dose (1.8–4 mg/L) but not with the studied range of organic carbon concentrations (4–6.3 mg/L). The authors have therefore deduced that the studied levels of organic carbon were not rate-limiting parameters or they were not present at levels sufficient for affecting CABP formation. This study also confirmed that the CABP yield was ten times that of aldehyde DBPs. However, Griffini et al. [23] reported a linear relationship (R = 0.91) between the formation of total DBPs (aldehydes and CAs), dissolved organic carbon (DOC) and ozone dose. Griffini et al. [23] also reported that the formation of ketoacids was twice that of aldehyde BPs. To understand the effect of ozone dosage on the type of formed CABPs, Huang et al. [26] applied ozonation to water from Feng-San Reservoir (DOC = 3.0 to 3.5 mg/L). This study reported low concentrations of aromatic CABPs at low ozone doses and high concentrations of aliphatic CABPs at high ozone doses. This indicates the oxidation of aromatic CABPs into aliphatic CABPs with increasing doses of ozone (0.5 to 11 mg O3/mg DOC). Similarly, Richardson et al. [9] identified higher levels of CABPs than other DBPs when water from the Mississippi River was subjected to four rounds of ozonation. Liu et al. [13] also reported a linear relationship between CABPs formation and ozone dose (0–5 mg/L) during ozonation of Lake Washington water. All these studies confirm the high levels of the formation of CA DBPs by ozonation and their increase when ozone dose is increased. However, these studies did not determine the mechanism for the formation of CABPs with respect to NOM composition and concentration and ozonation conditions (dose and contact time).
3.1.2. Temperature
Philip Porter [30] conducted a study to understand the impact of change in water quality with season on ODBP formation using clarified water collected from the Britannia Water Purification Facility in Ottawa, Canada. This study also studied the range of temperature effect on ODBPs formation, 7 and 22 °C for summer water matrix and 11 °C for fall water matrix at different pH values (6 and 8) and at different scales (pilot, semi-batch and flow-through) (Table 1, row no. 5). This study revealed that the concentration of CABPs (formic acid (38.8%), acetic acid (37.4%), glycolic (11.7%) and pyruvic acid (12.3%)) was 5 to 10 times the average of total aldehyde BPs. An increase in total CABP formation was reported in summer water, compared to fall water. This difference in CABP formation could be due to the seasonal changes in the raw water matrix and temperature (as shown in Table 1, row no. 5). No change was observed in the formation of CABPs during ozonation of summer water at a temperature of 22 °C with a change in pH from 6 to 8 but a statistically significant increase was observed in the case of fall water ozonation at 11°C. However, the authors did not provide any logical explanation for the effect of pH change and temperature on CABPs formation.
Jurado-Sánchez et al. [36] identified 35 CAs in a WTP located in Southeastern Spain over three different seasons (summer, winter and spring). The higher levels of CABPs in raw water samples collected in winter and spring compared to samples collected in summer are shown in Table 1 (row no.14). This significant seasonal variation in raw water CAs could be due to changes in NOM composition and concentration. The high concentration of CAs in raw water during winter and spring indicate/reveal the effect of rainfall on raw water composition. The biodegradation and thermal or photo-degradation of CAs in the summer may be responsible for the low concentrations observed in raw water. Compared to raw water concentrations, ozonation increased total CABP levels to almost 7.5 times in winter and spring and 0.5 times in summer. Among the recorded CABPs, the formation of aromatic CABPs increased up to 60%. These differences in total CABPs are primarily due to seasonal variations in the composition of the organic matrix. Similar results indicating higher levels of CABP formation were obtained in spring and winter during the ozonation of water from the Taihu Lake Region in China, by Zhong et al. [39]. Seasonal variations in NOM and water temperature may significantly affect the CAs levels in raw water and the corresponding CABPs formation but the effect of temperature on CABPs formation during ozonation has not yet been reported. More research is needed to confirm the effects of temperature on CABP formation. Research in this area may be useful for optimizing ozonation conditions in countries with colder temperatures.
3.2. Occurrence of CABPs
Glaze et al. [29] (Table 1, row no. 1) observed differences in the type and quantity of CABPs in raw and ozonated waters from the Los Angeles Aqueduct Water (LAAW) in the Los Angeles Aqueduct Filtration Plant (LAAFP). Short-chain and aromatic (C6-C11) CABPs were not detected in raw water samples but they were detected in ozonated water at concentrations of 27-970 ng/L. These detected CABPs included benzoic acid, hexanoic acid, heptanoic acid, octanoic acid, nonanoic acid, decanoic acid and undecanoic acid. The concentrations of long-chain CABPs, C14-C18 (not detectable (nd)—3975 ng/L) were lowered in raw water (nd—1705 ng/L), indicating that the long-chain CAs have a high reactivity to ozone. This study also found that the unsaturated CABP 9-hexadecenoic acid, which was detected at a high level (2165 ng/L) in raw water, was not detected in ozonated water. Hence, unsaturated CABPs must be easily oxidized by ozone. Furthermore, laboratory ozonation of 9-hexadecenoic acid has confirmed the formation of different CABPs along with the aldehyde, heptanal. As shown in Table 1 (row no. 1), ozonation reduced the total abundance of CABPs to 55% compared to raw water. However, ozonation also generated new and short-chain CABPs, which are highly biodegradable [29].
Following this study, another full-scale study and two batch-scale studies were conducted in the same plant (LAAFP) in 1989. These studies aimed to evaluate and compare the ODBPs in State Project Water (SPW) with previously reported results of LAAW [29]. In the full-scale study, only aldehyde BPs were reported for SPW samples, making it impossible to compare CABP results. The batch-scale results for CABPs from these two river waters (LAAW and SPW) were compared and are reported in Table 1 (rows no. 2 and 3, respectively). Raw water samples from both rivers were found to have significant levels of CAs but SPW yielded almost twice the level of LAAW. This could be due to the high concentration of total organic carbon (TOC) (2.6 mg/L) present as compared to the concentration in LAAW (1.6 mg/L). For both SPW and LAAW, the ozonated water has lower concentrations of long-chain CABPs and higher concentrations of short-chain CAs than in raw water. In SPW, a remainder of >50% unsaturated CA 9-hexadecenoic acid and a <10% reduction in total CABPs were observed after ozonation. In LAAW, ozonation resulted in diminished levels of unsaturated CA 9-hexadecenoic acid and a reduction in total CABPs to 44%. This difference in results could be due to the higher concentration of TOC (1.6 times) and the higher initial concentration of 9-hexadecenoic acid (2.8 times) in SPW compared to LAAW at the administered ozone dose.
In 2012, a study by Jurado-Sánchez et al. [38] identified 22 CAs in two full-scale drinking water plants in Spain, where a combination of ozonation with chlorination and chlorination alone were applied for disinfection. The combined (ozonation and chlorination) treatment resulted in an increase of 19-20 times (Table 1, row no. 16) the total CABP concentrations in treated water compared to raw water. However, chlorination alone showed nearly no change in total CABPs. This might explain the catalytic role of chlorine disinfection in CABP formation. Among the 22 CAs measured, a significant increase was observed after ozonation for acetic acid, oxalic acid, glycolic acid, benzoic acid, phthalic acid and 1,2,3 benzoic acids [38]. Similar results were obtained by Nawrocki et al. [35] who applied ozonation to the Warta River water in Poland. They observed the levels of total formic and oxalic acid formation that were ten times higher than those of total aldehydes (formaldehyde, acetaldehyde, glyoxal and methylglyoxal) [35]. These results are similar to those from previous studies by Porter [30] and Huang et al. [26].
To date, many studies have reported the high prevalence of specific CABPs such as acetic acid, glyoxylic acid and oxalic acid in drinking water, as shown in Table 1 (rows no. 4-11 and 17). Predominantly, acetic acid, glyoxylic acid and oxalic acid were generated (around 47–75%) when water from the Feng-San Reservoir (DOC3–3.5 mg/L) was subjected to ozonation [26]. Another study reported oxalic acid as being the principal by-product of all CABPs, accounting for 50% of total CABPs [40,41]. Propanol, commonly present in raw water samples [42], was subjected to ozonation in order to demonstrate the principal formation of the three CABPs (acetic acid, glyoxylic acid and acid) at lab-scale. Through ozonation, propanol was converted into acetic acid and oxalic acid. Acetic acid was oxidized into glyoxylic acid which in turn, was oxidized into oxalic acid. Acetic acid (C2H2O2) and glyoxylic acid (C2H2O3) were further oxidized by ozone to increase the number of oxygen atoms in their structures and form oxalic acid. Oxalic acid was subsequently oxidized to carbon dioxide and water [43]. Hence, through ozonation, the compounds with functional groups including −OH, = O, = CHO and = COOR undergo oxidation multiple times and are converted into their most oxidized forms with a carboxylic acid functional group. These CAs further undergo oxidation or mineralization based on the ozone dose and contact time. All of this suggests that CAs might be the most significant type of DBP resulting from ozonation disinfection.
There are few studies on the removal of CABPs in WTPs. Of the existing studies, Glaze et al. [29] compiled data from SPW in California that demonstrated the presence of total residual CABPs (1961 ng/L) in finished water after anthracite filtration compared to other ODBPs, such as aldehydes which were not detected (Figure 1). Similarly, the CABPs (formic and acetic acid) that formed in high concentrations (40% of total CABPs 490 µg/L) were efficiently removed (>80%) by biologically active filters. Another CABP (pyruvic acid) which was formed at low levels (8% of total CABPs 490 µg/L) was removed with poor efficiency (60%) [32]. These studies demonstrate that CABP removal varies depending on the type of CABP. Moreover, it is impossible to compare CABP formation and removal among the reported studies, as the treatment conditions, water matrices, concentrations of CABPs, operating conditions and filter properties were all completely different.
To date, most studies have concluded that CAs are the major DBPs that result from ozonation, are formed by the oxidation of NOM and increase with contact time and ozone dose [26]. To the best of our knowledge, the main pathways for CABP formation in drinking water have not been reported. This review highlights the concept that NOM and its oxidized intermediate BPs act as precursors and undergo a large number of redox reactions to form CABPs. The structural and compositional complexity of NOM differs depending on the ozonation conditions and treatment process of each WTP, worldwide. The data reported are therefore diverse in terms of the types and levels of CABPs. Regardless, current research should focus on investigating the relationships between the NOM characteristics (composition and structure), ozonation conditions (ozone dose, contact time) and seasonal variations in order to establish the mechanism of CABP formation and the key factors that affect it.
4. Analytical Quantification of CABPs
CAs have a wide range of polarities and molecular weights. They exist in protonated or deprotonated forms depending on the pH of the source water and pKa of the CAs. Trace level occurrences of CAs have also posed a challenge to the current analytical tools. Table 2 lists the various instrumental and sample processing technologies and the detection limits for CAs. In general, most of the analytical methods were developed in pure drinking water samples by spiking CA standards to avoid matrix interferences, which in turn, affects the sensitivity of the method [44]. Therefore, factors such as the concentration and type of CA (polarity and molecular weight) and the sample matrix largely determine the accuracy of the analytical method. Matrix interferences can potentially impact the accurate quantification of CAs at trace levels because environmental samples have complex matrix compositions. A few methods, as mentioned in Table 2 (row no. 9, 10, 11, 14, 17), have directly analyzed samples after a simple filtration step. This direct analysis has resulted in low sensitivity (µg/L–mg/L) of CAs because of the insufficient removal of the matrix interferences from raw water samples. Clean-up and pre-extraction steps are being applied in order to tackle these matrix interferences. Conventional extraction methods, such as liquid-liquid extraction, are applied for specific compounds; however, these methods consume large amounts of solvent and are time- and are labor-intensive. Therefore, these conventional methods may not be the most efficient for extracting CAs. Recent technical developments in sample preparation, such as solid-phase microextraction (SPME), headspace-needle trap extraction and solid-phase extraction (SPE) have been applied to extract a broad range of compounds and to reduce solvent requirements and analytical time. Among these, SPE has gained in popularity due to its simplicity, lower solvent consumption and its ability to extract several compounds [37].
Predominantly, CAs exist as carboxylates (deprotonated, negative ions) due to their low pKa values in comparison to surface water pH. To achieve good sorption and extraction capacities, CAs must be in their protonated (positive ions) forms. To convert CAs to their pronated forms the pH of water samples is adjusted to 2 or lower. Selecting a sorbent material for SPE is crucial for the efficient adsorption of CAs because of the wide range of polarity among these materials. The sorption capacities of broad-spectrum materials have been investigated by Jurado-Sánchez et al. [44] (Table 2, row no. 23) and include polar materials (silica gel), non-polar materials (Supelclean ENVI-18; silica-reverse phase octadecyl), polymeric materials (Amberlites [XAD-2, XAD-4, XAD-7 and XAD-16], Oasis HLB, HyperSep Retain PEP, Isolute ENV+, LiChrolut EN), graphitized carbon black and fullerenes (C60 and C70 derivatives and nanotubes) [44]. The polar sorbents showed lower sorption capacities (<30%) due to weak interactions between CAs and the polar surface of the sorbent. Strong hydrophobic interactions of non-polar sorbents resulted in higher medium retention and long-chain aliphatic and aromatic CAs (over 85%) and reduced the retention of polar CAs (C2–C5, phenylacetic and phthalic acids). In the case of polymer sorbents, Oasis HLB and LiChrolut EN showed good recovery (∼100%) of C2-C12 aliphatic and aromatic CAs and less efficient recovery (50–75%) of long-chain carboxylic acids (C14–C18). Amberlite polymer sorbents showed lower retention for CAs than Oasis HLB and LiChrolut EN sorbents [44]. This study showed the different sorption capacities of polymeric sorbents due to their differences in particle size and polarity. The sorbent materials of carbon derivatives showed an average of retention of CAs (30–70%) due to their non-polar interactions. Based on these data, an equal ratio of polymeric to non-polar sorbents (LiChrolut EN and Supelclean ENVI-18 (1:1)) has been used to extract a broad range of CAs as shown in Table 2 (row no. 9, 10, 23, 24). Extraction using a combination of sorbents in this way showed good recovery and sensitivity for a wide range of CAs, including short-chain and long-chain aliphatic and aromatic CAs.
In addition to the extraction methods, the instruments and techniques used also determine the sensitivity of analytical methods. Several tools can be used to detect CAs in environmental samples, such as capillary electrophoresis, ion-exchange chromatography, ion-exclusion chromatography, gas chromatography (GC) and liquid chromatography (LC), as shown in Table 2 (row no. 9, 10, 13). GC is the most extensively used technique due to its inherent advantages of simplicity, high sensitivity and selectivity, broad and ease of applicability, low cost and high resolving power. For GC analysis, compounds must have sufficient thermostability and volatility properties; however, only a few CAs meet these criteria. When measuring polar CAs using GC, it is challenging to get high resolution between peaks with a standard capillary GC column due to weak adsorption. Therefore, columns with stationary phases coated with polyethylene glycol or acids have been utilized for improved adsorption and peak resolution of polar CAs (Table 2, row no. 18 and 23). Molecular weight also plays a vital role in GC analysis. While low molecular weight CAs cannot be detected due to the high background noise of the instrument, high molecular weight CAs are difficult to volatilize and analyze. Therefore, studies have applied derivatization methods to make CAs volatile and stable at high temperatures during GC analysis. Various derivatization procedures have been developed, such as alkylation (using induced alkylchloroformate, trimethylammonium hydroxide, trimethylanilinium hydroxide, trimethylphenylammonium hydroxide and alcohols in the presence of BF3 or acetyl chloride as a catalyst) and silylation (using N,O- bis-(trimethylsilyl) trifluoroacetamide (BSTFA) with 1% trimethylchlorosilane (TMCS) and N,O-bis-(trimethylsilyl) acetamide (BSA)) (Table 2 row no. 3, 25, 26). Jurado-Sánchez et al. [38] compared the sensitivities of derivatization by alkylation and by silylation. Both derivatization sensitivities were comparable with aliphatic C2-C18 CAs. However, alkylation (BF3 or acetyl chloride catalyst) of aromatic CAs showed low sensitivity compared to silylation of aromatic CAs. In addition, it was observed that the high basicity of alkylating agents accelerated the GC column damage [45]. Silylation reagents showed high sensitivity and produced better yields and derivative stability during GC analysis. Silylated derivatives also generated good resolution peaks due to their high volatility, which leads to reliable identification [38]. All these derivatization methods require high temperatures or longer times to achieve a high percentage yield. Therefore, in order to reduce the reaction time, microwave-assisted derivatization was developed [38].
In addition to GC columns, ion sources and detectors play equally critical roles in method development. Identification and selectivity of CAs are possible using mass spectrometry (MS) but not with flame ionization detectors or electron capture detectors. Similarly, electron ionization (EI), an ion source, is more sensitive than chemical ionization (CI). Therefore, most studies have used MS in combination with EI for identifying or quantifying CAs, as mentioned in Table 2 [38,44].
5. Toxicity of CABPs
There is a paucity of information concerning the health effects of water quality impairment due to CABPs. Instead of determining the toxicity of specific classes of ODBPs, researchers have been more focused on the toxicity of ozonated water [57]. Most of the articles published in the 1970s and 1980s are about the mutagenic activity (MA) of ozonated water and no clear evidence was found of an increase or decrease in MA due to ozonation [21,60]. A study by Kool and Hrube [61] showed increased levels of MA at low ozone doses and no MA at high ozone doses (DBP concentration and type vary according to ozone dose). This variation in MA is highly dependent on the conditions of the treatment process, such as ozone dose, contact time and the stage within the plant at which ozone is applied which in turn effects ODBPs. Currently, no studies have directly reported the potential health effects of CABPs resulting from the ozonation of drinking water. However, a few studies have provided the toxicity data for short-chain CAs (C2-C4) as well as esters, revealing them to be inflammatory or carcinogenic compounds. These data were recorded when CAs were produced as metabolites in human cells during food digestion [60,61,62]. Moreover, these studies were conducted at concentration of ppm (parts per million), which are 100-1000 times higher than the current detection levels of CABPs in drinking water. Therefore, these results are not comparable with CABPs in drinking water. Model predictions of toxicity of CAs were developed by Moudgal et al. [62] using TOPKAT®/QSTR software. The majority of aliphatic mono- and dicarboxylic acids displayed developmental toxicity. In addition, aliphatic and aromatic dicarboxylic acids were found to be carcinogenic in a female rat sub-model.
ODBPs act as precursors to form chlorination DBPs (HAAs), including aldehydes and CABPs [63]. The most likely pathway leading to the formation of HAAs during ozonation is as follows: NOM → (ozonation) → aldehydes/CABPs → (chlorination) → HAAs. Hence, it is possible that ODBPs might act as precursors for HAA formation, especially CABPs. Research conducted by McKnight and Reckhow [63] confirmed the rapid reactivity of pyruvic acid (CABP) with free and combined chlorine and the subsequent formation of chlorinated DBPs. In addition to this formation, the release of these readily biodegradable CABPs in water distribution systems aids microbial regrowth and causes issues with taste and odor in drinking water [64,65]. Studies have shown an increase in the growth of NOX strain (CAs-utilizing isolate) of 15-20 times in ozonated water [65]. Similarly, bacterial regrowth stimulated by oxalic acid (approx. 50 µg eq/Cl) indicates the probability of higher microbial growth in the presence of CABPs [64]. In comparison to other DBPs from ozonation, CABPs are poorly removed by filtration processes and enter the water distribution systems [8]. These residual CABPs then react with nitrites and sulfites in drinking water and release toxic gases [66]. Moreover, CAs are reactive to iron, aluminum and steel containers, which may cause the corrosion of water distribution pipes [67]. Therefore, in order to stop CABPs from entering and toxically effecting drinking water, a combination of ozone treatment with filtration or other disinfectants are required. This points to an urgent need for better knowledge about CABP toxicity to characterize the effect of ozonation in water distribution utilities. This information may help the regulatory bodies control CABPs in drinking water. This section may be divided by subheadings. It should provide a concise and precise description of the experimental results, their interpretation as well as the experimental conclusions that can be drawn.
6. Conclusions
CABPs are present in higher concentrations than other ozonation DBPs. The formation of CABPs is complex because of numerous factors such as NOM composition and concentration, conditions of ozonation (dose, contact time, etc.) and water treatment processes (filtration processes and secondary disinfection). Various sampling approaches for raw water, such as sampling at different water input points (septic installations, wastewater effluents, eutrophic lakes) and at each step of the WTP process may help identify the precursors and mechanisms of CABP formation. CAs have a wide range of molecular weights and polarities associated with them; these properties pose a challenge for developing a single accurate analytical method for analysis. It has been shown that CABPs promote bacterial growth; hence, the occurrence of these highly biodegradable compounds in distribution systems could affect water quality. Moreover, reduced MA due to ozonation and an increase in MA from secondary chlorination disinfection was observed. These observations directly indicate the precursor’s activity of ODBPs in forming DBPs from chlorination. This suggests that facilities that apply ozonation should consider implementing efficient treatment processes for the maximum removal of ODBP precursors before applying chlorination as a secondary disinfectant. It is necessary to gather extensive data and evidence of CABP occurrence in drinking water treated by ozonation in order to regulate these CABPs. Similarly, studies should provide transparency about the toxicity of CABPs in water distribution systems, in terms of increased microbial activity and the production of toxic microbial products, as well as the precursor activity of DBPs from chlorination and the consequent potential health effects. It is also essential to evaluate the efficiency of the treatment processes to improve the removal of CABPs or ODBPs. The lack of concrete analytical data and toxicity assessments of CABPs highlights the necessity for further detailed investigations in this field.
Author Contributions
R.P. wrote the original draft; R.P., F.P., S.B., J.-B.S. and M.J.R. contributed directly to project conceptualization and methodology planning; F.P., S.B., J.-B.S. and M.J.R. reviewed and edited the manuscript in detail; S.B. and M.J.R. supervised the project from its beginning and coordinated the funding application. All authors have read and agreed to the published version of the manuscript.
Funding
This research was funded by MITACS, Grant number IT12226. This work is also a part of the research program of the NSERC (Natural Sciences and Engineering Research Council of Canada) Research Chair on Drinking Water of Laval University, Canada.
Acknowledgments
Authors are thankful to Mitacs Accelerate Fellowship program for the scholarship provided to the first author.
Conflicts of Interest
The authors declare no conflict of interest.
References
- McGuire, M.J. Eight revolutions in the history of US drinking water disinfection. J. Am. Water Work. Assoc. 2006, 98, 123–149. [Google Scholar] [CrossRef]
- Hrudey, S.E. Chlorination disinfection by-products, public health risk tradeoffs and me. Water Res. 2009, 43, 2057–2092. [Google Scholar] [CrossRef] [PubMed]
- Nieuwenhuijsen, M.J.; Toledano, M.B.; Eaton, N.E.; Fawell, J.; Elliott, P. Chlorination disinfection byproducts in water and their association with adverse reproductive outcomes: A review. Occup. Environ. Med. 2000, 57, 73–85. [Google Scholar] [CrossRef] [Green Version]
- Somani, S.; Ingole, N.; Principal, I.; Ghatkhed, A. Alternative approach to chlorination for disinfection of drinking water an overview. Int. J. Adv. Eng. Res. Stud. 2011, 1, 47–50. [Google Scholar]
- Hua, G.; Reckhow, D.A. Comparison of disinfection byproduct formation from chlorine and alternative disinfectants. Water Res. 2007, 41, 1667–1678. [Google Scholar] [CrossRef] [PubMed]
- Le Pauloue, J.; Langlais, B. State-of-the-art of ozonation in France. J. Int. Ozone Assoc. 1999. [Google Scholar] [CrossRef]
- Loeb, B.L.; Thompson, C.M.; Drago, J.; Takahara, H.; Baig, S. Worldwide ozone capacity for treatment of drinking water and wastewater: A review. Ozone Sci. Eng. 2012, 34, 64–77. [Google Scholar] [CrossRef]
- Liu, X.; Liu, R.; Zhu, B.; Ruan, T.; Jiang, G. Characterization of carbonyl disinfection by-products during ozonation, chlorination and chloramination of dissolved organic matters. Environ. Sci. Technol. 2020. [Google Scholar] [CrossRef]
- Richardson, S.D.; Thruston, A.D.; Caughran, T.V.; Chen, P.H.; Collette, T.W.; Floyd, T.L.; Schenck, K.M.; Lykins, B.W.; Sun, G.-R.; Majetich, G. Identification of new ozone disinfection byproducts in drinking water. Environ. Sci. Technol. 1999, 33, 3368–3377. [Google Scholar] [CrossRef]
- Park, K.-Y.; Choi, S.-Y.; Lee, S.-H.; Kweon, J.-H.; Song, J.-H. Comparison of formation of disinfection by-products by chlorination and ozonation of wastewater effluents and their toxicity to Daphnia magna. Environ. Pollut. 2016, 215, 314–321. [Google Scholar] [CrossRef]
- LoPachin, R.M.; Gavin, T. Molecular mechanisms of aldehyde toxicity: A chemical perspective. Chem. Res. Toxicol. 2014, 27, 1081–1091. [Google Scholar] [CrossRef] [PubMed]
- Zhong, X.; Cui, C.; Yu, S. Exploring the pathways of aromatic carboxylic acids in ozone solutions. Rsc Adv. 2017, 7, 34339–34347. [Google Scholar] [CrossRef] [Green Version]
- Liu, C.; Tang, X.; Kim, J.; Korshin, G.V. Formation of aldehydes and carboxylic acids in ozonated surface water and wastewater: A clear relationship with fluorescence changes. Chemosphere 2015, 125, 182–190. [Google Scholar] [CrossRef] [PubMed]
- Li, C.; Wang, D.; Xu, X.; Wang, Z. Formation of known and unknown disinfection by-products from natural organic matter fractions during chlorination, chloramination and ozonation. Sci. Total Environ. 2017, 587, 177–184. [Google Scholar] [CrossRef] [PubMed]
- McDonald, S.; Bishop, A.G.; Prenzler, P.D.; Robards, K. Analytical chemistry of freshwater humic substances. Anal. Chim. Acta 2004, 527, 105–124. [Google Scholar] [CrossRef]
- Hammes, F.; Salhi, E.; Köster, O.; Kaiser, H.-P.; Egli, T.; Von Gunten, U. Mechanistic and kinetic evaluation of organic disinfection by-product and assimilable organic carbon (AOC) formation during the ozonation of drinking water. Water Res. 2006, 40, 2275–2286. [Google Scholar] [CrossRef]
- Lu, J.; Zhang, T.; Ma, J.; Chen, Z. Evaluation of disinfection by-products formation during chlorination and chloramination of dissolved natural organic matter fractions isolated from a filtered river water. J. Hazard. Mater. 2009, 162, 140–145. [Google Scholar] [CrossRef]
- Kusakabe, K.; Aso, S.; Hayashi, J.-I.; Isomura, K.; Morooka, S. Decomposition of humic acid and reduction of trihalomethane formation potential in water by ozone with u.v. irradiation. Water Res. 1990, 24, 781–785. [Google Scholar] [CrossRef]
- Krasner, S.; Coffey, B.; Hacker, P.; Hwang, C.; Kuo, C.; Mofidi, A.; Sclimenti, M. The effect of ozonation and biofiltration on NOM. In Proceedings of the Natural Organic Workshop (Influence of Natural Organic Matter Characteristics on Drinking Water Treatment and Quality, La Verne, CA, USA, 18–19 Septembre 1996. [Google Scholar]
- Richardson, S.D. Disinfection by-products and other emerging contaminants in drinking water. Trac Trends Anal. Chem. 2003, 22, 666–684. [Google Scholar] [CrossRef]
- Miltner, R.J.; Shukairy, H.M.; Summers, R.S. Disinfection by-product formation and control by ozonation and biotreatment. J. Am. Water Work. Assoc. 1992, 84, 53–62. [Google Scholar] [CrossRef]
- Xie, Y.; Reckhow, D.A. Formation of ketoacids in ozonated drinking water. J. Int. Ozone Assoc. 1992. [Google Scholar] [CrossRef]
- Griffini, O.; Bao, M.; Barbieri, K.; Burrini, D.; Santianni, D.; Pantani, F. Formation and removal of biodegradable ozonation by-products during ozonation-biofiltration treatment: Pilot-scale evaluation. J. Int. Ozone Assoc. 1999. [Google Scholar] [CrossRef]
- Can, Z.S.; Gurol, M. Formaldehyde formation during ozonation of drinking water. Ozone Sci. Eng. 2003, 25, 41–51. [Google Scholar] [CrossRef]
- Huang, W.-J.; Chen, L.-Y.; Peng, H.-S. Effect of NOM characteristics on brominated organics formation by ozonation. Environ. Int. 2004, 29, 1049–1055. [Google Scholar] [CrossRef]
- Huang, W.-J.; Fang, G.-C.; Wang, C.-C. The determination and fate of disinfection by-products from ozonation of polluted raw water. Sci. Total Environ. 2005, 345, 261–272. [Google Scholar] [CrossRef]
- Langlais, B.; Reckhow, D.A.; Brink, D.R. Ozone in Water Treatment: Application and Engineering; Routledge: Abingdon, UK, 2019. [Google Scholar]
- Kozyatnyk, I.; Świetlik, J.; Raczyk-Stanisławiak, U.; Dąbrowska, A.; Klymenko, N.; Nawrocki, J. Influence of oxidation on fulvic acids composition and biodegradability. Chemosphere 2013, 92, 1335–1342. [Google Scholar] [CrossRef]
- Glaze, W.H.; Koga, E.C.R.; Cancilla, D. Application of Closed Loop Stripping and XAD Resin Adsorption for the Determination of ozone by-products from natural water. Biohazards Drink. Water Treat. 1988, 1, 201. [Google Scholar]
- Porter, P. A Comparison of Ozonation Systems with Respect to Disinfection by-Product Formation and Microbial Inactivation; National Library of Canada = Bibliothèque nationale du Canada: Ottawa, ON, Canada, 2000. [Google Scholar]
- Peldszus, S.; Huck, P.M.; Andrews, S.A. Determination of short-chain aliphathic, oxo-and hydroxy-acids in drinking water at low microgram per liter concentrations. J. Chromatogr. A 1996, 723, 27–34. [Google Scholar] [CrossRef]
- Kuo, C.-Y. Improved application of ion chromatographic determination of carboxylic acids in ozonated drinking water. J. Chromatogr. A 1998, 804, 265–272. [Google Scholar] [CrossRef]
- Gagnon, G.A.; Booth, S.D.; Peldszus, S.; Mutti, D.; Smith, F.; Huck, P.M. Carboxylic acids: Formation and removal in full-scale plants. J. Am. Water Work. Assoc. 1997, 89, 88–97. [Google Scholar] [CrossRef]
- Richardson, S.D.; Caughran, T.V.; Poiger, T.; Guo, Y.; Crumley, F.G. Application of DNPH derivatization with LC/MS to the identification of polar carbonyl disinfection byproducts in drinking water. Ozone Sci. Eng. 2000, 22, 653–675. [Google Scholar] [CrossRef]
- Nawrocki, J.; Świetlik, J.; Raczyk-Stanisławiak, U.; Dąbrowska, A.; Biłozor, S.; Ilecki, W. Influence of ozonation conditions on aldehyde and carboxylic acid formation. Ozone Sci. Eng. 2003, 25, 53–62. [Google Scholar] [CrossRef]
- Jurado-Sánchez, B.; Ballesteros, E.; Gallego, M. Occurrence of carboxylic acids in different steps of two drinking-water treatment plants using different disinfectants. Water Res. 2014, 51, 186–197. [Google Scholar] [CrossRef]
- Richardson, S.; Thruston, A.; Caughran, T.; Chen, P.; Collette, T.; Schenck, K.; Lykins, B.; Rav-Acha, C.; Glezer, V. Identification of new drinking water disinfection by-products from ozone, chlorine dioxide, chloramine and chlorine. Water Air Soil Pollut. 2000, 123, 95–102. [Google Scholar] [CrossRef]
- Jurado-Sánchez, B.; Ballesteros, E.; Gallego, M. Determination of carboxylic acids in water by gas chromatography–mass spectrometry after continuous extraction and derivatisation. Talanta 2012, 93, 224–232. [Google Scholar] [CrossRef] [PubMed]
- Zhong, X.; Cui, C.; Yu, S. Seasonal evaluation of disinfection by-products throughout two full-scale drinking water treatment plants. Chemosphere 2017, 179, 290–297. [Google Scholar] [CrossRef]
- Faria, P.C.C.; Órfão, J.J.M.; Pereira, M.F.R. Activated carbon catalytic ozonation of oxamic and oxalic acids. Appl. Catal. B Environ. 2008, 79, 237–243. [Google Scholar] [CrossRef]
- Kuo, C.-Y.; Krasner, S.W.; Davis, M.K.; Minera, R.A.; Amy, G.L. Water Disinfection and Natural Organic Matter: Characterization and Control (ACS Symposium Series, No. 649); American Chemical Society: Washington, DC, USA, 1996; p. 350. [Google Scholar]
- Beale, R.; Liss, P.; Nightingale, P. First oceanic measurements of ethanol and propanol. Geophys. Res. Lett. 2010, 37. [Google Scholar] [CrossRef]
- Kuo, P.P.; Chian, E.S.; Chang, B.J. Identification of end products resulting from ozonation and chlorination of organic compounds commonly found in water. Environ. Sci. Technol. 1977, 11, 1177–1181. [Google Scholar] [CrossRef]
- Jurado-Sánchez, B.; Ballesteros, E.; Gallego, M. Determination of carboxylic acids in water by gas chromatography using several detectors after flow preconcentration. J. Chromatogr. A 2010, 1217, 7440–7447. [Google Scholar] [CrossRef]
- Rompa, M.; Kremer, E.; Zygmunt, B. Derivatisation in gas chromatographic determination of acidic herbicides in aqueous environmental samples. Anal. Bioanal. Chem. 2003, 377, 590–599. [Google Scholar] [CrossRef] [PubMed]
- Pan, L.; Adams, M.; Pawliszyn, J. Determination of fatty acids using solid phase microextraction. Anal. Chem. 1995, 67, 4396–4403. [Google Scholar] [CrossRef]
- Pan, L.; Pawliszyn, J. Derivatization/solid-phase microextraction: New approach to polar analytes. Anal. Chem. 1997, 69, 196–205. [Google Scholar] [CrossRef]
- Wert, E.C.; Rosario-Ortiz, F.L.; Drury, D.D.; Snyder, S.A. Formation of oxidation byproducts from ozonation of wastewater. Water Res. 2007, 41, 1481–1490. [Google Scholar] [CrossRef]
- Glaze, W.H.; Koga, M.; Cancilla, D.; Wang, K.; McGuire, M.J.; Liang, S.; Davis, M.K.; Tate, C.H.; Aieta, E.M. Evaluation of ozonation by-products from two California surface waters. J. Am. Water Work. Assoc. 1989, 81, 66–73. [Google Scholar] [CrossRef]
- Richardson, S.D.; Thruston, A.D.; Collette, T.W.; Patterson, K.S.; Lykins, B.W.; Majetich, G.; Zhang, Y. Multispectral identification of chlorine dioxide disinfection byproducts in drinking water. Environ. Sci. Technol. 1994, 28, 592–599. [Google Scholar] [CrossRef]
- Peldszus, S.; Huck, P.M.; Andrews, S.A. Quantitative determination of oxalate and other organic acids in drinking water at low μg/l concentrations. J. Chromatogr. A 1998, 793, 198–203. [Google Scholar] [CrossRef]
- Yo, S.-P. Analysis of volatile fatty acids in wastewater collected from a pig farm by a solid phase microextraction method. Chemosphere 1999, 38, 823–834. [Google Scholar] [CrossRef]
- Cruwys, J.; Dinsdale, R.; Hawkes, F.; Hawkes, D. Development of a static headspace gas chromatographic procedure for the routine analysis of volatile fatty acids in wastewaters. J. Chromatogr. A 2002, 945, 195–209. [Google Scholar] [CrossRef]
- Abalos, M.; Bayona, J. Application of gas chromatography coupled to chemical ionisation mass spectrometry following headspace solid-phase microextraction for the determination of free volatile fatty acids in aqueous samples. J. Chromatogr. A 2000, 891, 287–294. [Google Scholar] [CrossRef]
- Abalos, M.; Bayona, J.; Pawliszyn, J. Development of a headspace solid-phase microextraction procedure for the determination of free volatile fatty acids in waste waters. J. Chromatogr. A 2000, 873, 107–115. [Google Scholar] [CrossRef]
- Ohta, K.; Ohashi, M.; Jin, J.-Y.; Takeuchi, T.; Fujimoto, C.; Choi, S.-H.; Ryoo, J.-J.; Lee, K.-P. Separation of aliphatic carboxylic acids and benzenecarboxylic acids by ion-exclusion chromatography with various cation-exchange resin columns and sulfuric acid as eluent. J. Chromatogr. A 2003, 997, 117–125. [Google Scholar] [CrossRef]
- Li, C.; Wang, D.; Li, N.; Luo, Q.; Xu, X.; Wang, Z. Identifying unknown by-products in drinking water using comprehensive two-dimensional gas chromatography–quadrupole mass spectrometry and in silico toxicity assessment. Chemosphere 2016, 163, 535–543. [Google Scholar] [CrossRef] [PubMed]
- Makoś, P.; Fernandes, A.; Boczkaj, G. Method for the determination of carboxylic acids in industrial effluents using dispersive liquid-liquid microextraction with injection port derivatization gas chromatography–mass spectrometry. J. Chromatogr. A 2017, 1517, 26–34. [Google Scholar] [CrossRef]
- Makoś, P.; Fernandes, A.; Przyjazny, A.; Boczkaj, G. Sample preparation procedure using extraction and derivatization of carboxylic acids from aqueous samples by means of deep eutectic solvents for gas chromatographic-mass spectrometric analysis. J. Chromatogr. A 2018, 1555, 10–19. [Google Scholar] [CrossRef]
- Zoeteman, B.; Hrubec, J.; De Greef, E.; Kool, H. Mutagenic activity associated with by-products of drinking water disinfection by chlorine, chlorine dioxide, ozone and UV-irradiation. Environ. Health Perspect. 1982, 46, 197–205. [Google Scholar] [CrossRef]
- Kool, H.; Hrubec, J. The Influence of an Ozone, Chlorine and Chlorine Dioxide Treatment on Mutagentic Activity in (Drinking) Water; Taylor & Francis: Abingdon, UK, 1986. [Google Scholar]
- Moudgal, C.J.; Lipscomb, J.C.; Bruce, R.M. Potential health effects of drinking water disinfection by-products using quantitative structure toxicity relationship. Toxicology 2000, 147, 109–131. [Google Scholar] [CrossRef]
- McKnight, A.; Reckhow, D.A. Reactions of ozonation byproducts with chlorine and chloramines. In Proceedings of the Conference proceedings, AWWA Annual Conference, Vancouver, BC, Canada, 18–22 June 1992. [Google Scholar]
- Chu, C.; Lu, C. Effects of oxalic acid on the regrowth of heterotrophic bacteria in the distributed drinking water. Chemosphere 2004, 57, 531–539. [Google Scholar] [CrossRef]
- Van der Kooij, D.; Hijnen, W. Substrate utilization by an oxalate-consuming Spirillum species in relation to its growth in ozonated water. Appl. Environ. Microbiol. 1984, 47, 551–559. [Google Scholar] [CrossRef] [Green Version]
- CAMEO Chemicals. Available online: https://cameochemicals.noaa.gov/react/3 (accessed on 15 January 2019).
- Sandvik. Available online: https://www.materials.sandvik/en/materials-center/corrosion-tables/2019 (accessed on 15 January 2019).
Figure 1.
Percentage of formation and removal of disinfection by-products identified during ozonation in drinking water samples [19].
Figure 1.
Percentage of formation and removal of disinfection by-products identified during ozonation in drinking water samples [19].


Table 1.
Levels of carboxylic acid by-products (CABPs) reported in ozonated drinking water samples across the world.
Table 1.
Levels of carboxylic acid by-products (CABPs) reported in ozonated drinking water samples across the world.
| Location | Ozonation Conditions and Water Characteristics | Carboxylic Acids (CAs) | Experiment Type | Estimated Concentrations of CAs | Ref. | ||
|---|---|---|---|---|---|---|---|
| Raw Water (Total: Minimum to Maximum) | Ozonated Water (Total: Minimum to Maximum) | ||||||
| 1 | Los Angeles Aqueduct filtration plant, California, US | Ozone dose: 1mg/L; TOC: 1.1–1.9 mg/L; total alkalinity: 113–123 mg/L as CaCO3. | Hexanoic acid, heptanoic acid, benoic acid, octanoic acid, nonanoic acid, decanoic acid, undecanoic acid, dodecanoic acid, tridecanoic acid, pentadecanoic acid, tetradecanoic acid, 9-hexadecenoic acid, hexadecenoic acid, heptadecanoic acid, octadecanoic acid, nonadecanoic acid, eicosanoic acid, Heneicosanoic acid, docosanoic acid, tricosanoic acid, tetracosanoic acid | Full scale | 32–3975 ng/L (12482 ng/L) | 20–1705 ng/L (6954 ng/L) | [29] |
| 2 | Los Angeles Aqueduct Water (LAAW), California, US | Ozone dose: 0.22 mg ozone/L-min; flow rate: 1.0 L/min; TOC: 1.6 mg/L; alkalinity- 120 mg as CaCO3/L. | Hexanoic acid, heptanoic acid, benoic acid, octanoic acid, nonanoic acid, decanoic acid, undecanoic acid, dodecanoic acid, tridecanoic acid, pentadecanoic acid, tetradecanoic acid, 9-hexadecenoic acid, hexadecenoic acid, heptadecanoic acid, octadecanoic acid, nonadecanoic acid, eicosanoic acid, Heneicosanoic acid, docosanoic acid, tricosanoic acid, tetracosanoic acid | Batch scale | 0.9–793 ng/L (2498.7 ng/L) | 21–341 ng/L (1111 ng/L) | [29] |
| 3 | State Project Water (SPW), California, US | Ozone dose: 0.22 mg ozone/L-min; flow rate: 1.0 L/min; TOC: 2.6 mg/L; alkalinity- 84–88 as CaCO3/L. | Heptanoic acid, decanoic acid, dodecanoic acid, tridecanoic acid, tetradecanoic acid, pentadecanoic acid, 9-hexadecenoic acid, hexadecenoic acid, heptadecanoic acid, octadecanoic acid | Batch scale | 75–1900 ng/L (4855 ng/L) | 46–1600 ng/L (4448) ng/L | |
| 4 | Anconella plant in Florence (Arno River water), Italy | 0.7–1.6 mgO3/mgC; DOC: 0.73–2.39 mg/L; alkalinity: 148-235 mg/L as HCO3. | Glyoxylic acid, pyruvic acid, keto malonic acid | Batch scale | No data | 20–112 µg/L | [23] |
| 5 | Britannia Water Purification Facility, Ottawa, Ontario, Canada | Summer water matrix; TOC: 3.7 mg/L; ozone dose: 0.1–0.5 mg/min; alkalinity: 9.2 as CaCO3/L; pH: 6; experimental temperature: 22 °C. | Formic acid, acetic acid, glycolic acid, pyruvic acid | Full scale | No data | 659.8–873 (1102) µg/L | [30] |
| Fall water matrix; TOC: 2.8 mg/L; ozone dose: 0.1–0.5 mg/min; alkalinity: 10 as CaCO3/L; pH: 6; experimental temperature: 11 °C. | No data | 196.5–244.8 (327) µg/L | |||||
| 6 | Water treatment plant, Ontario, Canada | No data | Acetic acid, glycolic acid, butyric acid, formic acid, ketobutyric acid, pyruvic acid | Full scale | No data | 1–277 µg/L (522) | [31] |
| 7 | California state project water | Ozone dose: 1.6 mg/L; pH: 8.3. | Acetic acid, propionic acid, formic acid, pyruvic acid, glyoxylic acid, oxalic acid and ketomalonic acid. | Full scale | No data | 3.7–210.3 µg/L | [32] |
| 8 | The Mannheim Water Treatment Plant in Kitchener, Ontario, Canada | Ozone dose: 1.8–4 mg/L; organic carbon: 4–6.3 mg/L; temperature: 2.8-22 °C; alkalinity: 140-320 mg/L as CaCO3. | Acetic acid, glycolic acid, formic acid, butyric acid, pyruvic acid, α-ketobutyric acid | Full scale | Less than detection limits | 18–271 µg/L | [33] |
| 9 | Valdosta Water Treatment Plant, Valdosta, GA (Treats ground water) | TOC: 1.0 mg/L; Ozone dose: 3.0 mg/L; contact time: 90 sec. | Glyoxylic acid, pyruvic acid | Batch scale | No data | Identified | [34] |
| 10 | Lanier Water Treatment Plant, Gwinnett County | TOC: 1.2 mg/L; Ozone diose: 0.5 mg/L; contact time: 4 min. | Glyoxylic acid, pyruvic acid, ketomanoic acid Oxaloacetic acid | Full scale | No data | Identified | |
| 11 | Poznań Water Treatment and Sewage Co. | TOC: 3.8–6.5 mg/L; pH: 7.06–7.48; alkalinity: −3.35-4.30 mval/L; ozone dose: 40–60 mg/L. | Formic and oxalic acid | Full scale | No data | 1–480 µg/L | [35] |
| 12 | Feng-San Reservoir, Taiwan | DOC: 3.0–3.5 mg/l; ozone dose: 0.5–11 mg/mg DOC | Propanoic acid, Benzoic acid, Octanoic acid, Nonanoic acid, 7-Nonenoic acid, Undecanoic acid, Dodecanoic acid, Tridecanoic acid, Teradecanoic acid, Pentadecanoic acid, Hexadecanoic acid, n-Octadecenoic acid, Nonanedioic acid | Batch scale | Identified | Identified | [26] |
| 13 | Mississippi River water | TOC- 2.7 2.6, 3.7 and 3.0 mg/L; alkalinity: 102, 110, 112 and 140 mg/L; ozone dose: 2.1, 4.3, 3.0 and 4.3 mg/L. | 2-methylpropanoic acid, butanoic acid, 3-methylbutanoic acid, pentanoic acid, hexanoic acid, heptanoic acid, octanoic acid, nonanoic acid, decanoic acid, undecanoic acid, dodecanoic acid, tridecanoic acid, tetradecanoic acid, pentadecanoic acid, hexadecanoic acid, heptadecanoic acid, octadecanoic acid, phenylacetic acid, benzoic acid, ethanedioic acid, propanedioic acid, butanedioic acid, 2-ethyl-3-methylmaleic acid, tert-butylmaleic acid, pentanedioic acid, hexanedioic acid, heptanedioic acid, octanedioic acid, nonanedioic acid, decanedioic acid, undecanedioic acid, tridecanedioic acid, phthalic acid, isophthalic acid, terephthalic acid, 1,2,4-benzenetricarboxylic acid, 1,3,5-benzenetricarboxylic acid, 1,2,4,5- benzenetetracarboxylic acid, 1,2,3,4-benzenetetracarboxylic acid, 1,2,3,5-benzenetetracarboxylic acid | Batch scale | Identified | Identified | [9] |
| 14 | surface water treatment plant located in SE Spain | Ozonation and chlorination | 18 (Spring) | Full scale | 0.02–20 (35.76) µg/L | 0.52–75 (268) µg/L | [36] |
| 18+o-Toluic acid (winter) | 0.02–25 (59.5) µg/L | 0.72–100 (467.7) µg/L | |||||
| Acetic acid, butyric acid, decanoic acid, dodecanoic acid, glycolic acid, propanoic acid (summer) | 0.04–2.4 (3.2) µg/L | 0.13–3.6 (5.5) µg/L | |||||
| 15 | Full-scale ozone treatment plant in Valdosta, GA; pilot ozonation plant in Jefferson Parish, LA | Ozone dose of 2:1 (ozone:dissolved organic carbon) | 2-methyl propanoic acid, butanoic acid, 3-methyl butanoic acid, pentanoic acid, hexanoic acid, heptanoic acid, octanoic acid, nonanoic acid, decanoic acid, undecanoic acid, dodecanoic acid, tridecanoic acid, tetradecanoic acid, pentadecanoic acid, hexadecanoic acid, heptadecanoic acid, octadecanoic acid, phenylacetic acid, benzoic acid, ethanedioic acid, propanedioic acid, butanedioic acid, 2-ethyl-3-methyl maleic acid, tert-butyl maleic acid, pentanedioic acid, hexanedioic acid, heptanedioic acid, octanedioic acid, nonanedioic acid, decanedioic acid, undecanedioic acid, tridecanedioic acid, phthalic acid, isophthalic acid, terephthalic acid, 1,2,4-benzenetricarboxylic acid, 1,3,5-benzenetricarboxylic acid, 1,2,4,5-benzenetetracarboxylic acid, 1,2,3,4-benzenetetracarboxylic acid, 1,2,3,5-benzenetetracarboxylic acid | Full scale | No data | Identified | [37] |
| 16 | Full-scale drinking water treatment plants located in Spain | Ozone and chlorine treatment | Acetic acid, Propionic acid, Butyric acid, 2-Methylbutyric acid, Hexanoic acid, Decanoic acid, Dodecanoic acid, Oleic acid, Oxalic acid, Pyruvic acid, Glycolic acid, Benzoic acid, o-Toluic acid, m-Toluic acid, p-Toluic acid, Phenylacetic acid, Salicylic acid, 3-Hydroxybenzoic acid, 2-Nitrobenzoic acid, 4-Nitrobenzoic acid, Phthalic acid, 1,2,3-Benzenetricarboxylic acid | Full scale | 44.87–95.47 µg/L | 937–1827 µg/L | [38] |
| 16 | Natural surface water, Lake Washington | DOC: 1.6 mg/L; ozone dose: 5.0 mg/L; contact time: 30 min. | Acetic acid, formic acid, oxalic acid | Batch scale | No data | 970 µg/L | [13] |
| 17 | Lake water, Lake Zurich | DOC: 1.2–1.4 mg/L; ozone dose: 2 ± 0.1 mg/L; pH: 7.9–8.0; alkalinity: 2.6 mmol/L; contact time: 3.5 min. | Acetic acid, formic acid, oxalic acid, pyruvic acid, glyoxalic acid | Batch scale | No data | 50 µg/L | [16] |
| Lake water, Lake Greifensee | pH = 8.6–8.7; DOC = 3.9–4.0 mg/L; alkalinity = 2.6 mmol/L; ozone dose: 2 ± 0.1 mg/L; contact time: 3.5 min. | Acetic acid, formic acid, oxalic acid, pyruvic acid, glyoxalic acid | Batch scale | No data | 150 µg/L | ||
| Drinking water treatment facility, Lengg, Zurich, Switzerland | Ozone dose 1.1 mg/L; contact time: 50 min. | Acetic acid, formic acid, oxalic acid, pyruvic acid, glyoxalic acid | Full scale | 0–4 µg/L (7 µg/L) | 0–7 µg/L (12.5 µg/L) | ||
| 18 | Drinking water treatment plants located in Taihu Lake Region, China | Ozonation | Spring: Formic acid, oxalic acid, malonic acid, fumaric acid, phthalic acid, benzoic acid, protocatechuic acid, 3-hydroxy benzoic acid | Full scale | ND-154.2 (227.6–345.6) µg/L | ND- 159.7 (483.4-782.56) µg/L | [39] |
| Summer: Acetic acid, fumaric acid, benzoic acid, protocatechuic acid, 3-hydroxy benzoic acid | ND-214.16 (344.64–533.31) µg/L | ND-268.3 (311.4–858.5) µg/L | |||||
| Autumn: Formic acid, acetic acid, fumaric acid, benzoic acid, protocatechuic acid, 3-hydroxy benzoic acid | ND-212.12 (296.45–633.27) µg/L | ND-158.4 (300–631.76) µg/L | |||||
| Winter: Formic acid, oxalic acid, fumaric acid, phthalic acid, benzoic acid, protocatechuic acid, 3-hydroxy benzoic acid | ND-130.75 (241.69–301.22) µg/L | ND-139.65 (304.56–632.68) µg/L | |||||
CaCO3: Calcium carbonate; ND: Not detectable; TOC: Total organic carbon; DOC: Dissolved organic carbon; ng/L: Nanogram/liter; µg/L: Microgram/liter; No data: Not reported/not measured; Identified: Qualitative measurement was done.
Table 2.
Analytical approaches developed for detection of carboxylic acid in water samples.
| Carboxylic Acids (CAs) | Instrument Type | Sample Preparation | Detection Limit | References | |
|---|---|---|---|---|---|
| 1 | Acetic, propionic, butyric, valeric, hexanoic, hep tanoic, octanoic, nonanoic, decanoic acid | GC-FID | Solid phase microextraction followed by derivatization (l-pyrenyldiazomethane) | Identified | [46] |
| 2 | Acetic acid, propionic acid, butyric acid, valeric acid | GC-FID | Solid phase microextraction | 3.1-760 µg/L | [47,48] |
| 3 | GC-ECD | Derivatization with Pentafluorobenzyl bromide and (pentafluorophenyl)diazoethane | 0.4-0.8 µg/L | ||
| 4 | 2-methylpropanoic acid, butanoic acid, 3-methylbutanoic acid, pentanoic acid, hexanoic acid, heptanoic acid, octanoic acid, nonanoic acid, decanoic acid, undecanoic acid, dodecanoic acid, tridecanoic acid, tetradecanoic acid, pentadecanoic acid, hexadecanoic acid, heptadecanoic acid, octadecanoic acid, phenylacetic acid, benzoic acid, ethanedioic acid, propanedioic acid, butanedioic acid, 2-ethyl-3-methylmaleic acid, tert-butylmaleic acid, pentanedioic acid, hexanedioic acid, heptanedioic acid, octanedioic acid, nonanedioic acid, decanedioic acid, undecanedioic acid, tridecanedioic acid, phthalic acid, isophthalic acid, terephthalic acid, 1,2,4-benzenetricarboxylic acid, 1,3,5-benzenetricarboxylic acid, 1,2,4,5- benzenetetracarboxylic acid, 1,2,3,4-benzenetetracarboxylic acid, 1,2,3,5-benzenetetracarboxylic acid | GC/MS, fused-silica column | Methylation derivatizations with BF3-methanol | Identified | [9] |
| 5 | Hexanoic acid, heptanoic acid, benoic acid, octanoic acid, nonanoic acid, decanoic acid, undecanoic acid, dodecanoic acid, tridecanoic acid, pentadecanoic acid, tetradecanoic acid, 9-hexadecenoic acid, hexadecenoic acid, heptadecanoic acid, octadecanoic acid, nonadecanoic acid, eicosanoic acid, Heneicosanoic acid, docosanoic acid, tricosanoic acid, tetracosanoic acid | GC/MS, fused-silica column | Closed loop stripped analysis using Granular activated carbon as cartridge | Quantified | [29] |
| 6 | Hexanoic acid, heptanoic acid, benoic acid, octanoic acid, nonanoic acid, decanoic acid, undecanoic acid, dodecanoic acid, tridecanoic acid, pentadecanoic acid, tetradecanoic acid, 9-hexadecenoic acid, hexadecenoic acid, heptadecanoic acid, octadecanoic acid, nonadecanoic acid, eicosanoic acid, Heneicosanoic acid, docosanoic acid, tricosanoic acid, tetracosanoic acid | GC/MS, fused-silica column | Non-ionic resin accumulation and methylation using diazomethane-ether solution | Quantified | [49] |
| 7 | Hexanoic acid, heptanoic acid, benzoic acid, octanoic acid, nonanoic acid, phthalic acid, decanoic acid, undecanoic acid, dodecanoic acid, tridecanoic acid, tetradecanoic acid, hexadecenoic acid, heptadecanoic acid, octadecanoic acid | GC/FT-IR, Restek Rtx-5 column | Sample concentration by adsorption on Amberlite XAD resins | Quantified | [50] |
| 8 | Glyoxylic acid, pyruvic acid, ketomalonic acid | GC-ECD, GC-EI, 30-m x 0.32-mm, 0.25-mm SPB-5 capillary column. | PFBHA-diazomethane double derivatization | 0.5 µg/L | [22] |
| 9 | Formic acid, acetic acid, glycolic acid, pyruvic acid, | IC-DC; Dionex AS 10-25Ox4mm | Direct injection | Quantified | [30] |
| 10 | Acetic acid, glycolic acid, butyric acid, formic acid, ketobutyric acid, pyruvic acid | IC-CDM; anion-exchange column | Direct injection (large sample loop: 740 µl) | 1 to 5 µg/L | [33] |
| 11 | Oxalic acid | IC | 740 ml sample loop (direct injection) concentrator column (heart-cut) | 9 μg/L (direct) 6 μg/L (heart-cut) | [51] |
| 12 | Acetic acid, propionic acid, formic acid, pyruvic acid, glyoxylic acid, oxalic acid and ketomalonic acid. | IC; Dionex 2000 | hydrogen cartridge (OnGuard-H+, P/N 39596; Dionex) | 2–6 μg/L | [32] |
| 13 | Glyoxylic acid, pyruvic acid, ketomanoic acid, 5-ketohexanoic acid, oxalacetic acid | LC-MS/MS spectrometer-Electrospray ionization; Supelco Supelcosil C18 LC column | Derivatization with DNPH followed by solid phase extraction using C-18 Empore disk (3M Corp.) | Identified | [34] |
| 14 | Formic and oxalic acid | Ion chromatography; DIONEX DX-500 system with IonPac AS-9-HC column; conductivity detector | Direct injection | Quantified | [35] |
| 15 | Glyoxylic acid, acetic acid, oxalic acid, pyruvic acid, 2-methylpropanoic acid, butanoic acid, 3-methylbutanoic acid, benzoic acid, 2-hydroxylbenzoic acid, phthalic acid and nitrobenzoic acid | GC/EI-MS, DB-1 column | Pentafluorobenzylhydroxylamine (PFBHA) derivatization | Quantified | [13,26] |
| 16 | Acetic acid, Formic acid, Propanoic acid, isobutyric Acid, Butanoic acid, Isovaleric acid, n-Valeric acid, Isocaproic acid, n-Caproic acid, Heptanoic acid | GC/MS; Stablewax DA fused-silica capillary column | Fiber adsorption | 0.03–11.5 mM/L | [52] |
| 17 | Acetic acid, Propionic acid, Isobutyric acid, n-Butyric acid, Isovaleric acid, n-Valeric acid | HS-GC, a free fatty acid phase (FFAP) fused-silica capillary column | Direct injection | 0.1–4.1 mg/L | [53] |
| 18 | Acetic acid, Propionic acid, Butyric acid, Valeric acid, Hexanoic acid, Heptanoic acid | GC–CI-MS; GC-FID; a tailor-made capillary column coated with polyethylene glycol modified with nitroterephthalic acid | Headspace solid-phase microextraction using polydimethylsiloxane–Carboxen fiber extraction | 150 µg/L (acetic acid); 2 to 6 µg/L (for remaining CAs)–GC-MS; 675 µg/L (acetic acid); 6–54 µg/L (for remaining CAs)–GC-FID | [54,55] |
| 19 | Aliphatic carboxylic acids (formic, acetic, propionic, butyric, isovaleric, valeric, isocaproic, 1 7 caproic, 2-methylhexanoic and heptanoic acids) and benzenecarboxylic acids (pyromellitic, trimellitic, hemimellitic, o-phthalic, m-phthalic, p-phthalic, benzoic, salicylic acids and phenol) | Ion-exclusion chromatography | Different resin extractions: sulfonated silica gel; carboxylated silica gel; sulfonated polymethacrylate resin; carboxylated polymethacrylate resins | Identified | [56] |
| 20 | Formic, acetic, oxalic acid, malonic acid-ICS; fumaric, protocatechuic, 3-hydroxybenzoic, phthalic and benzoic acid-UHPLC | ICS-2100, Dionex IonPac AS-19 capillary column; ultra-high-performance liquid chromatography, BEH C18 column | SPE: 80 mg of the mixture LiChrolut EN/Supelclean ENVI-18 (1:1) sorbents – UHPLC Direct injection -ICS | Quantified | [39] |
| 21 | 2-methyl propanoic acid, butanoic acid, 3-methyl butanoic acid, pentanoic acid, hexanoic acid, heptanoic acid, octanoic acid, nonanoic acid, decanoic acid, undecanoic acid, dodecanoic acid, tridecanoic acid, tetradecanoic acid, pentadecanoic acid, hexadecanoic acid, heptadecanoic acid, octadecanoic acid, phenylacetic acid, benzoic acid, ethanedioic acid, propanedioic acid, butanedioic acid, 2-ethyl-3-methyl maleic acid, tert-butyl maleic acid, pentanedioic acid, hexanedioic acid, heptanedioic acid, octanedioic acid, nonanedioic acid, decanedioic acid, undecanedioic acid, tridecanedioic acid, phthalic acid, isophthalic acid, terephthalic acid, 1,2,4-benzenetricarboxylic acid, 1,3,5-benzenetricarboxylic acid, 1,2,4,5-benzenetetracarboxylic acid, 1,2,3,4-benzenetetracarboxylic acid, 1,2,3,5-benzenetetracarboxylic acid | GC/EI-MS, DB-5 column; LC/MS, Supelco Supelcosil C18 LC column; GC/IR, Restek Rtx-5 column | Adsorption: XAD resin extraction; Derivalization: pentafluorobenzylhydroxylamine (PFBHA)-GC-MS; 2,4-dinitrophenylhydrazine (DNPH) – LC-MS | Identified | [37] |
| 22 | Acetic acid, Propionic acid, Butyric acid, 2-Methylbutyric acid, Valeric acid, Isovaleric acid, Hexanoic acid, Octanoic acid, Nonanoic acid, Decanoic acid, Dodecanoic acid, Myristic acid, Palmitic acid, Heptadecanoic acid, Stearic acid, Oleic acid, Linoleic acid, Oxalic acid, Pyruvic acid, Glycolic acid, Succinic acid, Fumaric acid, Benzoic acid, o-Toluic acid, m-Toluic acid, p-Toluic acid, Phenylacetic acid, Salicylic acid, 3-Hydroxybenzoic acid, 2-Nitrobenzoic acid, 3-Nitrobenzoic acid, 4-Nitrobenzoic acid, 3,4-Dihydroxybenzoic acid, Phthalic acid, 1,2,3-Benzenetricarboxylic acid | GC-MS, DB-5 MS fused-silica capillary column | Solid phase extraction followed by microwave-assisted derivatization: mixture of LiChrolut EN/Supelclean ENVI-18 (1:1) sorbents for SPE and N,O-bis-(trimethylsilyl)trifluoroacetamide (BSTFA) with 1% trimethylchlorosilane (TMCS) for derivatization | 0.6–15 ng/L | [36,38,57] |
| 23 | Acetic acid, Propionic acid, Butyric acid, 2-Methylbutyric acid, Pentanoic acid, Hexanoic acid, Octanoic acid, Nonanoic acid, Decanoic acid, Dodecanoic acid, Myristic acid, Palmitic acid, Heptadecanoic acid, Stearic acid, Oleic acid, Linoleic acid, Benzoic acid, o-Toluic acid, m-Toluic acid, p-Toluic acid, Phenylacetic acid, Phthalic acid | GC–EI-MS, poly-ethylene glycol column | SPE: 80 mg of LiChrolut EN/Supelclean ENVI-18 (1:1) | Identified and quantified | [44] |
| 24 | Benzoic acid, 2-methylbenzoic acid, 4-methylbenzoic acid, 2,4-dimethylbenzoic acid, 4-tert-butylbenzoic acid, 2-hydroxybenzoic acid, propanoic acid, butyric acid, 2-ethylhexanoic acid, heptanoic acid, octanoic acid, nonanoic acid, decanoic acid, 10-undecylenic acid, dodecanoic acid | GC–MS, Rxi-624Sil MS | Ion-pair dispersive liquid-liquid microextraction and derivatization method: chloroform and isopropanol as disperser solvent and derivatized by Tetrabutylammonium hydrogensulfate (0.2 M) | 6.9 to 1120 μg/L | [58] |
| 25 | Propanoic acid, butanoic acid, heptanoic acid, 2-ethylhexanoic acid, octanoic acid, benzoic acid, nonanoic acid, 2-methylbenzoic acid, 2-hydroxybenzoic acid, 4-methylbenzoic acid, decanoic acid, 2-chlorobenzoic acid (IS), 2,4-dimethylbenzoic acid, 10-undecylenic acid, 4-tert-butylbenzoic acid, dodecanoic acid. | GC-MS, Rxi-624Sil MS (60 m × 0.25 mm × 1.40 μm) | liquid-liquid microextraction: derivatized by adding tetrabutylammonium hydrogen sulfate (TBA-HSO4) | 6.9–1120 μg/L | |
| 26 | Benzoic acid, 2-methylbenzoic acid, 4-methylbenzoic acid, 2,4-dimethylbenzoic acid, 4-butylbenzoic-tert-butylbenzoic acid, 2-hydroxybenzoic acid, octanoic acid, nonanoic acid, decanoic acid, 10-undecylenic acid, dodecanoic acid | GC-MS, HP-5 MS (30 m × 0.25 mm × 0.25 μm) capillary column | liquid-liquid microextraction and derivatizing: DES (Choline chloride: 4-Methyl phenol (1: 2)) extracting solvent/derivatizing agent | 1.7–8.3 μg/L | [59] |
| 27 | 3-ketobutanoic acid, 3-methyl-2- ketobutanoic acid, 9-oxononanoic acid | Fourier transform ion cyclotron resonance mass spectrometry (FT-ICR MS), ESI mode | D0/D5-GRP reagents | Identified | [8] |
| 28 | Formic acid acetic acid glycolic acid, oxalic acid, pyruvic acid, glyoxylic acid, ketobutyric acid and ketomalonic acid | ICS-3000 ion chromatograph | Direct injection | 1 mg/L | [13] |
| 29 | Oxalic and oxamic acids | HPLC, C18 column (250 mm × 4.6 mm) | Direct injection | Not reported | [40] |
Identified: Qualitative measurement of carboxylic acids; Quantified: Concentrations of carboxylic acids were measured.
© 2020 by the authors. Licensee MDPI, Basel, Switzerland. This article is an open access article distributed under the terms and conditions of the Creative Commons Attribution (CC BY) license (http://creativecommons.org/licenses/by/4.0/).
Share and Cite
MDPI and ACS Style
Pulicharla, R.; Proulx, F.; Behmel, S.; Sérodes, J.-B.; Rodriguez, M.J. Trends in Ozonation Disinfection By-Products—Occurrence, Analysis and Toxicity of Carboxylic Acids. Water 2020, 12, 756. https://doi.org/10.3390/w12030756
AMA Style
Pulicharla R, Proulx F, Behmel S, Sérodes J-B, Rodriguez MJ. Trends in Ozonation Disinfection By-Products—Occurrence, Analysis and Toxicity of Carboxylic Acids. Water. 2020; 12(3):756. https://doi.org/10.3390/w12030756
Chicago/Turabian StylePulicharla, Rama, François Proulx, Sonja Behmel, Jean-B. Sérodes, and Manuel J. Rodriguez. 2020. "Trends in Ozonation Disinfection By-Products—Occurrence, Analysis and Toxicity of Carboxylic Acids" Water 12, no. 3: 756. https://doi.org/10.3390/w12030756
Note that from the first issue of 2016, this journal uses article numbers instead of page numbers. See further details here.