Assessment of Water Security in Socially Excluded Areas in Kolkata, India: An Approach Focusing on Water, Sanitation and Hygiene


1
Institute of Geographical Sciences, Physical Geography, Freie Universität Berlin, Malteserstr. 74-100, 12249 Berlin, Germany
2
School of Social Policy, Sociology and Social Research (SSPSSR), University of Kent, Q-Step Centre, Canterbury, Kent CT2 7NF, UK
*
Author to whom correspondence should be addressed.
Water 2020, 12(3), 746; https://doi.org/10.3390/w12030746
Submission received: 21 January 2020
/
Revised: 29 February 2020
/
Accepted: 2 March 2020
/
Published: 8 March 2020
(This article belongs to the Section Urban Water Management)
Abstract
:Water security is essential not only to ensure the availability and accessibility of water for drinking, producing food, washing, but also to maintain both human and environmental health. The 2011 Census of India reveals that 17.4% of urban households in India live in deprived areas in urban landscapes which are designated as slums in the Census dataset. The increasing number of people living in these areas poses serious challenges to the provision of basic urban water, sanitation and hygiene (WaSH) services. Perceived susceptibility of risks from contaminated water and lack of proper sanitation and hygiene will be addressed in the light of social exclusion factors. This study attempts to assess the present situation of water, sanitation and required hygiene provisions within the areas defined as slums by the Census of India 2011 in Kolkata, India. Based on the results obtained from the datasets from the census, and a household survey, we identified a lack of supplies associated with WaSH provisions in these areas of Kolkata. The WaSH provisions in the slum areas of Kolkata city are facing various issues related to regularity, quality and quantity of supplied water. Additionally, there is poor maintenance of existing WaSH services including latrine facilities and per capita allocation of a sustainable water security among the slum dwellers. By adding to our understanding of the importance of factors such as gender, religions, and knowledge of drinking water in deprived areas, the study analyses the links between both physical and social issues determining vulnerability and presence of deprivation associated with basic WaSH provisions as human rights of slum communities.
1. Introduction
At the turn of the millennium about half of the global population lived in ‘mega-cities’ [1]. These large cities are predominantly located in the developing world [2]. There are well-known environmental problems of and in megacities, and this article focuses on one major dimension of these environmental problems—water, sanitation and hygiene (WaSH)—here seen to represent a major part of the overall concept of water security. Provisioning of sustainable WaSH services is now increasingly considered as water security [3]. Water shortage is a rapidly growing problem and delivery of safe drinking water cannot be ensured in many mega-cities. The present-day situation with respect to pollution of air, land, and water, as well as the lack of basic water and sanitation facilities in mega-cities, creates difficult living conditions, with women and children suffering most [4]. Attaining universal and equitable access to safe and affordable drinking water for all by 2030 (UN Sustainable Development Goal 6) will be a major challenge, particularly in deprived areas of large cities and mega cities.
Water security ensures the access to safe and enough drinking water at an affordable cost in order to meet basic needs, which includes sanitation and hygiene [5], and the safeguarding of health and well-being [3]. Hence, this article uses water security as a framework to understand WaSH-related issues in mega-cities, here Kolkata (India), and the complex web of factors influencing these issues. We study WaSH indicators, which we understand as key provisions to achieve water security. We combine human-oriented and environmental perspectives through analyzing slum data and data of a pilot survey—and combining bio-physical and social data as discussed in Mukherjee et al. [6]. Although there is no consensus on the concept of water security, most authors agree on some commonalities seen as fundamental to water security, including adequacy of water and sanitation (see for example [7,8]). Securing access to clean water, and ability to adequate hygiene and sanitation is here seen as crucial to secure basic human rights, and sustainable development [8].
When analyzing water security in urbanized areas most recent studies seek to focus on complex sets of factors including: unrestricted population growth [9,10], poor governance [11,12,13] and mismanagement of the water supply system [14] as well as social inequality [15,16,17,18]. Our study aligns itself with studies focusing on the multidimensional and complex set of factors related to WaSH to create an improved quantitative assessment framework. By analysing data on slums and a pilot survey in Kolkata and combining both data sets we will show variations in bio-physical and socio-economic data—and how these factors need to be considered when we want to understand WaSH related vulnerabilities. By analyzing WASH provisions, we want to identify inequalities in water security among the socially excluded groups in Kolkata.
For an in-depth discussion on the connotations and history of the concept of slums see Mayne [19]. In his work he understands slums as a ‘place to be ministered to, a place to be cleaned up, a place to be cleared out’. In 2012, globally more than 860 million people—about a third of the urban population of developing countries—lived in slum areas [20]. The primary barriers to access water in these areas are not solely monetary or technical but legal, institutional, and political [20]. Urban areas with high levels of deprivation i.e., slums, constituted almost 1 billion people or 32% of the global urban population in 2003 [21]. Moreover, the locus of global poverty is moving to the cities, a process now recognized as the ‘urbanization of poverty’ [22]. Without concerted action on the part of municipal authorities, national governments, civil society actors and the international community, the number of people living in highly deprived areas in these cities is likely to increase in most developing countries, and is projected to rise over the next 30 years to about 2 billion [21]. In the United Nations Millennium Declaration, world leaders pledge to tackle this challenge, setting the specific goal of achieving ‘significant improvement in the lives of at least 100 million slum dwellers by the year 2020′ [21]. This includes to address the needs for shelter as well as overarching problems of urban poverty, especially unemployment, low incomes and a lack of access to basic urban services, such as access to water and sanitation. At present, 785 million people lack even basic drinking-water service and 2.0 billion people still do not have basic sanitation facilities such as toilets or latrines. [23]. The question arises: why the interventions to ensure safe water and sanitation to everyone is insufficient? It is our hypothesis, that part of the answer lies within the issue of socio-cultural dimensions. These aspects are often only considered superficially, and there is inadequate knowledge to be able to ensure suitable and sustainable WaSH provision for everyone.
In this study we want to analyze water security in socially excluded areas in Kolkata mega city as a case study along social, political, economic and cultural dimensions combined with bio-physical characteristics. As a social measure of vulnerability to water security we focus on data from areas defined as slums by the data gathering institutions, here the Census of India 2011, to analyze the trends in water security among households that are socially excluded. These socially excluded areas or ‘slums’ are defined as a group of individuals living together under the same roof and lacking one or more of the following conditions: access to improved water, access to improved sanitation, structural quality/durability of dwelling, sufficient living space that is not overcrowded, and security of tenure [19]. Referring to various desiderata, this study aims to determine the role of social factors and culture as dimensions of water security by analyzing in the context of Kolkata’s deprived areas, to assess WaSH program’s failure or success. We explore to what extent social, cultural, economic, political and institutional factors influence individuals’ and specific groups’ (groups in vulnerable positions from an intersectional point of view) water security in a city, with the objective to create indices that can reliably measure water security. This will help to develop sustainable solutions to fight water insecurity. Summarizing, this article aims to:
- (1)
- Provide a new understanding of water security in socially excluded areas in Kolkata using ‘Slum Data’ extracted from the 2011 Census of India report.
- (2)
- Show the variation in water security across and within areas defined as slums, by focusing on WaSH and identify the key socio-economic factors affecting urban water security of socially excluded population in Kolkata based on primary data collected in the frame of this study.
This article provides an analysis of biophysical and social data with the aim of enhancing our understanding of water security issues in socially excluded areas, often referred to as slums.
2. State of the Art
Geographical areas with high levels of social exclusion and deprivation are often referred to as slums [24]. These areas are expected to have particularly high levels of water insecurity [25]. The populations within these areas are growing due to net migration gain and high birth rates [26,27]. For Kolkata (and India), the general term slum can refer to both bastis (or Bustee) and squatter settlements [28]. Bastis are legally recognized settlements that the Kolkata Municipal Corporation supplies with services such as water, latrines, trash removal, and occasionally electricity. Basti huts typically are permanent structures that the government will not demolish, which allows basti communities to develop a sense of permanency and to focus on issues of poverty beyond shelter availability [28]. In contrast, squatter settlements are illegal clusters of temporary houses mostly located along canals and railways [29,30]. The Kolkata Municipal Corporation (KMC), responsible for the civic infrastructure and administration of the city of Kolkata, usually does not supply squatters with basic conveniences [21,29]. Moreover, people in squatters live in anticipation, though of different degrees depending on settlement location and political affiliation, of their potential evictions [21,28].
The term social exclusion in the sense of the UN-Habitat Programme is a ‘a complex and multi-dimensional process [… that] involves the lack or denial of resources, rights, goods and services, and the inability to participate in the normal relationships and activities, available to the most people in a society, whether in economic, social, cultural or political arenas. It affects both the quality of life of individuals and the equity and cohesion of society as a whole’ ([21], p. 9). Social exclusion as a concept focuses on both the processes by which social and economic institutions exclude groups, and the multidimensional nature of the adverse consequences experienced by those who are excluded [31]. Gender is one of the most important factors related to social exclusion and is also the most dominating in the context of cultural dimension of WaSH and water security [32]. It controls the roles and vulnerabilities in relation to WaSH and the hegemonic role of male gender over others, especially in developing countries. As an example, the provision of hygiene and sanitation are often considered as women’s tasks, resulting in women being more exposed to WaSH-related problems. Despite this, women’s concerns are rarely spoken properly due to societal or cultural blockades [33] and other gendered people are not even recognized when designing solutions to WaSH issues [34].
For Kolkata few studies exist that have researched water and sanitation issues in specific wards (= administrative units) defined as slums [28,29,35]. Ghosh observed that slum dwellers of Bibi Bagan Lane (within Kolkata city, ward no. 56) are greatly unhappy with water and sanitation provision; among the most crucial issues they highlighted were dirty, filthy conditions of the toilets for females [9]. Beyond, overflowing toilets, shortage of baths and drainage problems were common problems in the ward, and the study also reports a demand for provision of tap water. A socio-economic survey of the Dasnagar slum within the Kolkata Metropolitan area (KMA) describes not only poor but also deteriorating conditions out of which the authors identified a set of social indicators of social exclusion combined with poor sanitation in the area [35]. Schenk argues that religion and language have a greater influence on the social, economic and physical characteristic of deprived areas than caste [28]. He points out that to improve the living conditions we need to understand the factors that led to emergence of slum areas, the population that inhabit them and the constraints imposed by the politics of slums and settlements. Lessons must be learned from the shortcomings of past policies [36], and Schenk suggests that new policies must consider ethnic diversity, disparate occupation and the social and political scenario of the slums that are critical for its existence [28].
Looking at official data [37] growing numbers of deprived areas defined as slums by the official bodies in Kolkata and Bengal can be observed [37]. According to the ‘Primary Census Abstract for Slum, Census of India 2011′ West Bengal state counted 6.4 million slum dwellers—0.48 million in notified slums, 3.7 million in recognized slums and 2.6 million in identified slums. The share of slum population in West Bengal state has risen from 8.9% in 2001 to 9.8% in 2011. In Kolkata (capital city of West Bengal state), the proportion of slum households to total urban households amounts 29.6%. 80–85% of the slum population in West Bengal are literate.
2.1. Water Security and Human Rights
For squatter/semi-permanent settlements state water insecurity is stated as ‘a lack of access by all people, at all time, to adequate water for an active and healthy lifestyle’ ([38], p. 2117). Various studies emphasize the dimensions of quantity, quality and accessibility as crucial dimensions [39,40,41].
The human right to water entitles everyone to enough, safe, acceptable, physically accessible, and affordable water for personal and domestic (household) use. Sanitation is defined as a system for the collection, transport, treatment, disposal, or reuse of human excreta and associated hygiene [42]. The human right to sanitation entitles everyone to sanitation services that are safe, socially and culturally acceptable, secure, hygienic, physically accessible and affordable, and that provide privacy and ensure dignity [43]. ‘Human rights are inherent in all human beings, whatever their nationality, place of residence, sex, national or ethnic origin, color, religion, language, or any other status’ [21]. In 1977, the United Nations Water Conference for the first time recognized the ‘right to water’. The conference’s action plan stated that all people have the right to have access to drinking water in quantities and of a quality equal to their basic needs [44,45]. In 2000, the ‘right to clean water’ was affirmed by the United Nations General Assembly in its resolution A/Res/54/175. However, the rights to water and sanitation were not recognized as a fundamental human right until July 28, 2010 in resolution 64/292 made by the United Nations General Assembly [46]. The formal recognition of the ‘Human Right to Water and Sanitation’ (HRWS) in 2010 by UN member states was the most recent step in a decades-long discussion about the contents and implications of these rights ([47], p. 238). Securing human rights to clean water and sanitation is central in water security with both aspects being intrinsically linked. Consequently, water security can be defined as ‘the secure, adequate, and sustainable access that people and ecosystems have to water, including the equitable distribution of advantages/disadvantages related to water use and development opportunities, the safeguarding against water-based threats, and the ways of sharing decision-making power in water governance’ ([48], p. 20). Gutierrez advocates for an approach to water security that embraces the notion of ‘access’ [49]. This implies bringing individual rights, equity and justice and affordability to the first place [46,50]. These principles of water security comply with the Human Right to Water and Sanitation (HRWS) ensuring all people to have access to enough water [46,51]. Recognizing this coupling of the HRWS and water security concepts, it is helpful to consider five main dimensions of the rights in practice, in order to maintain household water security:
- Availability, corresponding to sufficient and continuous water supply for personal and domestic uses, including drinking and food preparation, personal hygiene, washing of clothes, cleaning, and other aspects of domestic hygiene, as well as facilities and services for the safe disposal of human excreta (i.e., urine and faeces) [52].
- Accessibility, implying that water and sanitation facilities must be located or constructed in such a way that they are always accessible to everybody. Safe access is particularly important regarding to sanitation both for people with constrained physical movement and particularly women, girls and trans* who may face safety risks [53,54].
- Quality and safety, implying that water quality must be safe for human consumption (i.e., drinking and food preparation) and for personal and domestic hygiene. This means it must be free from microorganisms, chemical substances, and radiological hazards that constitute a threat to a person’s health both short term and over a lifetime of consumption. Sanitation facilities must be safe to use and prevent contact between people and human excreta [52].
- Acceptability, meaning that water and sanitation facilities must meet social or cultural norms from a user’s perspective, i.e., regarding the odor or color of drinking water, or the privacy of sanitation facilities. In most cultures, gender-specific sanitation facilities will be required in public spaces and institutions [54,55].
- Affordability, including that individual and household expenditure on water and sanitation services, as well as associated hygiene, must be affordable for people without forcing them to resort to other, unsafe alternatives or limiting their capacity to acquire other basic goods and services (such as food, housing, or education) guaranteed by other human rights [56,57].
Almost all United Nations members agreed with HRWS as a universal right, but the implementation of the standards varies in practice. The World Health Organization (WHO) and United Nations International Children’s Emergency Fund (UNICEF) specified 20 L of water per capita per day as the minimum amount required for a person [58]. Only then that person would be considered to have access to improved water supply in their global assessment of water supply according to WHO/UNICEF Joint Monitoring Programs for Water Supply and Sanitation, 2011 [58]. However, this does not provide enough water to ensure other basic human rights which are fundamental to maintain water security at a household level [45,47]. Chenoweth argues for 85 L per capita per day as minimum requirement for basic domestic water usage (mainly drinking, cooking and washing) at the household level, and 120 L per capita per day as the least necessity if economic activities are involved on top of that [45]. Therefore, it gets clear that the standard of minimum access level of per capita water requirement set by WHO/UNICEF is too low for achieving household water security to fulfill the HRWS [45].
For vulnerable societal groups, water insecurity and deficient WaSH provisions commonly reflect unequal distribution of water volumes, quality, and sanitation services within unequal power structures [59,60]. Policy debates tend to naturalize and de-politicize the definition of water security [47]. Instead of recognizing that water security and distribution are a result of political choices, negotiation, and power plays, they are often represented as following universal economic, legal, and natural-scientific rules [61]. In this context, there is a widespread policy assumption that formally recognizes that local, customary HRWS is an important element to grant water security for marginalized user groups [46].
Water in-security, as it is increasingly perceived in recent policy notions, is not so much associated with hazardous or absolute scarcity of sufficient fresh and clean water only, but the ways the water and water-services are distributed and, essentially, the unequal power structures within the society [46,59,60] Therefore, equity in distribution of water services is more crucial in limiting water security in the context of unequal power than sufficiency of availability of safe and clean water [59]. According to the 2006 United Nations Human Development Report, poverty, power and inequality create the water crisis, not the water scarcity itself ([46], p. 238).
The right to water ensures that every human is provided with safe, accessible and affordable universal access to water which is also reflected in the WHO approach to categorizing access to water [62]. In developing countries, access to urban services often differs widely between the rich and the poor dwellers, and between men and women [63]. The slum dwellers experience variable deficiencies and risks associated with urban water insecurity, including lack of durable housing, overcrowding, insufficient access to clean water, poor sanitation and hygiene facilities and threats of forced evictions [21]. In water, sanitation and hygiene, women’s concerns are rarely addressed appropriately due to societal or cultural barriers [64,65]. Women and girls in slums or poor informal settlements typically take responsibility for fetching water when supply is poor, and this can take hours out of their day, reducing time for education, employment, childcare etc. [66]. When relatives become sick because of poor hygiene, it is also women and girls who bear the greatest burden of care [67]. Because women tend to spend more time than men in the home and neighborhood, they are also more directly exposed to environmental hazards of poor sanitation—such as diseases caused by poor drainage, contact with human faeces and decomposing rubbish [66].
2.2. Water Security in Kolkata’s Deprived Areas
Water security provision in Kolkata’s deprived areas (slums) has been a contested topic since the foundation of the city. Various political forces have debated the issue of slum improvement versus slum demolition since the Colonial Period [68]. The post-independence Indian government emphasized slum improvement but with the goal of slum demolition and relocation. The colonial government refused to take financial responsibility for improving slums because they existed on private lands ([69], p. 31). The municipal corporation only acted initially out of concern for public health and fire hazards [69]. Prioritization of street construction over slum improvement grew during the 1890s and early twentieth century as power was allotted to the Calcutta Building Commission and the Calcutta Improvement Trust [28,69]. Slums were cleared in the early twentieth century to make room for British colonisers [70]. There is no indicator that the authorities showed concern for the welfare of displaced slum dwellers, but rather a political emphasis on ‘commercial viability’ by colonial British policies ([28], p. 104).
In Kolkata local water security is deeply anchored in local water control rights [61]. Diverse interest groups encounter and negotiate with rights definitions and normative codes that regulate day to day water uses. HRWS is co-determined also by bio-physical conditions, but in a mega-city like Kolkata the water rights are interwoven with society’s socio-cultural norms and perceptions related to WaSH as well as political and economic histories [46]. Religion, language and caste are diverse among the population in Kolkata’s deprived area, which is reflected in the wide spectrum of their social and economic features as well as in water and sanitation. Also, religion, ethnicity and language are included to understand deprived areas [28]. Currently, and despite the Bustee Improvement Programme implemented by the Calcutta Metropolitan Planning Organization (CMPO) and a variety of activities by different NGOs and efforts of slum dwellers themselves, there has not been any significant improvement in the physical living conditions of the slums in Kolkata [71].
3. Study Area
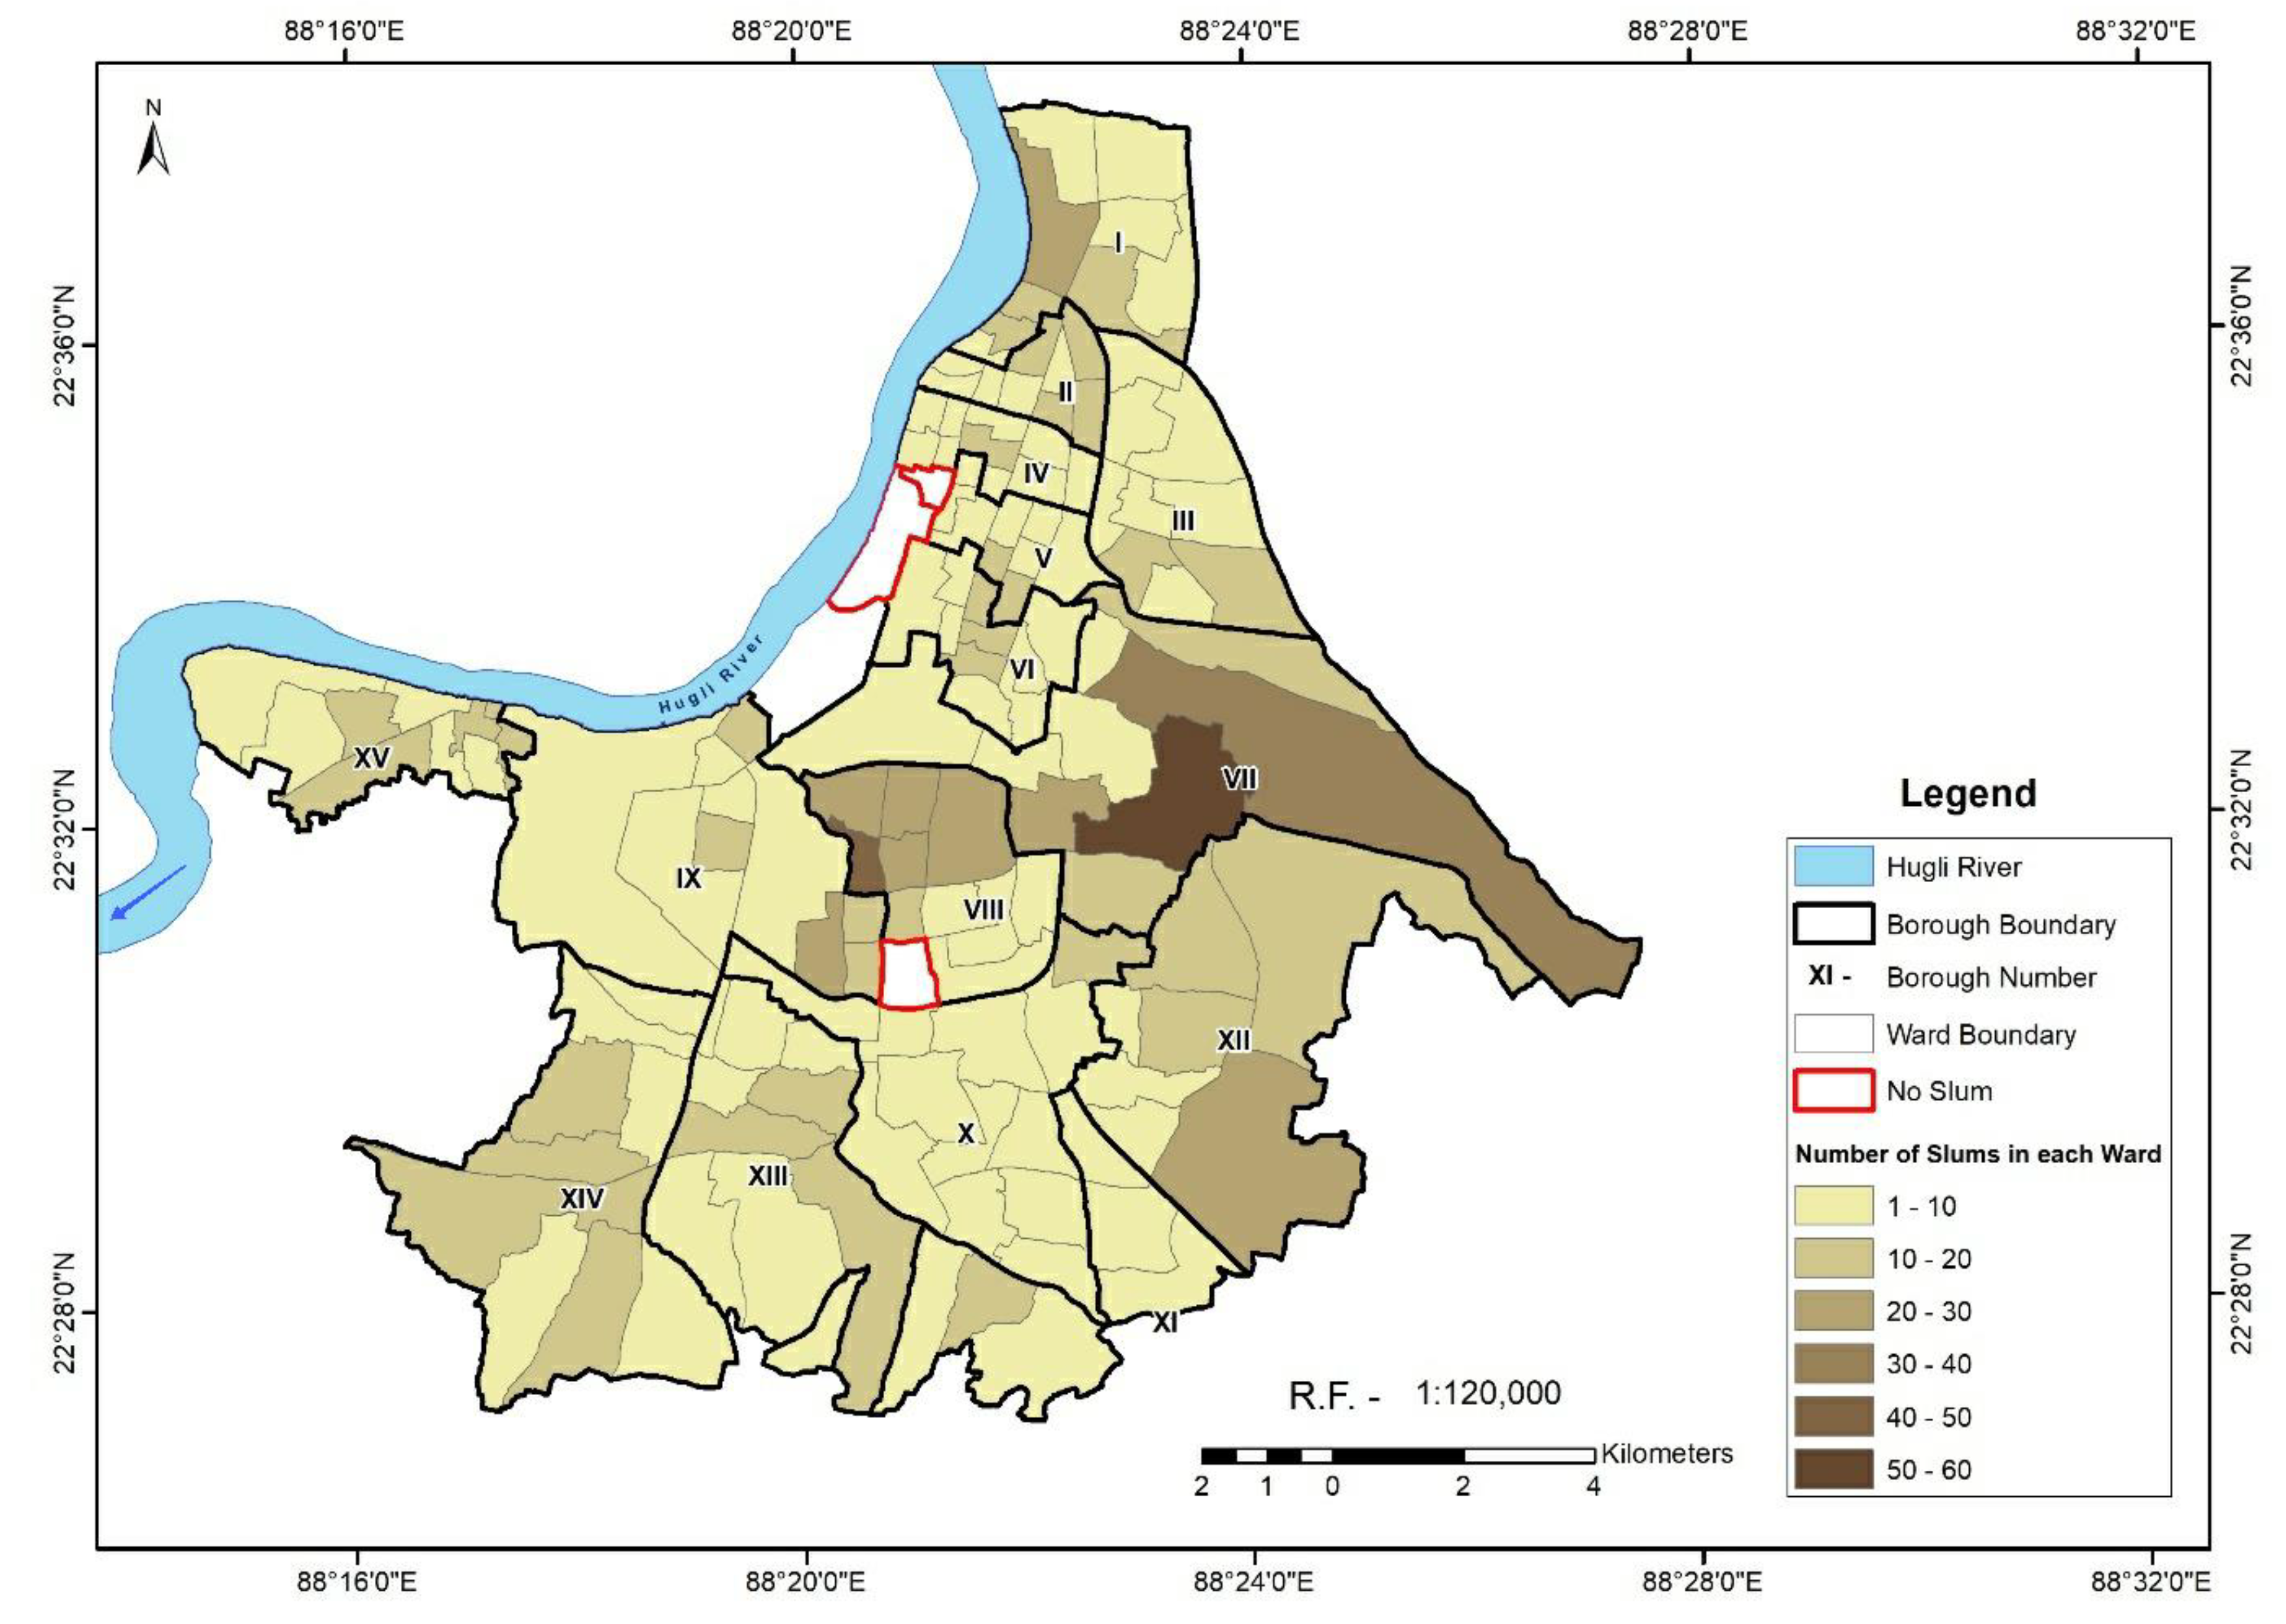
Kolkata Municipal Corporation (KMC) is located between 22° 28′ 00″–22°37′ 30″ N and 88° 17′ 30″ E–88°25′ 00″ E with its northwestern boundary along the main branch of river Ganga, the Bhagirathi Hooghly (Figure 1). The city Kolkata is the capital of the state West Bengal and is well connected by rail, road and air network. The Kolkata Municipal Corporation covers an area of 187.3 km² and comprises of 141 wards reassigned to 15 boroughs (currently, three new wards have been added and boroughs are rearranged in 16 wards, but official data for this rearrangement are still not available) having 21 assemblies and three parliamentary constituencies. As per provisional reports of Census of India (2011), population of KMC in 2011 totaled 4,496,694 capita of which 52.4% were male [37]. As per 1901 census population of Kolkata counted 933,754 capita and increased to 2,698,494 capita in 1951, 4,572,876 in 2001 [37] and most recently it is estimated to be 5,302,880 capita (https://indiapopulation2019.com/population-of-kolkata-2019.html). In 2001 approximately 40% of Kolkata’s population lived in 5500 overpopulated slums [37], while according to census data from 2011 there lived approximately 25% Kolkata’s population in 5600 different slum areas (c. 1.141 million city residents) [37]. The population growth of Kolkata city is increasing rapidly which also enhances the demand of ground water in the city and ultimately imposes stress on ground water regime in the area [72]. Hinduism is the predominant religion in Kolkata city with 76.51% followers, while Islam has about 20% followers. Beyond, in Kolkata city Christianity is followed by 0.88% of its population, Jainism by 0.47%, Sikhism by 0.31% and Buddhism by 0.31%; around 0.03% of the city residents stated to follow an ‘Other Religion’, approximately 1.09% stated to belong to ‘No Particular Religion’ [37]. Daily water demand within the KMC area totals about 969 × 106 L with two major water sources to cover the water demand: (a) Surface water from the river Hooghly through piped supply as standposts and (b) ground water made accessible through tubewells and dugwells [6].
4. Methods
4.1. Data
The primary data base on a survey using (i) Stratified Random Sampling collection of data from 45 households from each borough of KMC and (ii) two LGBTQ focus groups consisting of 35 respondents were conducted in November–December 2018. Total respondents were 755. Furthermore, Census Data of India (2011) was used to extract the detailed slum data [37]. The survey included the presence of drinking water provisions and toilets in the house. The respondents were a mixed from slum and non-slum areas of the entire KMC. The 2011 Census Data of India dataset on slums provides detailed information on household level in each ward of the KMC area. It includes information on socioeconomics such as condition of the slum housing, income, literacy as well as water provisions in term of latrines, dugwell, tubewell and standposts; data on gender, religion and language statistics were also obtained from this data set.
This article reports on interdisciplinary analysis using the data in an innovative way, combining it with biophysical data and complementing it with survey data. As the aim of the research is to for the first time combine social and biophysical data to start exploring the new understanding such approaches can yield in the area of water security—and this aims to highlight this through bivariate analysis, with robustness and significance testing and the use of data from satellite images. This follows in the tradition of landmark studies within the area of water security, where simple indicators and analysis form the basis for crucial contributions to the field [6,8,11,13,15,17,25,47,48,59]. The article is a first step in a larger project, which will make use of advanced techniques such as multilevel modelling and GIS combining social and biophysical data, and argues that simple, strong findings found in the analysis carried out here is crucial and sufficient to show important dimensions to take into account in water security, as can be seen in our findings.
The survey focused on water security issues comprehensively as defined by Grey and Sadoff [48]. According to them, water security is ‘the availability of an acceptable quantity and quality of water for health, livelihoods, ecosystems and production, coupled with an acceptable level of water-related risks to people, environments and economies.’ The survey was based on a questionnaire consisting of 35 questions divided into four segments, differentiating issues of pressure (availability and accessibility), state (water quality) and impact of water security (water related risks/hazards) on the households. The fourth segment included demographic data assemblage to reflect the social aspects of water security in the city’s neighbourhood.
The article used the variables focused on WaSH issues of availability, accessibility, quality and risks related to water experienced in the respondent’s everyday life. Due to the ethnic and linguistic diversity of Kolkata interviewers speaking the local languages were recruited providing access to respondents of different socio-economic, ethnic and caste background. The Interviewers undertook training to ensure they learnt about the crucial social and biophysical dimensions of water security as well as to ensure they were fully trained both on interviewing skills, how to avoid bias as well as ethical issues that may arise during an interview. Survey training activities were also very important to maintain survey quality, as well as gender sensitization because our survey included the entire gender spectrum to be notified on record. Interviews were conducted based on the availability of respondents, which might affect how representative the sample is. The average survey response rate across the city was about 70% varied across the study area.
The research also incorporated analysis of satellite images to extract the information on existing waterbodies within the city in 2010 (as the Census survey was performed mainly in 2010) as a basis to compare the status of WaSH provisioning and the availability of surface waterbodies. For this study we used Indian Remote Sensing (IRS) Resourcesat-1 Linear Imaging Self-Scanning Sensor (LISS) III image (path 108, row 56; DoA: 03.02.2010).
It is focused on source and access to water as well as access to and place of toilets. The provisions of WaSH are defined in each slum as access to latrine and drinking water supply facilities i.e., standposts, dugwells and tubewells. A standpost is a tap-stand which provides water from a piped water distribution system for local communities. Dugwells and tubewells are both vertical drilled wells receiving water from an aquifer. Dugwells are holes in the ground dug by shovel or backhoe and cased with stones, brick, tile, or other material to prevent collapse, while tubewells are cased with stainless steel tube or pipe [73].
4.2. Data Processing
Data processing and analyzing were divided into four sections according to the source of the data.
• Survey Data Processing.
All survey data were collected by questionnaire which were transferred into MS-Excel data sheets. The answers were coded and cleaned for further analyses. Data cleaning involved the detection and removal (or correction) of errors and inconsistencies in a data set or database due to the corruption or inaccurate entry of the data. Incomplete, inaccurate or irrelevant data is identified and then either replaced, modified or deleted.
• Census Data Processing.
The slum data obtained from the Census of India (2011) were first extracted from the District Census Data Handbook—Kolkata and transferred into a MS-Excel data sheet. Data was cleaned and sorted based on wards and boroughs respectively. On this base per capita availability of water provision (no of latrine, standposts, dugwell and tubewell) in each ward was calculated. Each of the per capita allotment of water provision was further related to each category of gender (male, female, children), language spoken (Bengali, Hindi, Urdu) and religions (Hindu, Muslim, other) to get the category-wise distribution of water provision in the slums in each ward. Deductive statistics is applied to analyze the distribution of water provision in regard to the different population categories.
• Outlining surface waterbodies and WaSH provisioning in the slums, optical bands were considered to map surface waterbodies and WaSH provisioning in the slums within KMC areas.
In the first step, standard image (LISS III Satellite Image 2010 from ISRO, Bengaluru, India) was geometrically and radiometrically corrected, thereupon image was co-registered to match the overlay with sub-pixel accuracy (RMS errors ≈ 0.21). For re-sampling, nearest-neighborhood technique was performed for the classification to retain the original pixel values. The maximum likelihood based supervised classification was employed to detect the changes in wetlands areas within the Kolkata Municipal Corporation area (KMC) for 2010. Classification of wetland areas was performed on co-registered images using a non-parametrical feature-space classifier on ERDAS Imagine software (v. 2015, Hexagon Geospatial, Madison, AL, USA). Surface waterbodies (excluding the river Bhagirathi Hooghly in the west) were mapped. For the assessment of the accuracy level of the classification procedure topographical maps (scale 1:50,000 surveyed in 1975–76 by the Survey of India), complemented by ground-truth data obtained from field surveys between 2008–2018 and analysis of secondary data collected within 2008–18 were compared with the classified satellite imagery. The overall accuracy obtained was 85%. Finally, the extracted surface waterbody class was overlaid on the displayed slum data with various water provisioning in the study area.
• Calculation of ward-wise distribution of WaSH provisions (WP index).
Using the ward-wise frequencies of water provision, a WP index of a ward as a normalized weighted average was applied, defined as follows:
with l/p = latrines person−1, s/p = standposts person−1, d/p = dugwells person−1 and t/p = tubewells person−1.
WP index (non-normalised) = (l/p/2) + {(s/p + d/p + t/p)/6}
WP index (normalised) = {index − min(index)}/{max(index) − min(index)} ∈ [0,1]
The variable “latrines person−1” was considered as a representative of sanitation provision, while the remaining variables represent water sources. Therefore, total number of latrine person−1 (l/p) was given same weight as the sum of the remaining three WaSH provisions (s/p = standpost person−1, d/p = dugwells person−1 and t/p = tubewells person−1). Normalisation to WP index values between 0–1 allows to assess inter-ward-variability in water security provisions. The results were displayed in maps using ArcGIS 10.6 (ESRI, Redlands, CA, USA).
5. Results
The ward wise distribution of the WaSH provisions in relation to gender (male, female), ethnicity based on language spoken (Bengali, Hindi, Urdu and other languages) and religions (Hindu, Muslim and other religious groups) is analysed applying deductive statistics supported by maps documenting spatial distribution.
5.1. Social Exclusion and WaSH Provisions in Slums
Pearson product-moment correlation coefficient was applied to assess the linear correlation between all WaSH provision variables and the social categories (Table 1); analysis base on the 2011 Census data of slums within the KMC area.
There is a statistically significant correlation in the data between all the dependent variables with number of families, male dwellers, female dwellers and literate dwellers in slums of KMC (α < 0.01). Number of Bengali speakers show statistically significant correlations with both latrine person−1 and sources of water (standposts person−1, dugwells person−1 and tubewells person−1) (α < 0.01).
At the same time, the number of Hindu as another majority group correlates with the number of latrines person−1 (α < 0.01) and sources of waters (standposts person−1, dugwells person−1 and tubewells person−1) (α < 0.05). The data do not provide statistically significant relationships between the dependent variables dugwells person−1 and tubewells person−1 and the independent variables number of Muslim and other religious groups as well as number of Urdu and other language speakers (α > 0.05).
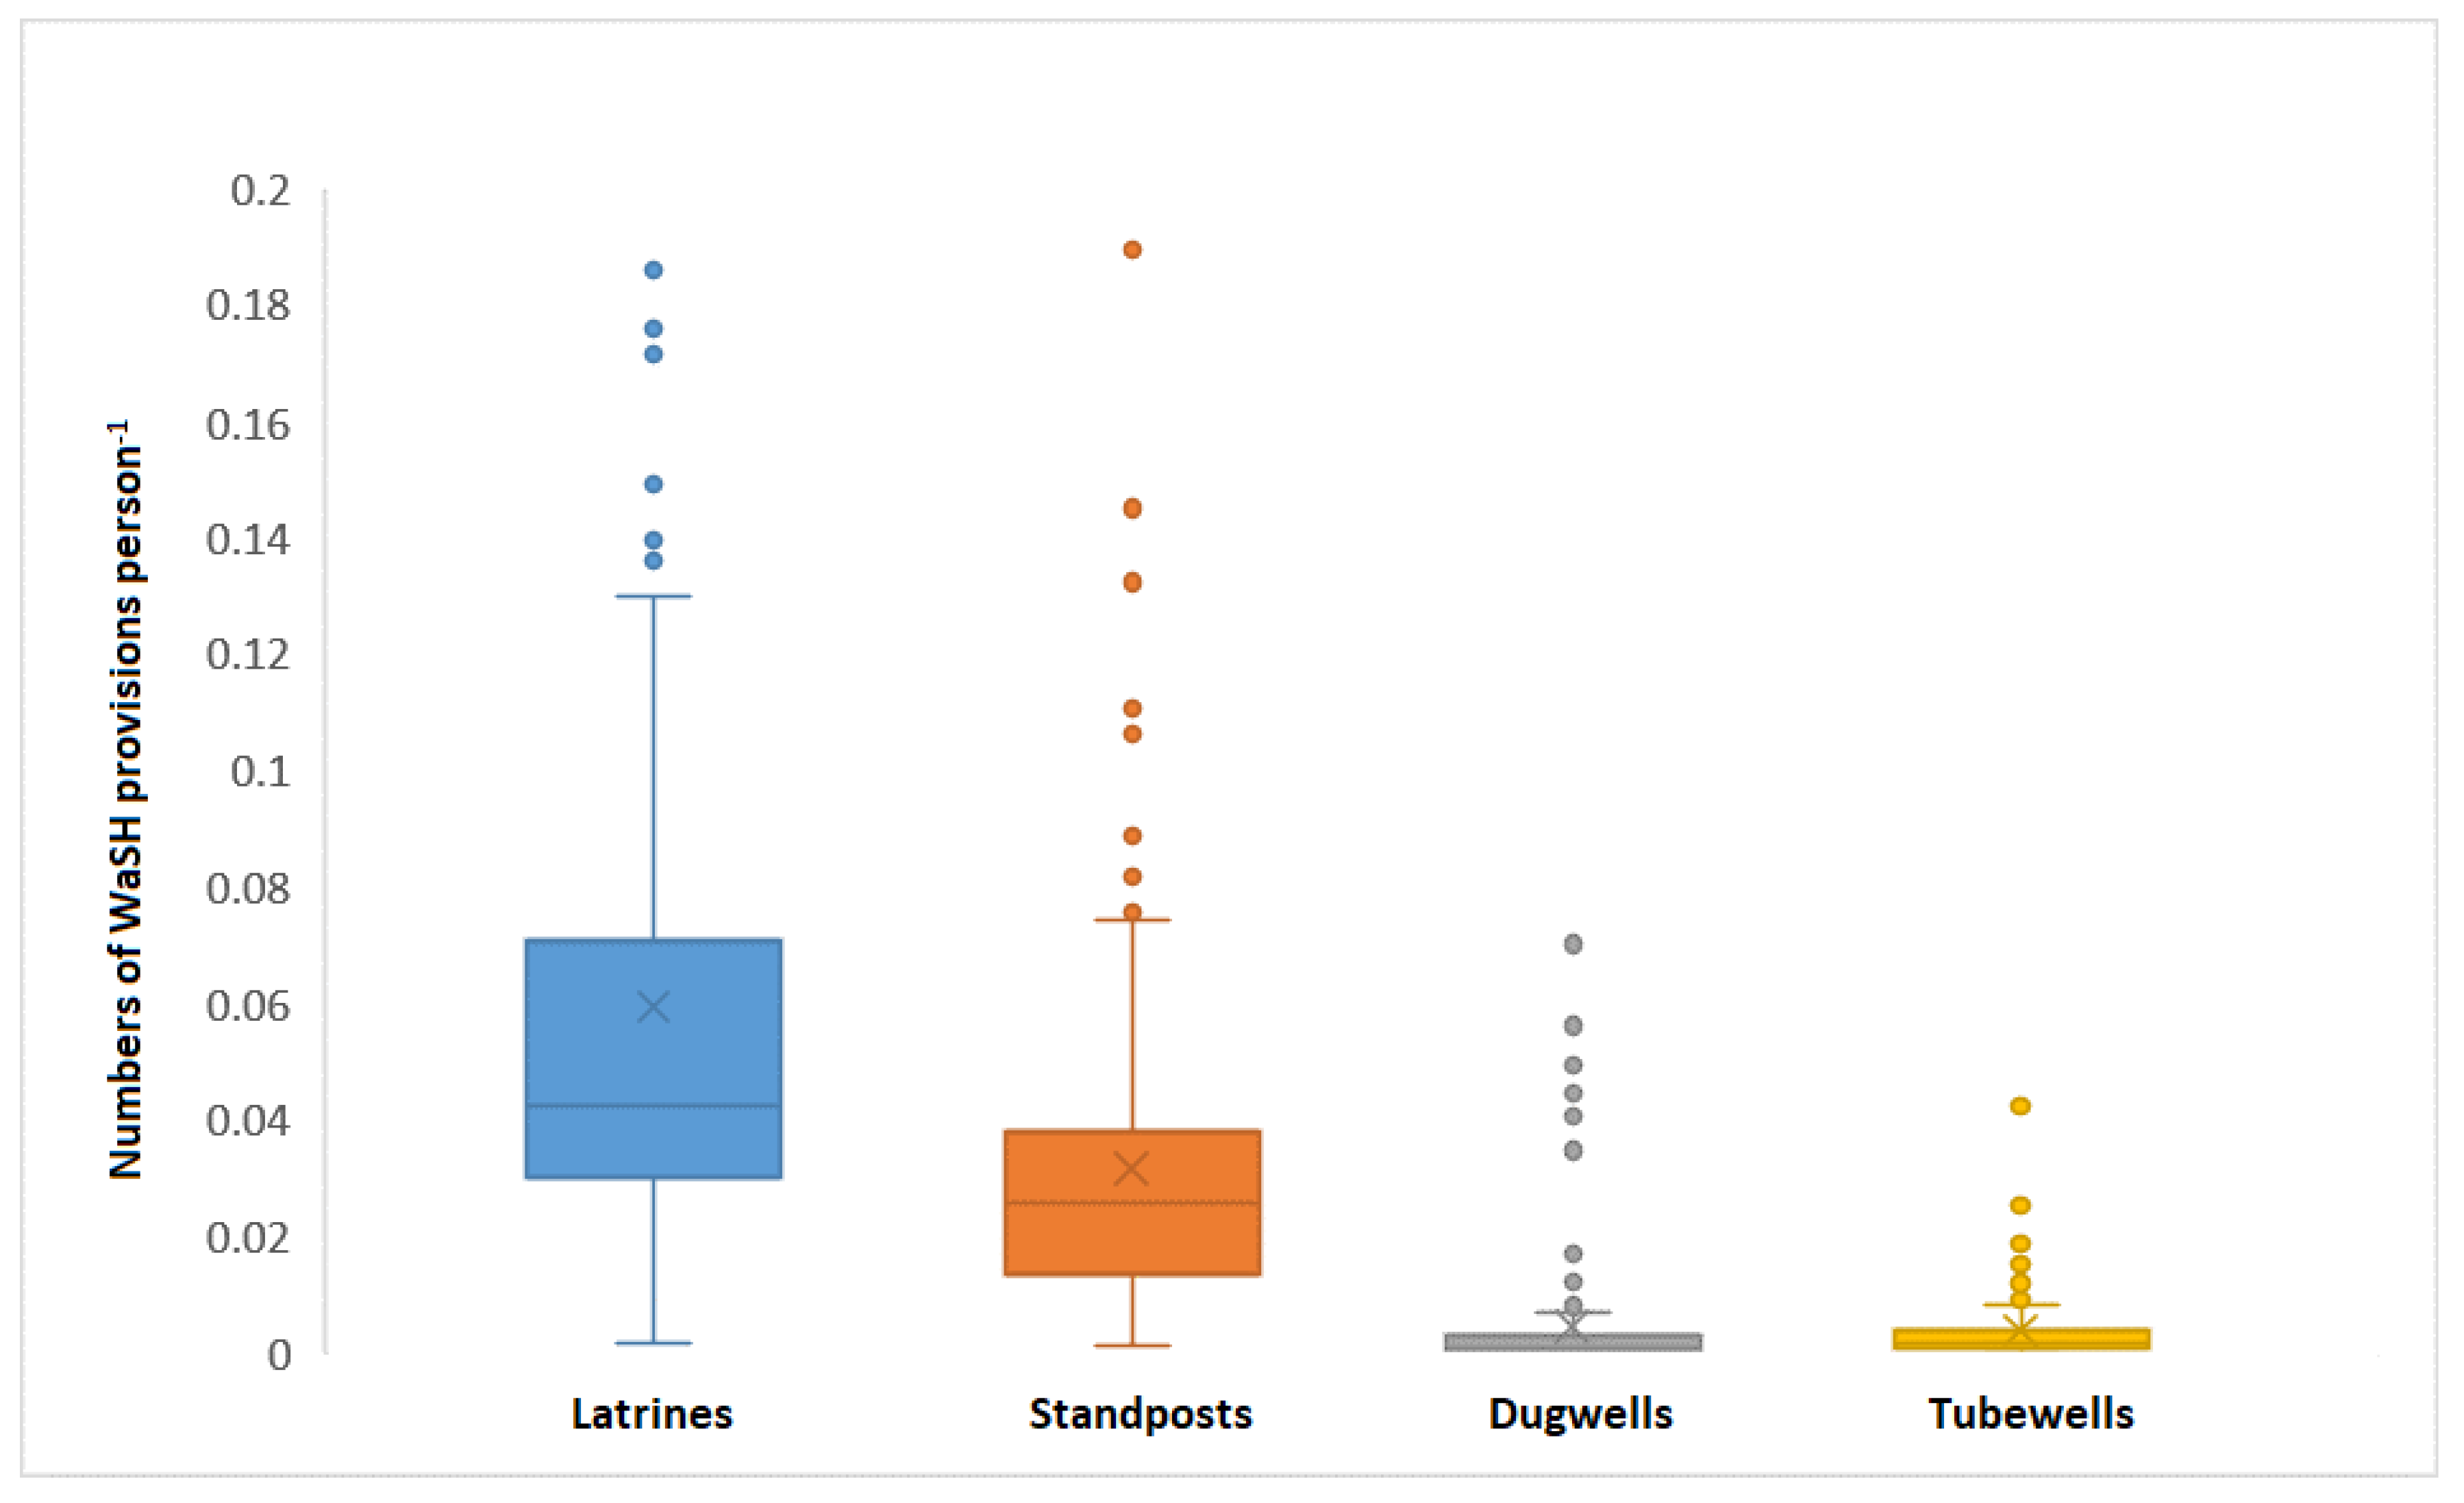
In about 75% of the slum areas less than 0.07 latrines person−1 (median = 0.042; n = 138) are available, and in about 50% of the slums, this value decreases to less than 0.04 latrines person−1 (Figure 2). In comparison, the availability of standposts is even sparser: in 50% of all slum areas, the number of standposts person−1 available range between 0.02–0.04 (median = 0.026; n = 138). In contrast, the availability of dugwells person−1 and tubewells person−1 are in general low in numbers. In case of the numbers of dugwells person−1 (median = 0.00, n = 138) and tubewells person−1 (median = 0.001, n = 138), the median is either zero or close to zero, which points out that there are many slum pockets which did not have either dugwell or tubewell.
5.2. WaSH Provisions in Slum and Non-Slum Areas of Kolkata City
Survey data from 2018 consists of samples from both slum and non-slum areas of KMC. Chi-Square Test was run to determine the relationship between the location variables ward and WaSH provisions (“Direct piped water supply to the house” and “Presence of toilets in the house”) and between “Presence of toilets in the house” and “Gender characteristics” using survey data (Table 2). The location variable ward shows significant statistical correlation to the variables direct piped water supply to the house (p = 0.000, n = 755, p < 0.01) and presence of toilets in the house (p = 0.000, n = 755, p < 0.01). Also, a statistically significant correlation occurs between presence of toilets in the house and gender characteristics of the houses surveyed (p < 0.01). The survey data show (see Appendices) that 81% of the total respondents depend on piped water supply in their houses for drinking purpose; among these respondents only 8% use the piped water supply for household works (toilet flushing, washing clothes etc.). 43% of the total respondent depend on the water from standposts outside their houses for household works (see Appendices). Piped water in the houses as well as standposts are supplied by the government (KMC authority).
The survey data reveal the differences in WaSH provisions in the city (both slum and non-slum areas) in terms of having direct piped sources of drinking water (Appendix A, Appendix B, Appendix C, Appendix D, Appendix E and Appendix F) and the presence of water flushed toilets in the houses (Appendix G, Appendix H, Appendix I, Appendix J and Appendix K). 82.3% (n = 755) respondents are of general (upper) caste and have direct water supply in the house, while 73% of the scheduled caste or scheduled tribes (SC/ST; 17.7% of the respondents) or other backward castes (OBC) have direct water supply in the houses. Within total respondents, the majority are the Bengali speakers (83.7%), among them almost 83.4% have direct water supply in their houses. In contrast, among the non-Bengali speakers 15.9% have direct water supply facilities in their houses. In case of religions, among the Hindu respondents 86.6% have direct water supply facilities in their houses. Differentiating by gender, 34.9% of the Cis-male and 25.2% of the Cis-female have direct piped water facilities in their houses, while 17% of the transsexual and 11% of the intersex respondents have direct water supply facilities in their houses. Of the respondents who work in the unorganized sector of business (it includes activities carried out by small and family enterprises, partly or wholly with family labor without any legal registration) only 2.3% have direct water supply facilities in their houses, and workers from the unorganized sectors have in 1.8% direct water supply facilities within their houses.
Analyzing the presence of flush toilet(s) in the houses of the respondents, survey findings show that c. 86% of the respondents from the general (upper) caste category have at minimum one toilet in their houses, while in the case of the lower caste people (SC/ST/OBC) only 13.6% have at minimum one toilet in their houses. 25.6% of the Cis-male and 33.7% the Cis-female have at least one toilet in their houses while only 15.9% of the transsexuals and 13.1% of the intersex respondents have at minimum one toilet in their houses. 82.8% of the Bengali-speakers and 17% of the other Indian language speakers, 86.2% of the Hindu and 10.8% of the Muslims have at least one toilet in their houses. 38% of the respondents who work in unorganized business and 69.2% of the respondents who work in the unorganized sectors do not have any toilet in their houses.
5.2.1. WaSH Provisions in Slums: Ward Wise Variation
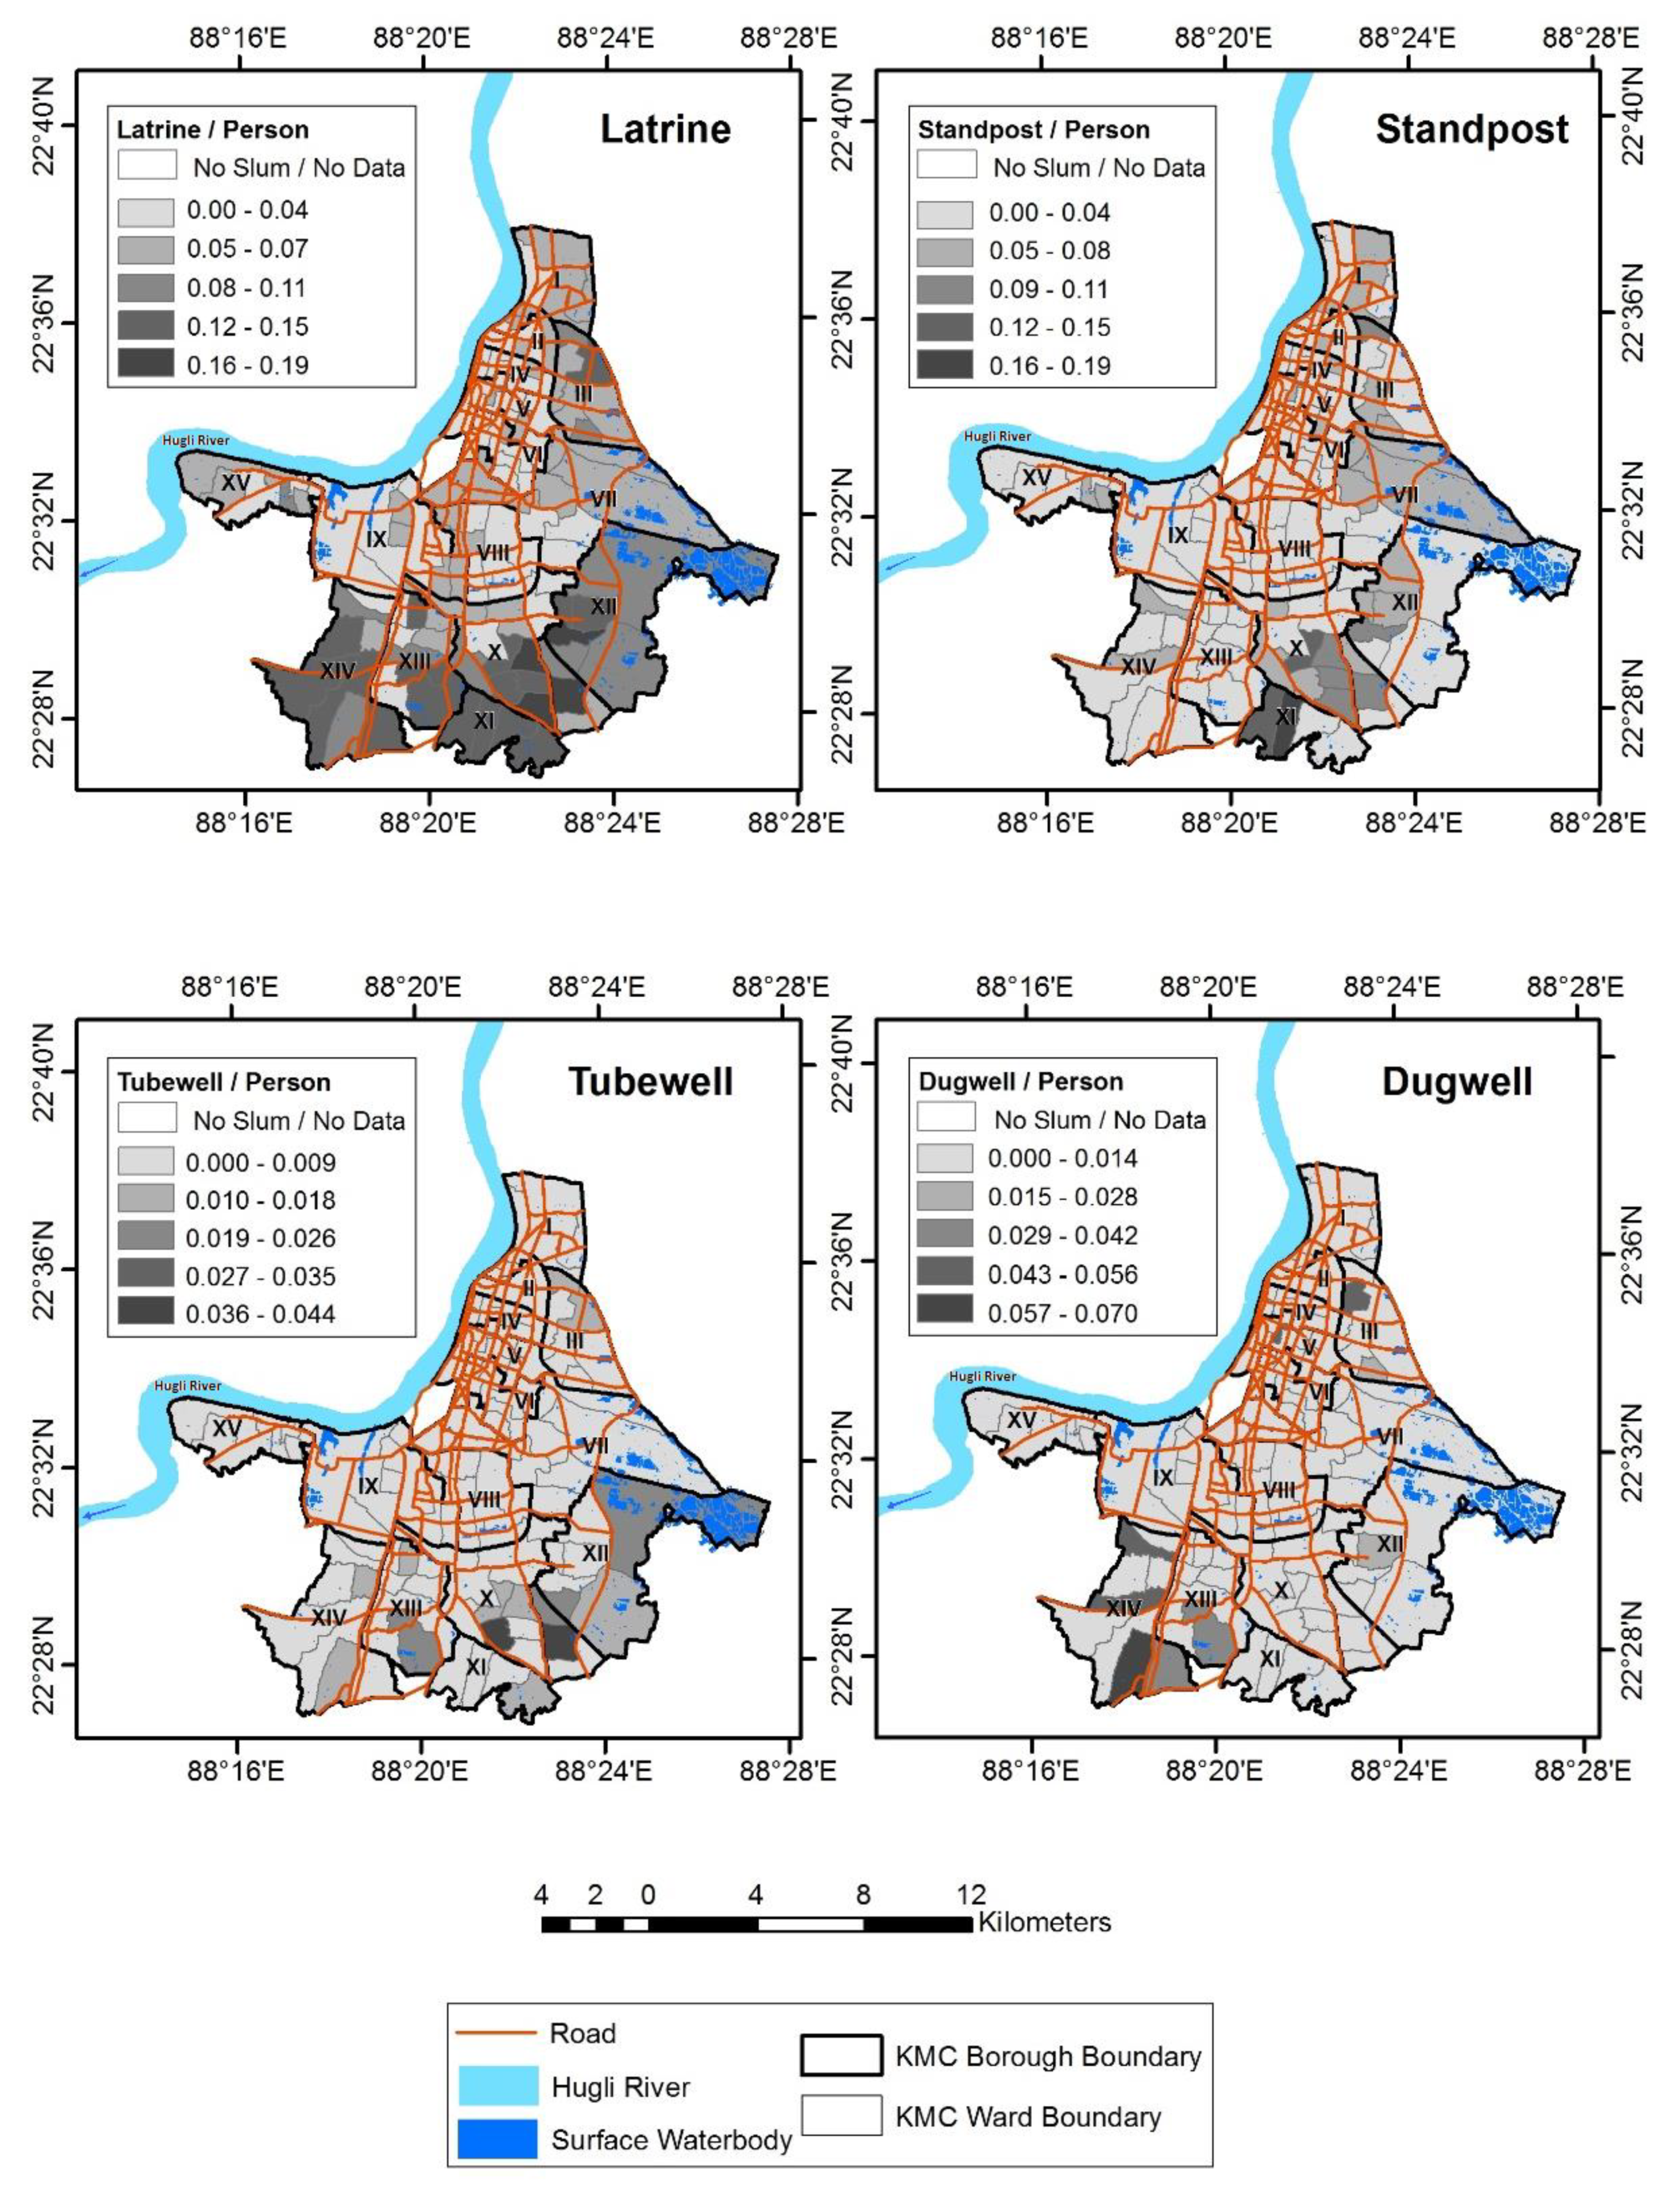
In Figure 3 the per capita WaSH provisions in slums of KMC are shown. The numbers of per capita WaSH provision vary in the slums within KMC area. Most of the slums within boroughs X-XIV have the highest number of per capita latrines. These slums are concentrated in the south and east of KMC.
The intra-borough variation in number of per capita WaSH provisions can be mainly observed in the slums of borough XII, which is located at the south-eastern corner of the city and in the slums of borough VIII, which stretches from the city center to its eastern border. In contrast, the slums located in the central and northern boroughs have lower numbers of per capita latrines than the boroughs in the south. A similar relation can be seen in the number of standposts per person (Figure 3). Additionally, intra and interborough variations of the number of standposts per person can be observed. Relatively high numbers of standposts per person mainly occur in the slums of the southern and eastern boroughs. Some wards in the center of the city show very low numbers of dugwells and tubewells but assessing this phenomenon the in total small number of dugwells and tubewells must be considered (Figure 3). It is evident, that in slums where relatively high numbers of dugwells were observed, relatively low numbers of tubewells per person were detected. Albeit insignificant in terms of number, dugwells and tubewells are still the only sources for drinking water in many slum areas within KMC area. Their distribution, hence, shows the variability of slums’ total water provision and access to sanitation and hygiene.
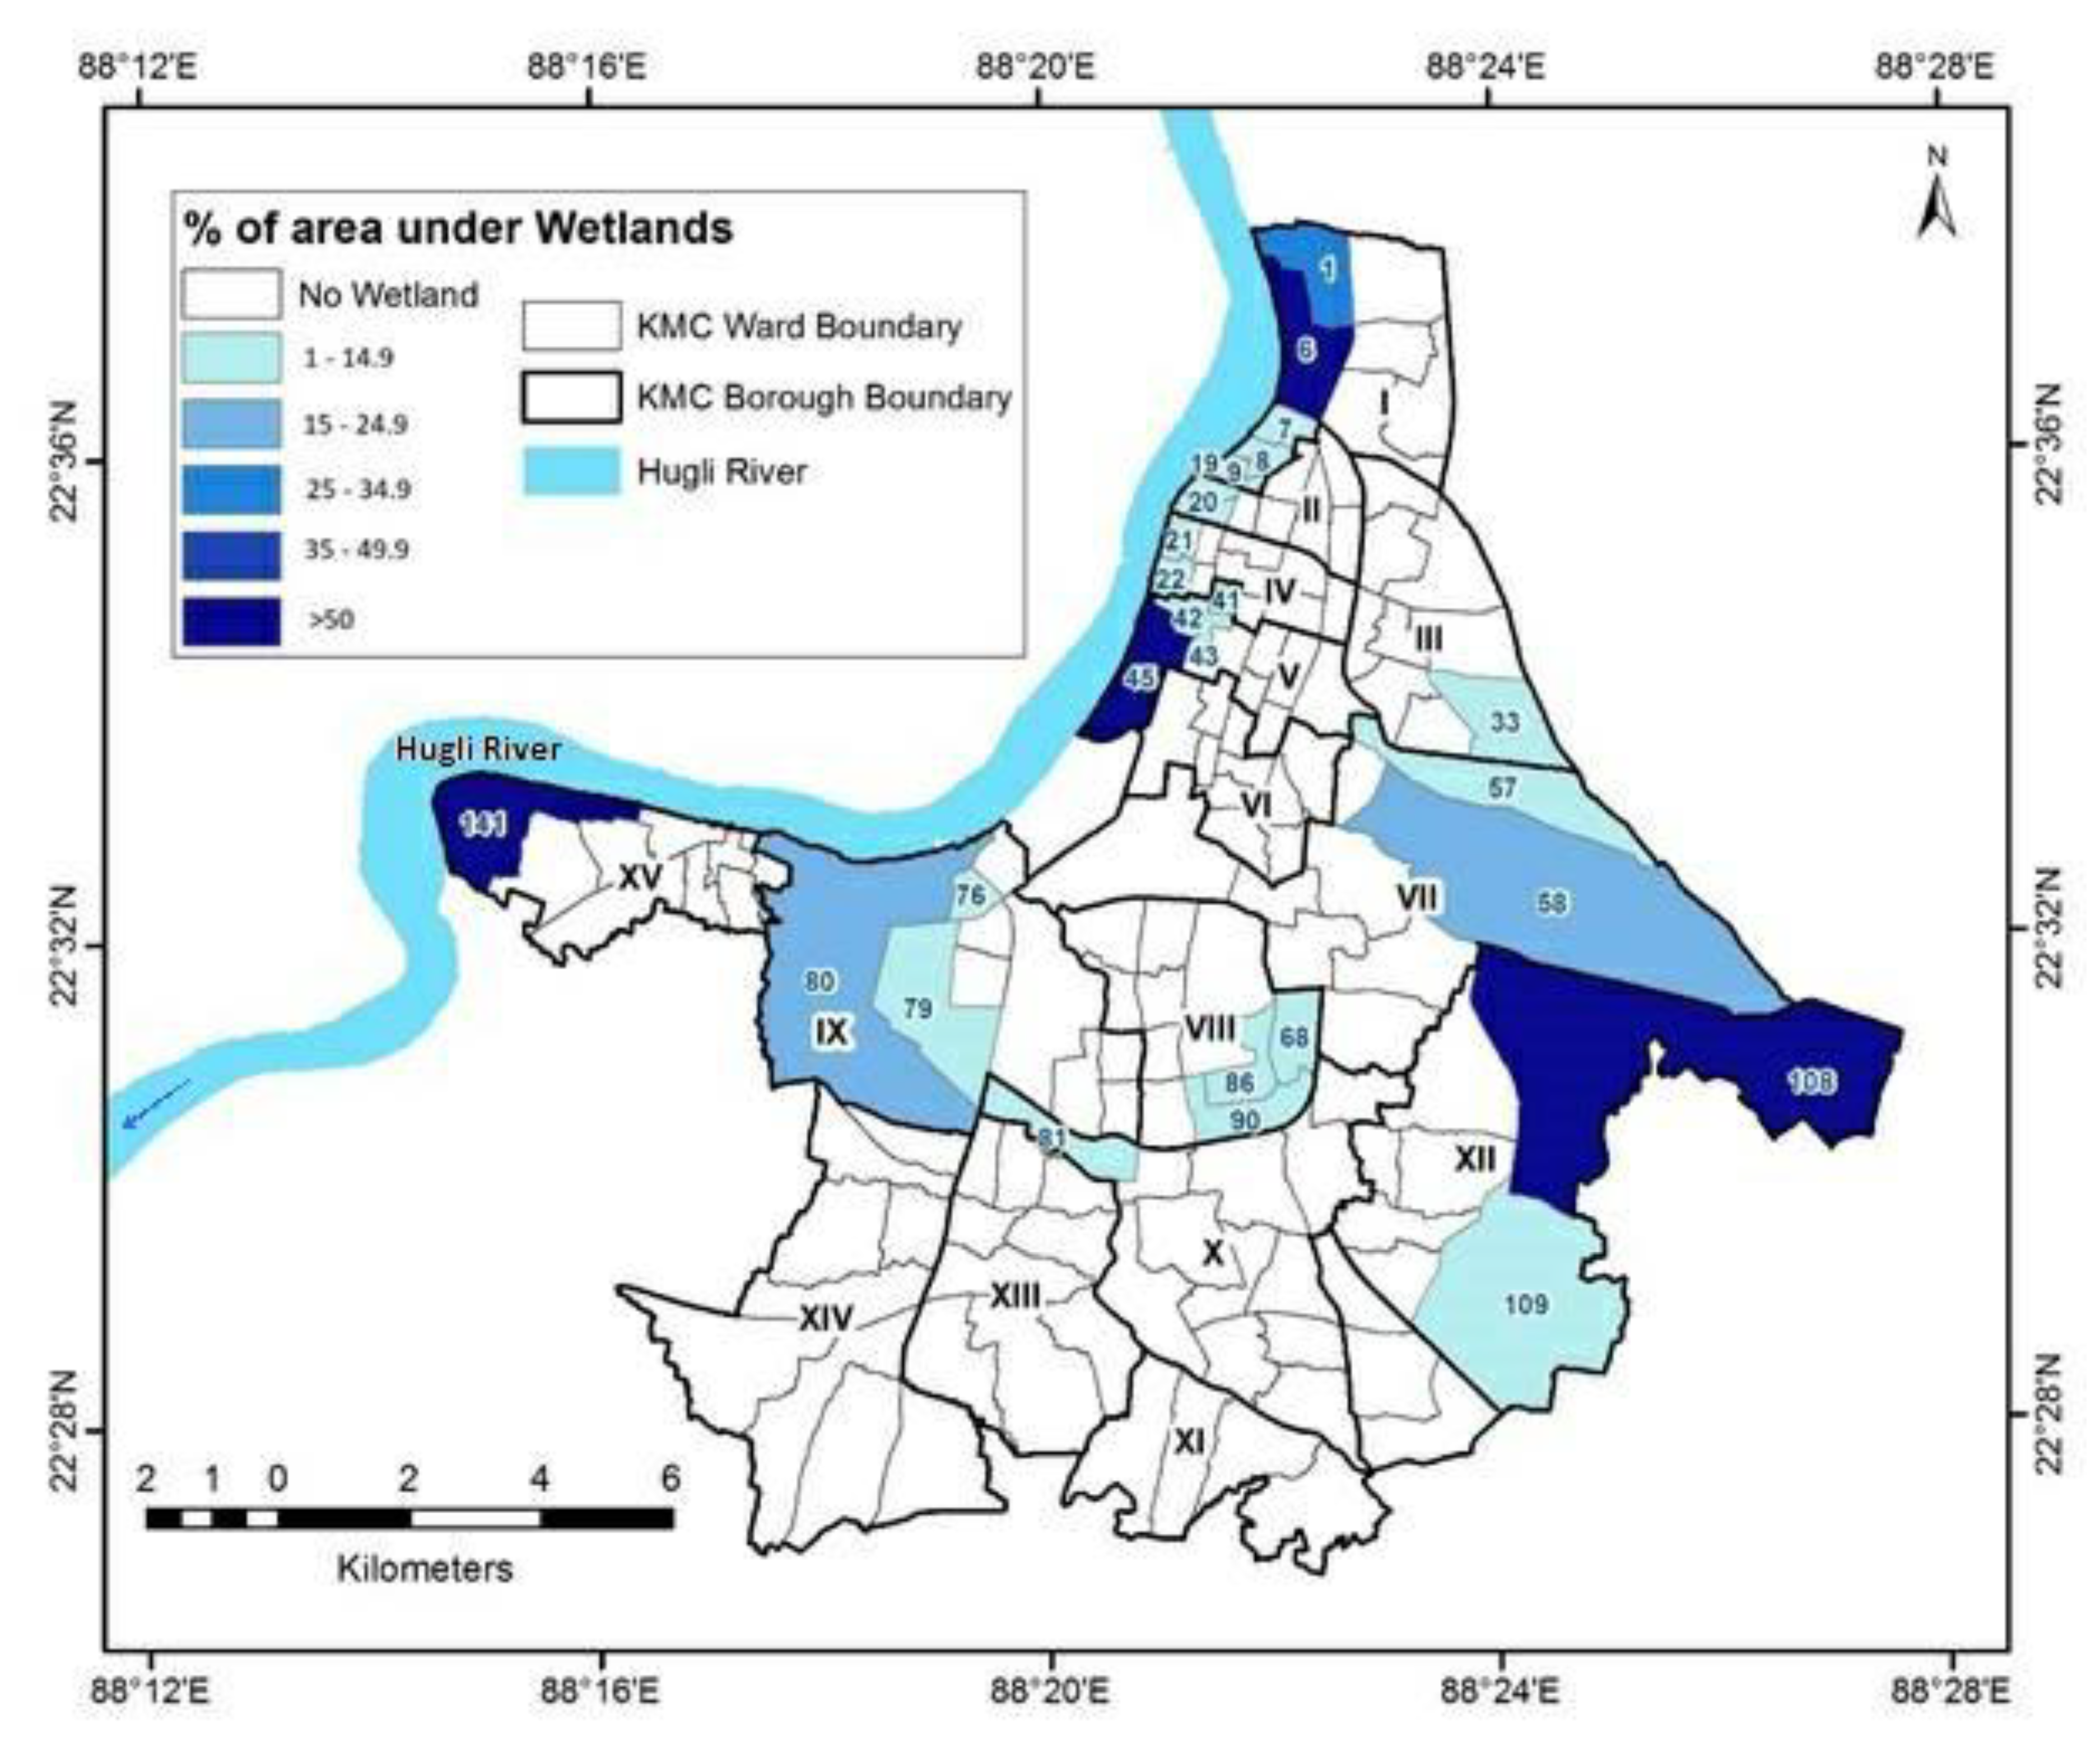
The spatial share of wetlands in each ward is mapped in Figure 4. Only four wards (wards 6, 45, 108 and 141) are covered by more than 50% by wetlands, another five wards (wards: 1, 21, 22, 58, 80) are covered by 10–50% by wetlands. In all other wards less than 10% of their area is covered by wetlands.
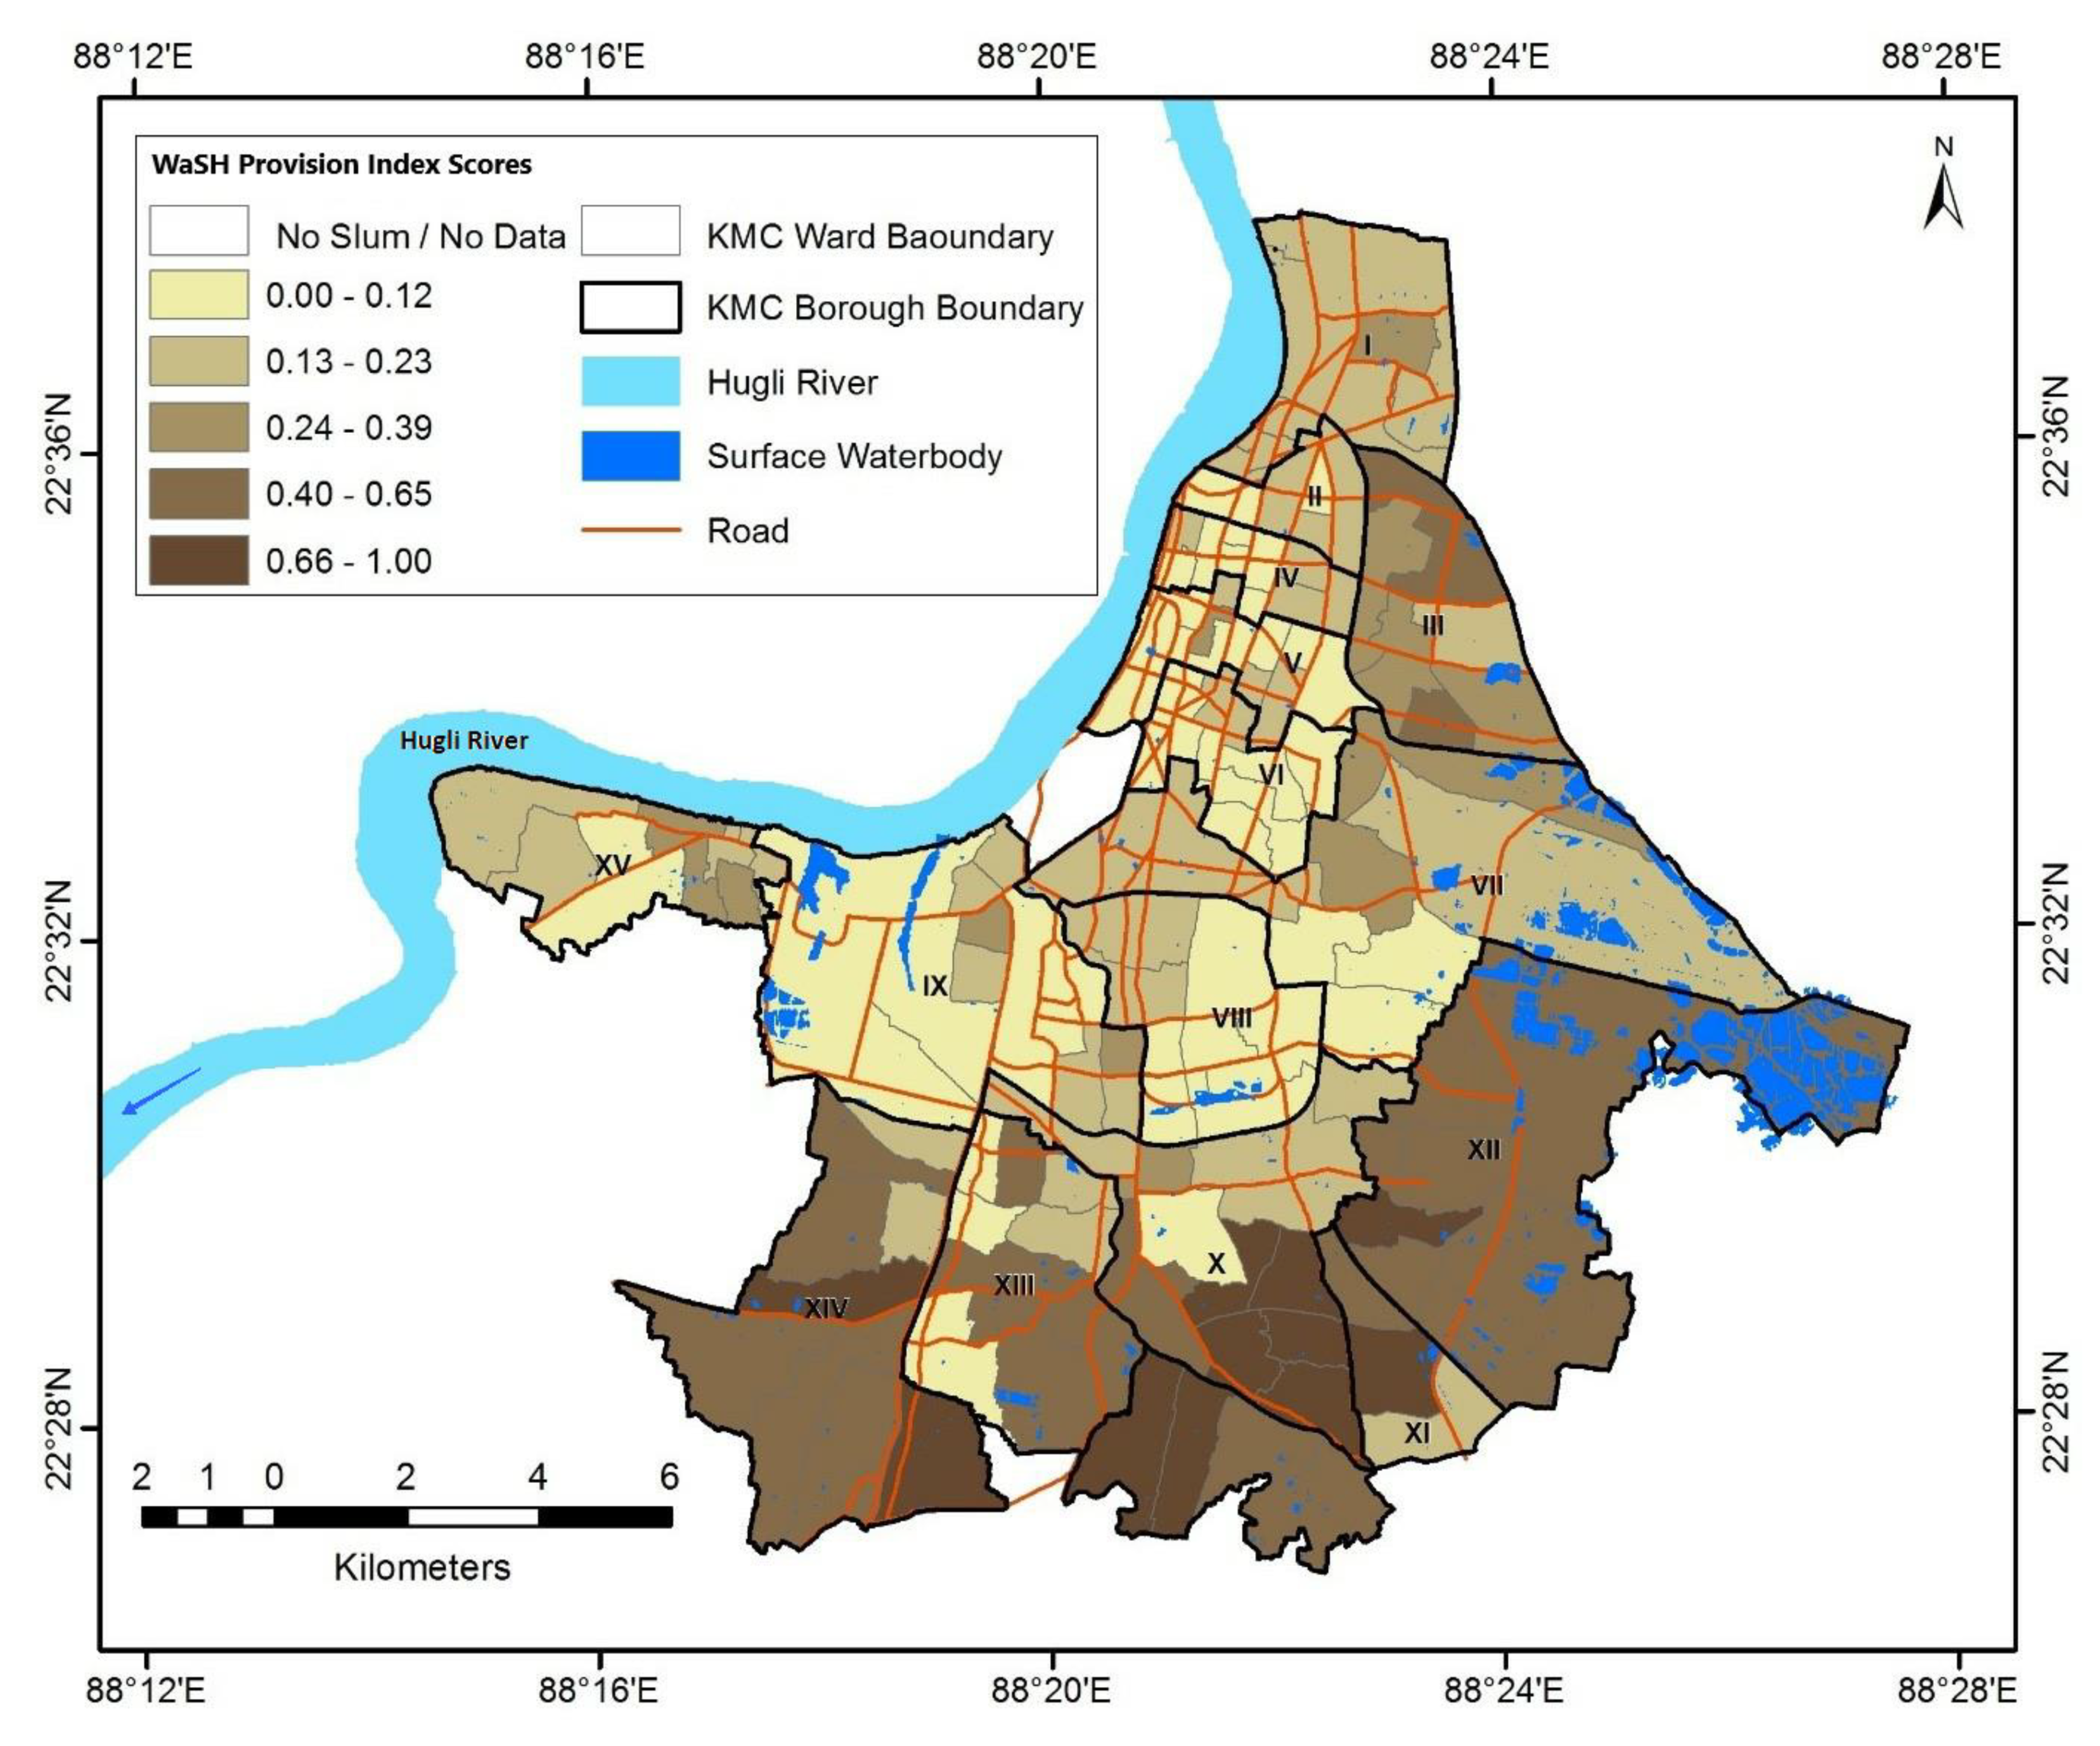
5.2.2. Ward Wise Distribution of WaSH Provision (WP) Index for Slums
The application of the WaSH provision (WP) Index shows that the slums in the peripheral boroughs of the KMC area have higher per capita WaSH provision than the centrally located boroughs. Most wards (58 out of 141) show WaSH provision (WP) Index between 0.00–0.12, which corresponds to almost zero access to WaSH provision in slums (Figure 5). Hence, the slums within 11 wards are characterized by WaSH provision (WP) Index of 0.66–1.00, which corresponds to more access to WaSH provision than the other wards within the city (Figure 5). The majority of the KMC wards show WaSH provision (WP) Index of less than 0.4. The slums located in the center of the city have the lowest WaSH provision (WP) Index.
6. Discussion
Water is a resource that activates extreme tensions and fierce struggles. In this ‘struggle for water’ those people living in deprivation and who are excluded socially, economically and politically suffer most [74,75,76,77,78]. Socio-political exclusion results in a ‘continuum of inclusion/exclusion characterized by unequal access to resources, capabilities and rights which leads to health inequalities’ ([79], p. 2). It is a complex and multi-dimensional process that involves the lack (or denial) of resources, rights, goods and services. Provision of water for human domestic use is a fundamental part of water security [59]. Rapid urban expansion is a major concern for water security [74], and many developing, and less developed countries often lack the infrastructure and basic services to ensure WaSH for the increasing number of citizens [80,81]. Unable to adequately meet the demands of the growing population, deprived areas have emerged and continue to grow in developing and less developed countries [82].
6.1. Variation in Water Security Across and Within Areas Defined as Slums in Kolkata
We have applied a water security perspective to the problems of domestic water, sanitation and hygiene (WaSH) provision in poorer or deprived areas (notified as slums) in Kolkata, using the status of WaSH provisions as the condition of water security. The results show that intersecting factors of social exclusion, social characteristics and biophysical factors influence water insecurity. Inequalities in WaSH provision along both social and biophysical dimensions are closely interrelated with and influence access, use, and control, and often translate to varying degree of lack of adequate and affordable water services for urban citizens. Urban water services do not just reflect urban inequalities present in the society, but they are also a key in reproducing socio-political, economic and spatial exclusions from water security. Inherent to this are also questions about inclusivity and equity of service provision of WaSH, and the extent by which these relate to urban dwellers’ needs and aspirations. Water deprivation and water insecurity affect marginalized urban subgroups at various scales [74]. Mapping the geographical distribution of WaSH at ward level scales help to identify deprived subgroups that would otherwise be hidden within national or state statistics. The current monitoring frameworks for the water security in terms of WaSH, internationally and Indian nationally, collect and disaggregate data by urban and rural areas. However, intra-urban inequalities, and particularly data and information on people living in deprived areas or informal settlements, deserve more attention [83,84,85,86]. Another categorization to consider is smaller administrative units, such as wards in Kolkata to understand variations in poverty—especially within wards with high levels of poverty [87]. As our results show, it is crucial to understand both inter-city and inter-ward variations to fully capture the complex issues of urban water security at play.
The Census Data of India (2011) on deprived areas (denoted as slums) of Kolkata (KMC area) reveals that almost one-third (31.35%) of the urban population live in these deprived areas of the city [37] where the income gap has widened sharply during the past three decades [88]. The most deprived areas are concentrated in the eastern and northern peripheral areas. The central areas (especially business districts) of the city either do not have slum pockets or one or two informal settlements only. The number of families vary within slums in a ward.
According to Census of India (2011) most of the households in slums within KMC use standposts (82%) for collection of water for both drinking and domestic purposes, while some use tubewell (13%) to collect drinking water mainly. Among the other sources of drinking water are dugwells located nearby the houses mostly outside their premises. These data show the sources of proliferating problems of material and social “water injustices” which prohibit the equal distribution of access water rights and water-related decision-making for the marginalised subgroups in slum areas. For example, in our study we found that the inter-ward variation of different water sources, such as standposts, tubewells and dugwells are all controlled and maintained by the KMC Authority to supply treated surface water (standposts) or direct extraction of groundwater (tubewells and dugwells).
6.2. Assessing Water Insecurity from an Exclusion Perspective for Socially Excluded Areas in Kolkata
Socio-political exclusion affects both the quality of life of individuals and the equity and cohesion of society ([30], p. 9). Due to the lack of proper WaSH provision, inequality in urban water services is argued to be a crucial factor in socially deprived areas of KMC [37]. The present study indicates that intra-city inequality in slums is a major challenge and is related to who has access too adequate WaSH provision. It suggests that the existing inequality in WaSH provisions is regardless of areas defined as slum and non-slum households, highlighting the need to move away from simple understandings of slums, towards more complex analyses that also explores the multitude of demographic and socio-economic characteristics that are related to water insecurity, as well as the variations of these in socially deprived areas often referred to as slums.
Similar to our findings, other studies also report that WaSH service deliveries vary across populations in deprived areas, and are differentiated by gender, religions, languages [82,89,90,91,92]. Further to those characteristics, most of the labours who work in unorganised sectors are forced to live in the slums [93], which are characterized by poor WaSH provisions due the lack of contributing in city’s overall economies [94,95]. In 2011, within the KMC area, 21% of households defined as slum households were without a bathing facility. The rest of them had bathing facility within a semi-permanent or temporary enclosure (sometimes without a roof) [37]. In consequence dwellers are exposed to hygiene issues, particularly for many adolescent girls and women [96,97,98]. Additionally, poor sanitation contributes to high levels of water-borne diseases like jaundice and diarrhoea among the children living in the slums [99].
Our findings confirm previous studies’ findings arguing that achieving availability and accessibility of WaSH is linked to equitable distributions of WaSH services. These services demand considerable and equitable financial allocation to the governing urban bodies. The specific allocation and expenditure of WaSH provisions as basic amenities and services are almost negligible compared to the capital-intensive big projects on urban transportation system [100,101]. Lack or poor WaSH service facilities result in unhealthy practices within and around the households defined as slum households in the cities. Social exclusion and spatial segregation of city dwellers based on socio-economic, cultural (sometimes political too) status is a primary factor related with intra-city inequality [89,102,103,104]. This is a crucial dimension to explore in future studies, as our findings show both intra- city and ward variation.
Another crucial finding in our study is that wetlands are needed in a city to secure water security. This requires combining environmental and socio-economic dimensions to fully understand urban water security. Our analysis reveals that only 6.5% of the wards have more than 10% of their areas covered by wetlands. The lack of wetlands correlates in environmental water insecurity which ultimately results in water poverty for both human and environment [25,105]. In consequence, water poverty is a multi-dimensional state of deprivation, of which lack of access to adequate water of safe quality is a key characteristic [106]. Wetland ecosystems provide cultural, provisioning, regulating and supporting services that contribute directly and indirectly to human well-being [107]. Wetlands in a city can also provide water for the people who are otherwise deprived of having a latrine or other sanitation facilities (for examples: bathing, washing clothes and cooking utensils etc.) within their premises [28,100,108].
Monitoring of disadvantaged groups can be challenging when they form a small proportion of the population and/or if they are difficult to reach through conventional household surveys or by census data. In many less developed countries, this shortage of data is linked with the use of rigid and often outdated urban planning regulations, which are usually ignored by the slum dwellers to meet their housing needs due to the poor urban governance [109]. Although, many local and national governments in developing and less developed countries are unable to implement planning regulations due to the lack of resources [110]. In addition, responses are made at the level of the household, which makes it impossible to accurately measure intra-household inequalities such as gender, age or disability [42]. In our survey we consciously included questions and training of interviewers that helped us to understand intra-household inequalities, which are frequently missing in survey and census data. To further research on water insecurities, studies need to focus on the barriers to WaSH access met by people along a multitude of constraining characteristics including people with disabilities, chronically ill and elderly people. Indicators measuring WaSH issues are one dimension of water security data analyses. Significantly, while common taps or standposts are the sources of water in all areas defined as slums, there is no report on water scarcity in metropolitan Kolkata, except at E.M. Bye Pass area [6]. On the other hand, as far as sanitation is concerned, there is no information on the Census of India (2011) dataset but according to literature and government reports conditions in the slums are poor [71]. The ratio of the number of latrines to number of slum dwellers is very low, a situation that creates water insecurity in the everyday life.
In developing countries, access to urban services often differs widely between the rich and the poor citizens, and across genders. The gender and social inequalities violate the basic human rights associated with water in urban slums of KMC. According to the Census Data of India (2011), though the majority of what is defined as slum households in KMC areas have bathing facilities (almost 80%), the enclosure is sometimes without a roof. A large section of households (21%) lack bathing facilities [37]—in consequence the dwellers are forced to bath and wash in public bathing facilities, which can lead to difficulties maintaining hygiene for certain groups, i.e., during menstruation, and this may be related to increased levels of infection and other diseases. Despite of having latrine facilities in 59% of these households (within KMC area), a very high percentage (41%) still lacks this provision [37]. Most of the slum dwellers (30%) are either forced to use the public latrines or must go to the open areas (11%). The lack of toilets exposes the dwellers of these poorer parts of the city to physical and emotional danger [21]. For example: bathing in open ponds and rivers also exposes them to risks, such as sexual harassment [21]. Special situations like pregnancy and illnesses exacerbate the problem [111,112]. The slum dwellers experience varying deprivations and risks associated with urban water insecurity, which can include a lack of durable housing, overcrowding, insufficient access to clean water, poor sanitation and hygiene facilities and threats of forced evictions [112,113].
Another vulnerable group living in areas defined as slums are trans* people. Although, none of these groups are mentioned in the Census Data of India (2011). We therefore used our survey data where we found that trans and intersex people are vulnerable to WaSH issues, whilst at the same time being understudied. Making it crucial to focus on these populations in future studies Recent studies [114,115] show that they also experience daily harassment, discrimination, prejudice and violence in relation to water and sanitation. Denial of accommodation forces them to live in remote, socially deprived areas, where WaSH provision is poor. Trans* people face a dilemma every time they must use a public toilet. Public toilets are either for men or women and transgender people are not welcome in either, since it is commonly alleged that they are seeking sex work when they visit public toilets. Also, most of the time it is reported that when they use the men’s toilet, they are subjected to sexual harassment and sexual violence. Therefore, most transgender women prefer to use the ladies’ toilet; however, they report both abuse and issues with cis women when doing so. Studying water security using gender characteristics on a gender continuum is crucial to help address gender and social inequalities related to water which violate the basic human rights associated with water. Our survey data is valuable as it helps to address the shortage of multidimensional data on water security and WaSH. This highlights a gap in data provided through national household surveys and censuses for the collection of WaSH data.
We found that gender is crucial to social exclusion and WaSH in our survey data given in the appendices (Appendix D and Appendix J), where we see that women, trans*, intersex and other are more insecure in terms of both sanitation as well as source of water. This study is the first of its kind to transgress the binary definition of gender in a representative survey combining more diverse gender indicators with biophysical and WaSH indicators—and these findings underline the importance of doing so. Thus, this study shows the relevance of a multidimensional approach, underlining that social exclusion correlates with WaSH issues within and across the city of Kolkata. An individual’s social position also is important when analyzing water insecurity [116,117], again highlighting a need for further and more complex studies combining social and biophysical data. Importantly, all of this shows us that social exclusion and water insecurity goes hand in hand, and that we need to analyze how these factors vary across and within cities and wards when we analyze urban water security, addressing and finding solutions to water and sanitation for all.
7. Conclusions
Water insecurity is a multidimensional issue along social, cultural and economic characteristics. This article forms part of a critique of those applying the concept of slum, in general, and as a fixed entity. It has been shown that social, economic and political exclusion vary within and across both, wards defined as slums as well as other wards within and across the city. Previous literature has analyzed discreet issues of water injustices in areas defined as slums, focusing on socio-economic and physical characteristics, frequently leading to a partial view of slums and related policies. However, these different issues are all interrelated at various spatial levels. Therefore, the interdisciplinary and intersectional approach applied in this article is required to fully understand the multifaceted issues influencing and shaping water security in these areas. This will help to develop appropriate policies and to improve the livelihoods of those living in deprived areas.
The article shows that there are vulnerabilities to water security in terms of WaSH in socially deprived and excluded areas; however, there are also variations within these geographical areas. We identified that within areas characterized by deprivation and social exclusion, based on ethnicity, religion, socio-economic standing and gender matters, in determining who is more water insecure. In consequence, water and sanitation experts should take not only bio-physical factors into account conducting the WaSH infrastructure planning, but how they are associated with socio-economic, cultural and demographic characteristics. Therefore, we observe multi-dimensional vulnerability to water insecurity—which should be considered in water security research.
We use social exclusion as an overarching concept to understand vulnerabilities and exposure to water insecurity in what has been defined as urban slum areas. Our findings show that we can explicate some of the variabilities in the provision of WaSH from the context of urban water security within and across areas defined as socially deprived areas within Kolkata. Water Security solutions exist that can make significant strides in combating disease and mortality, and further research should be done with an interdisciplinary, intersectional approach to understand how we can change policies, management and behaviour to secure water security. Further, creating community groups for women and other marginalised community members to learn about using point-of-use water treatment methods, decreasing pathways of contamination, and mobilizing communities to work towards sustainable clean water systems would be suggested.
Our results indicate that we need to analyze and address water security issues with a lens that appreciates across and within city and ward variations to understand water and sanitation issues. Research in water security (particularly for urban areas) needs to be focused on understanding the link between this spatial heterogeneity and water accessibility issues. This understanding is crucial for the management of current urban water systems as well as for the planning of future sustainable development. It also may help us to understand the influence of policy interventions on urban system structure and function. Cities function as a melting pot for people with differing cultural backgrounds, religions, interests, and social statuses. As our results show that ethnicity, religion and language are crucial in influencing and understanding who water-insecure, more research is needed on these aspects to fully understand the complex interactions. This is important as cities are not only growing in population but are also becoming increasingly diverse.
Our findings are crucial in showing the importance of interdisciplinary approaches to enhance understanding of the complexity of water security on the one hand. On the other, they shed important knowledge to be incorporated into to water security management and policies. It is clear that solving WaSH issues needs to address and include policies that can support marginalized groups across the gender continuum, ethnic and religions as they are particularly vulnerable to WaSH issues. Furthermore, it also shows the importance of understanding within city and within ward variations, so that policies do not solely target specific areas defined as slums, but incorporate flexible and intelligent solutions which looks at urban water security in the city as an organism, with complex divisions and relations, which cannot be solved by solving issues in only one area.
Author Contributions
Conceptualization, Methodology, Software, Validation, Formal Analysis, Investigation, Resources, Data Curation, Visualization, Writing—Original Draft Preparation, S.M.; Writing—Review & Editing, T.S., B.S.; Supervision, T.S., B.S.; Project Administration, Funding Acquisition, S.M., B.S. All authors have read and agreed to the published version of the manuscript.
Funding
We thank the German Academic Exchange Service (DAAD) who provides a fellowship to conduct this study. We thank the GeoX Network for additional supports regarding the survey data collections and interviews to organise. We also acknowledge financial support by the German Research Foundation and the Open Access Publication Fund of the Freie Universität Berlin.
Acknowledgments
We would like to thank Kai Hartmann, Department of Earth Sciences, Freie Universität Berlin, Mahalaya Chatterjee, University of Calcutta, India and Dipankar Bhattacharya, KMDA, India who provided relevant data, insight and expertise that greatly assisted the research. We are indebted to Ena Sen for her continuous assistance in Mapping. Hindol Rakhshit, data scientist, EKOR Tech Gmbh and Prajna Debnath, Junior Product Analyst, HelloFresh SE, made an important effort to initiate the discussion on the issues regarding data analysis. The authors are thankful to them for their kind and mindful contributions for this research. We would also like to thank Tapas Dey, research scholar, IIPS-India for his kind assistance in data analyses. We would also like to show our gratitude to Sougata Saha, Comtel Consultans and Infraproject Pvt Ltd., India and Surajit Kar, University of Calcutta, India for assistance with Survey and Mapping during this research, and we thank the three anonymous reviewers for their insights. The publication of this article was funded by Freie Universität Berlin.
Conflicts of Interest
The authors declare no conflict of interest. The funders had no role in the design of the study; in the collection, analyses, or interpretation of data; in the writing of the manuscript, or in the decision to publish the results.
Appendix A

Table A1.
Castes & sources of drinking water supply (based on survey data).
| Caste | Total | ||||||
|---|---|---|---|---|---|---|---|
| General | SC/ST/OBC | Tribal | NA | ||||
| Source of Water | Direct Piped-water supply by Corporation to the house | Count | 535 | 73 | 0 | 2 | 610 |
| % within Source of Water | 87.7% | 12.0% | 0.0% | 0.3% | 100.0% | ||
| % within Caste | 82.3% | 73.0% | 0.0% | 50.0% | 80.8% | ||
| Standpost outside the houses | Count | 53 | 18 | 0 | 2 | 73 | |
| % within Source of Water | 72.6% | 24.7% | 0.0% | 2.7% | 100.0% | ||
| % within Caste | 8.2% | 18.0% | 0.0% | 50.0% | 9.7% | ||
| Dugwell/Tubewell | Count | 3 | 1 | 0 | 0 | 4 | |
| % within Source of Water | 75.0% | 25.0% | 0.0% | 0.0% | 100.0% | ||
| % within Caste | 0.5% | 1.0% | 0.0% | 0.0% | 0.5% | ||
| Waterbody nearby | Count | 1 | 1 | 0 | 0 | 2 | |
| % within Source of Water | 50.0% | 50.0% | 0.0% | 0.0% | 100.0% | ||
| % within Caste | 0.2% | 1.0% | 0.0% | 0.0% | 0.3% | ||
| Other | Count | 48 | 4 | 1 | 0 | 53 | |
| % within Source of Water | 90.6% | 7.5% | 1.9% | 0.0% | 100.0% | ||
| % within Caste | 7.4% | 4.0% | 100.0% | 0.0% | 7.0% | ||
| NA | Count | 10 | 3 | 0 | 0 | 13 | |
| % within Source of Water | 76.9% | 23.1% | 0.0% | 0.0% | 100.0% | ||
| % within Caste | 1.5% | 3.0% | 0.0% | 0.0% | 1.7% | ||
| Total | Count | 650 | 100 | 1 | 4 | 755 | |
| % within Source of Water | 86.1% | 13.2% | 0.1% | 0.5% | 100.0% | ||
| % within Caste | 100.0% | 100.0% | 100.0% | 100.0% | 100.0% | ||
Appendix B
Table A2.
Ethnic groups & sources of drinking water supply (based on survey data).
| Ethnic group (Based on Main Language Spoken) | Total | ||||||
|---|---|---|---|---|---|---|---|
| Bengali | Other Indian | non-Indian | NA | ||||
| Source of Water | Direct Piped-water supply by Corporation to the house | Count | 509 | 97 | 1 | 3 | 610 |
| % within Source of Water | 83.4% | 15.9% | 0.2% | 0.5% | 100.0% | ||
| % within Ethnic group | 83.7% | 68.8% | 50.0% | 75.0% | 80.8% | ||
| Standpost outside the houses | Count | 39 | 33 | 0 | 1 | 73 | |
| % within Source of Water | 53.4% | 45.2% | 0.0% | 1.4% | 100.0% | ||
| % within Ethnic group | 6.4% | 23.4% | 0.0% | 25.0% | 9.7% | ||
| Dugwell/Tubewell | Count | 3 | 0 | 1 | 0 | 4 | |
| % within Source of Water | 75.0% | 0.0% | 25.0% | 0.0% | 100.0% | ||
| % within Ethnic group | 0.5% | 0.0% | 50.0% | 0.0% | 0.5% | ||
| Waterbody nearby | Count | 1 | 1 | 0 | 0 | 2 | |
| % within Source of Water | 50.0% | 50.0% | 0.0% | 0.0% | 100.0% | ||
| % within Ethnic group | 0.2% | 0.7% | 0.0% | 0.0% | 0.3% | ||
| Other | Count | 46 | 7 | 0 | 0 | 53 | |
| % within Source of Water | 86.8% | 13.2% | 0.0% | 0.0% | 100.0% | ||
| % within Ethnic group | 7.6% | 5.0% | 0.0% | 0.0% | 7.0% | ||
| NA | Count | 10 | 3 | 0 | 0 | 13 | |
| % within Source of Water | 76.9% | 23.1% | 0.0% | 0.0% | 100.0% | ||
| % within Ethnic group | 1.6% | 2.1% | 0.0% | 0.0% | 1.7% | ||
| Total | Count | 608 | 141 | 2 | 4 | 755 | |
| % within Source of Water | 80.5% | 18.7% | 0.3% | 0.5% | 100.0% | ||
| % within Ethnic group | 100.0% | 100.0% | 100.0% | 100.0% | 100.0% | ||
Appendix C
Table A3.
Religion and sources of drinking water supply (based on survey data).
| Religion | Total | ||||||
|---|---|---|---|---|---|---|---|
| Hindu | Muslim | Other | NA | ||||
| Source of Water | Direct Piped-water supply by Corporation to the house | Count | 528 | 56 | 23 | 3 | 610 |
| % within Source of Water | 86.6% | 9.2% | 3.8% | 0.5% | 100.0% | ||
| % within Religion | 82.4% | 70.0% | 79.3% | 60.0% | 80.8% | ||
| Standpost outside the houses | Count | 60 | 7 | 5 | 1 | 73 | |
| % within Source of Water | 82.2% | 9.6% | 6.8% | 1.4% | 100.0% | ||
| % within Religion | 9.4% | 8.8% | 17.2% | 20.0% | 9.7% | ||
| Dugwell/Tubewell | Count | 3 | 0 | 0 | 1 | 4 | |
| % within Source of Water | 75.0% | 0.0% | 0.0% | 25.0% | 100.0% | ||
| % within Religion | 0.5% | 0.0% | 0.0% | 20.0% | 0.5% | ||
| Waterbody nearby | Count | 1 | 1 | 0 | 0 | 2 | |
| % within Source of Water | 50.0% | 50.0% | 0.0% | 0.0% | 100.0% | ||
| % within Religion | 0.2% | 1.3% | 0.0% | 0.0% | 0.3% | ||
| Other | Count | 40 | 12 | 1 | 0 | 53 | |
| % within Source of Water | 75.5% | 22.6% | 1.9% | 0.0% | 100.0% | ||
| % within Religion | 6.2% | 15.0% | 3.4% | 0.0% | 7.0% | ||
| NA | Count | 9 | 4 | 0 | 0 | 13 | |
| % within Source of Water | 69.2% | 30.8% | 0.0% | 0.0% | 100.0% | ||
| % within Religion | 1.4% | 5.0% | 0.0% | 0.0% | 1.7% | ||
| Total | Count | 641 | 80 | 29 | 5 | 755 | |
| % within Source of Water | 84.9% | 10.6% | 3.8% | 0.7% | 100.0% | ||
| % within Religion | 100.0% | 100.0% | 100.0% | 100.0% | 100.0% | ||
Appendix D
Table A4.
Gender and sources of drinking water supply (based on survey data).
| Gender of the Respondent | Total | ||||||||||
|---|---|---|---|---|---|---|---|---|---|---|---|
| Female | Male | Trans | Intersex | Other | 5 | 7 | NA | ||||
| Source of Water | Direct Piped-water supply by Corporation to the house | Count | 153 | 212 | 103 | 70 | 35 | 1 | 1 | 32 | 607 |
| % within Source of Water | 25.2% | 34.9% | 17.0% | 11.5% | 5.8% | 0.2% | 0.2% | 5.3% | 100.0% | ||
| % within Gender of the respondent | 74.3% | 79.4% | 85.1% | 87.5% | 94.6% | 100.0% | 100.0% | 82.1% | 80.7% | ||
| Standpost outside the houses | Count | 20 | 31 | 13 | 6 | 0 | 0 | 0 | 3 | 73 | |
| % within Source of Water | 27.4% | 42.5% | 17.8% | 8.2% | 0.0% | 0.0% | 0.0% | 4.1% | 100.0% | ||
| % within Gender of the respondent | 9.7% | 11.6% | 10.7% | 7.5% | 0.0% | 0.0% | 0.0% | 7.7% | 9.7% | ||
| Dugwell/Tubewell | Count | 0 | 2 | 1 | 1 | 0 | 0 | 0 | 0 | 4 | |
| % within Source of Water | 0.0% | 50.0% | 25.0% | 25.0% | 0.0% | 0.0% | 0.0% | 0.0% | 100.0% | ||
| % within Gender of the respondent | 0.0% | 0.7% | 0.8% | 1.3% | 0.0% | 0.0% | 0.0% | 0.0% | 0.5% | ||
| Waterbody nearby | Count | 0 | 0 | 2 | 0 | 0 | 0 | 0 | 0 | 2 | |
| % within Source of Water | 0.0% | 0.0% | 100.0% | 0.0% | 0.0% | 0.0% | 0.0% | 0.0% | 100.0% | ||
| % within Gender of the respondent | 0.0% | 0.0% | 1.7% | 0.0% | 0.0% | 0.0% | 0.0% | 0.0% | 0.3% | ||
| Other | Count | 26 | 20 | 1 | 1 | 2 | 0 | 0 | 3 | 53 | |
| % within Source of Water | 49.1% | 37.7% | 1.9% | 1.9% | 3.8% | 0.0% | 0.0% | 5.7% | 100.0% | ||
| % within Gender of the respondent | 12.6% | 7.5% | 0.8% | 1.3% | 5.4% | 0.0% | 0.0% | 7.7% | 7.0% | ||
| NA | Count | 7 | 2 | 1 | 2 | 0 | 0 | 0 | 1 | 13 | |
| % within Source of Water | 53.8% | 15.4% | 7.7% | 15.4% | 0.0% | 0.0% | 0.0% | 7.7% | 100.0% | ||
| % within Gender of the respondent | 3.4% | 0.7% | 0.8% | 2.5% | 0.0% | 0.0% | 0.0% | 2.6% | 1.7% | ||
| Total | Count | 206 | 267 | 121 | 80 | 37 | 1 | 1 | 39 | 752 | |
| % within Source of Water | 27.4% | 35.5% | 16.1% | 10.6% | 4.9% | 0.1% | 0.1% | 5.2% | 100.0% | ||
| % within Gender of the respondent | 100.0% | 100.0% | 100.0% | 100.0% | 100.0% | 100.0% | 100.0% | 100.0% | 100.0% | ||
Appendix E
Table A5.
Levels of education and sources of drinking water supply (based on survey data).
| Highest Level of Education | Total | ||||||||
|---|---|---|---|---|---|---|---|---|---|
| Primary Education | Secondary Education | College | Postgrad | 8th | 666 | ||||
| Source of Water | Direct Piped-water supply by Corporation to the house | Count | 115 | 212 | 212 | 61 | 1 | 8 | 609 |
| % within Source of Water | 18.9% | 34.8% | 34.8% | 10.0% | 0.2% | 1.3% | 100.0% | ||
| % within highest level of education | 72.3% | 87.6% | 80.6% | 83.6% | 33.3% | 57.1% | 80.8% | ||
| Standpost outside the houses | Count | 34 | 16 | 15 | 3 | 0 | 5 | 73 | |
| % within Source of Water | 46.6% | 21.9% | 20.5% | 4.1% | 0.0% | 6.8% | 100.0% | ||
| % within highest level of education | 21.4% | 6.6% | 5.7% | 4.1% | 0.0% | 35.7% | 9.7% | ||
| Dugwell/Tubewell | Count | 0 | 2 | 0 | 1 | 1 | 0 | 4 | |
| % within Source of Water | 0.0% | 50.0% | 0.0% | 25.0% | 25.0% | 0.0% | 100.0% | ||
| % within highest level of education | 0.0% | 0.8% | 0.0% | 1.4% | 33.3% | 0.0% | 0.5% | ||
| Waterbody nearby | Count | 0 | 0 | 0 | 2 | 0 | 0 | 2 | |
| % within Source of Water | 0.0% | 0.0% | 0.0% | 100.0% | 0.0% | 0.0% | 100.0% | ||
| % within highest level of education | 0.0% | 0.0% | 0.0% | 2.7% | 0.0% | 0.0% | 0.3% | ||
| Other | Count | 7 | 9 | 31 | 4 | 1 | 1 | 53 | |
| % within Source of Water | 13.2% | 17.0% | 58.5% | 7.5% | 1.9% | 1.9% | 100.0% | ||
| % within highest level of education | 4.4% | 3.7% | 11.8% | 5.5% | 33.3% | 7.1% | 7.0% | ||
| NA | Count | 3 | 3 | 5 | 2 | 0 | 0 | 13 | |
| % within Source of Water | 23.1% | 23.1% | 38.5% | 15.4% | 0.0% | 0.0% | 100.0% | ||
| % within highest level of education | 1.9% | 1.2% | 1.9% | 2.7% | 0.0% | 0.0% | 1.7% | ||
| Total | Count | 159 | 242 | 263 | 73 | 3 | 14 | 754 | |
| % within Source of Water | 21.1% | 32.1% | 34.9% | 9.7% | 0.4% | 1.9% | 100.0% | ||
| % within highest level of education | 100.0% | 100.0% | 100.0% | 100.0% | 100.0% | 100.0% | 100.0% | ||
Appendix F
Table A6.
Occupation and sources of drinking water supply (based on survey data).
| Occupation | Total | ||||||||||||||||
|---|---|---|---|---|---|---|---|---|---|---|---|---|---|---|---|---|---|
| Job—Undefined | Job Organised | Job Unorganised | Business—Undefined | Business Organised | Business Unorganised | StudentUndefined | School | College | University | Household | Household | Other | NA | ||||
| Source of Water | Direct Piped-water supply by Corporation to the house | Count | 8 | 127 | 11 | 2 | 108 | 14 | 1 | 21 | 41 | 11 | 228 | 1 | 25 | 11 | 609 |
| % within Source of Water | 1.3% | 20.9% | 1.8% | 0.3% | 17.7% | 2.3% | 0.2% | 3.4% | 6.7% | 1.8% | 37.4% | 0.2% | 4.1% | 1.8% | 100.0% | ||
| % within Occupation | 80.0% | 83.0% | 84.6% | 100.0% | 80.0% | 53.8% | 100.0% | 100.0% | 85.4% | 73.3% | 82.3% | 100.0% | 83.3% | 50.0% | 80.8% | ||
| Standpost outside the houses | Count | 0 | 8 | 2 | 0 | 9 | 11 | 0 | 0 | 2 | 2 | 28 | 0 | 2 | 9 | 73 | |
| % within Source of Water | 0.0% | 11.0% | 2.7% | 0.0% | 12.3% | 15.1% | 0.0% | 0.0% | 2.7% | 2.7% | 38.4% | 0.0% | 2.7% | 12.3% | 100.0% | ||
| % within Occupation | 0.0% | 5.2% | 15.4% | 0.0% | 6.7% | 42.3% | 0.0% | 0.0% | 4.2% | 13.3% | 10.1% | 0.0% | 6.7% | 40.9% | 9.7% | ||
| Dugwell/Tubewell | Count | 0 | 0 | 0 | 0 | 2 | 0 | 0 | 0 | 0 | 0 | 0 | 0 | 1 | 1 | 4 | |
| % within Source of Water | 0.0% | 0.0% | 0.0% | 0.0% | 50.0% | 0.0% | 0.0% | 0.0% | 0.0% | 0.0% | 0.0% | 0.0% | 25.0% | 25.0% | 100.0% | ||
| % within Occupation | 0.0% | 0.0% | 0.0% | 0.0% | 1.5% | 0.0% | 0.0% | 0.0% | 0.0% | 0.0% | 0.0% | 0.0% | 3.3% | 4.5% | 0.5% | ||
| Waterbody nearby | Count | 0 | 1 | 0 | 0 | 0 | 0 | 0 | 0 | 0 | 0 | 0 | 0 | 0 | 1 | 2 | |
| % within Source of Water | 0.0% | 50.0% | 0.0% | 0.0% | 0.0% | 0.0% | 0.0% | 0.0% | 0.0% | 0.0% | 0.0% | 0.0% | 0.0% | 50.0% | 100.0% | ||
| % within Occupation | 0.0% | 0.7% | 0.0% | 0.0% | 0.0% | 0.0% | 0.0% | 0.0% | 0.0% | 0.0% | 0.0% | 0.0% | 0.0% | 4.5% | 0.3% | ||
| Other | Count | 1 | 13 | 0 | 0 | 14 | 1 | 0 | 0 | 5 | 2 | 15 | 0 | 2 | 0 | 53 | |
| % within Source of Water | 1.9% | 24.5% | 0.0% | 0.0% | 26.4% | 1.9% | 0.0% | 0.0% | 9.4% | 3.8% | 28.3% | 0.0% | 3.8% | 0.0% | 100.0% | ||
| % within Occupation | 10.0% | 8.5% | 0.0% | 0.0% | 10.4% | 3.8% | 0.0% | 0.0% | 10.4% | 13.3% | 5.4% | 0.0% | 6.7% | 0.0% | 7.0% | ||
| NA | Count | 1 | 4 | 0 | 0 | 2 | 0 | 0 | 0 | 0 | 0 | 6 | 0 | 0 | 0 | 13 | |
| % within Source of Water | 7.7% | 30.8% | 0.0% | 0.0% | 15.4% | 0.0% | 0.0% | 0.0% | 0.0% | 0.0% | 46.2% | 0.0% | 0.0% | 0.0% | 100.0% | ||
| % within Occupation | 10.0% | 2.6% | 0.0% | 0.0% | 1.5% | 0.0% | 0.0% | 0.0% | 0.0% | 0.0% | 2.2% | 0.0% | 0.0% | 0.0% | 1.7% | ||
| Total | Count | 10 | 153 | 13 | 2 | 135 | 26 | 1 | 21 | 48 | 15 | 277 | 1 | 30 | 22 | 754 | |
| % within Source of Water | 1.3% | 20.3% | 1.7% | 0.3% | 17.9% | 3.4% | 0.1% | 2.8% | 6.4% | 2.0% | 36.7% | 0.1% | 4.0% | 2.9% | 100.0% | ||
| % within Occupation | 100.0% | 100.0% | 100.0% | 100.0% | 100.0% | 100.0% | 100.0% | 100.0% | 100.0% | 100.0% | 100.0% | 100.0% | 100.0% | 100.0% | 100.0% | ||
Appendix G
Table A7.
Caste and presence of toilet in the house (based on survey data).
| Caste | Total | ||||||
|---|---|---|---|---|---|---|---|
| General | SC/ST/OBC | Tribal | 666 | ||||
| Presence of toilet in the house (Y/N) | Yes | Count | 455 | 72 | 0 | 2 | 529 |
| % within Presence of toilet in the house (Y/N) | 86.0% | 13.6% | 0.0% | 0.4% | 100.0% | ||
| % within Caste | 70.0% | 71.3% | 0.0% | 50.0% | 70.0% | ||
| No | Count | 136 | 20 | 0 | 0 | 156 | |
| % within Presence of toilet in the house (Y/N) | 87.2% | 12.8% | 0.0% | 0.0% | 100.0% | ||
| % within Caste | 20.9% | 19.8% | 0.0% | 0.0% | 20.6% | ||
| NA | Count | 59 | 9 | 1 | 2 | 71 | |
| % within Presence of toilet in the house (Y/N) | 83.1% | 12.7% | 1.4% | 2.8% | 100.0% | ||
| % within Caste | 9.1% | 8.9% | 100.0% | 50.0% | 9.4% | ||
| Total | Count | 650 | 101 | 1 | 4 | 756 | |
| % within Presence of toilet in the house (Y/N) | 86.0% | 13.4% | 0.1% | 0.5% | 100.0% | ||
| % within Caste | 100.0% | 100.0% | 100.0% | 100.0% | 100.0% | ||
Appendix H
Table A8.
Ethnic groups and presence of toilet in the house (based on survey data).
| Ethnic Group (Based on Main Language Spoken) | Total | ||||||
|---|---|---|---|---|---|---|---|
| Bengali | Other Indian | Non-Indian | NA | ||||
| Presence of toilet in the house (Y/N) | Yes | Count | 438 | 90 | 0 | 1 | 529 |
| % within Presence of toilet in the house (Y/N) | 82.8% | 17.0% | 0.0% | 0.2% | 100.0% | ||
| % within Ethnic group | 71.9% | 63.8% | 0.0% | 25.0% | 70.0% | ||
| No | Count | 116 | 38 | 1 | 1 | 156 | |
| % within Presence of toilet in the house (Y/N) | 74.4% | 24.4% | 0.6% | 0.6% | 100.0% | ||
| % within Ethnic group | 19.0% | 27.0% | 50.0% | 25.0% | 20.6% | ||
| NA | Count | 55 | 13 | 1 | 2 | 71 | |
| % within Presence of toilet in the house (Y/N) | 77.5% | 18.3% | 1.4% | 2.8% | 100.0% | ||
| % within Ethnic group | 9.0% | 9.2% | 50.0% | 50.0% | 9.4% | ||
| Total | Count | 609 | 141 | 2 | 4 | 756 | |
| % within Presence of toilet in the house (Y/N) | 80.6% | 18.7% | 0.3% | 0.5% | 100.0% | ||
| % within Ethnic group | 100.0% | 100.0% | 100.0% | 100.0% | 100.0% | ||
Appendix I
Table A9.
Religion and presence of toilet in the house (based on survey data).
| Religion | Total | ||||||
|---|---|---|---|---|---|---|---|
| Hindu | Muslim | Other | NA | ||||
| Presence of toilet in the house (Y/N) | Yes | Count | 456 | 57 | 14 | 2 | 529 |
| % within Presence of toilet in the house (Y/N) | 86.2% | 10.8% | 2.6% | 0.4% | 100.0% | ||
| % within Religion | 71.1% | 70.4% | 48.3% | 40.0% | 70.0% | ||
| No | Count | 131 | 12 | 13 | 0 | 156 | |
| % within Presence of toilet in the house (Y/N) | 84.0% | 7.7% | 8.3% | 0.0% | 100.0% | ||
| % within Religion | 20.4% | 14.8% | 44.8% | 0.0% | 20.6% | ||
| NA | Count | 54 | 12 | 2 | 3 | 71 | |
| % within Presence of toilet in the house (Y/N) | 76.1% | 16.9% | 2.8% | 4.2% | 100.0% | ||
| % within Religion | 8.4% | 14.8% | 6.9% | 60.0% | 9.4% | ||
| Total | Count | 641 | 81 | 29 | 5 | 756 | |
| % within Presence of toilet in the house (Y/N) | 84.8% | 10.7% | 3.8% | 0.7% | 100.0% | ||
| % within Religion | 100.0% | 100.0% | 100.0% | 100.0% | 100.0% | ||
Appendix J
Table A10.
Gender and presence of toilet in the house (based on survey data).
| Gender of the Respondent | Total | ||||||||||
|---|---|---|---|---|---|---|---|---|---|---|---|
| Female | Male | Trans | Intersex | Other | 5 | 7 | NA | ||||
| Presence of toilet in the house (Y/N) | Yes | Count | 135 | 178 | 84 | 69 | 34 | 1 | 0 | 27 | 528 |
| % within Presence of toilet in the house (Y/N) | 25.6% | 33.7% | 15.9% | 13.1% | 6.4% | 0.2% | 0.0% | 5.1% | 100.0% | ||
| % within Gender of the respondent | 65.5% | 66.4% | 69.4% | 86.3% | 91.9% | 100.0% | 0.0% | 69.2% | 70.1% | ||
| No | Count | 41 | 68 | 34 | 5 | 3 | 0 | 1 | 3 | 155 | |
| % within Presence of toilet in the house (Y/N) | 26.5% | 43.9% | 21.9% | 3.2% | 1.9% | 0.0% | 0.6% | 1.9% | 100.0% | ||
| % within Gender of the respondent | 19.9% | 25.4% | 28.1% | 6.3% | 8.1% | 0.0% | 100.0% | 7.7% | 20.6% | ||
| NA | Count | 30 | 22 | 3 | 6 | 0 | 0 | 0 | 9 | 70 | |
| % within Presence of toilet in the house (Y/N) | 42.9% | 31.4% | 4.3% | 8.6% | 0.0% | 0.0% | 0.0% | 12.9% | 100.0% | ||
| % within Gender of the respondent | 14.6% | 8.2% | 2.5% | 7.5% | 0.0% | 0.0% | 0.0% | 23.1% | 9.3% | ||
| Total | Count | 206 | 268 | 121 | 80 | 37 | 1 | 1 | 39 | 753 | |
| % within Presence of toilet in the house (Y/N) | 27.4% | 35.6% | 16.1% | 10.6% | 4.9% | 0.1% | 0.1% | 5.2% | 100.0% | ||
| % within Gender of the respondent | 100.0% | 100.0% | 100.0% | 100.0% | 100.0% | 100.0% | 100.0% | 100.0% | 100.0% | ||
Appendix K
Table A11.
Occupation and Presence of toilet in the house (Based on Survey Data).
| Occupation | Total | ||||||||||||||||
|---|---|---|---|---|---|---|---|---|---|---|---|---|---|---|---|---|---|
| Job—Undefined | Job Organised | Job Unorganised | Business—Undefined | Business Organised | Business Unorganised | Student—Undefined | School | College | University | Household | Household | Other | NA | ||||
| Presence of toilet in the house (Y/N) | Yes | Count | 7 | 122 | 4 | 0 | 106 | 14 | 1 | 15 | 41 | 11 | 174 | 1 | 22 | 11 | 529 |
| % within Presence of toilet in the house (Y/N) | 1.3% | 23.1% | 0.8% | 0.0% | 20.0% | 2.6% | 0.2% | 2.8% | 7.8% | 2.1% | 32.9% | 0.2% | 4.2% | 2.1% | 100.0% | ||
| % within Occupation | 70.0% | 79.7% | 30.8% | 0.0% | 77.9% | 53.8% | 100.0% | 71.4% | 85.4% | 73.3% | 62.8% | 100.0% | 73.3% | 50.0% | 70.1% | ||
| No | Count | 1 | 20 | 9 | 2 | 20 | 10 | 0 | 3 | 3 | 2 | 74 | 0 | 7 | 4 | 155 | |
| % within Presence of toilet in the house (Y/N) | 0.6% | 12.9% | 5.8% | 1.3% | 12.9% | 6.5% | 0.0% | 1.9% | 1.9% | 1.3% | 47.7% | 0.0% | 4.5% | 2.6% | 100.0% | ||
| % within Occupation | 10.0% | 13.1% | 69.2% | 100.0% | 14.7% | 38.5% | 0.0% | 14.3% | 6.3% | 13.3% | 26.7% | 0.0% | 23.3% | 18.2% | 20.5% | ||
| NA | Count | 2 | 11 | 0 | 0 | 10 | 2 | 0 | 3 | 4 | 2 | 29 | 0 | 1 | 7 | 71 | |
| % within Presence of toilet in the house (Y/N) | 2.8% | 15.5% | 0.0% | 0.0% | 14.1% | 2.8% | 0.0% | 4.2% | 5.6% | 2.8% | 40.8% | 0.0% | 1.4% | 9.9% | 100.0% | ||
| % within Occupation | 20.0% | 7.2% | 0.0% | 0.0% | 7.4% | 7.7% | 0.0% | 14.3% | 8.3% | 13.3% | 10.5% | 0.0% | 3.3% | 31.8% | 9.4% | ||
| Total | Count | 10 | 153 | 13 | 2 | 136 | 26 | 1 | 21 | 48 | 15 | 277 | 1 | 30 | 22 | 755 | |
| % within Presence of toilet in the house (Y/N) | 1.3% | 20.3% | 1.7% | 0.3% | 18.0% | 3.4% | 0.1% | 2.8% | 6.4% | 2.0% | 36.7% | 0.1% | 4.0% | 2.9% | 100.0% | ||
| % within Occupation | 100.0% | 100.0% | 100.0% | 100.0% | 100.0% | 100.0% | 100.0% | 100.0% | 100.0% | 100.0% | 100.0% | 100.0% | 100.0% | 100.0% | 100.0% | ||
References
- Massey, D.; Allen, J.; Pile, S. (Eds.) City Worlds; Routledge: London, UK; New York, NY, USA, 1999. [Google Scholar]
- Ilesanmi, A.O. Urban sustainability in the context of Lagos mega-city. J. Geogr. Reg. Plan. 2010, 3, 240–252. [Google Scholar]
- Wetlands International. WaSH and Water Security. Integration and the Role of Civil Society; Wetlands International: Wageningen, The Netherlands, 2017. [Google Scholar]
- Niemczynowicz, J. Megacities from a Water Perspective. Water Int. 1996, 21, 198–205. [Google Scholar] [CrossRef]
- United Nations. The Millennium Development Goals Report 2012; United Nations: New York, NY, USA, 2012. [Google Scholar]
- Mukherjee, S.; Bebermeier, W.; Schütt, B. An Overview of the Impacts of Land Use Land Cover Changes (1980–2014) on Urban Water Security of Kolkata. Land 2018, 7, 91. [Google Scholar] [CrossRef] [Green Version]
- Sommer, M.; Ferron, S.; Cavill, S.; House, S. Violence, gender and WaSH: Spurring action on a complex, under-documented and sensitive topic. Environ. Urban 2015, 27, 105–116. [Google Scholar] [CrossRef]
- Brears, R.C. Urban Water Security; John Wiley & Sons: Hoboken, NJ, USA, 2017. [Google Scholar]
- Falkenmark, M.; Widstrand, C. Population and Water Resources: A Delicate Balance; Population Reference Bureau: Washington, DC, USA, 1992. [Google Scholar]
- Ravell, J. Population Growth, Urbanisation and Water Security: A Case Study of Greater Brisbane; Water Supply & Urbanization: Brisbane, Australia, 2014; Available online: https://www.academia.edu/7132376/Population_growth_urbanisation_and_water_security_A_case_study_of_Greater_Brisbane (accessed on 6 May 2019).
- Bakker, K.; Morinville, C. The governance dimensions of water security: A review. Philos. Trans. R. Soc. A 2013, 371, 20130116. [Google Scholar] [CrossRef]
- Biggs, E.M.; Duncan, J.M.A.; Atkinson, P.M.; Dash, J. Plenty of water, not enough strategy: How inadequate accessibility, poor governance and a volatile government can tip the balance against ensuring water security: The case of Nepal. Environ. Sci. Policy 2013, 33, 388–394. [Google Scholar] [CrossRef]
- Cook, C.; Bakker, K. Water security: Debating an emerging paradigm. Glob. Environ. Chang. 2012, 22, 94–102. [Google Scholar] [CrossRef]
- Piesse, M. Water Security in Urban India: Water Supply and Human Health; Future Directions International: Dalkeith, Australia, 2015; Available online: http://futuredirections.org.au/wp-content/uploads/2015/09/Water_Security_in_Urban_India_Water_Supply_and_Human_Health.pdf (accessed on 7 March 2018).
- Blanca, F.M. Water security in an urbanized world: An equity perspective. Habitat Int. 2017. [Google Scholar] [CrossRef]
- Goff, M.; Crow, B. What is water equity? The unfortunate consequences of a global focus on ‘drinking water’. Water Int. 2014, 39, 159–171. [Google Scholar] [CrossRef]
- Jepson, W.; Budds, J.; Eichelberger, L.; Harris, L.; Norman, E.; O’Reilly, K.; Pearson, A.; Shah, S.; Shinn, J.; Staddon, C.; et al. Advancing human capabilities for water security: A relational approach. Water Secur. 2017, 1, 46–52. [Google Scholar] [CrossRef]
- UN-Habitat. State of the World’s Cities 2008/2009—Harmonious Cities; UN-Habitat: Nairobi, Kenya, 2008. [Google Scholar]
- Mayne, A. The History of a Global Injustice; University of Chicago Press: Chicago, IL, USA, 2017. [Google Scholar]
- Subbaraman, R.; Murthy, S. The Right to Water in the Slums of Mumbai, India 2015. Bull. World Health Organ. 2015, 93, 815–816. Available online: https://ssrn.com/abstract=3149943 (accessed on 6 May 2019).
- United Nations Human Settlements Programme (UN-Habitat). The Challenge of Slums: Global Report on Human Settlements; Earthscan Publications Ltd.: London, UK, 2003. [Google Scholar]
- Ravallion, M.; Chen, S.; Sangraula, P. The Urbanization of Global Poverty. Development Research Group; World Bank: Washington, DC, USA, 2007; Available online: http://siteresources.worldbank.org/INTDECINEQ/Resources/Urbanizationpoverty.pdf (accessed on 5 December 2019).
- United Nations Children’s Fund (UNICEF) and World Health Organization (UNICEF/WHO). Progress on Household Drinking Water, Sanitation and Hygiene 2000–2017. Special Focus on Inequalities. New York. 2019. Available online: https://www.who.int/water_sanitation_health/publications/jmp-2019-full-report.pdf?ua=1 (accessed on 5 January 2020).
- Begum, H.; Moinuddin, G. Spatial dimension of social exclusion. An imperial investigation into the relationship of housing and social exclusion in the slums of Dhaka city. Manag. Res. Pract. 2010, 2, 314–328. [Google Scholar]
- Webb, P.; Iskandarani, M. Water Insecurity and the Poor: Issues and Research Needs, ZEF—Discussion Papers on Development Policy No. 2; Center for Development Research: Bonn, Germany, 1998; p. 66. [Google Scholar]
- Martine, G. Migration, Natural Increase and City Growth: The Case of Rio de Janiero. Intern. Migr. Lat. Am. 1972, 6, 200–215. [Google Scholar] [CrossRef]
- Marx, B.; Stoker, T.; Suri, T. The Economics of Slums in the Developing World. J. Econ. Perspect. 2013, 27, 187–210. [Google Scholar] [CrossRef] [Green Version]
- Schenk, C. Slum Diversity in Kolkata. Columbia Undergrad. J. South Asian Stud. 2010, 1, 91–108. [Google Scholar]
- Ghosh, S. Regional Disparities of Slums, 2013—An Overview with special emphasis to Kolkata. Int. J. Humanit. Soc. Sci. Invent. 2013, 2, 48–54. [Google Scholar]
- Levitas, R.; Pantazis, C.; Fahmy, E.; Gordon, D.; Loyd, E.; Patsios, D. The Multi-Dimensional Analysis of Social Exclusion; UK Office Social Exclusion Task Force: London, UK, 2007. [Google Scholar]
- Thorat, S. Economic Exclusion and Poverty in Asia: The Example of Caste in India. In 2020 Focus Brief on the World’s Poor and Hungry People; IFPRI: Washington, DC, USA, 2007. [Google Scholar]
- World Bank-Water and Sanitation Program (WSP). Gender in Water and Sanitation. Mainstreaming Gender in Water and Sanitation; World Bank: Washington, DC, USA, 2010. [Google Scholar]
- Sustainable Sanitation Alliance (SuSanA). SuSanA Factsheet: Integrating a Gender Perspective in Sustainable Sanitation. Eschborn: Sustainable Sanitation Alliance Working Group on Gender. 2009. Available online: http://www.susana.org/lang-en/library?view=ccbktypeitem&type=2&id=1187 (accessed on 5 January 2020).
- Benjamin, C.; Hueso, A. LGBTI and sanitation: What we know and what the gaps are. Local action with international cooperation to improve and sustain water, sanitation and hygiene services. In Proceedings of the 40th WEDC International Conference, Loughborough, UK, 24–28 July 2017; Available online: https://wedc-knowledge.lboro.ac.uk/resources/conference/40/Benjamin-2649.pdf (accessed on 5 January 2020).
- Das, B.; Khara, U.; Giri, P.; Bandyopadhyay, A. The Challenge of Slum Development in India: A Case Study of Meltala-Dasnagar Slum Area of Howrah Municipal Corporation. Int. J. Adv. Syst. Soc. Eng. Res. 2012, 2, 22–27. [Google Scholar]
- Ray, B. Quality of life in selected slums of Kolkata: A step forward in the era of pseudo-urbanisation. Local Environ. 2017, 22, 365–387. [Google Scholar] [CrossRef]
- Census of India. Primary Census 2011 Abstract for Slums; Office of the Registrar General and Census Commissioner: New Delhi, Indina, 2011. Available online: http://www.censusindia.gov.in/2011-Documents/Slum-26-09-13.pdf (accessed on 19 September 2016).
- Wutich, A.; Ragsdale, K. Water insecurity and emotional distress: Coping with supply, access, and seasonal variability of water in a Bolivian squatter settlement. Soc. Sci. Med. 2008, 67, 2116–2125. [Google Scholar] [CrossRef]
- Gleick, P. The human right to water. Water Policy 1998, 1, 487–503. [Google Scholar] [CrossRef]
- Satterthwaite, D. The Millennium Development Goals and urban poverty reduction: Great expectations and nonsense statistics. Environ. Urban. 2003, 15, 181–190. [Google Scholar] [CrossRef]
- Hadley, C.; Amber, W. Experience-based measures of food and water security: Biocultural approaches to grounded measures of insecurity. Hum. Organ. 2009, 68, 451–460. [Google Scholar] [CrossRef]
- World Health Organization and UNICEF. Progress on Sanitation and Drinking-Water-2013 Update; World Health Organization: Geneva, Switzerland, 2014. [Google Scholar]
- United Nations. UN Special Rapporteur’s Realizing the Rights to Water and Sanitation: A Handbook; UN: New York, NY, USA, 2014. [Google Scholar]
- UN-Water. Water Security and the Global Water Agenda; A UN-Water Analytical Brief; UNU-INWEH: Hamilton, ON, Canada, 2013. [Google Scholar]
- Chenoweth, J.; Malcolm, R.; Pedley, S.; Kaime, T. Household Water Security and the Human Right to Water and Sanitation. In Water Security: Principles, Perspectives and Practices; Lankford, B., Bakker, K., Zeitoun, M., Conway, D., Eds.; Routledge: New York, NY, USA; London, UK, 2013; pp. 307–318. [Google Scholar]
- United Nations. The Human Right to Water and Sanitation (Resolution Adopted by the General Assembly). UN Doc.64/292. 2010. Available online: http://www.un.org/ga/search/view_doc.asp?symboll=A/RES/64/292 (accessed on 6 December 2019).
- Boelens, R. The Shotgun Marriage. Water Security, Cultural Politics, and Forced Engagements between Official and Local Rights Frameworks. In Water Security: Principles, Perspectives and Practices; Lankford, B., Bakker, K., Zeitoun, M., Conway, D., Eds.; Routledge: New York, NY, USA; London, UK, 2013; pp. 239–255. [Google Scholar]
- Grey, D.; Sadoff, C.W. Sink or Swim? Water security for growth and development. Water Policy 2007, 9, 545–571. [Google Scholar] [CrossRef]
- Gutierrez, E. Boiling Point: Issues and Problems in Water Security and Sanitation; WaterAid Briefing Paper; Global Water Partnership: London, UK, 1999. [Google Scholar]
- Leb, C.; Wouters, P. The Water Security Paradox and International Law. Securitisation as an Obstacle to Achieving Water Security and the Role of Law in Desecuritising the World’s Most Precious Resource. In Water Security: Principles, Perspectives and Practices; Lankford, B., Bakker, K., Zeitoun, M., Conway, D., Eds.; Routledge: New York, NY, USA; London, UK, 2013; pp. 26–46. [Google Scholar]
- UNESCO. The United Nations World Water Development Report 2019: Leaving No One behind; UNESCO: Paris, France, 2019. [Google Scholar]
- Gleick, P.H. The World’s Water 2004–2005: The Biennial Report on Freshwater Resources; Island Press: Washington, DC, USA, 2004. [Google Scholar]
- World Health Organization (WHO). Guidelines on Sanitation and Health; World Health Organization: Geneva, Switzerland, 2018; Available online: https://apps.who.int/iris/bitstream/handle/10665/274939/9789241514705-eng.pdf?ua=1 (accessed on 5 January 2020).
- United Nations (UN). Background Paper Submitted by the Interagency Task Force on Gender and Water, Gender, Water and Sanitation. United Nations Commission on Sustainable Development, Twelfth Session, 14–30 April, Item on the Provisional Agenda, 2004. Available online: http://www.un.org/esa/sustdev/sdissues/water/GenderWaterTaskForce_CSD12finalreport.doc (accessed on 5 January 2020).
- World Health Organization (WHO). Guidelines for Drinking-Water Quality: Acceptability Aspects. Available online: https://www.who.int/water_sanitation_health/dwq/gdwq3_10.pdf (accessed on 6 January 2020).
- Smets, H. Access to drinking water at an affordable price in developing countries. Options Méditerranéennes A nº 2009, 57–68. [Google Scholar]
- Teodoro, M.P. Measuring Household Affordability for Water and Sewer Utilities. J. Am. Water Work. Assoc. 2018, 110, 13–24. Available online: https://awwa.onlinelibrary.wiley.com/doi/full/10.5942/jawwa.2018.110.0002 (accessed on 5 January 2020). [CrossRef]
- World Health Organisation (WHO)/United Nations Childrens Fund (UNICEF). Progress on Drinking Water and Sanitation—2012 Update; WHO & UNICEF: New York, NY, USA, 2012. [Google Scholar]
- Bradley, D.; Bartram, J. Domestic water and sanitation as water security: Monitoring, concepts and strategy. Philos. Trans. R. Soc. A 2013, 371, 20120420. [Google Scholar] [CrossRef] [Green Version]
- UNESCO. The United Nations World Water Development Report 2015: Water for a Sustainable World; UNESCO: Paris, France, 2015. [Google Scholar]
- Boelens, R.; Seemann, M. Forced engagements: Water security and local rights formalization in Yanque, Colca valley, Peru. Hum. Organ. 2014, 73, 1–12. [Google Scholar] [CrossRef]
- World Health Organization (WHO). World Health Organization Global Burden of Disease; 2004 Update; WHO: Geneva, Switzerland, 2008. [Google Scholar]
- Duflo, E.; Galiani, S.; Mobarak, M. Improving Access to Urban Services for the Poor: Open Issues and a Framework for a Future Research Agenda. J-PAL Urban Services Review Paper; Abdul Latif Jameel Poverty Action Lab: Cambridge, MA, USA, 2012. [Google Scholar]
- Schelwald-Van Der Kley, L.; Reijerkerk, L. Water: A Way of Life. Sustainable Water Management in a Cultural Context; CRC Press: Leiden, The Netherland, 2009. [Google Scholar]
- Warner, W.; Heeb, J.; Jenssen, P.; Gnanakan, K.; Conradin, K. M4-2: Socio-Cultural Aspects of Ecological Sanitation. PDF-Presentation. Aarau: Seecon. 2008. Available online: http://www.sswm.info/sites/default/files/reference_attachments/WARNER%20et%20al%202008%20Socio%20Cultural%20Aspects.pdf (accessed on 20 June 2018).
- Winter, S.; Dzombo, M.; Barchi, F. Exploring the complex relationship between women’s sanitation practices and household diarrhea in the slums of Nairobi: A cross-sectional study. BMC Infect. Dis. 2019, 19, 242. [Google Scholar] [CrossRef]
- UN-Women. We must Leverage Women’s Voice and Influence in Water Governance by Åsa Regnér, Deputy Executive Director of UN Women, at the World Water Week Celebration in Stockholm on 27 August. 2018. Available online: https://www.unwomen.org/en/news/stories/2018/8/speed-ded-regner-stockholm-world-water-week (accessed on 5 January 2020).
- Doshi, S. The Right to the Slum? Redevelopment, Rule and the Politics of Difference in Mumbai. UC Berkeley. 2011. Available online: https://escholarship.org/uc/item/4tx6v6sw (accessed on 5 December 2019).
- Furedy, C. Whose Responsibility? Dilemmas of Calcutta’s Bustee Policy in the Nineteenth Century. South Asia 1982, 5, 24–46. [Google Scholar] [CrossRef]
- Dutt, T.K. Hungry Bengal; Indian Printing Works: Lahore, India, 1944. [Google Scholar]
- Bose, R.; Ghosh, S. Slums in Kolkata: A socio-economic analysis. EEQEL 2015, 4, 134–148. [Google Scholar]
- McArthur, J.M.; Sikdar, P.K.; Leng, M.J.; Ghosal, U.; Sen, I. Groundwater Quality beneath an Asian Megacity on a Delta: Kolkata’s (Calcutta’s) Disappearing Arsenic and Present Manganese. Environ. Sci. Technol. 2018, 52, 5161–5172. [Google Scholar] [CrossRef]
- United States Environmental Protection Agency (EPA). Learn about Private Water Wells. 2019. Available online: https://www.epa.gov/privatewells/learn-about-private-water-wells (accessed on 5 January 2020).
- Boelens, R.; Vos, J.; Perreault, T. Introduction: The Multiple Challenges and Layers of Water Justice Struggles. In Water Justice; Boelens, R., Perreault, T., Vos, J., Eds.; Cambridge University Press: Cambridge, MA, USA, 2018; pp. 1–32. [Google Scholar]
- Crow, B.; Lu, F.; Ocampo-Raeder, C.; Boelens, R.; Dill, B.; Zwarteveen, M. Santa Cruz declaration on the global water crisis. Water Int. 2014, 39, 246–261. [Google Scholar]
- Escobar, A. Difference and conflict in the struggle over natural resources: A political ecology framework. Development 2006, 49, 6–13. [Google Scholar] [CrossRef]
- Harvey, D. Justice, Nature and the Geography of Difference; Blackwell Publishers: Cambridge, MA, USA; Oxford, UK, 1996. [Google Scholar]
- Perreault, T.; Wraight, S.; Perreault, M. The Social Life of Water: Histories and Geographies of Environmental Injustice in the Onondaga Lake Watershed; Justicia Hídrica: New York, NY, USA, 2011; Available online: www.justiciahidrica.org (accessed on 28 August 2019).
- Popay, J.; Escorel, S.; Hernandez, M.; Johnston, H.; Mathieson, J.; Rispel, L. Understanding and Tackling Social Exclusion: Final Report of the Social Exclusion Knowledge Network of the Commission on Social Determinants of Health; World Health Organization: Geneva, Switzerland, 2008. [Google Scholar]
- Cohen, B. Urbanization in developing countries: Current trends, future projections, and key challenges for sustainability. Technol. Soc. 2006, 28, 63–80. [Google Scholar] [CrossRef]
- Montgomery, M. The urban transformation of the developing world. Science 2008, 319, 761–764. [Google Scholar] [CrossRef] [Green Version]
- Mahabir, R.; Crooks, A.; Croitoru, A.; Agouris, P. The study of slums as social and physical constructs: Challenges and emerging research opportunities. Reg. Stud. Reg. Sci. 2016, 3, 399–419. [Google Scholar] [CrossRef] [Green Version]
- Kilroy, A. Intra-urban spatial inequalities: Cities as ‘urban regions. In Background Paper to the 2009 World Development Report; World Bank: Washington, DC, USA, 2007; Available online: http://siteresources.worldbank.org/INTWDR2009/Resources/42310061204741572978/Kilroy2.pdf (accessed on 18 March 2019).
- Martinez, J.; Mboup, G.; Sliuzas, R.; Stein, A. Trends in urban and slum indicators across developing world cities, 1990–2003. Habitat Int. 2008, 32, 86–108. [Google Scholar] [CrossRef]
- Hawkins, P.; Blackett, I.; Heymans, C. Poor-Inclusive Urban Sanitation: An Overview; World Bank: Washington, DC, USA, 2013; Available online: http://wedc.lboro.ac.uk/resources/pubs/WSP-Poor-Inclusive-Urban-Sanitation-Overview.pdf (accessed on 5 December 2019).
- Mosello, B.; Chambers, V.; Mason, N. Improving WaSH Service Delivery in Protracted Crises: The case of the Democratic Republic of Congo; Overseas Development Institute: London, UK, 2017. [Google Scholar]
- World Health Organisation (WHO)/United Nations Childrens Fund (UNICEF). Progress on Drinking Water and Sanitation—2014 Update; WHO & UNICEF: New York, NY, USA, 2014. [Google Scholar]
- Schreiber, F.; Carius, A. The Inclusive City: Urban Planning for Diversity and Social Cohesion. In State of the World: Can a City Be Sustainable? Worldwatch Institute, Ed.; Worldwatch Institute: Washington, DC, USA, 2016; pp. 123–141. [Google Scholar]
- Bhan, G.; Jana, A. Reading spatial inequality in urban India. Econ. Political Wkly. 2015, 50, 49–54. [Google Scholar]
- Haque, I. Discriminated urban spaces: A study of spatial segregation in urban West Bengal. Econ. Political Wkly. 2016, 51, 41–50. [Google Scholar]
- Hegde, S. India: Segregation in housing and ghettoization of cities. South Asia Citiz. 2013. Available online: http://www.sacw.net/article6363.html (accessed on 12 August 2019).
- Sidhwani, P. Spatial inequalities in big Indian cities. Econ. Political Wkly. 2015, 50, 55–62. [Google Scholar]
- Saroj, S.K.; Rana, M.J.; Choudhary, B.K.; Goli, S. WaSH Availability, Accessibility and Inequalities in Select Metro Cities of India. Sustain. Cities Soc. 2017, 29, 105268. [Google Scholar]
- Giles, H.; Brown, B. And Not a Drop to Drink’: Water and sanitation services to the urban poor in the developing world. Geogr. Assoc. 1997, 82, 97–109. Available online: http://www.jstor.org/stable/40572824 (accessed on 5 December 2019).
- Smith, L. The urban political ecology of water in Cape Town. Urban Forum 2001, 12, 204–224. [Google Scholar] [CrossRef]
- Chant, S.; Klett-Davies, M.; Ramalho, J. Challenges and Potential solutions for adolescent girls in urban settings: A rapid evidence review. In Gender and Adolescence: Global Evidence; The London School of Economics and Political Science: London, UK, 2017; Available online: http://eprints.lse.ac.uk/84297/1/Young%20Female%20Adolescents%20in%20Urban%20Areas%20RER%20FINAL.pdf (accessed on 5 January 2020).
- Corburn, J.; Hildebrand, C. Slum Sanitation and the Social Determinants of Women’s Health in Nairobi, Kenya. J. Environ. Public Health 2015, 2015, 209505. [Google Scholar] [CrossRef] [PubMed] [Green Version]
- Mohite, R.V.; Mohite, V.R. Menstrual hygiene practices among slum adolescent girls. Int. J. Community Med. Public Health 2016, 3, 1729–1734. [Google Scholar] [CrossRef]
- Parvez, A.; Rahman, M.M.; Sultana, S.; Shaheen, S.M. Prevalence of water-borne disease in farmgate slum of Dhaka city: A case study of disease propagation in Bangladesh. Pharmacologyonline 2019, 1, 55–63. [Google Scholar]
- Kundu, A. India’s sluggish urbanisation and its exclusionary development. In Urban Growth in Emerging Economies: Lessons from the BRICS; McGranahan, G., Martine, G., Eds.; Routledge: Abingdon, UK, 2014; pp. 191–232. [Google Scholar]
- Mahadevia, D. Branded and renewed? Policies, politics and processes of urban development in the reform era. Econ. Political Wkly. 2007, 46, 56–64. [Google Scholar]
- Murthy, S.L. Land security and the challenges of realizing the human rights to water and sanitation in the slums of Mumbai, India. Health Hum. Rights 2012, 14, 61–73. Available online: http://www.jstor.org/stable/healhumarigh.14.2.61 (accessed on 28 August 2019).
- Goli, S.; Arokiasamy, P.; Chattopadhyay, A. Living and health conditions of selected cities in India: Setting priorities for the National Urban Health Mission. Cities 2011, 28, 461–469. [Google Scholar] [CrossRef]
- Goli, S.; Doshi, R.; Arokiasamy, A. Pathways of economic inequalities in maternal and child health in urban India: A decomposition analysis. PLoS ONE 2013, 8, e58573. [Google Scholar] [CrossRef] [Green Version]
- Kumar, R.; Horwitz, P.; Milton, G.R.; Sellamuttu, S.S.; Buckton, S.T.; Davidson, N.C.; Pattnaik, A.K.; Zavagli, M.; Baker, C. Assessing wetland ecosystem services and poverty interlinkages: A general framework and case study. Hydrol. Sci. J. 2011, 56, 1602–1621. [Google Scholar] [CrossRef] [Green Version]
- Mayer, F.; Frantz, C.; Bruehlman-Senecal, E.; Dolliver, K. Why is nature beneficial? The role of connectedness to nature. Environ. Behav. 2009, 41, 607–643. [Google Scholar] [CrossRef]
- Aylward, B.; Bandyopadhyay, J.; Belausteguigotia, J.C.; Borkey, P.; Cassar, A.Z.; Meadors, L.; Saade, L.; Siebentritt, M.; Stein, R.; Tognetti, S.; et al. Freshwater ecosystem services. Ecosyst. Hum. Well-Being Policy Responses 2005, 3, 213–256. [Google Scholar]
- Nawab, B.; Nyborg, I.L.; Esser, K.B.; Jenssen, P.D. Cultural preferences in designing ecological sanitation systems in North West Frontier Province, Pakistan. J. Environ. Psychol. 2006, 26, 236–246. [Google Scholar] [CrossRef]
- Chiodelli, F.; Moroni, S. The complex nexus between informality and the law: Reconsidering unauthorised settlements in light of the concept of nomotropism. Geoforum 2014, 51, 161–168. [Google Scholar] [CrossRef]
- Tsenkova, S.; Potsiou, C.; Badyina, A. Self-Made Cities—In Search of Sustainable Solutions for Informal Settlements in the United Nations Economic Commissions for Europe Region; United Nations Economic Commission for Europe (UNECE), United Nations Publications: Geneva, Switzerland, 2009; p. 113. [Google Scholar]
- Mishra, V. Key challenges of marginalised communities on sanitation and hygiene and recommendations to clean India. In Proceedings of the 40th WEDC International Conference, Loughborough, UK, 24–28 July 2017. [Google Scholar]
- United Nations Human Rights Council (UNHRC). Report of the Independent Expert on the Issue of Human Rights Obligations Related to Access to Safe Drinking Water and Sanitation; UN Document A/HRC/15/31; UNHRC: Geneva, Switzerland, 2010. [Google Scholar]
- Uddin, N. Assessing urban sustainability of slum settlements in Bangladesh: Evidence from Chittagong city. J. Urban. Manag. 2018, 7, 32–42. [Google Scholar] [CrossRef]
- Dhall, P.; Boyce, P. Livelihood, Exclusion and Opportunity: Socioeconomic Welfare among Gender and Sexuality Non-Normative People in India; Institute of Development Studies: Brighton, UK, 2015. [Google Scholar]
- Boyce, P.; Boyce, P.; Brown, S.; Cavill, S.; Chaukekar, S.; Chisenga, B.; Dash, M.; Dasgupta, R.K.; De La Brosse, N.; Dhall, P.; et al. Transgender-inclusive sanitation: Insights from South Asia. Waterlines 2018, 37, 102–117. [Google Scholar] [CrossRef]
- Shrestha, S.; Aihara, Y.; Bhattarai, A.P.; Bista, N.; Kondo, N.; Futaba, K.; Nishida, K.; Shindo, J. Development of an objective water security index and assessment of its association with quality of life in urban areas of developing countries. SSM—Popul. Health 2018, 6, 276–285. [Google Scholar] [CrossRef]
- Sasidevan, D.; Santha, S.D. The social construction of water scarcity: An exploratory study along the “Bharathapuzha” in Kerala. Glocalism: J. Cult. Politics Innov. 2018, 3. [Google Scholar] [CrossRef]
Figure 1.
Borough map of Kolkata Municipal Corporation (KMC) area featuring the wards associated in a borough. Roman numbers mark the borough numbers [6,37].

Figure 2.
Boxplot showing distribution of the WaSH provisions (Latrines, Standposts, Dugwell, Tubewells) per person in Slums of Kolkata Municipal Corporation (KMC) area. Data source: Census of India (2011).
Figure 2.
Boxplot showing distribution of the WaSH provisions (Latrines, Standposts, Dugwell, Tubewells) per person in Slums of Kolkata Municipal Corporation (KMC) area. Data source: Census of India (2011).

Figure 3.
Ward-wise distribution of per capita WaSH provisions in slums in terms of latrine, standpost, dugwell and tubewell within Kolkata Municipal Corporation (KMC) area. * Data Source: Census of India, 2011 and Kolkata Municipal Corporation, 2016; LISS III Satellite Image 2010 (ISRO, India).
Figure 3.
Ward-wise distribution of per capita WaSH provisions in slums in terms of latrine, standpost, dugwell and tubewell within Kolkata Municipal Corporation (KMC) area. * Data Source: Census of India, 2011 and Kolkata Municipal Corporation, 2016; LISS III Satellite Image 2010 (ISRO, India).

Figure 4.
Ward-wise percentage (%) of areas covered by wetlands within Kolkata Municipal Corporation (KMC) area. *Data Source: Census of India, 2011 and Kolkata Municipal Corporation, 2016; LISS III Satellite Image 2010 (ISRO, India).
Figure 4.
Ward-wise percentage (%) of areas covered by wetlands within Kolkata Municipal Corporation (KMC) area. *Data Source: Census of India, 2011 and Kolkata Municipal Corporation, 2016; LISS III Satellite Image 2010 (ISRO, India).

Figure 5.
Ward-wise distribution of per person WaSH provision Index for the slums within Kolkata Municipal Corporation (KMC) area. Higher scores represent more WaSH provision per person in slums within a ward.
Figure 5.
Ward-wise distribution of per person WaSH provision Index for the slums within Kolkata Municipal Corporation (KMC) area. Higher scores represent more WaSH provision per person in slums within a ward.

Table 1.
Pearson correlation coefficient (r) to assess the linear correlation between per person access to sanitation and drinking water provision in slums within Kolkata Municipal Corporation (KMC) area (n = 138). Data source: Census of India (2011). * marking 95% confidence level, ** marking 99% confidence level.
| Gender | Literacy | Ethnicity (Based on Language Spoken) | Religion | ||||||||
|---|---|---|---|---|---|---|---|---|---|---|---|
| Families | Male Dwellers | Female Dwellers | Literate Dwellers | Bengali Speakers | Hindi Speakers | Urdu speakers | Other Language Speakers | Hindu | Muslim | Other Religions | |
| Latrines person−1 | |||||||||||
| Pearsons’s r | 0.781 ** | 0.718 ** | 0.707 ** | 0.733 ** | 0.795 ** | 0.323 ** | 0.178 * | 0.213 * | 0.734 ** | 0.192 * | 0.261 ** |
| Sig.(2-tailed) | 0.000 | 0.000 | 0.000 | 0.000 | 0.000 | 0.000 | 0.037 | 0.012 | 0.000 | 0.024 | 0.002 |
| N | 138 | 138 | 138 | 138 | 138 | 138 | 138 | 138 | 138 | 138 | 138 |
| Standposts person−1 | |||||||||||
| Pearsons’s r | 0.871 ** | 0.830 ** | 0.817 ** | 0.815 ** | 0.807 ** | 0.482 ** | 0.254 ** | 0.375 ** | 0.856 ** | 0.192 * | 0.409 ** |
| Sig.(2-tailed) | 0.000 | 0.000 | 0.000 | 0.000 | 0.000 | 0.000 | 0.003 | 0.000 | 0.000 | 0.024 | 0.000 |
| N | 138 | 138 | 138 | 138 | 138 | 138 | 138 | 138 | 138 | 138 | 138 |
| Dugwells person−1 | |||||||||||
| Pearsons’s r | 0.403 ** | 0.340 ** | 0.364 ** | 0.381 ** | 0.452 ** | 0.202 ** | - | - | 0.455 ** | - | - |
| Sig.(2-tailed) | 0.000 | 0.000 | 0.000 | 0.000 | 0.000 | 0.018 | 0.892 | 0.079 | 0.000 | 0.819 | 0.058 |
| N | 138 | 138 | 138 | 138 | 138 | 138 | 138 | 138 | 138 | 138 | 138 |
| Tubewells person−1 | |||||||||||
| Pearsons’s r | 0.369 ** | 0.369 ** | 0.337 ** | 0.349 ** | 0.509 ** | - | - | - | 0.410 ** | - | - |
| Sig.(2-tailed) | 0.000 | 0.000 | 0.000 | 0.000 | 0.000 | 0.883 | 0.659 | 0.979 | 0.000 | 0.503 | 0.820 |
| N | 138 | 138 | 138 | 138 | 138 | 138 | 138 | 138 | 138 | 138 | 138 |
* Correlation is significant at the 0.05 level (2-tailed). ** Correlation is significant at the 0.01 level (2-tailed).
Table 2.
Statistical measure (Chi-Square Test) for testing relationships between location variable ward, WaSH provisions (direct piped water supply to the house and presence of toilets in the house) and gender characteristics. Data base: survey data.
Table 2.
Statistical measure (Chi-Square Test) for testing relationships between location variable ward, WaSH provisions (direct piped water supply to the house and presence of toilets in the house) and gender characteristics. Data base: survey data.
| WaSH Provisions and Gender Characteristics | Statistical Measure | Value | df | Asymptotic Significance (2-sided) |
|---|---|---|---|---|
| Ward and Direct piped water supply to the house | Pearson Chi-Square | 670.72 | 372 | 0.000 |
| Likelihood Ratio | 279.66 | 372 | 1.000 | |
| Linear-by-Linear Association | 0.06 | 1 | 0.801 | |
| N of Valid Cases | 755 | |||
| Ward and Presence of Toilets in the house | Pearson Chi-Square | 764.73 | 124 | 0.000 |
| Likelihood Ratio | 719.22 | 124 | 0.000 | |
| Linear-by-Linear Association | 42.50 | 1 | 0.000 | |
| N of Valid Cases | 755 | |||
| Presence of Toilets in the house and Gender characteristics | Pearson Chi-Square | 239.75 | 8 | 0.000 |
| Likelihood Ratio | 259.28 | 8 | 0.000 | |
| Linear-by-Linear Association | 32.13 | 1 | 0.000 | |
| N of Valid Cases | 755 |
© 2020 by the authors. Licensee MDPI, Basel, Switzerland. This article is an open access article distributed under the terms and conditions of the Creative Commons Attribution (CC BY) license (http://creativecommons.org/licenses/by/4.0/).
Share and Cite
MDPI and ACS Style
Mukherjee, S.; Sundberg, T.; Schütt, B. Assessment of Water Security in Socially Excluded Areas in Kolkata, India: An Approach Focusing on Water, Sanitation and Hygiene. Water 2020, 12, 746. https://doi.org/10.3390/w12030746
AMA Style
Mukherjee S, Sundberg T, Schütt B. Assessment of Water Security in Socially Excluded Areas in Kolkata, India: An Approach Focusing on Water, Sanitation and Hygiene. Water. 2020; 12(3):746. https://doi.org/10.3390/w12030746
Chicago/Turabian StyleMukherjee, Subham, Trude Sundberg, and Brigitta Schütt. 2020. "Assessment of Water Security in Socially Excluded Areas in Kolkata, India: An Approach Focusing on Water, Sanitation and Hygiene" Water 12, no. 3: 746. https://doi.org/10.3390/w12030746
Note that from the first issue of 2016, this journal uses article numbers instead of page numbers. See further details here.