Numerical Simulation of Seepage and Stability of Tailings Dams: A Case Study in Lixi, China


1
State Key Laboratory of Eco-Hydraulics in Northwest Arid Region of China, Xi’an University of Technology, Xi’an 710048, China
2
School of Civil Engineering, Xijing University, Xi’an 710123, China
*
Author to whom correspondence should be addressed.
Water 2020, 12(3), 742; https://doi.org/10.3390/w12030742
Submission received: 16 February 2020
/
Revised: 2 March 2020
/
Accepted: 6 March 2020
/
Published: 8 March 2020
(This article belongs to the Section Water Quality and Contamination)
Abstract
:The purpose of establishing a tailings dam is to safely store tailings to protect the natural environment from damage. Accidents at tailings dams are frequent, however, with serious consequences of not only threats to life and property but also the pollution of the environment. Many tailings dam accidents are caused by seepage failure. In this paper, the object of the case study is the Lixi tailings dam. Three- and two-dimensional finite element models are established. The seepage field of the project under different working conditions is simulated and the position of the phreatic line is obtained. The safety factors under different working conditions are obtained by combining the seepage field with the stable surface. Finally, the influence of different dry and upstream slope ratio on seepage and stability of tailings dam is obtained. The results show that the longer the length of the dry beach, the lower the phreatic line and the greater the safety factor. The higher the upstream slope ratio, the lower the phreatic line and the greater the safety factor.
1. Introduction
With the acceleration of industrialization in China, demand for mineral ores is also gradually increasing [1,2]. Ore tailings are generated, and waste residues are discharged after useful components are extracted [3,4]. Tailings are generally recycled or stored [5]. Tailings used in concrete additives can be recycled [6,7]. A tailings pond is a good place to store these waste residues [8]. According to survey data, more than 20,000 tailings ponds have been created worldwide, and the larger ones can reach 10 million or even more than 100 million m3. For example, the storage capacity of the Yang Kedutel tailings dam in the United States reaches 150 million m3 [9]. As a kind of artificial high-potential debris flow, tailings dams are different from ordinary dams in terms of the water blocked by them [10]. Leakage of the tailings dam body will cause more serious damage than leakage of ordinary reservoir dams [11,12]. The tailings dam is a mixture of tailings and water, and seepage phenomena are inevitable [13].
The hazards caused by a tailings pond discharge accident rank 18th, next to those caused by earthquakes, cholera, floods, and the explosion of a hydrogen bomb [14]. A dam failure at a copper mine in Zambia killed more than 100 people. The Pure Pierre tailings dam accident in Italy killed 251 people. More than 1000 Guyanese people were killed when drinking water was contaminated after the Omai tailings dam in Guyana collapsed [15]. The Baia Mara mineral processing plant in Romania dumped 100,000 m3 of cyanide wastewater into nearby rivers, resulting in the pollution of the river, affecting the ecological environment of the Black Sea region, and causing the destruction of all the plants and animals in the path of tailings flowing through the region [16]. After the Bang Lake accident in the United States, more than 60,000 m3 of tailings pond drained into a swamp, resulting in the death of all the plants in the swamp [17]. The Karamken gold tailings dam in Russia’s far east crashed in 2009, causing damage to the site and environment [18].About 32 million cubic metres of tailings were released when the Brazilian Fundao tailings dam crashed in 2015.The pollution reached 668 km and extended into the Atlantic ocean [19,20].
China is a major mining country, with more than 1500 tailings dams and 300 million tons of tailings discharged annually. The design height of the largest tailings dam at present is 260 m. The failure of Anhui’s Huang Meishan iron mine tailings dam caused 119 casualties and 282 acres of farmland were damaged by pollution. At present, the most serious tailings dam accident in China was that of the Xinta mining company in the Tanshan mining area, Xiangfen county, Linfen city, Shanxi. That accident caused 258 deaths, 34 injuries, and environmental pollution damage [21].
Most of the research on tailings dams focuses on the seepage, consolidation, stability, and seismic characteristics of tailings dams [22]. At present, most tailings dams are wet-piled, for which the study of seepage control and slope stability is very important [23]. Seepage also influences the control of stability. Damage caused by seepage flow accounts for 20% to 30% of tailings dam accidents [24].
Zandarin et al. conducted a simulation study of the seepage field and capillary water of a tailings dam in Cuba under heavy rain conditions [25]. They believed that the capillary water greatly influences the stability of the tailings dam, with the stability being proportional to the height of the capillary water. Lu and Cui generalized a complex section and simplified topographic conditions, representing the tailings dam by a plane model [26]. Through the analysis and numerical simulation of the seepage flow field, the simplification was found to have little influence on the engineering simulation results. Xu et al. considered the special situation of the tailings dam physics and chemical clogging, and studied its seepage characteristics [27]. Consequently, Liu Chong et al. proposed a new type of drainage system for seepage and stability analysis of tailings dams [28]. This new drainage system reduces the wetting line to meet stable requirements. Pak and Nabipour studied saturation and unsaturation in different drainage systems and simulated the seepage under different conditions [29]. Yin et al. studied the mesoscopic mechanism of the tailings dam and obtained the microscopic changes under the seepage [30]. Yonghao Yang et al. made a case study on the application of geotextile tubes in tailings dam. The results show that this method is effective in construction [31]. Shaohua Hu et al. studied the seepage control of a tailings dam during its staged construction. They believe that a proper drainage system is of great significance to the reduction in the phreatic surface [32].
Many domestic and foreign scholars have studied the stability of tailings dams. Ozer and Bromwell used a limit equilibrium method and a finite element method to do seepage transient analysis of tailings dams under the condition of extremely rapid water level decline, and coupled this with the analysis of slope stability under that condition [33]. Meggyse et al. believe that there are many factors affecting the stability of a tailings dam, including the choice of building materials, tailings pond management, and the tailings slurry composition [34]. Wang et al. conducted a safety evaluation on the Xiangyun Phosphogypsum tailings pond. The keys to safety analysis and assessment—inspection and verification—can be mutually beneficial, and can lead to a better overall result [35]. Sanjay et al. proposed a simplified method to evaluate the seismic stability of the tailings dam [36]. Mahdi et al. numerically simulated the stability of the high line tailings dam under earthquake conditions, and the results showed that the dam under study was unstable under strong earthquake conditions [37].
In this case study, the Lixi tailings dam is taken as the research object. The research mainly focuses on analyzing its seepage field and stability. The dry spreading length and upstream slope ratio of the tailings dam are of concern in this paper. Following implementing the finite element method, the simulation adopts the seepage field and the stable field combination analysis method. The results of the seepage field are sorted, and the positions of phreatic line under different working conditions are obtained. This result is input into the stability analysis to obtain the safety factor under different working conditions. The analysis results can be used as a reference for the control of dry beach length and the upstream slope ratio in the tailings dam project.
2. Project Overview
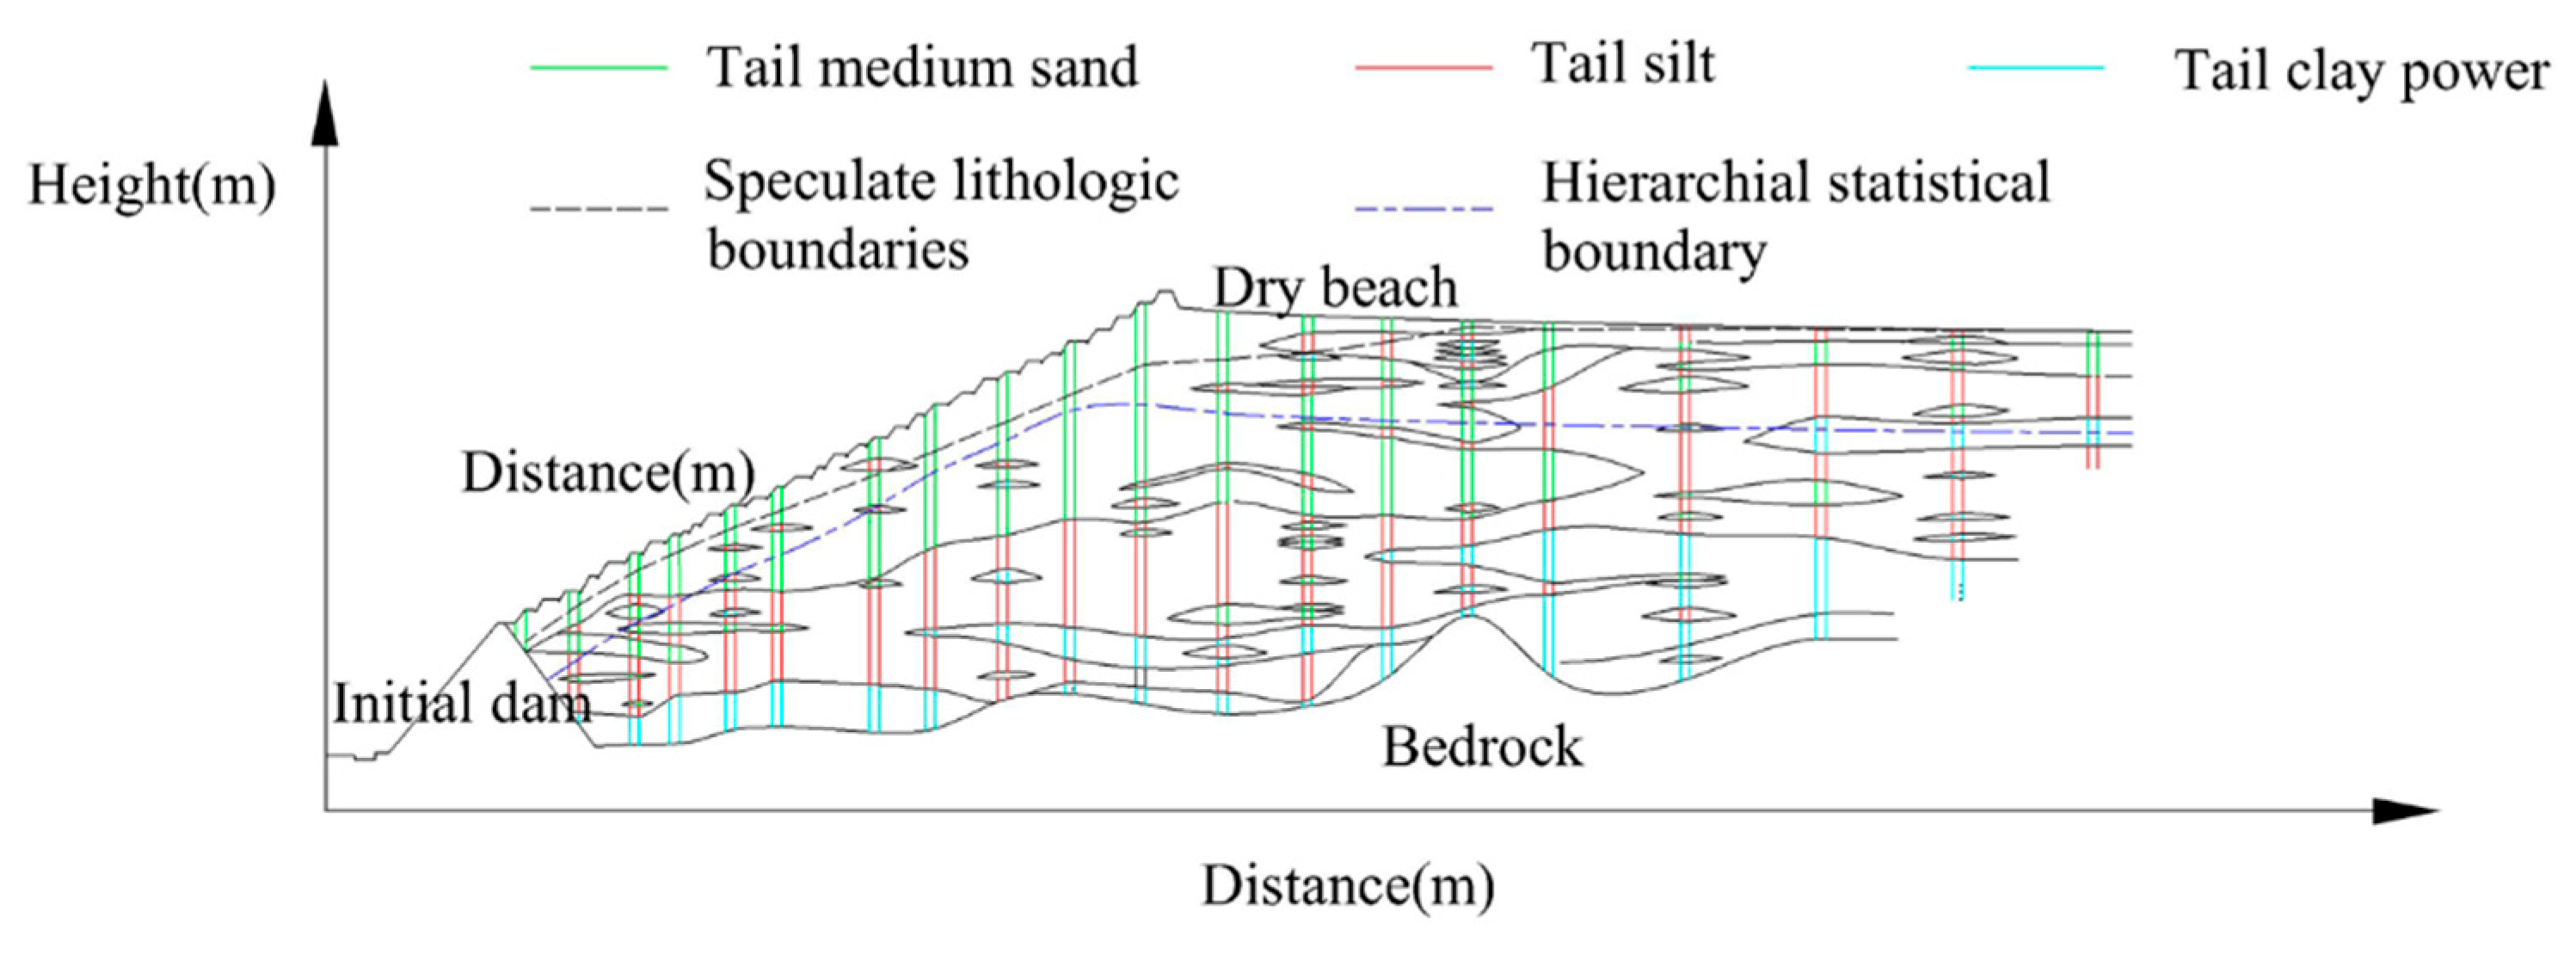
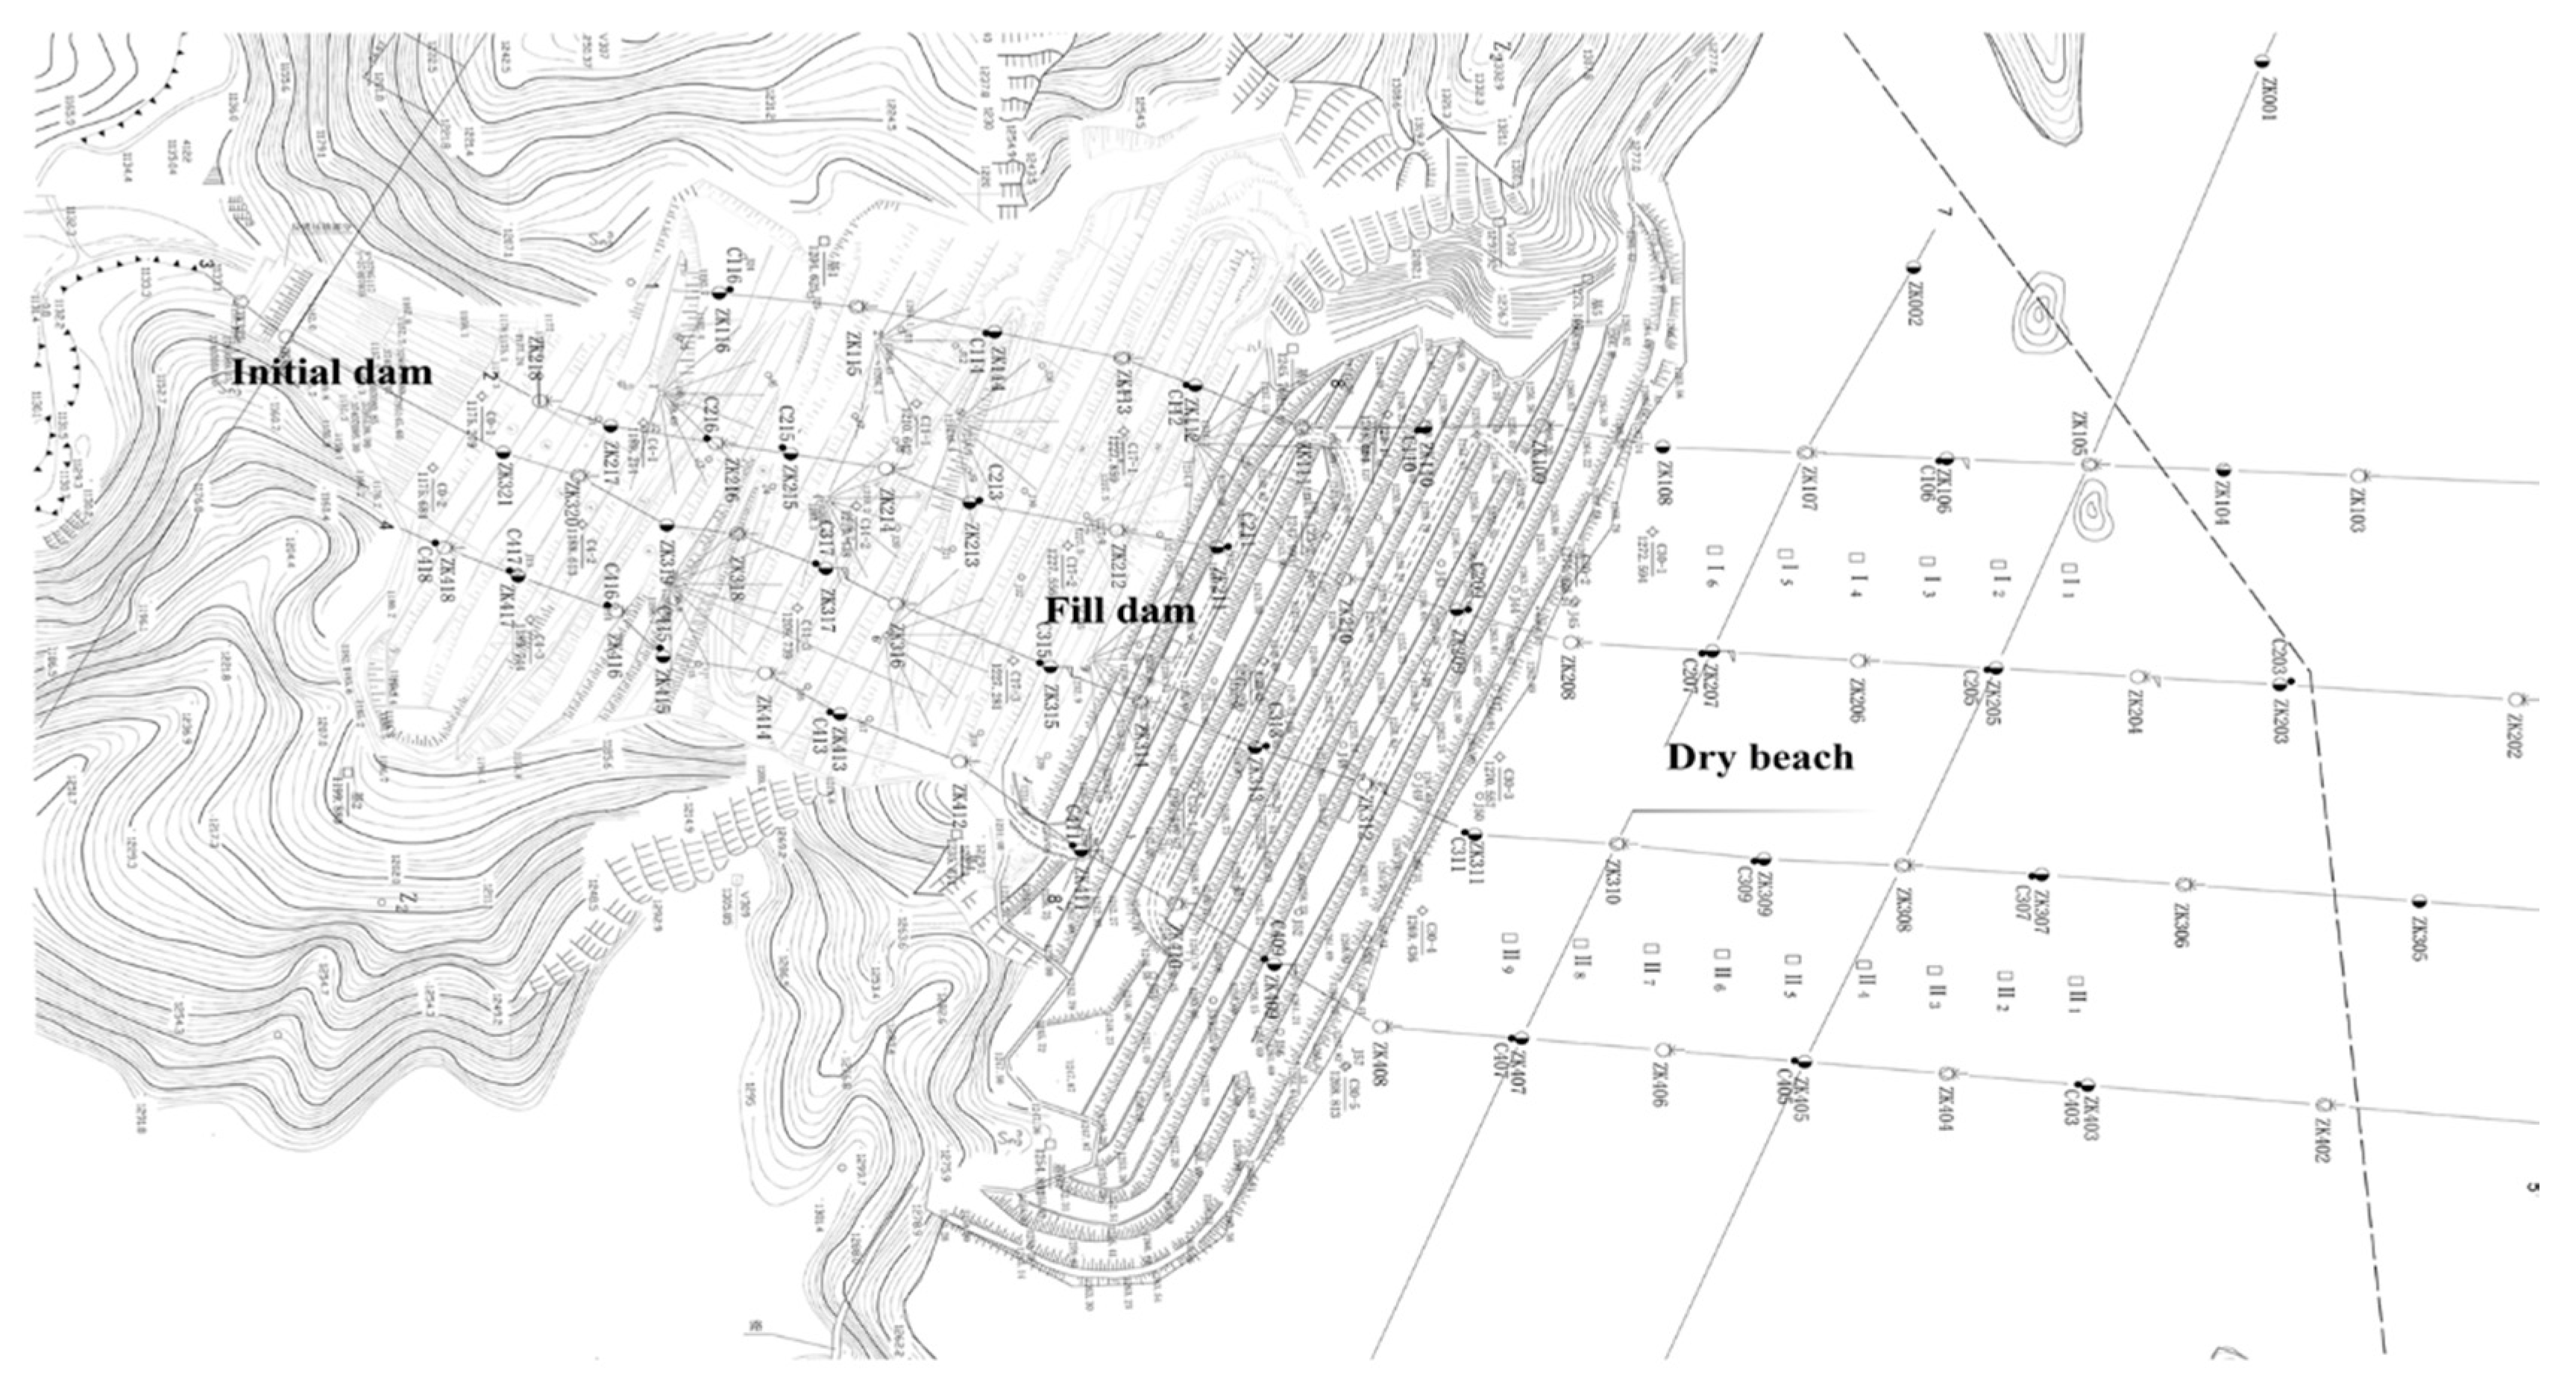
The Lixi tailings dam is located east of the Qinling Mountains in Lixi ravine, Jindui town, Huaxian county, Shanxi province (Figure 1). The dam was designed by the Beijing Nonferrous Metallurgy Design and Research Institute in 1973 and construction was started by the 10th metallurgy construction company of the Ministry of Metallurgical Industry in 1977. Construction was completed and the dam was put into use in 1983. The dam is designed with a final stacking dam with an elevation of 1300 m, a total storage capacity of 165 million cubic meters, a total dam height of 164.5 m, and a service life of 32 years. Originally considered a second-class tailings pond (now a first-class tailings pond), the initial dam was built as a permeable dam made of rubble and was piled up with directional blasting. The dam crest elevation is 1176.5 m, the top length is 115.0 m, the top width is 4.0 m, and the top low width is 157.0 m. The dam is 40.5 m high. The upstream and downstream slope ratios of the long-term dam are 1:1.7 and 1:2.0, respectively. There is a 2.0 m horse trail 1156.0 m downstream and a 0.7 to 1.0 m reverse filter layer at the upstream end. The later dams are raised by the upstream stacking method. The sub-bats in each period are 3 m high, and the loader is used to ship the results. The tailings pipe is laid on the top of the sub-dam for decentralized ore discharge, and the tailings are deposited after natural classification to form a late-stage accumulation dam. The outer slope of the dam is stepped, and the designed total slope ratio is 1:5. It is covered with soil-bearing gravel and has a grid-like drainage ravine. The sectional view is shown in Figure 2. The layout of the project is shown in Figure 3.
3. Model and Computational Method
3.1. Simulation Model
In this study, ADINA was used to simulate the three-dimensional (3D) seepage field, and SEEP/W in the Geo-Studio software was used to simulate the seepage field of the two-dimensional (2D) maximum profile. The results were coupled using SLOPE/W software for the safety coefficient calculation.
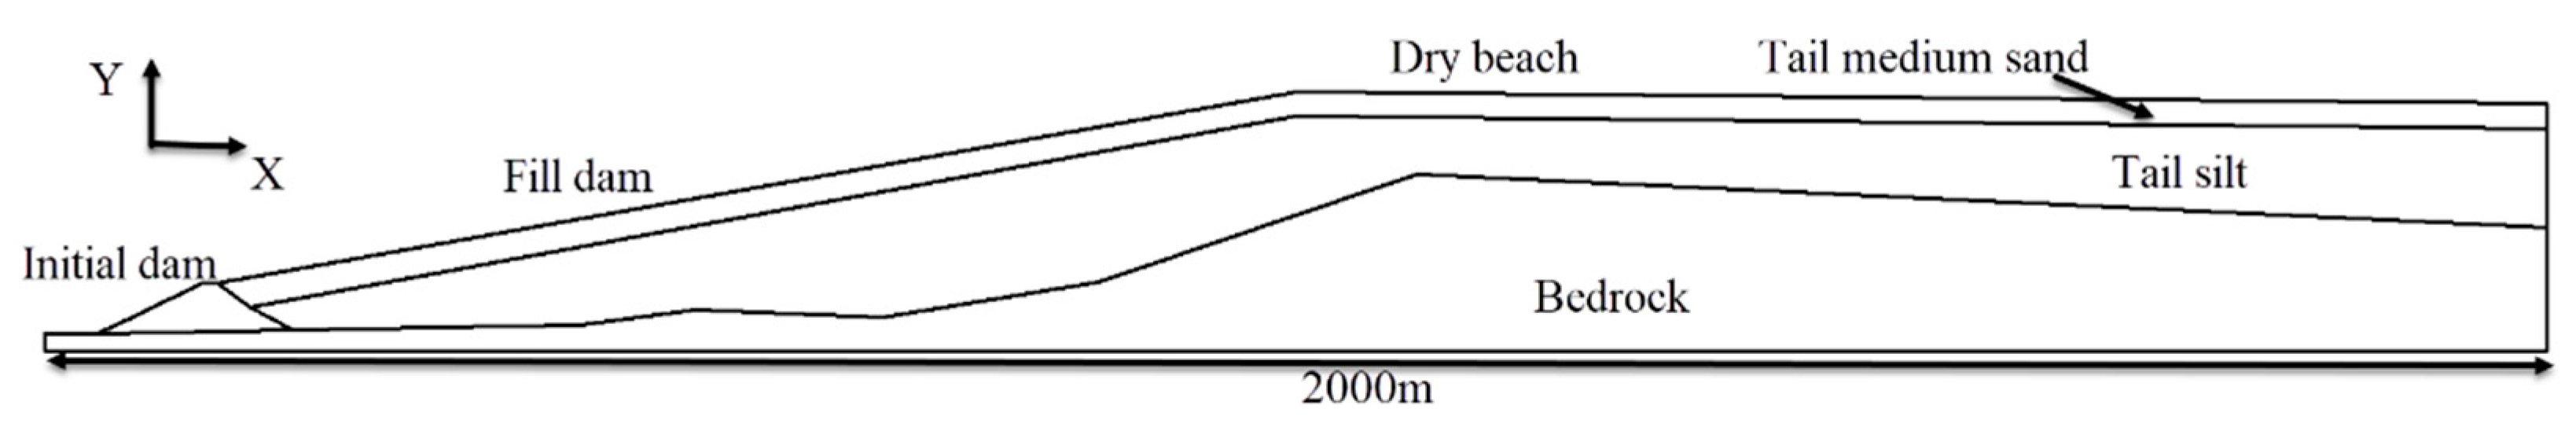
The model was simplified in the process of modeling. When modeling in Geo-Studio, the dimensional parameters of the model are measured in CAD from Figure 1. In the X direction, the extension direction of the stack dam is divided and taken. The boundary between different materials of the dam is distinguished by a broken line. The materials at different locations of the dam are reduced to bedrock, tail silt and tail medium sand. The sub-dams at different elevations are simplified as a straight line from the initial dam to the dam top. The elevation of the foundation surface was 1120 m, and the elevation of the simulated thirty-fifth pile dam was 1330 m. The length of the simulation in the X direction of the model is 2000m. The curve is simplified to a straight line connected at different points. The resulting model is shown in Figure 4.
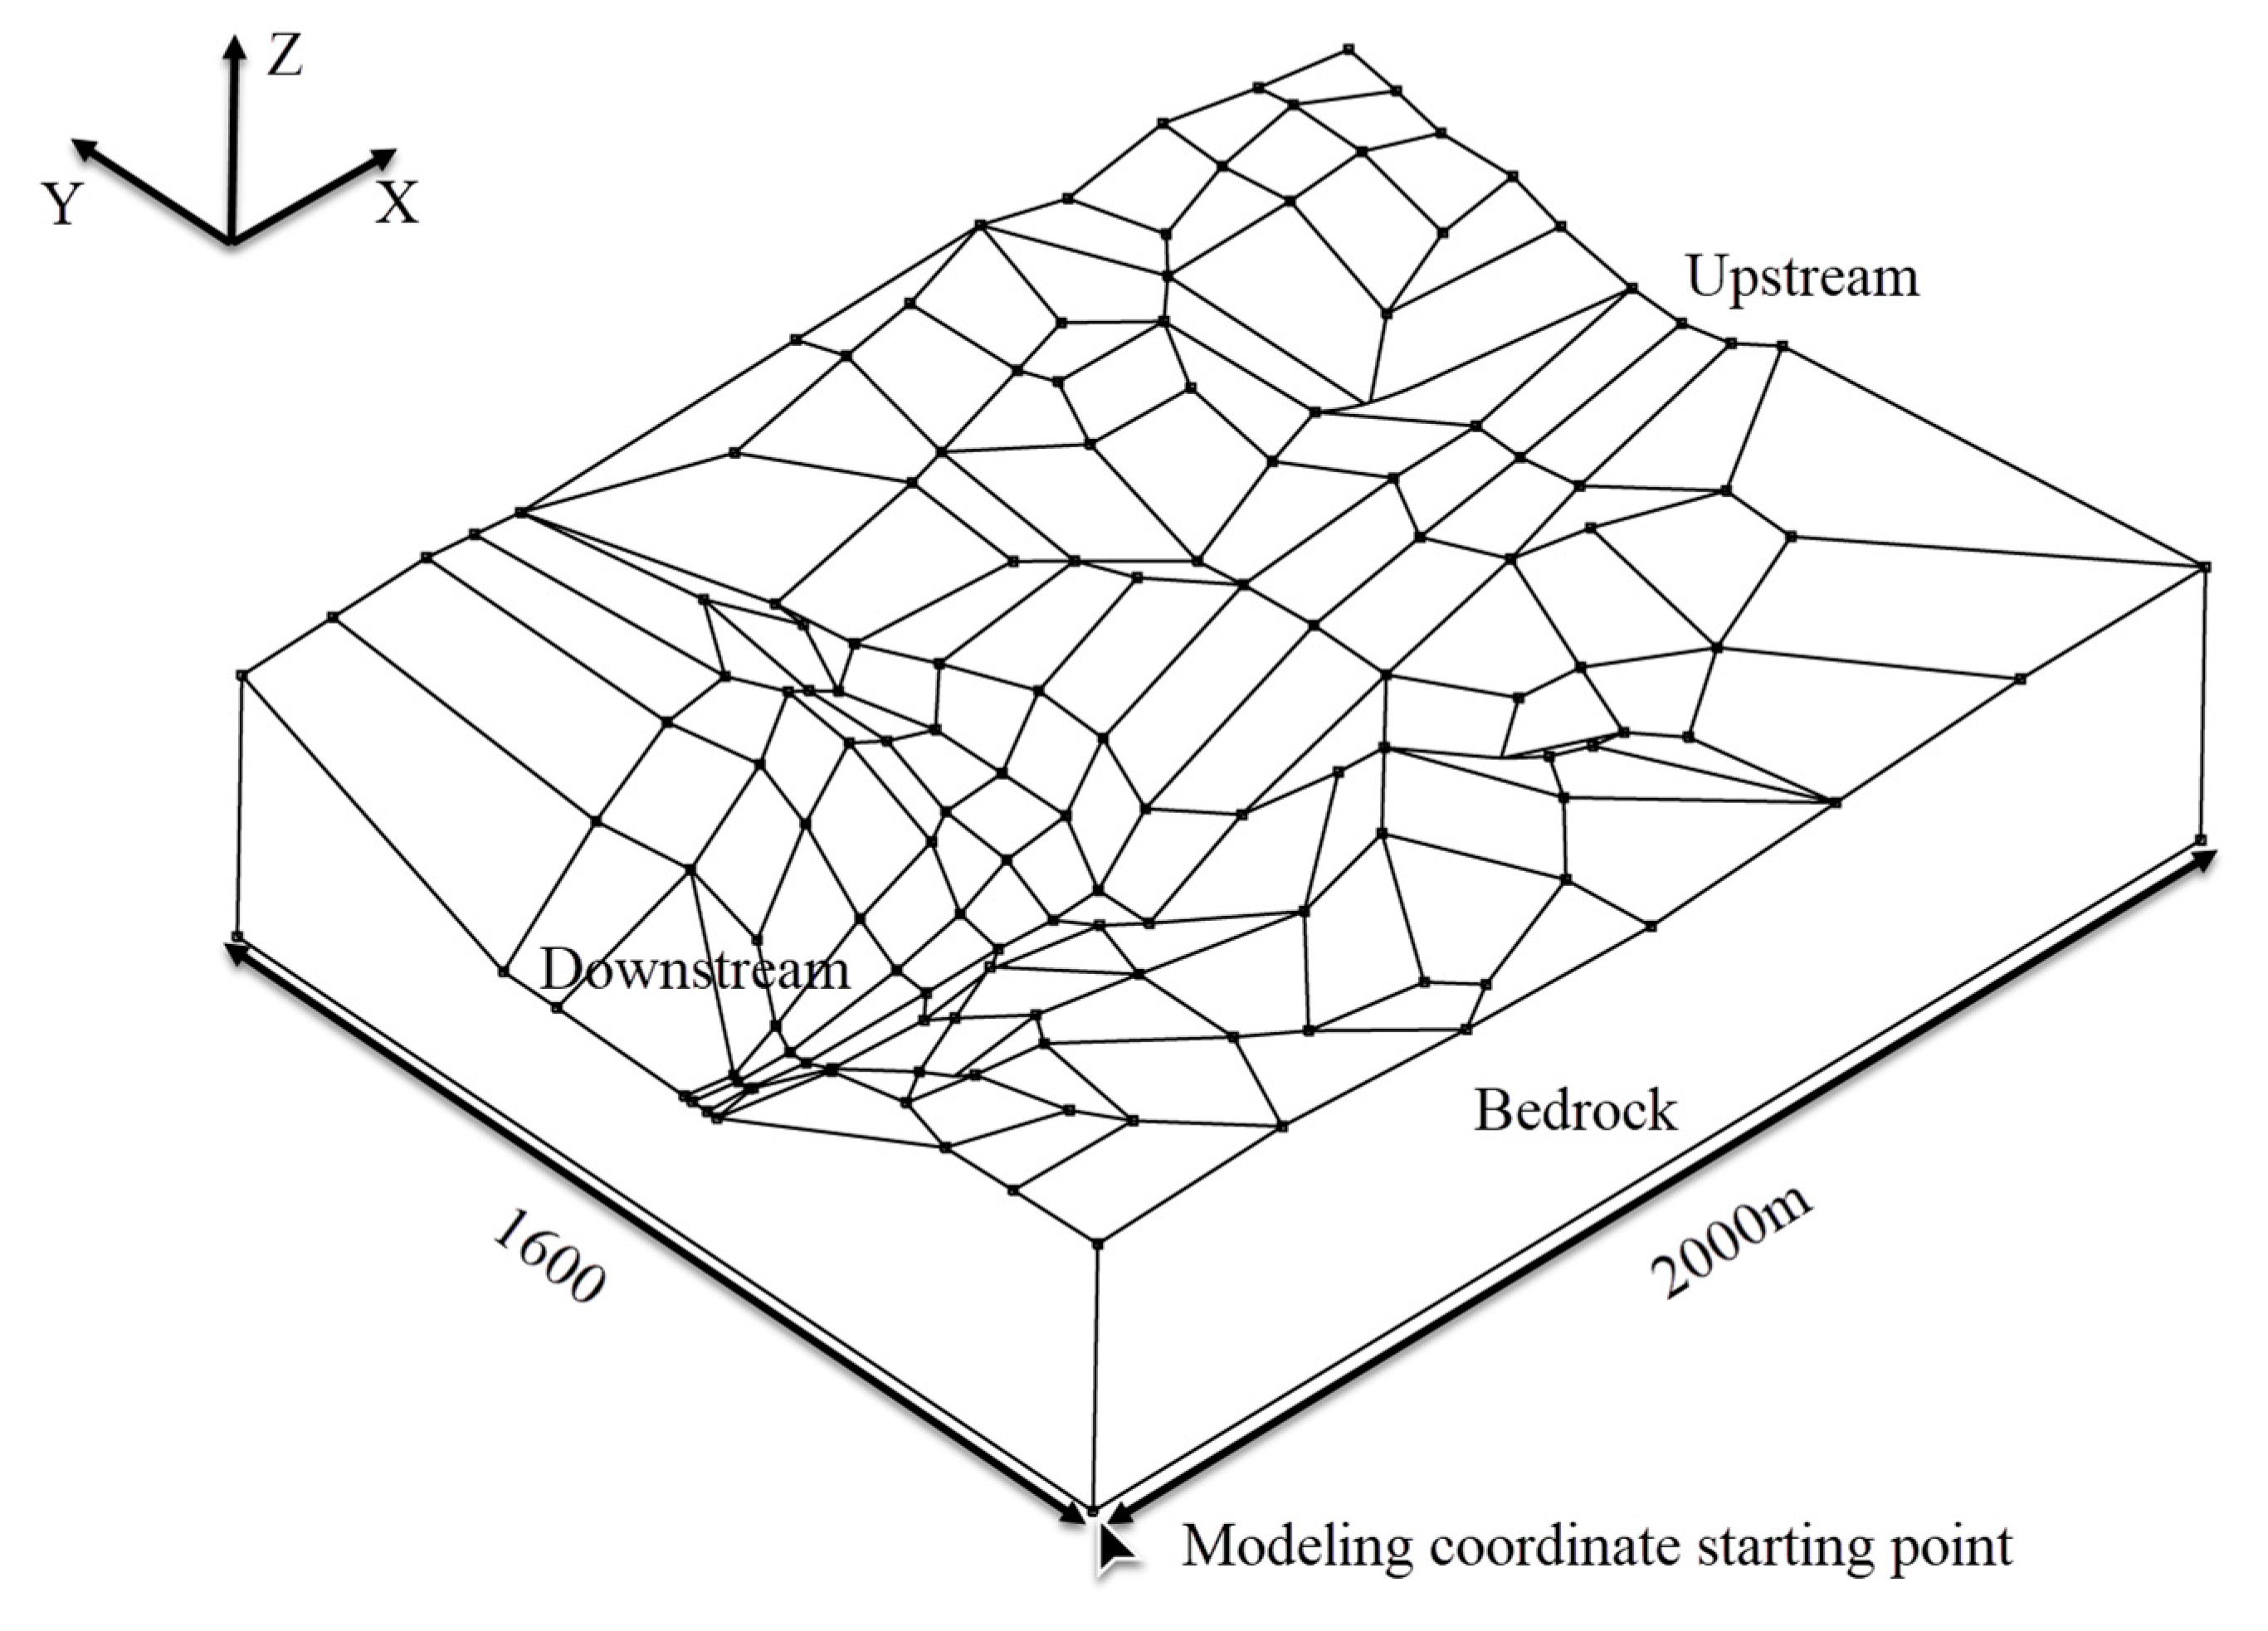
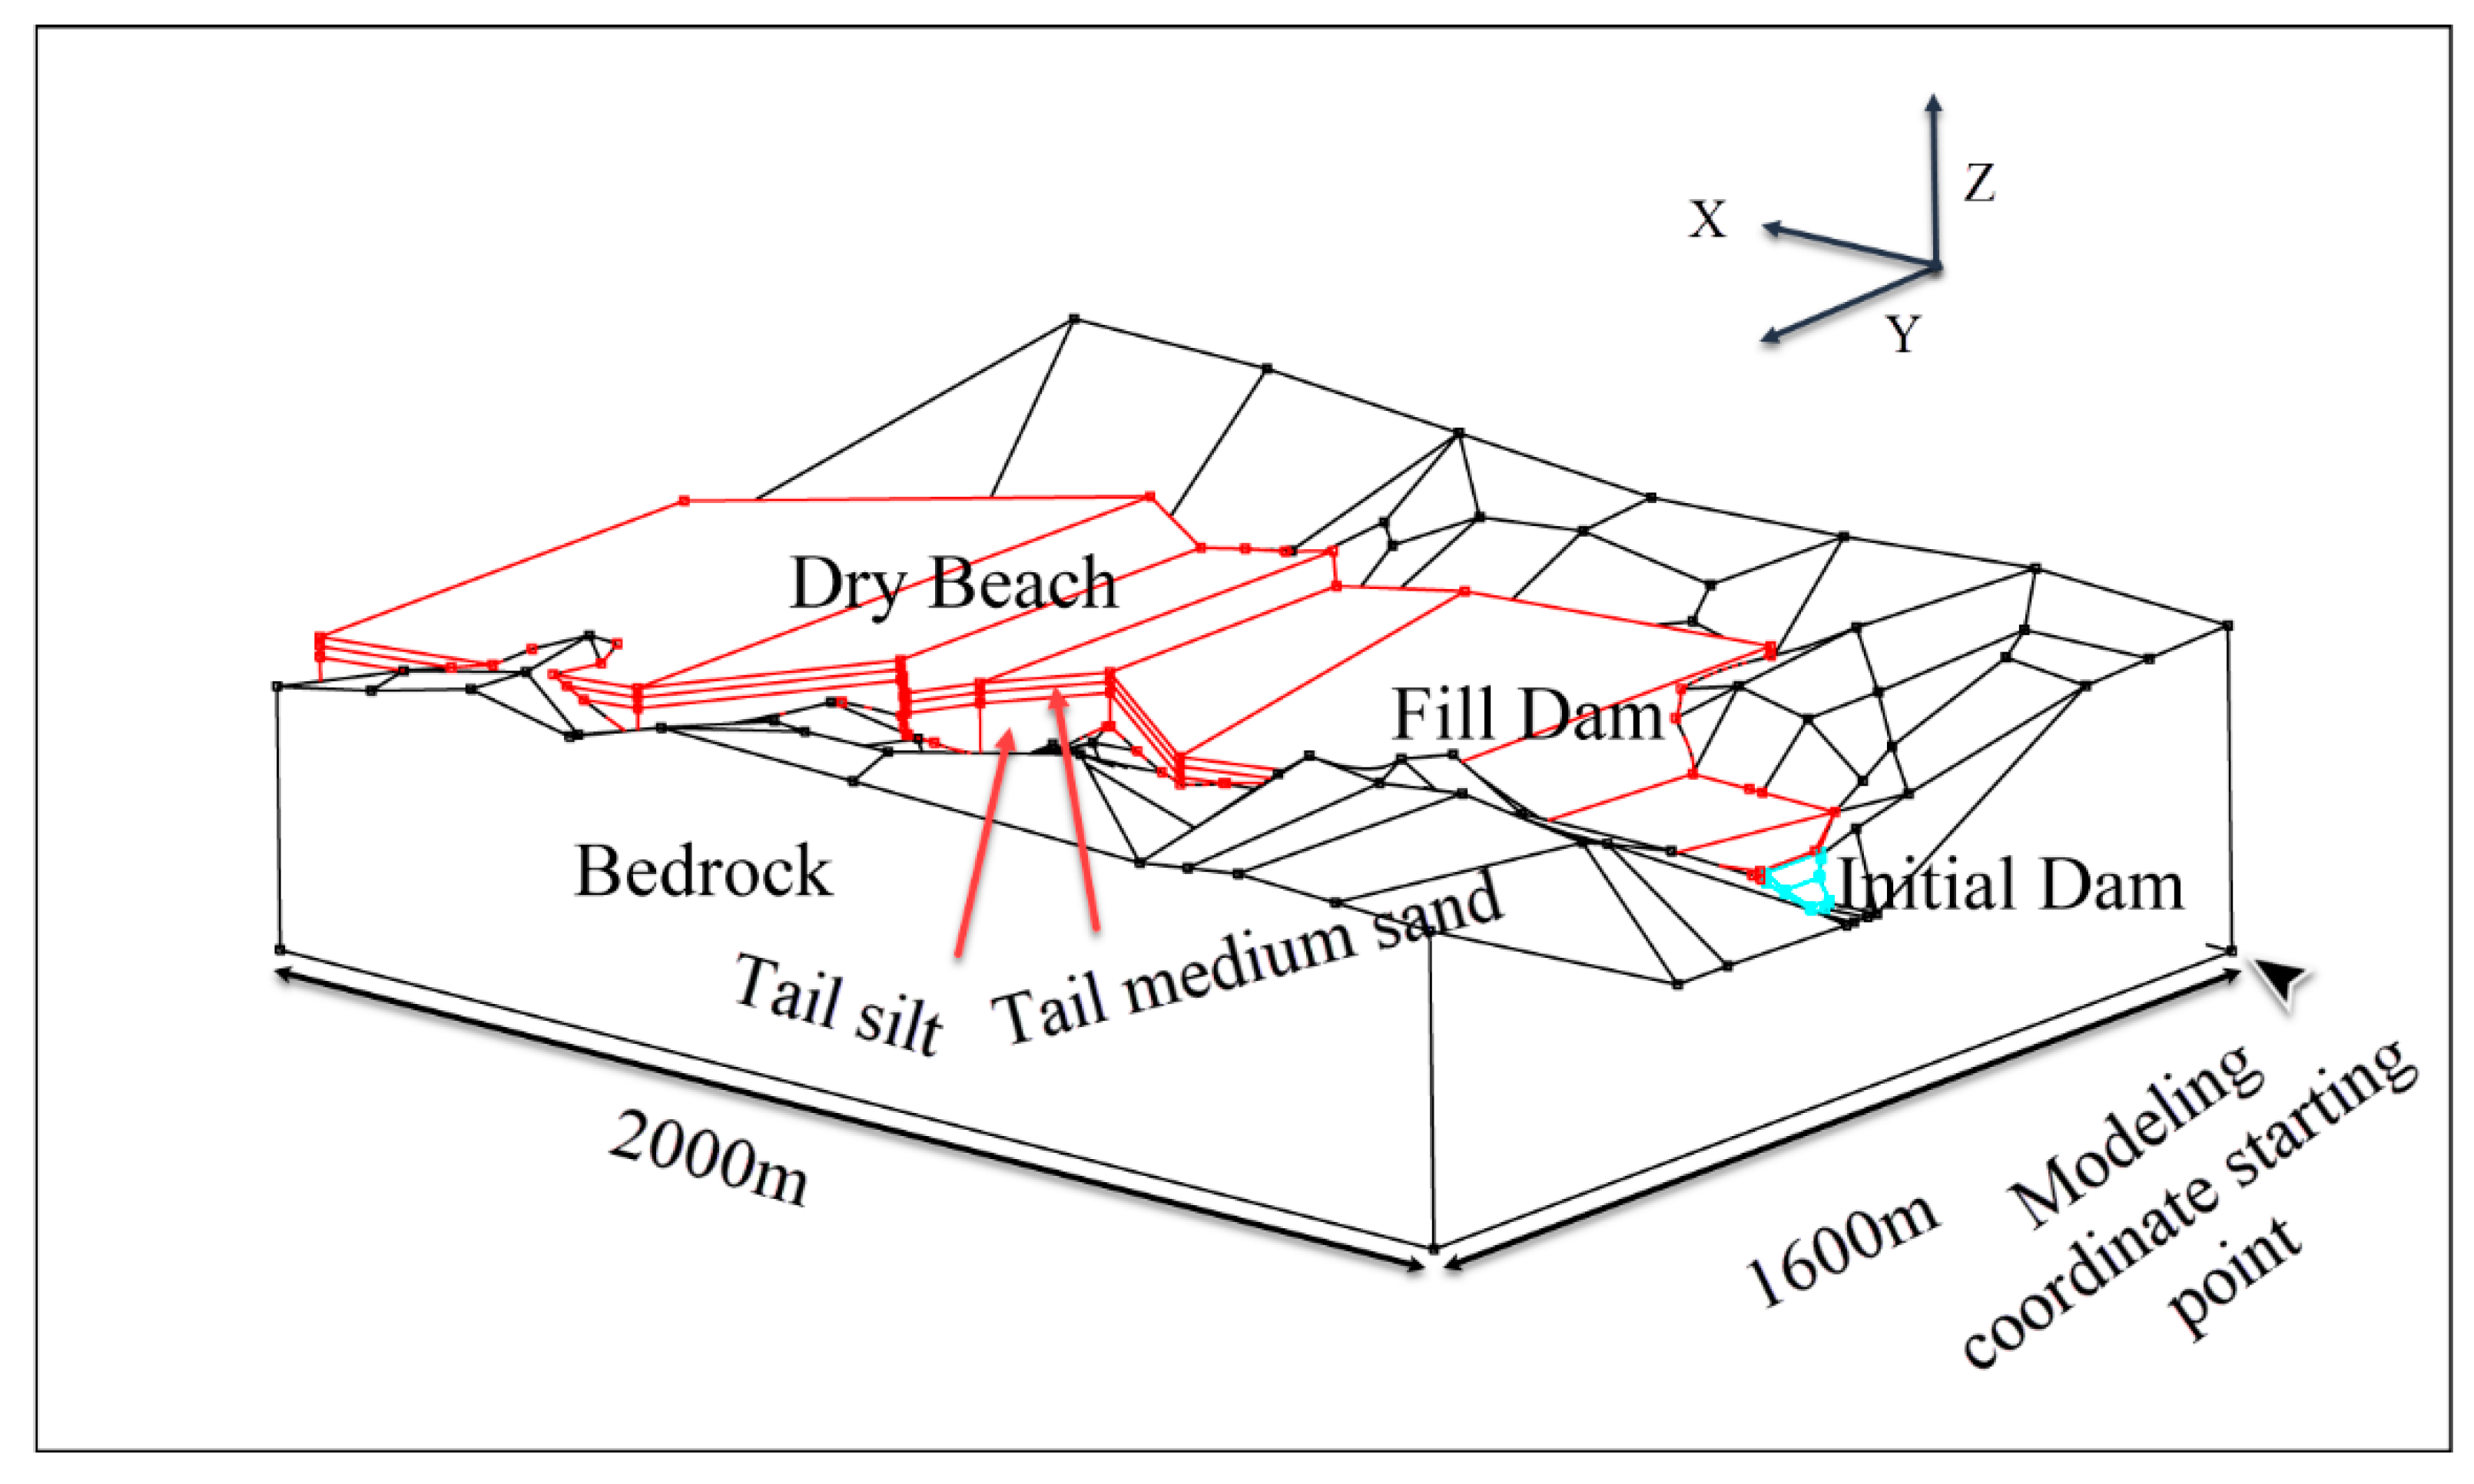
When modeling in ADIN, the modeling scope was designed to take into account the entire research area. In the dam body left and right bank (Y direction) extend outward 100m. At the upstream of the dam (X direction), the length of the dry bench is approximately equal to the length of the fill dam. For the convenience of modeling, take the number of its range as an integer. Therefore, the modeling range was selected as 2000m in the X direction and 1600m in the Y direction. The elevation of the foundation model at the starting point in the Z direction is 1100m. First, the terrain is divided into different sizes and these pieces are modeled. Then, the Boolean operation is used in ADINA. These pieces of bedrock are integrated into a complete foundation. The obtained foundation model is shown in Figure 5. It is then combined with Figure 2 and Figure 3. The 3D model had the same partitioning as the previous 2D one, and the pile dam was also divided into a bedrock layer, a tailings silt layer, and a tailings medium sand layer. Then, according to the stratification of different sections of the dam, the stratification is established. The rest of dam is modeled. Finally, through Boolean operation in ADINA, subtracting the overlapping part of foundation and dam body, the subtracted interface is the interface between dam body and surrounding bedrock. The 3d model of the tailings dam obtained using the Boolean operation is shown in Figure 6.
The material of the dam body was divided into three parts: tail silt, tail medium sand, and initial dam and bedrock. The material properties of the different parts are shown in Table 1.
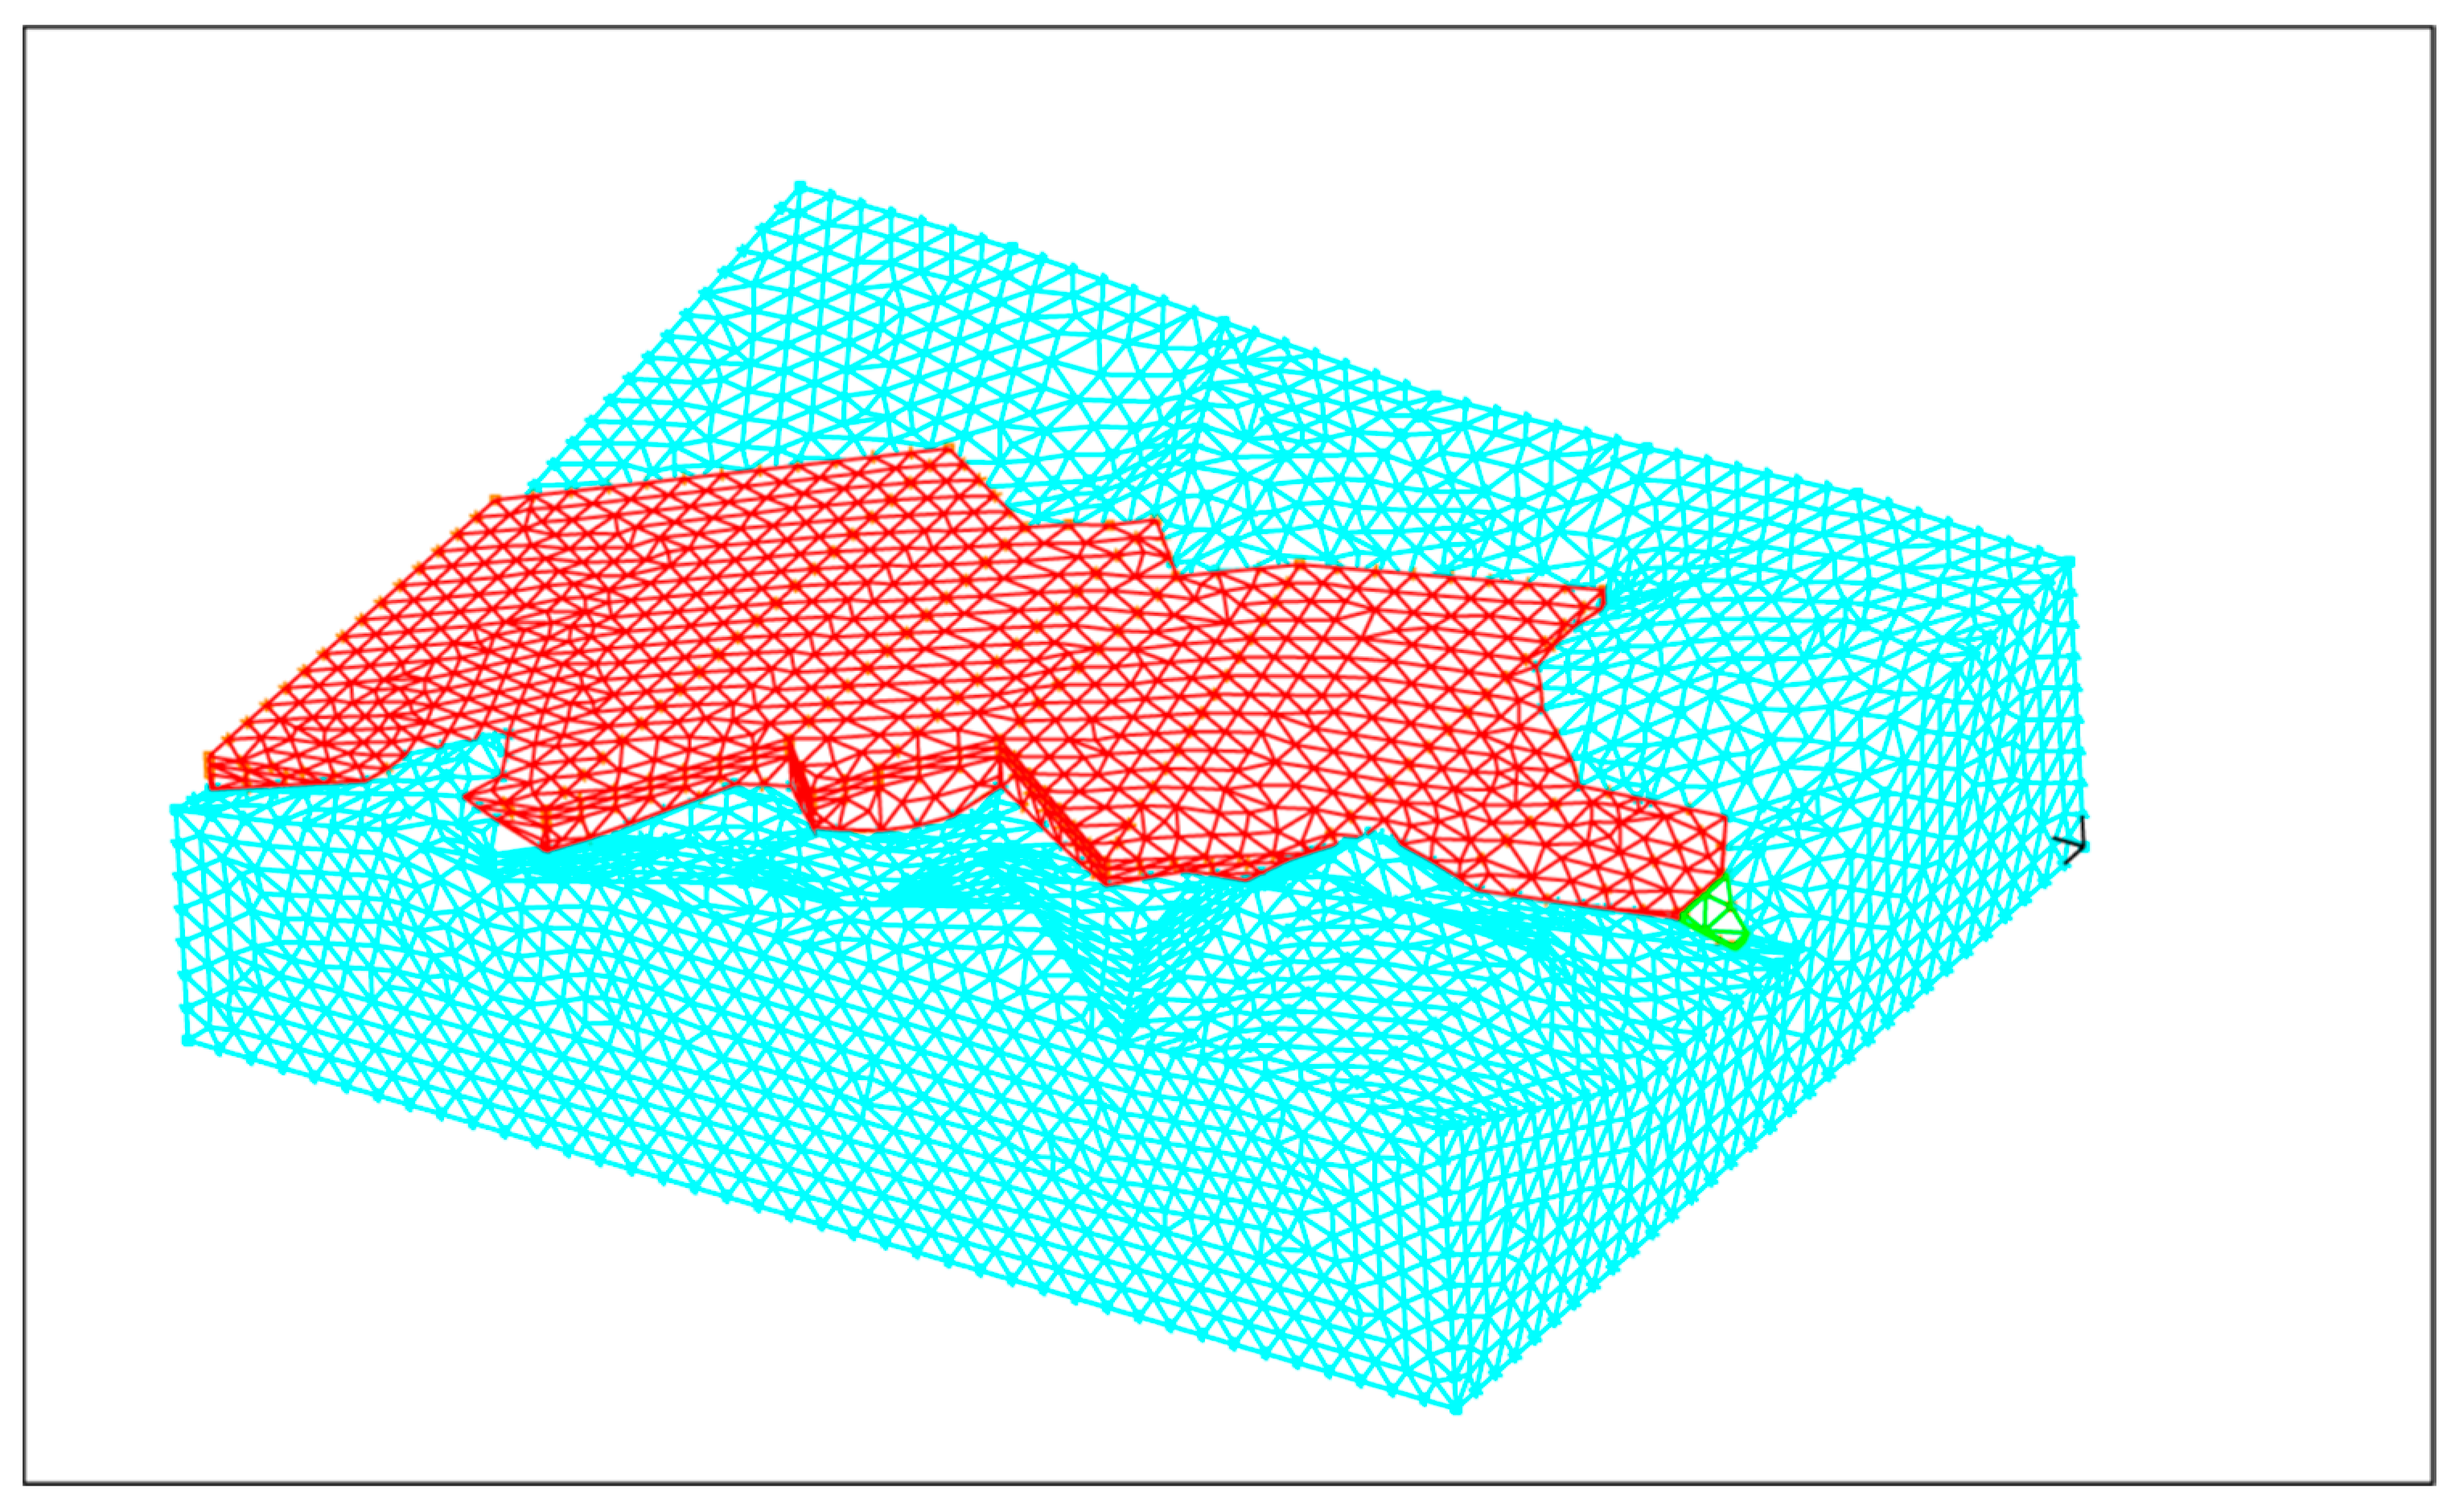
The size and quantity of mesh are very important in finite element analysis. When the mesh generation is less, the calculated results cannot meet the requirement of accuracy. When the mesh generation is more, the computational workload is large and the time required for processing is long. Applying a tetrahedral element to the terrain gives it a strong adaptability. Therefore, we use a tetrahedron as a unit for subdivision. In order to meet the requirements of accuracy, the calculation is not very large. By trial and error, the length of each unit is selected to be 50 m. Mapped and Free-Form subsections are used. The model after grid generation is shown in Figure 7. The bedrock was divided into 90,742 units. The initial dam is divided into 387 units. The tailings silt layer was divided in to 9209 units. Tailings medium sand layer was divided in to 8211 units.
3.2. Boundary Conditions and Calculation Conditions
The downstream water level boundary is in the initial dam. After the dry beach, the upstream water level boundary is added. Both of these boundaries are added to the surface on which they are located.
In the simulation of different working conditions, the effect of dry beach length and upstream slope ratio was considered. Under the influence of these two factors, the seepage and stability of tailings dam are simulated. Under the influence of only the length of the dry beach, the upstream slope ratio is kept constant. The slope ratio of upstream the dry bench is 1:100. The length of the dry benches are set as 100m and 200m, respectively. Then, to simulate the effect of the upstream slope ratio, we keep the drying length constant. The length of the dry bench is 100m. The upstream slope ratio is 1:100, 1:200 and 1:300, respectively.
4. Case Study Results
4.1. Seepage Field Simulation in ADINA
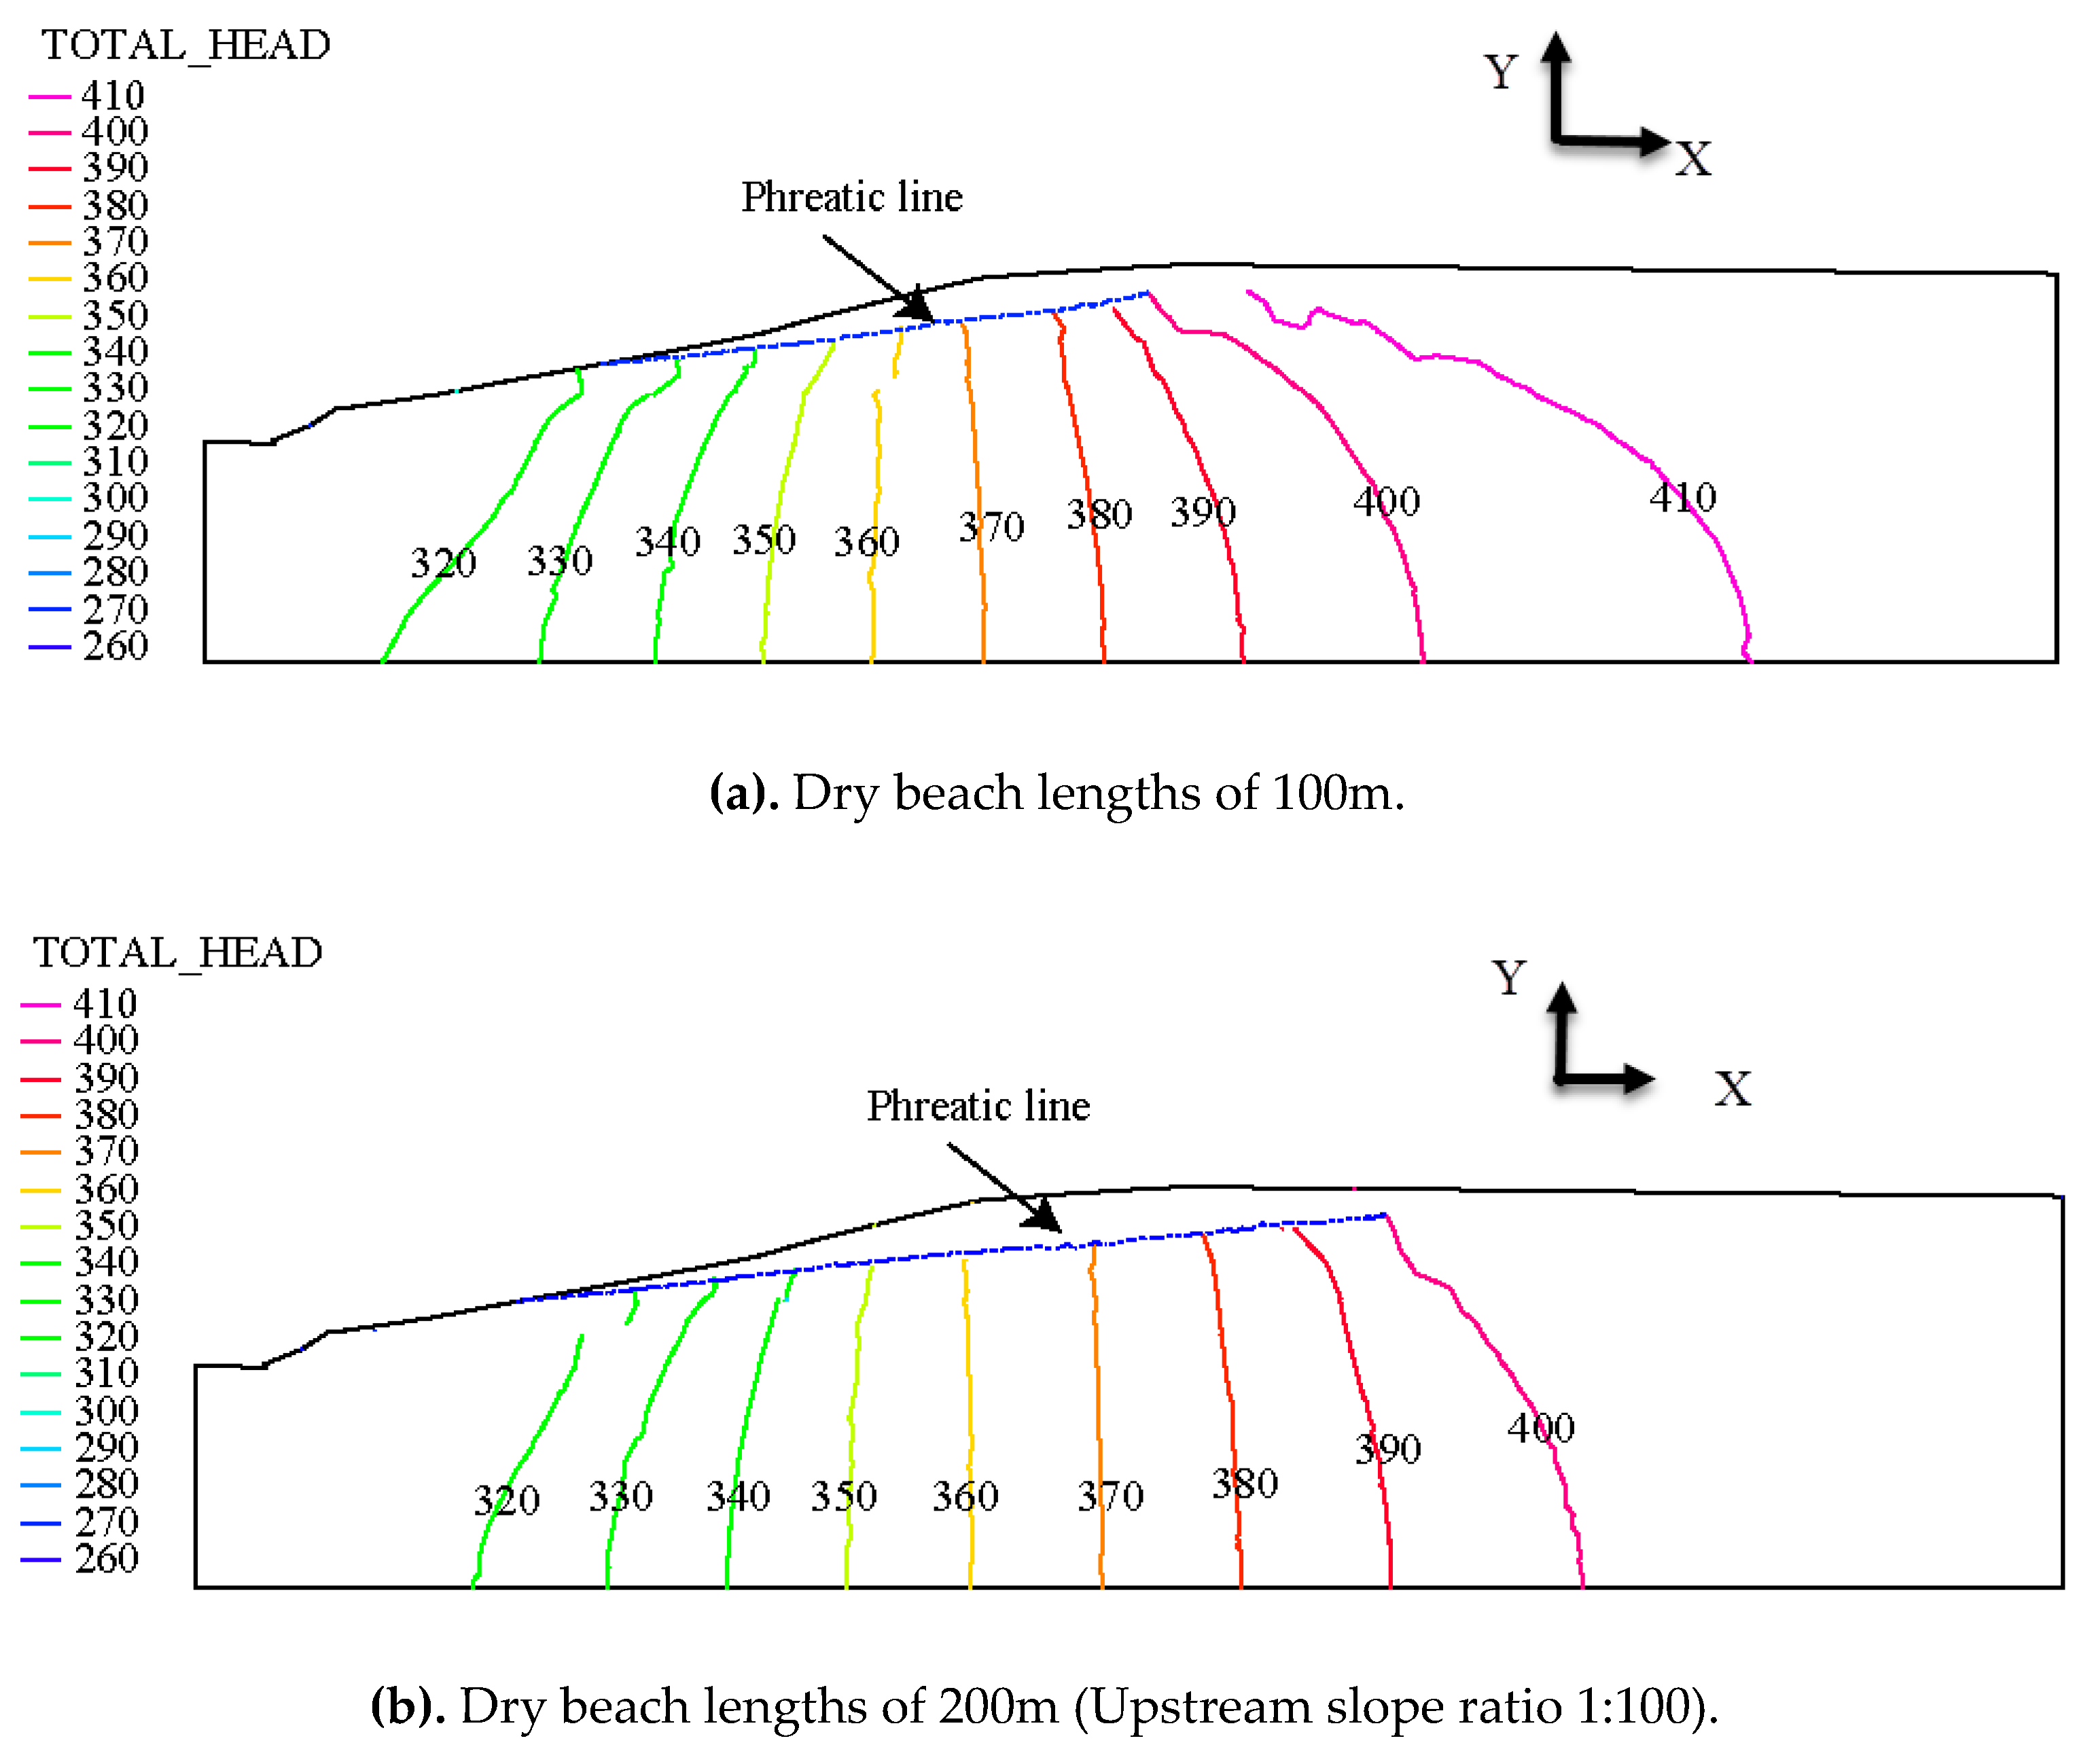
The above working conditions were calculated using the temperature field module in ADINA. We determined the total head chart and position of the phreatic line. To make the results more intuitive, we selected the appropriate section for the 3d model. The result is presented as a contour map. For the seepage of tailings dam, we are more concerned with the location of the phreatic line. The phreatic line is also known as the lifeline of the tailings dam. The seepage simulation results under different working conditions can be seen in Figure 8a–d. The total head cloud and phreatic line also can be seen in Figure 8. Figure 8a,b are the calculated results of dry beach lengths of 100 m and 200 m. Figure 8b–d are the results of the upstream slope ratios 1:100, 1:200 and 1:300, respectively.
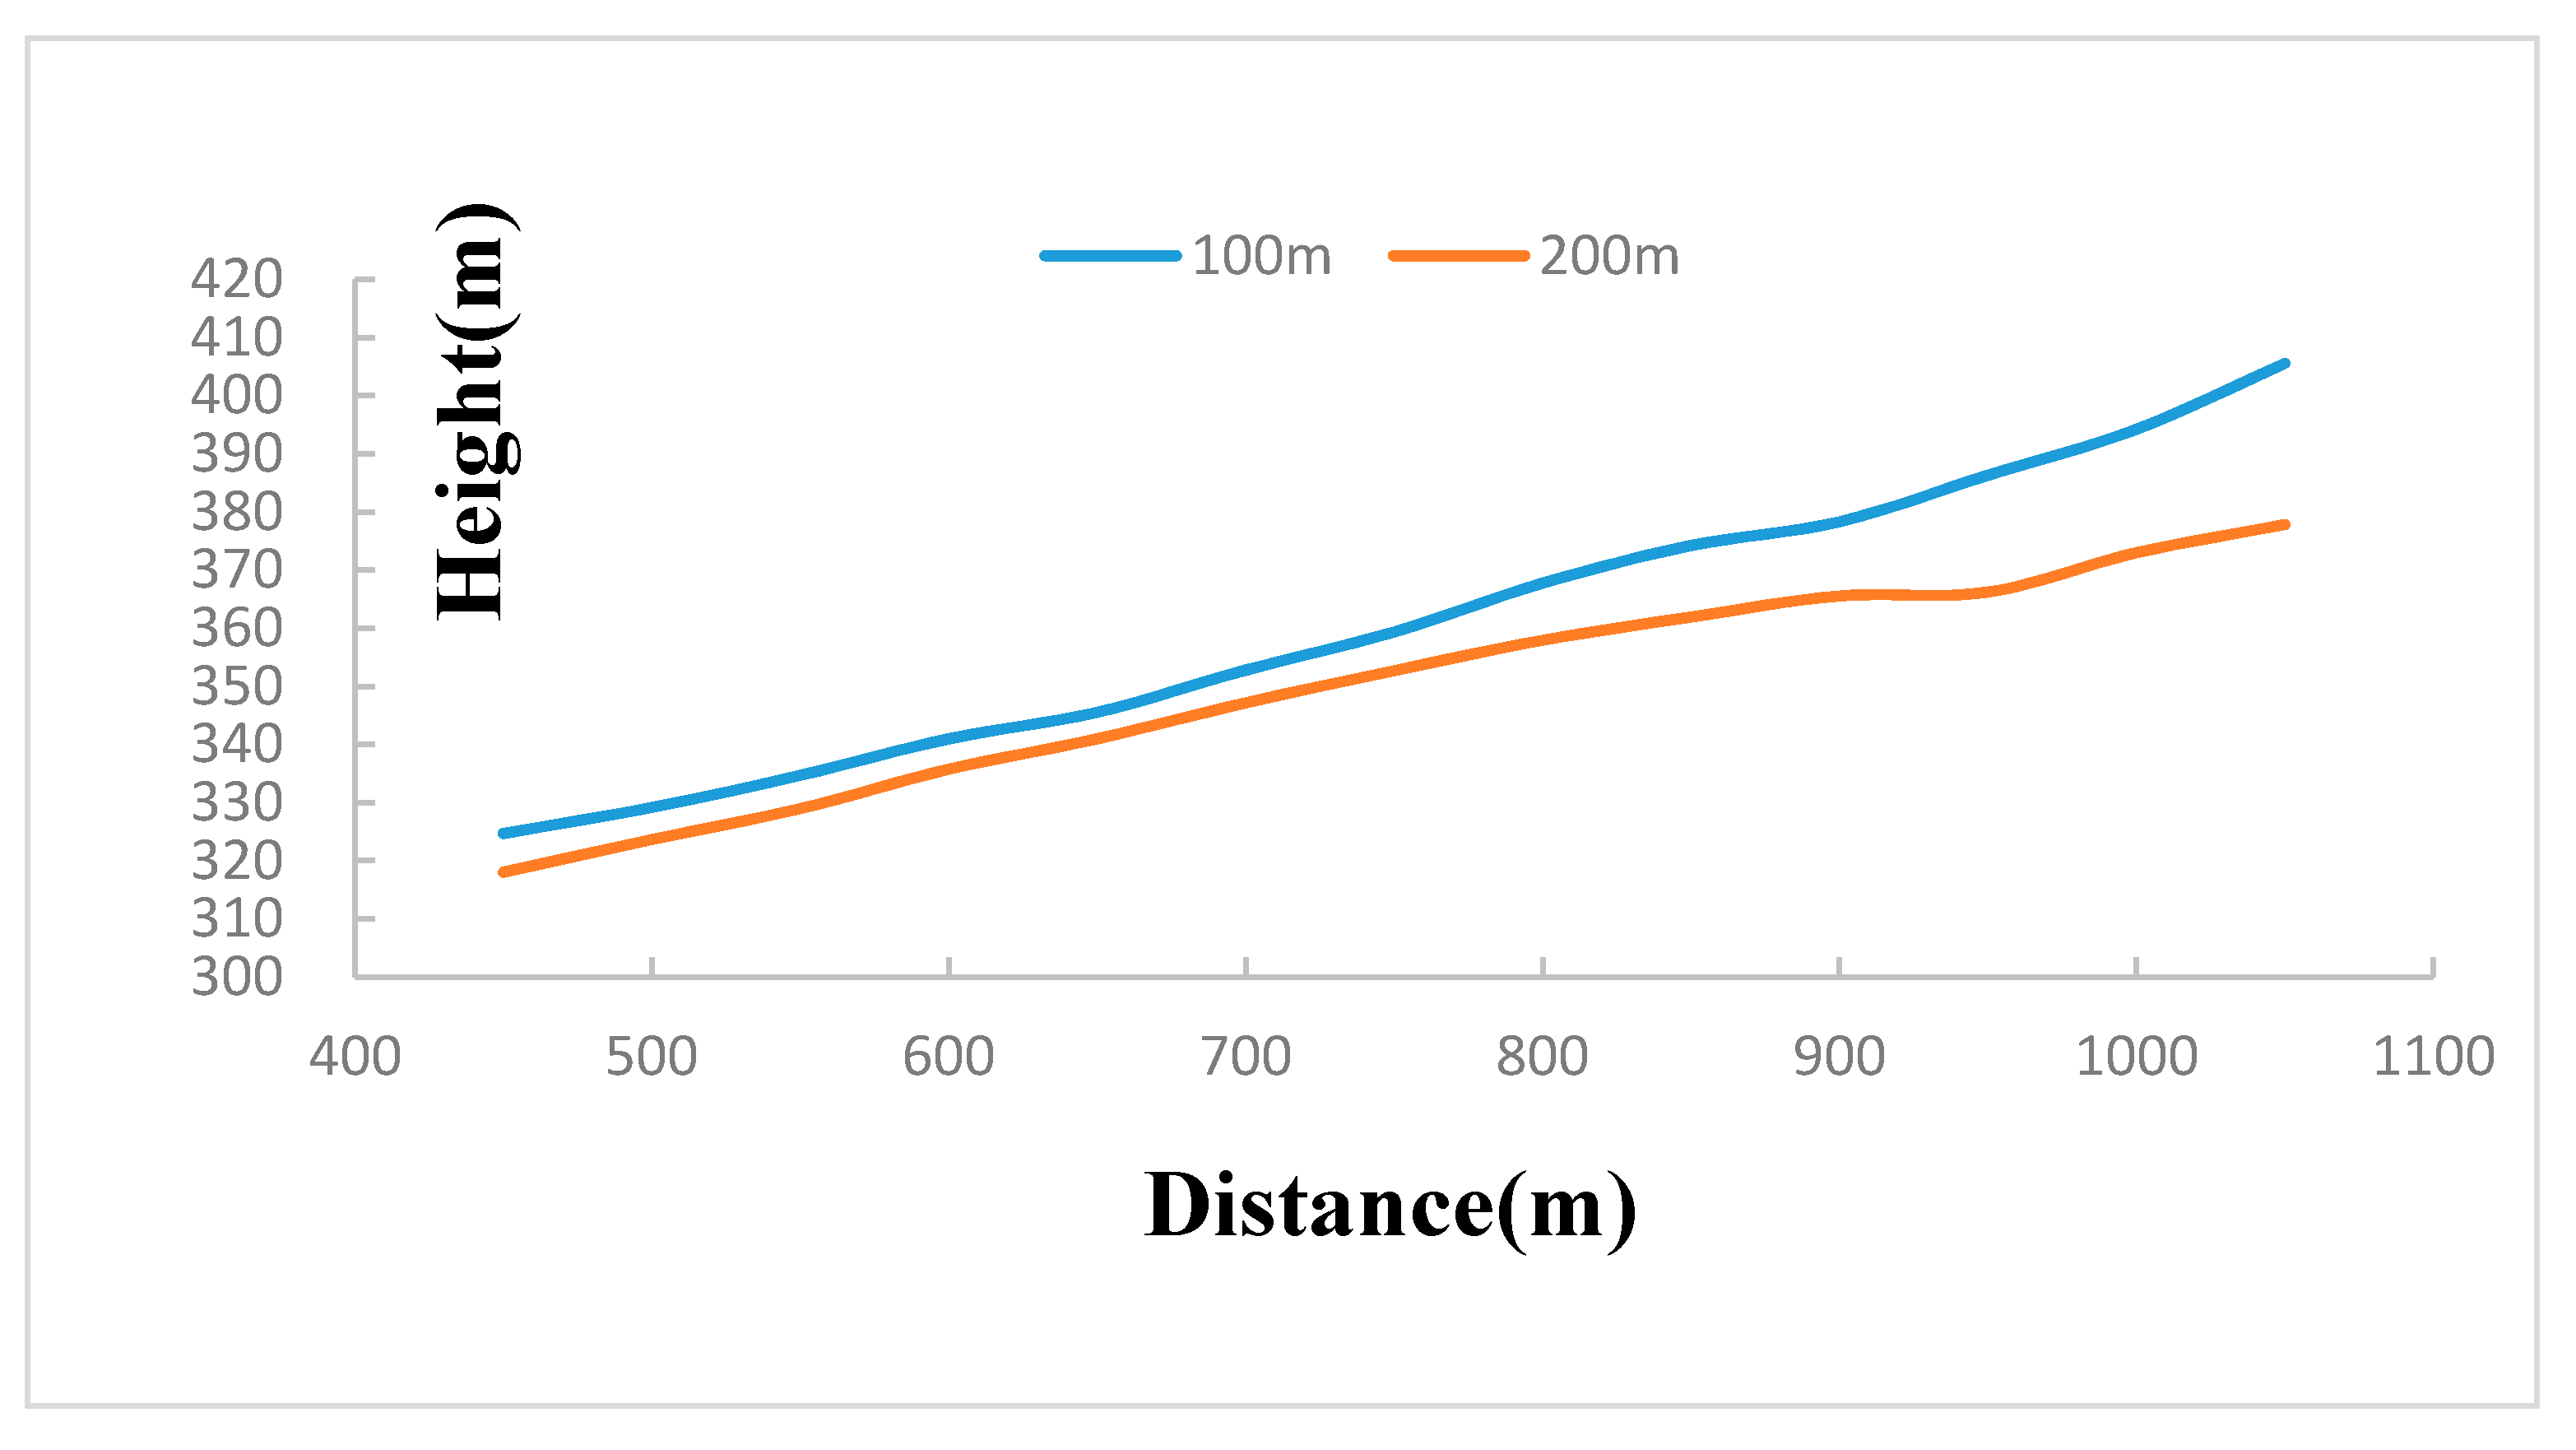
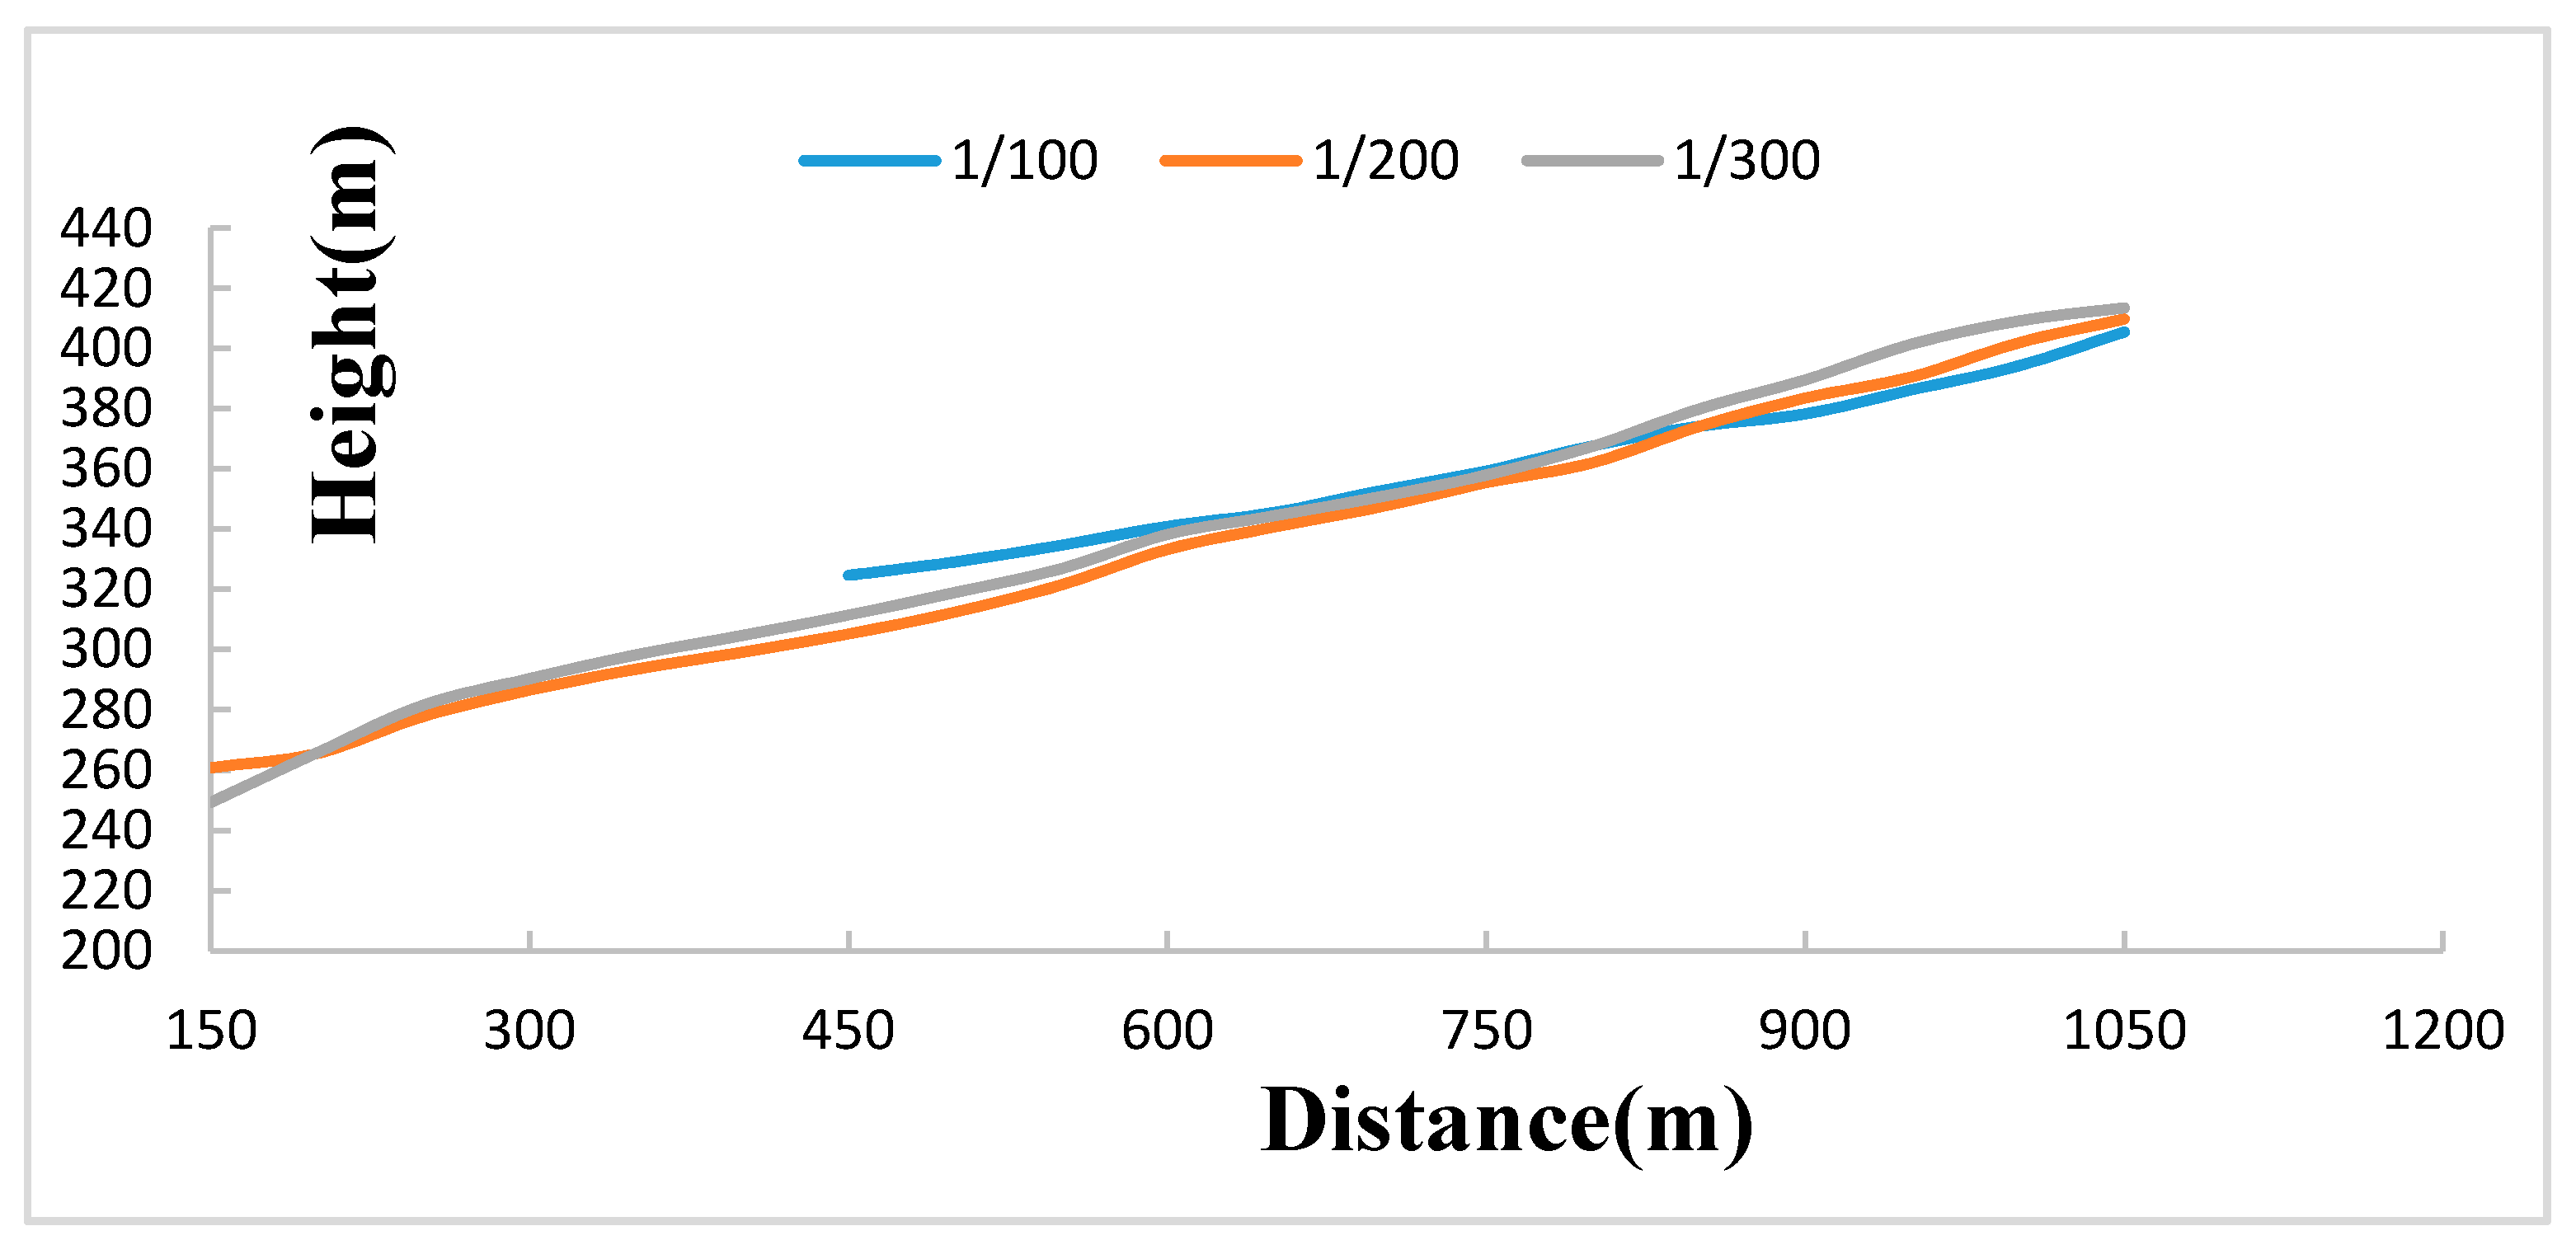
In order to obtain the influence of different factors on the phreatic line, we analyzed situations where only a single factor changed. In the Z direction, the starting position of the elevation is the bottom of the model. In the X direction, the position of the starting point is the leftmost boundary of the model. With these two positions as the starting point, the position of the infiltration line is measured. The height of the phreatic line under the ratios of different lengths of dry beach to the upstream slope was measured. The position of the phreatic line under different dry bench lengths is shown in Figure 9. The position of phreatic line under different upstream slope ratios is shown in Figure 10.
The simulation results of seepage field show that the height of phreatic line is affected by the length of dry beach and the upstream slope ratio. When the upstream slope ratio remains unchanged, the length of the dry beach changes from 100 m to 200 m. The average height reduction in the infiltration line is about 11 m, the maximum is about 27 m, and the minimum is about 4.5 m. The height of the phreatic line near the downstream of the dam decreases less. The height of the phreatic line near the upstream of the dam has decreased a lot. The upstream slope ratio changes from 1:100 to 1:200 to 1:300 when the length of the dry stand remains the same. The maximum values of the phreatic line rising near the upstream are 7.5 m and 15 m, and the minimum values are 4.3 m and 5 m. The maximum values of the phreatic line dropping near the downstream are 19 m and 13 m, and the minimum values are 0.1 m and 0.14 m. The phreatic line with a slope ratio of 1:300 is 11 m lower than the phreatic line with a slope ratio of 1:200 in the outflow seepage point. Therefore, when the phreatic line is at different dry bench lengths; the longer the dry bench, the lower the height of the phreatic line. The height of the phreatic line near the upstream of the dam decreased significantly when the phreatic line was at a different upstream slope ratio. At the upstream of the dam, the higher the upstream slope ratio, the higher the elevation of the phreatic line. In the downstream of dam, the larger the upstream slope ratio, the lower the height of the phreatic line.
4.2. Stability Calculation in Geo-Studio
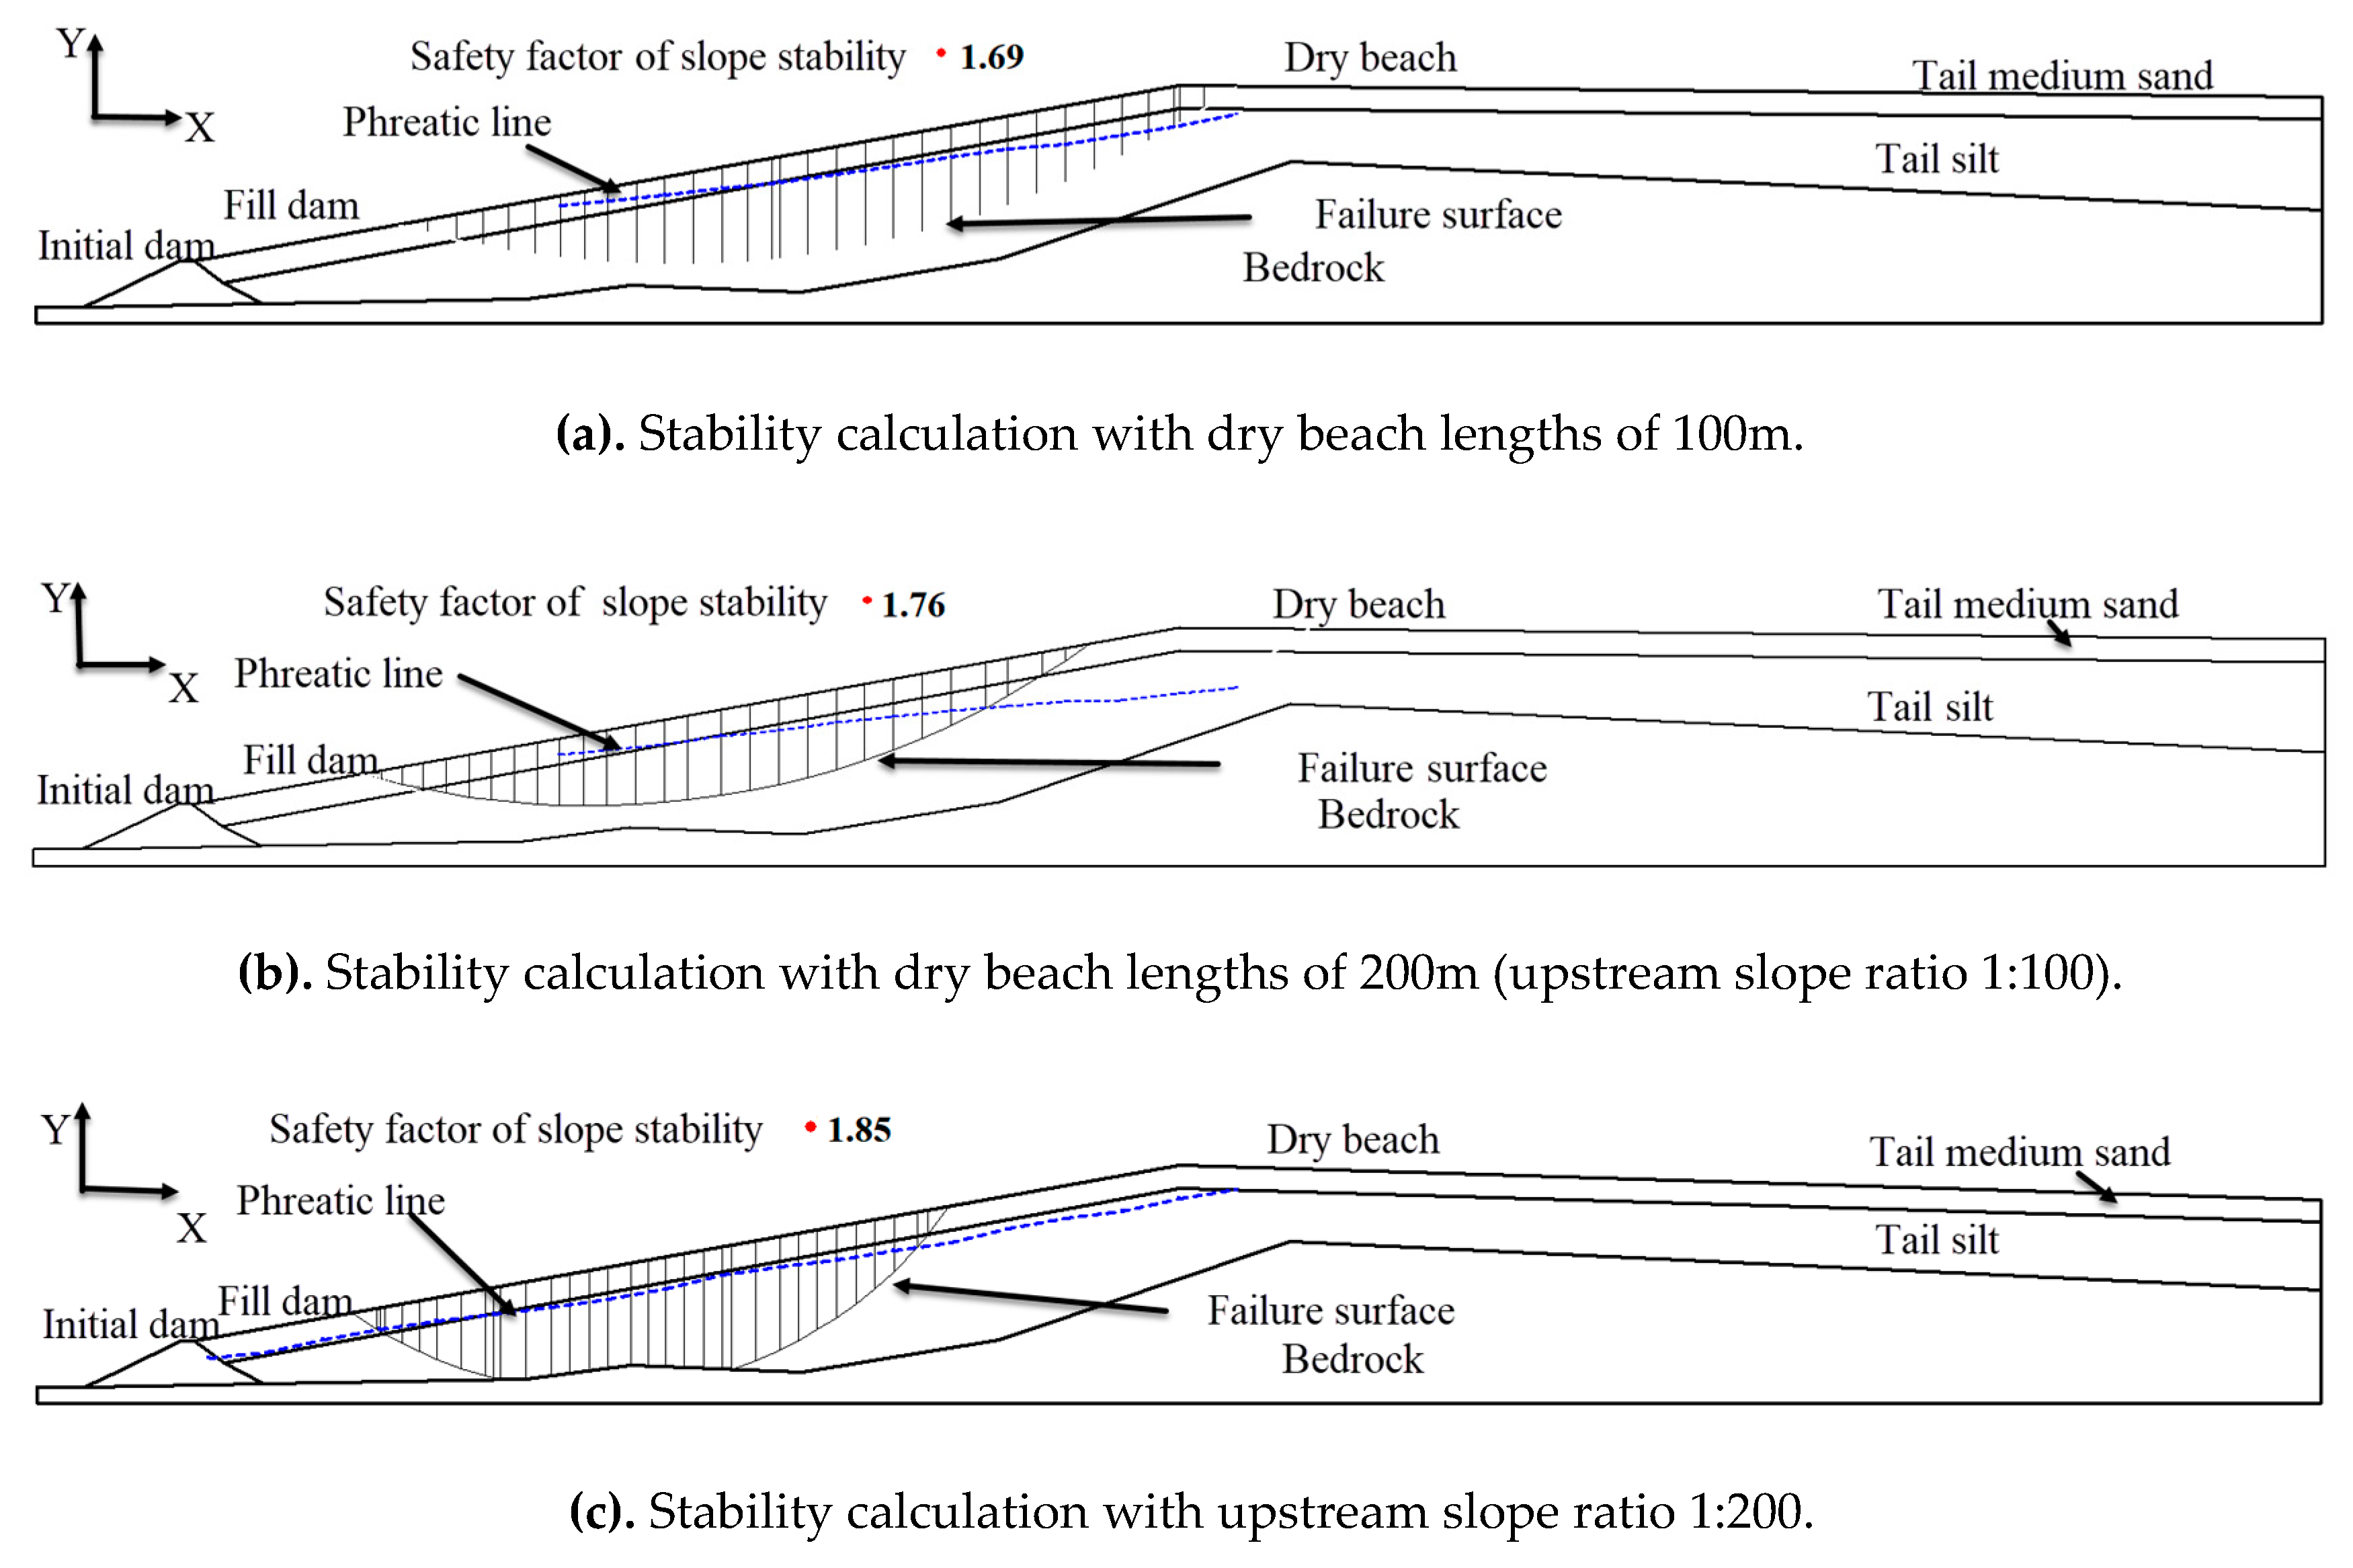
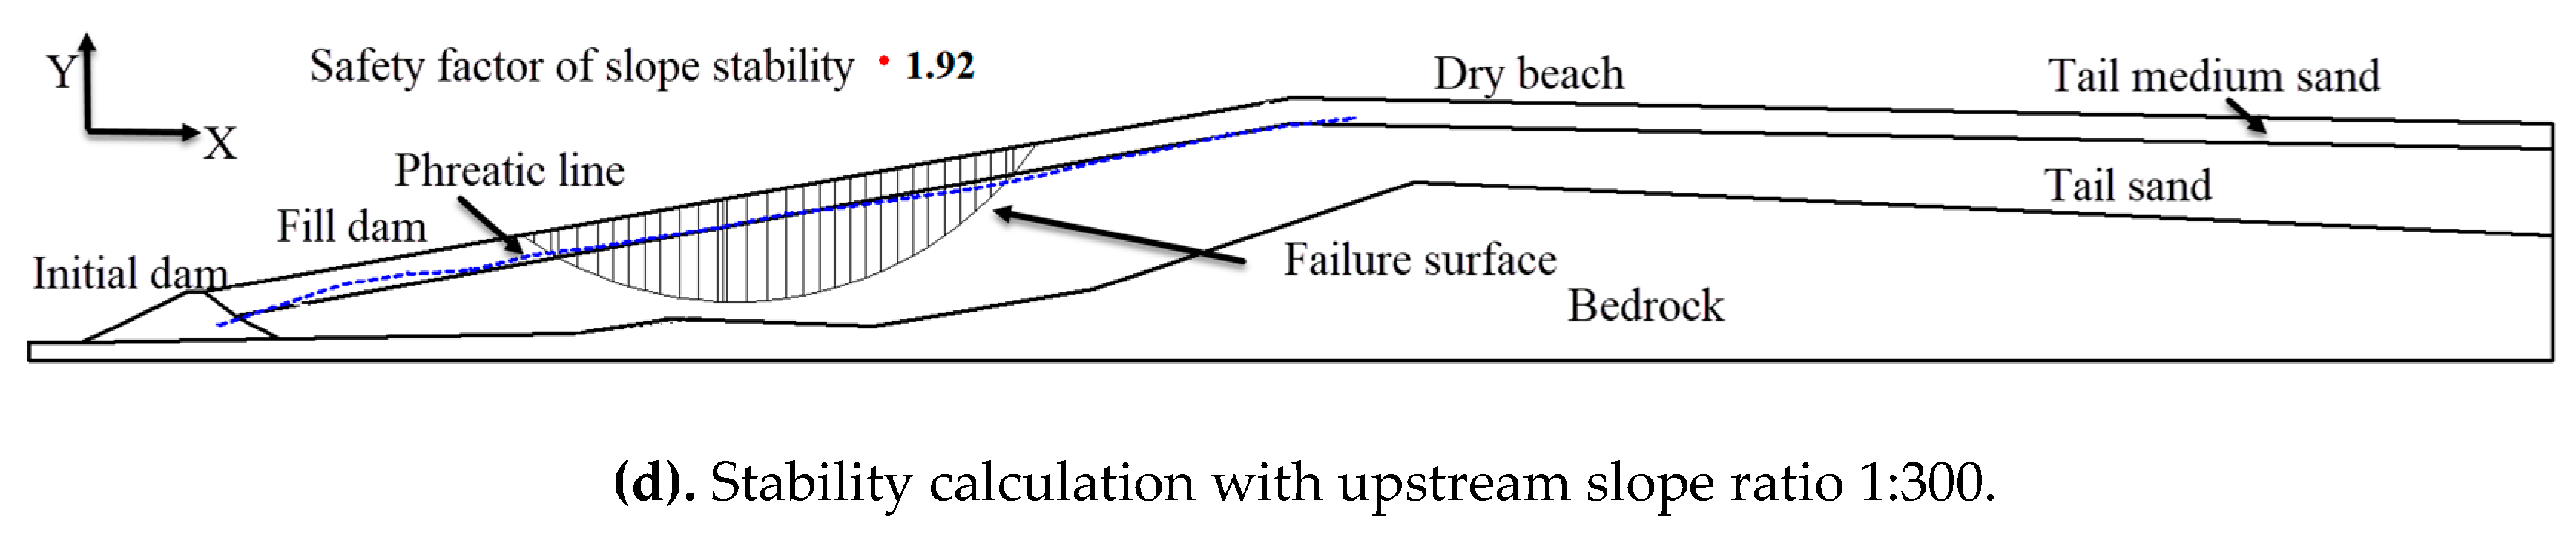
Slope-W in geo-studio was used for the stability analysis of the above working conditions. The seepage results were introduced into the stability analysis. The results are shown in Figure 11a,d. The blue line in the figure is the phreatic line. The calculated safety factor of slope stability can be seen from Figure 11a–d. The arc in the figure is the failure surface. The safety factor can be used to describe the stability of the slope. The larger the value, the more stable the dam slope tends to be.
From the results of stability simulation, the safety factor is affected by the length of the dry beach and the upstream slope ratio. When the upstream slope ratio remained unchanged, the length of the dry beach changed from 100 to 200m, and the safety factor increased from 1.69 to 1.76, an increase of 0.007. When the length of dry beach remains unchanged, the safety factor changes from 1.76 to 1.85 and 1.92, increasing by 0.09 and 0.12, respectively, and the upstream slope ratio changes from 1:100 to 1:200 and then to 1:300. When the safety factor is at different dry bench lengths, the longer the dry bench, the bigger safety factor of the dam. When the safety factor is at a different upstream slope ratio, the higher the upstream slope ratio, the greater the safety factor.
5. Conclusions
The calculation of seepage and stability is very important for the design and construction of tailings dam. In this study, the engineering overview of the Lixi tailings dam was provided. Based on the engineering data of Lixi tailings dam, the finite element model is established. The seepage and stability are calculated, and the total head chart, phreatic line and safety coefficient of seepage under different working conditions are obtained. The major conclusions are summarized as follows:
1. In the seepage analysis. The seepage simulation was carried out with dry bench lengths of 100 m, 200 m and different upstream slope ratios, and the corresponding seepage field was obtained. The results of the seepage simulation under different working conditions were compared. It can be seen that with the same upstream slope, the shorter the length of the dry beach, the higher the elevation of the obtained phreatic line. Under the same length of dry beach, the higher the upstream slope is—the higher the phreatic line is in the upstream, and the lower it is in the downstream.
2. In the stability analysis, it can be seen from the comparison of safety factors under different working conditions, that with the same upstream slope ratio, the longer the length of the dry beach, the higher the safety factor of slope stability. With the same length of dry beach, the higher the upstream slope is, the higher the safety factor of slope stability. The size of the dry beach length and upstream slope ratio is proportional to the size of the safety factor.
3. In the project design and management of tailings dam, within a reasonable range, we should make the dry beach as long as possible and the upstream slope as large as possible. This can make the position of phreatic line lower and the safety factor larger, and the operation of tailings dam tends to remain stable.
Author Contributions
Conceptualization, C.Z., J.C. (Junrui Chai), J.C. (Jing Cao), Z.X., Y.Q. and Z.L.; methodology, C.Z.; software, C.Z.; validation, Z.X.; formal analysis, C.Z.; investigation, C.Z. and Z.L.; resources, C.Z.; data curation, C.Z.; writing—original draft preparation, C.Z.; writing—review and editing, C.Z.; visualization, C.Z.; supervision, C.J.; project administration, J.C. (Junrui Chai); funding acquisition, J.C. (Junrui Chai), J.C. (Jing Cao). All authors have read and agreed to the published version of the manuscript.
Funding
This research was funded by the National Natural Science Foundation of China (Grant No. 51679197), the Natural Science Basic Research Program of Shanxi Province-Key Project (Grant No. 2017JZ013), and the Leadership Talent Project of Shaanxi Province High-Level Talents Special Support Program in Science and Technology Innovation (Grant No. 2013KCT-15).
Conflicts of Interest
The authors declare no conflicts of interest.
References
- Wang, X.; Zhan, H.; Wang, J.; Li, P. The stability of tailings dams under dry-wet cycles: A case study in Luonan, China. Water 2018, 10, 1048. [Google Scholar] [CrossRef] [Green Version]
- Wang, K.; Yang, P.; Hudson-Edwards, K.A.; Lyu, W.; Yang, C.; Jing, X. Integration of DSM and SPH to Model Tailings Dam Failure Run-Out Slurry Routing Across 3D Real Terrain. Water 2018, 10, 1087. [Google Scholar] [CrossRef] [Green Version]
- Asghari, M.; Noaparast, M.; Shafaie, S.Z.; Ghassa, S.; Chelgani, S.C. Recovery of coal particles from a tailing dam for environmental protection and economical beneficiations. Int. J. Coal Sci. Technol. 2018, 5, 253–263. [Google Scholar] [CrossRef] [Green Version]
- Yagüe, S.; Sánchez, I.; Vigil de La Villa, R.; García-Giménez, R.; Zapardiel, A.; Frías, M. Coal-mining tailings as a pozzolanic material in cements industry. Minerals 2018, 8, 46. [Google Scholar] [CrossRef] [Green Version]
- Deng, D.Q.; Liu, L.; Yao, Z.L.; Song, K.I.; Lao, D.Z. A practice of ultra-fine tailings disposal as filling material in a gold mine. J. Environ. Manag. 2017, 196, 100–109. [Google Scholar] [CrossRef] [PubMed]
- Gao, S.; Cui, X.; Zhang, S. Utilization of Molybdenum Tailings in Concrete Manufacturing: A Review. Appl. Sci. 2020, 10, 138. [Google Scholar] [CrossRef] [Green Version]
- Lv, X.; Shen, W.; Wang, L.; Dong, Y.; Zhang, J.; Xie, Z. A comparative study on the practical utilization of iron tailings as a complete replacement of normal aggregates in dam concrete with different gradation. J. Clean. Prod. 2019, 211, 704–715. [Google Scholar] [CrossRef]
- Kossoff, D.; Dubbin, W.E.; Alfredsson, M.; Edwards, S.J.; Macklin, M.G.; Hudson-Edwards, K.A. Mine tailings dams: Characteristics, failure, environmental impacts, and remediation. Appl. Geochem. 2014, 51, 229–245. [Google Scholar] [CrossRef] [Green Version]
- Azam, S.; Li, Q. Tailings dam failures: A review of the last one hundred years. Geotech. News 2010, 28, 50–54. [Google Scholar]
- Hatje, V.; Pedreira, R.M.; de Rezende, C.E.; Schettini, C.A.F.; de Souza, G.C.; Marin, D.C.; Hackspacher, P.C. The environmental impacts of one of the largest tailing dam failures worldwide. Sci. Rep. 2017, 7, 1–13. [Google Scholar] [CrossRef]
- Ormann, L.; Zardari, M.A.; Mattsson, H.; Bjelkevik, A.; Knutsson, S. Numerical analysis of strengthening by rockfill embankments on an upstream tailings dam. Can. Geotech. J. 2013, 50, 391–399. [Google Scholar] [CrossRef]
- ICOLD. Tailings Dams—Risk of Dangerous Occurrences, Lessons Learnt from Practical Experiences; Bulletin 121; United Nations Environmental Programme (UNEP), Division of Technology, Industry and Economics (DTIE) and International Commission on Large Dams (ICOLD): Paris, France, 2001. [Google Scholar]
- Hudson-Edwards, K.A.; Macklin, M.G.; Miller, J.R.; Lechler, P.J. Sources, distribution and storage of heavy metals in the Rıo Pilcomayo, Bolivia. J. Geochem. Explor. 2001, 72, 229–250. [Google Scholar] [CrossRef]
- Kemper, T.; Sommer, S. Estimate of heavy metal contamination in soils after a mining accident using reflectance spectroscopy. Environ. Sci. Technol. 2002, 36, 2742–2747. [Google Scholar] [CrossRef] [PubMed]
- Von der Heyden, C.J.; New, M.G. Groundwater pollution on the Zambian Copperbelt: Deciphering the source and the risk. Sci. Total Environ. 2004, 327, 17–30. [Google Scholar] [CrossRef] [PubMed]
- Rico, M.; Benito, G.; Salgueiro, A.R.; Díez-Herrero, A.; Pereira, H.G. Reported tailings dam failures: A review of the European incidents in the worldwide context. J. Hazard. Mater. 2008, 152, 846–852. [Google Scholar] [CrossRef] [PubMed] [Green Version]
- Rico, M.; Benito, G.; Diez-Herrero, A. Floods from tailings dam failures. J. Hazard. Mater. 2008, 154, 79–87. [Google Scholar] [CrossRef] [PubMed] [Green Version]
- Glotov, V.E.; Chlachula, J.; Glotova, L.P.; Little, E. Causes and environmental impact of the gold-tailings dam failure at Karamken, the Russian Far East. Eng. Geol. 2018, 245, 236–247. [Google Scholar] [CrossRef]
- Do Carmo, F.F.; Kamino, L.H.Y.; Junior, R.T.; de Campos, I.C.; do Carmo, F.F.; Silvino, G.; Mauro, M.L.; Rodrigues, N.U.A.; de Souza Miranda, M.P.; Pinto, C.E.F. Fundão tailings dam failures: The environment tragedy of the largest technological disaster of Brazilian mining in global context. Perspect. Ecol. Conserv. 2017, 15, 145–151. [Google Scholar] [CrossRef]
- Mura, J.C.; Gama, F.F.; Paradella, W.R.; Negrão, P.; Carneiro, S.; De Oliveira, C.G.; Brandão, W.S. Monitoring the vulnerability of the dam and dikes in Germano iron mining area after the collapse of the tailings dam of Fundão (Mariana-MG, Brazil) using DInSAR techniques with TerraSAR-X data. Remote Sens. 2018, 10, 1507. [Google Scholar] [CrossRef] [Green Version]
- Yong, W.; Li, X.K.; Xin, Z. Discussion on the causes for tailings dam accidents at home and abroad. Met. Mine 2009, 7, 139–142. [Google Scholar]
- Lyu, Z.; Chai, J.; Xu, Z.; Qin, Y.; Cao, J. A comprehensive review on reasons for tailings dam failures based on case history. Adv. Civ. Eng. 2019, 2019, 4159306. [Google Scholar] [CrossRef]
- Shahriari, M.; Aydin, M.E. Lessons learned from analysis of Los Frailes tailing dam failure. In International Conference on Applied Human Factors and Ergonomics; Springer: Cham, Switzerland, 2017; pp. 309–317. [Google Scholar]
- Yin, G.; Li, G.; Wei, Z.; Wan, L.; Shui, G.; Jing, X. Stability analysis of a copper tailings dam via laboratory model tests: A Chinese case study. Miner. Eng. 2011, 24, 122–130. [Google Scholar] [CrossRef]
- Zandarín, M.T.; Oldecop, L.A.; Rodríguez, R.; Zabala, F. The role of capillary water in the stability of tailing dams. Eng. Geol. 2009, 105, 108–118. [Google Scholar] [CrossRef]
- Lu, M.L.; Cui, L. Three-dimensional seepage analysis for complex topographical tailings dam. Rock Soil Mech. 2006, 27, 1176–1180. [Google Scholar]
- Xu, Z.; Yang, X.; Chai, J.; Qin, Y.; Li, Y. Permeability Characteristics of Tailings considering Chemical and Physical Clogging in Lixi Tailings Dam, China. J. Chem. 2016, 2016, 8147845. [Google Scholar] [CrossRef] [Green Version]
- Liu, C.; Shen, Z.; Gan, L.; Xu, L.; Zhang, K.; Jin, T. The Seepage and Stability Performance Assessment of a New Drainage System to Increase the Height of a Tailings Dam. Appl. Sci. 2018, 8, 1840. [Google Scholar] [CrossRef] [Green Version]
- Pak, A.; Nabipour, M. Numerical Study of the Effects of Drainage Systems on Saturated/Unsaturated Seepage and Stability of Tailings Dams. Mine Water Environ. 2017, 36, 341–355. [Google Scholar] [CrossRef]
- Yin, G.; Zhang, Q.; Wang, W.; Chen, Y.; Geng, W.; Liu, H. Experimental study on the mechanism effect of seepage on microstructure of tailings. Saf. Sci. 2012, 50, 792–796. [Google Scholar] [CrossRef]
- Yang, Y.; Wei, Z.; Cao, G.; Yang, Y.; Wang, H.; Zhuang, S.; Lu, T. A case study on utilizing geotextile tubes for tailings dams construction in China. Geotext. Geomembr. 2019, 47, 187–192. [Google Scholar] [CrossRef]
- Hu, S.; Chen, Y.; Liu, W.; Zhou, S.; Hu, R. Effect of seepage control on stability of a tailings dam during its staged construction with a stepwise-coupled hydro-mechanical model. Int. J. Min. Reclam. Environ. 2015, 29, 125–140. [Google Scholar] [CrossRef]
- Ozer, A.T.; Bromwell, L.G. Stability assessment of an earth dam on silt/clay tailings foundation: A case study. Eng. Geol. 2012, 151, 89–99. [Google Scholar] [CrossRef]
- Meggyes, T.; Niederleithinger, E.; Witt, K.J.; Csovari, M.; Kreft-Burman, K.; Engels, J.; Roehl, K.E. Enhancing the safety of tailings management facilities. Soil Sediment Contam. 2008, 17, 323–345. [Google Scholar] [CrossRef]
- Wang, T.; Zhou, Y.; Lv, Q.; Zhu, Y.; Jiang, C. A safety assessment of the new Xiangyun phosphogypsum tailings pond. Miner. Eng. 2011, 24, 1084–1090. [Google Scholar] [CrossRef]
- Nimbalkar, S.; Annapareddy, V.S.R.; Pain, A. A simplified approach to assess seismic stability of tailings dams. J. Rock Mech. Geotech. Eng. 2018, 10, 1082–1090. [Google Scholar] [CrossRef]
- Naeini, M.; Akhtarpour, A. Numerical analysis of seismic stability of a high centerline tailings dam. Soil Dyn. Earthq. Eng. 2018, 107, 179–194. [Google Scholar] [CrossRef]
Figure 1.
The location of the tailings dam.

Figure 2.
The dam sectional view.

Figure 3.
The layout of the project.

Figure 4.
The 2D model in geo-studio.

Figure 5.
Foundation model.

Figure 6.
The 3d model of tailings dam.

Figure 7.
The model after grid generation.

Figure 8.
Seepage calculation with drybeach lengths and Seepage calculation with upstream slope ratio. (a) Dry beach lengths of 100 m; (b) Dry beach lengths of 200 m (Upstream slope ratio 1:100); (c) Upstream slope ratio 1:200; (d) Upstream slope ratio 1:300.
Figure 8.
Seepage calculation with drybeach lengths and Seepage calculation with upstream slope ratio. (a) Dry beach lengths of 100 m; (b) Dry beach lengths of 200 m (Upstream slope ratio 1:100); (c) Upstream slope ratio 1:200; (d) Upstream slope ratio 1:300.


Figure 9.
The position of the phreatic line under different dry bench length.

Figure 10.
The position of phreatic line under different upstream slope ratios.

Figure 11.
Stability calculation with dry beach lengths and Stability calculation with upstream slope ratio. (a) 100 m; (b) 200 m (upstream slope ratio 1:100); (c) 1:200; (d) 1:300.
Figure 11.
Stability calculation with dry beach lengths and Stability calculation with upstream slope ratio. (a) 100 m; (b) 200 m (upstream slope ratio 1:100); (c) 1:200; (d) 1:300.


Table 1.
The material properties of the different parts.
| Name | K (m/s) | ρ (kg/m3) | C (Pa) | Φ (°) | E (Pa) | μ |
|---|---|---|---|---|---|---|
| Bedrock | 3.7 × 10⁻⁷ | |||||
| Initial dam | 2 × 10⁻⁴ | 1900 | 1.6 × 10⁴ | 30 | 1.8 × 10⁹ | 0.33 |
| Tail medium sand | 3.6 × 10⁻³ | 1810 | 1.5 × 10⁴ | 26 | 4.1 × 10⁹ | 0.30 |
| Tail silt | 2.2 × 10⁻³ | 1890 | 1.5 × 10⁴ | 21 | 2.1 × 10⁹ | 0.33 |
© 2020 by the authors. Licensee MDPI, Basel, Switzerland. This article is an open access article distributed under the terms and conditions of the Creative Commons Attribution (CC BY) license (http://creativecommons.org/licenses/by/4.0/).
Share and Cite
MDPI and ACS Style
Zhang, C.; Chai, J.; Cao, J.; Xu, Z.; Qin, Y.; Lv, Z. Numerical Simulation of Seepage and Stability of Tailings Dams: A Case Study in Lixi, China. Water 2020, 12, 742. https://doi.org/10.3390/w12030742
AMA Style
Zhang C, Chai J, Cao J, Xu Z, Qin Y, Lv Z. Numerical Simulation of Seepage and Stability of Tailings Dams: A Case Study in Lixi, China. Water. 2020; 12(3):742. https://doi.org/10.3390/w12030742
Chicago/Turabian StyleZhang, Chen, Junrui Chai, Jing Cao, Zengguang Xu, Yuan Qin, and Zongjie Lv. 2020. "Numerical Simulation of Seepage and Stability of Tailings Dams: A Case Study in Lixi, China" Water 12, no. 3: 742. https://doi.org/10.3390/w12030742
Note that from the first issue of 2016, this journal uses article numbers instead of page numbers. See further details here.