Enhanced Monovalent Cation Biomineralization Ability by Quartz Sand for Effective Removal of Soluble Iron in Simulated Acid Mine Drainage


1
Department of Environmental Engineering, School of Information and Safety Engineering, Zhongnan University of Economics and Law, Wuhan 430073, China
2
School of Environmental Science and Engineering, North China Electric Power University, Baoding 071003, China
*
Author to whom correspondence should be addressed.
Water 2020, 12(3), 732; https://doi.org/10.3390/w12030732
Submission received: 13 February 2020
/
Revised: 26 February 2020
/
Accepted: 3 March 2020
/
Published: 7 March 2020
(This article belongs to the Section Wastewater Treatment and Reuse)
Abstract
:Acid mine drainage (AMD) is characterized by low pH, high soluble Fe, and heavy metal concentrations. Conventional lime neutralization produces large amounts of Fe(OH)2 and Fe(OH)3, which complicate subsequent disposal. Secondary iron minerals synthesized by biomineralization can reduce the concentration of soluble Fe in addition to adsorbing and removing heavy metals in AMD. Therefore, an appropriate method for improving the precipitation efficiency of Fe is urgently needed for AMD treatment. Using simulated AMD, this work analyzes the influence of quartz sand (40 g/L) on the Fe2+ oxidation and total Fe deposition efficiencies, as well as the phases of secondary iron minerals in an Acidithiobacillus ferrooxidans system including K+, Na+, or NH4+ (53.3 mmol/L). Quartz sand had no significant effect on Fe2+ oxidation and 160 mmol/L Fe2+ was completely oxidized by A. ferrooxidans in 168 h, but contributed to the oxidized product (Fe3+) mineralization, improving the total Fe removal efficiency in simulated AMD. Compared with treatments involving K+ or Na+ alone, quartz sand improved the total Fe precipitation efficiency by 26.6% or 30.2%, respectively. X-ray diffraction showed that quartz sand can promote the transformation of the biomineralization pathway from schwertmannite to jarosite with higher yields, which is important for improving the removal efficiency of heavy metals in AMD.
1. Introduction
Acid mine drainage (AMD), which results from the combined action of air, water, microorganisms, and sulfide minerals during mining, beneficiation, and runoff from the waste ore and tailing heap after mining [1]. AMD is highly acidic and contains soluble Fe (Fe2+, Fe3+), SO42−, and heavy metals (e.g., Cr, Cu, Cd, Ni), thus posing a threat to the environment and human health [2,3]. Currently, lime neutralization is a common method to raise the pH and remove Fe, SO42−, and other toxic metals from AMD [4,5]. However, when AMD passes through the lime ditch, Fe in the AMD preferentially forms Fe(OH)3, which coats the limestone surfaces, preventing further neutralization reactions between the limestone and AMD and resulting in a large increase in lime consumption or low heavy-metal removal efficiencies. In addition, a great amount of toxic waste residue, consisting of CaSO4, Fe(OH)3, and toxic metal oxides, are produced in this method, which increases the burden of post-disposal [6,7,8]. Therefore, it was urgently to explore environment-friendly and high-efficient ways to recover the valuable Fe and remove part of the SO42− in AMD in order to reduce the disposal burden of subsequent lime neutralization.
Soluble Fe in AMD exists partly as Fe2+, and the pH required for complete precipitation of Fe2+ (pH >8.5) is much higher than that of Fe3+ (pH = 3.5). Accordingly, the rapid conversion of Fe2+ to Fe3+ and inhibition of Fe(OH)3 formation are crucial for the treatment of AMD. Previous studies have shown that under extremely acidic conditions and high concentrations of SO42−, S will combine with Fe to preferentially form secondary iron minerals over Fe(OH)3 [9,10]. Nevertheless, when the pH of the solution is ˂3.5, the atmospheric oxidation efficiency constant of Fe2+ is extremely low (only 10−3.5/d), greatly limiting the transformation of Fe2+ to secondary iron minerals [11]. Numerous studies have shown that the oxidation efficiency of Fe2+ can be increased 105 to 106 times by Acidithiobacillus ferrooxidans (A. ferrooxidans, an acidophilic chemoautotrophic Fe2+-oxidizing bacterium) in acidic sulfate environments [12]. In addition, Fe2+ oxidation by A. ferrooxidans is often accompanied by the mineralization of Fe3+, producing secondary iron minerals such as schwertmannite and jarosite [13,14,15]. The specific reaction can be described as follows [14]:
4Fe2+ + O2 + 4H+ → 4Fe3+ + 2H2O (A. ferrooxidans participation)
8Fe3+ + 14H2O + SO42− → Fe8O8(OH)6SO4 (schwertmannite) + 22H+
M+ + 3Fe3+ + 2SO42− + 6H2O → MFe3(SO4)2(OH)6 (jarosite) + 6H+
M+ represents K+, Na+, or NH4+. Schwertmannite and jarosite have been proven to exert a large adsorption or coprecipitation effect on heavy metals, which makes them ideal adsorbent materials [16,17,18]. A preliminary trial indicated that in an Fe2+-rich system, schwertmannite was very easily obtained after Fe2+ was biologically oxidized by A. ferrooxidans. However, only a small amount of the resultant Fe3+ in the solutions was converted to schwertmannite. Correspondingly, in the presence of monovalent cations (such as K+, Na+, and NH4+) of a certain concentration in acidic sulfate environments, Fe3+ will participate during the synthesis of jarosite, which was much higher than the formation of schwertmannite. In this case, the yield of pure jarosite is approximately 1.5 times greater than that of pure schwertmannite when the same amount of Fe3+ is consumed (Equations (2) and (3)). Therefore, inducing the formation of jarosite instead of schwertmannite is beneficial, as jarosite can reduce the Fe content in AMD and remove heavy metals.
In general, the formation of secondary iron minerals can be roughly divided into three steps: Fe2+ is oxidized to Fe3+; Fe3+ is hydrolyzed and forms mineral crystal nucleus, and the nucleus gradually agglomerates and expands [19]. The synthesis of secondary iron minerals involves new phase formation, so the existence of an induction period can lower the initial precipitation efficiency of Fe3+ [20]. Numerous studies have confirmed that the existence of crystal seeds provide nucleation sites for mineral formation, eliminating the induction period and accelerating initial precipitation efficiency [20,21,22]. For example, Dutrizac found that the addition of crystal seeds (sodium, ammonium, and potassium jarosites) can accelerate the hydrolysis and mineralization of Fe3+ and raise the mineral output [20]. However, these results were based on chemical methods, mainly investigating the effect of crystal seeds on the synthesis of jarosite at high temperatures (60–100 °C). Few reports regarding the application of crystal seeds in the biosynthesis of jarosite by A. ferrooxidans have been published, except for that of Wang et al. [23] who used quartz sand as a crystal seed to form K-jarosite in a FeSO4–K2SO4–A. ferrooxidans system. In addition, members of our team have investigated the influence of quartz sand on secondary iron mineral formation by biomineralization in municipal sludge filtrate mixture systems (including K+, Na+, and NH4+), the results showed that 10 g/L quartz sand can induce and promote K-jarosite formation when the concentration of Fe2+ is 4–8 g/L, but Na-jarosite and NH4-jarosite were not detected in the collected minerals [24]. Previous studies have shown that quartz sand can promote the transformation of soluble Fe to jarosite in acid sulfate environment. Nevertheless, it is still unclear how quartz sand impacts the efficiency of Fe2+ oxidation and total Fe precipitation in A. ferrooxidans culture solutions, including K+, Na+, or NH4+. In previous studies, only the influence of K+ concentration has been taken into account [23], and the relative mineralizing ability of K+, NH4+, or Na+, the differences in mineral phases between the secondary iron minerals in the presence of quartz sand, have not yet been reported. The study on the influence of quartz sand on the ability of monovalent cation biomineralization has certain reference significance for the biological treatment of AMD.
Therefore, based on the biosynthesis of secondary iron minerals using A.ferrooxidans, the objective of the present work is to analyze the influence of quartz sand on the A. ferrooxidans-mediated biomineralization in simulated AMD. The addition of quartz sand (40 g/L) and concentration of monovalent cation (K+ = 53.3 mmol/L) were adjusted in reference to the study by Wang et al. [23]. The biomineralization capability of three monovalent cations (K+, NH4+, and Na+) in the presence of quartz sand in an acidic sulfate system was investigated and compared by determining Fe2+ oxidation efficiency, total Fe precipitation efficiency, and synthetic mineral phases. We believe that the afforded results may provide an essential theoretical basis to promote the transformation of Fe to secondary iron minerals from AMD.
2. Materials and Methods
2.1. Preparation of A. Ferrooxidans Cell Suspensions and Quartz Sand
A. ferrooxidans LX5 (CGMCC No. 0727), obtained from the China General Microbiological Culture Collection Center, was grown in a 9 K medium, which contained the following analytical grade salts: 3.00 g (NH4)2SO4, 0.10 g KCl, 0.50 g K2HPO4, 0.50 g MgSO4·7H2O, 0.01 g Ca(NO3)2, and 44.48 g FeSO4·7H2O in 1 L of deionized water [25]. Preparation of the A. ferrooxidans cell suspensions was performed as described by Song et al. [26]. The concentration of A. ferrooxidans was determined to be 6 × 10⁷ CFU/mL by the double-layer plate method [27].
The particle size of quartz sand used in this study was 30~40 mesh; it was firstly soaked in 1 mol/L H2SO4 for 24 h and then dried for further use.
2.2. Biomineralization of Simulated AMD
Preparation of simulated AMD: approximately 135 mL of deionized water, 15 mL of A. ferrooxidans cell suspension, and 6.63 g of FeSO4·7H2O were added to a series of 250 mL Erlenmeyer flasks. Subsequently, two experimental groups were prepared, one with quartz sand addition and a control group without the sand. The first group contained no quartz sand and four treatments were used: K+ = 53.3 mmol/L, Na+ = 53.3 mmol/L, NH4+ = 53.3 mmol/L (K+, NH4+, or Na+, added as K2SO4, (NH4)2SO4, or Na2SO4, respectively), and the control check (CK) without any monovalent cations. The four treatments of the first group were used for the second group containing 40 g/L of quartz sand [23]. The effective volume of each Erlenmeyer flask was 150 mL. Simultaneously, the initial pH of each solution was adjusted to 2.50, with 5 mol/L H2SO4. The density of A. ferrooxidans in each treatment was approximately 6 × 10⁶ CFU/mL, as determined by the bilayer flat band method. All Erlenmeyer flasks were subjected to 180 rev/min shaking cultivation in a rotary shaker and were inoculated for 168 h at 28 °C. All experiments were performed in triplicate. The pH was measured every 24 h, and 1 mL of the supernatant was sampled with a pipette through a 0.22 μm filter membrane to determine the concentrations of Fe2+ and total Fe (TFe) in simulated AMD. According to the variation in the concentration of TFe, the TFe precipitation efficiencies at different time nodes were calculated using the following formulas:
TFe precipitation efficiencies at different time nodes (%) = (C0 - Ct)/C0 × 100%
Where C0 is the TFe concentration (g/L) at 0 h, Ct is the TFe concentration (g/L) at t h.
At the end of the culturing, the secondary iron minerals were collected with qualitative filter paper and washed twice with deionized water to remove impurities. After drying at 55 °C, the minerals were ground into powder using an agate mortar and identified via X-ray diffraction (XRD).
2.3. Analytical Procedures
The solution pH was measured using a pHS-3C model digital pH-meter with a resolution of 0.01 pH unit. Fe2+ and TFe concentrations were determined using the 1,10-phenanthroline method by a spectrophotometer (721, XTZ Optical Instrument Factory, Shanghai, China) with detection wavelength at 530 nm [28]. The mineral phase of the sample was determined via X-ray diffraction (XRD, Bruker D8A25, Bruker Corporation, Karlsruhe, Germany) using CuKα radiation (40 kV, 40 mA); the samples were scanned from 10 to 80° 2θ with a step increment of 0.01° 2θ and 6°/min scanning speed. The data shown in the figures are presented as mean values with standard deviations to indicate the reproducibility and reliability of the results.
3. Results and Discussion
3.1. Changes in Fe2+ Concentration During Biomineralization of Simulated AMD
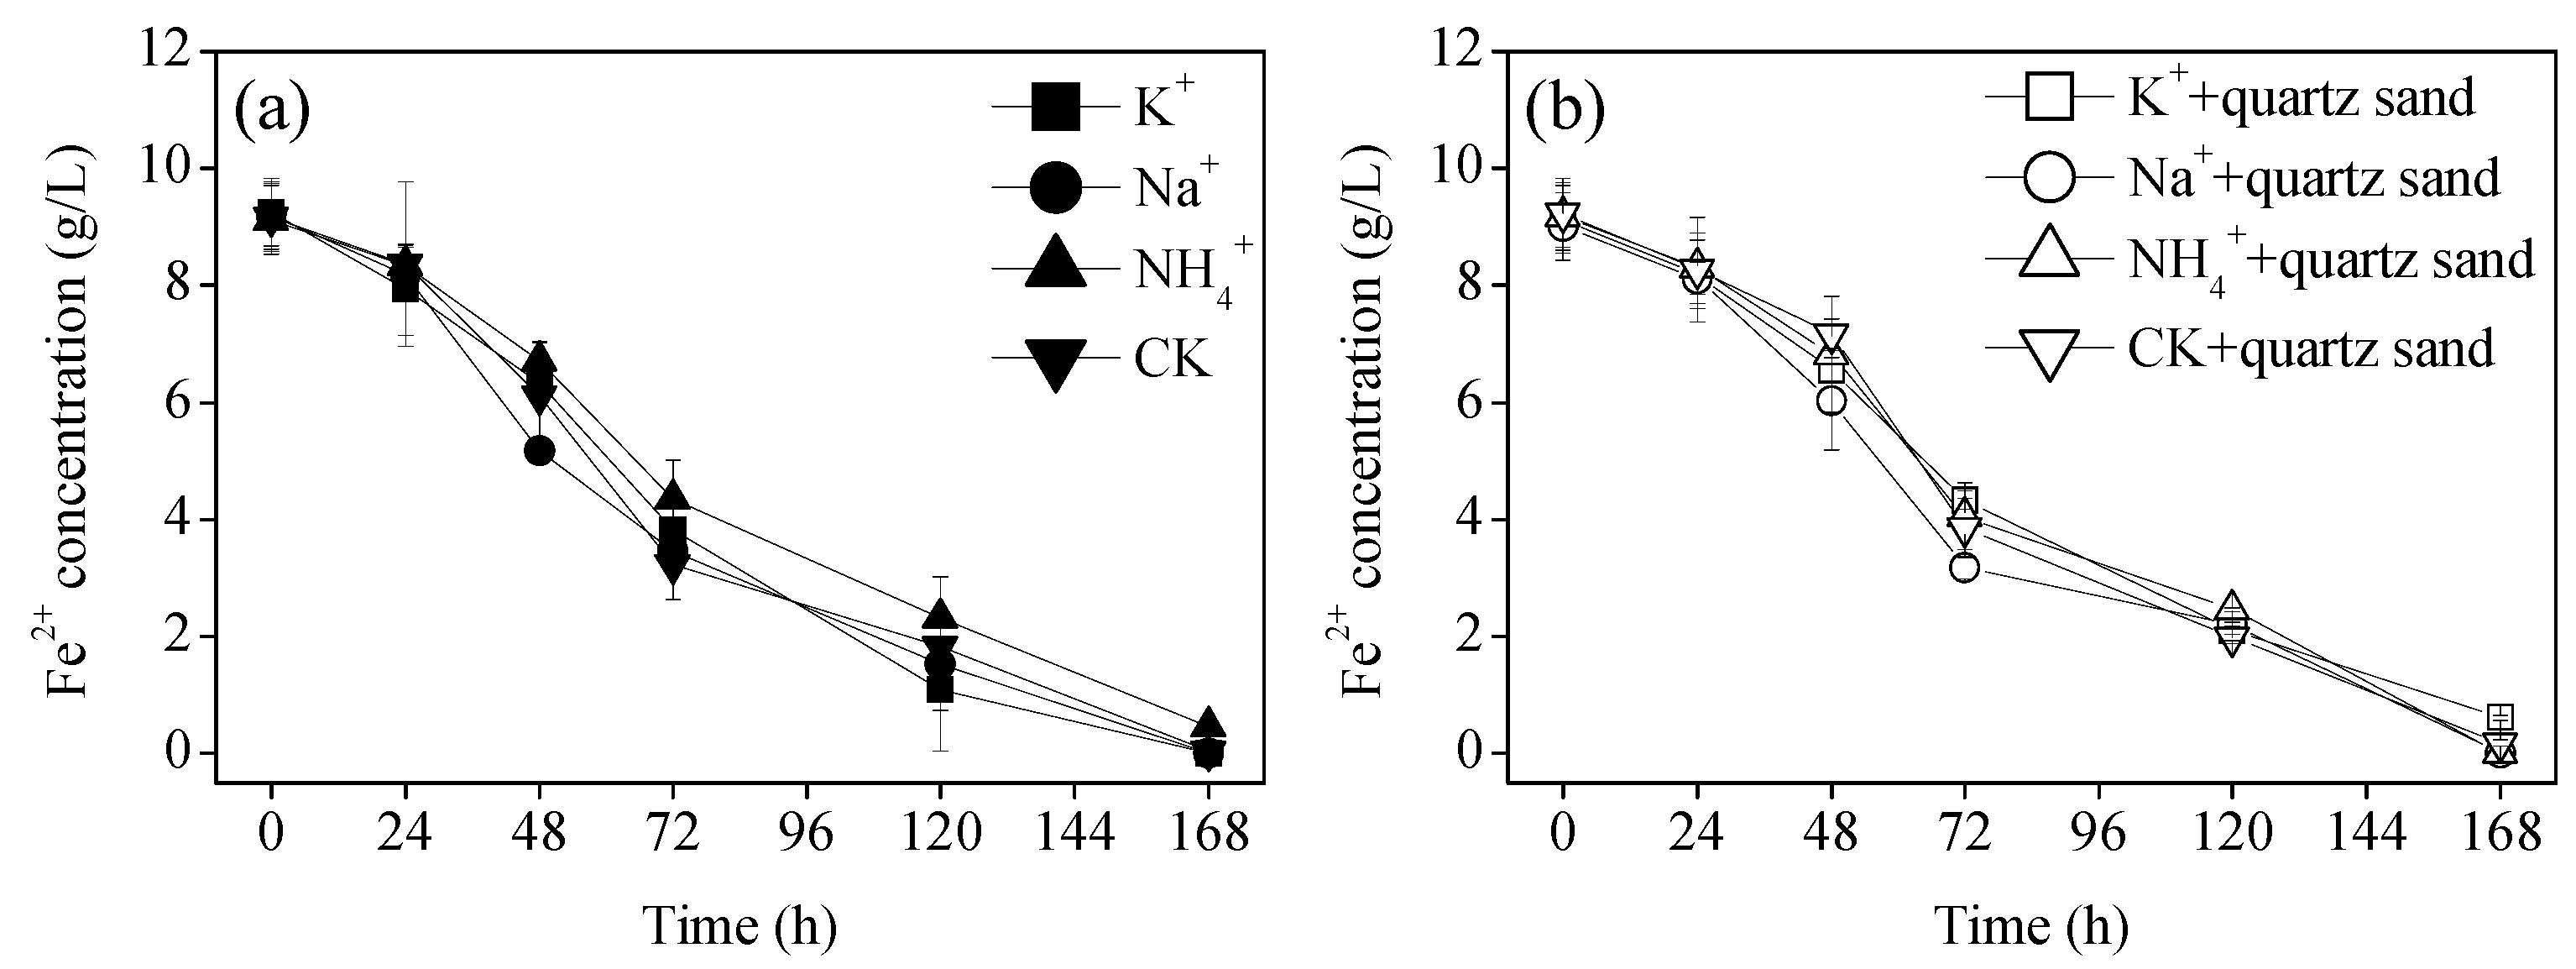
Figure 1 shows the changes in the Fe2+ concentration during A. ferrooxidans mediated biomineralization with and without quartz sand addition. Overall, the combined application of quartz sand and monovalent cations had no significant effect on the biooxidation activity of A. ferrooxidans, and Fe2+ was completely oxidized after 168 h. During the initial inoculation stage of A. ferrooxidans, the oxidation of Fe2+ was slow, with an average oxidation efficiency of only 10.3% after 24 h. The poor oxidation of Fe2+ during the initial stage of the reaction can be attributed to the adaptive phase of A. ferrooxidans. Fe2+ was then rapidly oxidized between 24 and 168 h, which agrees with the results of Wang et al. [23]. The addition of quartz sand and K+ had no significant influence on the biooxidation efficiency of Fe2+ under the same experimental conditions. In addition, Wang et al. [29] confirmed that at concentrations of Na+ ranging from 81.6 to 326.5 mmol/L, the growth curves of A. ferrooxidans were nearly unchanged. When the Na+ concentration increased to 653 mmol/L, the A. ferrooxidans growth was inhibited. Song et al. [30] confirmed that the NH4+ tolerance of A. ferrooxidans ranged from 80 to 160 mmol/L and that the critical concentration where A. ferrooxidans growth was completely suppressed was between 160 and 320 mmol/L. Csonka [31] reported that the ability of organisms to respond to fluctuations in their environments is an important physiological process that determines their growth in various habitats. High salt concentrations may cause changes in the osmotic pressure of A. ferrooxidans and the biooxidation efficiency of Fe2+, therefore confirming that the variety and concentration of monovalent cations exhibit considerable influence on the biological oxidation of Fe2+ in AMD. Specifically, a high concentration of monovalent cations inhibits the oxidizing ability of A.ferrooxidans. This will help us to choose the appropriate concentration of monovalent cations for the bio-mineralization treatment of AMD. However, the concentration of monovalent cations selected in this study was 53.3 mmol/L and was within the tolerance range of A. ferrooxidans.
3.2. Changes in Solution pH During Biomineralization of Simulated AMD
According to Equations (1)–(3), the oxidation of Fe2+ consumes acid (Equation (1)), while the hydrolysis of Fe3+ is accompanied by the production of acid (Equations (2) and (3)) [14]. Figure 1 confirms that, regardless of the presence of quartz sand (40 g/L) or monovalent cations (53.3 mmol/L), A. ferrooxidans exhibited no significant effect on the oxidation efficiency of Fe2+. Hence, the hydrolytic ability of Fe3+ under different treatment conditions can be preliminarily judged from changes in pH.
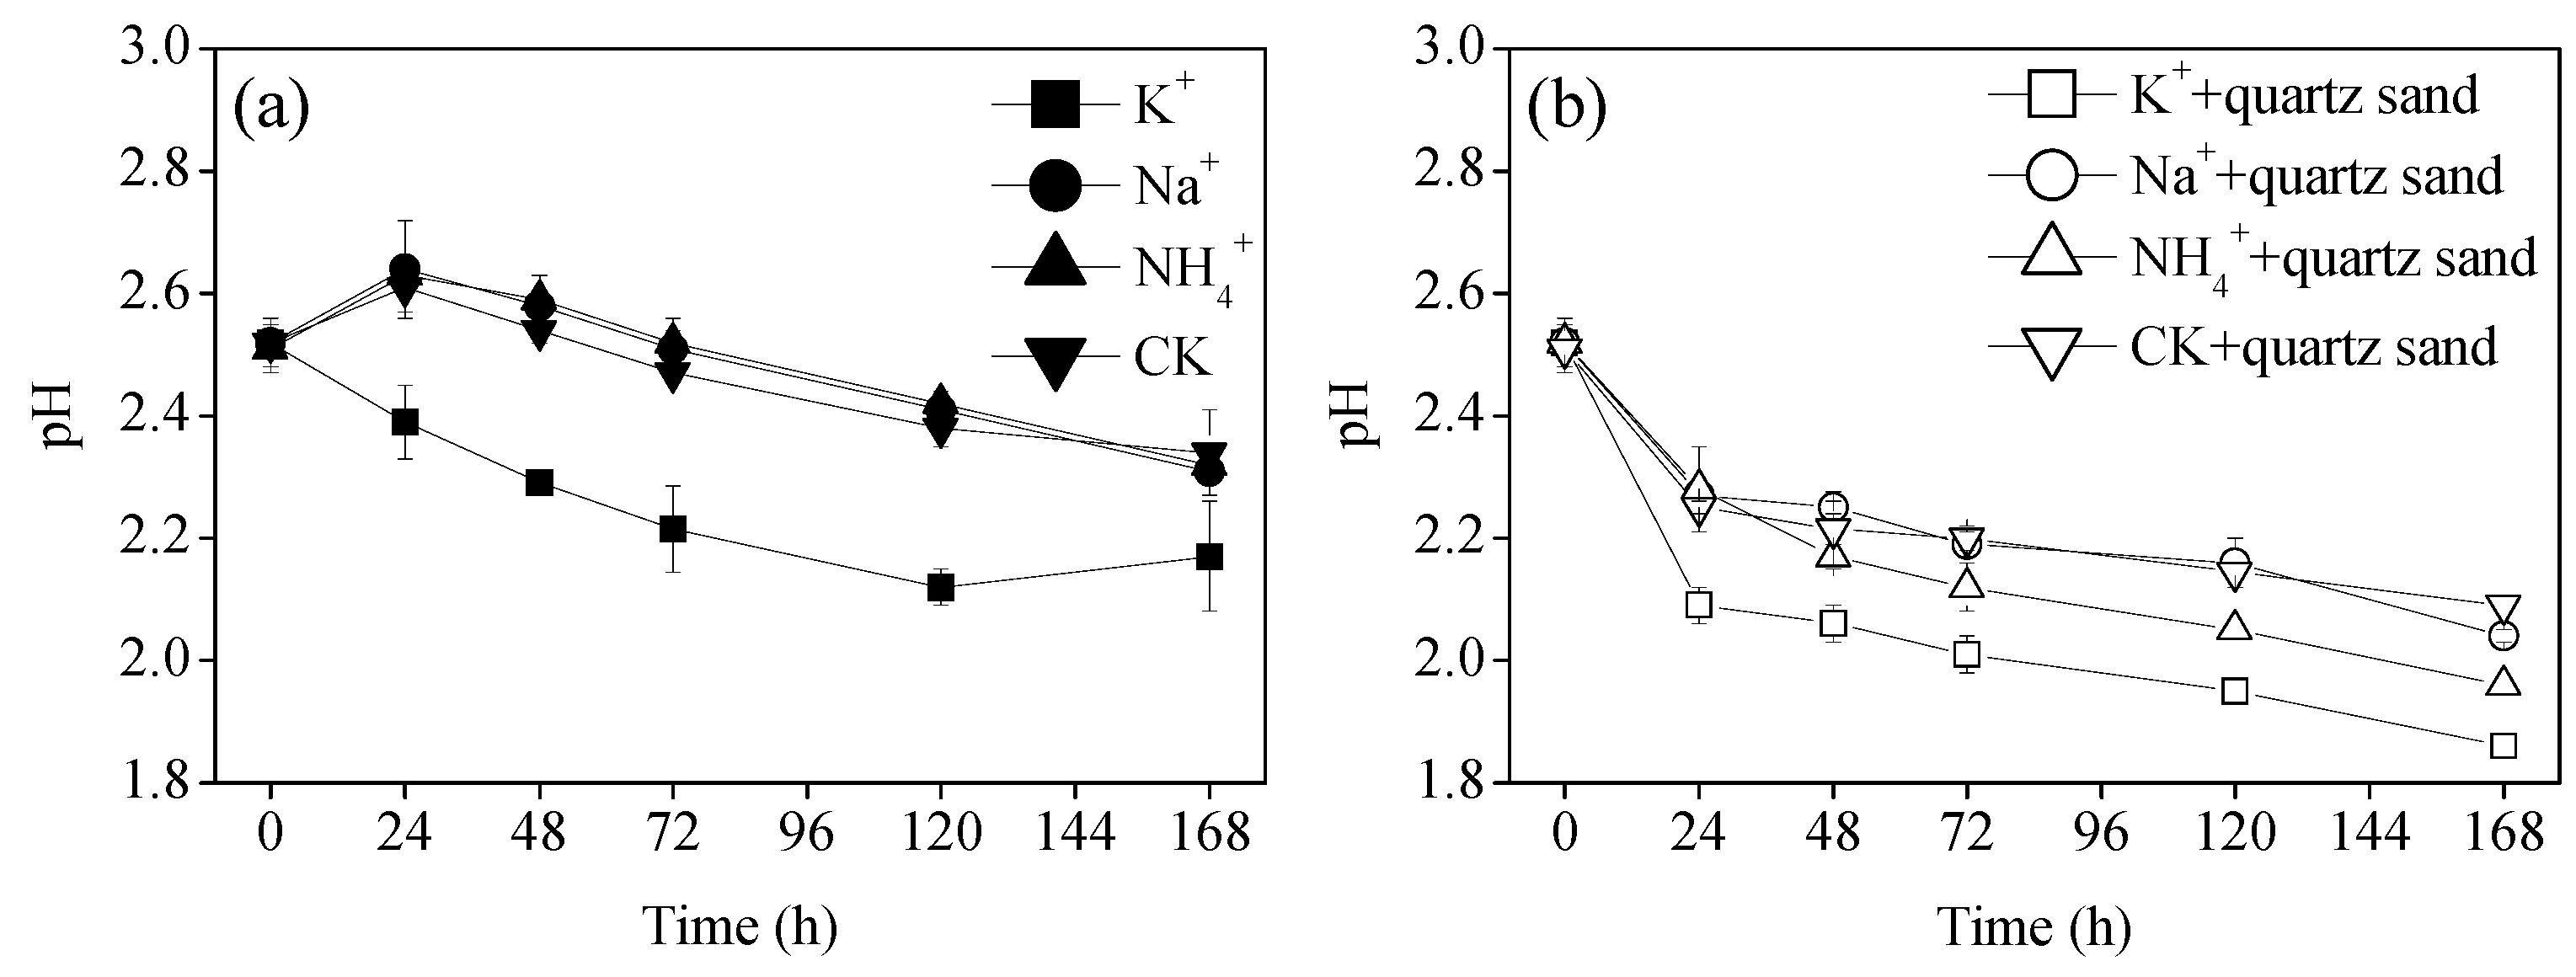
When the quartz sand was not added to the reaction system (Figure 2a), the pH variations were similar for the systems containing Na+, NH4+, and CK, where the pH values rose from 2.50 to 2.64, 2.63, and 2.61 at 24 h, then gradually decreased to 2.31, 2.32, and 2.34, respectively, after 168 h. Thus, it can be inferred that 53.3 mmol/L Na+ or NH4+ added individually exerted no effect on the biological mineralization process. In contrast, when 53.3 mmol/L K+ was added individually, the solution pH exhibited a downward trend, decreasing from 2.50 to 2.17. According to the biochemical reactions (Equations (1)–(3)) for secondary iron mineral formation, a lower pH promotes Fe3+ hydrolysis on the minerals. Bai et al. [32] also showed that, compared with Na+ or NH4+, K+ exhibited a stronger ability to induce mineralization in a 160 mmol/L Fe2+ solution containing A. ferrooxidans.
After the addition of 40 g/L quartz sand to the reaction system (Figure 2b), the pH of the treatments with only quartz sand, and those with quartz sand and Na+ or NH4+, showed a decreasing trend. This indicates that the introduction of quartz sand promoted Fe3+ hydrolysis and that, even in the absence of monovalent cations, the process with only quartz sand accelerated Fe3+ hydrolysis. The pH variation curves of the solutions with only quartz sand and quartz sand with Na+ were comparable. Thus, it could be concluded that even upon the introduction of quartz sand, 53.3 mmol/L Na+ had no significant effect on Fe3+ hydrolysis, and its ability to induce Fe3+ biological mineralization remained poor. Here, the decreasing pH can be solely attributed to the quartz sand rather than Na+. Interestingly, at the same concentration of NH4+, after the addition of quartz sand to the system, the pH showed a more obvious decline compared to the treatments involving the separate addition of NH4+ or quartz sand. This decline indicated that when NH4+ and quartz sand interact, a synergistic effect promoted the formation of secondary iron minerals. This is the first report of such a phenomenon. Although the mineralization ability of NH4+ was weaker and its effect on Fe3+ hydrolysis was smaller, the introduction of quartz sand likely aids in the synthesis of secondary iron minerals, which subsequently promoted the effective removal of soluble Fe in simulated AMD.
3.3. Changes in TFe Precipitation Efficiency During Biomineralization of Simulated AMD
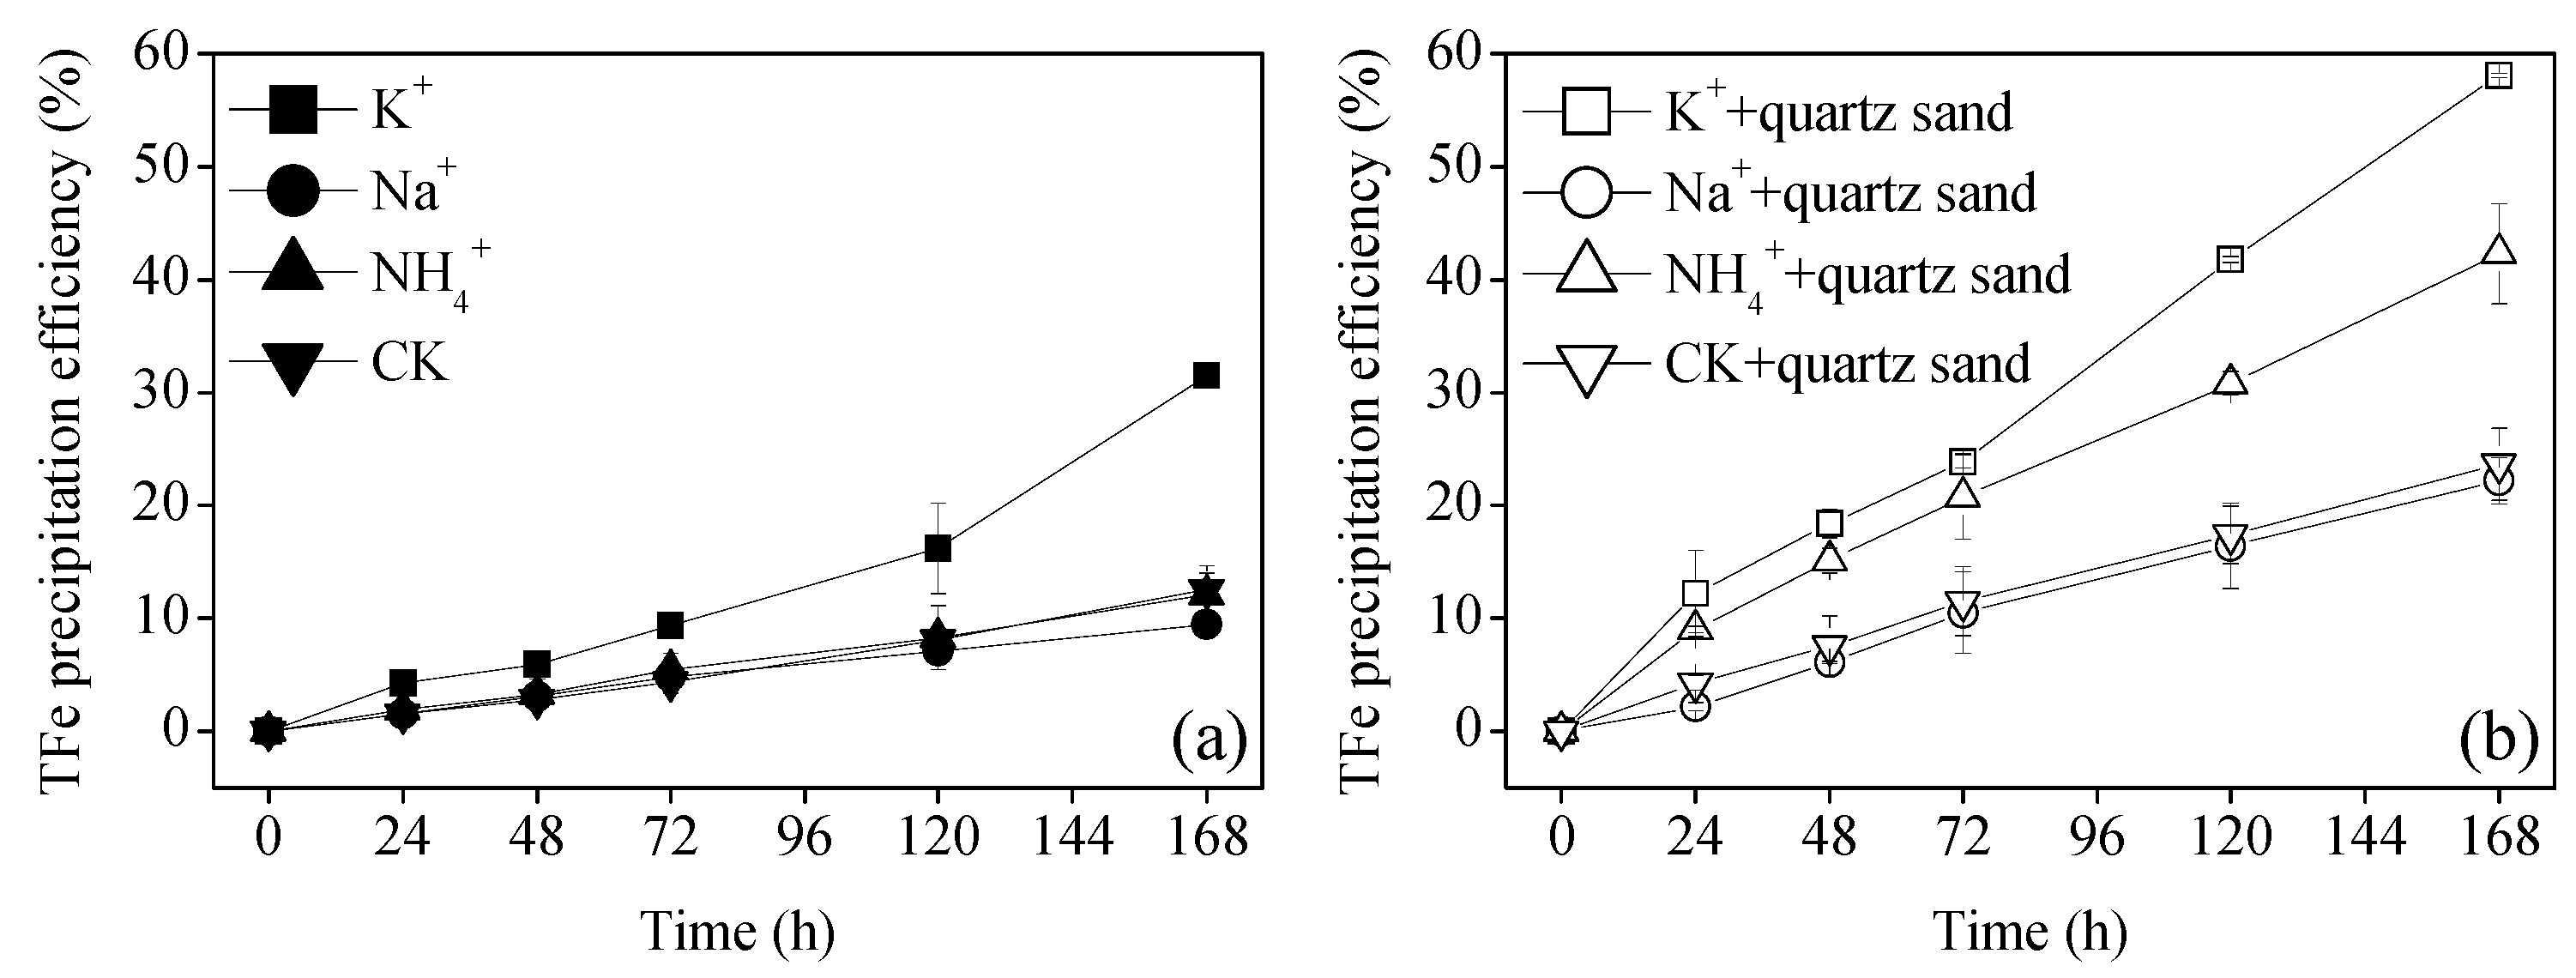
With the participation of various monovalent cations, changes in the TFe precipitation efficiency for systems with or without quartz sand are shown in Figure 3. For the separate additions of Na+, NH4+, and CK (Figure 3a), the TFe precipitation efficiencies were essentially identical. At 168 h, the TFe precipitation efficiencies were only 9.5%, 12.1%, and 12.6% after the mineralization reaction for the Na+, NH4+, and CK treatments, respectively. Separate additions of 53.3 mmol/L Na+ or NH4+ could not induce the mass removal of soluble Fe in simulated AMD. For the treatment involving K+ alone, the TFe precipitation efficiency was much higher than that of the CK treatment. This was beneficial for the mass synthesis of minerals, and the TFe precipitation efficiency increased from 12.6% to 31.5% after mineralization. The results of this study are consistent with those reported by Wang et al. [23], who reported that at K+ concentrations of 7.14, 16, 32, 53.3, and 80 mmol/L, the TFe precipitation efficiencies for biomineralization mediated by A. ferrooxidans were approximately 36%, 42%, 46%, 50%, and 52%, respectively. Since the addition of K+ did not accelerate the oxidation efficiency of Fe2+ (Figure 1), the increased TFe precipitation efficiency can be mainly attributed to the Fe3+ hydrolysis induced by K+.
By comparison, the TFe precipitation efficiency of the treatment with quartz sand was higher than that obtained without quartz sand (Figure 3b). In other words, the addition of quartz sand contributed to Fe3+ hydrolysis, improving the TFe removal efficiency in the simulated AMD. As stated earlier, the addition of quartz sand showed no significant effect on the oxidation efficiency of Fe2+, indicating that quartz sand can induce additional syntheses of secondary iron minerals at the same Fe3+ supply rate. Crystal seeds provide nucleation sites for the generation of solid phase materials, accelerating the initial precipitation efficiencies of the secondary minerals and promoting TFe precipitation [20,21,22]. In addition, quartz sand and monovalent cations (K+ or NH4+) showed a synergistic effect, promoting the generation of secondary iron minerals, and increasing the TFe precipitation rate to 26.6% or 30.2% compared to those of the single monovalent cation, respectively. Therefore, the combination of the induced mineralization of K+ or NH4+ and crystal seed stimulation of quartz sand promotes Fe3+ hydrolysis, achieving improved Fe removal. However, the TFe precipitation efficiencies for both treatments, quartz sand with or without Na+, were similar, which is analogous to the trends of solution pH shown in Figure 2. This indicates that the synergistic effect of 53.3 mmol/L Na+ and quartz sand on TFe mineralization precipitation was not significant. In conclusion, at monovalent cation concentrations of 53.3 mmol/L and under the synergistic action of 40 g/L quartz sand, the order of the mineralization ability is K+ > NH4+ > Na+. This result indicates a difference in the abilities of these three ion species to catalyze the transformation of Fe into secondary iron minerals. Gramp et al. [33] reported that the mineralization capacity of K+ is 75 and 200 times higher than those of NH4+ and Na+, respectively.
The effect of the Fe3+ concentration on biomineralization was investigated by Deveci et al. [34], who suggested that regardless of the material added, mineralization ability is limited at low Fe3+ concentrations. In the early stages, the Fe2+ oxidation efficiency was low, owing to the adaptation period required for A. ferrooxidans. Therefore, only a small amount of Fe3+ was produced and the low concentration of Fe3+ was not conducive to hydrolysis. This resulted in a low TFe precipitation efficiency at the beginning of the reaction, and the increased TFe precipitation efficiency in all treatments was the slowest between 0 and 24 h (Figure 3a). In addition, the low TFe precipitation efficiency indicates that only small amounts of secondary iron minerals were generated during this period. The TFe precipitation efficiency in the presence of Na+, NH4+, and CK alone did not show significant improvements in any reaction period. Although K+ exhibited the strongest mineralization ability, its ability remained limited during the initial stages of the reaction, with a TFe precipitation rate of only 4.3% in the 0–24 h period. However, in the late stages of the reaction (120–168 h), the induced mineralization of K+ was apparent due to the sufficient supply of Fe3+, indicating that the TFe precipitation efficiency increased sharply.
When quartz sand was introduced into the system (Figure 3b), the TFe precipitation efficiency for the treatment containing K+ and NH4+ significantly increased in the 0–24 h period. This increased efficiency suggested that the introduction of quartz sand overcame the limitations associated with low Fe3+ concentration during the initial stage of the reaction. Because quartz sand had no significant effect on the oxidation of Fe2+, the increased TFe precipitation efficiency occurred because the quartz sand shortened the induction period and accelerated the synthesis of the secondary iron minerals [20,21,22]. The trends of the TFe precipitation efficiency for the treatment containing Na+ and quartz sand and that with only quartz sand were similar in each period. This result further confirmed that the synergistic effect of 53.3 mmol/L Na+ and quartz sand on the mineralization of soluble Fe was insignificant. However, Dutrizac [20] reported that the TFe precipitation efficiency increased with increasing Na+ concentration from 20 to 60 mmol/L when the system contained 50 g/L of crystal seeds. This result is inconsistent with our study, likely because the reaction involved the chemical synthesis of minerals and temperature of 98 °C, which increases the rate and efficiency of Fe3+ mineralization at low Na+ concentrations. Therefore, over a suitable monovalent cations concentration range, the induction of crystal seeds can promote the precipitation efficiency of TFe in simulated AMD, and secondary iron mineral production can be increased.
3.4. X-ray Diffraction Analysis of the Biomineralization Products
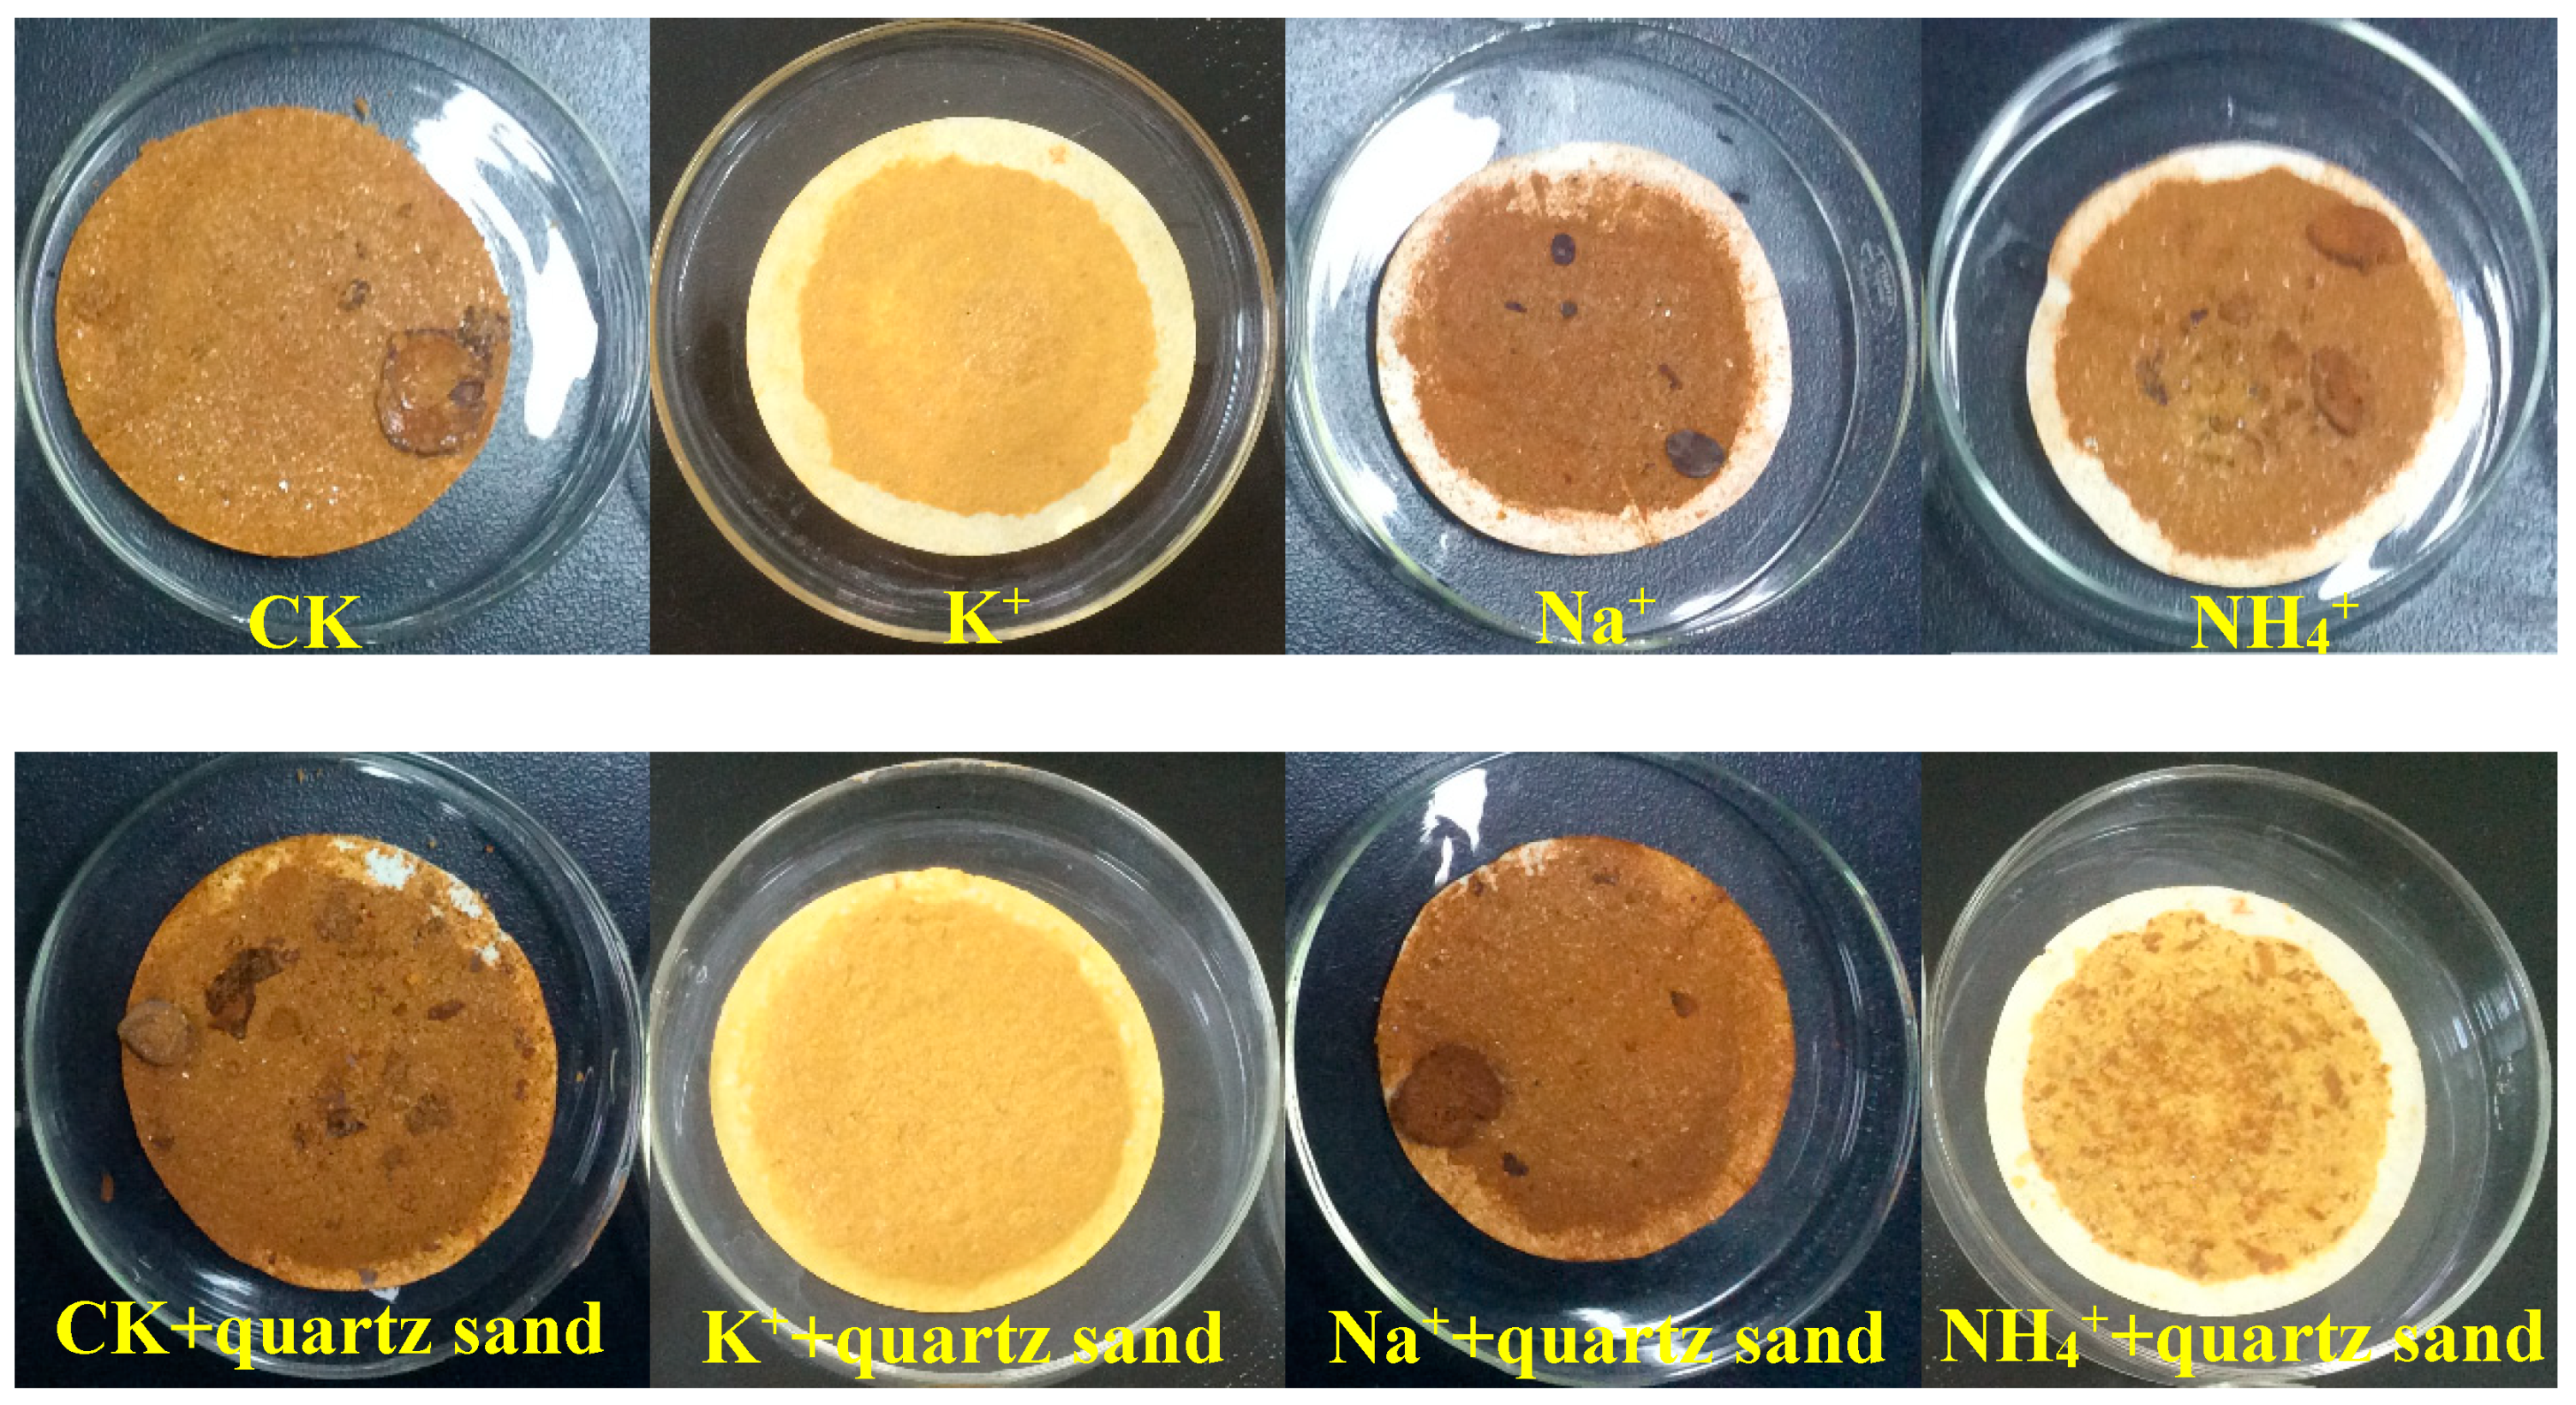
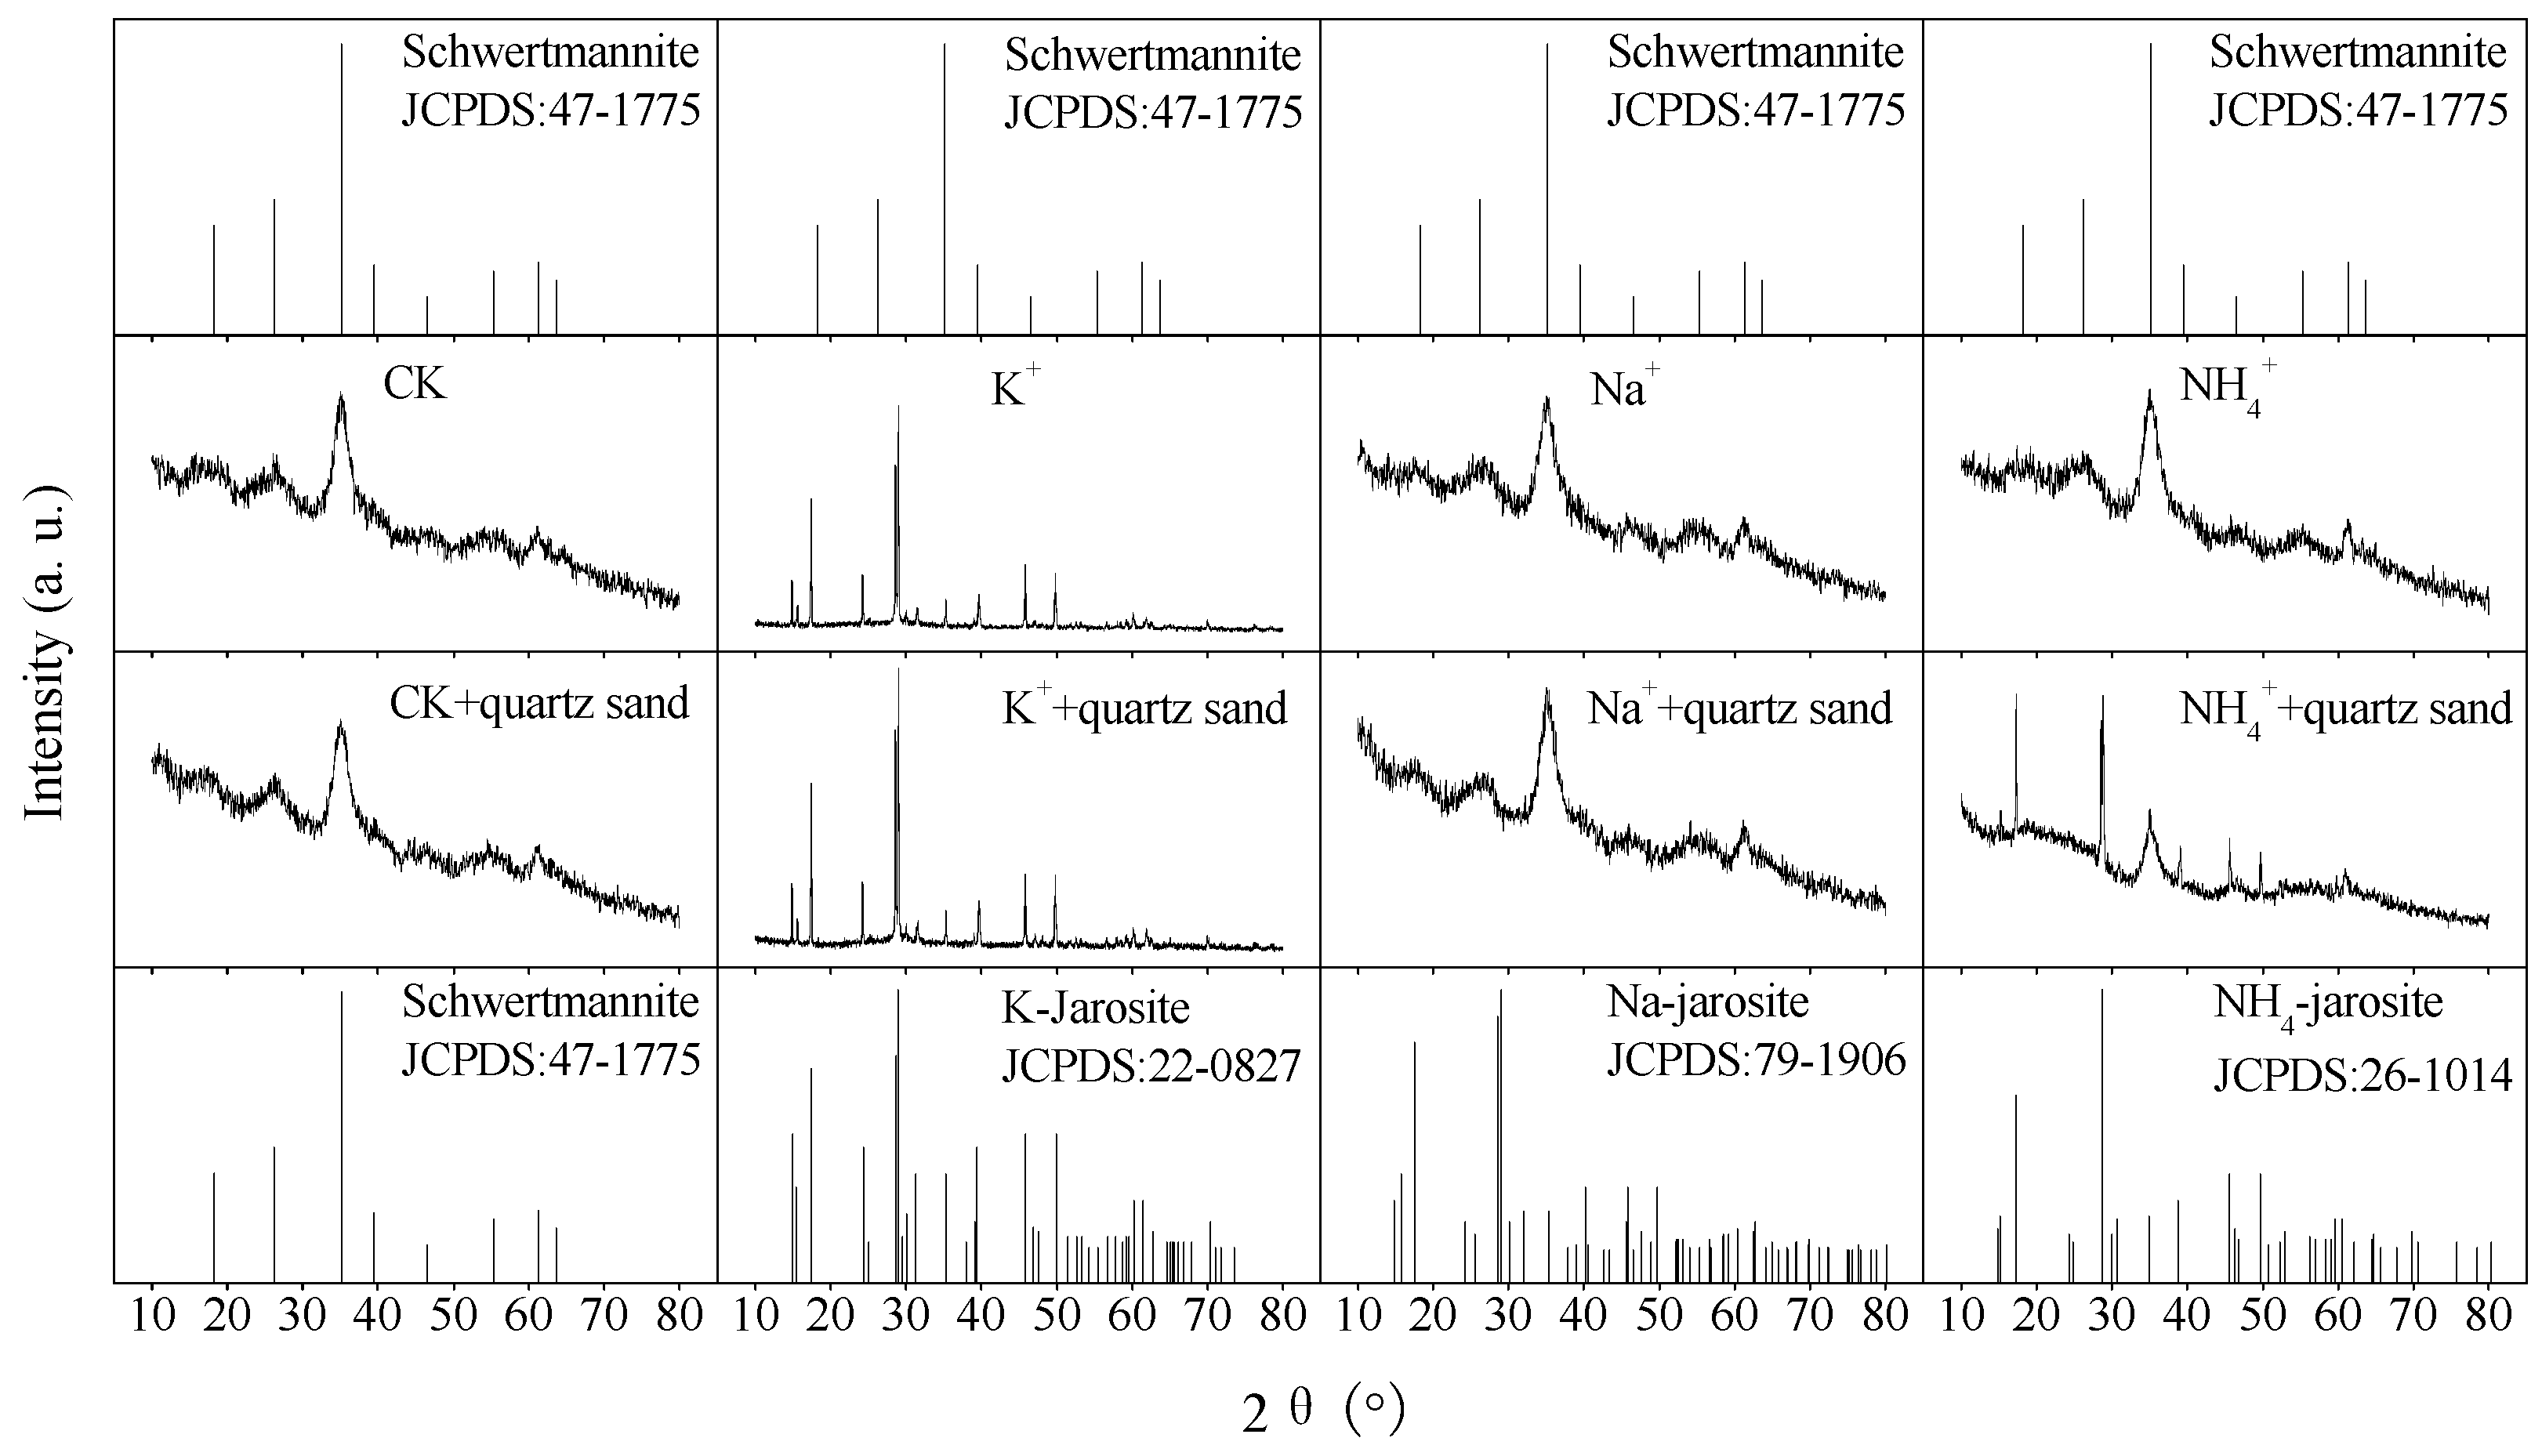
Photographs and XRD patterns of the secondary iron minerals collected for each biomineralization treatment are shown in Figure 4 and Figure 5, respectively. With reference to the standard (JCPDS) [35], XRD patterns of crystalline jarosite and amorphous schwertmannite, the data suggested that at 53.3 mmol/L monovalent cation concentration, treatments with K+, Na+, and NH4+ mediated by A. ferrooxidans produced K-jarosite, schwertmannite, and schwertmannite, respectively. This indicates that Na+ and NH4+ were not involved in the synthesis of Na-jarosite or NH4-jarosite, which is consistent with the results of Bai et al. [32]. However, after adding 40 g/L quartz sand to the NH4+ system, the secondary iron minerals exhibited diffraction peaks characteristics of schwertmannite and NH4-jarosite. Thus, 40 g/L quartz sand induced and promoted changes in the synthesis process of the secondary iron minerals, forming NH4-jarosite more easily than schwertmannite. However, the dominant mineral obtained from the Na+ and quartz sand process remained schwertmannite, which further confirmed that Na+ was not involved in the biosynthesis reaction of Na-jarosite. The same trends of the solution pH and TFe precipitation efficiency were observed for the treatments of Na+ and CK, whether quartz sand was added or not (Figure 2 and Figure 3). According to Equations (2) and (3), if the secondary iron minerals were produced by a single pathway, the yield of jarosite produced by the same amount of Fe3+ should be 1.5 times that of schwertmannite. The addition of quartz sand may lead to increased production of biogenerated secondary iron minerals. This process effectively removes soluble Fe in AMD, which is of great significance for the optimization of the bio-mineralization treatment of AMD.
4. Conclusions
To remove soluble Fe from simulated AMD, biomineralization of each system, with and without the addition of 40 g/L quartz sand, was investigated with an initial Fe2+ concentration of 160 mmol/L and monovalent cations (K+, Na+, and NH4+) concentration of 53.3 mmol/L. The addition of quartz sand contributed to Fe3+ hydrolysis (the oxidation product of Fe2+), improving TFe removal efficiency in the simulated AMD. For example, the TFe removal efficiencies of the K+, Na+, and NH4+ systems rose from 31.5%, 9.5%, and 12.1% to 58.1%, 22.2%, and 42.3%, respectively, with the addition of quartz sand. The quartz sand shortened the induction period of the biomineralization reaction, improving the TFe precipitation efficiency of the simulated AMD during the initial stage. The XRD patterns showed that 40 g/L quartz sand can improve the biomineralization removal efficiency of soluble Fe in the simulated AMD and induce the Fe3+ biomineralization pathway from schwertmannite to jarosite. In the next step, we will continue to optimize the experimental method of this study and apply it to the treatment of real AMD to evaluate the feasibility of its practical application.
Author Contributions
H.W. contributed to revision of the manuscript. M.L. performed the experiments, conducted the data collation and analysis. Y.S. conceived and designed this study, conducted the data collation and analysis and wrote the manuscript. All authors have read and agreed to the published version of the manuscript.
Funding
This research was funded by the National Natural Science Foundation of China (21906183); and the Soft Science Foundation of Hubei Province, China (2019ADC152); and the Fundamental Research Funds for the Central Universities (2722020JCG068; 2722020PY061).
Acknowledgments
The authors would like to thank the Solid Waste Research Institute of Nanjing Agricultural University for kindly providing A. ferrooxidans LX5 (CGMCC No. 0727).
Conflicts of Interest
The authors declare no conflict of interest.
References
- Zhou, L.X. Biomineralization: A pivotal process in developing a novel passive treatment system for acid mine drainage. Acta Chim. Sin. 2017, 75, 552–559. [Google Scholar] [CrossRef]
- Peppas, A.; Komnitsas, K.; Halikia, I. Use of organic covers for acid mine drainage control. Miner. Eng. 2000, 13, 563–574. [Google Scholar] [CrossRef]
- Sahoo, P.K.; Bhattacharyya, P.; Tripathy, S.; Equeenuddin, S.M.; Panigrahi, M.K. Influence of different forms of acidities on soil microbiological properties and enzyme activities at an acid mine drainage contaminated site. J. Hazard. Mater. 2010, 179, 966–975. [Google Scholar] [CrossRef] [PubMed]
- Cravotta, C.A.; Trahan, M.K. Limestone drains to increase pH and remove dissolved metals from acidic mine drainage. Appl. Geochem. 1999, 14, 581–606. [Google Scholar] [CrossRef]
- Vhahangwele, M. A novel technology for neutralizing acidity and attenuating toxic chemical species from acid mine drainage using cryptocrystalline magnesite tailings. J. Water Process Eng. 2016, 10, 67–77. [Google Scholar]
- Lee, W.C.; Lee, S.W.; Yun, S.T.; Lee, P.K.; Hwang, Y.S.; Kim, S.O. A novel method of utilizing permeable reactive kiddle (PRK) for the remediation of acid mine drainage. J. Hazard. Mater. 2016, 301, 332–341. [Google Scholar] [CrossRef] [PubMed]
- Meschke, K.; Herdegen, V.; Aubel, T.; Janneck, E.; Repke, J.U. Treatment of opencast lignite mining induced acid mine drainage (AMD) using a rotating microfiltration system. J. Environ. Chem. Eng. 2015, 4, 2848–2856. [Google Scholar] [CrossRef]
- Song, Y.W.; Wang, M.; Liang, J.R.; Zhou, L.X. High-rate precipitation of iron as jarosite by using a combination process of electrolytic reduction and biological oxidation. Hydrometallurgy 2014, 143, 23–27. [Google Scholar] [CrossRef]
- Bigham, J.M.; Schwertmann, U.; Pfab, G. Influence of pH on mineral speciation in a bioreactor simulating acid mine drainage. Appl. Geochem. 1996, 11, 845–849. [Google Scholar] [CrossRef]
- Jambor, J.L.; Dutrizac, J.E. Occurence and constitution of natural and synthetic ferrihydrite, a widespread iron oxyhydroxide. Chem. Rev. 1998, 98, 2549–2585. [Google Scholar] [CrossRef]
- Umita, T. Biological mine drainage treatment. Resour. Conserv. Recycl. 1996, 16, 179–188. [Google Scholar] [CrossRef]
- Bosecker, K. Bioleaching: Metal solubilization by microorganisms. FEMS Microbiol. Rev. 1997, 20, 591–604. [Google Scholar] [CrossRef]
- Singer, P.C.; Stumm, W. Acidic mine drainage: The rate-determining step. Science 1970, 167, 1121–1123. [Google Scholar] [CrossRef] [PubMed]
- Valente, T.; Grande, J.A.; De La Torre, M.L.; Santisteban, M.; Cerón, J.C. Mineralogy and environmental relevance of AMD-precipitates from the Tharsis mines, Iberian Pyrite Belt (SW, Spain). Appl. Geochem. 2013, 39, 11–25. [Google Scholar] [CrossRef]
- Zhu, J.Y.; Gan, M.; Zhang, D.; Hu, Y.H.; Chai, L.Y. The nature of schwertmannite and jarosite mediated by two strains of Acidithiobacillus ferrooxidans with different ferrous oxidation ability. Mater. Sci. Eng. C 2013, 33, 2679–2685. [Google Scholar] [CrossRef]
- Mihone, K.M.; Hana, F.; Sanda, R.; Lidija, C. Assessment of metal risks from different depths of jarosite tailing waste of Trepça Zinc Industry, Kosovo based on BCR procedure. J. Geochem. Explor. 2015, 148, 161–168. [Google Scholar]
- Min, G.; Sun, S.J.; Zheng, Z.H.; Tang, H.J.; Sheng, J.R.; Zhu, J.Y.; Liu, X.X. Adsorption of Cr(VI) and Cu(II) by AlPO4 modified biosynthetic schwertmannite. Appl. Surf. Sci. 2015, 356, 986–997. [Google Scholar]
- Zhang, S.L.; Jia, S.Y.; Yu, B.; Liu, Y.; Wu, S.H.; Han, X. Sulfidization of As(V)-containing schwertmannite and its impact on arsenic mobilization. Chem. Geol. 2016, 420, 270–279. [Google Scholar] [CrossRef]
- Sasaki, K.; Konno, H. Morphology of jarosite-group compounds precipitated from biologically and chemically oxidized Fe ions. Can. Mineral. 2000, 38, 45–56. [Google Scholar] [CrossRef]
- Dutrizac, J.E. The effect of seeding on the rate of precipitation of ammonium jarosite and sodium jarosite. Hydrometallurgy 1996, 42, 293–312. [Google Scholar] [CrossRef]
- Hutchison, R.F.S.; Phipps, P.J. Formaion and Particle Size of Jarosite. In Proceedings of the Australasian Institute of Mining and Metallurgy Conference (Tasmania); AusIMM: Melbourne, Australia, 1977; pp. 319–327. [Google Scholar]
- Won, C.W.; Paik, Y.H. Precipitation kinetics of hydronium jarosite at elevated temperatures. Taehan Kumsok Hakhoe Chi 1982, 120, 594–602. [Google Scholar]
- Wang, M.; Liang, J.R.; Zhou, L.X. The formation of biogenic jarosite by Acidithiobacillus ferrooxidans in the presence of crystal seed and potassium. J. Nanjing Agric. Univ. 2013, 36, 97–102. [Google Scholar]
- Ma, Y.Y.; Wang, H.W.; Song, Y.W.; Wu, Y.Q.; Guo, Z.H. The synthesis of secondary iron minerals induced by quartz sand during the bioleaching process improves the dewaterability of municipal sewage sludge. Minerals 2018, 8, 419. [Google Scholar] [CrossRef] [Green Version]
- Silverman, M.P.; Lundgren, D.G. Studies on the chemoautotrophic iron bacterium Ferrobacillus ferrooxidans. I. An improved medium and a harvesting procedure for securing high cell yields. J. Bacteriol. 1959, 77, 642–647. [Google Scholar] [CrossRef] [PubMed] [Green Version]
- Song, Y.W.; Liu, Y.L.; Wang, H.R. Comparison of the biological and chemical synthesis of schwertmannite at a consistent Fe2+ oxidation efficiency and the effect of extracellular polymeric substances of Acidithiobacillus ferrooxidans on biomineralization. Materials 2018, 11, 1739. [Google Scholar] [CrossRef] [PubMed] [Green Version]
- Wang, S.M.; Zhou, L.X. A renovated approach for increasing colony count efficiency of Thiobacillus ferrooxidans and Thiobacillus thiooxidans: Double-layer plates. Acta Sci. Circumstantiae 2005, 25, 1418–1420. [Google Scholar]
- Houngaloune, S.; Kawaai, T.; Hiroyoshi, N.; Ito, M. Study on schwertmannite production from copper heap leach solutions and its efficiency in arsenic removal from acidic sulfate solutions. Hydrometallurgy 2014, 147–148, 30–40. [Google Scholar] [CrossRef]
- Wang, Q.L.; Qiu, G.Z.; Yu, R.L.; Hu, E.M.; Zhang, H.C.; Xiong, X. Effects of coexisting ions on activity of Thiobacillus ferrooxidans in in-situ leaching of uranium. China Min. Mag. 2015, 24, 116–119, 127. [Google Scholar]
- Song, Y.W.; Wang, H.R.; Cao, Y.X.; Zhu, Y.H.; Zhou, L.X. Effect of NH4+ on the formation of secondary iron minerals and the removal of heavy metals. China Environ. Sci. 2018, 38, 2116–2123. [Google Scholar]
- Csonka, L.N. Physiological and genetic responses of bacteria to osmotic stress. Microbiol. Rev. 1989, 53, 121–147. [Google Scholar] [CrossRef] [Green Version]
- Bai, S.Y.; Liang, J.R.; Zhou, L.X. Effects of monovalent cation and dissolved organic matter on the formation of biogenic secondary iron minerals in bioleaching system. Acta Mineral. Sin. 2011, 31, 118–125. [Google Scholar]
- Gramp, J.P.; Jones, F.S.; Bigham, J.M.; Tuovinen, O.H. Monovalent cation concentrations determine the types of Fe(III) hydroxysulfate precipitates formed in bioleach solutions. Hydrometallurgy 2008, 94, 29–33. [Google Scholar] [CrossRef]
- Deveci, H.; Akcil, A.; Alp, I. Bioleaching of complex zinc sulphides using mesophilic and thermophilic bacteria: Comparative importance of pH and iron. Hydrometallurgy 2004, 73, 293–303. [Google Scholar] [CrossRef]
- Joint Committee on Powder Diffraction Standards (JCPDS). Mineral Powder Diffraction Files; International Center for Diffraction Data: Swarthmore, PA, USA, 2002; pp. 856–975. [Google Scholar]
Figure 1.
Change of Fe2+ concentration (a) without and (b) with quartz sand in simulated acid mine drainage (AMD) system.
Figure 1.
Change of Fe2+ concentration (a) without and (b) with quartz sand in simulated acid mine drainage (AMD) system.

Figure 2.
Change of pH (a) without and (b) with quartz sand in simulated acid mine drainage (AMD) system.
Figure 2.
Change of pH (a) without and (b) with quartz sand in simulated acid mine drainage (AMD) system.

Figure 3.
Change of TFe concentration (a) without and (b) with quartz sand in simulated acid mine drainage (AMD) system.
Figure 3.
Change of TFe concentration (a) without and (b) with quartz sand in simulated acid mine drainage (AMD) system.

Figure 4.
Photographs of the secondary iron minerals for different biomineralization treatments.

Figure 5.
X-ray diffraction patterns of the secondary iron minerals for different biomineralization treatments.
Figure 5.
X-ray diffraction patterns of the secondary iron minerals for different biomineralization treatments.

© 2020 by the authors. Licensee MDPI, Basel, Switzerland. This article is an open access article distributed under the terms and conditions of the Creative Commons Attribution (CC BY) license (http://creativecommons.org/licenses/by/4.0/).
Share and Cite
MDPI and ACS Style
Wang, H.; Li, M.; Song, Y. Enhanced Monovalent Cation Biomineralization Ability by Quartz Sand for Effective Removal of Soluble Iron in Simulated Acid Mine Drainage. Water 2020, 12, 732. https://doi.org/10.3390/w12030732
AMA Style
Wang H, Li M, Song Y. Enhanced Monovalent Cation Biomineralization Ability by Quartz Sand for Effective Removal of Soluble Iron in Simulated Acid Mine Drainage. Water. 2020; 12(3):732. https://doi.org/10.3390/w12030732
Chicago/Turabian StyleWang, Heru, Mengying Li, and Yongwei Song. 2020. "Enhanced Monovalent Cation Biomineralization Ability by Quartz Sand for Effective Removal of Soluble Iron in Simulated Acid Mine Drainage" Water 12, no. 3: 732. https://doi.org/10.3390/w12030732
Note that from the first issue of 2016, this journal uses article numbers instead of page numbers. See further details here.