Combined Electrocoagulation and Chemical Coagulation in Treating Brewery Wastewater


1
School of Engineering, University of Guelph, Guelph, ON N1G 2W1, Canada
2
Department of Civil Engineering, University of Ottawa, Ottawa, ON K1N 6N5, Canada
*
Author to whom correspondence should be addressed.
Water 2020, 12(3), 726; https://doi.org/10.3390/w12030726
Submission received: 10 December 2019
/
Revised: 26 February 2020
/
Accepted: 5 March 2020
/
Published: 6 March 2020
(This article belongs to the Section Wastewater Treatment and Reuse)
Abstract
:Significant over-strength discharge fees are often imposed on breweries for the disposal of high-strength effluent to sanitary sewers. In this research work, the removal performances of electrocoagulation (EC) compared with operating electrocoagulation and chemical coagulation in sequence (EC-CC) or vice-versa (CC-EC) was examined to determine the capability of treatment in reducing the strength of the wastewater. Optimal operating parameters regarding electrolysis time, initial pH, and applied power were determined in conjunction with nutrient removal performance, electrode consumption and energy usage. Combined EC-CC treatment has been demonstrated to be economically feasible for brewery wastewater applications from an energy consumption perspective due to the efficiency of nutrient removal and the reduction of sewer discharge costs. Treatment by EC-CC at 5 W for 20 min using aluminum electrodes resulted in enhanced and consistent removal efficiencies of 26%, 74%, 76%, and 85% for chemical oxygen demand (COD), reactive phosphorous (RP), total phosphorous (TP) and total suspended solids (TSS), respectively. Energy consumption was the main contributor to operating cost. By considering potential recovered over-strength discharge fees (ODF), EC-CC treatment is economically feasible and beneficial in a brewery wastewater application. The results demonstrated the effectiveness of the CC-EC process to remove phosphorous, organics and solids from brewery wastewater at lower power supply, so that the recovered ODF cost for CC-EC at 5 W-EC is 23% higher than at 10 W-EC.
1. Introduction
Over the past decade, the brewing industry has experienced substantial growth worldwide, solidifying its position and economic value in the global agri-food sector [1,2]. In Canada, the number of small breweries has increased by 17.6% between 2016 and 2017 due to the increasing market share of Craft beer [3]. This has increased the amount of generated wastewater where Craft breweries have been established, often adding organic loading stress to smaller community wastewater treatment facilities. Furthermore, effluent created during the beer brewing process can be highly variable as a result of the mixture of waste streams from different processes and stages [4]. The combination of large volumes of highly variable effluent can result in significant disposal costs for a brewery. Several types of biological treatment methods have been applied to brewery wastewater treatment; however, anaerobic treatment accounts for the most common full-scale systems [1,2].
In Ontario, over-strength discharge fees (ODFs) are defined by a municipality and calculated based on specific parameters exceeding their limits [5]. These fees have steadily increased over the past 6 years, introducing a challenge for the brewing industry in Ontario. Considering that brewery effluent often contains significant concentrations of organic matter, reducing the amount of over-strength wastewater entering the sewer is crucial for breweries to remain economically feasible. Breweries with on-site treatment systems can significantly lower costs associated with discharging over-strength wastewater by treating the effluent and reducing the concentration of surchargeable parameters [2].
The treatment of food and beverage wastewater by electrocoagulation (EC) has been proven successful in terms of removal performance in past studies [6,7]. However, despite these optimistic results, studies on the treatment of brewery effluent by EC remains relatively untouched from a technical and economic standpoint. In EC processes, inorganic matter is removed by complexation and/or precipitation with metallic hydroxides, while organic compounds are removed by co-precipitation, complexation, and/or to electrostatic attraction on the surface of metallic hydroxides [8]. Organic matter can also be oxidized in the EC system as a result of formation of chlorine at the anode; however, the intensity of chlorine formation is dependent on the initial concentration of sodium chloride [9]. EC has also been reported as a cost-effective treatment method to remove heavy metals from industrial wastewater if compared to chemical coagulation (CC) [10,11]. Several studies have been proposed and conducted regarding the integration of EC with other technologies such as biological reactors and chemical coagulation (CC) [7,12]. Employing a hybrid process can result in potential cost and energy savings while simultaneously improving treatment performance. Combining EC and CC processes can take advantage of both processes and optimize treatment by reducing separation time and water content of the generated sludge, simplifying the sludge dewatering process [12]. As far as the authors are aware, there is no work carried out on evaluating the combinations of EC and CC in microbrewery wastewater as well as on their economical effectiveness. Accordingly, this paper aims at assessing the capacity of electrocoagulation and combined electrocoagulation and chemical coagulation to treat high-strength microbrewery wastewater by evaluating the performance of alternative treatment methods while providing a comparison in terms of pollutant removal by EC, EC followed by CC (EC-CC), and CC followed by EC (CC-EC). Moreover, the investigation provides an economic analysis of operating costs relative to recovered costs in terms of ODFs following treatment.
2. Materials and Methods
The wastewater used in the experiments was obtained from Wellington microbrewery in Guelph, Ontario. The microbrewery samples contained high concentrations of P (30–369 mg/L) and COD (4000–25,400 mg/L), which is commonly attributed to the cleaning in place (CIP) units in the microbrewery due to the additions of caustic soda, phosphoric acid, and nitric acid.
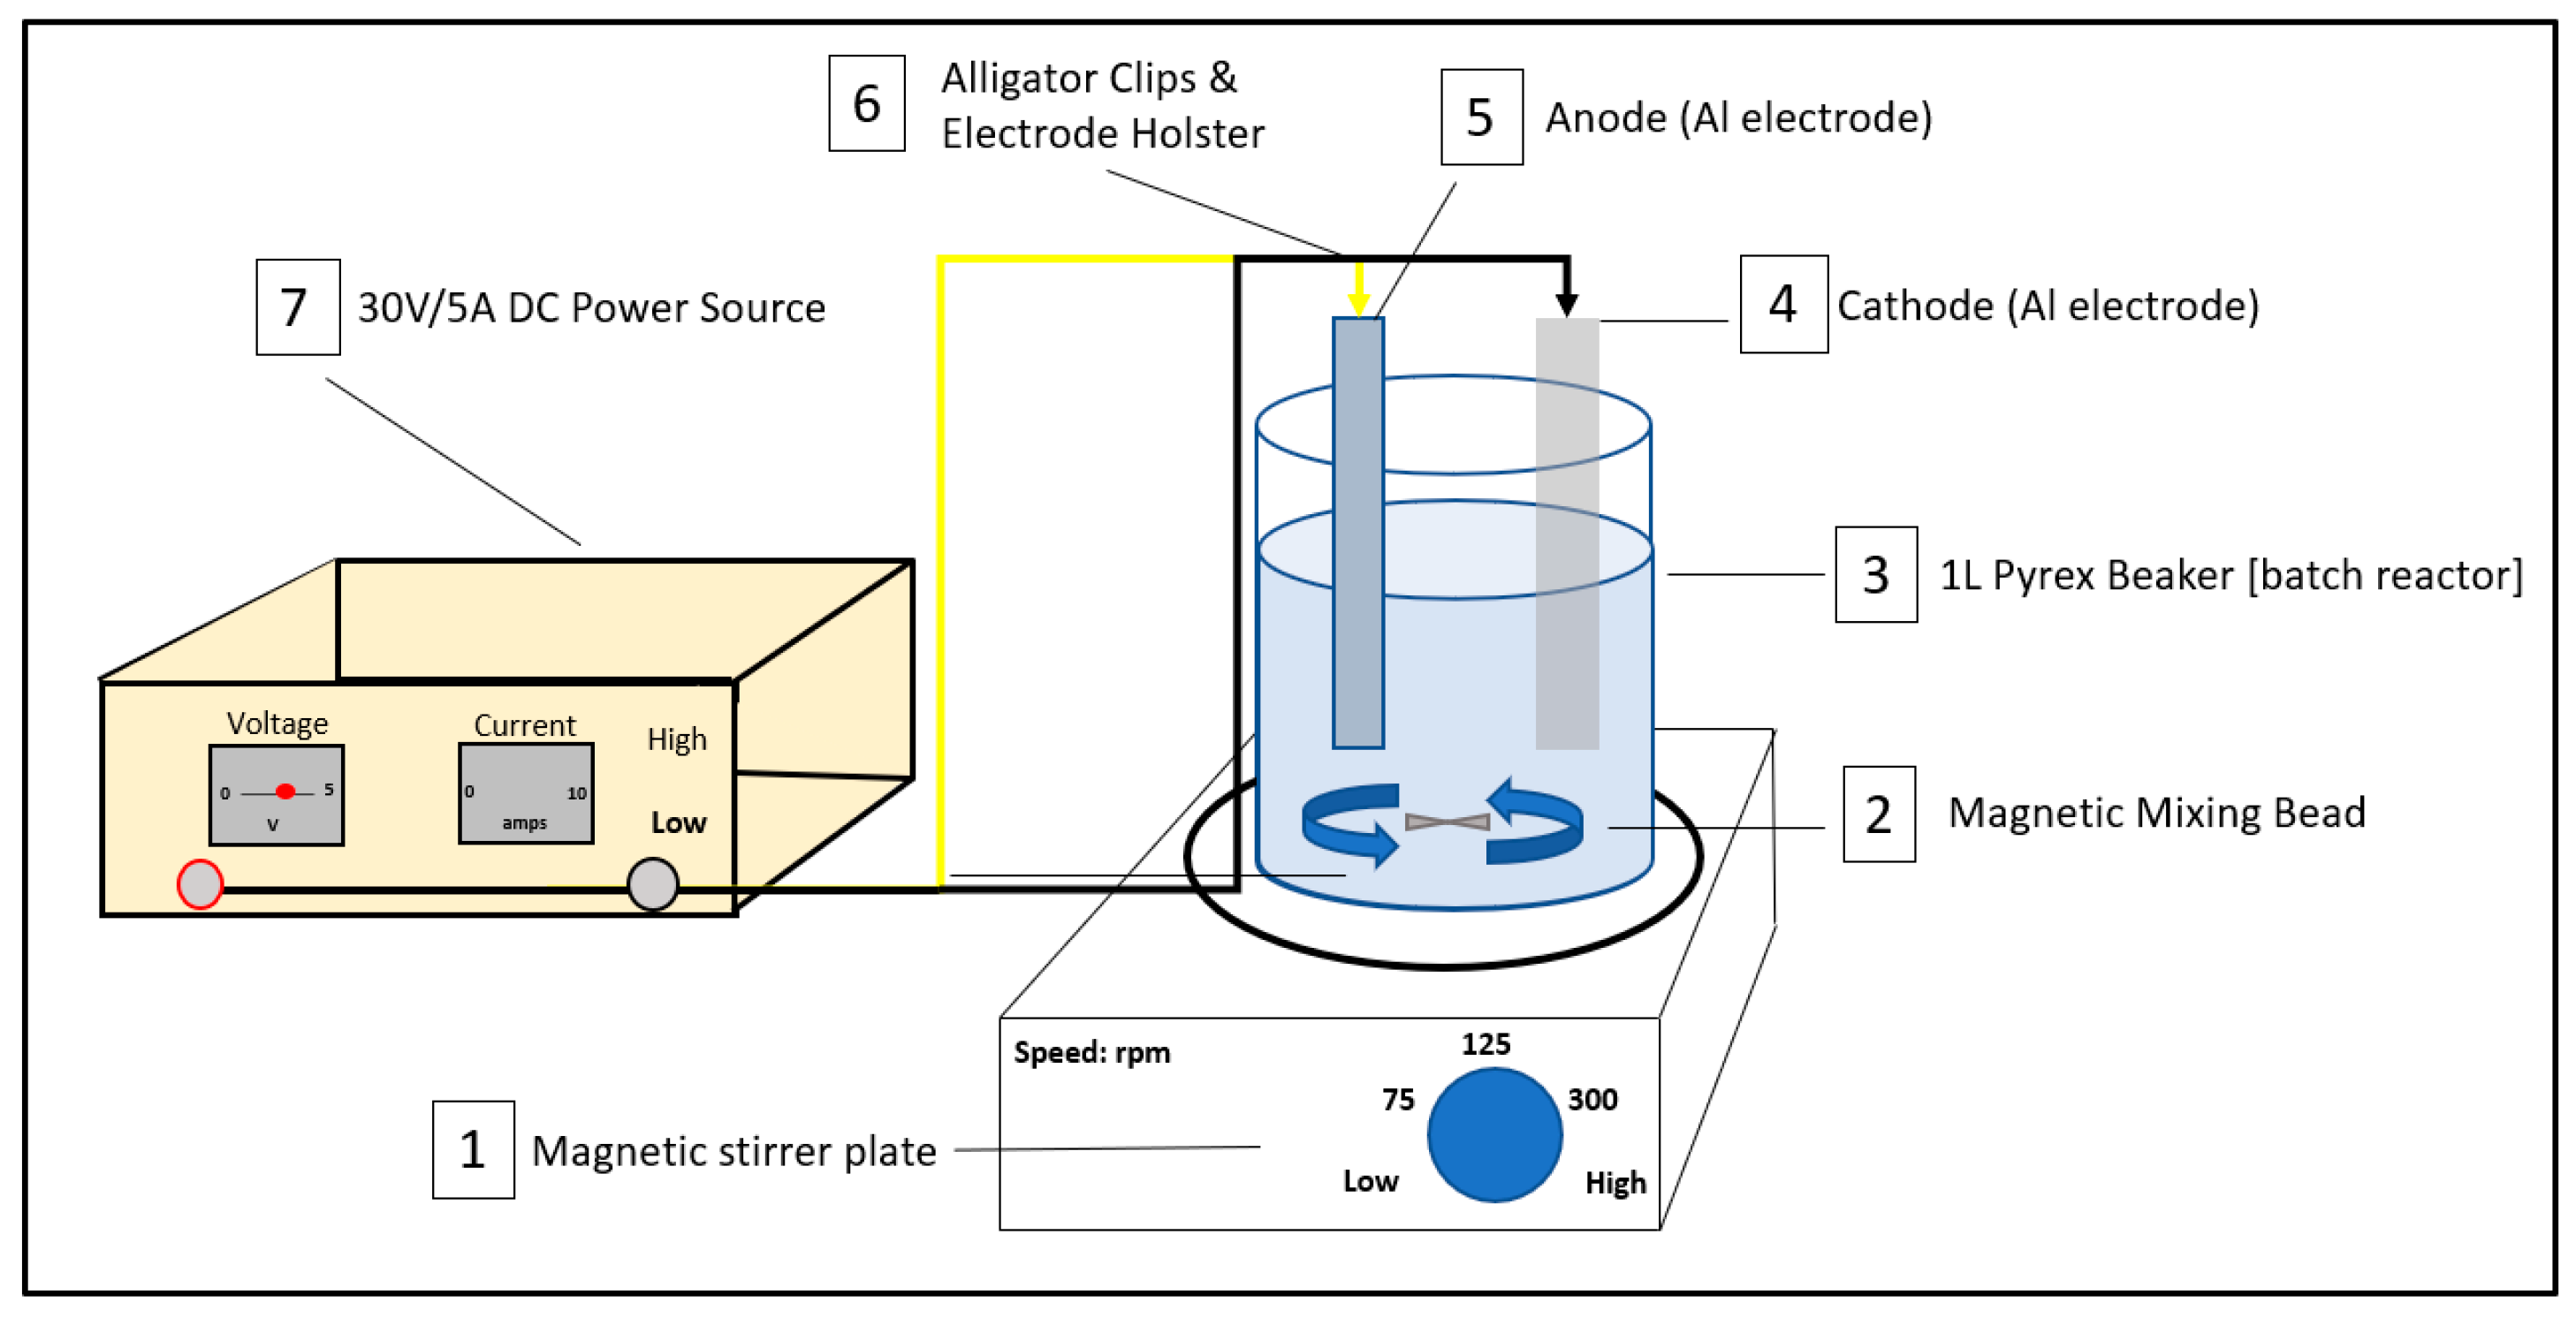
The EC reactor was composed of a 1L Pyrex cylindrical reactor, a magnetic stirrer plate (Fisherbrand™ Isotemp™ Stirrer, Fisher Scientific, Mississauga, ON, Canada), a wooden electrode holster for the Al/Al electrodes and a 30 V/5 A GW Laboratory DC power supply. Aluminum was chosen for the anode and cathode due to the low cost, reliability and accessibility of the material [13]. Prior to being attached to the electrode holster, the electrodes were scraped using fine sandpaper, submerged in 5 M (35%) hydrochloric acid solution for 8 min, rinsed with distilled water, then dried and weighed [10]. The purpose of cleaning the electrodes was to remove and avoid a passivation film forming on the electrodes. The pair of Al electrodes were spaced 3.5 cm apart and arranged in monopolar configuration. The approximate dimensions of the electrodes were 50 mm by 125 mm with a thickness of 2 mm. The surface area of the anode and cathode were 68.30 cm2 and 69.79 cm2, respectively. During the experiments, five 1L reactors were used to represent the incremental treatment times of 2, 5, 10, 20 and 30 min. The current densities applied ranged from 19.0 to 73.2 A/m2 and experiments were conducted galvanostatically. A PB-700 Philips & Bird blade Stirrer was used to stir the beakers following the addition of the dissolved aluminum sulfate (Al2(SO4)3·18H2O) during the EC-CC experiment. The experimental batch setup is shown in Figure 1.
2.1. Electro-Coagulation (EC)
During each run, 1 L of raw brewery effluent was added to a reactor with the electrodes and holster fastened on top. The reactors were placed on a magnetic stirrer plate with the speed held constant at 125 rpm during each run. The DC power supply was then turned on and adjusted according to the desired power applied (1, 5, and 10 W). After each electrolysis time (2, 5, 10, 20 and 30 min), the beakers were kept undisturbed to allow for the flocs to settle for a period of 30 min. Samples of the supernatant and sludge were then taken to perform TSS, COD, RP, and TP tests. For the COD, RP, and TP tests, the samples were tested by HACH methods using a HACH DR 3900 spectrometer. When the effect of pH was being investigated, the initial pH of the brewery wastewater (4.5–5.2) was adjusted to 3, 6, 6.5, 7, 7.5, 8, 8.5, 9 and 11 by adding 3 N NaOH and 1 N HCl with a precision of ±0.2 pH units. In all experimental runs, triplicates of each experiment were conducted to determine the mean value and standard deviations.
2.2. Electro-Coagulation Followed by Chemical Coagulation (EC-CC)
In this configuration, the EC procedure was conducted first followed by chemical coagulation. Each reactor (1 L beaker) was removed from the EC apparatus and placed in the jar test apparatus (PB-700 blade Stirrer, Philips & Bird manufacturer, Richmond, VA, USA). Dissolved aluminum sulfate (alum) (30 mL) was added to each beaker and mixing was applied: 30 s of rapid mixing at 125 rpm, 2 min at 75 rpm, and 5 min at 25 rpm. Following mixing, the reactors were kept undisturbed to allow for the flocs to settle for a period of 30 min. Samples from the supernatant and the sludge were taken to perform TSS, COD, RP, and TP tests. No pH adjustment to the raw brewery wastewater was carried out during the EC-CC experiments.
The optimum alum dose was predetermined by dosing raw wastewater with varying alum concentrations between 5 to 40 mg/L. The optimum alum dose of 30 mg/L was found to enhance the maximum removal efficiencies for RP and TP to 6 and 11%, respectively.
2.3. Chemical Coagulation and Post Electrocoagulation (CC-EC)
In this configuration, the CC procedure was conducted first followed by EC, using the same procedures as described above.
2.4. Economic Calculation
The energy and electrode consumption for the treatment of brewery wastewater was calculated using Equations (1) and (2), respectively.
where, V = average cell voltage (V), i = applied current (amp), t = electrolysis time (h), ∀ = volume of wastewater in EC units (L), MW = specific molecular weight of the Al electrode (26.98 g/mol), F = Faraday’s constant (96,485 °C/mol), z = number of electrons involved (3 for aluminum).
Energy, sacrificial electrodes and coagulants costs were considered in the calculation of operating costs. Other costs were assumed fixed and were not included in the calculation, including labor, maintenance, sludge dewatering and sludge disposal [14]. The operating costs for the treatment of brewery wastewater was calculated according to Equation (3).
where, a = unit cost of electricity ($/kWh), b = electrode material price ($/kg), c = cost of coagulant ($/kg), and Cenergy, Celectrode, Ccoagulant = experimental quantities consumed (per m3 of wastewater treated).
3. Results
Generally, EC is based on in situ formation of the coagulant due to the applied current that results in dissolution of the sacrificial anode. Simultaneously, the evolution of gases at the electrodes allows for organic pollutant removal by flotation [8,9]. Based on previous literature on EC, the capacity and efficiency of the EC process depends largely on the nature and concentration of pollutants being targeted for removal and slightly on the design of the EC reactor and flow conditions. The studies relative to effluent treatment by EC place significant emphasis on operating parameters and their influence on pollutant removal efficiencies [15]. Optimal parameters considered to affect EC performance include initial pH, applied power, electrolysis (treatment) time, current density, initial conductivity and electrode material/spacing/surface [8]. These parameters are often optimized to improve pollutant removal performance while minimizing energy consumption required during treatment.
3.1. Effect of Initial pH
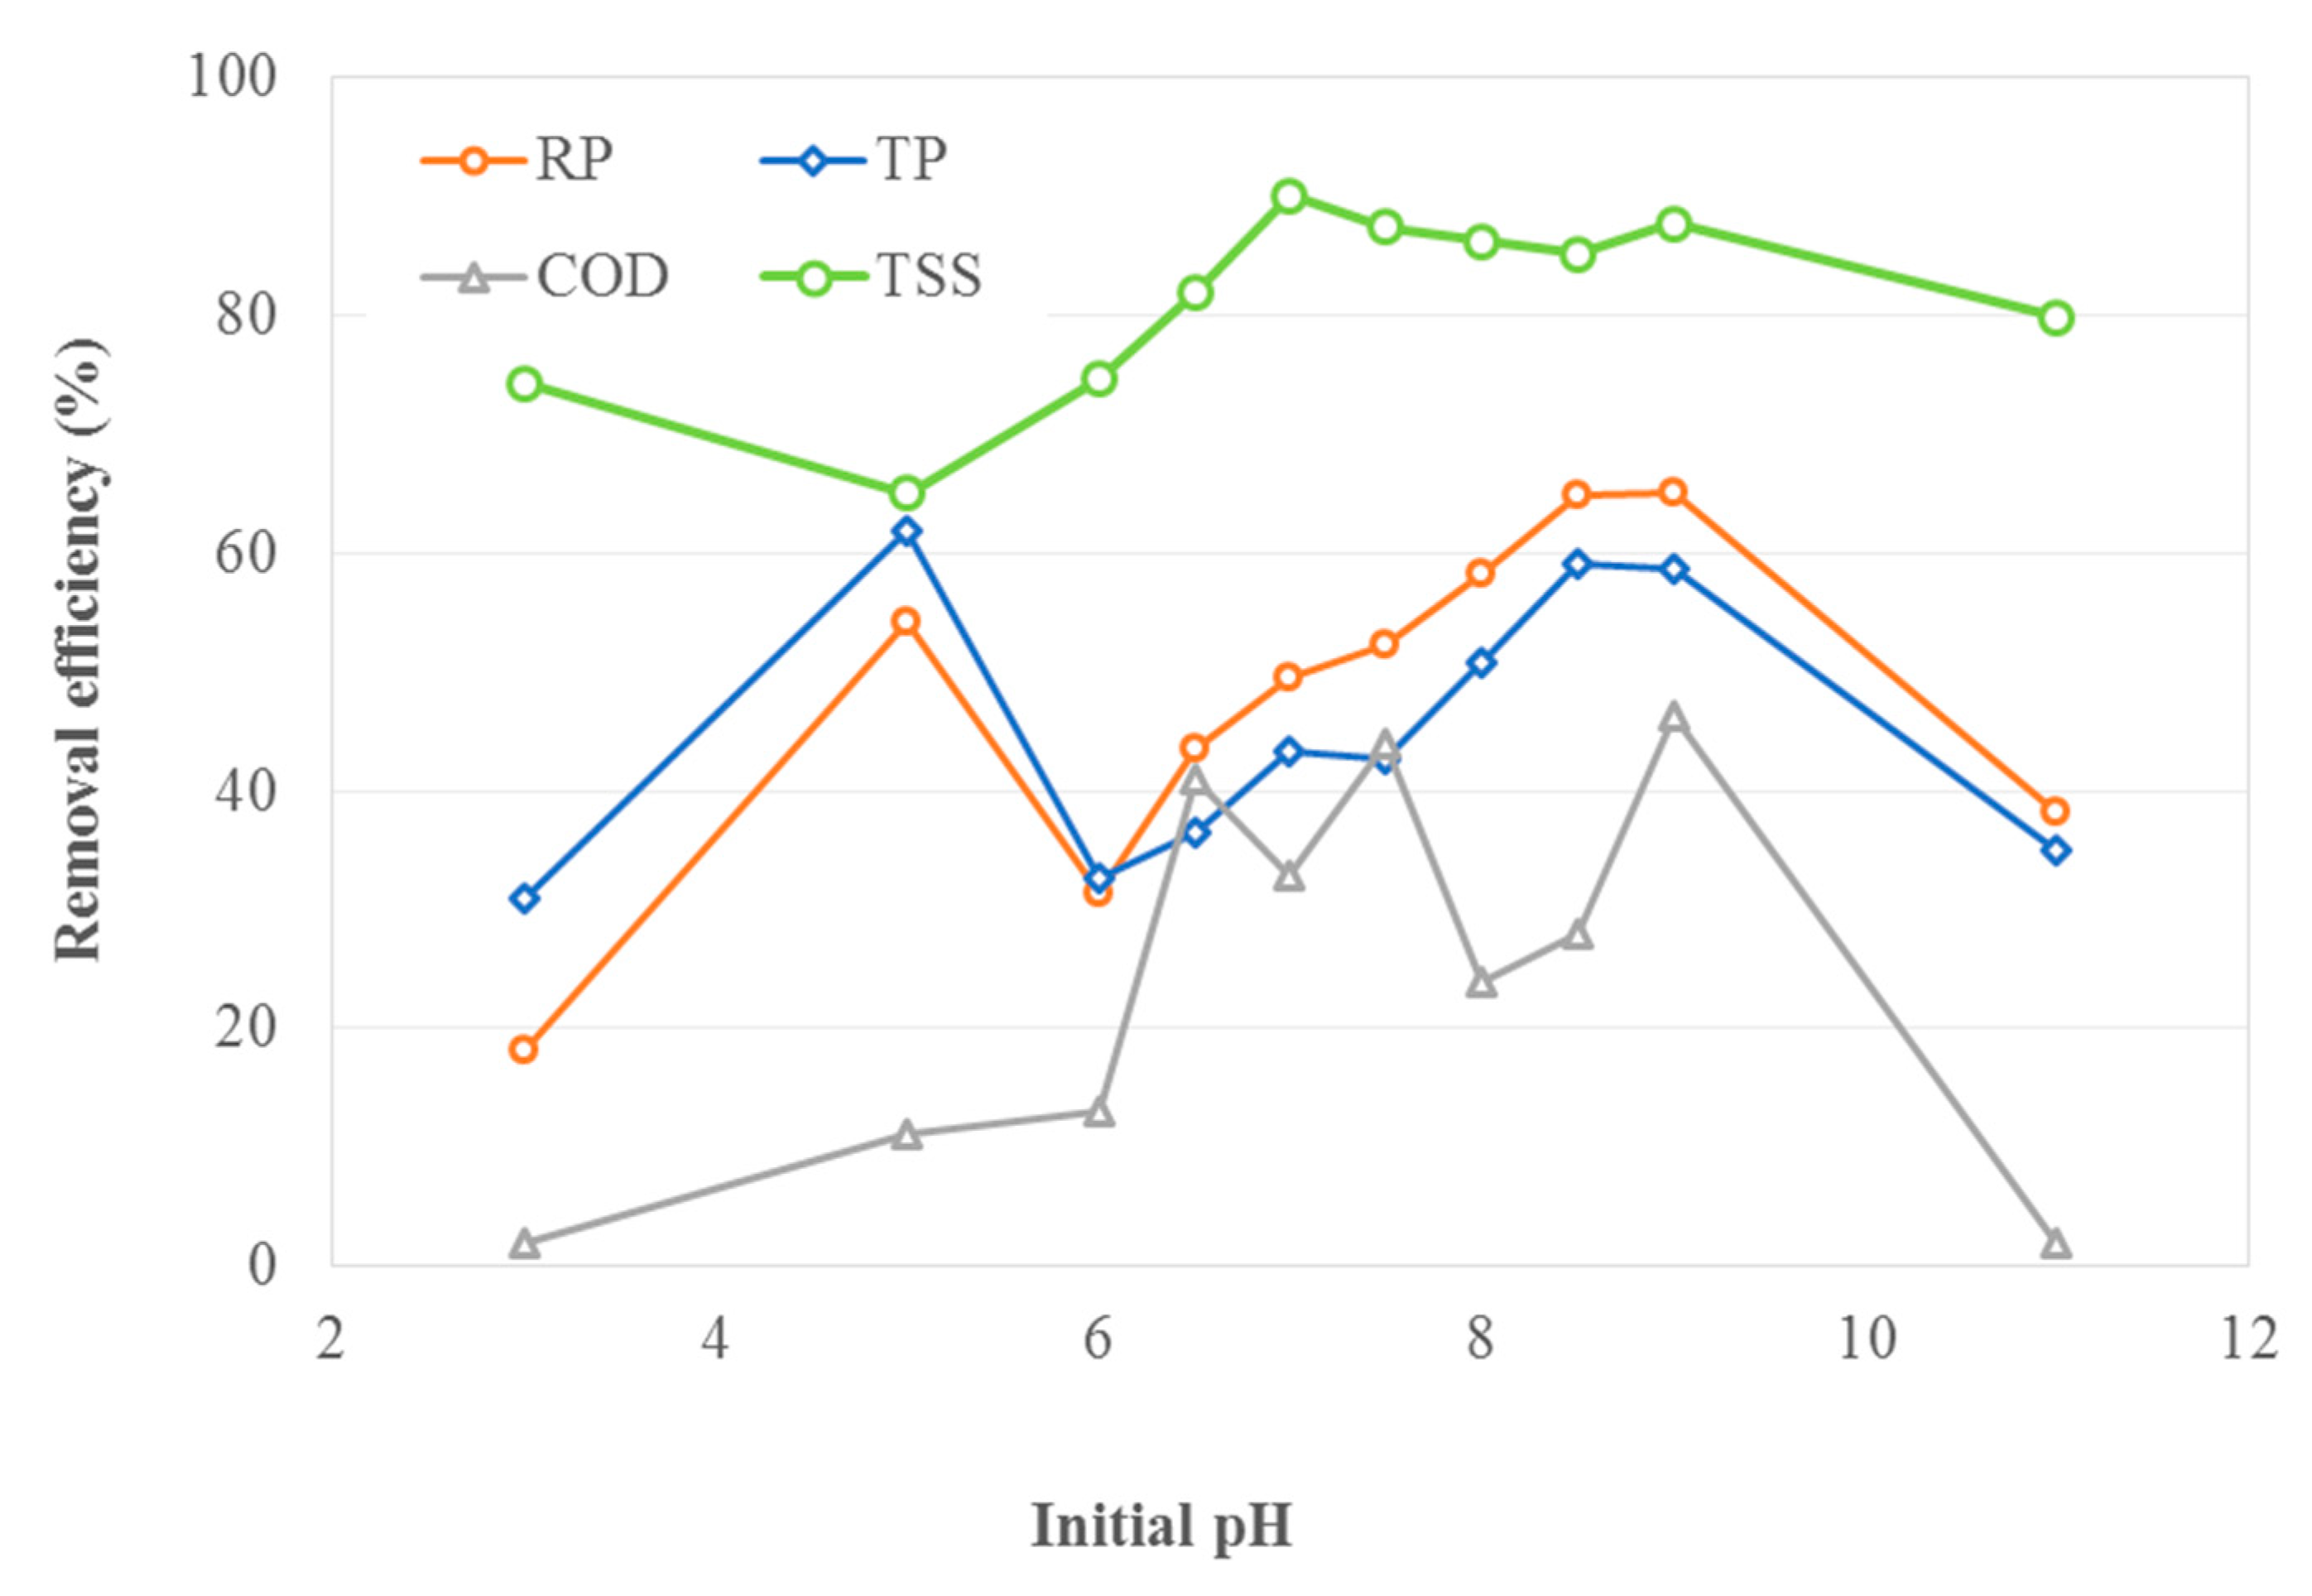
In order to investigate the effect of initial pH on EC performance, the brewery wastewater samples were adjusted to the desired pH and tested at 5 W applied power and 20 min electrolysis time. The results are shown in Figure 2.
The highest removal efficiencies for reactive phosphorous (RP) (65%), total phosphorous (TP) (62%), COD (47%) and TSS (90%) were observed at an initial pH of 9, 5, 7.5, and 7, respectively. Figure 2 also shows that TP and RP removals dropped significantly as initial water pH changed from 5 to 6, whereas the removal percentage was increased with a further increase in pH. This typical behavior can be seen in coagulation processes with more than one optimal removal range. Generally, the effective pollutant removal is achieved when the initial pH is between 5 to 9 due to the formation of polymeric species Al13O4(OH)247+ at the anode and the precipitation of Al(OH)3 [16]. The experimental results agree with a previous study that determined the optimum pH range to be between 4 and 8 [16]. When the initial pH of the solution was highly acidic (pH = 3) or basic (pH = 11), the removal efficiencies for RP, TP, COD and TSS were significantly reduced, excluding the TSS removal at a pH of 3. At a very acidic pH, poor removal can be attributed to the poor precipitation of aluminum hydroxide and the dominant Al3+ species, which has no coagulation effect [17]. At highly basic pH, poor removal can be attributed to the formation of Al(OH)4−, which is soluble and inadequate for pollutant adsorption [18]. The experimental results show that the optimal initial pH of brewery effluent to achieve the maximum removal for RP, TP, COD and TSS in EC is 9. However, if only RP and TP removal is preferred, an initial pH of 8.5 is suggested. At pH values higher than 8.5, the EC process can be negatively affected due to increased production of OH- ions that can chemically attack the electrodes and the increased formation of Al(OH)4− which is ineffective in wastewater treatment [19].
3.2. Effect of Applied Power
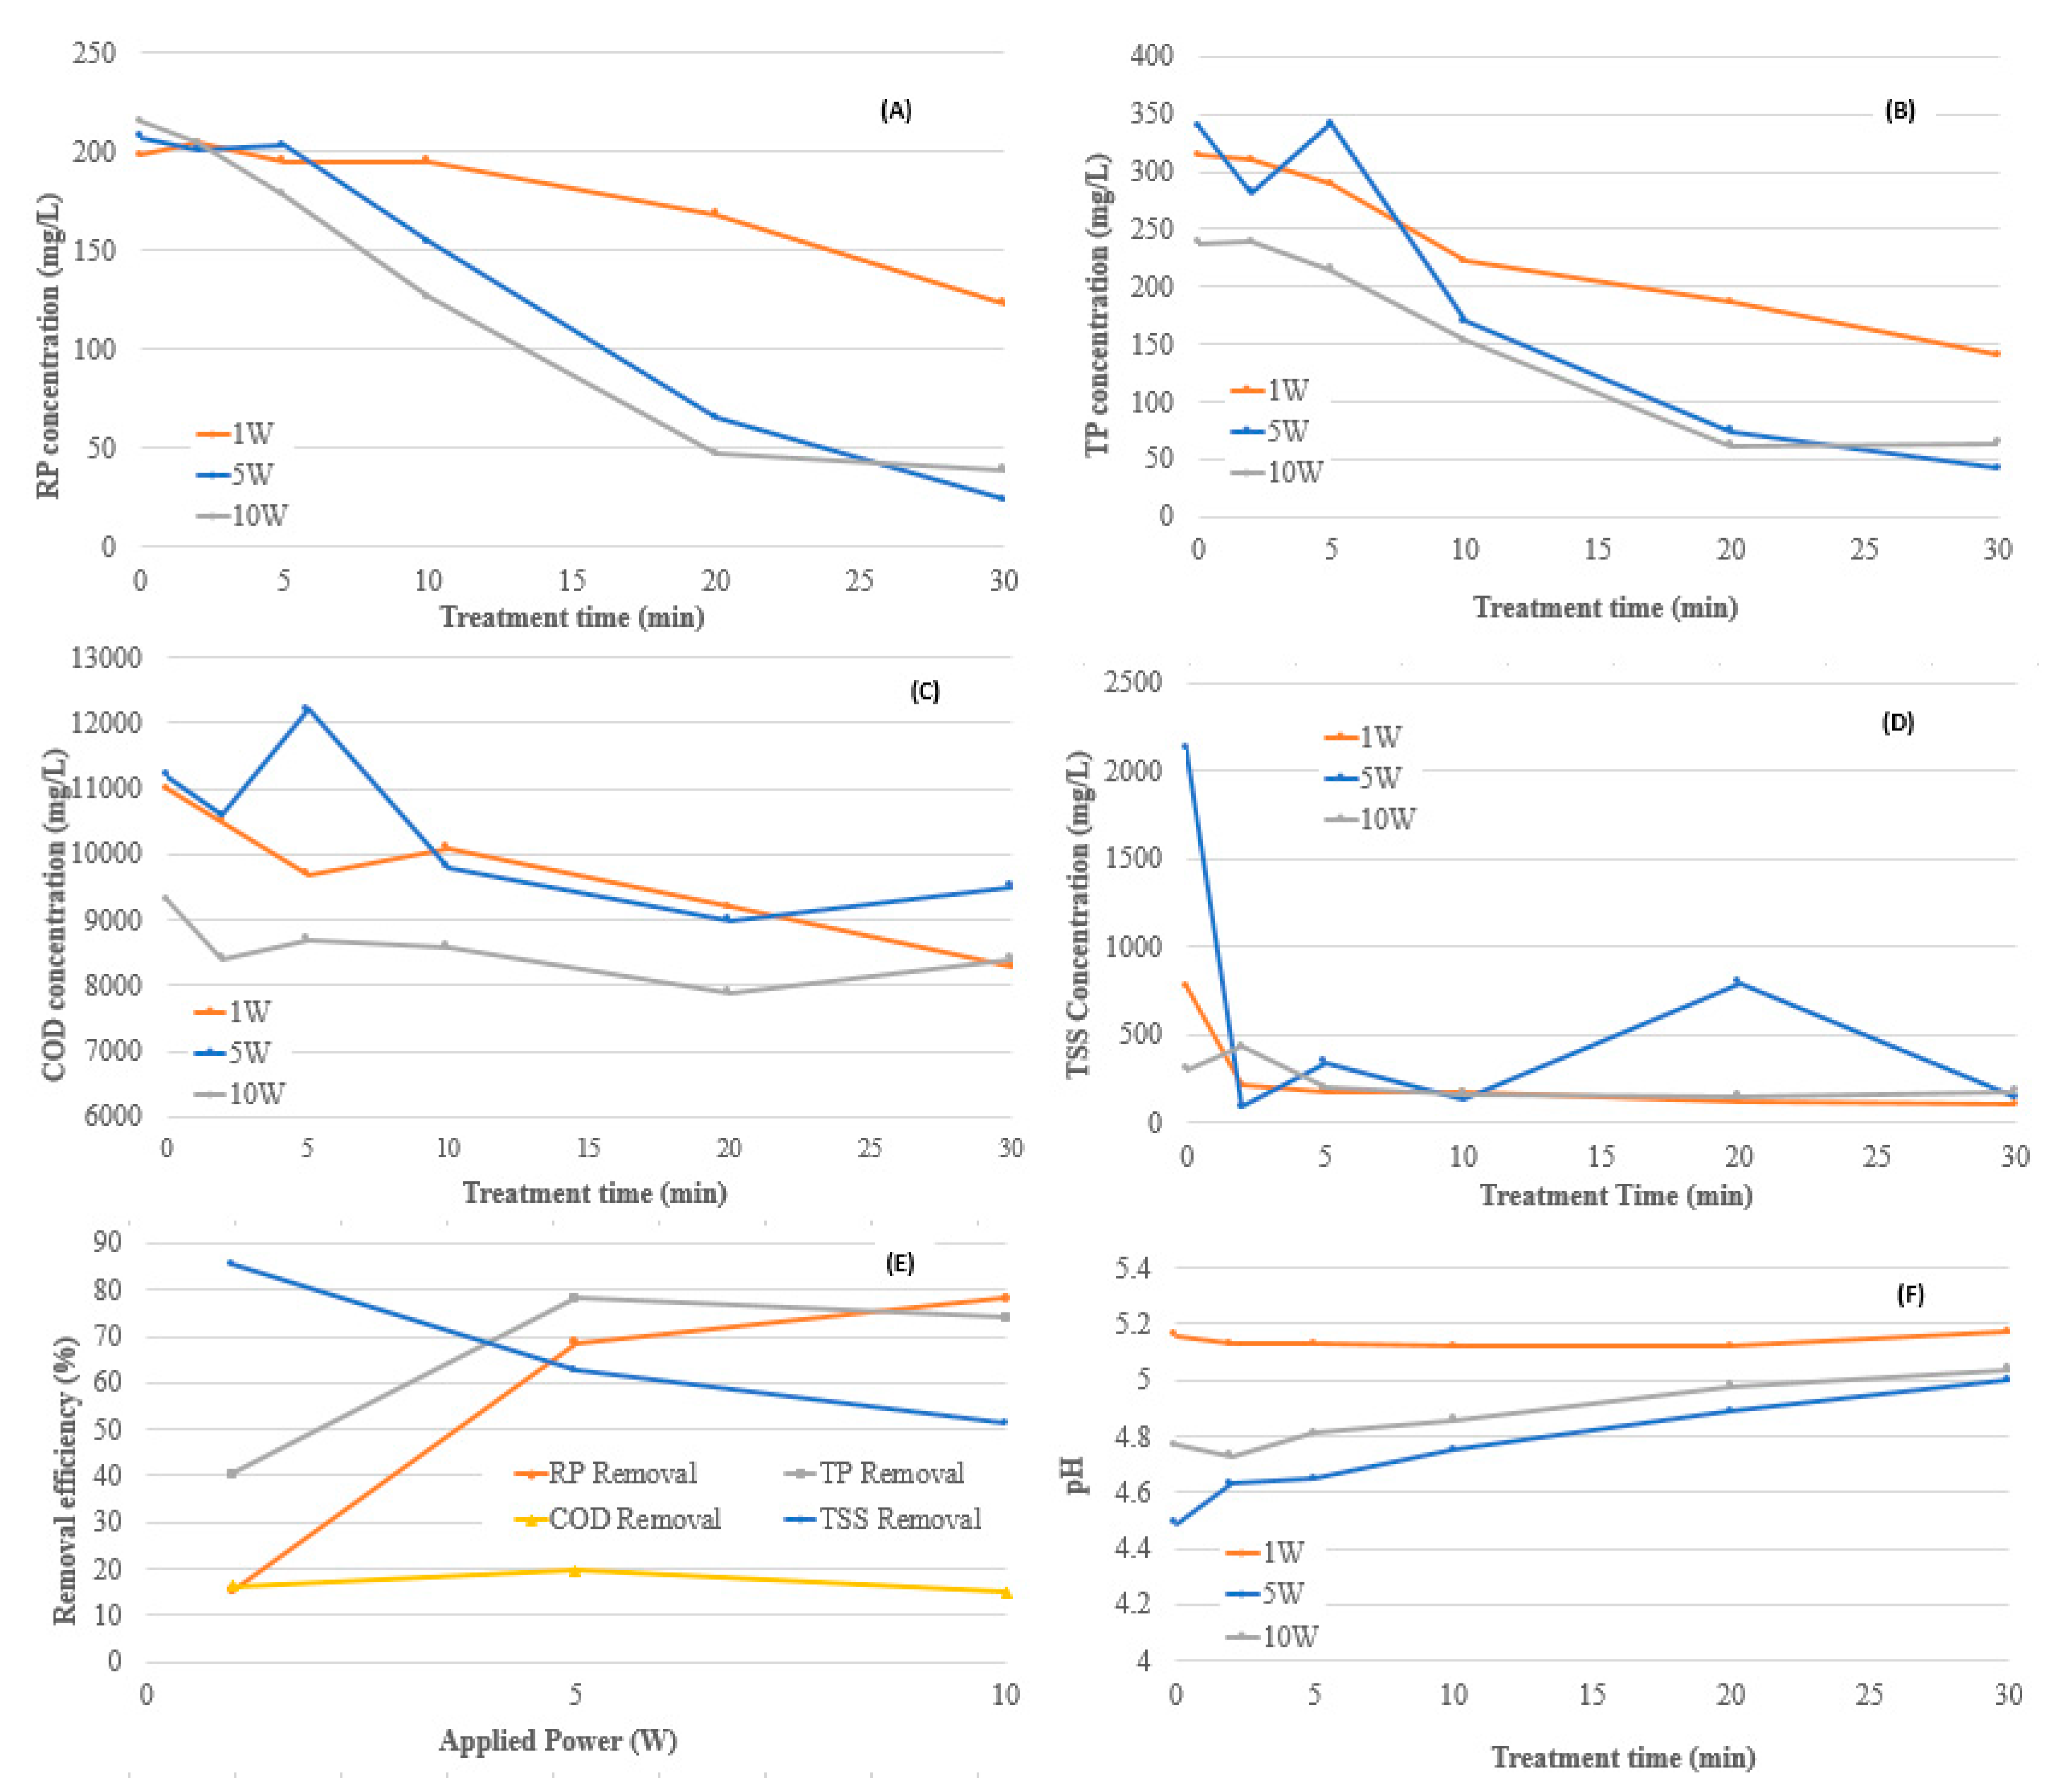
The effects of variations in applied power on nutrient removal for various treatment times are presented in Figure 3. The nutrient removal performance following 20 min of EC at 1 W, 5 W and 10 W applied power are shown in Figure 3E. The effect of variations of applied power on the pH of solution as a function of treatment time is presented in Figure 3F.
Figure 3A,B clearly demonstrate that as applied power was increased from 1 W to 5 W, RP and TP removal performances were enhanced, with COD removal increasing slightly. The reduced RP and TP removal performance at 1 W can be attributed to the Al3+ dosage in the EC reactor. According to Faraday’s law, when charge loading is low, the Al3+ dosage may not be sufficient to form Al(OH)3 and other polymeric aluminum species (i.e., Al13O4(OH)247+) to destabilize all colloidal and suspended particles [9,16]. As treatment time increased beyond 10 min at 1 W applied power, the RP and TP removal performance improved. This suggests that 10 min at 1 W was the critical Al3+ dosage to facilitate pollutant removal. In agreement with previous studies, greater applied power resulted in greater RP and TP removal efficiencies [20].
Figure 3 also shows that nutrient removal performance slightly decreased at 30 min of treatment at 10 W. Furthermore, as the applied power increased from 5 W to 10 W, the TP and COD removal performance decreased slightly. In accordance with the literature, longer treatment times at increased applied power have been described to adversely affect removal performance [13]. As suggested in a previous study, the reduction of performance at higher applied power can be explained by the oversaturation of metal hydroxide ions in the solution [12]. Excessive concentrations of metal cations can revert the net charge of suspended materials resulting in re-stabilization in the wastewater solution. As well, with increased current and the rapid generation of hydrogen bubbles, faster floatation times can diminish the contact time between contaminants and coagulants, negatively affecting treatment performance. Anodic passivation and cathodic polarization can also occur at higher applied power, reducing treatment performance [6]. Thus, in order to optimize the EC process, the effect of variations in applied power and treatment time should be considered.
Increasing the applied power from 5 W to 10 W for a 20-min treatment time did not significantly improve the removal of nutrients and COD, indicating that at an applied power of 5 W, the majority of the particulate matter was capable of being destabilized. Based on the experimental results obtained, the optimum applied power was chosen to be 5 W for a 20-min treatment time that resulted in RP, TP and COD removal percentages of 69%, 78% and 20%, respectively.
3.3. Effect of Electrolysis Time
In the EC process, the electrolysis time is a significant parameter affecting treatment performance by determining the production of Al3+ ions from the anode and effecting the pH of solution [13,21]. As electrolysis time is increased, removal efficiency can be enhanced due to the increased generation of flocs. However, beyond the optimal electrolysis time, the removal efficiency does not increase as there is already a sufficient number of flocs present in the EC reactor available for removal [22]. In this study, it has been found that the pH of the wastewater following 10 W EC is influenced by the treatment time. The pH of the wastewater has slightly increased from 4.7 to 5.1 as the EC time increased up to 30 min. The increasing pH following EC can be explained by the accumulation of the OH− ion in aqueous solution during treatment [23]. As the treatment time increases, more OH- ions can accumulate.
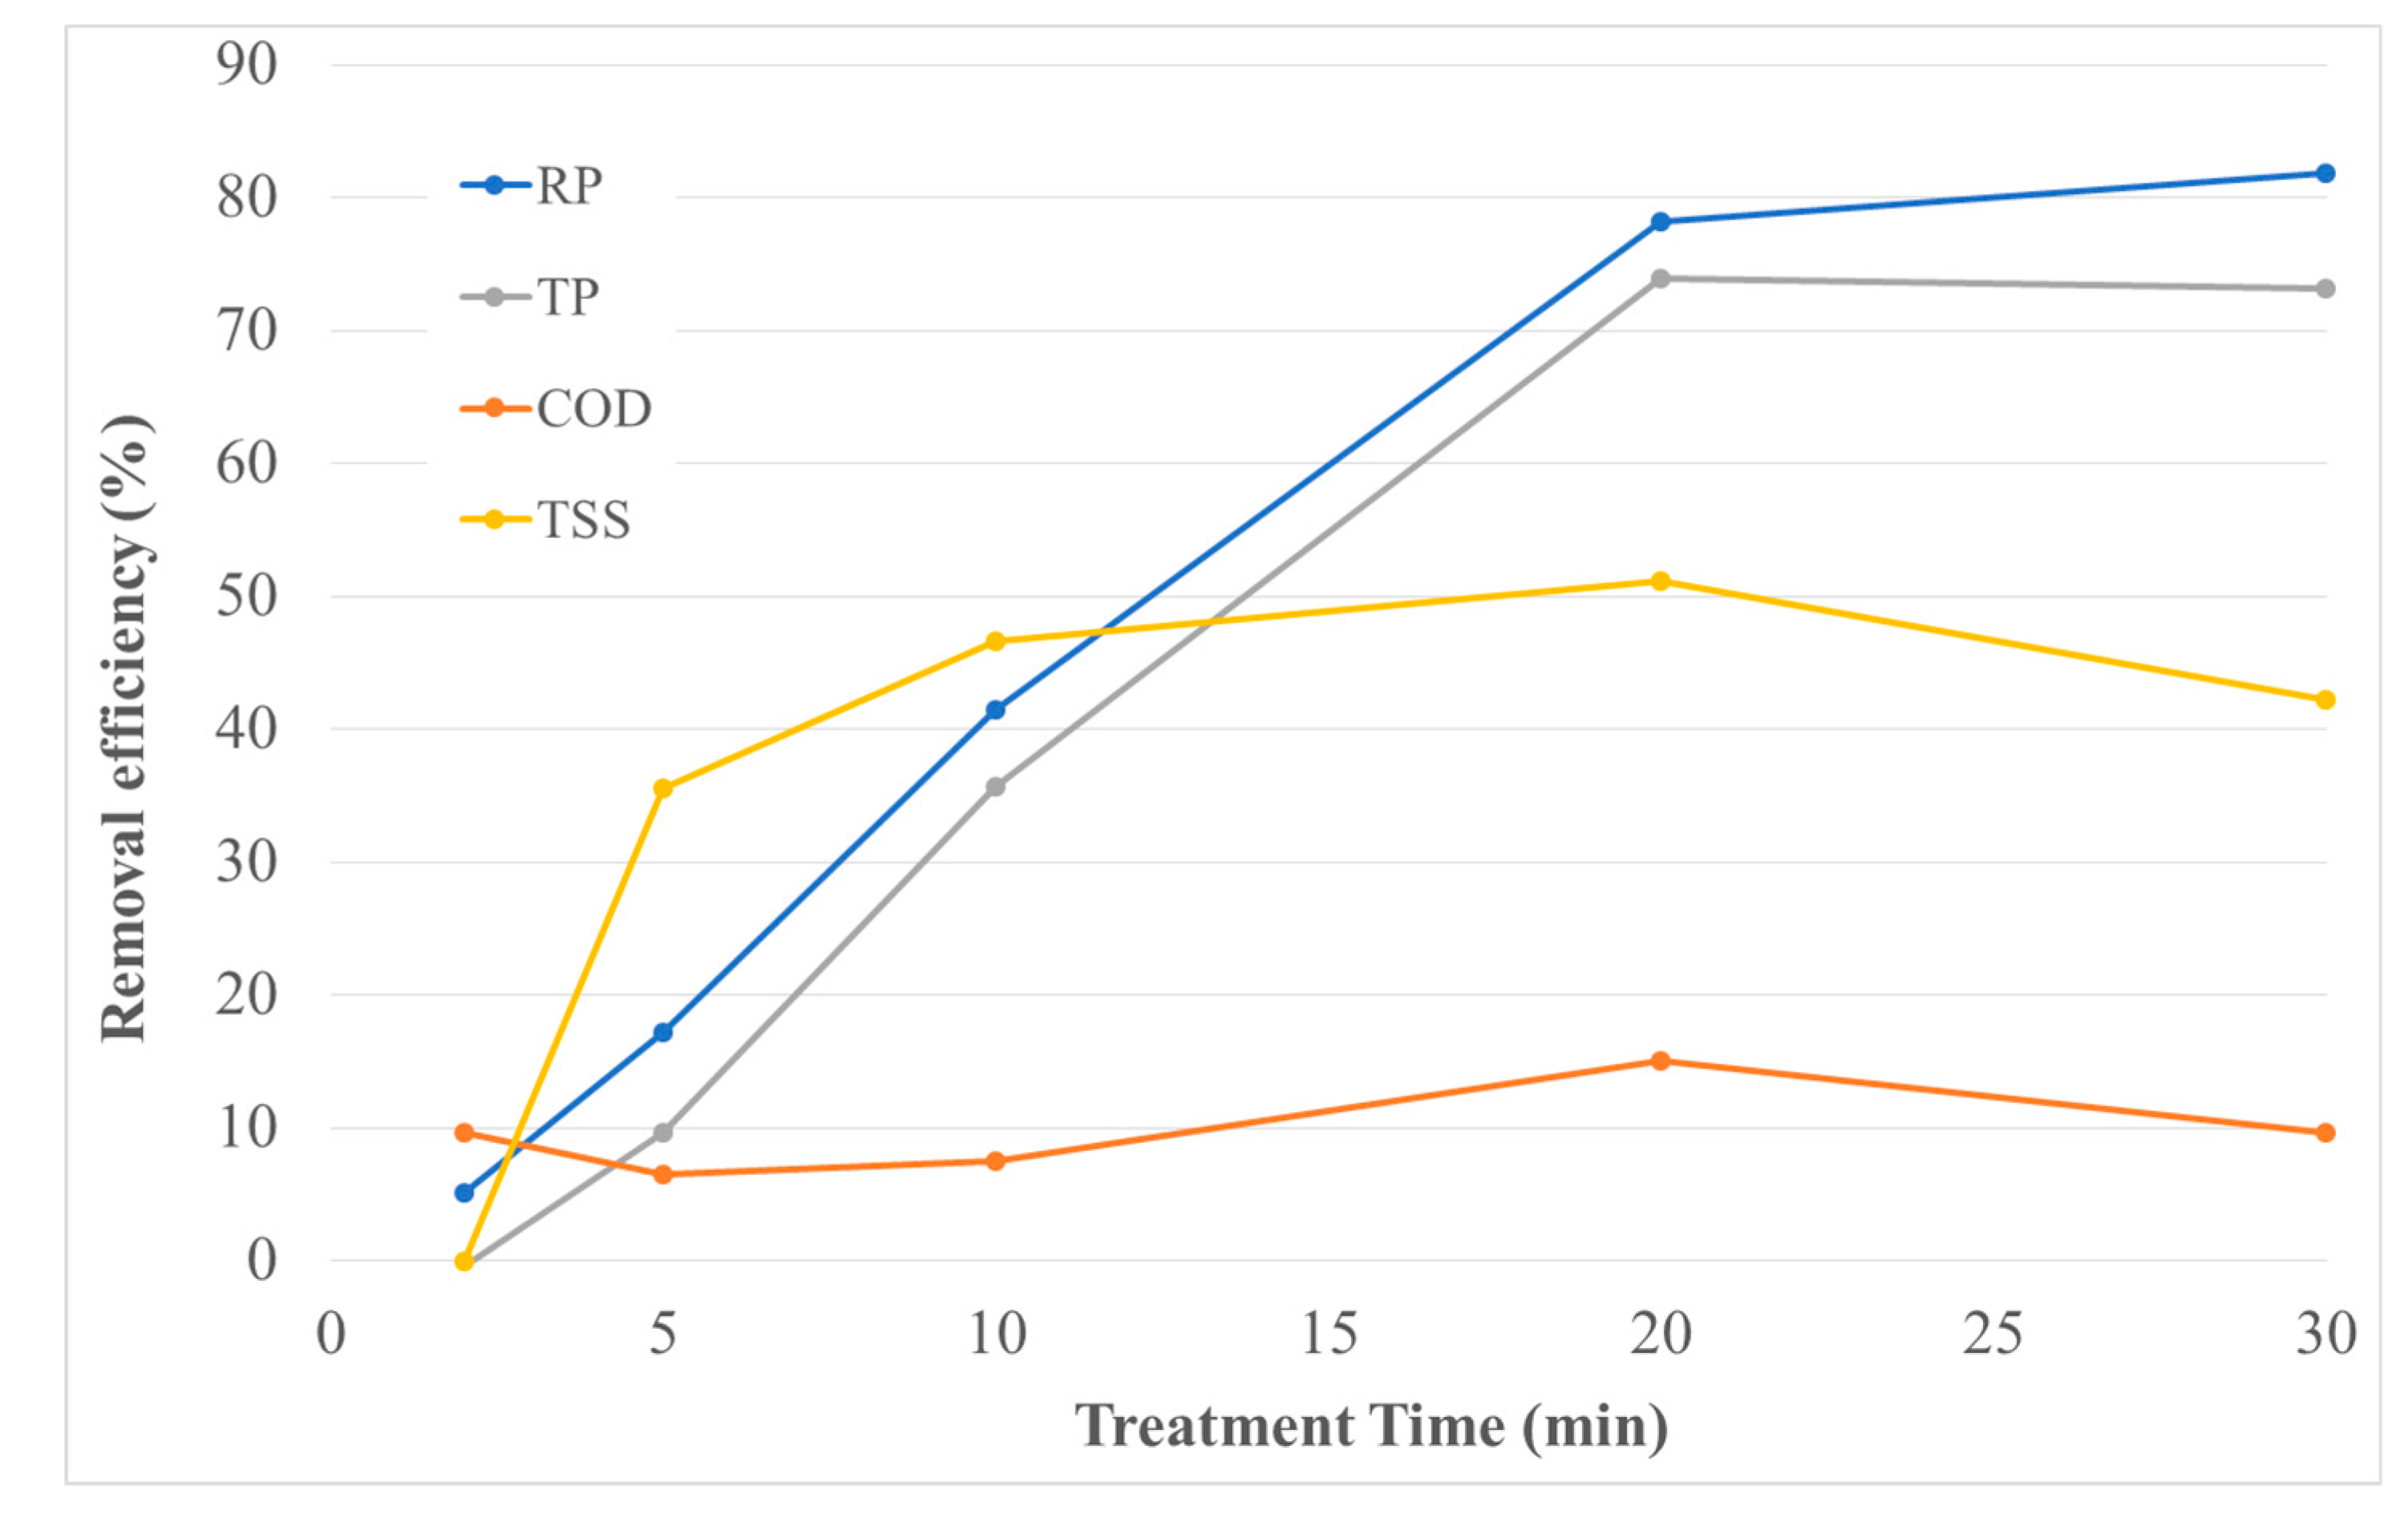
The RP, TP, COD and TSS removal efficiency at 10 W applied power as a function of treatment time is shown in Figure 4. The poor removal efficiencies at reduced treatment times can be attributed to the inadequate time for ionic exchange. Limited time for ionic exchange can result in an insufficient Al3+ ion dosage, incapable of destabilizing all colloidal and finely suspended particles. As suggested in a previous investigation, a higher dosage of Al(aq)3+ has a significant effect on floc growth profiles at pH 6.5 [3]. As the operating time is increased, the Al(aq)3+ dosage increases, resulting in a faster floc growth rate and enlarged floc sizes. Accordingly, as the treatment time was increased from 2 to 20 min resulting in a higher coagulant dosage, the removal performance of RP, TP and TSS was enhanced. Interestingly, the COD removal efficiency remained quite stable at all treatment times with the removal below 16%. It has been suggested that the poor COD removal of EC can be explained by the soluble COD fraction of the wastewater [7]. The soluble COD fraction of the wastewater obtained from Wellington Brewery was approximately 73%. Under the assumption that coagulant conditions were non-limiting, the maximum COD removal of 16%, agrees with most of the particulate portion of COD being removed. However, the lower COD removal efficiency could be attributed to the limited formation of chlorine as a result of the low concentration of sodium chloride [8].
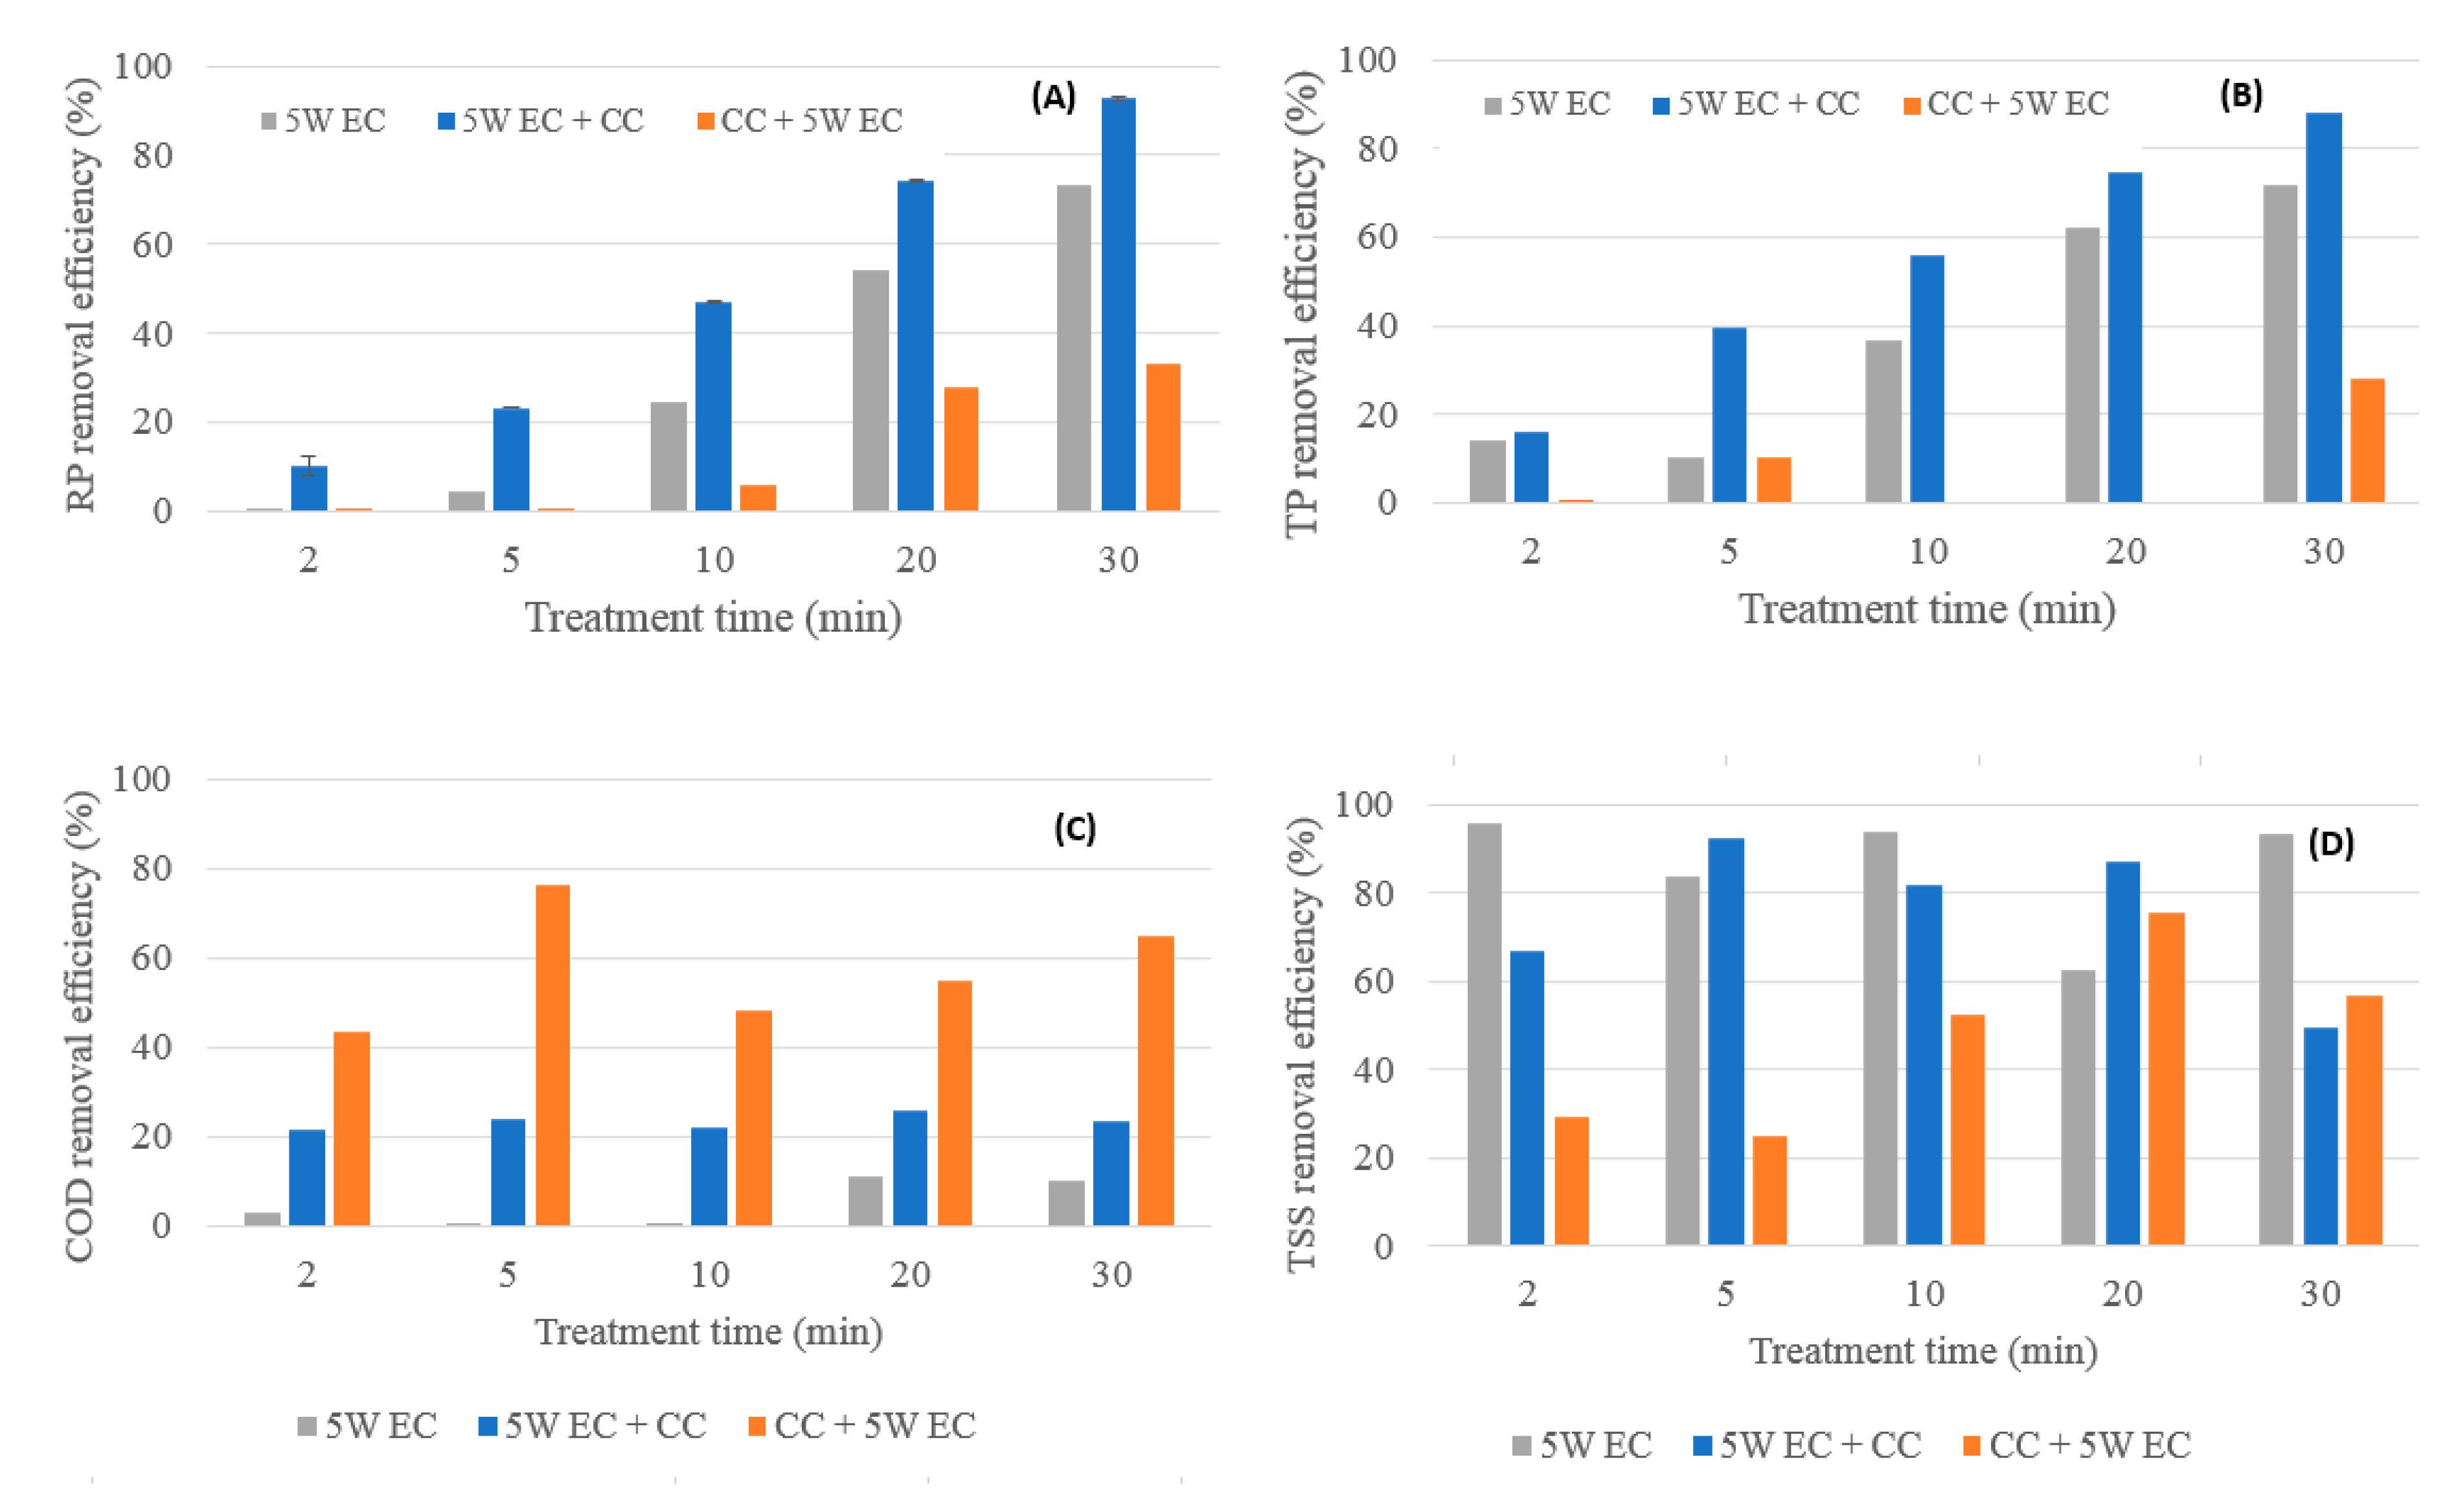
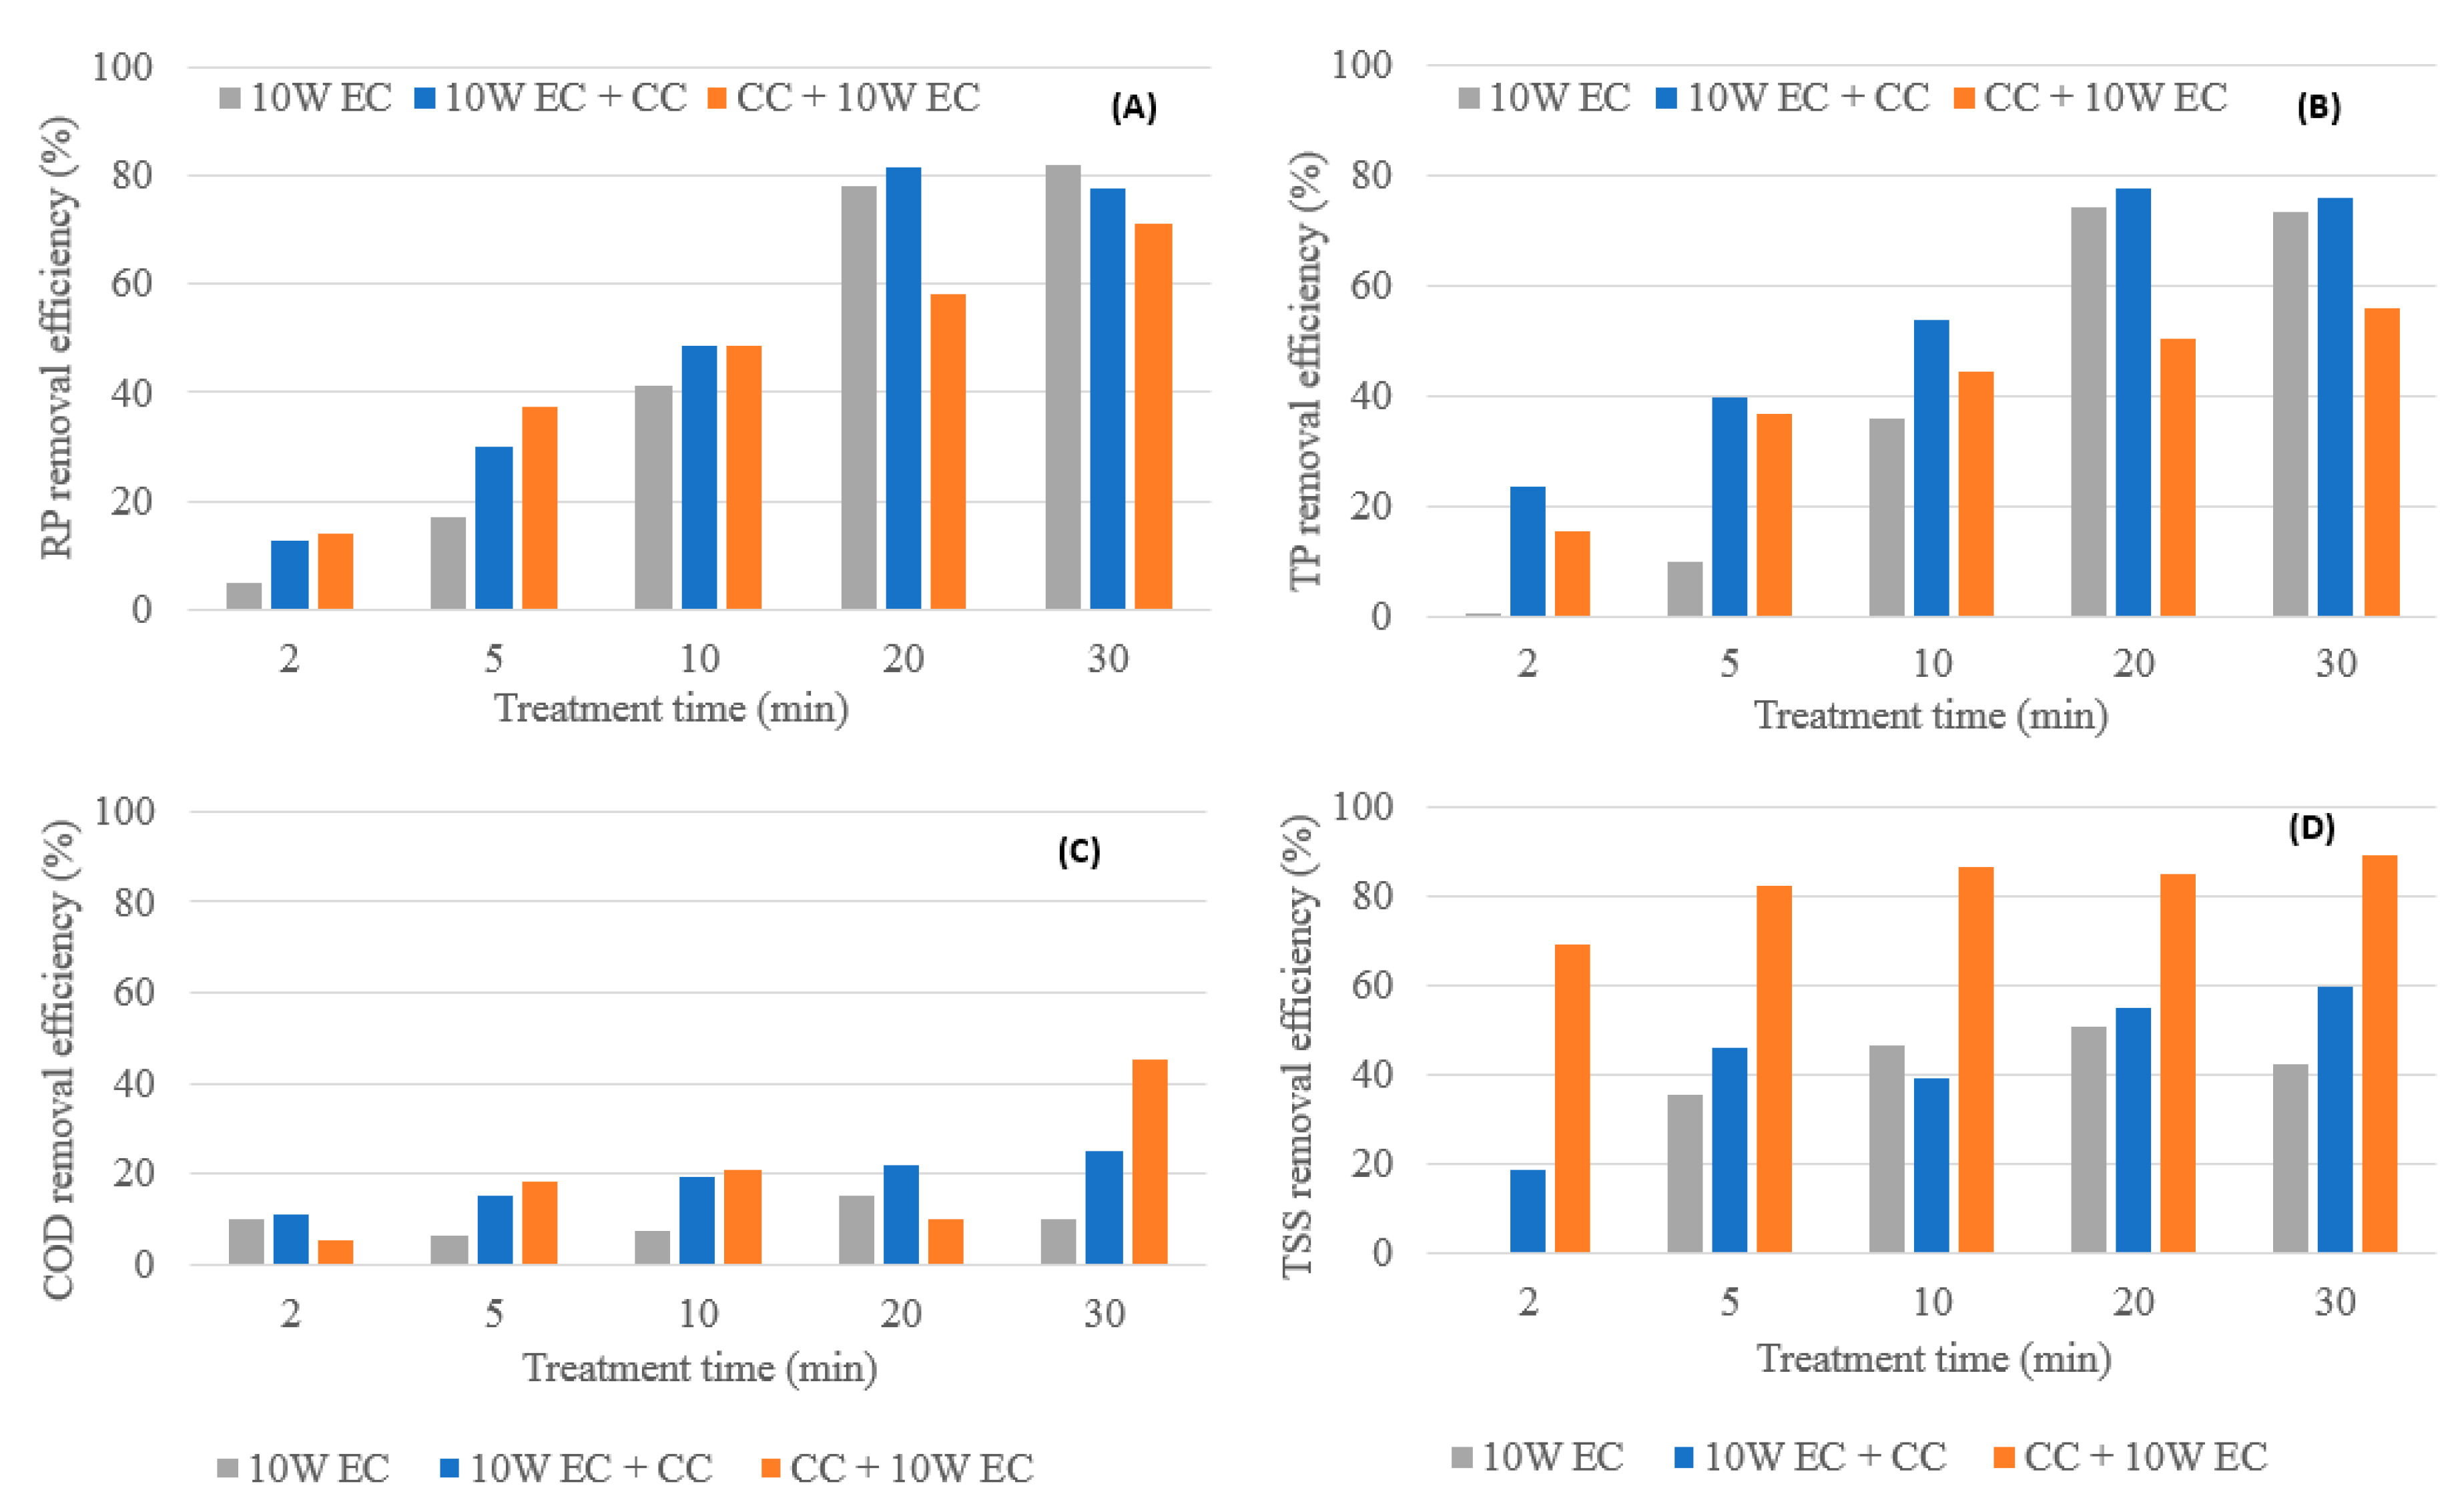
Similar to the experiments with increasing applied power, the removal performance does not necessarily increase with higher treatment times. Figure 4 shows that at the longest treatment time of 30 min, the removal performance diminished for TP, COD and TSS, with RP slightly increasing. As explained in a previous study, there are already sufficient readily available flocs in the EC reactor for the removal of pollutants at higher treatment times [6]. Thus, the optimum treatment time should be investigated in order to improve nutrient removal performance and reduce operating costs. Figure 5 and Figure 6 provide relevant experimental data to facilitate a comparison between the removal performances of EC, EC-CC, and CC-EC as a function of treatment time for 5 W and 10 W, respectively. It is clearly seen that the intensity of power plays a significant role in the removal efficiencies. Figure 5 demonstrates that the optimal treatment time of 20 min at 5 W applied power resulted in the RP, TP, COD and TSS removal efficiencies of 78%, 74%, 15%, and 51%, respectively. It is clear in all four curves that there is no significant improvement in performance with CC when the EC duration exceeds 20 min.
EC-CC resulted in the best overall RP removal efficiency as shown in Figure 5A and Figure 6A. For the optimal treatment time of 20 min, the maximum RP removal at 5 W was 74% (EC-CC) and at 10 W was 82% (EC-CC). Overall, EC-CC achieved the best TP removal efficiency, shown in Figure 5B and Figure 6B. For the optimal treatment time of 20 min, the maximum TP removal at 5 W was 78% (EC) and at 10 W 78% (EC-CC).
The maximum overall COD removal performance at 5 W resulted from the CC-EC and at 10 W from the EC-CC (Figure 5C and Figure 6C). For the optimal treatment time of 20 min, the maximum COD removal at 5 W was 55% (CC-EC) and at 10 W 22% (EC-CC). In the CC-EC experiments, the COD removal performance was significantly improved in comparison to the previous experiments regarding EC and EC-CC. A possible reason is because new brewery effluent was obtained for these experiments that had significantly more particulates in suspension. Thus, the enhanced COD removal performance in comparison to previous experiments can be rationalized by the reduced soluble COD fraction in the brewery wastewater from 73% to 37%. As the portion of particulate COD was increased, correspondingly, the COD removal performance was increased under the assumption of non-limiting coagulant conditions [7].
The maximum overall TSS (supernatant) removal at 5 W occurred during the EC experiments and at 10 W during the CC-EC experiments (Figure 5D and Figure 6D). For the optimal treatment time of 20 min, the maximum TSS removal at 5 W and 10 W was 87% (EC-CC), and 85% (CC-EC), respectively. The improved TSS removal performance in the CC and post-EC experiments can be attributed to the increased turbidity of the wastewater. Similar to the COD removal performance by CC-EC, this removal performance should be interpreted as the ability of combined EC-CC to treat wastewater rather than a comparison between the EC-CC and the CC-EC TSS removal efficiencies.
Overall, in terms of treatment performance and consistency, EC-CC was determined as the best treatment method for brewery wastewater. For the optimal operating parameters of 20 min at 5 W, EC-CC achieved COD, RP, TP and TSS removal efficiencies of 26%, 74%, 76%, and 85%, respectively.
3.4. Economic Evaluation
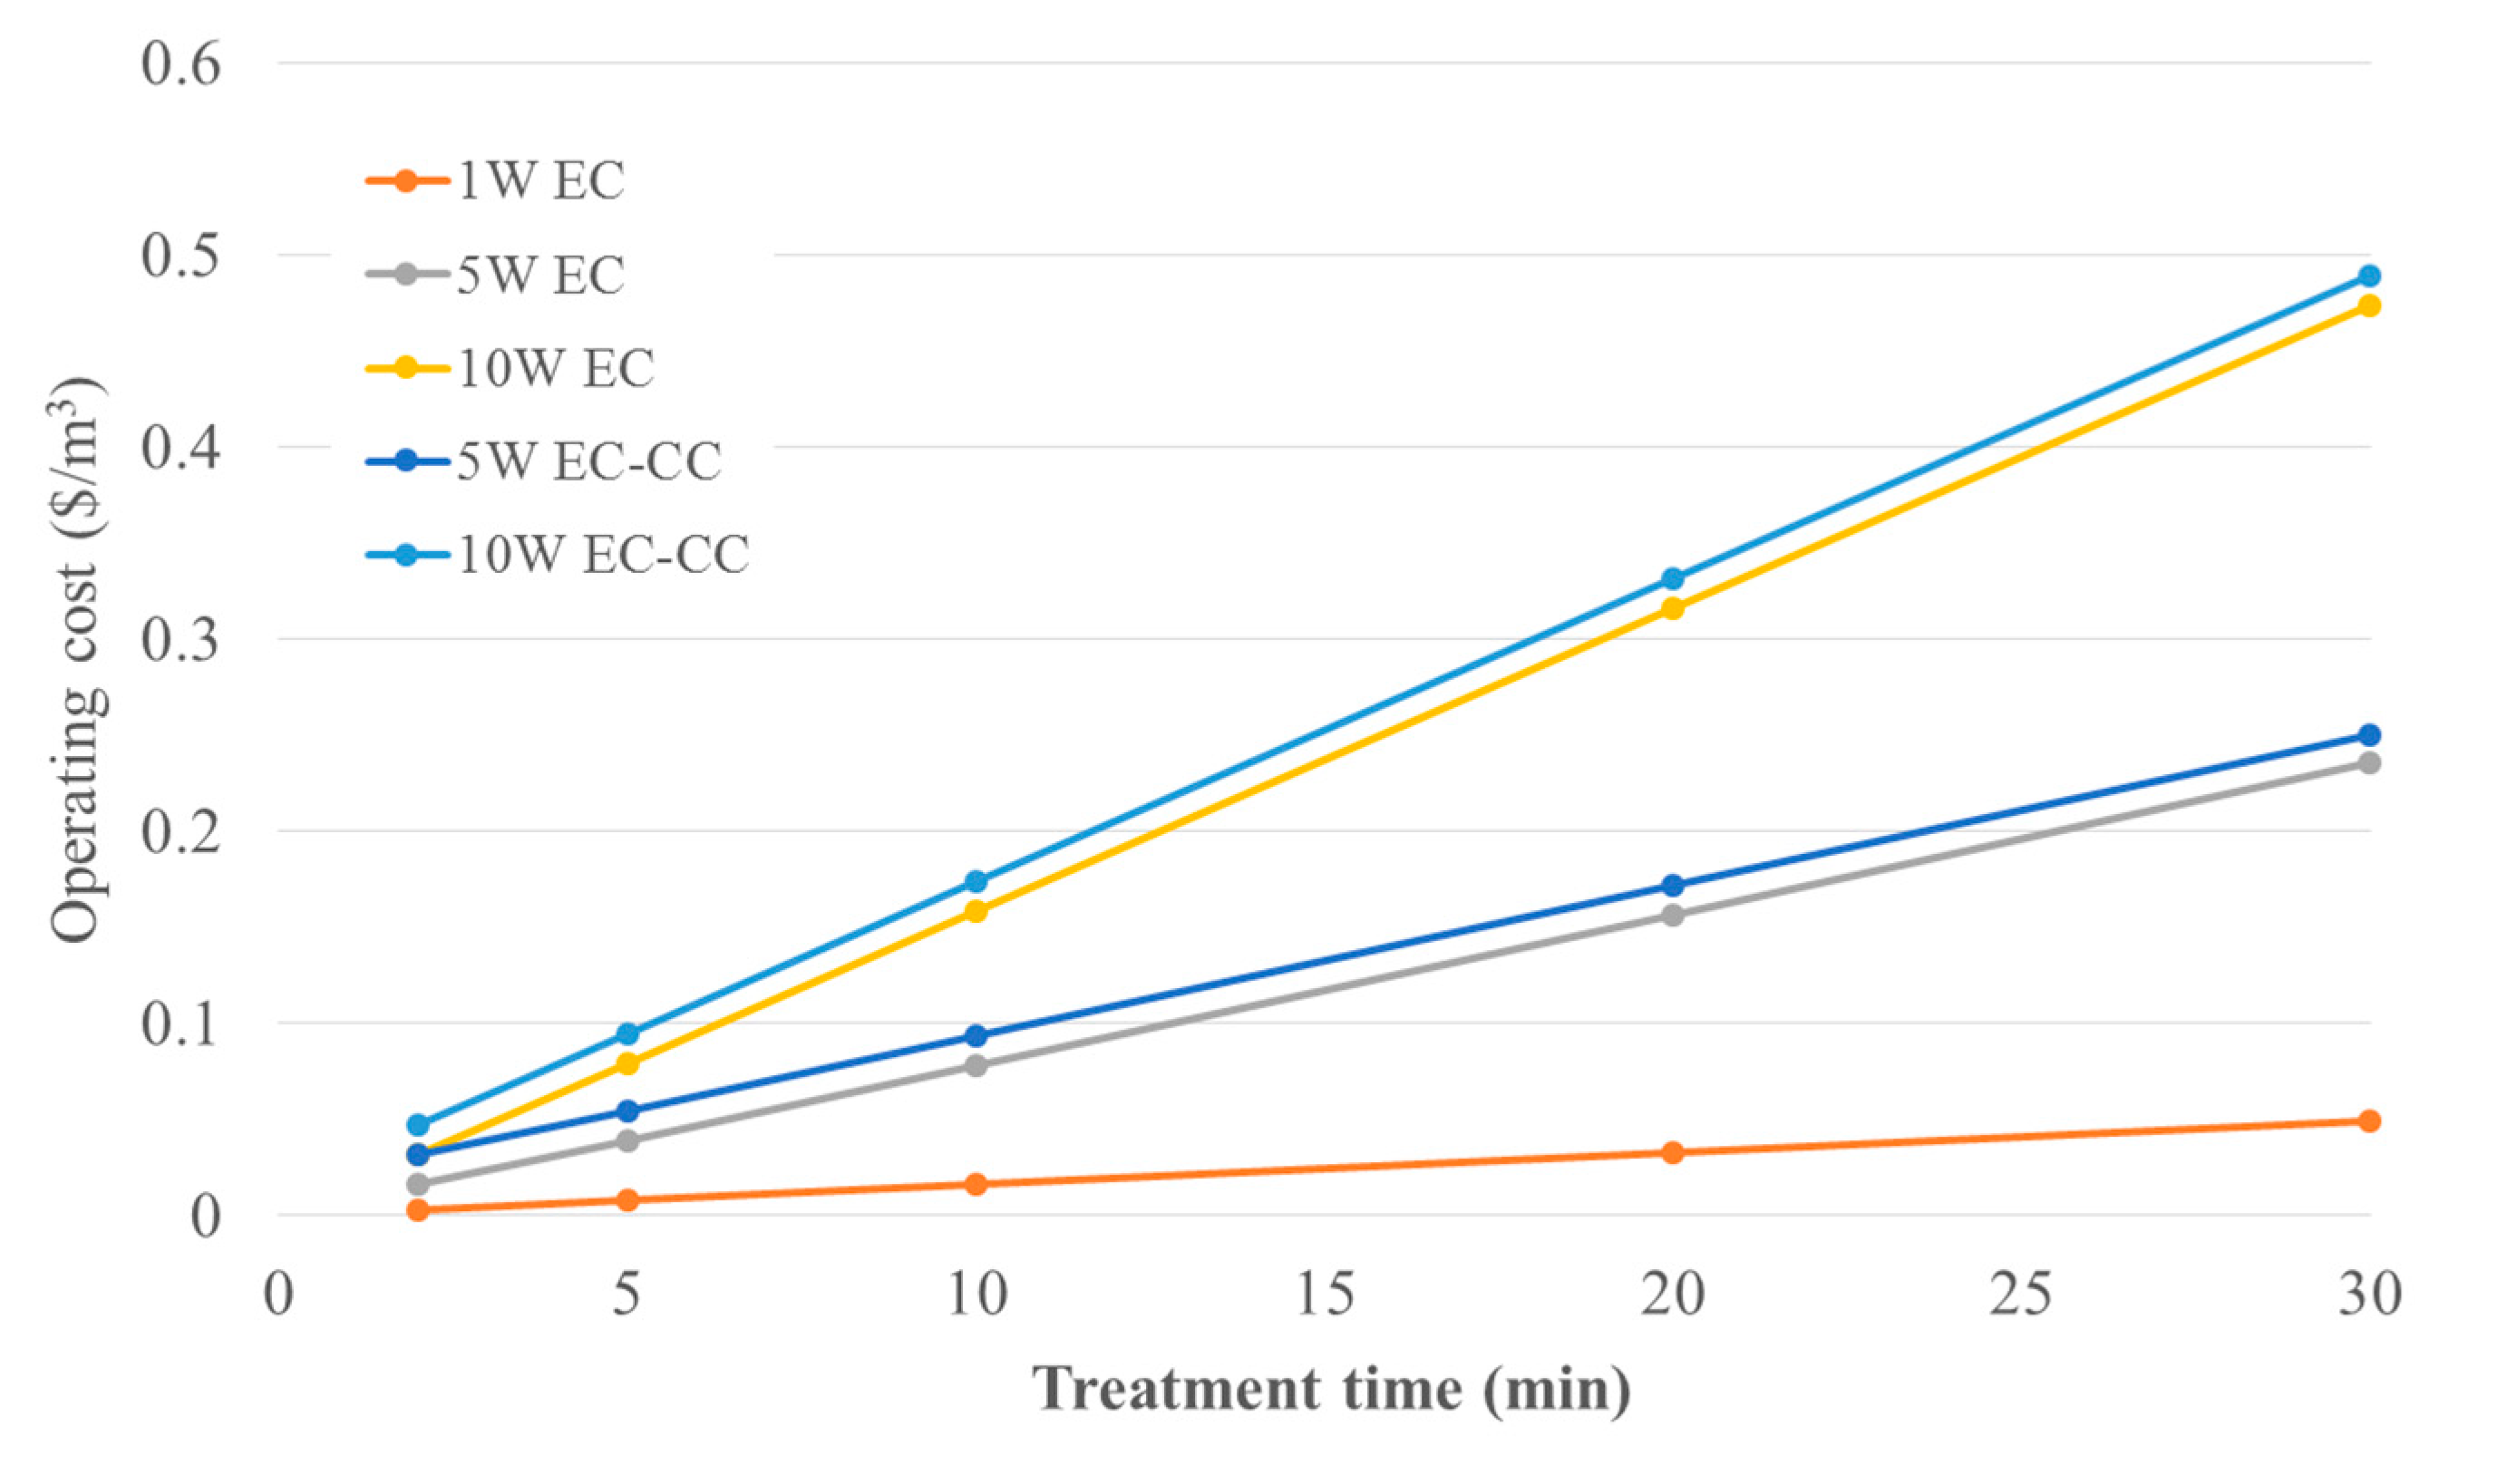
To calculate the operating costs of treatment, Equation (3) was applied. The cost of aluminum sulfate was estimated at $0.53 per kg and for the consumed Al electrodes at $2.25 per kg [16]. The cost of electricity obtained from the Ontario Energy Board [24] for Guelph, Ontario was estimated at $0.094 per kWh, which assumes a mid-peak time-of-use price period. The dry sludge disposal cost was ignored due to the experiments being conducted at laboratory-scale [25]. The electrode and energy consumption were calculated using Equations (1) and (2). A comparison of operating costs for EC and EC-CC at 1 W, 5 W and 10 W, as a function of treatment time, is shown in Figure 7.
Figure 7 demonstrates that the operating cost for EC and EC-CC are relatively similar. As such, due to the enhanced performance of EC-CC for contaminant removal, treatment of brewery wastewater by EC-CC is preferred. Moreover, over-strength discharge fees (ODFs) were used to evaluate the economic benefits of the EC process. The ODFs were estimated based on the City of Hamilton sewer bylaw limits for the disposal of untreated effluent for surchargeable parameters; BOD, TP, and TSS, whereas a COD/BOD ratio of 1.78 was applied in this investigation [26]. The projected ODFs were calculated according to the ODF Type 1 formula using the sewer bylaw concentration limits and surcharge rates for the sanitary sewer in the City of Hamilton [5]. The peak daily volume of wastewater produced at Wellington Brewery was used to approximate the daily ODFs imposed on Wellington Brewery (93 m3). To estimate the cost of electricity, the mid-peak time-of-use price period for Guelph was used for a 30-min treatment time [24].
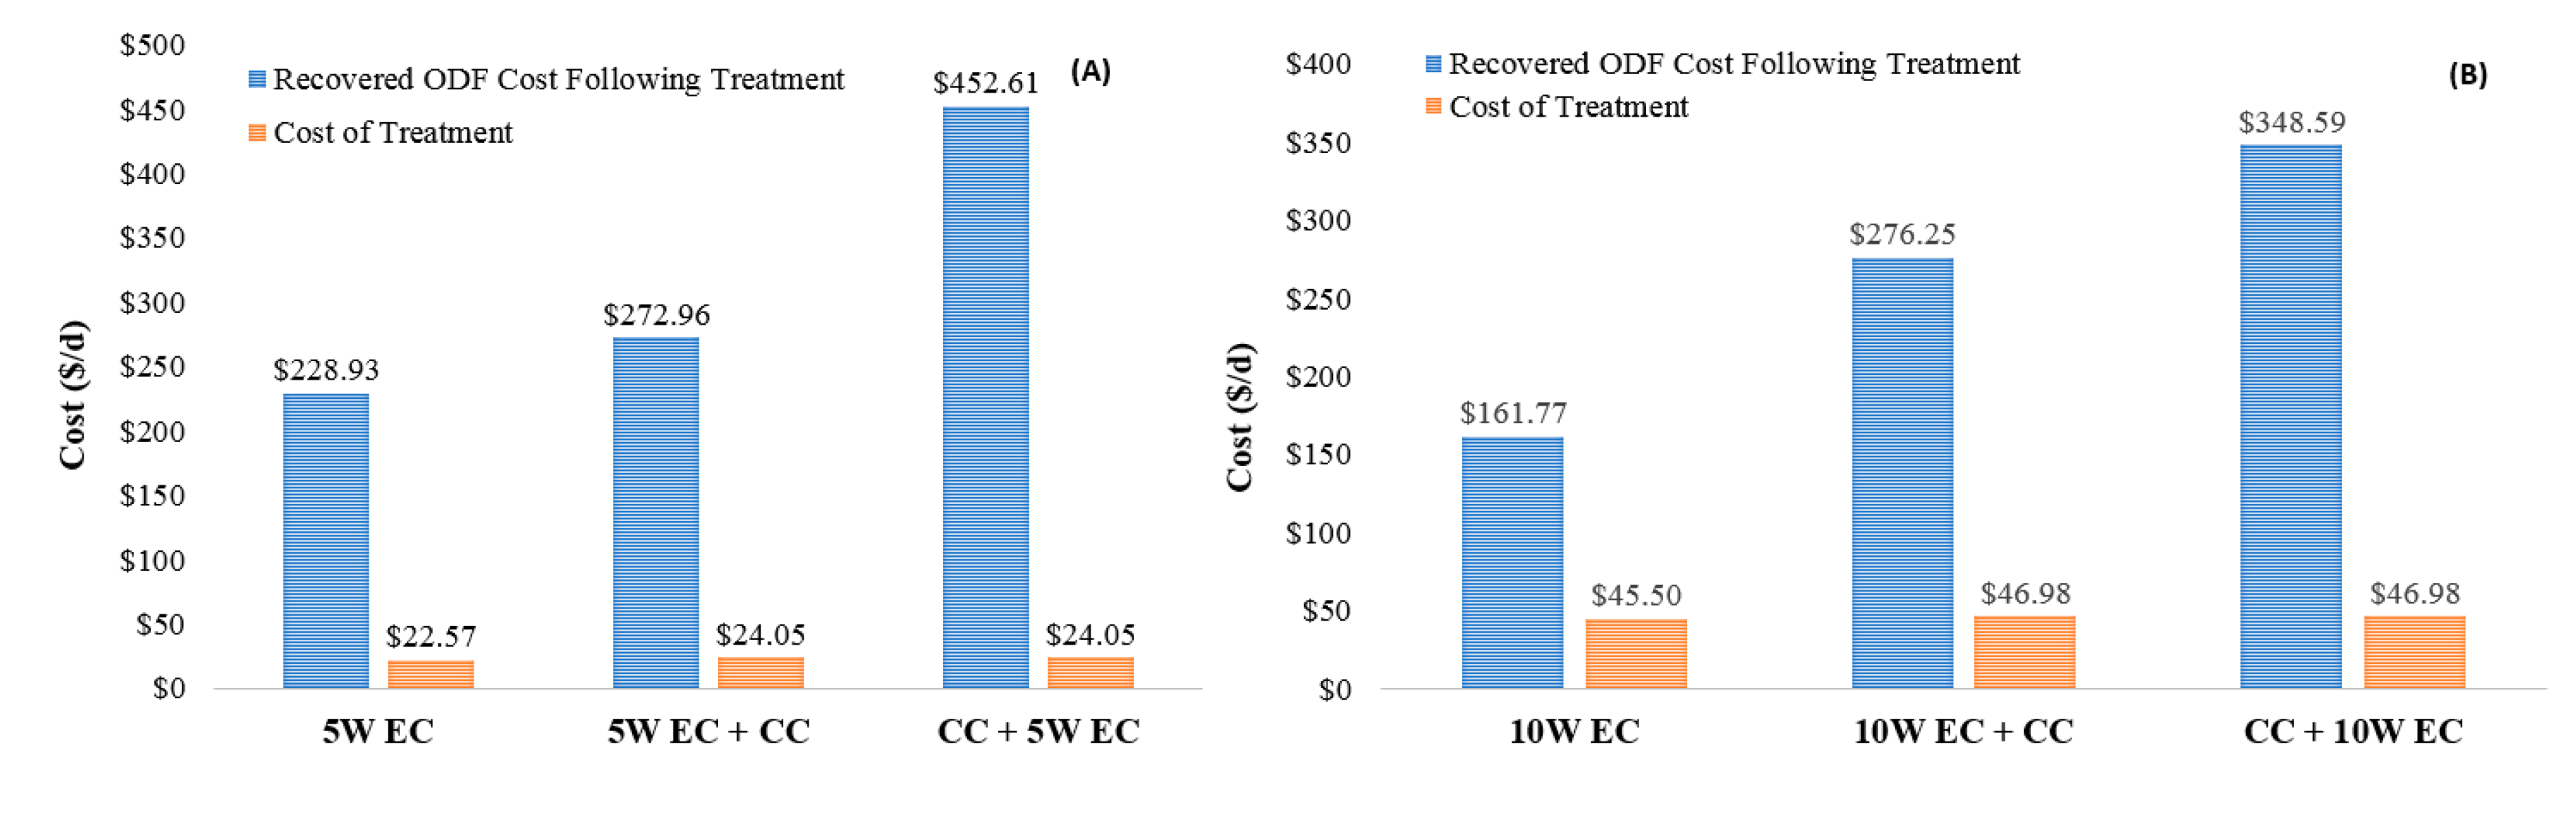
A comparison between recovered ODF costs following treatment and the cost of treatment at 5 W and 10 W is shown in Figure 8. The figure demonstrates that EC and combined EC-CC can significantly recover costs that would otherwise be imposed on breweries with high-strength effluent through ODFs. However, it is clearly seen that EC-CC exhibits higher recovered ODF costs compared to EC. In comparison to the estimated recovered costs, the operating costs of treatment are also presented. Figure 8 also shows that the EC and combined EC-CC treatment can be economically feasible for brewery wastewater applications from an energy consumption perspective due to the efficiency of nutrient removal and the reduction of sewer discharge costs.
Furthermore, Figure 8 shows that CC-EC exhibits higher recovered cost than EC-CC at both 5 and 10 W power supply. Interestingly, the calculation revealed that the recovered ODF cost for CC-EC at 5 W-EC ($452.61/d) is 23% more than the recovered cost for CC-EC at 10 W-EC ($348.59/d). This is attributed to the effectiveness of the CC-EC process to remove phosphorous from brewery wastewater at a lower power supply.
4. Conclusions
The comparison between electrocoagulation and combined chemical- and electro-coagulation used for the treatment of high-strength brewery wastewater demonstrate the advantages of these treatment applications in terms of cost and effectiveness. The results of this study suggest that both EC and combined EC-CC show high nutrient removal efficiencies. The results showed that EC and combined EC-CC can significantly remove phosphorous compounds, suspended solids, and organics as well as recover costs that would otherwise be imposed on breweries with high-strength effluent through ODFs. Moreover, EC-CC resulted in the best phosphorous removal efficiency as well as higher recovered ODF costs as compared with EC or CC-EC. Further investigation should be conducted to optimize other operating parameters such as solution electrolytic concentration and electrode spacing.
Author Contributions
Conceptualization, K.S. and B.A.; methodology, B.A.; validation, K.S. and B.A.; formal analysis, K.S.; investigation, K.S. and B.A.; writing—original draft preparation, K.S.; writing—review and editing, B.A. and C.K.; supervision, B.A. and C.K.; project administration, B.A.; funding acquisition, C.K. and B.A. All authors have read and agree to the published version of the manuscript.
Funding
This research was funded by the Ontario Ministry of Agriculture, Food and Rural Affairs (OMAFRA) within the project: Development of cost effective technology to treat and reuse microbrewery wastewaters. (Ref. UofG2015-2428).
Conflicts of Interest
The authors declare no conflict of interest.
References
- Brito, A.G.; Peixoto, J.; Oliveria, J.M.; Oliveria, J.A.; Costa, C.; Nogueira, R.; Rodrigues, A. Brewery and winery wastewater treatment: Some focal points of design and operation. In Utilization of By-Products and Treatment of Waste in the Food Industry; Springer: New York, NY, USA, 2006; pp. 109–131. [Google Scholar] [CrossRef]
- Di Biase, A.; Devlin, T.R.; Kowalski, M.S.; Oleszkiewicz, J.A. Performance and design considerations for an anaerobic moving bed biofilm reactor treating brewery wastewater: Impact of surface area loading rate and temperature. J. Environ. Manag. 2018, 216, 392–398. [Google Scholar] [CrossRef]
- Beer Canada. National Overview. Available online: http://industry.beercanada.com/national-overview (accessed on 12 October 2018).
- Simate, G.; Cluett, J.; Iyuke, S.; Musapatika, E.; Ndlovu, S.; Walubita, L.; Alvarez, A. The treatment of brewery wastewater for reuse: State of the art. Desalination 2011, 273, 235–247. [Google Scholar] [CrossRef]
- Stantec Ltd. Over Strength Surcharge Review for Toronto Water, City of Toronto (Tech.). 2012. Available online: https://www.toronto.ca/legdocs/mmis/2012/pw/bgrd/backgroundfile-50669.pdf (accessed on 12 October 2018).
- Eyvaz, M. Treatment of Brewery Wastewater with Electrocoagulation: Improving the process performance by using alternating pulse current. Int. J. Electrochem. Sci. 2016, 11, 4988–5008. [Google Scholar] [CrossRef]
- Tejedor-Sanz, S.; Ortiz, J.M.; Esteve-Núñez, A. Merging microbial electrochemical systems with electrocoagulation pretreatment for achieving a complete treatment of brewery wastewater. Chem. Eng. J. 2017, 330, 1068–1074. [Google Scholar] [CrossRef]
- Hakizimana, J.N.; Gourich, B.; Chafi, M.; Stiriba, Y.; Vial, C.; Drogui, P.; Naja, J. Electrocoagulation process in water treatment: A review of electrocoagulation modeling approaches. Desalination 2017, 404, 1–21. [Google Scholar] [CrossRef]
- Chen, G.; Chen, X.; Yue, P.L. Electrocoagulation and electrofloatation of restaurant wastewater. J. Environ. Eng. 2000, 126, 858–863. [Google Scholar] [CrossRef]
- Brahmi, K.; Bouguerra, W.; Hamrouni, B.; Elaloui, E.; Loungou, M.; Tlili, Z. Investigation of electrocoagulation reactor design parameters effect on the removal of cadmium from synthetic and phosphate industrial wastewater. Arab. J. Chem. 2015, 12, 1848–1859. [Google Scholar] [CrossRef]
- Harif, T.; Khai, M.; Adin, A. Electrocoagulation versus chemical coagulation: Coagulation/flocculation mechanisms and resulting floc characteristics. Water Resour. 2012, 46, 3177–3188. [Google Scholar] [CrossRef]
- Shamaei, L.; Khorshidi, B.; Perdicakis, B.; Sadrzadeh, M. Treatment of oil sands produced water using combined electrocoagulation and chemical coagulation techniques. Sci. Total Environ. 2018, 645, 560–572. [Google Scholar] [CrossRef]
- Elazzouzi, M.; El Kasmi, A.; Haboubi, K.; Elyoubi, M.S. A novel electrocoagulation process using insulated edges of Al electrodes for enhancement of urban wastewater treatment: Techno-economic study. Process Saf. Environ. Prot. 2018, 116, 506–515. [Google Scholar] [CrossRef]
- Can, O.T.; Kobya, M.; Demirbas, E.; Bayramoglu, M. Treatment of the textile wastewater by combined electrocoagulation. Chemosphere 2006, 62, 181–187. [Google Scholar] [CrossRef] [PubMed]
- Attour, A.; Touati, M.; Tlili, M.; Amor, M.B.; Lapicque, F.; Leclerc, J.-P. Influence of operating parameters on phosphate removal from water by electrocoagulation using aluminum electrodes. Sep. Purif. Technol. 2014, 123, 124–129. [Google Scholar] [CrossRef]
- Akbal, F.; Camci, S. Comparison of electrocoagulation and chemical coagulation for heavy metal removal. Chem. Eng. Technol. 2010, 33, 1655–1664. [Google Scholar] [CrossRef]
- Liu, H.; Zhao, X.; Qu, J. Electrocoagulation in Water Treatment. In Electrochemistry for the Environment; Comninellis, C., Chen, G., Eds.; Springer: New York, NY, USA, 2010. [Google Scholar] [CrossRef]
- El-Ashtoukhy, E.-S.Z.; El-Taweel, Y.A.; Abdelwahab, O.; Nassef, E.M. Treatment of petrochemical wastewater containing phenolic compounds by electrocoagulation using a fixed bed electrochemical reactor. Int. J. Electrochem. Sci. 2013, 8, 1534–1550. Available online: http://www.electrochemsci.org/papers/vol8/80101534.pdf (accessed on 12 October 2018).
- Dizge, N.; Akarsu, C.; Ozay, Y.; Gulsen, H.E.; Adiguzel, S.K.; Mazmanci, M.A. Sono-assisted electrocoagulation and cross-flow membrane processes for brewery wastewater treatment. J. Water Process Eng. 2018, 21, 52–60. [Google Scholar] [CrossRef]
- Franco, D.; Lee, J.; Arbelaez, S.; Cohen, N.; Kim, J.-Y. Removal of phosphate from surface and wastewater via electrocoagulation. Ecol. Eng. 2017, 108, 589–596. [Google Scholar] [CrossRef]
- Sahu, O.; Mazumdar, B.; Chaudhari, P.K. Treatment of wastewater by electrocoagulation: A review. Environ. Sci. Pollut. Res. 2014, 21, 2397–2413. [Google Scholar] [CrossRef]
- Shalaby, A.; Nassef, E.; Mubark, A.; Hussein, M. Phosphate removal from wastewater by electrocoagulation using aluminum electrodes. Am. J. Environ. Eng. Sci. 2014, 1, 90–98. Available online: http://www.openscienceonline.com/journal/ajees (accessed on 12 October 2018).
- Ni’am, M.-F.; Othman, F.; Sohaili, J.; Fauzia, Z. Electrocoagulation technique in enhancing COD and suspended solids removal to improve wastewater quality. Water Sci. Technol. 2007, 56, 47–53. [Google Scholar] [CrossRef] [Green Version]
- Ontario Energy Board. Time-of-Use Rates for Electricity, November 2018. Available online: https://www.guelphhydro.com/en/rates-and-service-charges/time-of-use-rates-for-electricity.aspx (accessed on 9 February 2019).
- Murthy, Z.V.P.; Nancy, C.; Kant, A. Separation of pollutants from restaurant wastewater by electrocoagulation. Sep. Sci. Technol. 2007, 42, 819–833. [Google Scholar] [CrossRef]
- Choi, H.-J. Parametric study of brewery wastewater effluent treatment using Chlorella vulgaris microalgae. Environ. Eng. Res. 2016, 21, 401–408. [Google Scholar] [CrossRef] [Green Version]
Figure 1.
Batch electro-coagulation experimental setup.

Figure 2.
Effect of initial pH on removal efficiency (5 W and 20-min treatment time).

Figure 3.
Effect of applied power on electrocoagulation (EC) performance. (A) Reactive phosphorous (RP) concentration vs. treatment time, (B) Total phosphorous (TP) concentration vs. treatment time, (C) Chemical oxygen demand (COD) concentration vs. treatment time, (D) Total suspended solid (TSS) concentration vs. treatment time, (E) removal efficiencies vs. applied power at 20-min treatment time, (F) pH of solution vs. treatment time.

Figure 4.
Effect of treatment time on RP, TP, COD and TSS removal (EC: 10 W).

Figure 5.
Comparison of removal performance of ECT, ECT and post CCT and CCT and post ECT (5 W); (A) RP removal performance, (B) TP removal performance, (C) COD removal performance, (D) TSS removal performance (supernatant).
Figure 5.
Comparison of removal performance of ECT, ECT and post CCT and CCT and post ECT (5 W); (A) RP removal performance, (B) TP removal performance, (C) COD removal performance, (D) TSS removal performance (supernatant).

Figure 6.
Comparison of removal performance of EC, EC-CC and CC-EC (10 W); (A) RP removal performance, (B) TP removal performance, (C) COD removal performance, (D) TSS removal performance (supernatant).
Figure 6.
Comparison of removal performance of EC, EC-CC and CC-EC (10 W); (A) RP removal performance, (B) TP removal performance, (C) COD removal performance, (D) TSS removal performance (supernatant).

Figure 7.
Comparison of operating costs for EC and EC-CC at 1 W, 5 W, and 10 W as a function of treatment time.
Figure 7.
Comparison of operating costs for EC and EC-CC at 1 W, 5 W, and 10 W as a function of treatment time.

Figure 8.
Comparison of recovered ODF cost following treatment and cost of treatment (30-min treatment time). (A) At 5 W applied power. (B) At 10 W applied power.
Figure 8.
Comparison of recovered ODF cost following treatment and cost of treatment (30-min treatment time). (A) At 5 W applied power. (B) At 10 W applied power.

© 2020 by the authors. Licensee MDPI, Basel, Switzerland. This article is an open access article distributed under the terms and conditions of the Creative Commons Attribution (CC BY) license (http://creativecommons.org/licenses/by/4.0/).
Share and Cite
MDPI and ACS Style
Swain, K.; Abbassi, B.; Kinsley, C. Combined Electrocoagulation and Chemical Coagulation in Treating Brewery Wastewater. Water 2020, 12, 726. https://doi.org/10.3390/w12030726
AMA Style
Swain K, Abbassi B, Kinsley C. Combined Electrocoagulation and Chemical Coagulation in Treating Brewery Wastewater. Water. 2020; 12(3):726. https://doi.org/10.3390/w12030726
Chicago/Turabian StyleSwain, Kimberly, Bassim Abbassi, and Chris Kinsley. 2020. "Combined Electrocoagulation and Chemical Coagulation in Treating Brewery Wastewater" Water 12, no. 3: 726. https://doi.org/10.3390/w12030726
Note that from the first issue of 2016, this journal uses article numbers instead of page numbers. See further details here.