Article

Low Trihalomethane Formation during Managed Aquifer Recharge with Chlorinated Desalinated Water

1
The Zuckerberg Institute for Water Research, The Jacob Blaustein Institutes for Desert Research, Ben-Gurion University of the Negev, Sde Boker Campus 8499000, Israel
2
Institute of Soil, Water and Environmental Sciences, Agricultural Research Organization, The Volcani Center, Rishon LeZion 7505101, Israel
3
Mekorot, Water Company Ltd., Tel Aviv 6713402, Israel
4
Institute of Applied Geosciences, Technische Universität Darmstadt, 64287 Darmstadt, Germany
5
Institute IWAR, Technische Universität Darmstadt, 64287 Darmstadt, Germany
*
Author to whom correspondence should be addressed.
Water 2020, 12(3), 711; https://doi.org/10.3390/w12030711
Submission received: 25 January 2020 / Revised: 18 February 2020 / Accepted: 28 February 2020 / Published: 5 March 2020

Abstract

:
Trihalomethanes (THMs) are toxic disinfection by-products, formed in the reaction of chlorine with organic matter. This work aimed to study THM formation during a unique case study of managed aquifer recharge (MAR) with chlorinated desalinated seawater. THM formation was tested in the field, along a 3.0 m deep vadose zone gallery. Two small-scale experiments were conducted in the site, with untreated and with bromide spiked desalinated seawater. These were accompanied by a large-scale, ~1-month long operational MAR event. In the small-scale experiments, THM concentrations were shown to increase with bromide concentrations, with increasing dominance of the brominated species. Nevertheless, concentrations remained within the single µg/L range, which is an order of magnitude lower than drinking water regulations. Such low THM concentrations were also determined in the large-scale event. In both cases, THM formation occurred in the ponding water, without significant formation or degradation in the upper 3.0 m of the vadose zone. This study shows that MAR with chlorinated (<0.5 mg/L) desalinated seawater through sandy infiltration basins does not pose a threat to drinking water quality at this site.

1. Introduction

Desalinated seawater (DSW) is an increasing source for domestic water, especially in Mediterranean and Middle East countries. It is expected to take an increasing role in other countries as well [1,2]. In Israel, this source amounted to a total of ~40% of the national potable water consumption in 2017 [3]. With the relatively high costs of this water source [2], motivation to reduce expenses is clear. This may be achieved by technological development, as well as by management flexibility, which enables the economical optimization of water production regardless of its consumption. This latter option demands considerable storage capacity. An attractive and available option is provided by managed aquifer recharge (MAR). MAR may be a preferred solution for the storage of temporal DSW surpluses, and was practiced mainly in countries of the Persian Gulf. It was shown to facilitate stable water distribution, overcoming operational disturbances and enabling the construction of desalination plants that are not designed for peak demand, but rather for annual demand [4]. The potential of this solution was demonstrated in Abu-Dhabi [5,6], in the Emirate of Sharjha [4,7] and in Kuwait [8]. Recently, it was also tested in Israel [9].
Desalinated seawater differs in its chemical characteristics from naturally infiltrating water (rain and stream water). One aspect is related to major elements as Ca2+ and Mg2+, which are not fully replenished in the desalination post-treatment [10]. It was shown that the aquifer may have the capacity to release these elements into the recharging water, following dissolution and ion exchange processes [11,12]. Another aspect is residual chlorine. Chlorination is the most common disinfection process in desalination plants, applied both as a pre- and a post-treatment [13,14]. As a pre-treatment, chlorine is intended to reduce membrane biofouling, while as a post-treatment, it is applied for disinfection of the distributed water. Chlorine can further react with naturally occurring organic matter, anthropogenic contaminants, bromide and iodide, forming toxic and carcinogenic products. In the process of water chlorination alone, more than 300 compounds were identified, while more than 50% of the formed organic halides have yet to be identified [15,16]. One of the most common groups of chlorination by-products, which are detected in relatively high concentrations, are trihalomethanes (THMs). THMs were investigated thoroughly since their discovery and their presence in drinking water has been a major concern due to their negative health effects [17]. Despite the large number of disinfection by-products, only 11 are currently regulated in the United States (THMs, haloacetic acids, bromate and chlorite), with regulations that dictate a maximal concentration limit of 80 μg/L for total THMs [18]. In Israel, public health regulations of drinking water refer to THMs only [19].
THM formation along water distribution systems was thoroughly investigated and focused mainly on natural water, whereas knowledge of THM formation during MAR is limited. Studies have shown that low chloroform concentrations (sub µg/L range) are highly abundant in US groundwater. This widespread distribution is mainly attributed to leaks in chlorinated water and wastewater systems [20,21], but natural sources of chloroform (as well as other THM species) are possible as well [20]. In Israel, MAR with chlorinated desalinated water occurs during unique operational periods, in which the desalinated water cannot be distributed through the national grid following maintenance operations. THM formation during such MAR events was questioned.
To the best of our knowledge, no research has been published on disinfection by products formation during MAR with chlorinated desalinated seawater. As mentioned above, the chemistry of desalinated water differs considerably from that of natural water; it is characterized by low electrical conductivity (EC), low bromide and low dissolved organic carbon (DOC). These parameters influence THM formation [22]. On the other hand, natural organic matter in the soil may react with the chlorinated water. Accordingly, the main objective of this research was to study trihalomethane formation in the unique case in which desalinated seawater bearing residual chlorine (0.2–0.5 mg/L) is recharged into sandy sediments. It was questioned whether THMs are formed in the ponding water or also along the soil profile, and whether the THM concentrations formed pose a threat to water quality.

2. Materials and Methods

2.1. Field Site

The recharge site is located about 4 km east of the Mediterranean shoreline and 28 m above mean sea level. The unsaturated zone underneath the site is composed mainly of sands, calcareous sandstone and clay lenses [23]. A more detailed description of the soil profile is published elsewhere [12]. The thickness of the unsaturated zone remained unchanged (26 m) during the experiment. The site is a part of the Menashe MAR plant, which diverts flood water for recharging the coastal aquifer through infiltration ponds. During unique operational periods in which DSW from the nearby Hadera desalination plant cannot be distributed through the national grid, surpluses of DSW are directed to the southern infiltration pond. Since the water is inevitably chlorinated in the water carrying system, residual chlorine is apparent. The unsaturated zone underneath the pond was monitored by analyzing water samples collected using silicon-carbide suction cups installed beneath the pond at depths of 0.5, 1.0, 2.0 and 3.0 m below ground surface [12]. A concrete ring of 1.3 m diameter and 1 m height was installed above the cups enabling the simulation of a small-scale infiltration event (this setup is referred to as the “vadose zone gallery” [12]). During small scale infiltration experiments and large MAR events, samples were extracted from the suction cups using a peristaltic pump (Masterflex E/S portable sampler) and collected to a glass syringe without forming headspace. The pump was operated at a low flow rate, keeping the pressure below an air breaking point of 0.8 bar. The water was transferred into 20 or 40 mL glass vials and capped with Teflon lined septa. The vials contained ammonium chloride (1 mg/mL) as a quenching agent and phosphate buffer for preservation (25 mg/mL), according to the EPA method 551.1 [24]. Samples for water isotopes measurements were collected in sealed 15 mL polyethylene tubes. All samples were stored on ice until reaching the laboratory, where they were refrigerated until being analyzed.

2.2. Field Experiment

Two small-scale infiltration tests were carried out in the field with chlorinated DSW from the Hadera desalination plant. In both experiments, only the concrete ring above the vadose zone gallery was artificially flooded. A constant hydraulic head of 0.5 m was maintained for the entire duration of the experiments (approx. 7 h). Water was sampled twice along the experiments—2 to 3 h and 5 to 6 h after the infiltration test began. While in the first experiment chlorinated desalinated water was allowed to infiltrate as is, in the second experiment bromide was added to the water to achieve a bromide concentration of ~2,000 µg/L (added from a lithium bromide stock solution). In order to maintain a relatively constant bromide concentration in the ring, the water was spiked every ~100 L of infiltration, which was continuously monitored by a gauge. Water samples were taken occasionally from the ring to monitor the actual bromide concentration.

2.3. Monitoring a Full-Scale MAR Event with Desalinated Seawater

A ~1-month long MAR event took place during January 2018, in which ~2.2 × 10⁶ m3 of DSW was infiltrated to the pond. This was most significantly attributed to a continuous discharge of water between the January 7th and January 25th. Sampling was done on three occasions during the flood, 8, 17 and 24 days after the continuous discharge began (on the 15th, 24th, and 31st of January). The pond water was sampled from different locations within the pond and different depths along the water profile. Additionally, pore-water was sampled from depths of 0.5, 1.0, 2.0 and 3.0 m below the pond surface using the installed suction cups. On-site monitoring was done for chlorine concentration, pH and EC. Lab analysis was done for THMs, DOC, bromide and water isotopes (δ2H and δ18O).

2.4. Field Analytical Methods

Chlorine concentrations in field samples were determined on site, using a C201 Free / Total Chlorine Colorimeter, Eutech Instruments (detection limit of 0.05 mg/L free chlorine for environmental samples). The pH and electrical conductivity of the water samples were measured on site using a portable multiparameter meter (WTW MultiLine 3420) with a SenTix 940-3 electrode for pH and a TetraCon 925 electrode for EC measurement.

2.5. Analytical Methods

THMs were analyzed by a quadrupole Gas chromatography–mass spectrometry (GC/MS) (TRACE 1300 ISQ LT, Thermo Scientific). Samples of 10 mL in 20 mL vials were agitated at 65 °C for 15 min. 800 μL of the headspace were injected by a gas tight syringe into the GC/MS by an autosampler (TriPlus RSH, Thermo Fisher scientific). The GC was equipped with a RESTEK Rxi-5Sil MS column (30 m × 0.25 mm × 0.25 μm) and operated under the following temperature program: 35 °C for 5 min, followed by a ramp of 20⁰ C/min to 65⁰ C, then a ramp of 15 °C /min to 100 °C, and finally 45 °C/min to 200 °C (hold for 3 min). Selected Ion Mode (SIM) was used for compound detection, as follows: at 2.8 min masses of 47, 83, 85 amu, at 3.9 min masses of 83, 85, 129 amu, at 5.8 min masses of 79, 127, 129 amu, and at 7.3 min masses 91, 173, 252 amu. A dwell time of 0.1 sec was defined for all masses. The detection limit was checked and set at 0.05 μg/L for all THM species.
Water isotopes—water samples from the field were collected in sealed polyethylene tubes and kept on ice until reaching the lab. Care was taken to avoid headspace and prevent evaporation. The samples were then filtered into 2 mL glass vials using a 0.22 μm MS PTFE syringe filter (13 mm). Isotope ratios of 2H/1H and 18O/16O were measured using a Cavity Ring-Down Spectroscopy water isotope analyzer (PICARRO L2130-i). The isotopic values were measured against lab standards, previously calibrated to the VSMOW2-SLAP2 scale, and the δ2H and δ18O units were used.
The DOC concentrations were analyzed using either a TOC multi N/C 2100s (Analytikjena) with a platinum catalyst multi NC, operated at 700 °C, or a TOC-L total organic carbon analyzer (Shimadzu), operated at 680 °C. When using the TOC-L Shimadzu, the samples were filtered (0.45 μm, Millex-HV Syringe Filter, PVDF, 33 mm) into 5 mL glass vials and acidified manually with 2 M HCl before analysis. When using the TOC Analytikjena instrument, the samples were filtered (0.45 μm) into 9 mL glass tubes and placed in a Shimadzu ASI-L Autosampler, where samples were automatically acidified with 21.25% H3PO4.
Bromide was analyzed by a Dionex ICS-5000 capillary HPLC system. The system uses a KOH eluent of 20 M (Dionex), an AERS 500 suppressor (4mm) set to 75 mA and an IonPac AS19 Column (4 × 250 mm) with a running time of 18 min. The detection limit for bromide was checked and set as 10 μg/L. The samples were filtered (0.22 μm, Millex-GV Syringe Filter, PVDF, 33 mm), and 5 mL were transferred to a 10 mL Dionex vial with a cap and multi injection septum and placed in a Dionex AS-AP Autosampler.

3. Results

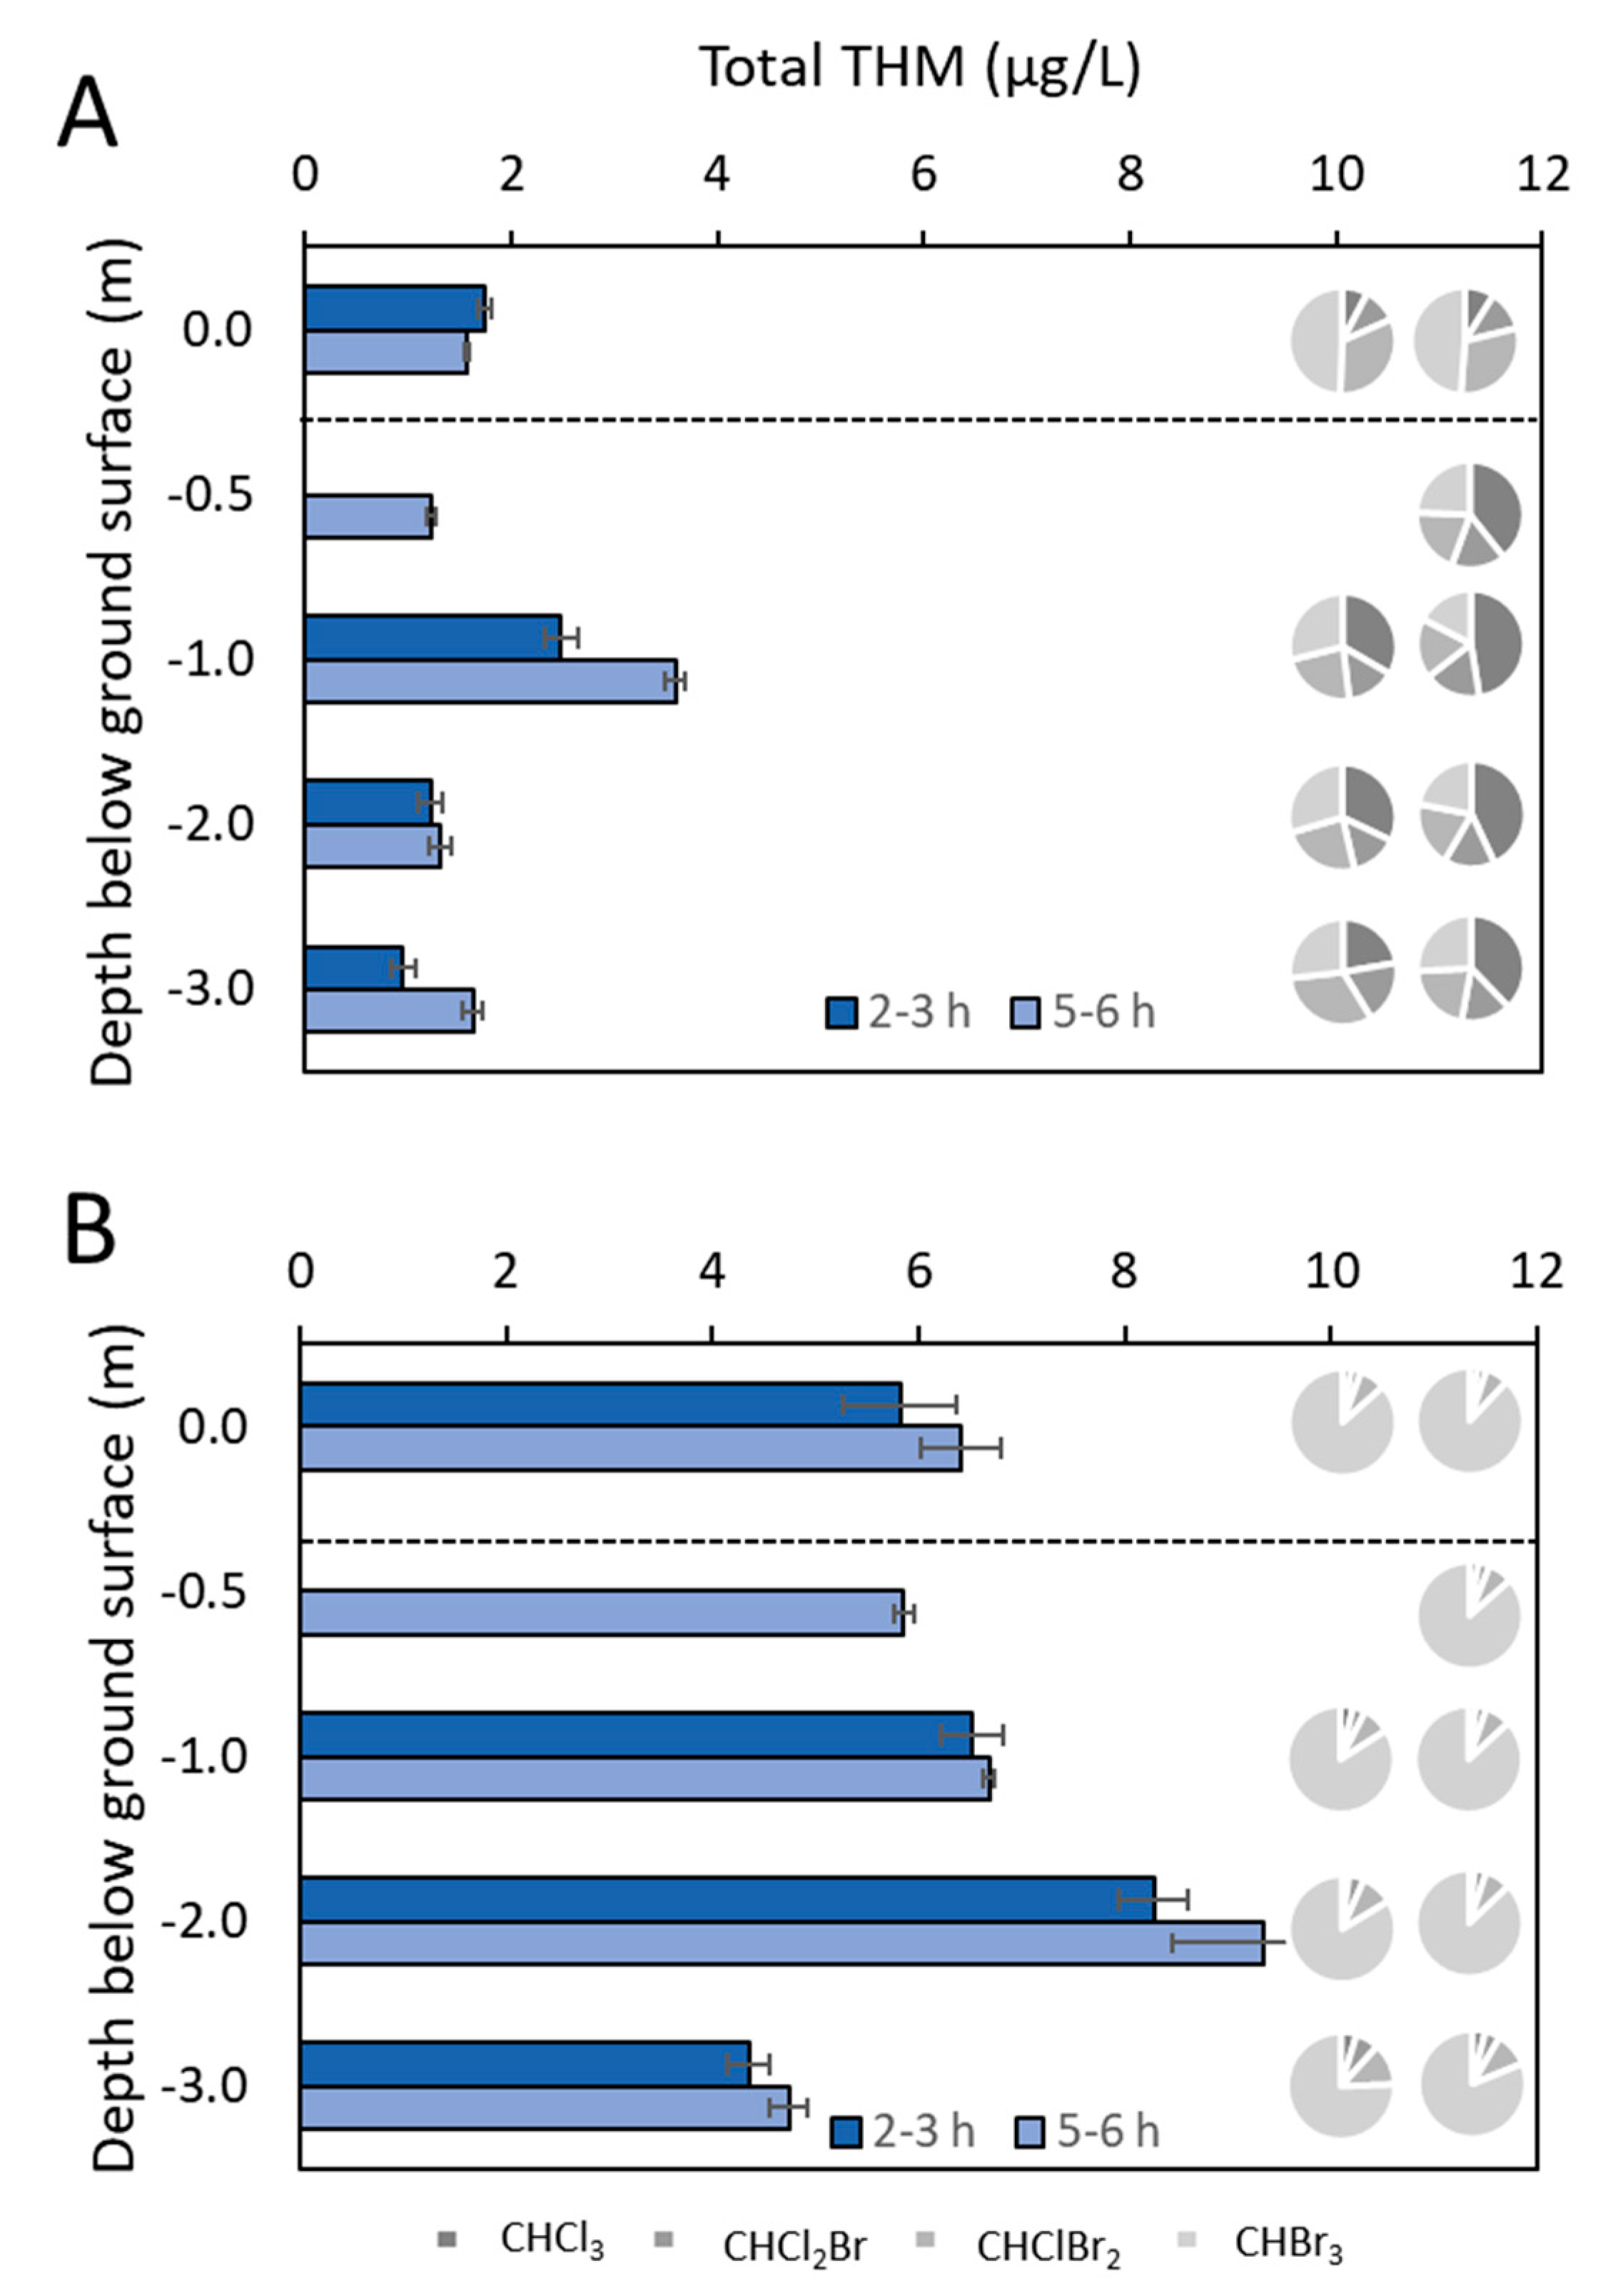
3.1. Influence of Bromide on THM Formation in a Small-Scale Infiltration Event

Two field experiments were conducted for determining the influence of bromide on THM formation during aquifer recharge. The first experiment was carried out with chlorinated DSW, and the second experiment (conducted three days later) mimicked the entry of a different water, similar to that of the Sea of Galilee, which is rich in bromide [25,26]. This later set a theoretical upper boundary for bromide concentrations for infiltrating water at the site. In both experiments, the water within the ring was maintained at a height of 0.5 m.

3.1.1. Infiltration of Chlorinated DSW—Results of a Small-Scale Experiment

During the first infiltration experiment, chlorine concentrations measured at the DSW pipe outflow varied between 0.3–0.4 mg/L. Bromide concentrations of 9–29 μg/L and DOC concentrations of 0.53–1.05 mg/L were measured in the water. In the vadose zone, only slight variations in bromide concentrations were observed. DOC concentrations slightly increased along the vadose zone, yet remained within the same magnitude as in the source (maximal value of 2.51 mg/L at a depth of 2 m; Table 1).
Water isotopes in the ponding water were similar to those of the DSW, with average δ18O = 1.49 ± 0.03‰ and δ2H = 11.47 ± 0.05‰. These values are typical for reverse osmosis desalinated seawater of Mediterranean origin [27]. Water isotopes did not significantly change along the soil profile, indicating that the water sampled along the vadose zone is indeed desalinated water and not residual water of other sources (Table 1).
The volume of infiltrated water was monitored along the experiment with a gauge, presenting an average infiltration flux of 21 m/d (total infiltration volume of 6.5 m3 during 5.5 h). This flux is higher than the initial 1D infiltration flux (~10 m/d), due to the 3D flow that developed under the concrete ring in small-scale experiments [9]. A constant positive head of 0.5 m was maintained within the ring and the average retention time for water in the ring was ~30 min.
The total THMs in the DSW at the pipe outlet were 0.8–1.0 μg/L. Bromoform (0.5 μg/L) and dibromochloromethane (0.2 μg/L) were the dominant THM species, while chloroform was below the quantification limit (<0.05 µg/L). The concentrations after discharge to the ring only slightly increased above these background concentrations, with maximal total THM concentrations of 1.6–1.8 μg/L. Total THM concentrations also did not change dramatically along the vadose zone (1.0–3.6 μg/L at different depths and times; Figure 1). The increase in THM in the ponding water and vadose zone was mostly attributed to the formation of chloroform, presenting a maximal concentration of 1.7 μg/L at a depth of 1 m, 2–3 h after infiltration began (for the entire dataset see Supplementary Materials).
The relatively uniform THM concentrations from the ponding water down to the soil profile indicate that THMs are quickly formed in the ponding water (average residence time of ~30 min) and are not significantly formed or removed along the top 3.0 m of the vadose zone. This is also supported by on-site chlorine measurements, presenting free chlorine concentrations that are lower than the detection limit (≤0.05 mg/L) for vadose zone samples.

3.1.2. Infiltration of Bromide Spiked Chlorinated DSW—Results of a Small-Scale Experiment

In the second e experiment, chlorine concentrations measured at the pipe outflow varied between 0.2 to 0.4 mg/L during the experiment. Average bromide concentrations of 10–17 μg/L were measured in the DSW. These were artificially increased to 2045 ± 205 μg/L in the ponding water by continuous spiking. These high concentrations did not vary significantly when further transported along the soil profile (see Supplementary Materials).
Besides the significant bromide increase during the second experiment, other parameters remained similar (Table 1)—DOC concentrations at the pipe outlet were only slightly higher than in the first experiment (0.80–1.81 mg/L), with a subsequent slight increase along the soil profile (maximal value of 3.63 mg/L). The water isotopes were similar to the values observed in the first experiment (Table 2).
As a result of increased bromide concentrations, the THMs formed in the pond were significantly higher. In the DSW pipe outflow, the total of THMs was 0.8–1.0 μg/L, while in the Br-spiked ponding water, the total of THMs increased to a range of 5.2–6.8 μg/L. The relatively high THM concentrations were maintained along the soil profile with concentrations of 4.2–10.3 μg/L. The dominance of the brominated species also increased, most significantly with bromoform (Figure 1; for the entire dataset see Supplementary Materials). However, although significantly higher than determined in the first experiment, total THM concentrations were still at least an order of magnitude lower than regulations [28].

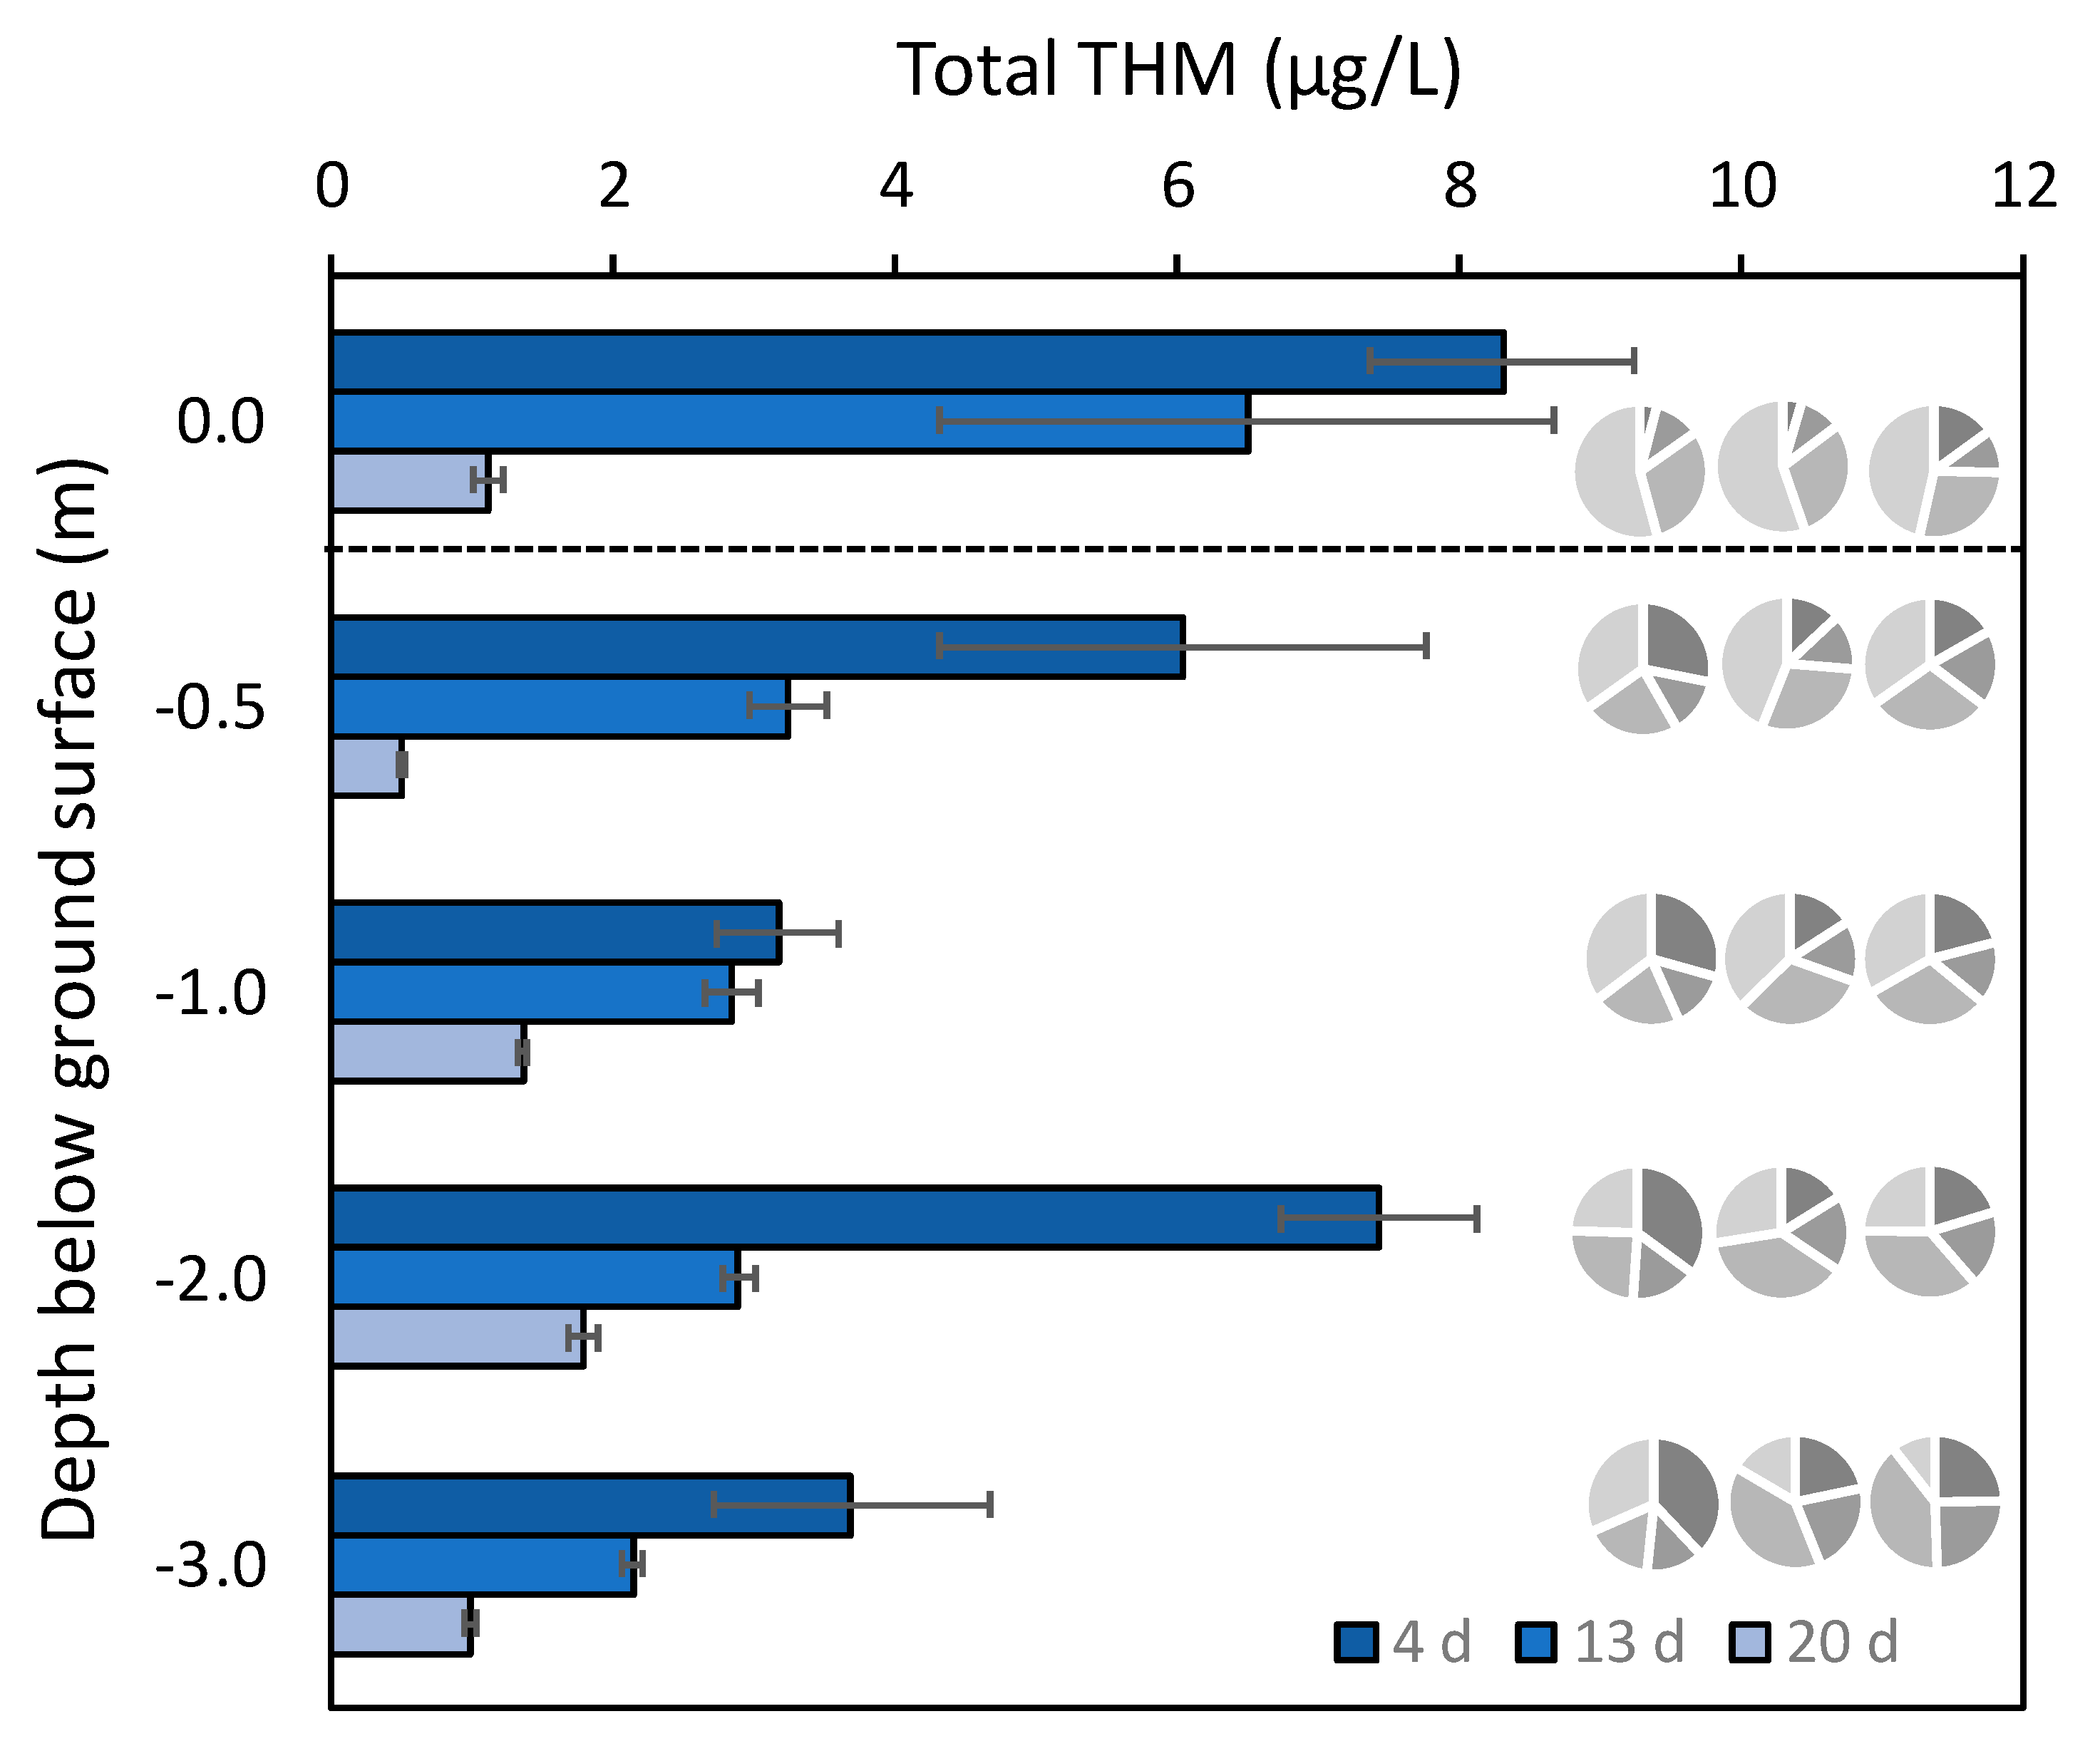
3.2. Large-Scale Infiltration Event

A large-scale infiltration MAR event took place at the site for ~1 month, with the maximal level of ponding water reaching a height of ~2 m above ground surface. The water parameters and THM concentrations were monitored in the pond and vadose zone 8, 17, and 24 days after continuous infiltration began. The third sampling campaign was carried out when water discharge was already stopped, and the ponding water was retained in isolated puddles.
In all three sampling events, the total THM concentrations in the pond and vadose zone were in the single µg/L range (Figure 2). These values are similar to those of the THM formation in the small-scale experiments, despite a significant difference in retention times within the pond, which may have facilitated volatilization. With an estimated infiltration flux of ~0.6 m/d for the flood event, a retention time of 3 to 4 days is expected for the ~2 m deep pond.
A significant decrease in total THM concentrations was monitored during the MAR event, from an average total THM of 8.3 to 6.5 and down to 1.1 µg/L in the pond, after 8, 17, and 24 days, respectively. Correspondingly, a sequential concentration decrease was observed along the vadose zone. This decreasing trend may theoretically be the result of a decrease of Br- or DOC; however, the results indicate a rather uniform Br- and DOC concentration along the entire flooding event (Table 3). The relatively high DOC concentration in the pond is related to vegetation that grows at the pond’s floor and was flooded during the MAR event.
The water isotopes presented a slight depletion toward lighter isotopes toward the end of the MAR event (Table 4). An average δ18O of 1.55‰ and an average δ2H of 11.65‰ were monitored along the vadose zone during the second sampling event, 17 days after the infiltration basin was flooded (24th January 2018), versus an average δ18O of 1.06‰ and δ2H of 9.45‰, which were monitored along the vadose zone 24 days after the flood began (31st January 2018). Such a shift may indicate mixing with other water sources. One possible source is rainwater, as significant rain events took place at the site between the 25th of January 2018 and 28th of January 2018, with a total precipitation of 77 mm (measured in the adjacent Hadera power plant; Israel Meteorological Service, online data). During this period, the water level in the pond decreased from 2 m to 1 m due to drainage (DSW discharge stopped at the 25th of January 2018). Hence, a rough estimation of DSW dilution from the 28th of January 2018 and afterward would be ~77 mm/1000 mm, or 7–8 %. With vertical mixing within the water body, some of the rain has infiltrated before the 28th. This dilution calculation does not take that into account. This rough estimation is supported by the calculated mixing ratio of the two end-members—rainwater and DSW. Using a typical rainwater δ18O composition of −5.1 to −5.7‰, and δ2H of −18.6 to −25.6‰ along the coastal plain [29], a dilution of 6 to 7% was calculated.

4. Discussion

4.1. Environmental Aspects of THM Formation in MAR with Chlorinated Desalinated Seawater

The monitored THM concentrations in both small-scale and full-scale infiltration events were within the single µg/L range. They presented an increasing dominance of chloroform (with some exceptions) in chlorinated DSW and bromoform in bromide rich DSW. In both cases, concentrations were at least an order of magnitude lower than drinking water regulations [19,28], and thus do not pose a threat to the potable water supply. For the bromide rich DSW, the total THM concentrations formed also remained at least an order of magnitude lower than those typical for the chlorinated Sea of Galilee [25,26], despite a similarity in bromide concentrations. As DOC was available in the system (Table 1, Table 2 and Table 3), the low THM concentrations even for bromide rich water are likely related to the low residual chlorine in the water.
Former studies have shown that THMs may be attenuated in the aquifer. While sorption and abiotic degradation are expected to be negligible [20], microbial degradation may be of greater significance. This, however, would become more relevant for reduced environments [30,31,32]. As THM concentrations along the vadose zone are relatively uniform, microbial degradation along the rapid transport through the upper 3.0 m of the vadose zone during MAR events seems insignificant.
Former flow and transport models for the DSW in the site discovered that water withdrawn from production wells downstream recorded a DSW mixing of >90% with local groundwater in 2017 [33]. Thus, a dilution by a factor of ten or more can be currently estimated for THM concentrations, even without other attenuation processes (sorption, volatilization, microbial or abiotic degradation). Such concentrations are often observed in groundwater in the US [20,21].

4.2. THM Formation in the Ponding Water

The formation of THMs was rapid and occurred already in the ponding water. Following the relatively low chlorine dose in the small-scale experiments and the relatively high limit of quantification for chlorine measurements in environmental samples (≤0.05 mg/L), we cannot exclude the possibility of low residual chlorine being transported through the vadose zone, leading to additional minor THM formation in the subsurface. Nevertheless, the formation in the soil profile is negligible. This is contradictory with former MAR studies, which presented the formation of THM during early transport through the aquifer [32,34,35,36]. The fact that this was not observed in the current study may be attributed to the limited chlorine concentrations in the desalinated water [36].
Laboratory kinetic studies indicate the role of rapid and slow THM formation precursors. These have shown rapid THM formation, within 3 h, following chlorination with a significantly higher chlorine dose [37]. A comparison between these systems is difficult, due to the significant differences in chlorine doses (which were typically more than an order of magnitude higher than in the current study), as well as to the type and concentration of organic matter. Nevertheless, the very general concept of significant rapid THM formation in the pond, followed by the slower formation of lower extents in the vadose zone, may be considered for our system as well.

4.3. Decrease in Total THM Concentrations During a Large-Scale MAR Event

A shift toward lower THM concentrations was observed in this study during the MAR event. This shift was not correlated to the shift in bromide or DOC concentrations. Also, this shift cannot be attributed to the dilution of DSW by rainwater, as the dilution was in the range of single percent only. Therefore, shifts in total THM have to be attributed to other factors such as volatilization, temporal variations in chlorine concentrations or changes in DOC characteristics. On the low end of concentrations, which was determined at the end of the flood event, days after discharge was stopped, volatilization may be a possible explanation. At this stage, infiltration occurred from small isolated puddles with high surface area relative to their volume, increasing the volatilization potential. Nevertheless, following the higher Henry’s constant for chloroform than for bromoform [20], it may be anticipated that volatilization would be greater for chloroform, while bromoform would be gradually enriched. This expectation was not met in the current results.

5. Conclusions

This work studied THM formation during managed aquifer recharge with chlorinated desalinated seawater. The results indicate a rapid THM formation in the ponding water with an insignificant formation or retardation of THMs along the upper 3.0 m of the vadose zone. THM concentrations significantly increased in bromide rich desalinated seawater with dominance of bromoform. During an operational large-scale MAR event, THM concentration decreased with time, and the fraction of brominated species reduced significantly with time and depth. Measurements of bromide and DOC alone cannot predict THM formation in this environment.
Water isotopes were found to be a good indicator for mixing with other water sources but could not fully explain the extent of the observed changes in THM concentrations. Further research is currently underway to understand processes occurring in the soil upon addition of chlorine. Compound-specific isotope analysis (CSIA) for THMs can be applied to investigate the formation and fate of THMs at the site. Yet the THM concentrations at the site were lower than the limit of quantification (LOQ) for the CSIA. For the application of CSIA, sample enrichment should be further optimized, which is also currently underway.
Very low concentrations of THMs were found in the three experiments with small variations along the unsaturated zone. Thus, a consideration of the variability of the porous media (as done by e.g. [38,39,40]) would not improve THM formation assessments. In any case, THM concentrations do not pose a threat to drinking water quality under the tested conditions. It is suggested that the low chlorine concentrations in the system ensure a low THM concentration.

Supplementary Materials

The following are available online at https://www.mdpi.com/2073-4441/12/3/711/s1, Table S1: THM concentrations in a small-scale field experiment, untreated DSW (29th April 2018); Table S2: THM concentrations in a small-scale field experiment, bromide spiked DSW (1st May 2018); Table S3: Bromide concentrations in a small-scale field experiment, untreated DSW (29th April 2018); Table S4: Bromide concentrations in a small-scale field experiment, bromide spiked DSW (1st May 2018); Table S5: THM concentrations in a large-scale infiltration event, day 8 (15th January 2018); Table S6: THM concentrations in a large-scale infiltration event, day 17 (24th January 2018); Table S7: THM concentrations in a large-scale infiltration event, day 24 (31 January 2018).

Author Contributions

Conceptualization, H.S., A.B., Y.K., C.S. and D.K.; Methodology, H.S., R.S. and A.B.; Formal analysis, H.S., R.S. and A.B.; Investigation, R.S. and V.S.; Resources, H.S., D.K., Y.K., A.B.; Data curation, R.S.; Writing—Original draft preparation, H.S., R.S. and A.B.; Writing—Review and editing, H.S., R.S., V.S., D.K., Y.G., Y.K., B.A.A., K.S.-S., C.S. and A.B.; Visualization, H.S. and A.B.; Supervision, H.S. and A.B.; Project administration, H.S., D.K., Y.K., C.S. and A.B.; Funding acquisition, H.S., D.K., Y.K., C.S. and A.B. All authors have read and agreed to the published version of the manuscript.

Funding

This research was funded by the BMBF-MOST German-Israeli Water Technology cooperation, grant WT-1401. BMBF project funding reference number 02WIL1386. The instrumentation and installation of the "vadose-zone gallery" were funded by the European Union’s Seventh Framework Program (FP7/2007–2013), under the grant agreement 619120 (Demonstrating Managed Aquifer Recharge as a Solution to Water Scarcity and Drought—MARSOL)

Acknowledgments

We are greatly indebted to Ido Nitzan of Volcani Center for the technical assistance in the field.

Conflicts of Interest

The authors declare no conflicts of interest.

References

  1. Hanasaki, N.; Yoshikawa, S.; Kakinuma, K.; Kanae, S. A seawater desalination scheme for global hydrological models. Hydrol. Earth Syst. Sci. 2016, 20, 4143–4157. [Google Scholar] [CrossRef] [Green Version]
  2. Tal, A. The desalination debate—lessons learned thus far. Environ. Sci. Policy Sustainable Dev. 2011, 53, 34–48. [Google Scholar] [CrossRef]
  3. Israel Water Authority. Consumption of Potable Water in 2017 (in Hebrew). Available online: http://www.water.gov.il/Hebrew/ProfessionalInfoAndData/Allocation-Consumption-andproduction/20172/shafirim_mavo_2017.pdf (accessed on 3 March 2020).
  4. Almulla, A.; Hamad, A.; Gadalla, M. Aquifer storage and recovery (ASR): A strategic cost-effective facility to balance water production and demand for Sharjah. Desalination 2005, 174, 193–204. [Google Scholar] [CrossRef]
  5. Hutchinson, C. Simulation of Aquifer Storage Recovery of Excess Desalinated Seawater, AL AIN Area, Abu Dhabi Emirate; Citeseer: The Pennsylvania State University, State College, PA, USA, 1998. [Google Scholar]
  6. Al-Katheeri, E. Towards the establishment of water management in Abu Dhabi Emirate. Water Resour. Manag. 2008, 22, 205. [Google Scholar] [CrossRef]
  7. Mukhopadhyay, A.; Al-Awadi, E.; AlSenafy, M.; Smith, P. Laboratory investigations of compatibility of the Dammam Formation Aquifer with desalinated freshwater at a pilot recharge site in Kuwait. J. Arid Environ. 1998, 40, 27–42. [Google Scholar] [CrossRef]
  8. Al-Awadi, E.; Mukhopadhyay, A.; Al-Haddad, A.J. Compatibility of desalinated water with the dammam formation at the northwest shigaya water-well field, Kuwait—A preliminary study. Hydrogeol. J. 1995, 3, 56–73. [Google Scholar] [CrossRef]
  9. Ganot, Y.; Holtzman, R.; Weisbrod, N.; Nitzan, I.; Katz, Y.; Kurtzman, D. Monitoring and modeling infiltration-recharge dynamics of managed aquifer recharge with desalinated seawater. Hydrol. Earth Syst. Sci. 2017, 21. [Google Scholar] [CrossRef] [Green Version]
  10. Yermiyahu, U.; Tal, A.; Ben-Gal, A.; Bar-Tal, A.; Tarchitzky, J.; Lahav, O. Rethinking desalinated water quality and agriculture. Science 2007, 318, 920–921. [Google Scholar] [CrossRef]
  11. Ronen-Eliraz, G.; Russak, A.; Nitzan, I.; Guttman, J.; Kurtzman, D. Investigating geochemical aspects of managed aquifer recharge by column experiments with alternating desalinated water and groundwater. Sci. Total Environ. 2017, 574, 1174–1181. [Google Scholar] [CrossRef]
  12. Ganot, Y.; Holtzman, R.; Weisbrod, N.; Russak, A.; Katz, Y.; Kurtzman, D. Geochemical processes during managed aquifer recharge with desalinated seawater. Water Resour. Res. 2018, 54, 978–994. [Google Scholar] [CrossRef]
  13. Agus, E.; Voutchkov, N.; Sedlak, D.L. Disinfection by-products and their potential impact on the quality of water produced by desalination systems: A literature review. Desalination 2009, 237, 214–237. [Google Scholar] [CrossRef]
  14. Kim, D.; Amy, G.L.; Karanfil, T. Disinfection by-product formation during seawater desalination: A review. Water Res. 2015, 81, 343–355. [Google Scholar] [CrossRef] [Green Version]
  15. Gopal, K.; Tripathy, S.S.; Bersillon, J.L.; Dubey, S.P. Chlorination byproducts, their toxicodynamics and removal from drinking water. J. Hazard. Mater. 2007, 140, 1–6. [Google Scholar] [CrossRef] [PubMed]
  16. Richardson, S.D.; Plewa, M.J.; Wagner, E.D.; Schoeny, R.; DeMarini, D.M. Occurrence, genotoxicity, and carcinogenicity of regulated and emerging disinfection by-products in drinking water: A review and roadmap for research. Mutat. Res. 2007, 636, 178–242. [Google Scholar] [CrossRef] [PubMed]
  17. WHO. Trihalomethanes in Drinking-water Background document for development of WHO Guidelines for Drinking-Water Quality. Geneva World Health Organ. 2005, 5, 8–64. [Google Scholar]
  18. EU. Decision 2004/248/EC of 10 March 2004. OJ 2004, L 78, 53–55. [Google Scholar]
  19. Israel Ministry of Health. Public Health Regulations 2013—The Sanitary Quality of Drinking Water and Drinking Water Facilities. Available online: https://www.health.gov.il/LegislationLibrary/Briut47.pdf (accessed on 3 March 2020).
  20. Ivahnenko, T.; Barbash, J.E. Chloroform in the Hydrologic System—Sources, Transport, Fate, Occurrence, and Effects on Human Health and Aquatic Organisms. US Geological Survey Reston: Reston, VA, USA, 2004. [Google Scholar]
  21. Carter, J.M.; Moran, M.J.; Zogorski, J.S.; Price, C.V. Factors associated with sources, transport, and fate of chloroform and three other trihalomethanes in untreated groundwater used for drinking water. Environ. Sci. Technol. 2012, 46, 8189–8197. [Google Scholar] [CrossRef]
  22. Sadiq, R.; Rodriguez, M.J. Disinfection by-products (DBPs) in drinking water and predictive models for their occurrence: A review. Sci. Total Environ. 2004, 321, 21–46. [Google Scholar] [CrossRef]
  23. Melloul, A. Hydrogeological Atlas of Israel’s Coastal plain aquifer. Ministry of Agriculture Water Commission 1988, 8, 35. [Google Scholar]
  24. Munch, D.J.; Hautman, D.P. Method 551.1: Determination of chlorination disinfection byproducts, chlorinated solvents, and halogenated pesticides/herbicides in drinking water by liquid-liquid extraction and gas chromatography with electron-capture detection. In Methods for the Determination of organic compounds in drinking water; NSCEP: Washington DC, USA, 1995. [Google Scholar]
  25. Richardson, S.D.; Thruston, A.D.; Rav-Acha, C.; Groisman, L.; Popilevsky, I.; Juraev, O.; Glezer, V.; McKague, A.B.; Plewa, M.J.; Wagner, E.D. Tribromopyrrole, brominated acids, and other disinfection byproducts produced by disinfection of drinking water rich in bromide. Environ. Sci. Technol. 2003, 37, 3782–3793. [Google Scholar] [CrossRef]
  26. Heller-Grossman, L.; Manka, J.; Limoni-Relis, B.; Rebhun, M. Formation and distribution of haloacetic acids, THM and TOX in chlorination of bromide-rich lake water. Water Rese. 1993, 27, 1323–1331. [Google Scholar] [CrossRef]
  27. Kloppmann, W.; Vengosh, A.; Guerrot, C.; Millot, R.; Pankratov, I. Isotope and ion selectivity in reverse osmosis desalination: Geochemical tracers for man-made freshwater. Environ. Sci. Technol. 2008, 42, 4723–4731. [Google Scholar] [CrossRef] [PubMed]
  28. EPAU. 2004 ed. of the Drinking Water Standards and Health Advisories; EPA 822-R-04-005; Office of Water: Washington, DC, USA, 2004. [Google Scholar]
  29. Goldsmith, Y.; Polissar, P.; Ayalon, A.; Bar-Matthews, M.; Demenocal, P.; Broecker, W. The modern and Last Glacial Maximum hydrological cycles of the Eastern Mediterranean and the Levant from a water isotope perspective. Earth Planet. Sci. Lett. 2017, 457, 302–312. [Google Scholar] [CrossRef]
  30. Pavelic, P.; Dillon, P.J.; Nicholson, B.C. Comparative evaluation of the fate of disinfection byproducts at eight aquifer storage and recovery sites. Environ. Sci. Technol. 2006, 40, 501–508. [Google Scholar] [CrossRef] [PubMed]
  31. Pavelic, P.; Nicholson, B.C.; Dillon, P.J.; Barry, K.E. Fate of disinfection by-products in groundwater during aquifer storage and recovery with reclaimed water. J. Contam. Hydrol. 2005, 77, 119–141. [Google Scholar] [CrossRef]
  32. Liu, D.; Liang, X.; Zhang, W.; Wang, Z.; Ma, T.; Li, F.; Chen, X. Formation and transformation of chloroform during managed aquifer recharge (MAR). J. Environ. Manag. 2018, 219, 304–315. [Google Scholar] [CrossRef]
  33. Ganot, Y.; Holtzman, R.; Weisbrod, N.; Bernstein, A.; Siebner, H.; Katz, Y.; Kurtzman, D. Managed aquifer recharge with reverse-osmosis desalinated seawater: Modeling the spreading in groundwater using stable water isotopes. Hydrol. Earth Syst. Sci. 2018, 22, 6323–6333. [Google Scholar] [CrossRef] [Green Version]
  34. Mille, C.; Wilson, L.; Amy, G.L.; Brothers, K. Fate of organochlorine compounds during aquifer storage and recovery: The Las Vegas experience. Groundwater 1993, 31, 410–416. [Google Scholar] [CrossRef]
  35. Maliva, R.G. Contaminant Attenuation and Natural Aquifer Treatment. In Anthropogenic Aquifer Recharge, Springer Cham: Switzerland, 2020; pp 165–208; Springer: Cham, Switzerland, 2020; pp. 165–208. [Google Scholar]
  36. Fram, M.S.; Bergamaschi, B.A.; Goodwin, K.D.; Fujii, R.; Clark, J.F. Processes affecting the trihalomethane concentrations associated with the third injection, storage, and recovery test at Lancaster, Antelope Valley, California, March 1998 through April 1999. Water Res. Invest. Rep. 2003, 3, 4062. [Google Scholar]
  37. Gallard, H.; von Gunten, U. Chlorination of natural organic matter: Kinetics of chlorination and of THM formation. Water Res. 2002, 36, 65–74. [Google Scholar] [CrossRef]
  38. Bekele, E.; Toze, S.; Patterson, B.; Higginson, S. Managed aquifer recharge of treated wastewater: Water quality changes resulting from infiltration through the vadose zone. Water Res. 2011, 45, 5764–5772. [Google Scholar] [CrossRef] [PubMed]
  39. Pedretti, D.; Barahona-Palomo, M.; Bolster, D.; Fernàndez-Garcia, D.; Sanchez-Vila, X.; Tartakovsky, D.M. Probabilistic analysis of maintenance and operation of artificial recharge ponds. Adv. Water Resour. 2012, 36, 23–35. [Google Scholar] [CrossRef]
  40. Masetti, M.; Pedretti, D.; Sorichetta, A.; Stevenazzi, S.; Bacci, F. Impact of a storm-water infiltration basin on the recharge dynamics in a highly permeable aquifer. Water Resour. Manag. 2016, 30, 149–165. [Google Scholar] [CrossRef]
Figure 1. Total trihalomethanes (THMs, blue bars) along the vadose zone for (A) chlorinated desalinated seawater (DSW); and (B) DSW spiked with bromide (2045 ± 205 µg/L). At each depth a water sample was taken twice along the experiment, except for the 0.5 m point. The error bars represent the standard deviation between three sequentially collected samples at each sampling phase. The dashed line illustrates the interface between the surface water and the vadose zone. The distribution of the THM species in each depth (averages for three subsequent samples) is presented in pie plots, with chloroform presented as dark gray, and colors gradually become lighter with the replacement of chlorine substituents with bromine (concentrations are provided on the Supplementary Materials).
Water 12 00711 g001
Figure 2. Total THM (blue bars) in the pond and along the vadose zone during the large-scale infiltration event. The error bars represent the standard deviation of three sequentially collected samples at each port. The dashed line illustrates the interface between the surface water and the vadose zone. The distribution of the THM species in each depth at each sampling date (averages for three subsequent samples) is presented in pie plots, with chloroform presented as dark gray, and colors gradually become lighter with the replacement of chlorine substituents with bromine (concentrations are provided on SI).
Water 12 00711 g002
Table 1. Water parameters in the first controlled infiltration experiment with desalinated seawater. Dissolved organic carbon (DOC) and bromide were analyzed for samples collected 2–3 h and 5–6 h after the infiltration began. (ND—no data.)
Water Isotopes (‰, VSMOW)DOC (mg/L)
δ18Oδ2H2–3 h5–6 h
DSW1.49 ± 0.0311.47 ± 0.051.05 ± 0.150.53 ± 0.02
Ponding Water1.49 ± 0.0111.47 ±0.160.53 ± 0.010.60 ± 0.05
Vadose Zone (m)
0.5NDNDND0.74 ± 0.14
1.01.51 ± 0.0311.53 ± 0.051.03 ± 0.030.63 ± 0.11
2.01.51 ± 0.0211.46 ± 0.142.51 ± 0.110.71 ± 0.02
3.01.43 ± 0.0211.18 ± 0.121.45 ± 0.072.35 ± 0.76
Table 2. Water parameters in the second controlled infiltration experiment with desalinated seawater spiked with bromide. DOC and bromide were analyzed for samples collected 2–3 h and 5–6 h after the infiltration began. Bromide was monitored hourly in the ponding water. (ND—No data.)
Water Isotopes (‰, VSMOW)DOC (mg/L)
δ18Oδ2H2–3 h5–6 h
DSW1.51 ± 0.0211.52 ± 0.041.81 ± 0.210.80 ± 0.19
Ponding Water1.48 ± 0.0211.29 ± 0.050.64 ± 0.170.33 ± 0.02
Vadose Zone (m)
0.5NDNDND0.66 ± 0.09
1.01.52 ± 0.0111.55 ± 0.070.56 ± 0.050.39 ± 0.05
2.01.49 ± 0.0111.54 ± 0.030.93 ± 0.041.46 ± 0.33
3.01.48 ± 0.0211.53 ± 0.083.29 ± 0.081.66 ± 0.15
Table 3. DOC and bromide concentration in the ponding water and vadose zone 8, 17, and 24 d after the infiltration began. Pond water samples were collected at multiple points (number of sampling points provided in brackets). (ND—No data.)
DOC (mg/L)Br- (µg/L)
8 d17 d24 d8 d17 d24 d
Pond Water16.5 ± 0.5 (n = 4)16.4 ± 0.7 (n = 8)17.4 (n = 1)34 ± 4 (n = 4)33 ± 9 (n = 6)30 (n = 1)
Vadose Zone (m)
0.5ND18.317.0503936
1NDND16.93940113
2ND17.613.6504438
3ND17.817.34043ND
Table 4. Water isotopes (VSMOW, ‰) in the ponding water and vadose zone 4, 13, and 20 d after the infiltration began. Pond water samples were collected at multiple points (number of sampling points provided in brackets). (ND—No data.)
8 d17 d24 d
δ18Oδ2Hδ18Oδ2Hδ18Oδ2H
Pond Water1.54 ± 0.02 (n = 3)11.52 ± 0.10 (n = 3)1.55 ± 0.03 (n = 5)11.69 ± 0.09 (n = 6)NDND
Vadose Zone (m)
0.51.37 ± 0.0410.45 ± 0.191.58 ± 0.0311.77 ± 0.081.07 ± 0.079.47 ± 0.34
11.22 ± 0.039.96 ± 0.121.52 ± 0.0311.60 ± 0.211.05 ± 0.059.43±0.31
21.49 ± 0.0211.26 ± 0.14NDNDNDND
31.43 ± 0.0410.96 ± 0.201.55 ± 0.0211.58 ± 0.04NDND

