Use of Diatoms in Monitoring the Sakarya River Basin, Turkey

 , , ,
, , ,  , ,
, , 
Abstract
:1. Introduction
2. Methods
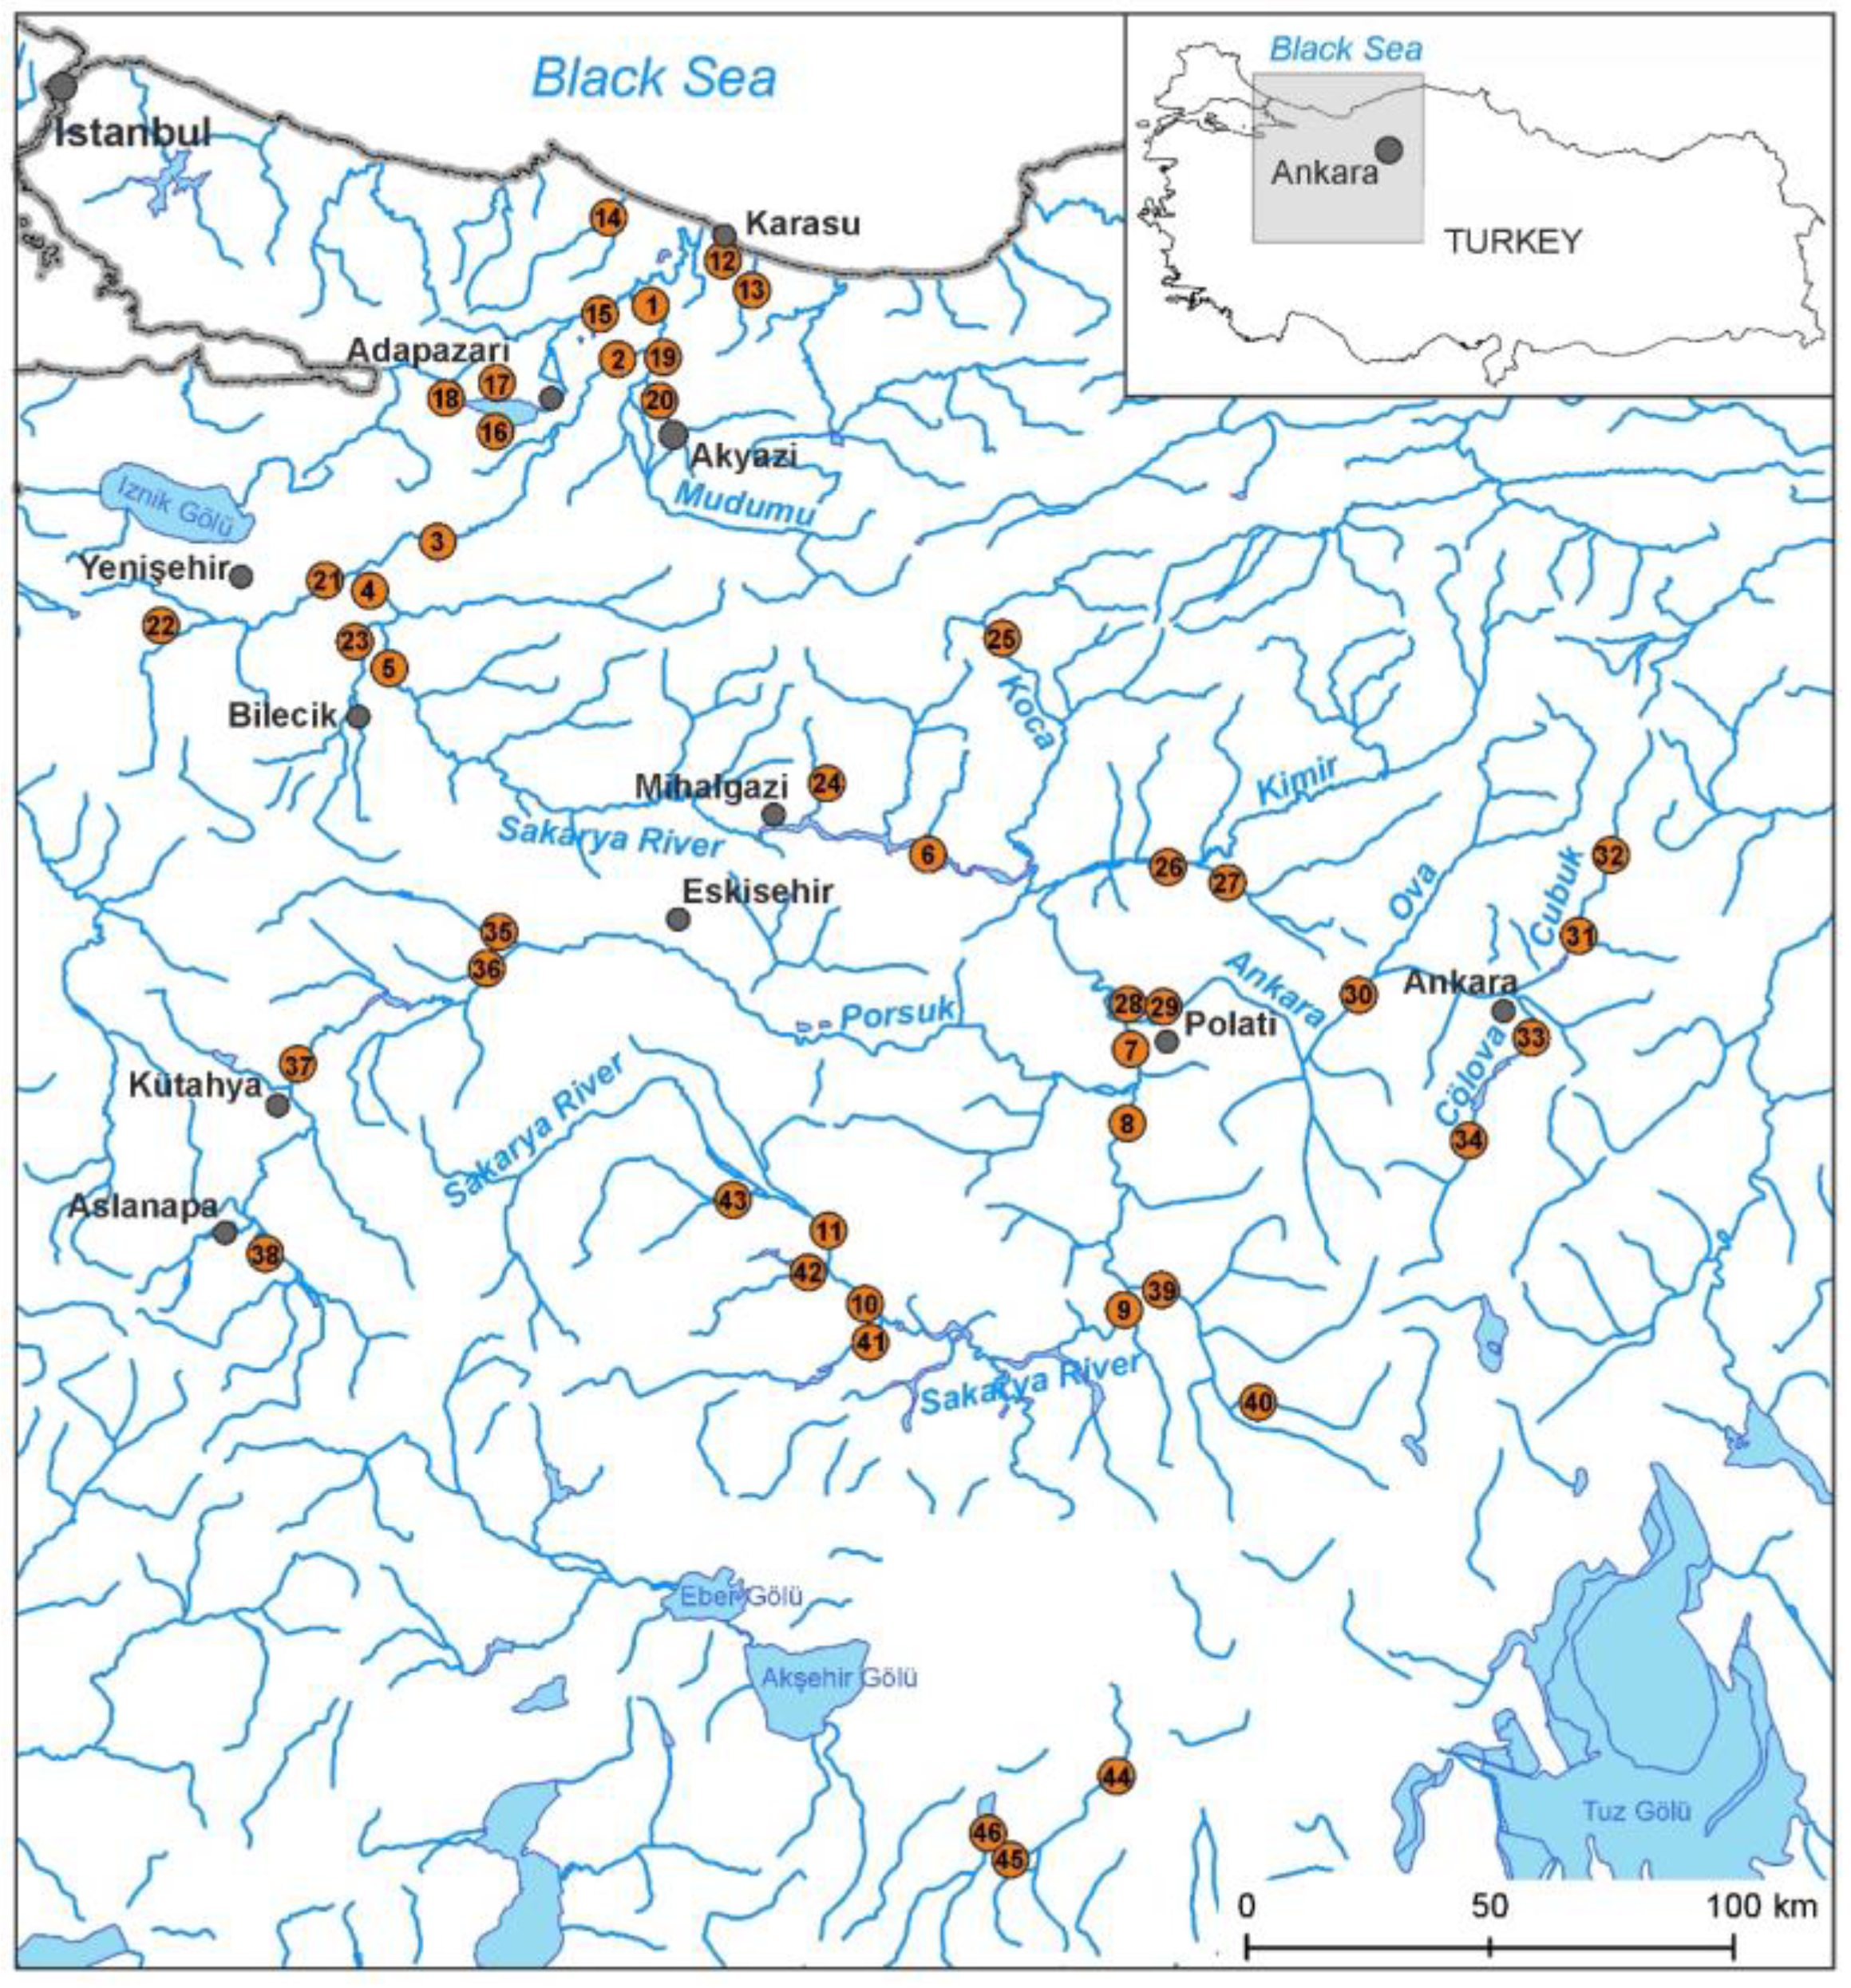
2.1. Study Area
2.2. Field and Laboratory Studies
3. Results
3.1. Physico-Chemical Water Parameters
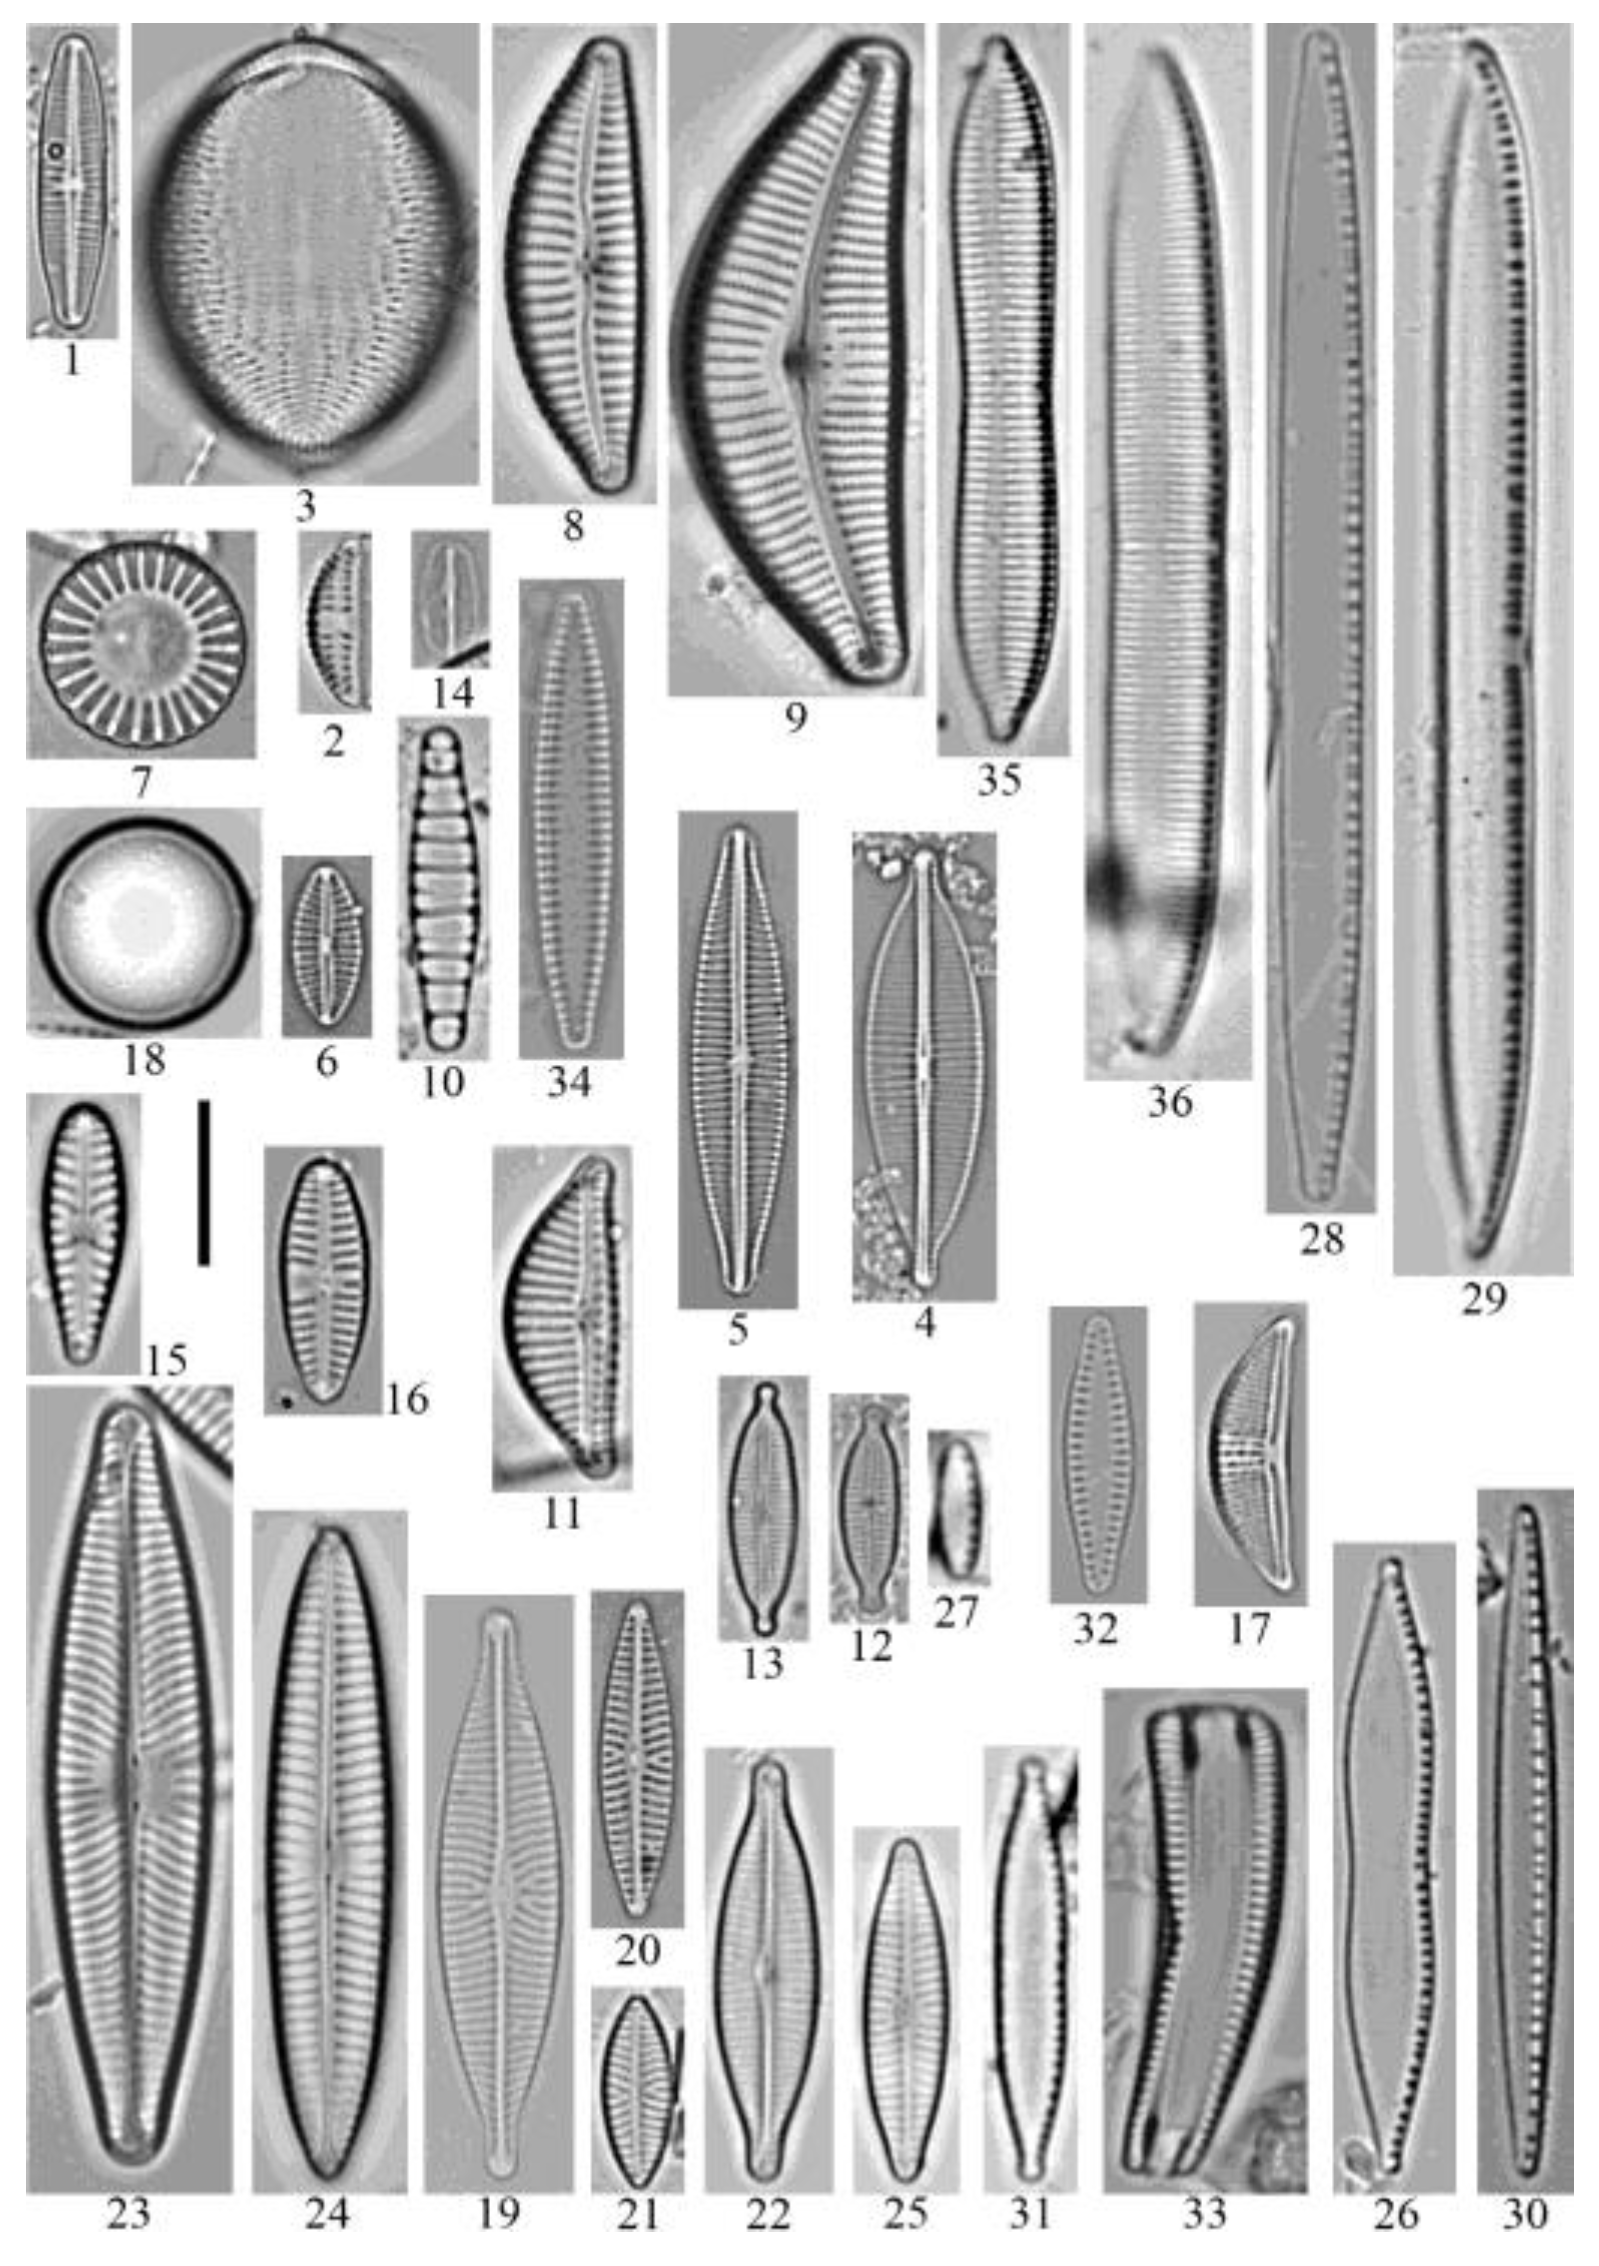
3.2. Diatom Composition
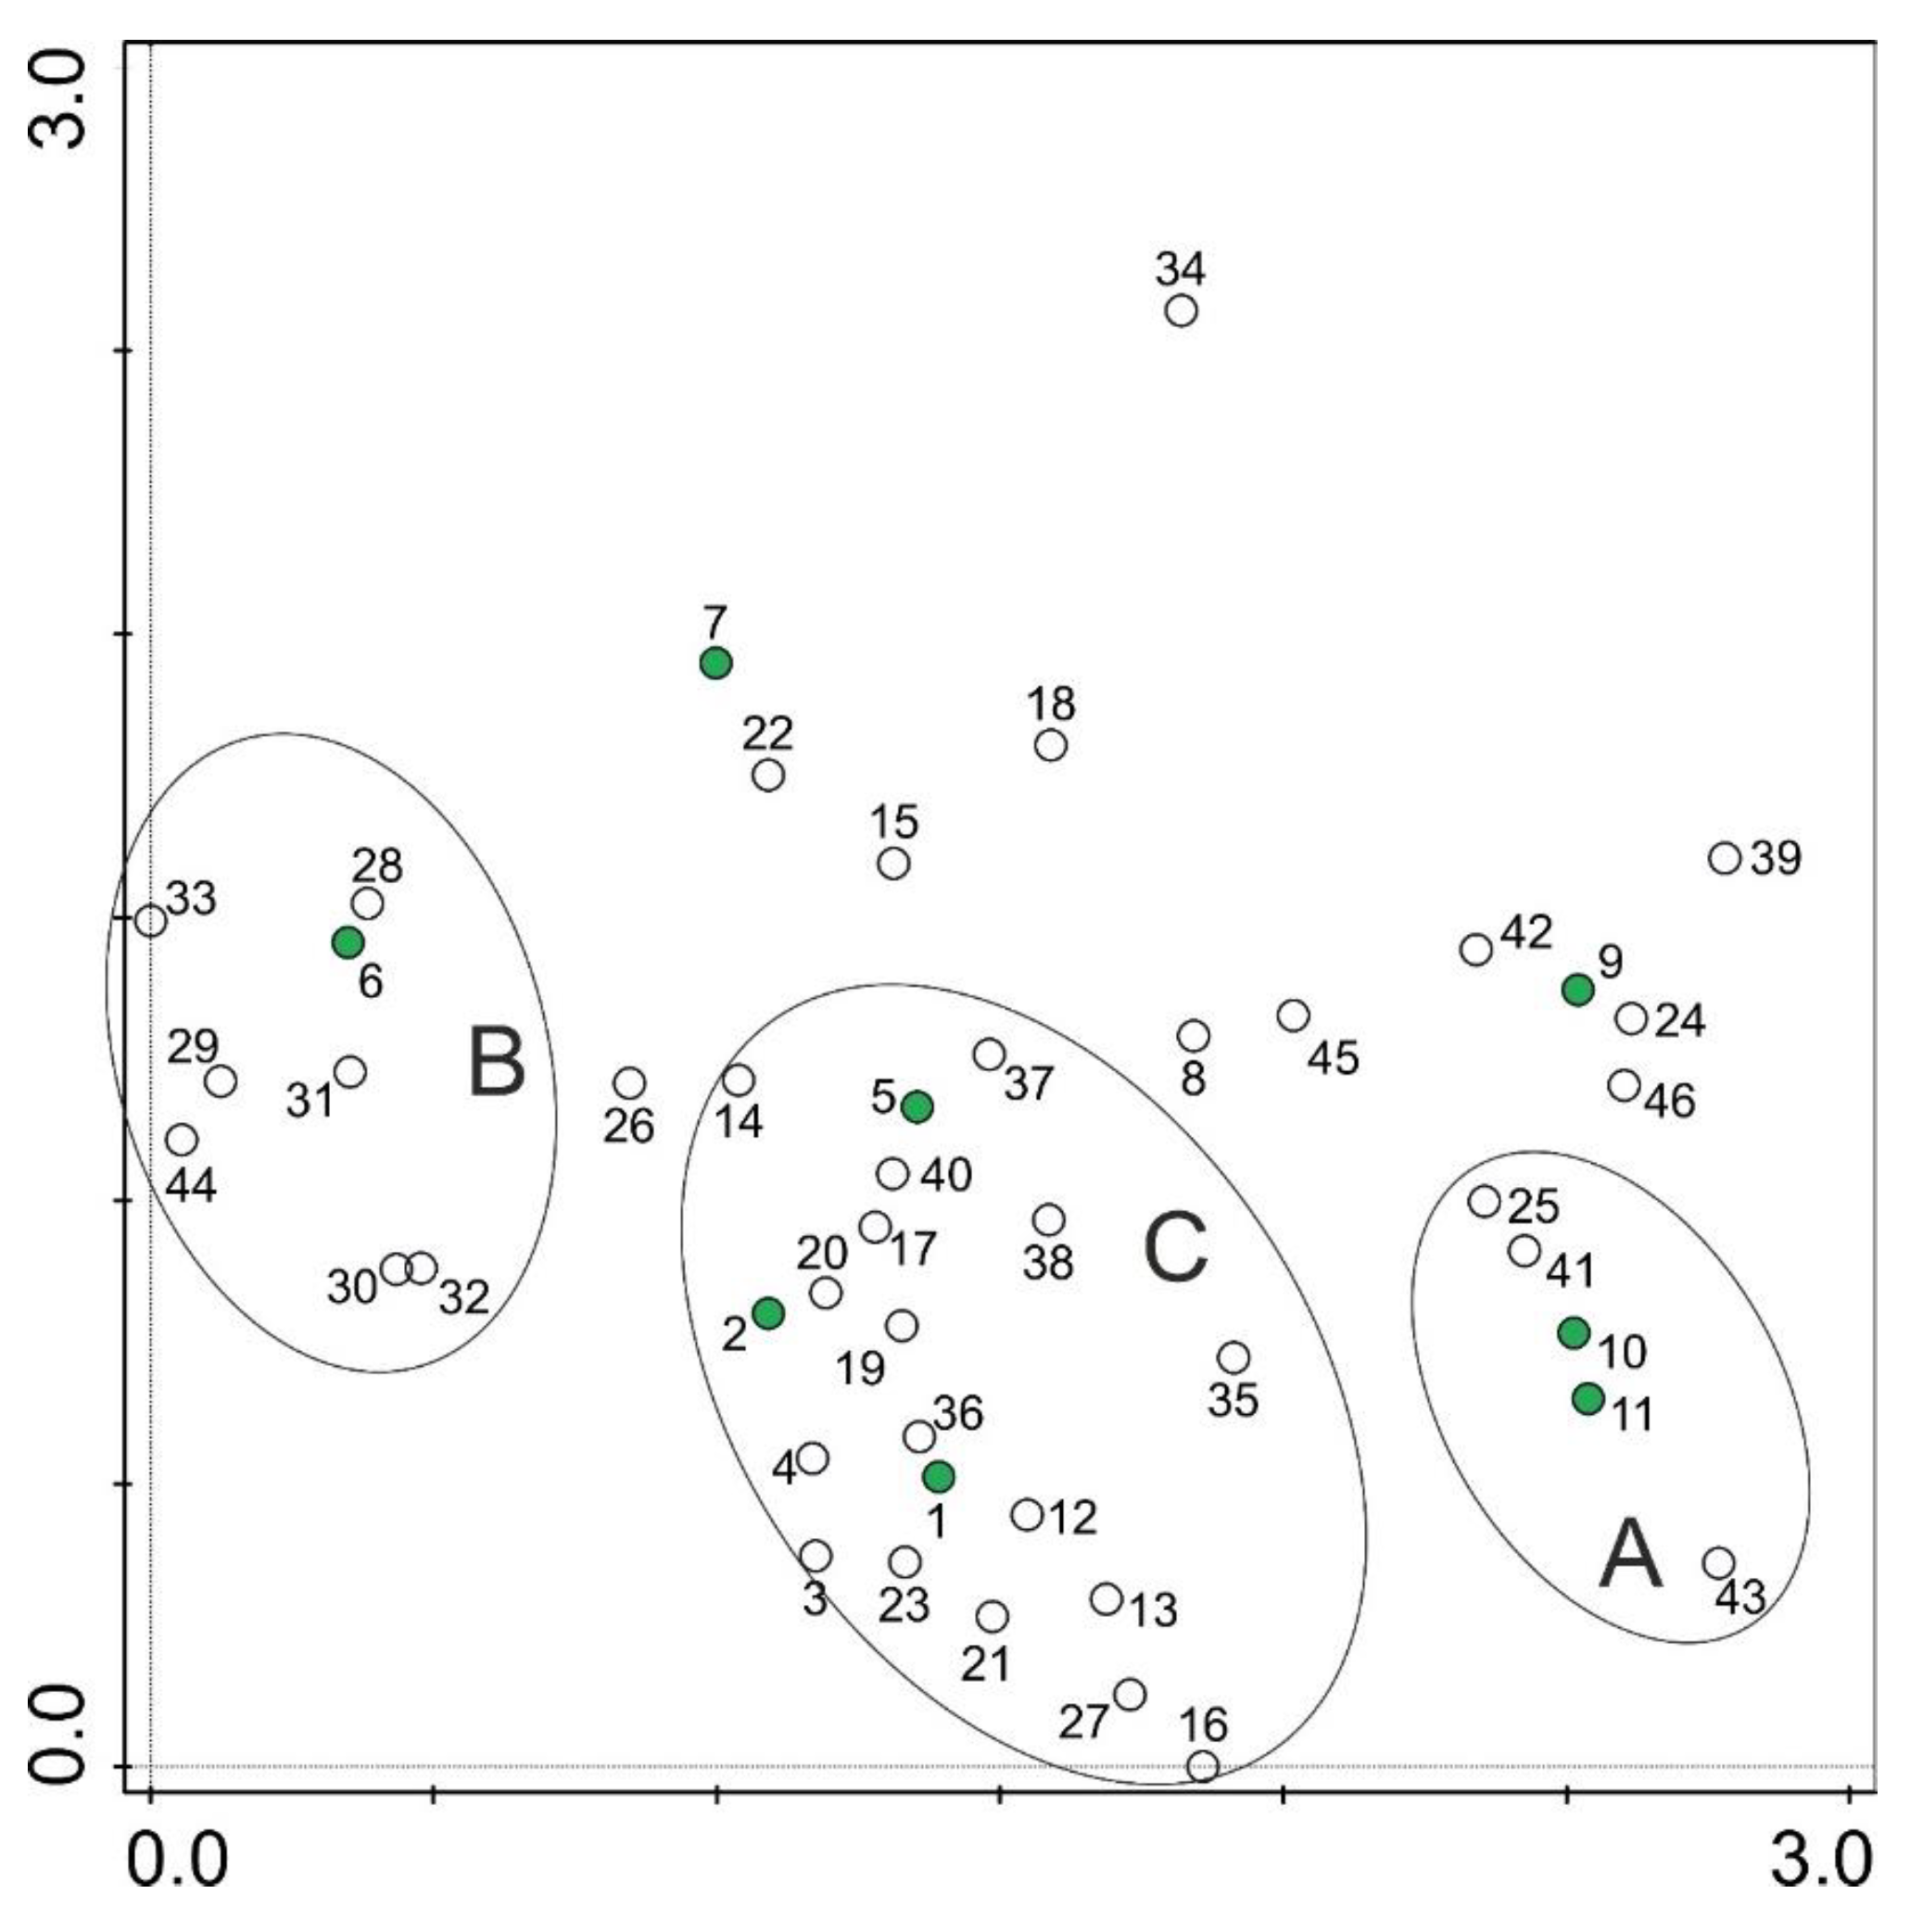
4. Discussion
5. Conclusions
Supplementary Materials
Author Contributions
Funding
Acknowledgments
Conflicts of Interest
References
- Verdonschot, P.F.M. Integrated ecological assessment methods as a basis for sustainable catchment management. Hydrobiologia 2000, 422–423, 389–412. [Google Scholar] [CrossRef]
- Kolkwitz, R.; Marsson, M. Grundsätze für die biologische Beurteilung des Wassers nach seiner Flora and Fauna. Mitt. Prüfungsanst. Wasserversorg. Abwasserreinig 1902, 1, 33–72. [Google Scholar]
- Kolkwitz, R.; Marsson, M. Ökologie der tierischen saprobien. Beiträge zur lehre von biologischen Gewasserbeurteilung. Int. Revue Gesamten Hydrobiol. Hydrogr. 1909, 2, 126–152. [Google Scholar] [CrossRef] [Green Version]
- Cholnoky, B.J. Die Ökologie der Diatomeen in Binnengewässern; Cramer, J., Ed.; J. Cramer: Lehre, Germany, 1968; pp. 1–699. [Google Scholar]
- Patrick, R. Ecology of freshwater diatoms and diatom communities. In The Biology of Diatoms; Werner, D., Ed.; Blackwell: Oxford, UK, 1977; pp. 284–332. [Google Scholar]
- Directive, W.F. Directive 2000/60/EC of the European Parliament and of the Council of 23 October 2000 establishing a framework for Community action in the field of water policy. Off. J. Eur. Commun. 2000, 22, 2000. [Google Scholar]
- Smol, J.P.; Stoermer, E.F. The Diatoms: Applications for the Environment and Earth Sciences; Cambridge University Press: New York, NY, USA, 2010; pp. 570–573. [Google Scholar]
- Ács, É.; Szabó, K.; Tóth, B.; Kiss, K.T. Investigation of benthic algal communities, especially diatoms of some Hungarian streams in connection wıth reference conditions of the water framework directives. Acta Bot. Hung. 2004, 46, 255–277. [Google Scholar] [CrossRef]
- Stevenson, R.J.; Bothwell, M.L.; Lowe, R.L. Algal Ecology: Freshwater Benthic Ecosystems; Academic Press: San Diego, CA, USA, 1996. [Google Scholar]
- Tapolczai, K.; Bouchez, A.; Stenger-Kovács, C.; Padisák, J.; Rimet, F. Trait-based ecological classifications for benthic algae: Review and perspectives. Hydrobiologia 2016, 776, 1–17. [Google Scholar] [CrossRef]
- Xeu, H.; Zheng, B.; Meng, F.; Wang, Y.; Zhang, L.; Cheng, P. Assessment of aquatic ecosystem health of the Wutong River based on benthic diatoms. Water 2018, 11, 1–17. [Google Scholar]
- Besse-Lototskaya, A.; Verdonschot, P.F.M.; Coste, M.; van de Vijver, B. Evaluation of European diatom trophic indices. Ecol. Indic. 2011, 11, 456–467. [Google Scholar] [CrossRef]
- Noga, T.; Stanek-Tarkowska, J.; Peszek, Ł.; Pajączek, A.; Kochman-Kędziora, N.; Ligęzka, R. The use of diatoms to assess the water quality in the Wisłoka River in the town of Dębica and the surrounding area. Oceanol. Hydrobiol. Stud. 2016, 45, 191–201. [Google Scholar] [CrossRef]
- Kwandrans, J.; Eloranta, P.; Kawecka, B.; Wojtan, K. Use of benthic diatom communities to evaluate water quality in rivers of southern Poland. J Appl. Phycol. 1998, 10, 193–201. [Google Scholar] [CrossRef]
- Dell’Uomo, A. Assessment of water quality of an Apennine river as a pilot study for diatom-based monitoring of Italian watercourses. In The Use of Algae for Monitoring Rivers II.; Whitton, B.A., Rott, E., Eds.; Institut fϋr Botanik Universität Innsbruck: Innsbruck, Austria, 1996; pp. 65–72. [Google Scholar]
- Kelly, M.G.; Whitton, B.A. The trophic diatom index: A new index for monitoring eutrophication in rivers. J. Appl. Phycol. 1995, 7, 433–444. [Google Scholar] [CrossRef]
- Kelly, M.G.; Chiriac, G.; Soare-Minea, A.; Hamchevici, C.; Birk, S. Defining ecological status of phytobenthos in very large rivers: A case study in practical implementation of the Water Framework Directive in Romania. Hydrobiologia 2018, 828, 353–367. [Google Scholar] [CrossRef]
- Szczepocka, E.; Żelezna-Wieczorek, J.; Nowicka-Krawczyk, P. Critical approachto diatom-based bioassessment of the regulated sections of urban flowing water ecosystems. Ecol. Indic. 2019, 104, 259–267. [Google Scholar] [CrossRef]
- Ponader, K.C.; Charles, D.F.; Belton, T.J. Diatom-based TP and TN inference models and indices for monitoring nutrient enrichment of New Jersey streams. Ecol. Indic. 2007, 7, 79–93. [Google Scholar] [CrossRef]
- Potapova, M.; Charles, D.F. Diatom metrics for monitoring eutrophication in rivers of the United States. Ecol. Indic. 2007, 7, 48–70. [Google Scholar] [CrossRef]
- Lecointe, C.; Coste, M.; Prygiel, J. “Omnidia”: Software for taxonomy. Calculation of diatom indices and inventories management. Hydrobiologia 1993, 269–270, 509–513. [Google Scholar] [CrossRef]
- Zgrundo, A.; Peszek, Ł.; Poradowska, A. Podręcznik do Monitoringu i Oceny Rzecznych Jednolitych Części wód Powierzchniowych na Podstawie Fitobentosu; Główny Inspektorat Ochrony Środowiska: Gdańsk, Poland, 2018; pp. 1–70. [Google Scholar]
- Pipp, E. A regional diatom-based trophic state indication system for running water sites in Upper Austria and its overregional applicability. Verh. Int. Verein. Limnol. 2002, 27, 3376–3380. [Google Scholar] [CrossRef]
- Tan, X.; Zhang, Q.; Burford, M.A.; Sheldon, F.; Bunn, S.E. Benthic diatom based indices for water quality assessment in two subtropical streams. Front. Microbiol. 2017, 8, 601. [Google Scholar] [CrossRef] [PubMed] [Green Version]
- Tierno de Figueroa, J.M.; Lopez-Rodrıguez, M.J.; Fenoglio, S.; Sanchez-Castillo, P.; Fochetti, R. Freshwater biodiversityin the rivers of the Mediterranean Basin. Hydrobiologia 2013, 719, 137–186. [Google Scholar] [CrossRef]
- Giorgio, A.; Bonis, S.; Guida, M. Macroinvertebrate and diatom communities as indicators for the biological assessment of river Picentino (Campania, Italy). Ecol. Indic. 2016, 64, 85–91. [Google Scholar] [CrossRef]
- Brabcová, B.; Marvan, P.; Opatřilová, L.; Brabec, K.; Fránková, M.; Heteŝa, J. Diatoms in water quality assessment: To count or not to count them? Hydrobiologia 2017, 795, 113–127. [Google Scholar] [CrossRef]
- Pardoa, I.; Delgadoa, C.; Abraína, R.; Gómez-Rodríguezb, C.; García-Rosellóc, E.; Garcíaa, L.; Reynoldsond, T.B. A predictive diatom-based model to assess the ecological status of streams and rivers of Northern Spain. Ecol. Indic. 2018, 90, 519–528. [Google Scholar] [CrossRef]
- Çetin, T.; Demir, N. The use of phytobenthos for the ecological status assessment in Upper Sakarya Basin. Turkey. Appl. Ecol. Env. Res. 2017, 17, 10155–10172. [Google Scholar]
- Karaouzas, I.; Smeti, E.; Kalogianni, E.; Skoulikidis, N.T. Ecological status monitoring and assessment in Greek rivers: Do macroinvertebrate and diatom indices indicate same responses to anthropogenic pressures? Ecol. Indic. 2019, 101, 126–132. [Google Scholar] [CrossRef]
- Solak, C.N.; Ector, L.; Wojtal, A.Z.; Ács, É.; Morales, E.A. A review of investigations on diatoms (Bacillariophyta) in Turkish inland waters. Nova Hedwig. Beih. 2012, 141, 431–462. [Google Scholar]
- Atıcı, T.; Yıldız, K. Sakarya Nehri Diyatomları. Turk. J. Bot. 1996, 20, 119–134. [Google Scholar]
- Yıldız, K. Diatoms of the Porsuk River, Turkey. Doğa Tr. J. Biol. 1987, 11, 162–182. [Google Scholar]
- Atıcı, T.; Ahıska, S. Pollutıon and algae of Ankara stream. Gazi Univ. J Sci. 2005, 18, 51–59. [Google Scholar]
- Tokatlı, C. Sucul sistemlerin izlenmesinde bazı diyatome indekslerinin kullanılması: Gürleyik Çayı örneği (Eskişehir). Dumlupınar Üniversitesi Bilimleri Enstitüsü Dergisi 2012, 29, 19–26. [Google Scholar]
- Yaykıran, S. Structuring the High Resolution Hydrological Model of Sakarya Basin; MSc—Istanbul Technical University, Institute of Science and Technology: İstanbul, Turkey, 2016; pp. 1–204. [Google Scholar]
- Günay, G. Hydrology and hydrogeology of Sakaryabaşı Karstic springs, Çifteler, Turkey. Environ. Geol. 2006, 51, 229–240. [Google Scholar] [CrossRef]
- Japan Society of Civil Engineers, Earthquake Engineering Committee. The 1999 Kocaeli Earthquake, Turkey—Investigation into Damage to Civil Engineering Structures. 1999. Available online: http://www.jsce.or.jp/library/eq_repo/Vol1/TURKEY/kocaeli_E.html (accessed on 15 October 2019).
- Krammer, K.; Lange-Bertalot, H. Bacillariophyceae. 1. Teil: Naviculaceae. Süßwasserflora Mitteleur. 1986, 2, 1–876. [Google Scholar]
- Krammer, K.; Lange-Bertalot, H. Bacillariophyceae. 2. Teil: Bacillariaceae. Epithemiaceae. Surirellaceae. Süßwasserflora Mitteleur. 1988, 2, 1–596. [Google Scholar]
- Krammer, K.; Lange-Bertalot, H. Bacillariophyceae. 3. Teil: Centrales. Fragilariaceae Eunotiaceae. Süßwasserflora Mitteleur. 1991, 2, 1–576. [Google Scholar]
- Krammer, K.; Lange-Bertalot, H. Bacillariophyceae. 4. Teil: Achnanthaceae. Kritische Erganzungen zu Navicula (Lineolatae) und Gomphonema. Gesamtliteraturverzeichnis. Süßwasserflora Mitteleur. 1991, 2, 1–437. [Google Scholar]
- Reichardt, E. Zur Revision der Gattung Gomphonema. Die Arten um G. affine/insigne.G. angustatum/micropus. G. acuminatum sowie gomphonemoide Diatomeen aus dem Oberoligozän in Böhmen. Iconogr. Diatomol. 1999, 8, 1–203. [Google Scholar]
- Krammer, K. Pinnularia. Diatoms of the European Inland Waters and Comparable Habitats. Diatoms Eur. 2000, 1, 1–703. [Google Scholar]
- Krammer, K. Cymbella. Diatoms of the European Inland Waters and Comparable Habitats. Diatoms Eur. 2002, 3, 1–584. [Google Scholar]
- Lange-Bertalot, H. Navicula sensu stricto. 10 Genera separated from Navicula sensu lato. Frustulia. Diatoms of the European inland waters and comparable habitats. Diatoms Eur. 2001, 2, 1–526. [Google Scholar]
- Lange-Bertalot, H.; Cavacini, P.; Tagliaventi, N.; Alfinito, S. Diatoms of Sardinia. Rare and 76 new species in rock pools and other ephemeral waters. Iconogr. Diatomol. 2003, 12, 1–438. [Google Scholar]
- Lange-Bertalot, H.; Hofmann, G.; Werum, M.; Cantonati, M. Freshwater Benthic Diatoms of Central Europe: Over 800 Common Species Used in Ecological Assessment, English Edition with Updated Taxonomy and Added Species; Koeltz Botanical Books: Schmitten-Oberreifenberg, Germany, 2017; pp. 1–942. [Google Scholar]
- Werum, M.; Lange-Bertalot, H. Diatoms in springs from Central Europe and elsewhere under the influence of hydrologeology and anthropogenic impacts. Iconogr. Diatomol. 2004, 13, 1–417. [Google Scholar]
- Houk, V.; Klee, R.; Tanaka, H. Atlas of freshwater centric diatoms with a brief key and descriptions. Part III. Stephanodiscaceae A: Cyclotella. Tertiarius. Discostella. Fottea 2010, 10, 1–498. [Google Scholar]
- Levkov, Z.; Metzeltin, D.; Pavlov, A. “Luticola and Luticopsis”. Diatoms of the European Inland Waters and Comparable Habitats. Diatoms Eur. 2013, 7, 1–697. [Google Scholar]
- Wojtal, A.Z. Species composition and distribution of diatom assemblages in spring waters from various geological formations in Southern Poland. Bibl. Diatomol. 2013, 59, 1–436. [Google Scholar]
- Eloranta, P.; Soininen, J. Ecological status of some finish rivers evaluated using benthic diatom communities. J. Appl. Phycol. 2002, 14, 1–7. [Google Scholar] [CrossRef]
- Dumnicka, E.; Jelonek, M.; Klich, M.; Kwandrans, J.; Wojtal, A.; Żurek, R. Ichtiofauna i Status Ekologiczny wód Wisły, Raby, Dunajca i Wisłoki; Institute of Nature Conservation, Polish Academy of Science: Kraków, Poland, 2006; pp. 164–166. [Google Scholar]
- Çelekli, A.; Toudjani, A.A.; Gümüş, E.Y.; Kayhan, S.; Lekesiz, H.Ö.; Çetin, T. Determination of trophic weight and indicator values of diatoms in Turkish running waters for water quality assessment. Turk. J. Bot. 2019, 43, 90–101. [Google Scholar] [CrossRef]
- Prygiel, J.; Coste, M. Recent trends in monitoring French rivers using algae, especially diatoms. In Use of Algae for Monitoring Rivers II; Whitton, B.A., Rott, E., Eds.; Institut für Botanik. Universität Innsbruck: Schmitten, Austria, 1996; pp. 87–96. [Google Scholar]
- Lenoir, A.; Coste, M. Development of a practical diatom index of overall water quality applicable to the French National Water Board network. In The Use of Algae for Monitoring Rivers II.; Whitton, B.A., Rott, E., Eds.; Institut fϋr Botanik Universität Innsbruck: Schmitten, Austria, 1996; pp. 29–43. [Google Scholar]
- Steinberg, C.; Schiefele, S. Biological Indication of Trophy and Pollution of Running Waters. Z. Wasser Abwasser-Forsch. 1988, 21, 227–234. [Google Scholar]
- Schiefele, S.; Schreiner, C. Use of diatoms for monitoring nutrient enrichment acidification and impact salts in Germany and Austria. In Use of Algae for Monitoring Rivers; Whitton, B.A., Rott, E., Friedrich, G., Eds.; Institut fϋr Botanik Universität Innsbruck: Schmitten, Austria, 1999; pp. 1–193. [Google Scholar]
- Hürlimann, J.; Niederhauser, P. Méthode d’Analyse et d’Appréciation des Cours d’eau en Suisse, Diatomées, Niveau R Région; Office Fédéral de l’Environnement, des Forêts et du Paysage OFEFP: Berne, Switzerland, 2002; pp. 1–111. [Google Scholar]
- CEMAGREF. Etude des Méthods Biologiques Quantatatives d’Appréciation de la Qualité des Eaux. Rapport Division Qualité des Eaux Lyon; Agence Financiére de Bassin Rhône, Mediterranée-Corse: Lyon, French, 1982; pp. 1–218. [Google Scholar]
- Sládeček, V. Diatoms as indicators of organic pollution. Acta Hydrochim. Hydrobiol. 1986, 14, 555–566. [Google Scholar] [CrossRef]
- Descy, J.P. A new approach to water quality estimation using diatoms. Nova Hedwig. 1979, 64, 305–323. [Google Scholar]
- Leclerq, L.; Maquet, B. Deux nouveaux índices chimique et diatomique de qualité d’eau courante: Comparaison avec diérents indices existants. Cah. Biol. Mar. 1987, 28, 303–310. [Google Scholar]
- Coste, M.; Ayphassorho, H. Etude de la qualité des eaux du Bassin Artois-Piccardie á l’ aide des communautés des diatomées benthiques (application des indices diatomiques). In Rapport CEMAGREF, Bordeaux; Agence de l’Eau Artois-Picardie: Douai, France, 1991; pp. 1–227. [Google Scholar]
- Descy, J.P.; Coste, M. A test of methods for assessing water quality based on diatoms. Verh. Intern. Limnol. 1991, 24, 2112–2216. [Google Scholar] [CrossRef]
- Lobo, E.A.; Callegaro, V.L.M.; Hermany, G.; Bes, D.; Wetzel, C.A.; Oliveira, M.A. Use of epilithic diatoms as bioindicator from lotic systems in southern Brazil, with special emphasis on eutrophication. Acta Limnol. Bras. 2004, 16, 25–40. [Google Scholar]
- Rott, E.; Hofmann, G.; Pall, K.; Pfister, P.; Pipp, E. Indikationslisten für Aufwuchsalgen in Österreichischen Fliessgewässern, Teil 1: Saprobielle Indikation Wasserwirtschaftskataster; Bundeministerium für Land- und Forstwirtschaft: Wienna, Astralia, 1997; pp. 1–73. [Google Scholar]
- Rott, E.; Pfister, P.; Van Dam, H.; Pipp, E.; Pall, K.; Binder, N.; Ortler, K. Indikationslisten fϋr Aufwuchsalgen; Bundesministerium fϋr Land-und Forstwirtschaft: Wienna, Astralia, 1999; pp. 1–248. [Google Scholar]
- Watanabe, T.; Asai, K.; Houki, A. Numerical water quality monitoring of organic pollution using diatom assemblages. Sci. Total Environ. 1986, 55, 209–218. [Google Scholar] [CrossRef]
- Gomez, N.; Licursi, M. The Pampean Diatom Index (IDP) for assessment of rivers and streams in Argentina. Aquat. Ecol. 2001, 35, 173–181. [Google Scholar] [CrossRef]
- American Public Health Association. Standard Methods for the Examination of Water and Wastewater, 22nd ed.; Rice, E.W., Baird, R.B., Eaton, A.D., Eds.; Clesceri. American Public Health Association (APHA): Washington, DC, USA; American Water Works Association (AWWA): Denver, CO, USA; Water Environment Federation (WEF): Cologny, Switzerland, 2012; pp. 1–541. [Google Scholar]
- Taylor, J.C.; Janse van Vuuren, M.S.; Pieterse, A.J.H. The application and testing of diatom-based indices in the Vaal and Wilge Rivers. South Africa. Water SA 2007, 33, 51–60. [Google Scholar] [CrossRef] [Green Version]
- Zgrundo, A.; Bogaczewicz-Adamczak, B. Applicability of diatom indices for monitoring water quality in coastal streams in the Gulf of Gdansk Region. Northern Poland. Oceanol. Hydrobiol. Stud. 2004, 33, 31–46. [Google Scholar]
- Bere, T.; Tundisi, J.G. Applicability of the Pampean Diatom Index (PDI) to streams around São Carlos-SP. Brazil. Ecol. Indic. 2012, 13, 342–346. [Google Scholar] [CrossRef] [Green Version]
- El-Karim, M.S.A. Epipelic algal distribution in Ismailia Canal and the possible use of diatoms as bioindicators and a biomonitoring tool. Egypt. J. Aquat. Res. 2014, 40, 385–393. [Google Scholar] [CrossRef] [Green Version]
- Dell’Uomo, A.; Pensieri, A.; Corradetti, D. Diatomees epilithiques du fleuve Esino (Italia centrale) et leur utilisation pour l’evaluation de la qualite biologique de l’eau. Cryptogam. Algol. 1999, 20, 253–269. [Google Scholar] [CrossRef]
- Torrisi, M.; Dell’Uomo, A. Biological monitoring of some Apennine rivers (Central Italy) using the diatom-based Eutrophication/Pollution Index (EPI-D) compared to other European diatom indices. Diatom Res. 2006, 21, 159–174. [Google Scholar] [CrossRef]
- Noga, T.; Kochman, N.; Peszek, Ł.; Stanek-Tarkowska, J.; Pajączek, A. Diatoms (Bacillariophyceae) in rivers and streams and on cultivated soils of the Podkarpacie region in the years 2007–2011. Ecol. Eng. 2014, 15, 6–25. [Google Scholar]
- Martín, G.; Fernández, R.M. Diatoms as Indicators of Water Quality and Ecological Status: Sampling, Analysis and Some Ecological Remarks. In Ecological Water Quality-Water Treatment and Reuse; Vaudouris, K., Ed.; InTech: Rijeka, Croatia, 2012; pp. 183–204. [Google Scholar]
- Ector, L.; Wetzel, C.E.; Novais, M.H.; Guillard, D. Atlas des Diatomées des Rivières des Pays de la Loire et de la Bretagne; DREAL Pays de la Loire: Nantes, French, 2015; pp. 1–649. [Google Scholar]
- Kelly, M.; Bennion, H.; Burgess, A.; Ellis, J.; Juggins, S.; Guthrie, R.; Jamieson, J.; Adriaenssens, V.; Yallop, M. Uncertainty in ecological status assessments of lakes and rivers using diatoms. Hydrobiologia 2009, 633, 5–15. [Google Scholar] [CrossRef]
- Kelly, M.; Bennett, C.; Coste, M.; Delgado, C.; Delmas, F.; Denys, L.; Ector, L.; Fauville, C.; Ferréol, M.; Golub, M.; et al. A comparison of national approaches to setting ecological status boundaries in phytobenthos assessment for the European Water Framework Directive: Results of an intercalibration exercise. Hydrobiologia 2009, 621, 169–182. [Google Scholar] [CrossRef]
- Solak, C.N.; Ács, É. Water quality monitorıng in European and Turkısh rivers using diatoms. Turk. J. Fish. Aquat. Sc. 2011, 11, 329–337. [Google Scholar]
- Blanco, S.; Becares, E.; Cauchie, H.-M.; Hoffmann, L.; Ector, L. Comparison of biotic indices for water quality diagnosis in the Duero Basin (Spain). Arch. Hydrobiol. Suppl. 2007, 161, 267–286. [Google Scholar] [CrossRef]
- Descy, J.P.; Ector, L. Use of diatoms for monitoring rivers in Belgium and Luxemburg. In Use of Algae for Monitoring Rivers III; Prygiel, J., Whitton, B.A., Bukowska, J., Eds.; Agaence de l’Eau Artois-Picardie: Douai, French, 1999; pp. 128–137. [Google Scholar]
- Rimet, F.; Ector, L.; Cauchi, H.M.; Hoffmann, L. Regional distribution of diatom assemblages in the headwater streams of Luxembourg. Hydrobiologia 2004, 520, 105–117. [Google Scholar] [CrossRef]
- Ács, É.; Borics, G.; Fehér, G.; Kiss, K.T.; Reskóne, N.M.; Stenger-Kovács, C.S.; Vábríró, G. Implementation of the European Water Framework Directive to assessment the water quality of Hungarian running waters with diatoms. Diatomededelingen 2009, 33, 29–33. [Google Scholar]
- Vilbaste, S.; Truu, J.; Leisk, U.; Iital, A. Species composition and diatom indices in relation to environmental parameters in Estonian streams. Arch. Hydrobiol. Suppl. 2007, 17, 307–326. [Google Scholar] [CrossRef]
- Almeida, S.F.P. Use of diatoms for freshwater quality evaluation in Portugal. Limnetica 2001, 20, 205–213. [Google Scholar]
- Commission Decision (EU) 2018/229 of 12 February 2018, Establishing, Pursuant to Directive 2000/60/EC of the European Parliament and of the Council, the Values of the Member State Monitoring System Classifications as a Result of the Intercalibration Exercise and Repealing Commission Decision 2013/480/EU. Available online: https://eur-lex.europa.eu/legal-content/EN/TXT/?uri=CELEX%3A32018D0229 (accessed on 17 January 2020).
- Commission Decision (EU) 2005/646/EC of 17 August 2005 on the Establishment of a Register of Sites to Form the Intercalibration Network in Accordance with Directive 2000/60/EC of the European Parliament and of the Council. Available online: https://eur-lex.europa.eu/legal-content/GA/TXT/?uri=CELEX:32013D0480 (accessed on 17 January 2020).


| Index | Reference | Stressor Type Sensibility |
|---|---|---|
| Artois-Picardie Diatom Index (IDAP) | [56] | General pollution |
| Eutrophication/Pollution Index (EPI-D) | [15] | Pollution/trophc status |
| Biological Diatom Index (IBD) | [57] | General pollution |
| Steinberg and Schiefele’s Index (SHE) | [58,59] | Pollution/trophic status |
| Swiss Diatom Index (DI-CH) | [60] | Trophic status |
| Specific Pollution Sensitivity Index (IPS) | [61] | General pollution |
| Sládeček’s Index (SLA) | [62] | Saprobity (BOD) |
| Descy’s Index (DES) | [63] | General pollution |
| Louis-Leclercq Diatomic Index (IDSE) | [64] | Saprobity |
| Generic Diatom Index (IDG) | [65] | General pollution |
| Commission for Economical Community Metric—European Index (CEE) | [66] | General pollution |
| Trophic-Saprobic index (LOBO) | [67] | Eutrophication |
| Trophic Diatom Index (TDI) | [16] | Trophic status |
| Proportion of taxa tolerant to organic pollution % PT | [16] | Trophic status (Eutrophication) |
| Rott’s Saprobic Metric (ROTTs) | [68] | Saprobic status |
| Rott’s Trophc Metric (ROTTt) | [69] | Trophic status |
| Watanabe Index (WAT) | [70] | Saprobity (BOD) |
| Pampean Diatom Index (IDP) | [71] | Organic pollution/eutrophication |
| Index Score | Ecological Status | Trophy |
|---|---|---|
| >17 | high | oligotrophy |
| 15–17 | good | oligo-mesotrophy |
| 12–15 | moderate | mesotrophy |
| 9–12 | poor | meso-eutrophy |
| <9 | bad | eutrophy |
| Station Number | Temp. °C | pH | EC µS·cm−1 | DO mg·L−1 | BOD mg O2·L−1 | COD mg O2·L−1 | TOC mg·L−1 | TN mg·L−1 | NH4+ mg·L−1 | NO2− mg·L−1 | NO3− mg·L−1 | TP mg·L−1 | PO43− mg·L−1 |
|---|---|---|---|---|---|---|---|---|---|---|---|---|---|
| 1 | 20 | 8 | 620 | 8 | 4 | 7 | 3.93 | 2.26 | 0.078 | 0.1 | 1.43 | 0.22 | 0.238 |
| 2 | 18.7 | 7.7 | 568 | 7.3 | 3 | 9.8 | 3.52 | 1.56 | 0.078 | 0.077 | 0.89 | 0.44 | 0.646 |
| 3 | 17.4 | 8 | 540 | 8.8 | 1 | 14.4 | 3.99 | 1.11 | 0.06 | 0.07 | 1.41 | 0.17 | 0.308 |
| 4 | 18.2 | 8.1 | 667 | 8.7 | 1 | -- | -- | 2.2 | 0.05 | -- | 1.414 | 0.11 | -- |
| 5 | 18 | 8.2 | 818 | 8.5 | 2 | 12.4 | 3.96 | 2.31 | -- | 0.13 | 1.56 | -- | 0.693 |
| 6 | 15.8 | 8.4 | 1037 | 9.2 | 4 | 15.9 | 3.61 | 8.95 | 0.731 | <0.018 | 5.116 | 0.607 | 1.638 |
| 7 | 20.7 | 8.3 | 5910 | 11.3 | 30 | 35.3 | 2.46 | 10.71 | <0.047 | <0.018 | 8.482 | 0.467 | 1.236 |
| 8 | 19.2 | 8.1 | 2059 | 6 | 9 | 11.4 | 3.09 | 10.13 | <0.047 | <0.018 | 7.972 | 3.029 | 0.892 |
| 9 | 19.9 | 8.1 | 1570 | 7.6 | 4 | 6.9 | 1.76 | 2.66 | <0.047 | <0.018 | 1.723 | 0.032 | 0.057 |
| 10 | 21.1 | 8.2 | 1120 | 8.6 | 1 | -- | -- | 0.97 | -- | -- | 0.59 | 0.11 | -- |
| 11 | 19.6 | 8.1 | 910 | 8.1 | 1 | 5.7 | 2.63 | 0.79 | -- | 0.08 | 0.505 | 0.21 | 0.401 |
| 12 | 22.3 | 8.2 | 1637 | 13.8 | 3 | -- | -- | 0.57 | -- | -- | 0.212 | 0.05 | -- |
| 13 | 16.9 | 8.1 | 189 | 9.8 | 1 | -- | -- | 2.17 | -- | -- | 0.73 | 0.04 | -- |
| 14 | 20.1 | 8 | 571 | 8.1 | 1 | 9.1 | -- | 4.01 | 0.1 | -- | 2.01 | 0.18 | 0.39 |
| 15 | 17.5 | 7.6 | 693 | 4.1 | 9 | 23 | 8.71 | 6.07 | 2.71 | 0.48 | 1.079 | 1.66 | 1.258 |
| 16 | 16.5 | 8 | 722 | 9.9 | 3 | 3.8 | 2.27 | 0.44 | -- | -- | -- | -- | -- |
| 17 | 19.2 | 8.1 | 416 | 8.9 | 2 | 3.2 | 1.68 | 0.78 | -- | -- | 0.54 | 0.24 | 0.05 |
| 18 | 16.9 | 7.2 | 311 | 4.2 | 5 | 16.1 | 7.39 | 1.24 | 0.271 | 0.159 | 0.457 | 0.358 | <0.260 |
| 19 | 16.6 | 8.1 | 376 | 9 | 2 | -- | -- | 7.98 | 0.046 | -- | 1.45 | 0.06 | -- |
| 20 | 17.6 | 7.9 | 372 | 8.5 | 2 | -- | -- | 1.87 | 0.09 | -- | 1.49 | 0.05 | -- |
| 21 | 16.4 | 8.2 | 346 | 10.2 | 3 | 17.8 | 4.81 | 2.48 | 0.008 | 0.09 | 1.07 | -- | 0.281 |
| 22 | 16.3 | 7.7 | 593 | 3.8 | 9 | 23.6 | 9.86 | 3.34 | 0.661 | 1.128 | 8.243 | 0.827 | 0.863 |
| 23 | 16.2 | 8.2 | 405 | 8.7 | 4 | 18.8 | 6.39 | 3.74 | 0.778 | 0.22 | 1.46 | -- | 0.36 |
| 24 | 17.2 | 8.5 | 510 | 8.9 | 1 | <5.00 | 1.52 | 1.29 | <0.047 | <0.018 | 0.895 | 0.019 | 0.02 |
| 25 | 13.9 | 7.5 | 300 | 9.6 | 4 | 4.9 | 3.34 | 1.1 | <0.047 | <0.018 | 0.635 | 0.051 | 0.095 |
| 26 | 17.2 | 8.5 | 387 | 10.8 | 9 | 10.5 | 4.22 | 1.56 | 0.227 | 0.021 | 1.281 | 0.103 | 0.266 |
| 27 | 17 | 7.9 | 2790 | 9.7 | 1 | -- | -- | 10.81 | -- | -- | 9.816 | 0.091 | 0.186 |
| 28 | 23 | 7.7 | 1294 | 4.1 | 31 | -- | -- | 13.24 | 15.14 | -- | -- | 1.97 | -- |
| 29 | 21.8 | 7.8 | 1426 | 2.2 | 70 | 106.9 | 8.11 | 19.95 | 11.96 | <0.018 | 1.833 | 2.056 | 5.703 |
| 30 | 19.9 | 7.8 | 1379 | 0.6 | 80 | 118.7 | 7.2 | 8.9 | 5.01 | <0.018 | 2.287 | 0.742 | 1.928 |
| 31 | 17.2 | 8.2 | 503 | 7.6 | 1 | 9.2 | 3.07 | 3.36 | -- | -- | 3.07 | 0.58 | 0.923 |
| 32 | 17.5 | 7.9 | 907 | 11.2 | 4 | -- | -- | 2.48 | -- | -- | 0.871 | 0.142 | 0.345 |
| 33 | 18.9 | 7.6 | 1269 | 2.3 | -- | -- | -- | 30.31 | 4.028 | -- | 1.275 | 1.176 | 3.195 |
| 34 | 19.8 | 7.9 | 1021 | 6.2 | <1 | 18 | 5.66 | 3.29 | <0.047 | <0.018 | 1.273 | 0.034 | 0.069 |
| 35 | 16 | 7.9 | 466 | 7.3 | 2 | 15.4 | 6.36 | 1.596 | 0.33 | 0.086 | 0.79 | 0.36 | 0.495 |
| 36 | 12.7 | 8.1 | 481 | 9.1 | 5 | 11.4 | 4.01 | 1.52 | -- | 0.025 | 1.034 | 0.11 | 0.181 |
| 37 | 17.4 | 7.7 | 592 | 3.5 | 3 | 20.4 | 4.77 | 1.22 | 0.12 | 0.28 | 0.045 | 0.22 | 0.108 |
| 38 | 18 | 8.4 | 489 | 12.1 | 4 | 11 | 3.41 | 0.35 | -- | 0.037 | 0.17 | 0.07 | 0.107 |
| 39 | 18.9 | 8 | 1633 | 8.9 | 4 | 6.4 | 1.42 | 2.84 | <0.047 | <0.018 | 2.181 | 0.029 | 0.045 |
| 40 | 23 | 8.4 | 1297 | 10.6 | 7 | -- | -- | 6.5 | 0.741 | -- | 5.579 | 0.076 | 0.146 |
| 41 | 17.3 | 8 | 1182 | 7.7 | 1 | -- | -- | 2.29 | -- | -- | 1.82 | 0.54 | -- |
| 42 | 21.7 | 8.2 | 1065 | 8.9 | 1 | 5.8 | 3.06 | 1.42 | -- | 0.06 | 1.03 | 0.33 | 0.14 |
| 43 | 17 | 7.5 | 802 | 3.6 | 1 | 6.5 | 1.42 | 0.68 | -- | 0.06 | 0.276 | 0.16 | 0.355 |
| 44 | -- | -- | -- | -- | -- | -- | -- | -- | -- | -- | -- | -- | -- |
| 45 | 17.5 | 8.1 | 413 | 7.5 | 4 | 19.9 | 4.63 | 1.25 | <0.100 | <0.100 | 4.702 | 0.22 | -- |
| 46 | 19.2 | 8.4 | 362 | 7.2 | 4 | -- | -- | 0.28 | -- | -- | -- | 0.074 | -- |
| Achnanthidium pyrenaicum | F. pygmaea | Neidiomorpha binodiformis |
| Adlafia minuscula | Fistulifera saprophila | Nitzschia acicularis |
| A. minuscula var. muralis | Fragilaria famelica | N. amphibia |
| Amphipleura pellucida | F. tenera | N. archibaldii |
| Amphora copulata | Frustulia vulgaris | N. capitellata |
| A. inariensis | Geissleria decussis | N. clausii |
| A. ovalis | Gomphonema calcifugum | N. communis |
| A. pediculus | G. exillissimum | N. dissipata |
| Aneumastus minor | G. italicum | N. dubia |
| Anomoeoneis sphaerophora | G. minutum | N. filiformis |
| Asterionella formosa | G. olivaceum | N. fonticola |
| Aulacoseira ambigua | G. parvulum | N. frustulum |
| A. granulata var. angustissima | G. subclavatum | N. hantzschiana |
| Bacillaria paxillifera | Gi tergestinum | N. heufleriana |
| Brachysira procera | G. truncatum | N. inconspicua |
| Caloneis amphisbaena | Gyrosigma attenuatum | N. intermedia |
| C. lancettula | G. kuetzingii | N. linearis |
| C. silicula | G. obtusatum | N. media |
| Cocconeis pediculus | G. sciotense | N. microcephala |
| C. placentula | Halamphora montana | N. palea |
| C. placentula var. lineata | H. veneta | N. pusilla |
| C. pseudolineata | Hantzschia amphioxys | N. radicula |
| Conticribra weissflogii | Hippodonta capitata | N. recta |
| Craticula accomoda | Humidophila contenta | N. sociabilis |
| C. ambigua | Karayevia clevei | N. solita |
| C. buderi | K. pleonensis | N. subtilis |
| C. molesta | Lemnicola hungarica | N. thermaloides |
| C. subminuscula | Lindavia balatonis | N. umbonata |
| Ctenophora pulchella | Luticola mutica | N. wuellerstroffii |
| Cyclostephanos dubius | L. nivalis | Pantocsekiella ocellata |
| C. invisitatus | L. ventricosa | Pinnularia brebissonii |
| Cyclotella atomus | L. similis | Planothidium lanceolatum |
| C. cryptica | Mayamaea atomus | Pseudostaurosira brevistriata |
| C. meneghiniana | Melosira varians | Reimeria sinuata |
| Cymatopleura solea | Meridion circulare | R. uniseriata |
| C. solea var. apiculata | Navicula antonii | Rhoicosphenia abbreviata |
| Cymbella compacta | N. capitatoradiata | Rhopalodia gibba |
| C. excisa | N. cari | Sellaphora pupula |
| C. neocistula | N. caterva | S. radiosa |
| C. neolanceolata | N. cincta | S. seminulum |
| C. tumida | N. cryptocephala | S. saugerressii |
| Cymbopleura amphicephala | N. cryptofallax | Stauroneis separanda |
| C. vrana | N. cryptotenella | S. smithii |
| Denticula kutzingii | N. cryptotenelloides | Staurophora tackei |
| Diadesmis confervaceae | N. erifuga | Staurosira construens |
| Diatoma ehrenbergii | N. germainii | Stephanodiscus hantzschii |
| D. mesodon | N. gottlandica | S. minutulus |
| D. moniliformis | N. gregaria | S. neoastreae |
| D. tenuis | N. kotschyi | Surirella angusta |
| D. vulgaris | N. lacuum | S. brebissonii |
| Diploneis oculata | N. lanceolata | S. gracilis |
| D. separanda | N. novaesiberica | S. minuta |
| Discostella stelligera | N. oblonga | S. neglecta |
| Ellerbeckia arenaria | N. phylleptosoma | S. ovalis |
| Encyonema caespitosum | N. radiosa | Tabularia fasciculata |
| E. lacustre | N. reichardtiana | Tryblionella angustata |
| E. minutum | N. rostellata | T. angustatula |
| E. silesiacum | N. salinarum | T. apiculata |
| E. ventricosum | N. simulata | T. brunoi |
| Encyonopsis minuta | N. tripunctata | T. calida |
| E. subminuta | N. trivialis | T. debilis |
| Entomoneis paludosa var. subsalina | N. upsaliensis | T. hungarica |
| Epithemia adnata | N. vandamii | Ulnaria acus |
| E. sorex | N. vilaplanii | U. biceps |
| Fallacia lenzii | N. veneta | U. nanana |
| Station No. | IDAP | EPI-D | IBD | SHE | DI-CH | WAT | IPS | SLA | DES | IDSE/5 | IDG | CEE | TDI/20 | %PT | LOBO | IDP | ROTTt | ROTTs | TIT | H’ | Evenness |
|---|---|---|---|---|---|---|---|---|---|---|---|---|---|---|---|---|---|---|---|---|---|
| 1 | 14.2 | 11.2 | 12.5 | 13.7 | 11.3 | 12.3 | 15.7 | 11.9 | 19.5 | 13.6 | 12.3 | 12.8 | 2.9 | 18.2 | 16.3 | 10.6 | 5.3 | 13.0 | 3.1 | 2.92 | 0.65 |
| 2 | 8.7 | 7.4 | 4.5 | 9.1 | 7.2 | 10.7 | 6.7 | 9.1 | 17.2 | 9.3 | 9.1 | 3.7 | 12.3 | 11.8 | 9.1 | 4.5 | 10.5 | 3.2 | 2.28 | 0.47 | |
| 3 | 12.4 | 9.7 | 10.7 | 12.7 | 9.2 | 11.8 | 14.0 | 10.8 | 18.8 | 12.8 | 10.3 | 12.2 | 2.5 | 29.3 | 16.4 | 9.6 | 4.8 | 12.3 | 3.7 | 2.82 | 0.85 |
| 4 | 10.8 | 7.2 | 10.3 | 8.6 | 6.3 | 11.5 | 9.6 | 9.8 | 16.5 | 9.5 | 8.2 | 11.1 | 1.8 | 16.8 | 11.3 | 8.5 | 5.5 | 9.2 | 2.7 | 3.31 | 0.72 |
| 5 | 12.9 | 8.7 | 7.9 | 2.9 | 6.8 | 12.4 | 11.5 | 8.9 | 17.0 | 9.0 | 10.2 | 9.6 | 4.7 | 14.6 | 11.6 | 10.3 | 6.5 | 13.3 | 3.0 | 3.59 | 0.75 |
| 6 | 5.9 | 0.3 | 4.8 | 3.3 | 3.9 | 9.0 | 4.1 | 6.6 | 5.4 | 6.4 | 6.0 | 3.1 | 2.4 | 41.4 | 6.0 | 6.9 | 2.2 | 5.7 | 2.8 | 2.55 | 0.69 |
| 7 | 6.4 | 6.1 | 5.9 | 4.4 | 3.3 | 6.4 | 3.8 | 7.7 | 2.0 | 6.9 | 3.2 | 3.9 | 3.1 | 60.5 | 20.0 | 2.2 | 4.0 | 6.4 | 2.8 | 2.07 | 0.74 |
| 8 | 13.7 | 10.5 | 9.9 | 14.5 | 8.5 | 16.9 | 12.8 | 10.8 | 15.1 | 12.0 | 10.9 | 11.5 | 4.2 | 15.9 | 14.6 | 6.2 | 5.9 | 12.1 | 2.9 | 2.80 | 0.63 |
| 9 | 14.1 | 11.8 | 10.3 | 14.9 | 9.4 | 16.3 | 14.7 | 11.1 | 15.5 | 12.0 | 12.5 | 12.2 | 6.7 | 9.4 | 19.4 | 10.5 | 6.4 | 12.6 | 2.9 | 2.99 | 0.65 |
| 10 | 12.1 | 15.1 | 16.4 | 16.2 | 16.0 | 14.6 | 16.4 | 10.1 | 16.1 | 12.4 | 15.3 | 15.4 | 11.1 | 7.9 | 10.5 | 11.2 | 8.7 | 15.4 | 3.0 | 3.36 | 0.68 |
| 11 | 14.2 | 14.3 | 11.9 | 15.9 | 13.6 | 12.9 | 14.3 | 11.9 | 19.2 | 13.1 | 13.4 | 13.9 | 8.1 | 5.3 | 11.8 | 10.6 | 6.7 | 15.7 | 2.7 | 2.99 | 0.59 |
| 12 | 7.9 | 7.3 | 8.3 | 9.8 | 7.5 | 12.3 | 6.8 | 11.3 | 14.5 | 9.3 | 5.5 | 10.3 | 3.1 | 73.5 | 9.9 | 6.9 | 3.0 | 11.0 | 3.4 | 3.29 | 0.69 |
| 13 | 13.2 | 12.2 | 13.8 | 13.3 | 13.0 | 16.7 | 15.6 | 11.8 | 18.7 | 12.8 | 10.8 | 14.7 | 4.9 | 17.5 | 12.1 | 10.2 | 6.6 | 13.3 | 3.6 | 2.90 | 0.65 |
| 14 | 11.7 | 11.5 | 18.4 | 9.1 | 7.4 | 17.4 | 13.6 | 11.5 | 17.0 | 10.2 | 12.1 | 11.8 | 8.8 | 5.8 | 2.1 | 10.3 | 7.9 | 10.8 | 3.5 | 2.02 | 0.44 |
| 15 | 10.1 | 8.6 | 10.6 | 11.5 | 7.9 | 11.9 | 10.3 | 9.4 | 13.6 | 10.1 | 10.5 | 9.4 | 4.8 | 41.7 | 12.4 | 8.6 | 3.9 | 10.9 | 2.8 | 4.40 | 0.83 |
| 16 | 13.1 | 14.2 | 15.4 | 14.2 | 13.9 | 17.8 | 16.6 | 13.2 | 18.2 | 13.6 | 10.9 | 13.9 | 6.0 | 10.7 | 18.9 | 13.9 | 8.4 | 14.0 | 3.9 | 2.39 | 0.54 |
| 17 | 10.3 | 7.1 | 8.4 | 8.7 | 5.0 | 8.1 | 5.9 | 8.8 | 8.4 | 8.2 | 6.4 | 4.8 | 2.8 | 50.8 | 17.9 | 4.7 | 4.3 | 8.1 | 3.0 | 3.23 | 0.65 |
| 18 | 9.5 | 7.0 | 8.8 | 11.4 | 8.5 | 13.6 | 10.0 | 9.7 | 15.9 | 10.5 | 11.5 | 11.6 | 7.2 | 10.1 | 6.3 | 9.1 | 5.0 | 11.1 | 2.7 | 3.42 | 0.68 |
| 19 | 13.3 | 10.0 | 11.5 | 11.9 | 9.4 | 14.1 | 13.1 | 11.3 | 18.9 | 11.2 | 10.2 | 12.2 | 2.6 | 25.1 | 9.4 | 9.8 | 6.1 | 12.1 | 2.9 | 3.78 | 0.75 |
| 20 | 11.5 | 8.1 | 11.9 | 9.8 | 8.1 | 13.0 | 11.2 | 9.2 | 16.8 | 10.5 | 10.8 | 10.9 | 3.2 | 26.0 | 10.5 | 9.2 | 4.9 | 10.5 | 2.5 | 3.99 | 0.83 |
| 21 | 13.1 | 10.8 | 10.8 | 12.8 | 9.1 | 12.9 | 14.9 | 13.0 | 18.5 | 13.1 | 8.4 | 13.5 | 2.8 | 25.7 | 13.7 | 10.8 | 5.7 | 12.5 | 3.6 | 2.66 | 0.68 |
| 22 | 10.1 | 8.5 | 10.1 | 8.5 | 5.3 | 14.5 | 10.3 | 9.5 | 12.2 | 9.8 | 12.8 | 9.4 | 2.5 | 47.7 | 10.2 | 5.7 | 4.4 | 9.4 | 2.8 | 3.12 | 0.68 |
| 23 | 12.4 | 10.5 | 9.5 | 12.4 | 7.8 | 17.1 | 12.6 | 12.3 | 18.9 | 12.8 | 7.2 | 11.8 | 0.9 | 20.4 | 1.8 | 6.1 | 11.8 | 3.9 | 1.38 | 0.36 | |
| 24 | 14.3 | 14.9 | 14.0 | 18.8 | 16.7 | 10.7 | 15.6 | 10.2 | 16.7 | 12.0 | 16.9 | 11.6 | 8.0 | 0.2 | 2.1 | 13.0 | 10.8 | 13.7 | 3.1 | 2.36 | 0.62 |
| 25 | 15.0 | 14.1 | 11.7 | 19.3 | 15.7 | 11.5 | 15.4 | 9.8 | 18.1 | 14.2 | 13.9 | 14.3 | 8.5 | 0.3 | 11.3 | 8.1 | 12.6 | 14.1 | 3.0 | 1.67 | 0.44 |
| 26 | 3.7 | 1.7 | 2.6 | 2.5 | 3.5 | 9.4 | 2.1 | 7.5 | 5.7 | 4.8 | 3.0 | 3.7 | 4.3 | 75.1 | 19.1 | 7.8 | 1.7 | 5.3 | 3.9 | 1.59 | 0.42 |
| 27 | 10.5 | 9.6 | 8.2 | 11.8 | 8.3 | 14.6 | 12.7 | 13.6 | 16.8 | 11.3 | 4.9 | 11.5 | 0.8 | 55.2 | 2.4 | 13.6 | 6.1 | 12.1 | 3.9 | 1.73 | 0.55 |
| 28 | 1.9 | 1.8 | 3.7 | 1.4 | 3.2 | 6.2 | 1.2 | 7.6 | 1.2 | 5.4 | 1.8 | 3.7 | 3.4 | 90.1 | 19.6 | 2.3 | 2.4 | 3.8 | 3.1 | 1.62 | 0.45 |
| 29 | 1.7 | 2.4 | 1.2 | 2.3 | 1.8 | 2.6 | 1.7 | 5.0 | 1.3 | 1.6 | 7.9 | 4.2 | 1.1 | 7.1 | 3.1 | 4.5 | 1.7 | 3.5 | 3.9 | 1.59 | 0.53 |
| 30 | 2.8 | 2.9 | 2.9 | 5.1 | 2.4 | 3.2 | 2.8 | 4.6 | 1.0 | 4.2 | 8.0 | 5.6 | 0.7 | 0.5 | 15.2 | 4.6 | 1.8 | 6.2 | 3.9 | 1.40 | 0.54 |
| 31 | 2.7 | 3.1 | 3.0 | 2.8 | 2.4 | 2.5 | 2.5 | 5.8 | 2.2 | 2.9 | 6.7 | 4.6 | 1.2 | 29.2 | 12.3 | 4.3 | 2.3 | 4.3 | 3.7 | 2.22 | 0.67 |
| 32 | 5.9 | 4.1 | 11.1 | 2.7 | 5.0 | 2.3 | 6.0 | 6.0 | 15.4 | 6.1 | 7.5 | 9.6 | 1.1 | 0.8 | 5.4 | 9.3 | 5.7 | 3.6 | 2.3 | 1.13 | 0.36 |
| 33 | 1.4 | 1.3 | 2.0 | 1.1 | 3.1 | 8.3 | 1.1 | 7.0 | 1.2 | 4.1 | 2.8 | 1.3 | 4.2 | 76.0 | 4.6 | 4.6 | 1.5 | 3.6 | 4.0 | 1.07 | 0.46 |
| 34 | 5.8 | 7.7 | 6.1 | 13.8 | 12.3 | 10.6 | 7.8 | 8.6 | 10.8 | 14.9 | 7.0 | 14.5 | 2.7 | 3.5 | 1.0 | 11.3 | 15.7 | 1.1 | 1.84 | 0.55 | |
| 35 | 11.3 | 10.4 | 9.0 | 14.5 | 7.9 | 15.7 | 11.4 | 12.4 | 13.2 | 11.7 | 6.4 | 11.8 | 3.6 | 19.0 | 17.5 | 9.8 | 4.0 | 12.6 | 3.3 | 3.09 | 0.74 |
| 36 | 12.0 | 9.7 | 8.7 | 13.7 | 10.7 | 11.2 | 11.0 | 10.9 | 17.2 | 11.2 | 11.4 | 12.8 | 1.4 | 51.1 | 14.6 | 10.6 | 3.6 | 11.7 | 3.1 | 2.02 | 0.49 |
| 37 | 6.2 | 6.1 | 6.3 | 6.3 | 5.3 | 8.2 | 5.0 | 7.8 | 6.3 | 6.6 | 6.2 | 5.8 | 3.9 | 50.0 | 19.6 | 4.2 | 3.8 | 8.3 | 3.0 | 3.76 | 0.73 |
| 38 | 14.3 | 11.6 | 13.4 | 13.2 | 11.2 | 16.0 | 15.4 | 13.0 | 18.6 | 13.8 | 11.7 | 13.9 | 4.0 | 13.9 | 8.0 | 12.0 | 6.8 | 12.9 | 2.4 | 3.65 | 0.74 |
| 39 | 7.6 | 14.3 | 14.4 | 18.9 | 8.6 | 16.2 | 9.0 | 17.6 | 10.2 | 17.6 | 10.7 | 16.5 | 3.6 | 13.7 | 9.6 | 7.7 | 15.4 | 2.9 | 2.82 | 0.61 | |
| 40 | 6.5 | 6.7 | 7.2 | 9.3 | 7.2 | 9.9 | 4.8 | 7.5 | 8.6 | 8.2 | 6.3 | 4.2 | 3.3 | 58.9 | 9.0 | 5.7 | 5.1 | 10.6 | 2.5 | 2.65 | 0.62 |
| 41 | 12.2 | 12.4 | 9.9 | 14.5 | 12.0 | 14.5 | 14.1 | 10.7 | 16.0 | 11.5 | 11.3 | 11.5 | 4.8 | 10.3 | 15.7 | 9.8 | 6.0 | 13.3 | 2.8 | 4.09 | 0.79 |
| 42 | 12.1 | 11.4 | 10.9 | 13.4 | 8.6 | 12.3 | 12.3 | 9.5 | 15.1 | 11.3 | 10.6 | 7.8 | 7.7 | 22.4 | 14.9 | 8.8 | 5.0 | 12.5 | 2.8 | 4.55 | 0.85 |
| 43 | 15.8 | 13.8 | 10.0 | 14.3 | 15.0 | 10.9 | 13.3 | 14.0 | 16.3 | 13.5 | 13.4 | 14.9 | 12.6 | 1.0 | 12.8 | 7.9 | 17.9 | 1.6 | 2.40 | 0.56 | |
| 44 | 3.0 | 2.8 | 4.5 | 2.6 | 3.5 | 3.5 | 2.7 | 5.6 | 1.6 | 3.7 | 7.8 | 2.9 | 1.7 | 11.9 | 1.9 | 4.4 | 2.7 | 3.6 | 3.7 | 2.47 | 0.67 |
| 45 | 6.8 | 11.4 | 11.4 | 13.6 | 8.0 | 10.8 | 11.1 | 7.8 | 14.1 | 8.3 | 13.5 | 5.6 | 9.0 | 15.4 | 12.3 | 9.1 | 4.2 | 10.8 | 3.1 | 3.79 | 0.74 |
| 46 | 11.4 | 13.4 | 13.0 | 15.2 | 10.4 | 10.5 | 15.1 | 8.3 | 15.3 | 12.5 | 15.2 | 8.4 | 11.7 | 3.4 | 9.2 | 13.1 | 8.2 | 14.0 | 2.8 | 3.53 | 0.73 |
| Diatom Index | Altitude | Temp. | pH | EC | O2 | BOD5 | COD | TOC | Total N | NH4+ | NO2− | NO3− | Total P | PO43− | SO42− | Cl− |
|---|---|---|---|---|---|---|---|---|---|---|---|---|---|---|---|---|
| IDAP | −0.32 * | −0.34 * | 0.09 | −0.24 | 0.34 * | −0.57 ** | −0.60 ** | −0.36 * | −0.57 ** | −0.61 ** | 0.01 | −0.18 | −0.32 * | −0.58 ** | −0.13 | −0.30 |
| EPI-D | −0.07 | −0.18 | 0.08 | −0.17 | 0.28 | −0.49 ** | −0.53 ** | −0.41 * | −0.57 ** | −0.55 ** | −0.04 | −0.17 | −0.37 * | −0.56 ** | −0.09 | −0.22 |
| IBD | −0.26 | −0.15 | 0.13 | −0.26 | 0.39 ** | −0.55 ** | −0.56 ** | −0.35 | −0.58 ** | −0.56 ** | 0.10 | −0.19 | −0.40 * | −0.59 ** | −0.13 | −0.25 |
| SHE | −0.02 | −0.23 | 0.03 | −0.20 | 0.23 | −0.45 ** | −0.47 ** | −0.32 | −0.54 ** | −0.56 ** | −0.14 | −0.17 | −0.34 * | −0.55 ** | −0.18 | −0.28 |
| DI-CH | −0.03 | −0.25 | 0.02 | −0.26 | 0.26 | −0.50 ** | −0.53 ** | −0.40 * | −0.52 ** | −0.50 ** | −0.19 | −0.32 | −0.40 * | −0.54 ** | −0.22 | −0.34 |
| IPS | −0.22 | −0.30 * | 0.10 | −0.26 | 0.31 * | −0.53 ** | −0.55 ** | −0.33 | −0.55 ** | −0.58 ** | −0.02 | −0.17 | −0.36 * | −0.56 ** | −0.20 | −0.33 |
| SLA | −0.37 * | −0.29 | 0.02 | −0.14 | 0.35 * | −0.55 ** | −0.59 ** | −0.27 | −0.40 ** | −0.51 ** | 0.02 | −0.11 | −0.29 | −0.53 ** | −0.16 | −0.29 |
| DES | −0.33 * | −0.36 * | 0.08 | −0.36 * | 0.44 ** | −0.65 ** | −0.61 ** | −0.23 | −0.61 ** | −0.62 ** | 0.01 | −0.25 | −0.44 ** | −0.62 ** | −0.31 | −0.44* |
| IDSE | −0.23 | −0.27 | 0.04 | −0.22 | 0.32 * | −0.59 ** | −0.59 ** | −0.25 | −0.56 ** | −0.61 ** | −0.02 | −0.17 | −0.37 * | −0.65 ** | −0.14 | −0.27 |
| IDG | 0.01 | −0.20 | −0.02 | −0.33 * | 0.01 | −0.27 | −0.28 | −0.23 | −0.50 ** | −0.40 * | 0.08 | −0.21 | −0.25 | −0.30 | −0.27 | −0.35 |
| CEE | −0.23 | −0.32 * | −0.09 | −0.27 | 0.26 | −0.46 ** | −0.42 * | −0.14 | −0.55 ** | −0.49 ** | −0.04 | −0.30 | −0.35 * | −0.53 ** | −0.27 | −0.35 |
| TDI | 0.19 | 0.08 | −0.08 | −0.09 | −0.01 | −0.28 | −0.40 * | −0.47 ** | −0.30 | −0.25 | −0.16 | −0.22 | −0.23 | −0.28 | 0.03 | −0.08 |
| %PT | −0.13 | 0.16 | 0.04 | 0.28 | 0.04 | 0.02 | −0.13 | 0.08 | 0.39 * | 0.33 | 0.32 | 0.30 | 0.19 | 0.08 | 0.25 | 0.25 |
| LOBO | −0.07 | 0.06 | 0.11 | 0.14 | 0.09 | 0.08 | −0.08 | −0.21 | −0.20 | 0.02 | −0.03 | −0.01 | 0.09 | −0.21 | 0.26 | 0.25 |
| ROTTt | 0.03 | −0.16 | 0.02 | −0.14 | 0.26 | −0.44 ** | −0.45 * | −0.38 * | −0.45 ** | −0.45 * | −0.15 | −0.17 | −0.39 * | −0.52 ** | −0.06 | −0.14 |
| ROTTs | −0.13 | −0.17 | 0.04 | −0.19 | 0.22 | −0.52 ** | −0.54 ** | −0.33 | −0.57 ** | −0.64 ** | −0.10 | −0.20 | −0.40 * | −0.59 ** | −0.16 | −0.29 |
| WAT | −0.40 * | −0.23 | 0.09 | −0.19 | 0.28 | −0.55 * | −0.58 * | −0.07 | −0.35 * | −0.60 * | 0.22 | 0.01 | −0.18 | −0.48 * | −0.15 | −0.30 |
| TIT | −0.24 | −0.08 | 0.10 | −0.01 | −0.01 | 0.30 | 0.32 | 0.15 | 0.31 * | 0.28 | −0.04 | 0.07 | 0.19 | 0.37 * | −0.13 | −0.03 |
| IDP | −0.15 | −0.37 * | 0.16 | −0.34 * | 0.34 * | −0.52 * | −0.49 * | −0.32 | −0.50 * | −0.57 * | −0.21 | −0.27 | −0.51 * | −0.49 * | −0.41 * | −0.51 * |
| H’ | −0.18 | 0.03 | 0.10 | −0.21 | 0.11 | −0.40 ** | −0.35 | 0.01 | −0.46 ** | −0.40 * | 0.30 | −0.15 | −0.15 | −0.32 | −0.12 | −0.24 |
| E | −0.14 | 0.06 | 0.17 | 0.02 | 0.08 | −0.22 | −0.12 | 0.03 | −0.28 | −0.35 | 0.19 | 0.03 | −0.09 | −0.12 | 0.16 | 0.09 |
| n | 45 | 44 | 44 | 44 | 44 | 43 | 31 | 30 | 44 | 28 | 27 | 41 | 40 | 33 | 29 | 29 |
© 2020 by the authors. Licensee MDPI, Basel, Switzerland. This article is an open access article distributed under the terms and conditions of the Creative Commons Attribution (CC BY) license (http://creativecommons.org/licenses/by/4.0/).
Share and Cite
Solak, C.N.; Peszek, Ł.; Yilmaz, E.; Ergül, H.A.; Kayal, M.; Ekmekçi, F.; Várbíró, G.; Yüce, A.M.; Canli, O.; Binici, M.S.; et al. Use of Diatoms in Monitoring the Sakarya River Basin, Turkey. Water 2020, 12, 703. https://doi.org/10.3390/w12030703
Solak CN, Peszek Ł, Yilmaz E, Ergül HA, Kayal M, Ekmekçi F, Várbíró G, Yüce AM, Canli O, Binici MS, et al. Use of Diatoms in Monitoring the Sakarya River Basin, Turkey. Water. 2020; 12(3):703. https://doi.org/10.3390/w12030703
Chicago/Turabian StyleSolak, Cüneyt Nadir, Łukasz Peszek, Elif Yilmaz, Halim Aytekin Ergül, Melih Kayal, Fatih Ekmekçi, Gábor Várbíró, Arzu Morkoyunlu Yüce, Oltan Canli, Mithat Sinan Binici, and et al. 2020. "Use of Diatoms in Monitoring the Sakarya River Basin, Turkey" Water 12, no. 3: 703. https://doi.org/10.3390/w12030703