Article

Assessment of Spatial Variation in River Water Quality of the Baiyangdian Basin (China) during Environmental Water Release Period of Upstream Reservoirs

1
Beijing Key Laboratory of Urban Hydrological Cycle and Sponge City Technology, College of Water Sciences, Beijing Normal University, Beijing 100875, China
2
School of Environment, Beijing Normal University, Beijing 100875, China
3
Hebei Provincial Laboratory of Water Environmental Science, Hebei Provincial Academy of Environmental Science, Shijiazhuang 050051, China
*
Author to whom correspondence should be addressed.
Water 2020, 12(3), 688; https://doi.org/10.3390/w12030688
Submission received: 2 February 2020 / Revised: 27 February 2020 / Accepted: 29 February 2020 / Published: 3 March 2020

Abstract

:
Baiyangdian Lake, the largest freshwater body in Northern China, is facing water shortage and eutrophication problems that threaten the lake’s ecosystem. Environmental water releases from upstream reservoirs to the lake are important measures to provide the freshwater resources demanded by the lake ecosystem. However, knowledge is limited regarding the influences of such water allocations on the water quality of the upstream rivers that receive the reservoir water and transport it into Baiyangdian Lake. To improve our understanding of possible influences of environmental water releases from upstream reservoirs, the spatial variation of water quality in rivers upstream of the lake during environmental water release periods from reservoirs was explored in this study. Water samples were collected along the two routes of water allocation: the WangKuai reservoir route (WKR) and the XiDaYang reservoir route (XDYR) and water quality parameters related to organic pollutants, nitrogen and phosphorus were analyzed. In the WKR, the pollutant concentrations generally increased from upstream to downstream. Chemical oxygen demand, total nitrogen, and total phosphorous at the sampling site closest to Baiyangdian Lake could not meet the water quality target of the water function zone. For the XDYR, pollutant concentrations peaked downstream of the major urban region of Baoding city and then decreased or remained at a similar level further downstream and only the total nitrogen concentration was worse than the target. The dissimilarities in spatial variation patterns of water quality may be caused by the different spatial distribution of wastewater treatment plants in the two routes.

1. Introduction

Baiyangdian Lake is the largest freshwater lake in Northern China. To keep the aquatic ecosystem of the lake in good condition, it is necessary to maintain its water level to meet the requirement to sustain aquatic biodiversity [1,2,3,4,5]. Because of the construction of reservoirs in upstream rivers for water supply and flood control [6,7] and excessive water use for industries, agriculture and human daily life [8,9,10], most rivers that flow into the lake have dried out in the past few decades [11]. The freshwater resource entering the lake has thus reduced and correspondingly the lake water level has decreased and water surface area shrunk. Facing the problem of water resource storage, environmental water allocations to the lake have been implemented, for which the sources of water include upstream reservoirs, the Yellow River and the middle route of the South-to-North Water Diversion Project, through which freshwater is transferred from the Yangtze River to North China to alleviate the water shortage problems. However, the discharge of domestic and industrial wastewater from upstream rivers led to high nutrient loads [12,13] in the lake, causing eutrophication issues. Therefore, to optimize the operation of environmental water allocations to Baiyangdian Lake, besides considering the influences on water quantity, it is also necessary to evaluate the impact on water quality because the water allocations change hydrodynamic conditions of both the lake and its upstream rivers.
Previous studies have mainly focused on the influences of environmental water allocation from upstream reservoirs on its target—Baiyangdian Lake. Yang and Yang [14], Yang et al. [15], and Han et al. [16] examined the changes in lake water quality after environmental flow releases based on observational data. Tang et al. [17] and Zheng et al. [18] used hydrodynamic models coupled with water quality models to explore changes in lake water quality under different water allocation scenarios. Yang et al. [19] explored the relationship between water level and the ecosystem services value for human. Yang et al. [20] implemented the AQUATOX model to understand how the lake biota reacted to the changes in water levels and water quality. These studies revealed that lake water quality and ecosystem health are generally improved by such water allocation. Although the upstream rivers are the important medium for the environmental water transportation from reservoirs to the lake and major sources of pollutants to the lake, how such water allocations influence these rivers, especially from the aspect of river water quality, remains unclear.
As a region of facing severe water scarcity, many studies have also focused on operating schemes to optimize environmental water allocations in the Baiyangdian Basin. Zhang et al. [21] computed the environmental water demand for maintaining the basic functions of the ecosystem. Chen et al. [22], Yang et al. [23], and Yin and Yang [24] conducted optimal reservoir operation schemes to meet the needs of socioeconomic development and environment water demand. These studies mainly deal with the competition of water resources between human society and ecosystems, but few studies have incorporated the demands of water quality improvement into the optimization of the environmental water allocation schemes.
This study focused on the rivers that receive environmental water from WangKuai and XiDaYang reservoirs and transport these waters to Baiyangdian Lake. The aim was to identify river segments that exhibit water quality problems during the period of environmental water allocation and explore their possible causes. During the environmental water allocation period of the spring season of 2019, water samples were taken to explore the spatial distribution of organic and nutrient pollutants and their influencing factors. The findings of this study are expected to provide new insights for making effective pollution control strategies. In addition, they are essential for producing an optimal environmental water allocation scheme to improve water quality. The knowledge gained from this study may be also useful for decision-making in the environmental protection and water resource management of similar lakes in the arid or semiarid region requiring external water allocation to meet the environmental water demands.

2. Materials and Methods
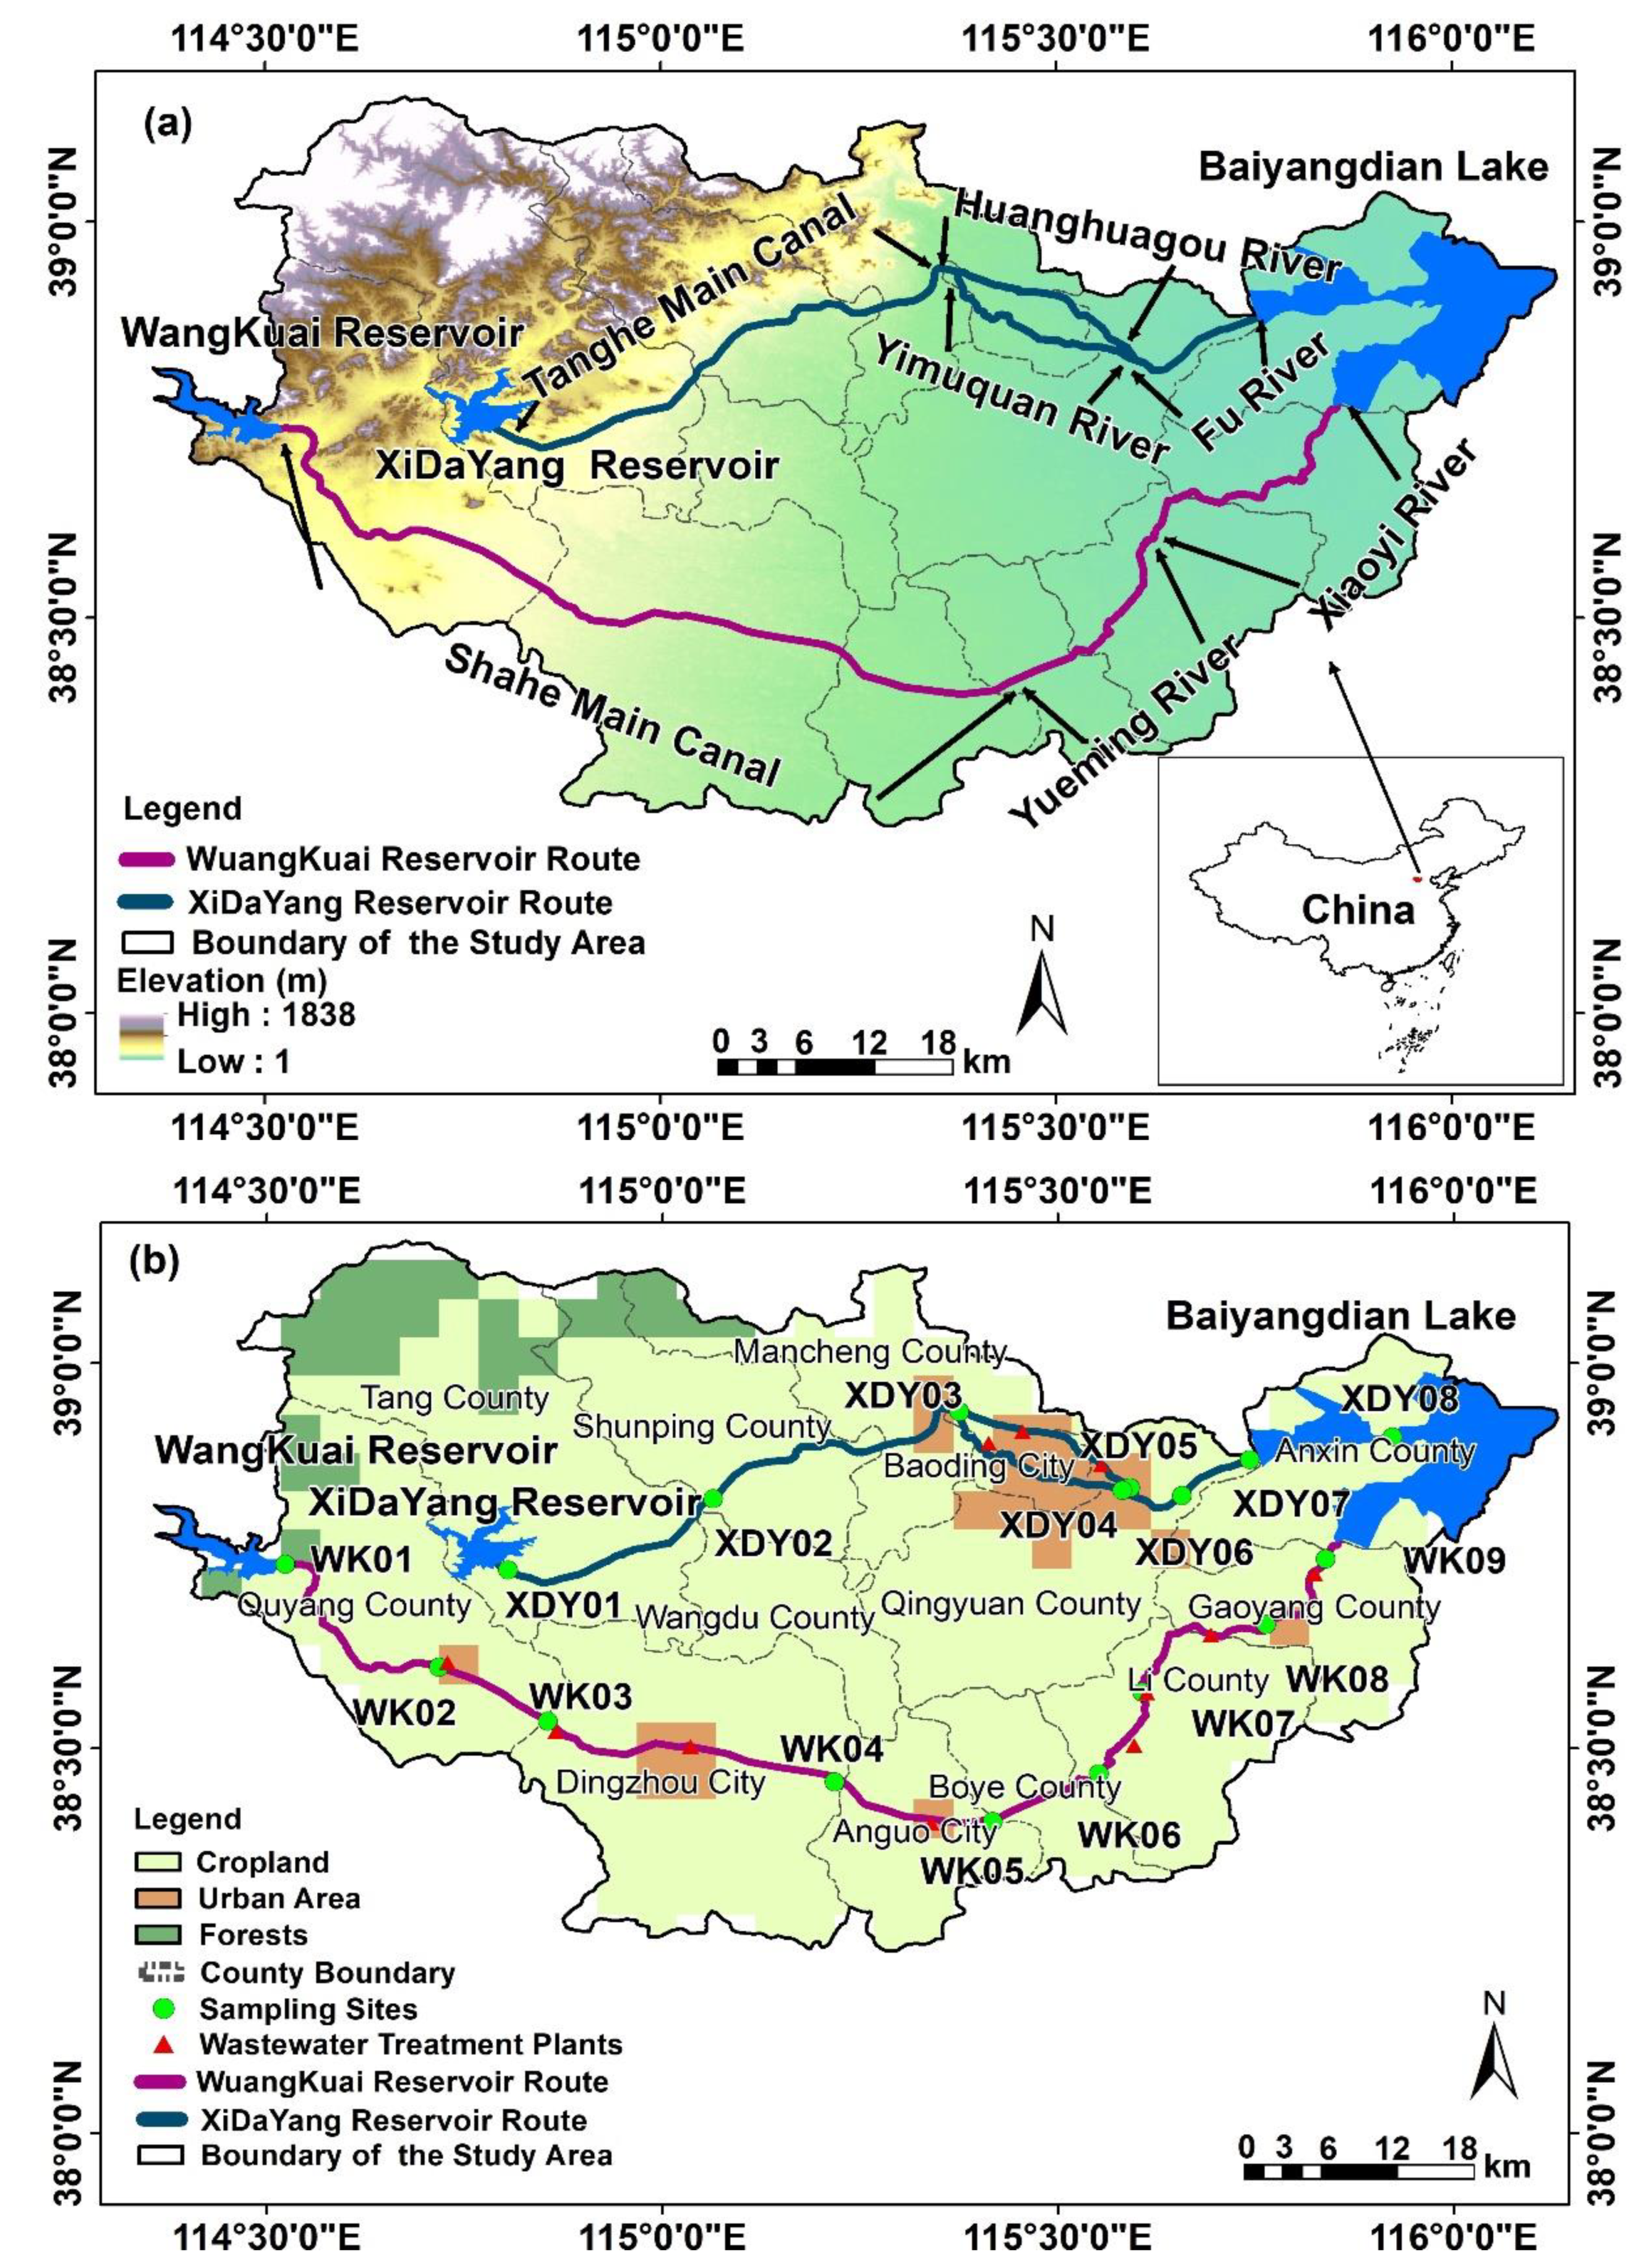
2.1. Study Area

Baiyangdian Lake, which is located in the Xiong’an New Area of Hebei province, China, is the largest freshwater shallow lake in the North China Plain. The lake is located on the east side of Taihang Mountain in a low-lying area between the Yongding River alluvial fan and the Wei River alluvial fan. The lake is composed of more than 100 small and shallow lakes connected by thousands of ditches. The basin has a warm temperate continental monsoon climate, with an annual mean temperature of 7.3–12.7 °C. The annual precipitation is around 550 mm and 80% of it occurs in July and August. The study area has a plain topography (Figure 1a). The stratum is composed of loose deposits of the Quaternary and it becomes thicker from the west to the east. The sediments include sand, clay or interlayers of sand and clay. This region is mainly covered by cropland, followed by an urban area, and forest in the northwest part (Figure 1b).
Nine upstream tributaries used to flow into Baiyangdian Lake, but most of them have recently dried up due to climate change and over-extraction of water resources for social and economic development [16,23]. When there is no environmental water allocation, only water from Fu River and Xiaoyi River (Figure 1a) enters the lake, which is mainly the treated wastewater discharged from the Baoding city and Gaoyang county. Based on the Hebei Province Ecology and Environment Condition Statement for 2018, the eutrophication level of the lake is mild. In recent years, environmental water allocation from the Yellow River and the South-to-North Water Diversion Project has been conducted mainly in the autumn and winter seasons. The water allocation from upstream areas is usually carried out in spring seasons. This is effective to raise the lake water level and generally improve its water quality [16].
For the spring of 2019, environmental water allocation from the reservoirs was conducted from March 25 to July 10 via two routes: the WangKuai reservoir route (WKR) and the XiDaYang reservoir route (XDYR) (Figure 1b). In the WKR, the freshwater released from the reservoir flows through Shahe Main Canal, Yueming River, and Xiaoyi River, and then flows into Baiyangdian Lake. The flow rate entering the lake is 3 m3/s. The total length of this route is about 170 km and the water flows through the urban region of several cities and counties of the prefecture-level city of Baoding, with a total population of 3.36 million. In the XDYR, the freshwater of the reservoir flows through Tanghe Main Canal, and then it enters the highly populated main urban region of Baoding city (population: 2.88 million) and flows through Huanghuagou and Yimuquan Rivers, which converge in the downstream area of this large urban region. The river water then flows into Fu River and finally reaches Baiyangdian Lake. The flow rate entering the lake is 6 m3/s. The total length of the XDYR is about 110 km. Besides being used as environmental water in the lake, the allocated water is also used for irrigation along the two routes. Most effluents from industries and wastewater from human daily life enter wastewater treatment plants (WWTPs), which are the major point source of pollution. As shown in Figure 1b, WWTPs along the XDYR are mainly located in urban region of Baoding city. In the XDYR, WWTPs of these cities and counties are scattered along this route.

2.2. Sample Collection

The field sampling was carried out on April 14–16, 2019, during the period of environmental water release from the two reservoirs. Nine river water samples were taken along the WKR. Of these, WK01, WK02, WK03, WK04, and WK05 were located on Shahe Main Canal, WK06 and WK07 samples were selected from Yueming River, and WK08 and WK09 were along Xiaoyi River. Eight samples were taken along the XDYR, among which XDY01, XDY02, and XDY03 were collected upstream of Baoding city and the remaining sampling points were located downstream of the city. In addition, XDY04 and XDY05 were taken in the river segments downstream the urban area of Baoding city, whereas XDY06, XDY07, and XDY08 were taken from the reaches of Fu River.

2.3. Sample Analysis

Previous studies [16,25] have shown that organic pollutants and nutrients are the main pollutants of Baiyangdian Lake water. Therefore, in this study, water quality parameters characterizing these pollutants were analyzed (Table 1). All samples were stored in polythene bottles and kept at 4 °C for analysis within 24 h. The pH and electrical conductivity (EC) were determined by a portable water quality analyzer (Orion520M-01A, ThermoFisher, USA) at the sampling sites and all other parameters were analyzed in the laboratory. For organic pollutants, chemical oxygen demand (COD) and biological oxygen demand over 5 days (BOD5) were analyzed. Total organic carbon (TOC), a comprehensive parameter to analyze organic carbon in water samples, was also included. For nitrogen, total nitrogen (TN), nitrate (NO3), nitrite (NO2), and ammonium nitrogen (NH4-N) were analyzed. Dissolved inorganic nitrogen (DIN) was computed as the sum of nitrogen in NO3-N, NO2-N, and NH4-N based on Lim et al. [26]. For phosphorous, total phosphorous (TP), dissolved total phosphorus (DTP) and dissolved orthophosphate (PO43−) were analyzed in the laboratory. Particulate phosphorus (PP) was computed as the difference between TP and DTP. Similarly, dissolved organic phosphorus (DOP) was treated as the difference between DTP and PO43−. When the value of the water quality parameter was below the detection limit, the detection limit value was used as the measured value for further analysis, based on the suggestion of Spahr and Wynn [27].
The Environmental Quality Standards for Surface Water of the People’s Republic of China (EQSSWC, standard number: GB3838-2002) was used to make an objective evaluation of the contamination condition of the water sample. It divides water quality into five classes. From Class I to V, the water quality become worse (Table 2). Class I is the best and applies to sources of drinking water and national natural protection area. Class V is the worst and applies to water use for agriculture and scenery. Based on the water quality target of water function zone in Baoding city, the sampling points closest to Baiyangdian Lake in the two routes (i.e., XDY08 and WK09) should reach Class III.

3. Results

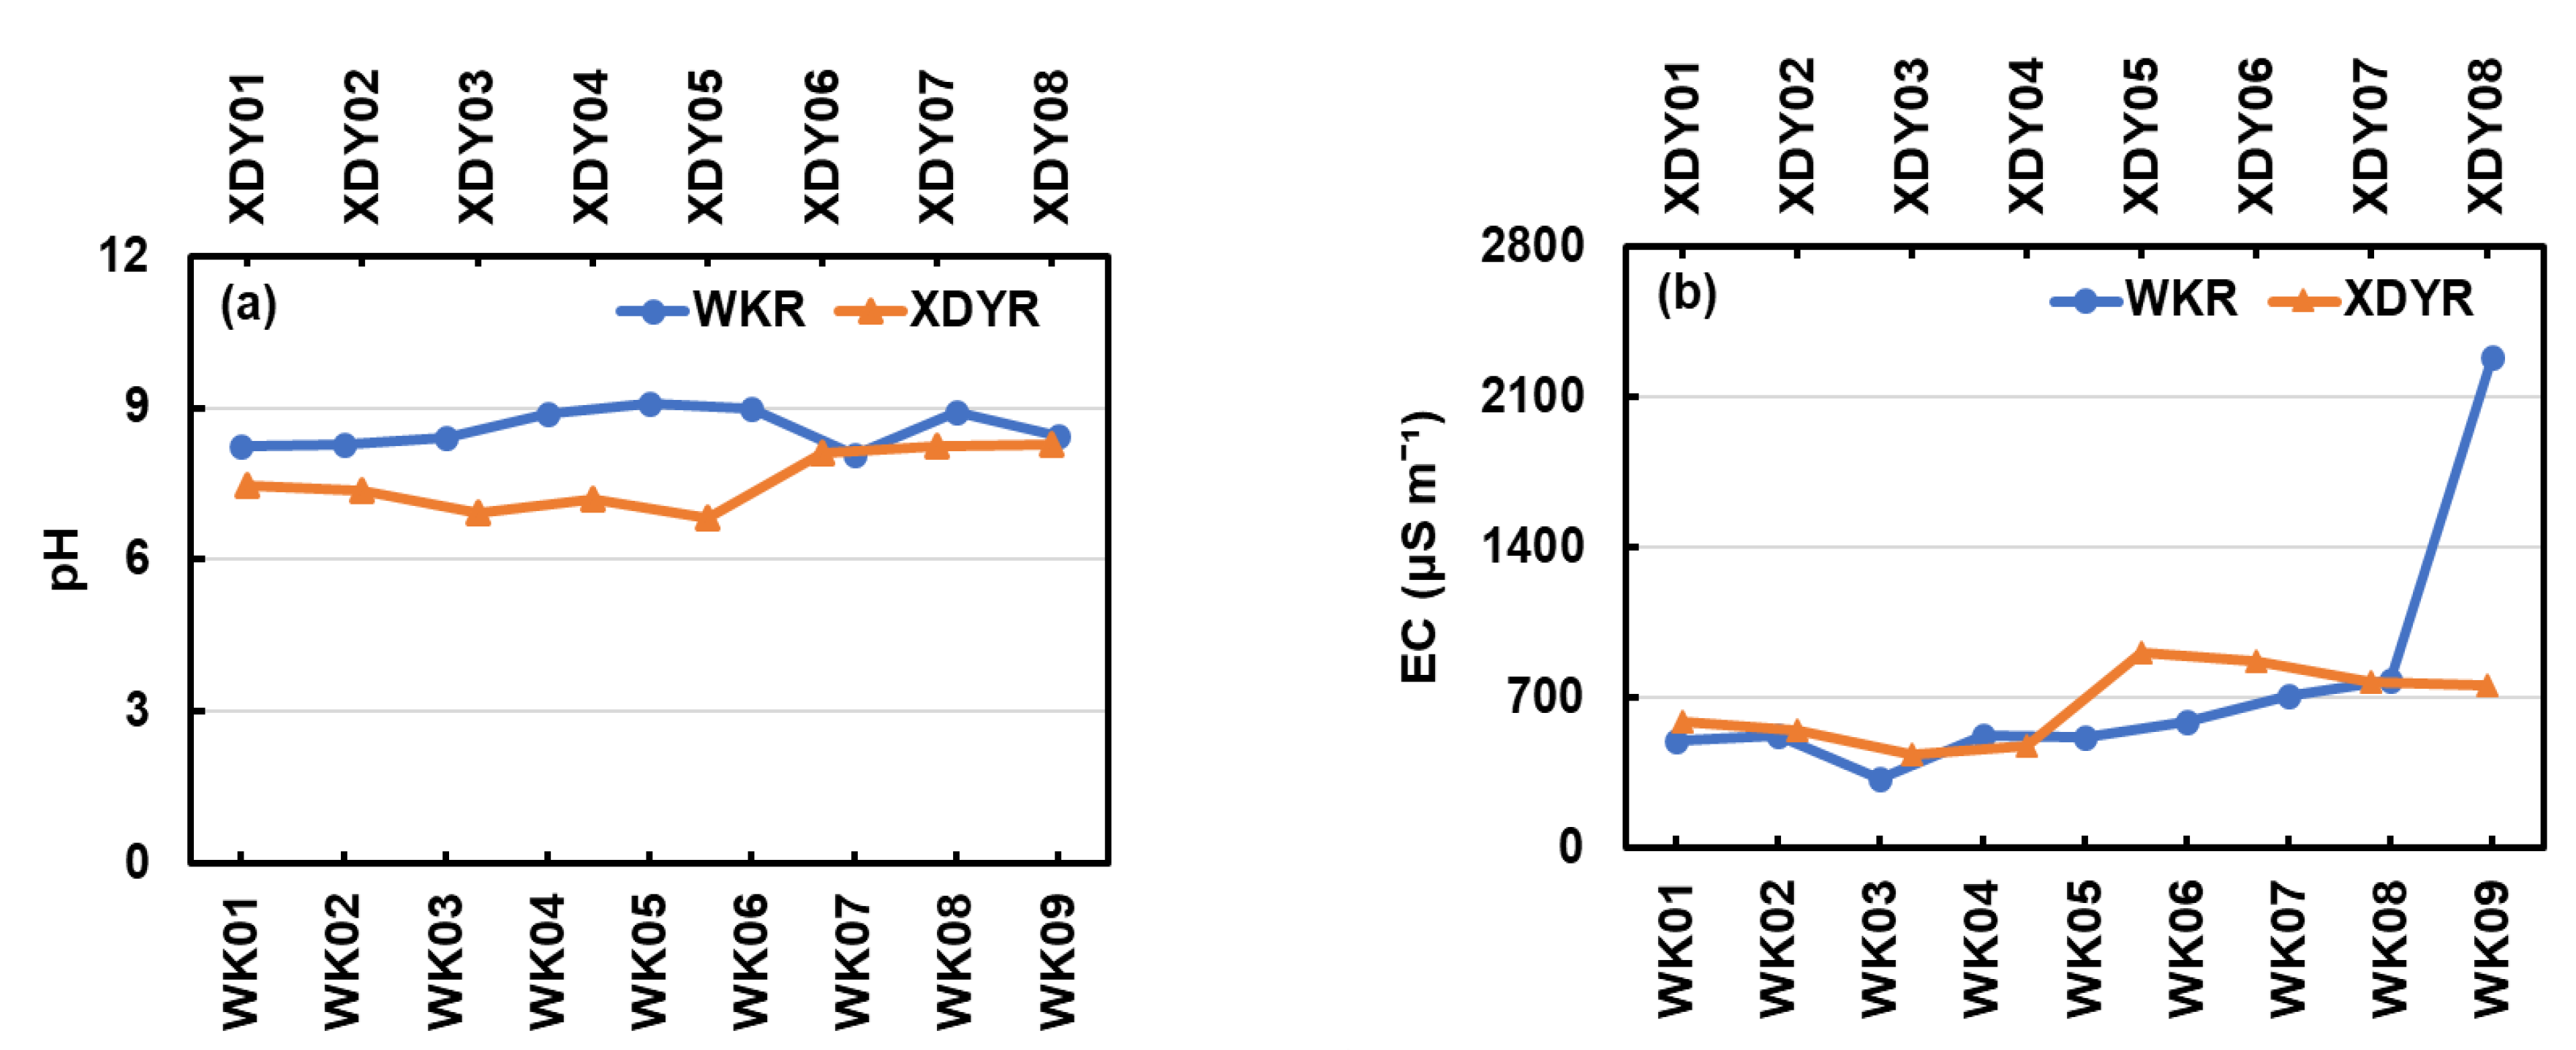
3.1. Spatial Variations of Water Quality Parameters Measured on Site

Spatial variations of pH and EC are shown in Figure 2a,b, respectively. Along the WKR, river water was alkaline, in the range of 8.07–9.07, while water samples collected along the XDYR were in the weakly acid or alkaline range (6.82–8.27) (Figure 2a). EC reflects the amount of inorganic dissolved solids in water and is an important index to measure overall water quality. There was a rising trend in EC concentration observed along the WKR. EC values were all less than 800 μS cm−1, except the sampling site at downstream of Xiaoyi River (WK09) (2286 μS cm−1). Along the XDYR, EC increased gradually and reached the peak at the sampling point downstream of urban area of Baoding city (XDY05) and then remained at a similar level downstream.

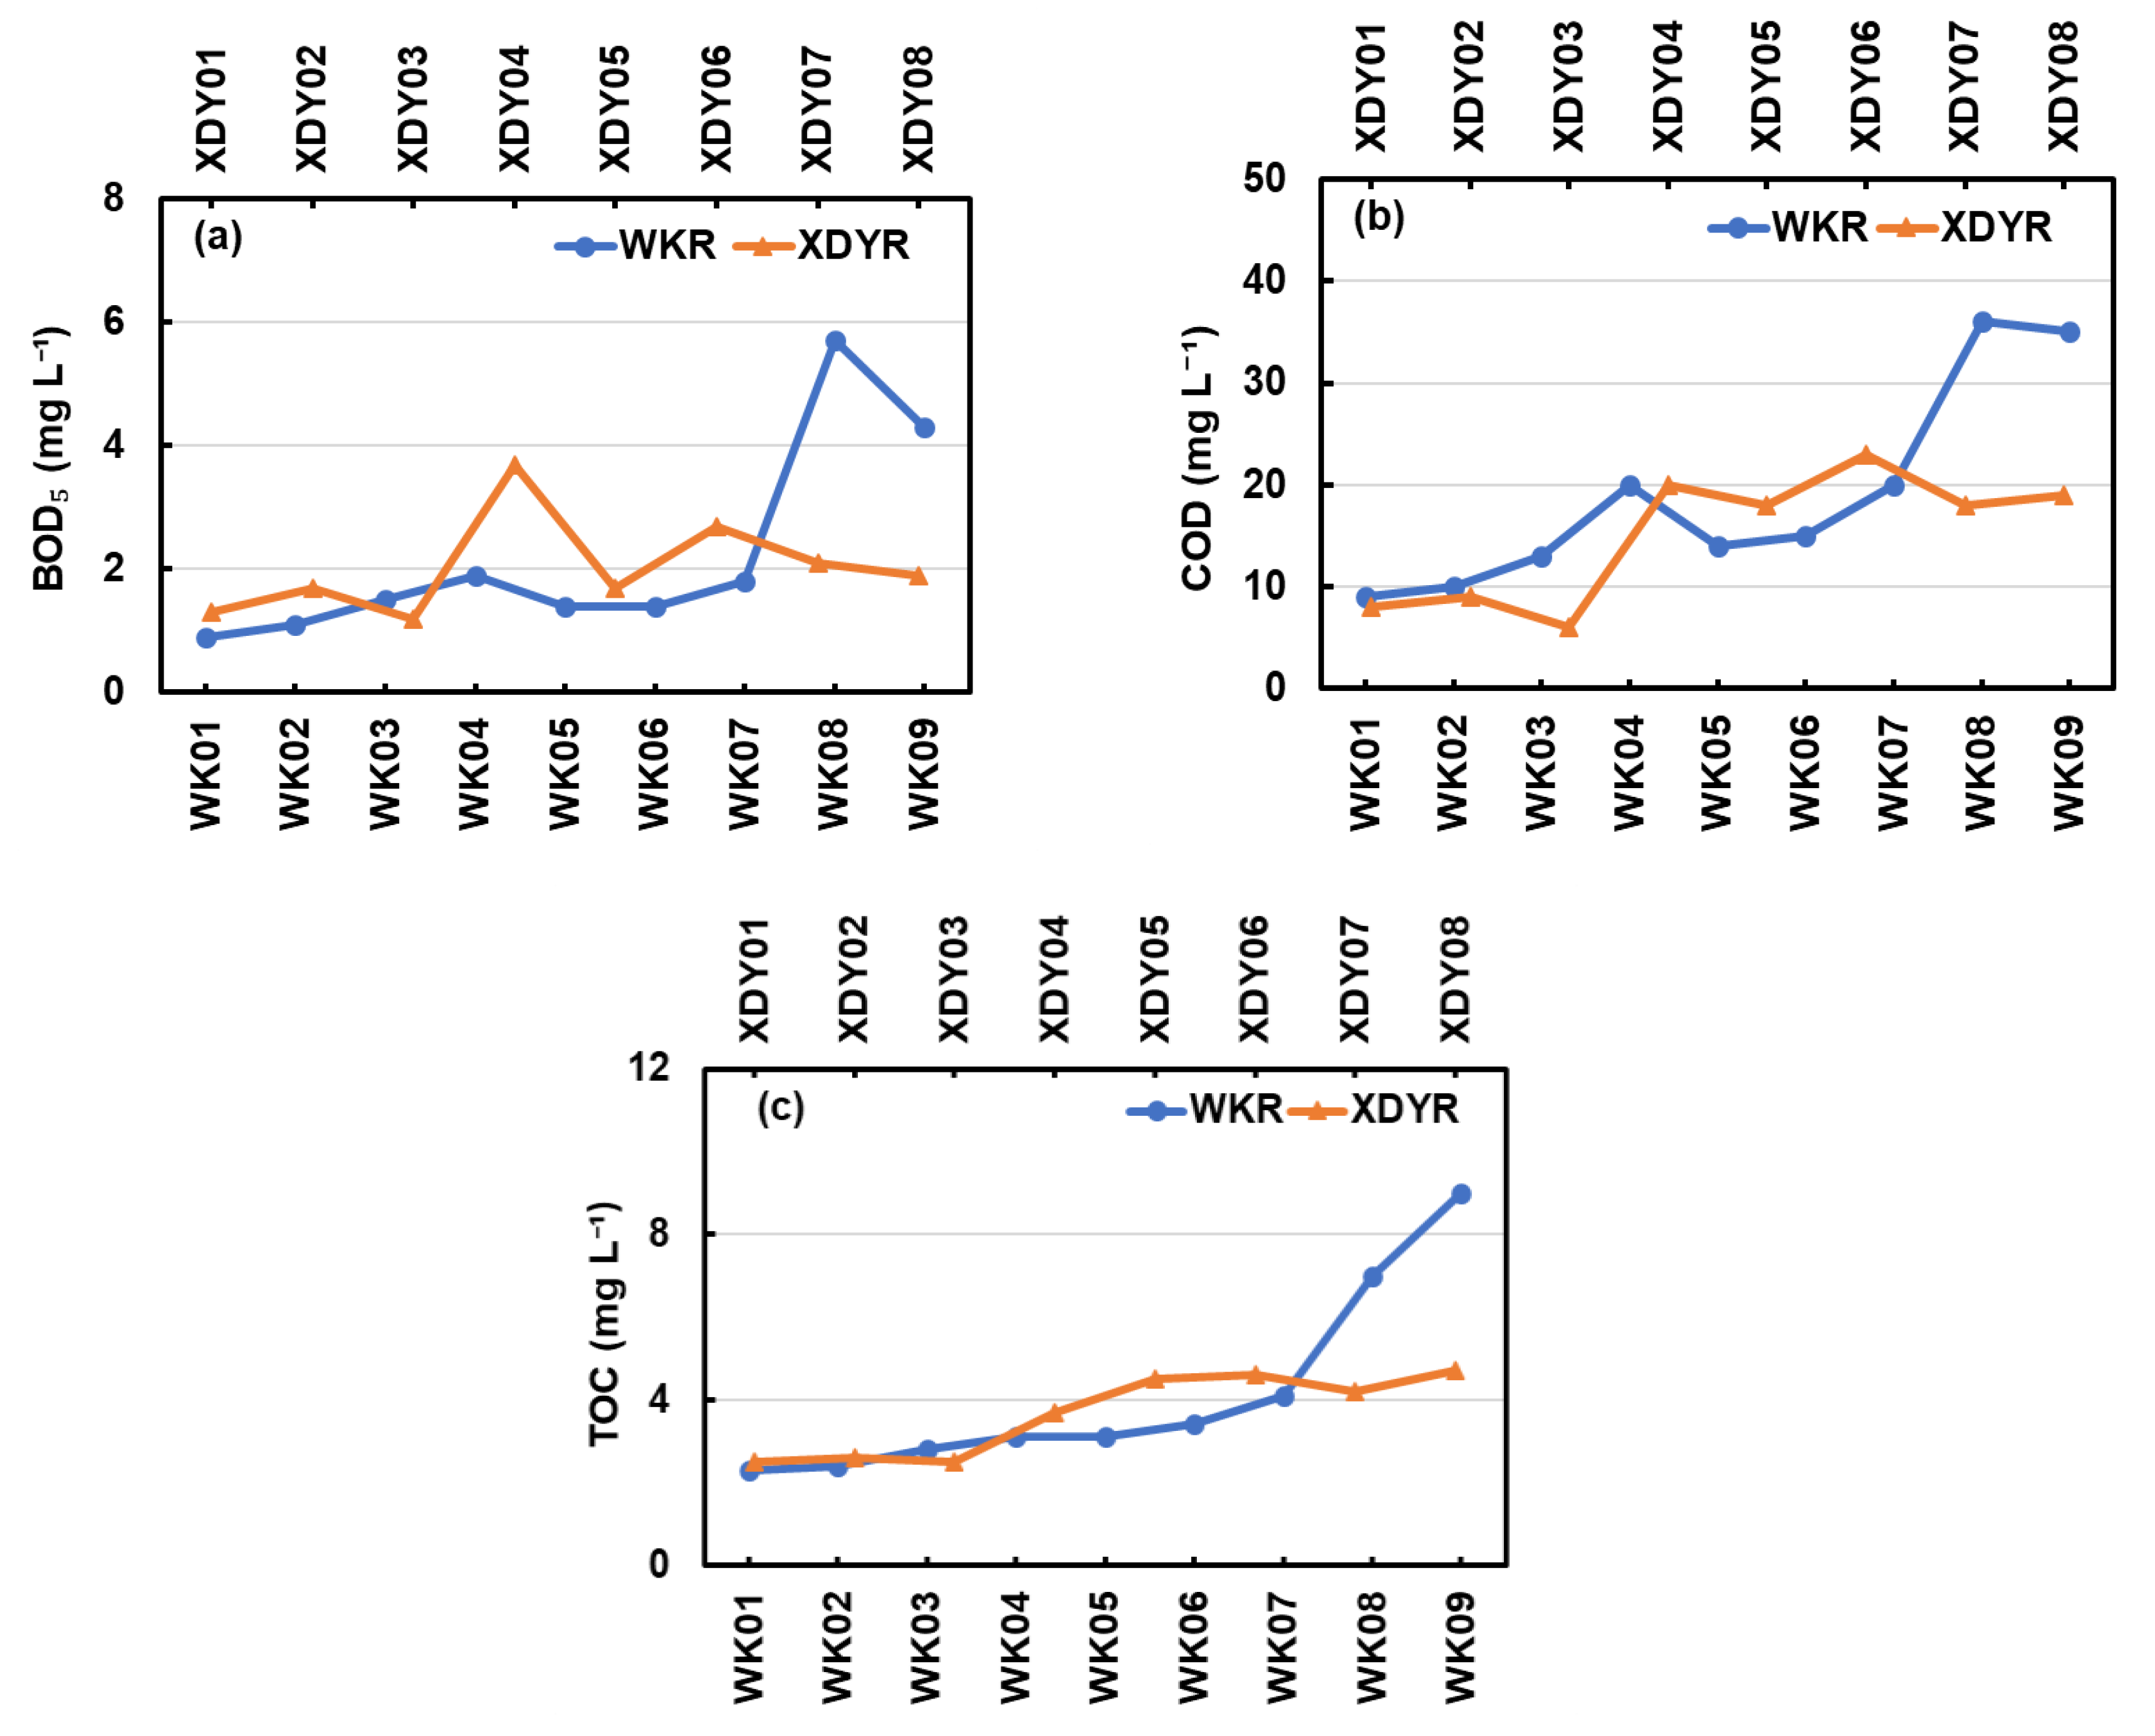
3.2. Spatial Variations of Water Quality Parameters Related to Organic Pollutants

Along the WKR, BOD5 presented an upward trend when moving downstream (Figure 3a). Two water samples collected at Xiaoyi River (WK08 and 09) showed relatively higher values and were graded as Class IV. COD gradually increased along the sampling route, with a sudden increase to 36 mg L−1 at WK08 and 35 mg L−1 at WK09 (Figure 3b), and were rated as Class V. At WK09, BOD5 and COD all failed to reach the target of water quality (Class III). TOC includes all carbon that exists in organic pollutants, and it is a comprehensive parameter to analyze organic carbon in pollutants. The TOC content along the WKR gradually increased and the range was 2.3–9.0 mg L−1 (Figure 3c). Along the XDYR, BOD5 and COD followed an increasing tendency first and then remained at similar levels after the water flow out of Baoding city (Figure 3a,b). At the sampling site closest to the lake (XDY08), both BOD5 and COD reached the water quality target of Class III. In general, the averages of BOD5 and COD in the XDYR were lower than those of the WKR. The TOC parameter for the XDYR also exhibited a slightly upward trend (Figure 3c).

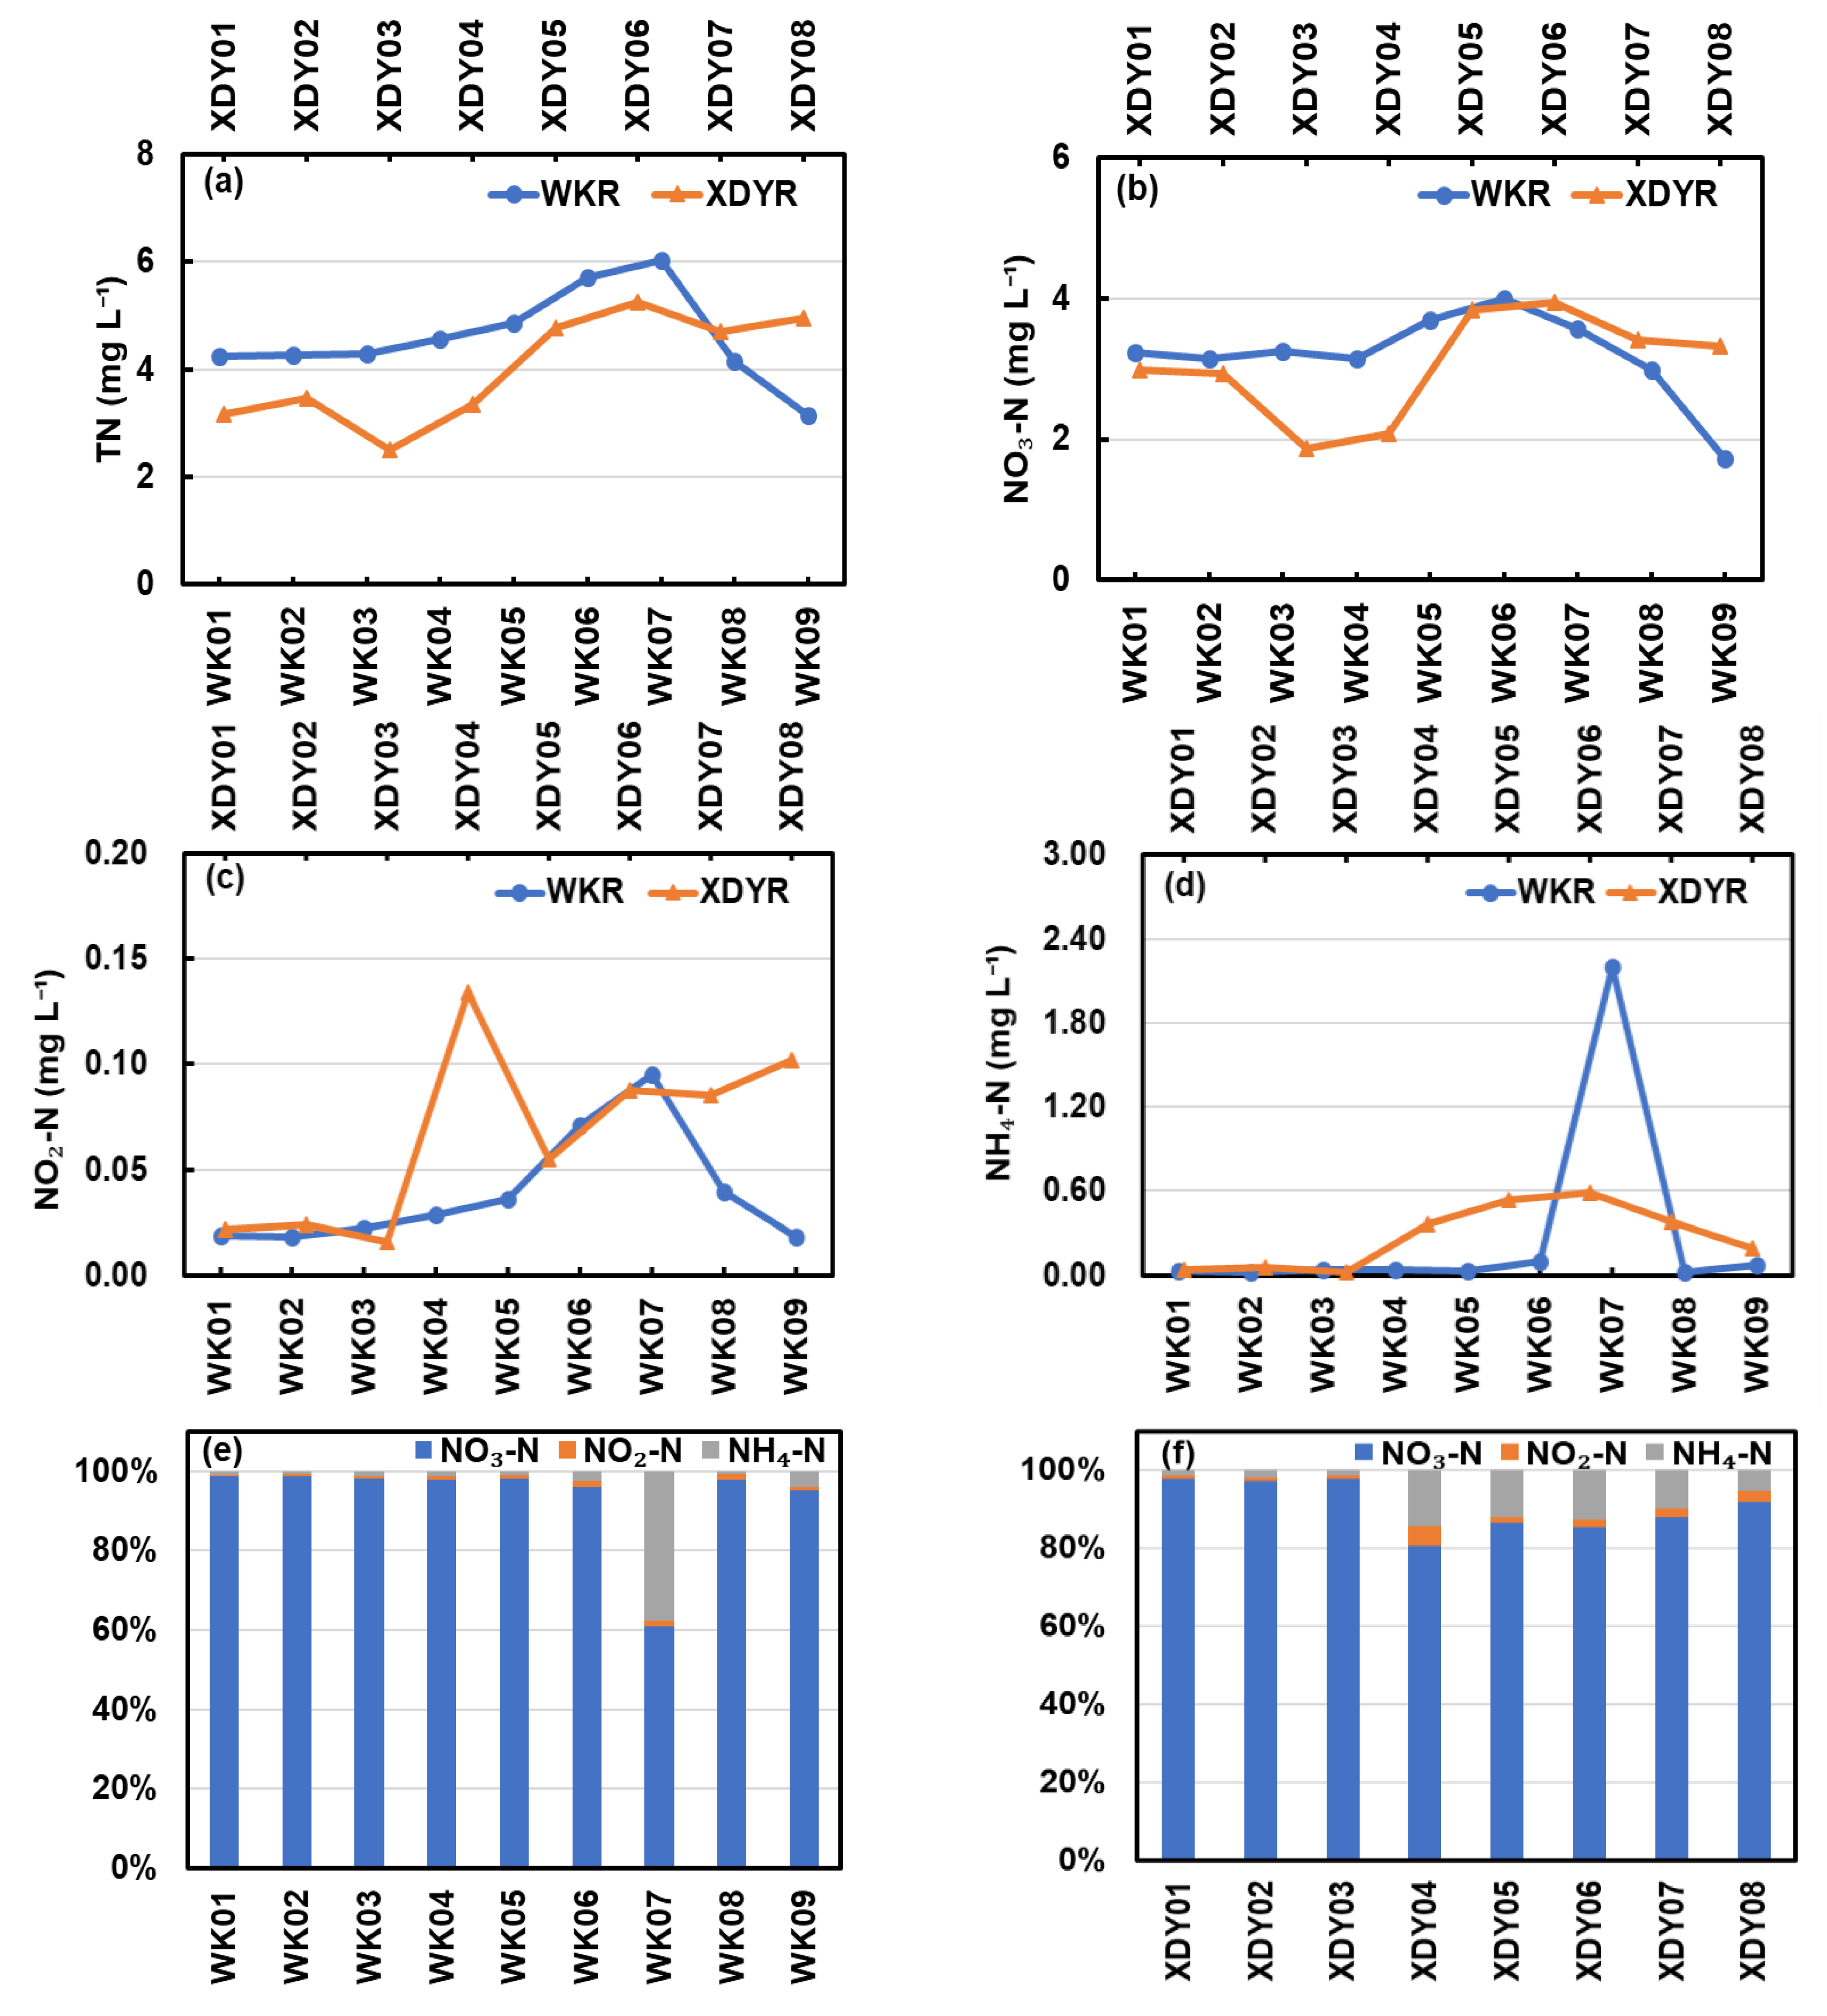
3.3. Spatial Variations of Nitrogen Forms

All TN values in samples from the two routes were at a high level (Figure 4a). Along the WKR, the TN value increased initially and peaked at the WK07 sampling site and then decreased. For the XDYR, TN increased gradually along the whole route. DIN in water mainly comprised NO3-N, NO2-N, and NH4-N. NO3-N was the dominant form for both two routes while NH4-N and NO2-N concentrations were relatively low. Along the WKR, NO3-N and NO2-N followed a similar spatial variation pattern to TN (Figure 4b,c). The NH4-N was low at most sites, except at WK07 (Figure 4d), which is close to the Li County WWTP. The NH4-N concentration at WK09 reached Class III. NO3-N accounted for an average of 93.4% of DIN in the WKR (Figure 4e). For the XDYR, the ratio of NO3-N to DIN ranged from 80.6% to 97.9% along the route (Figure 4f) and its spatial variation pattern was similar to TN. NH4-N contributed much more to the DIN than NO2-N and increased significantly after the water flow though the urban area and then decreased in the downstream direction. Furthermore, the NH4-N concentration at XDY08 reached the water quality target.

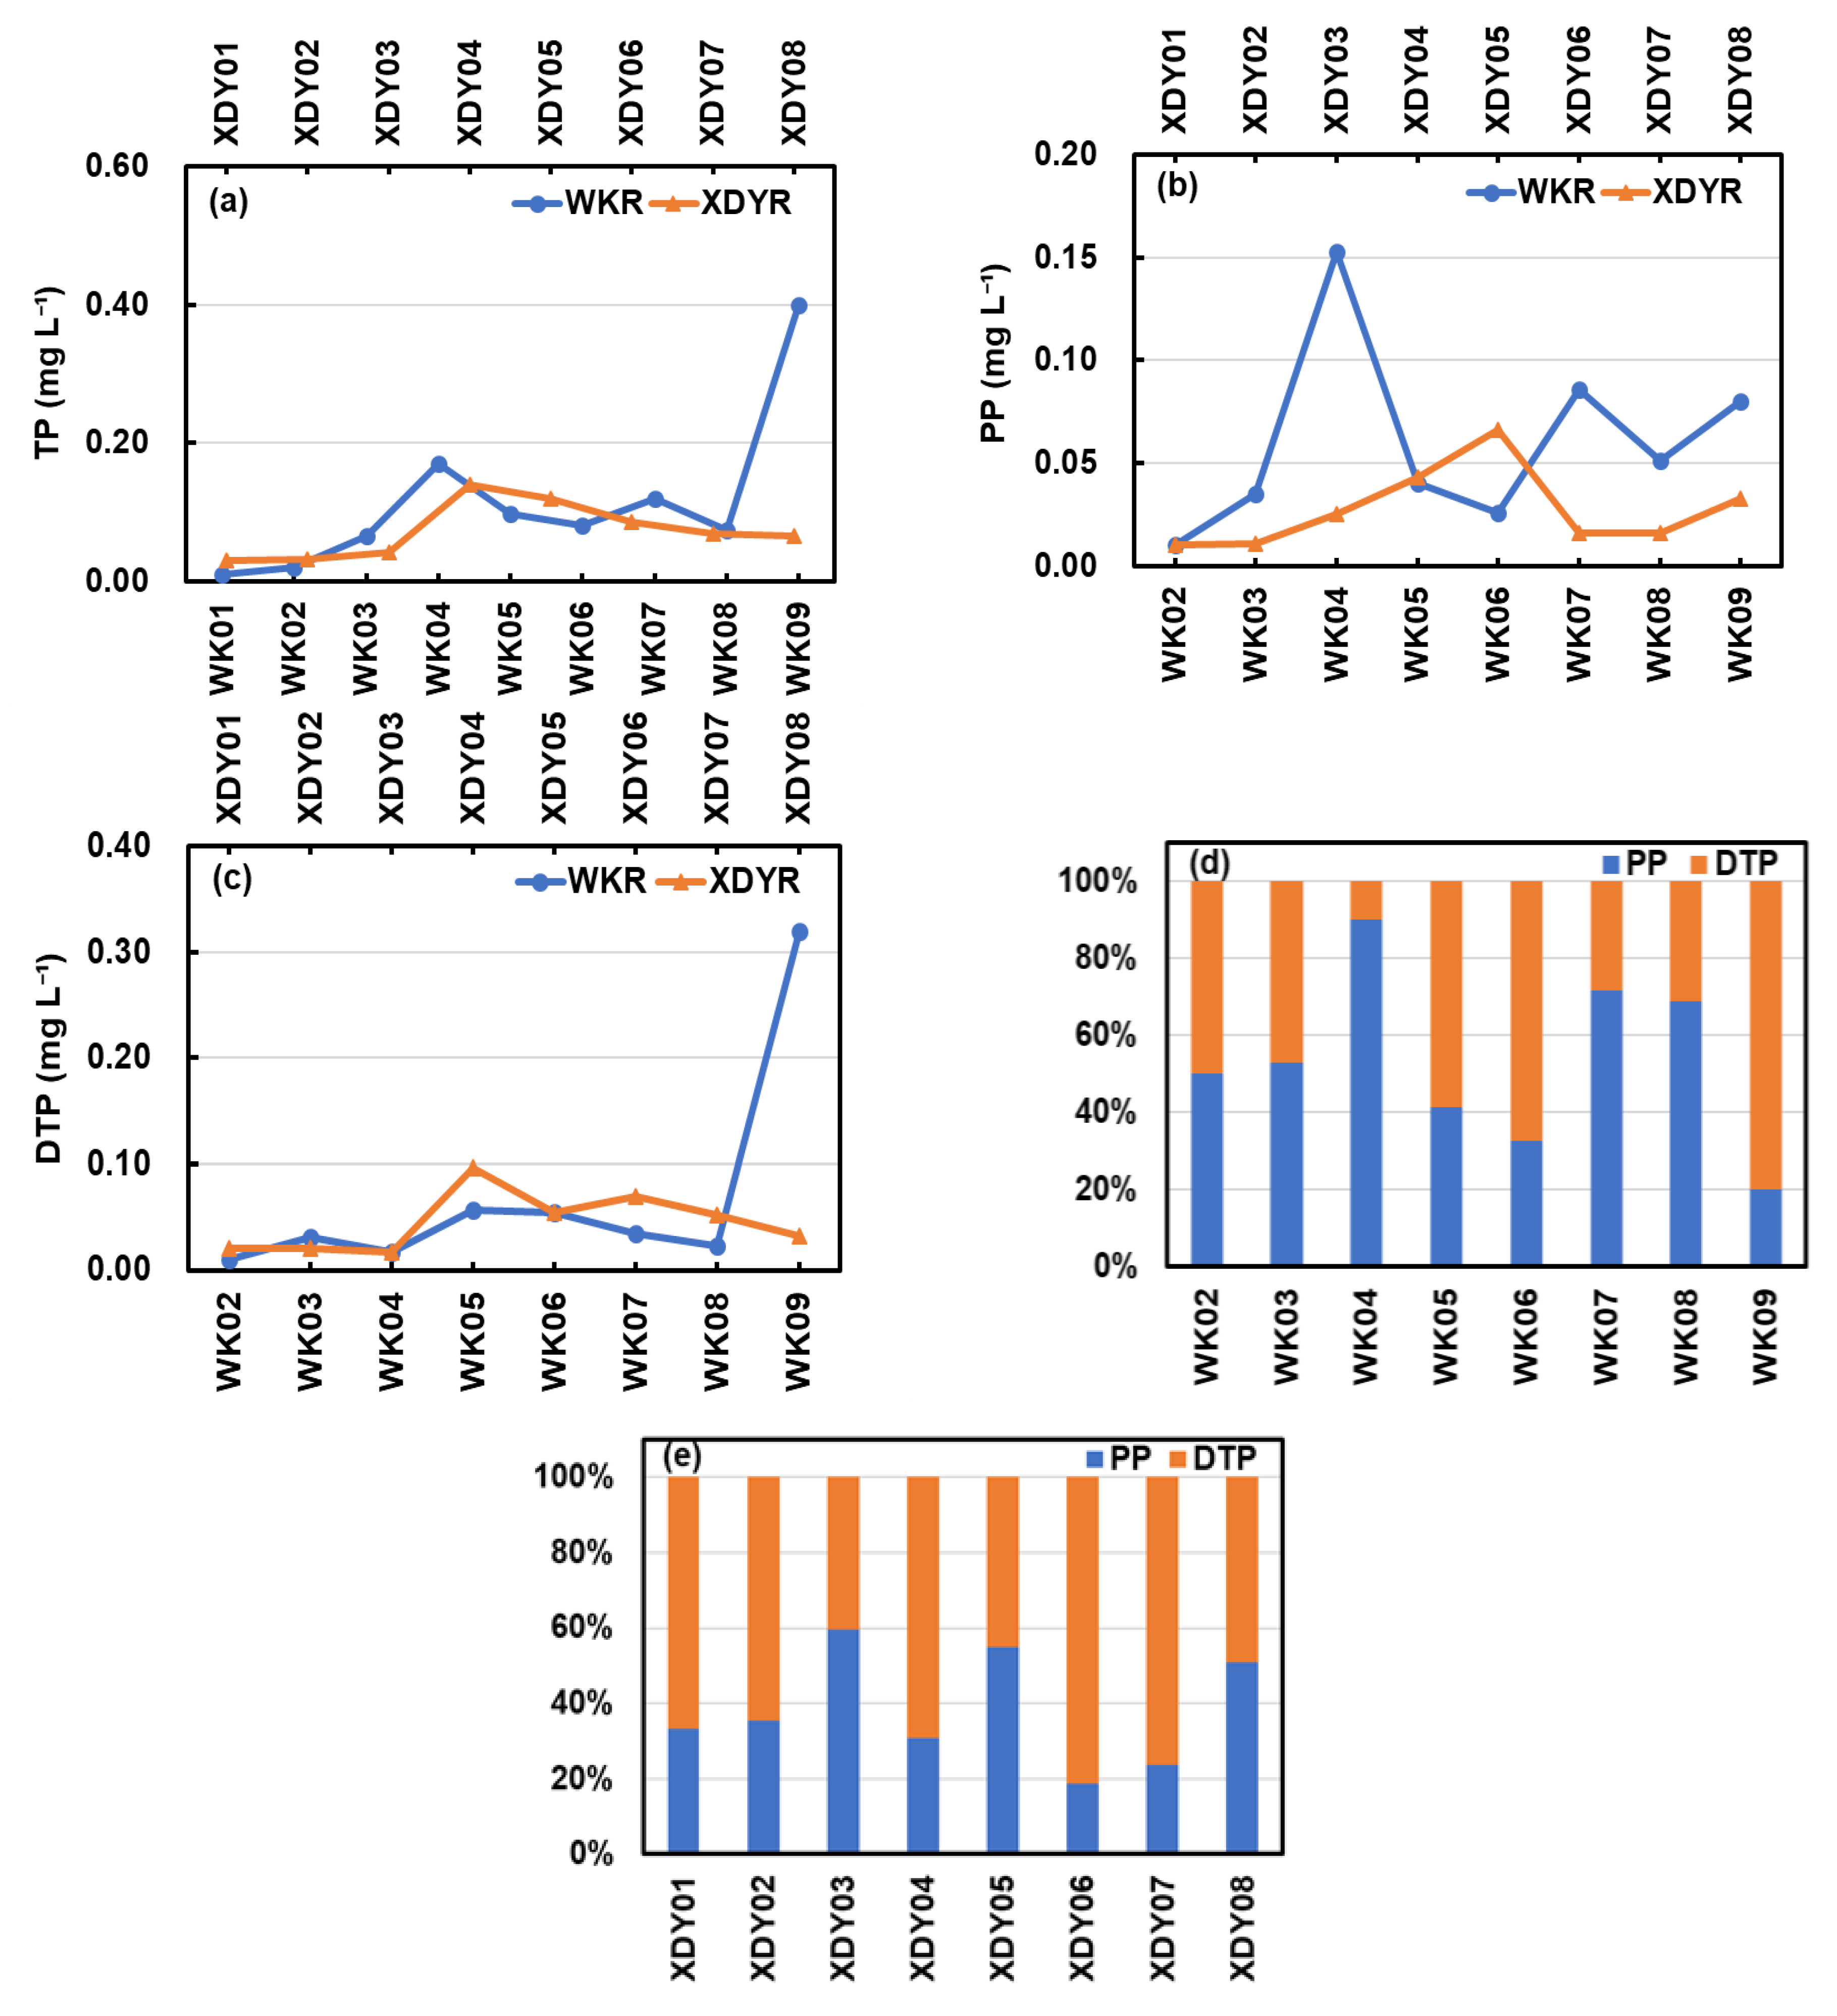
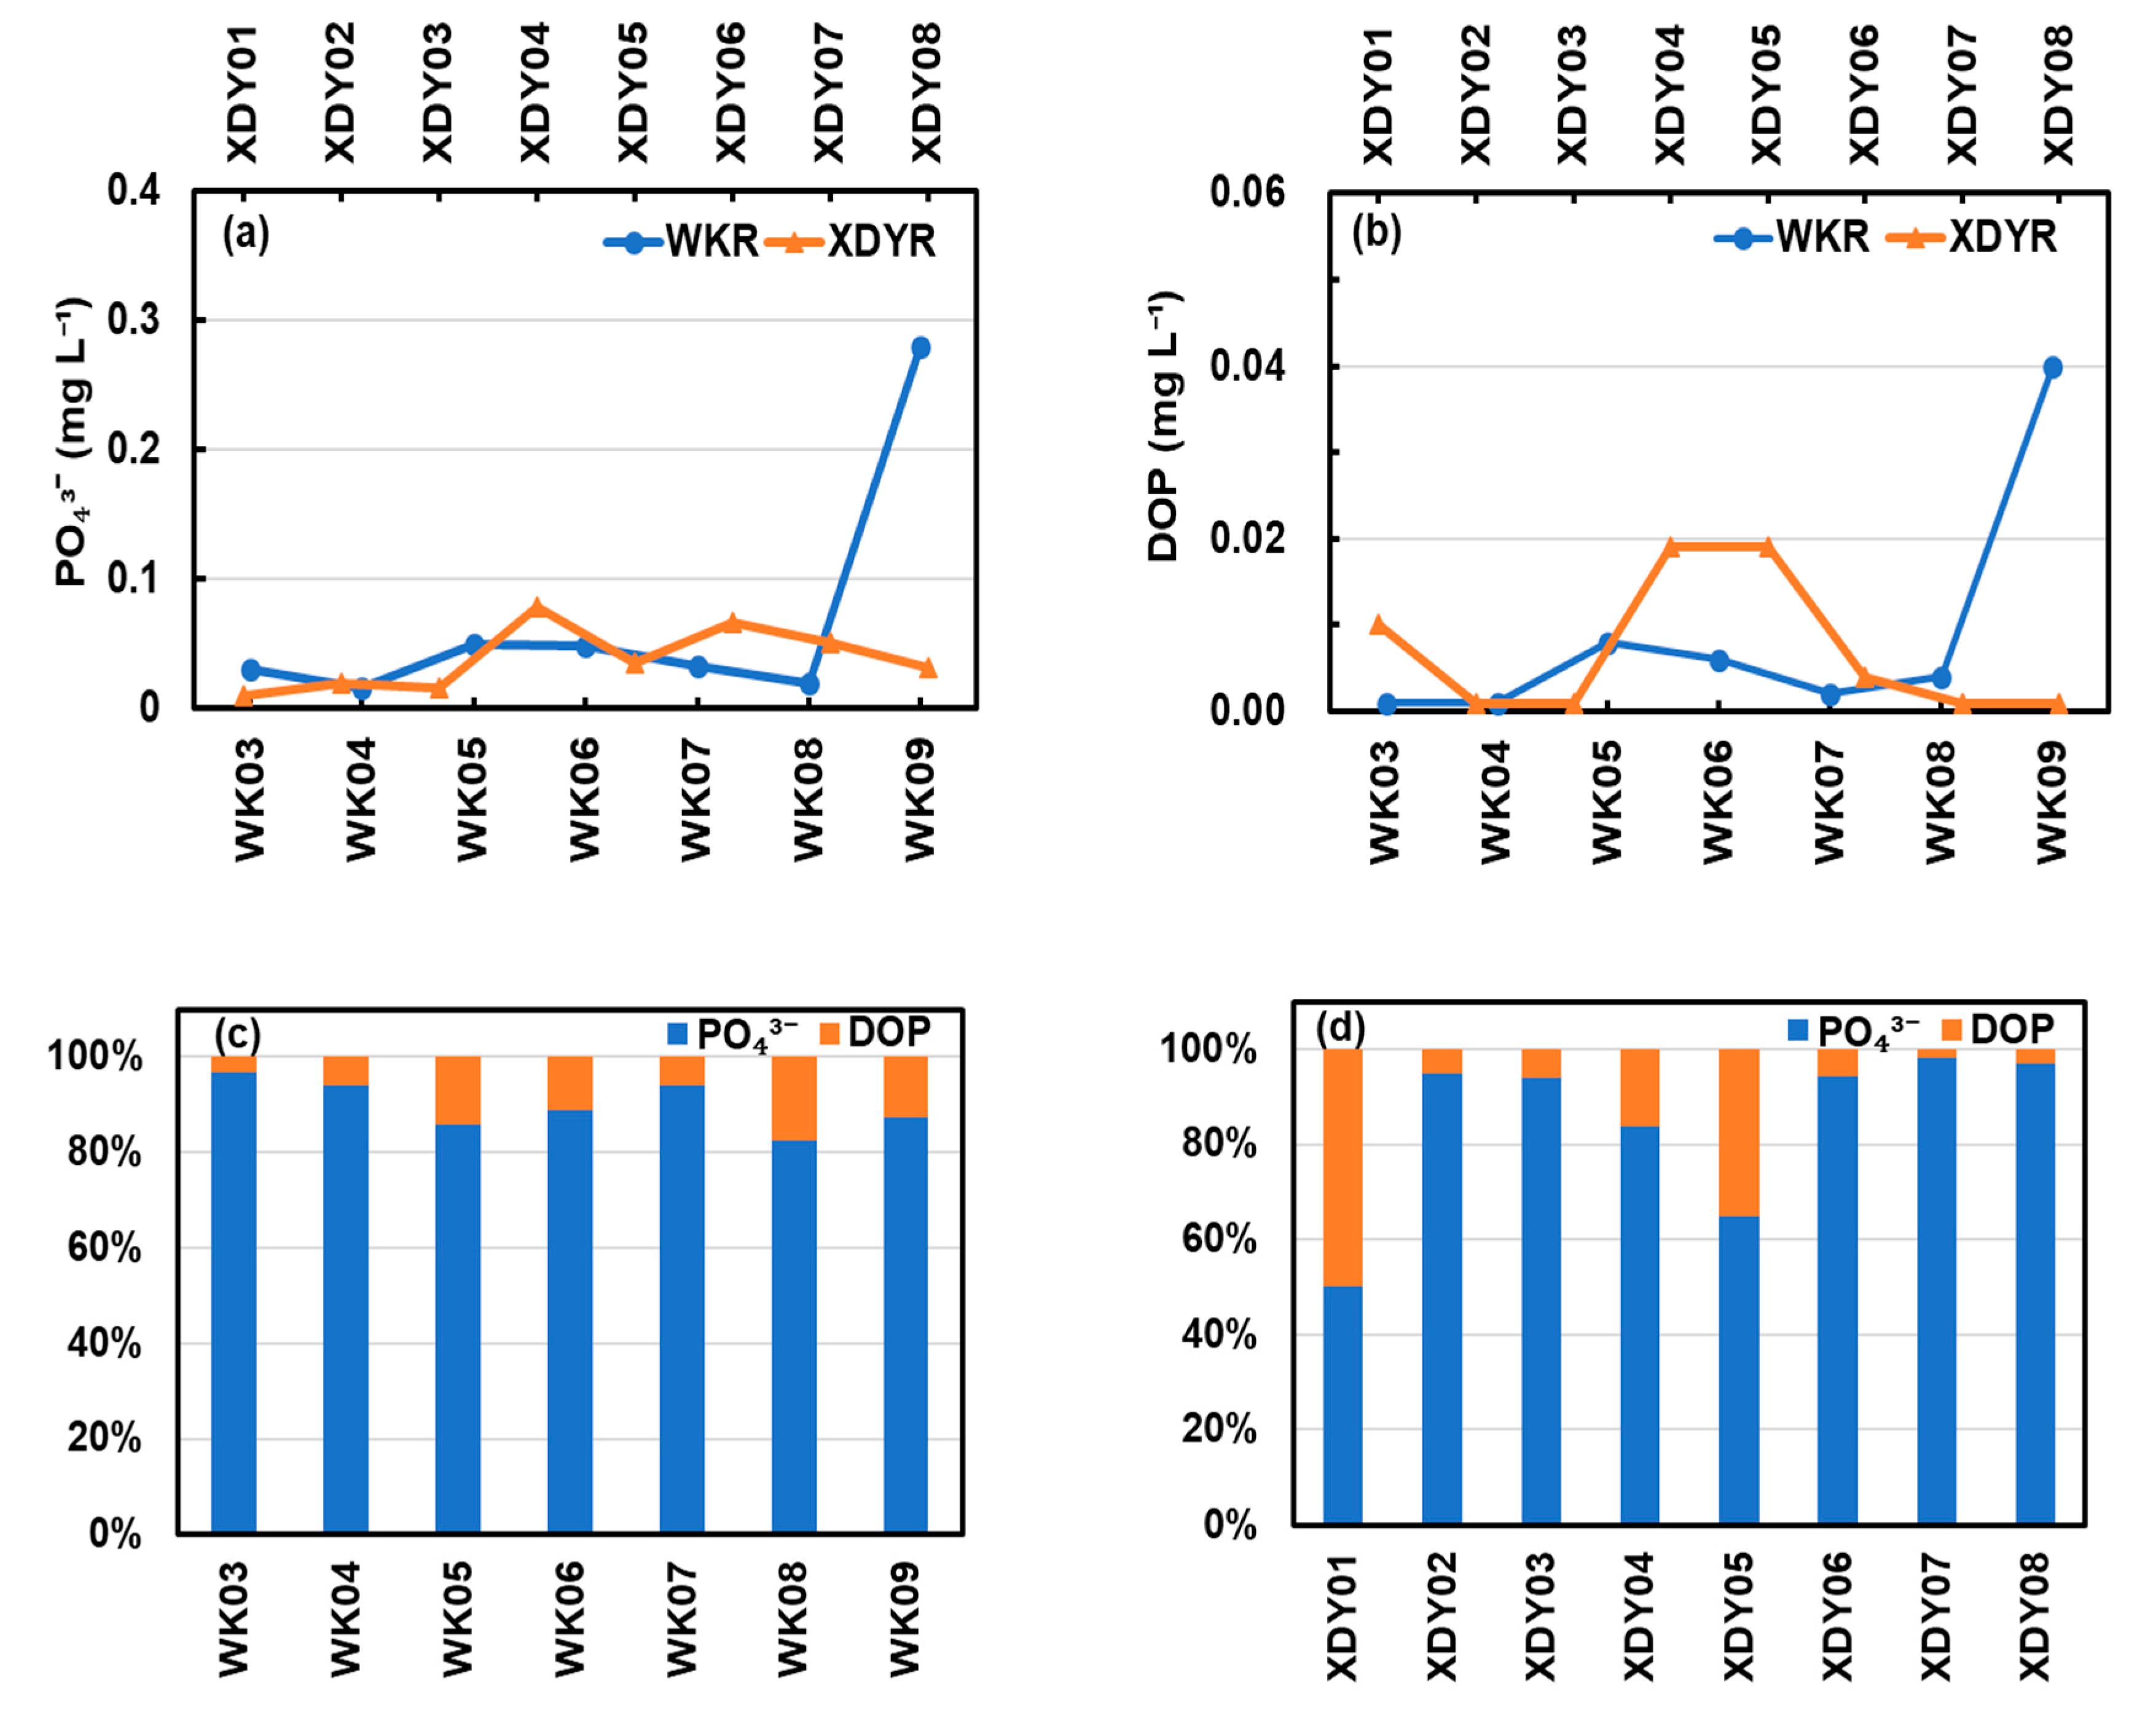
3.4. Spatial Variations of Phosphorous Forms

Along the WKR, TP exhibited a fluctuating but increasing trend (Figure 5a). The TP concentrations of WK04, WK07 and WK09 were higher than the upper limit of Class III in EQSSWC. The PP concentrations fluctuated along the route (Figure 5b). The DTP concentration showed an overall increasing pattern, with a range of 0.01–0.32 mg L−1 (Figure 5c). Except WK09, PP contributed most to TP (Figure 5d), with an average ratio of PP to TP being 53.4%. The proportion of PP in TP was high at WK04 (90.0%), WK07 (71.7%), and WK08 (68.9%). The TP concentration along the XDYR initially elevated and then decreased (Figure 5a) in the downstream region of Fu River, with XDY08 reaching the water quality target of Class III. Along the XDYR, DTP followed the similar spatial distribution as TP and the concentration ranged from 0.01 to 0.10 mg L−1, accounting for an average of 61.6% of TP (Figure 5e). In other words, percentage of PP in the XDYR is generally lower than that in the WKR. To understand the composition of DTP, PO43− was used to represent DIP. Figure 6 demonstrates the spatial variation of two dissolved phosphorous forms: DIP (PO43−) and DOP. There was a slightly upward trend in PO43 along the WKR and the PO43− content was highest at the WK09 sampling point (Figure 6a). DOP was generally below 0.04 mg L−1, and the average value was 0.01 mg L−1, accounting for less than 17.4% of DTP (Figure 6c) on average. Along the XDYR, the PO43− concentration was highest in XDY04 (Figure 6d), and then decreased gradually downstream. For DOP, the highest values appeared at the site of XDY04 and XDY05 (Figure 6b). The overall ratio of DOP to DIP was 23.1%, which was higher than that of the WKR.

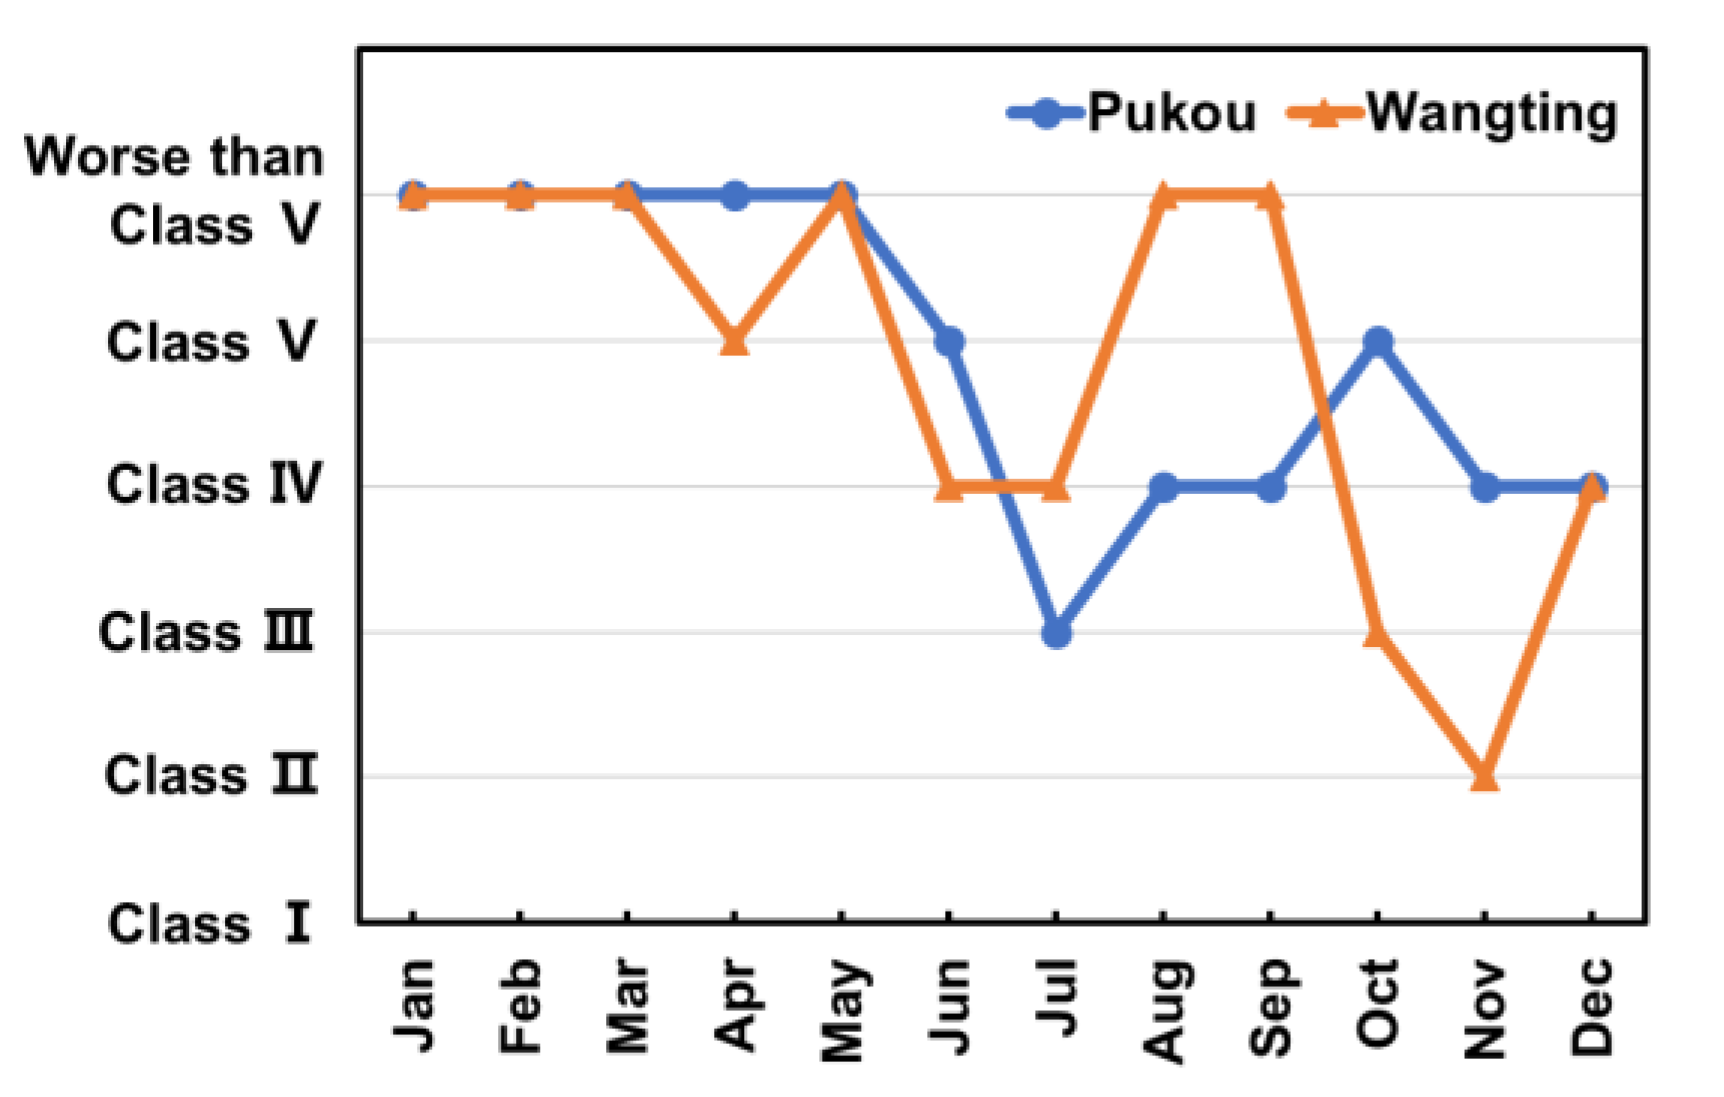
3.5. Comparison of Water Quality for The Periods with and without Environmental Water Allocation

To gain a more complete understanding of the influences of environmental water allocation, a comparison of river water quality was made between our samples and those taken in a non-environmental water allocation period, using publicly accessible water quality data from the monthly water quality report from Baoding Municipal Ecology and Environment Bureau (BMEEB). Data for April, 2018, the same month as our sampling, were used to exclude the influence of climate on water quality. For the WKR, the water quality of WK09 was compared with the BMEEB monitoring station of Pukou, which is about 3 km upstream of WK09. Figure 7a shows that, except BOD5, the values of COD, NH4-N, and TP were all higher for the samples taken in April 2018. For the XDYR, the water quality of XDY06 was compared with the BMEEB monitoring station of Wangting, which is very close to XDY06 (Figure 7b). All the four parameters are higher in the non-environmental water allocation period. Figure 8 shows that the monthly water quality conditions of the two BMEEB monitoring stations, which indicate that water quality in April is almost worst in a year. The results for these two sites demonstrate that the environmental flow released from the two reservoirs generally improved water quality in the rivers.

4. Discussion

The patterns of spatial variation of water quality were quite different between the two routes, indicating they are driven by different mechanisms. For the XDYR, before the river water flow enters the main urban area of Baoding city (XDY01, XDY02, and XDY03), the concentrations of pollutants were low. Generally, their values peaked after flowing out of the main urban area (XDY04 and XDY05), and then remained at a similar level (EC, COD, TOC, TN, and NO3-N) or decreased (BOD5, NH4-N, and all forms of phosphorous), which is consistent with the findings of Tang et al. [28] for NH4-N and Torrecilla et al. [29] for phosphorous. Figure 1b shows that the main inputs of pollutants to the river system are the three WWTPs located in the city. In the part of the route downstream of the city, no freshwater from tributaries nor discharge from point sources enter the river. Furthermore, the distance of this water course is relatively long (more than 30 km), making it possible for some pollutants to be diluted or degraded by in-river processes before they enter Baiyangdian Lake.
For the WKR, most water quality indexes (EC, BOD5, COD, TOC, and all forms of phosphorous) showed a general increasing trend with fluctuation. Especially for the most downstream points, i.e. WK09, water quality was worst among all samples. It can be explained by the spatial distribution of WWTPs among the route. Unlike the XDYR where all the WWTPs are concentrated in the major urban area of Baoding city, the WWTPs of the WKR are all scatteredly distributed along the whole route. Meanwhile, the WWTP of Gaoyang county is located about 6 km upstream of sampling site WK09. Its effluents might increase the concentrations of different pollutants at this sampling site. Furthermore, the sampling site is close to the estuary of Xiaoyi River to Baiyangdian Lake in the downstream direction. The backwater effect of the lake may reduce the flow velocity in Xiaoyi River and correspondingly the dilution and degradation capacity of river water to the pollutants. The spatial variation of nitrogen forms are different from the above-mentioned pattern. In the lower reaches of the WKR (sampling sites 08 and 09), a downward trend of TN and NO3-N was observed. This might be the result of the denitrification process in the water bodies as demonstrated in Liu et al. [30]. Meanwhile, the BOD5, COD, and TOC concentrations of the two sampling sites exhibited a clear increasing trend, thus a more favorable environment was created for denitrification because the higher organic loads tended to consume more oxygen in the rivers and flow rate is low as a result of the backwater effects.
For Shahe Main Canal, Yueming River in the WKR and river segment of the XDYR upstream of the urban area of Baoding city, there is no water flow in the river channels if water release from the two reservoirs is not implemented. The analysis conducted in this study is the first comprehensive evaluation of water quality variations along the two routes during the environmental water release period of upstream reservoirs. Such spatial evaluation is important to identify water quality problems and its possible sources [31]. The above discussions indicate that the different spatial distribution of WWTPs along the two routes is one important reason for their different spatial variation pattern in water quality. This is consistent with the finding of Mishra et al. [32], through a modelling approach, that positioning of WWTPs within Lockwitzbach Basin, Germany had significant influences on river water quality. In the past, the location of WWTPs may be decided based on the magnitude of ease to receive wastewater. Our findings indicate that optimizing the locations of WWTPs at basin scale is also necessary in such decision-making processes. Moreover, the timing, duration and magnitude of environmental flow release from the reservoirs dominated the hydrological regime of the two river systems upstream of Baiyangdian Lake and consequently affected the movement and transformation of pollutants. There is a risk that transportation of the pollutants in the rivers to the receiving lake may be accelerated by such water allocations, as shown by Gu et al. [33] for the Chaohu Basin of China. In our case, under current magnitude of environmental flow, the river water quality was generally improved in the two routes compared with the period without water allocation, indicating that the effect of diluting pollutants is stronger than the effect of accelerating pollutant movement. Also, for the XDYR, the amount of environmental flow is almost twice of that for the WKR, which will have direct effect on the water pollutants dilution. Yang et al. [34] demonstrated that the amount of river discharge is important for the dilution of pollutants discharged from WWTPs. Therefore, considering the magnitude of environmental water allocation is also recommended when optimizing the locations of WWTPs.

5. Conclusions

In order to detect possible water quality problems in the rivers connecting Baiyangdian Lake and its upstream reservoirs during the environmental water release period, the spatial distribution of organic pollutants and nutrients in the river system was explored. The results indicate that river water quality was generally improved by the environmental water allocation. In the WKR, most water quality indexes (EC, BOD5, COD, TOC, and all forms of phosphorous) showed a general increasing trend with fluctuation. The COD, TN, and TP in the sampling site closest to Baiyangdian Lake did not meet the water quality target of the water function zone, which is a possible threat to the lake water quality. For the XDYR, the concentrations of pollutants were low in the upstream river segment. Their values reached peaks after flowing out of the main urban area, and then remained at a similar level (EC, COD, TOC, TN, and NO3-N) or decreased (BOD5, NH4-N, and all forms of phosphorous). Only the TN concentration could not reach the water quality target in the sampling site closest to Baiyangdian Lake. It was demonstrated that the spatial variation patterns of water quality in the routes were not the same.The difference in spatial distribution of WWTPs along the two routes is one important reason for this phenomenon. Therefore, optimizing the spatial distribution of WWTPs at the basin scale is necessary when deciding locations of new WWTPs in the Baiyangdian Basin. Consideration of the timing, duration and magnitude of environmental flow allocation is also indispensable in such decision-making processes. These findings are valuable not only for Baiyangdian Lake, but also for other lakes in the arid or semiarid region that require external water allocation to meet their environmental water demands.

Author Contributions

W.S., H.C. (He Chen), and Z.T. designed the idea and methodology; W.S., H.C. (Haiyang Chen), R.T., and Q.H. did the investigation; L.Z. and W.S. did the analysis; L.Z., W.S., and Y.J. wrote the paper. All authors have read and agreed to the published version of the manuscript.

Funding

This research was supported by the National Key R&D Program of China (Grant no.2018YFC0406502), the Chinese National Special Science and Technology Program of Water Pollution Control and Treatment (Grant No. 2018ZX07110006), the 111 Project (B18006).

Acknowledgments

This research was supported by the National Key R&D Program of China (Grant no.2018YFC0406502), the Chinese National Special Science and Technology Program of Water Pollution Control and Treatment (Grant No. 2018ZX07110006), the 111 Project (B18006).

Conflicts of Interest

The authors declare no conflict of interest.

References

  1. Song, C.Q.; Ke, L.H.; Pan, H.; Zhan, S.G.; Liu, K.; Ma, R.H. Long-term surface water changes and driving cause in Xiong’an, China: From dense Landsat time series images and synthetic analysis. Sci. Bull. 2018, 63, 708–716. [Google Scholar] [CrossRef] [Green Version]
  2. Xu, C.; Xu, Z.H.; Yang, Z.F. Reservoir operation optimization for balancing hydropower generation and biodiversity conservation in a downstream wetland. J. Clean. Prod. 2020, 245, 118885. [Google Scholar] [CrossRef]
  3. Liu, D.; Wang, X.; Zhang, Y.L.; Yan, S.J.; Cui, B.S.; Yang, Z.F. A Landscape Connectivity Approach for Determining Minimum Ecological Lake Level: Implications for Lake Restoration. Water 2019, 11, 2237. [Google Scholar] [CrossRef] [Green Version]
  4. Ding, Y.; Liu, H.F.; Yang, W.; Xing, L.M.; Tu, G.Q.; Ru, Z.M.; Xu, Z.H. The assessment of ecological water replenishment scheme based on the two-dimensional lattice-Boltzmann water age theory. J. Hydro-Environ. Res. 2019, 25, 25–34. [Google Scholar] [CrossRef]
  5. Yan, S.J.; Wang, X.; Cai, Y.P.; Li, C.H.; Yang, Z.F.; Yi, Y.J. Investigation of the spatio-temporal dynamics in landscape variations in a shallow lake based on a new Tendency-Pattern-Service conceptual framework. J. Clean. Prod. 2017, 161, 1074–1084. [Google Scholar] [CrossRef]
  6. Yang, W.; Yang, Z.F.; Zheng, C. Sustainable environmental flow management based on lake quality protection: The case of Baiyangdian Lake, China. Procedia Environ. Sci. 2012, 13, 730–741. [Google Scholar] [CrossRef] [Green Version]
  7. Wang, X.Y.; Wang, W.J.; Jiang, W.G.; Jia, K.; Rao, P.Z.; Lv, J.X. Analysis of the Dynamic Changes of the Baiyangdian Lake Surface Based on a Complex Water Extraction Method. Water 2018, 10, 1616. [Google Scholar] [CrossRef] [Green Version]
  8. Zheng, C.; Yang, W.; Yang, Z.F. Strategies for Managing Environmental Flows Based on the Spatial Distribution of Water Quality: A Case Study of Baiyangdian Lake, China. J. Environ. Inform. 2011, 18, 84–90. [Google Scholar] [CrossRef]
  9. Zhu, M.J.; Wang, S.Q.; Kong, X.L.; Zheng, W.B.; Feng, W.Z.; Zhang, X.F.; Yuan, R.Q.; Song, X.F.; Sprenger, M. Interaction of Surface Water and Groundwater influenced by groundwater over-extraction, waste water discharge and water transfer in Xiong’an New Area, China. Water 2019, 11, 539. [Google Scholar] [CrossRef] [Green Version]
  10. Zhang, Y.Q.; Wang, G.W.; Wang, S.Q.; Yuan, R.Q.; Tang, C.Y.; Song, X.F. Hydrochemical characteristics and geochemistry evolution of groundwater in the plain area of the Lake Baiyangdian watershed, North China Plain. J. Groundw. Sci. Eng. 2018, 6, 220–233. [Google Scholar]
  11. Yuan, R.Q.; Wang, S.Q.; Wang, P.; Song, X.F.; Tang, C.Y. Changes in flow and chemistry of groundwater heavily affected by human impacts in the Baiyangdian catchment of the north china plain. Environ. Earth Sci. 2017, 76, 571. [Google Scholar]
  12. Qiu, R.Z.; Li, Y.X.; Yang, Z.F.; Shi, J.H. Influence of water quality change in Fu River on Lake Baiyangdian. Front. Earth Sci. China 2009, 3, 397–401. [Google Scholar] [CrossRef]
  13. Li, C.H.; Zheng, X.K.; Zhao, F.; Wang, X.; Cai, Y.P.; Zhang, N. Effects of urban non-point source pollution from Baoding city on Baiyangdian lake, China. Water 2017, 9, 249. [Google Scholar] [CrossRef]
  14. Yang, W.; Yang, Z.F. Effects of long-term environmental flow releases on the restoration and preservation of Baiyangdian Lake, a regulated Chinese freshwater lake. Hydrobiologia 2014, 730, 79–91. [Google Scholar] [CrossRef]
  15. Yang, Y.; Yin, X.N.; Yang, Z.F. Environmental flow management strategies based on the integration of water quantity and quality, a case study of the Baiyangdian Wetland, China. Ecol. Eng. 2016, 96, 150–161. [Google Scholar] [CrossRef] [Green Version]
  16. Han, Q.; Tong, R.Z.; Sun, W.C.; Zhao, Y.; Yu, J.S.; Wang, G.Q.; Shrestha, S.; Jin, Y.L. Anthropogenic influences on the water quality of the Baiyangdian Lake in North China over the last decade. Sci. Total Environ. 2020, 701, 134929. [Google Scholar] [CrossRef] [PubMed]
  17. Tang, C.H.; Yi, Y.J.; Yang, Z.F.; Zhang, S.H.; Liu, H.F. Effects of ecological flow release patterns on water quality and ecological restoration of a large shallow lake. J. Clean. Prod. 2018, 174, 577–590. [Google Scholar] [CrossRef]
  18. Zheng, C.; Yang, W.; Yang, Z.F. Environmental flows management strategies based on the spatial distribution of water quality, a case study of Baiyangdian Lake, a shallow freshwater lake in China. Procedia Environ. Sci. 2010, 2, 896–905. [Google Scholar]
  19. Yang, W. Variations in ecosystem service values in response to changes in environmental flows: A case study of Baiyangdian Lake, China. Lake Reserv. Manag. 2011, 27, 95–104. [Google Scholar] [CrossRef]
  20. Yang, Y.; Chen, H.; Yang, Z.F. Integration of water quantity and quality in environmental flow assessment in wetlands. Procedia Environ. Sci. 2012, 13, 1535–1552. [Google Scholar] [CrossRef] [Green Version]
  21. Zhang, L.; Yin, J.X.; Zhang, S.H.; Jiang, Y.Z. Ecological Operation Schemes on Water Diversion from Danjiangkou Reservoir to Baiyangdian Lake. Wetland Sci. 2012, 10, 32–39. (In Chinese) [Google Scholar]
  22. Chen, H.; Yang, L.; Yang, Z.F.; Yu, S.W. Sustainable reservoir operations to balance upstream human needs and downstream lake ecosystem targets. Procedia Environ. Sci. 2012, 13, 1444–1457. [Google Scholar] [CrossRef] [Green Version]
  23. Yang, W.; Yang, Z.F. Development of a Long-term, Ecologically Oriented Dam Release Plan for the Lake Baiyangdian Sub-basin, Northern China. Water Resour. Manag. 2013, 27, 485–506. [Google Scholar] [CrossRef]
  24. Yin, X.A.; Yang, Z.F. A reservoir operating model for directing water supply to humans, wetlands, and cones of depression. Ecol. Modell. 2012, 252, 114–120. [Google Scholar] [CrossRef]
  25. Zhang, X.X.; Yi, Y.J.; Yang, Z.F. Nitrogen and phosphorus retention budgets of a semiarid plain basin under different human activity intensity. Sci. Total Environ. 2020, 703, 134813. [Google Scholar] [CrossRef] [PubMed]
  26. Lim, J.H.; Wong, Y.Y.; Lee, C.W.; Bong, C.W.; Kudo, I. Long-term comparison of dissolved nitrogen species in tropical estuarine and coastal water systems. Estuar. Coast. Shelf Sci. 2019, 222, 103–111. [Google Scholar] [CrossRef]
  27. Spahr, N.E.; Wynn, K.H. Nitrogen and phosphorus in surface waters of the upper colorado rwer basin. J. Am. Water Resour. Assoc. 1997, 33, 547–660. [Google Scholar] [CrossRef]
  28. Tang, J.; Wang, T.; Zhu, B.; Zhao, P.; Xiao, Y.; Wang, R. Tempo-spatial analysis of water quality in tributary bays of the Three Gorges Reservoir region (China). Environ. Sci. Pollut. Res. 2015, 22, 16709–16720. [Google Scholar] [CrossRef] [PubMed]
  29. Torrecilla, N.J.; Galve, J.P.; Zaera, L.G.; Retarnar, J.F.; Alvarez, A.N.A. Nutrient sources and dynamics in a mediterranean fluvial regime (Ebro river, NE Spain) and their implications for water management. J. Hydrol. 2005, 304, 166–182. [Google Scholar] [CrossRef]
  30. Liu, J.; Shen, Z.; Chen, L. Assessing how spatial variations of land use pattern affect water quality across a typical urbanized watershed in Beijing, China. Landscape Urban Plan. 2018, 176, 51–63. [Google Scholar] [CrossRef]
  31. Haire, M.; Vega, R.; Koenig, J.; Teresa, R. Handbook for Developing Watershed TMDLs. Proc. Water Environ. Fed. 2009, 520–548. [Google Scholar] [CrossRef]
  32. Mishra, S.; Kneis, D.; Berendonka, T.U.; Aubeneaub, A. Optimum positioning of wastewater treatment plants in a river network: A model-based approach to minimize microbial pollution. Sci. Total Environ. 2019, 691, 1310–1319. [Google Scholar] [CrossRef] [PubMed]
  33. Gu, X.Y.; Liao, Z.L.; Zhang, G.Q.; Xie, J.Q.; Zhang, J. Modelling the effects of water diversion and combined sewer overflow on urban inland river quality. Environ. Sci. Pollut. Res. 2017, 24, 21038–21049. [Google Scholar] [CrossRef] [PubMed]
  34. Yang, S.; Büttner, O.; Kumar, R.; Jäger, C.; Jawitz, J.W.; Rao, P.S.C.; Borchardt, D. Spatial patterns of water quality impairments from point source nutrient loads in Germany’s largest national River Basin (Weser River). Sci. Total Environ. 2019, 697, 134145. [Google Scholar] [CrossRef]
Figure 1. (a) Topography and river system and (b) sampling sites, outlet of waste water treatment plants and land use in 2015 derived from Moderate-Resolution Imaging Spectroradiometer remote sensing data along the routes of environment flow allocations from Wangkuai and Xidayang Reservoirs to Baiyangdian Lake.
Water 12 00688 g001
Figure 2. Spatial distribution of (a) pH and (b) electrical conductivity (EC) of the sampling sites in the WangKuai reservoir route (WKR) and XiDaYang reservoir route (XDYR).
Water 12 00688 g002
Figure 3. Spatial distribution of (a) biological oxygen demand over 5 days (BOD5), (b) chemical oxygen demand (COD), and (c) total organic carbon (TOC) of the sampling sites in the WangKuai reservoir route (WKR) and XiDaYang reservoir route (XDYR).
Water 12 00688 g003
Figure 4. Spatial distribution of (a) total nitrogen (TN), (b) nitrate nitrogen (NO3-N), (c) nitrite nitrogen (NO2-N), and (d) ammonium nitrogen (NH4-N) of the sampling sites in the WangKuai reservoir route (WKR) and XiDaYang reservoir route (XDYR), and the percentages of NO3-N, NO2-N, and NH4-N in DIN in (e) the WKR and (f) the XDYR.
Water 12 00688 g004
Figure 5. Spatial distribution of: (a) total phosphorous (TP), (b) particulate phosphorus (PP), and (c) dissolved total phosphorus (DTP) ) of the sampling sites in the WangKuai reservoir route (WKR) and XiDaYang reservoir route (XDYR), and the percentages of PP and DTP in TP in (d) the WKR and (e) the XDYR.
Water 12 00688 g005
Figure 6. Spatial distribution of: (a) dissolved orthophosphate (PO43−) and (b) dissolved organic phosphorus (DOP in the WangKuai reservoir route (WKR) and XiDaYang reservoir route (XDYR), and the percentages of PO43− and DOP in (c) the WKR and (d) the XDYR.
Water 12 00688 g006
Figure 7. Ratios of water quality values measured in April, 2018 to the ones measured from our samples at (a) WK09 and (b) XDY06.
Water 12 00688 g007
Figure 8. The monthly water quality classes for the two Baoding Municipal Ecology and Environment Bureau (BMEEB) monitoring stations in 2018.
Water 12 00688 g008
Table 1. The water quality parameters, their units and the associated analytical method.
ParametersAbbreviationsUnitAnalytical Method
pHpH-pH probe
Electrical conductivityECμS cm−1Conductometry
Chemical oxygen demandCODmg L−1Potassium dichromate titration method
Biological oxygen demand over 5 daysBOD5mg L−1Dilution and seeding method
Total organic carbonTOCmg L−1Nondispersive infrared absorption method
Total nitrogenTNmg L−1Ultraviolet spectroscopy
NitrateNO3mg L−1Ultraviolet spectrophotometry
NitriteNO2mg L−1Spectrophotometric method
Ammonium nitrogenNH4-Nmg L−1Nessler’s reagent spectrophotometry
Total phosphorous TPmg L−1Spectrophotometric method
Dissolved total phosphorus DTPmg L−1Molybdenum antimony method
Dissolved orthophosphate PO43−mg L−1Molybdenum antimony method
Table 2. Environmental Quality Standards for Surface Water of the People’s Republic of China for water quality parameters in this study.
ParameterUnitUpper Limit for Each Class
Class IClass IIClass IIIClass IVClass V
BOD5mg L−1334610
CODmg L−11515203040
NH4-Nmg L−10.150.51.01.52.0
TPmg L−10.020.10.20.30.4

