Integrated Geological, Hydrogeological, and Geophysical Investigations of a Barchan Sand Dune in the Eastern Region of Saudi Arabia

 , and
, and 
Abstract
:1. Introduction
2. Materials and Methods
2.1. Sand Sampling Method
2.2. Electrical Resistivity Tomography (ERT)
- 1.
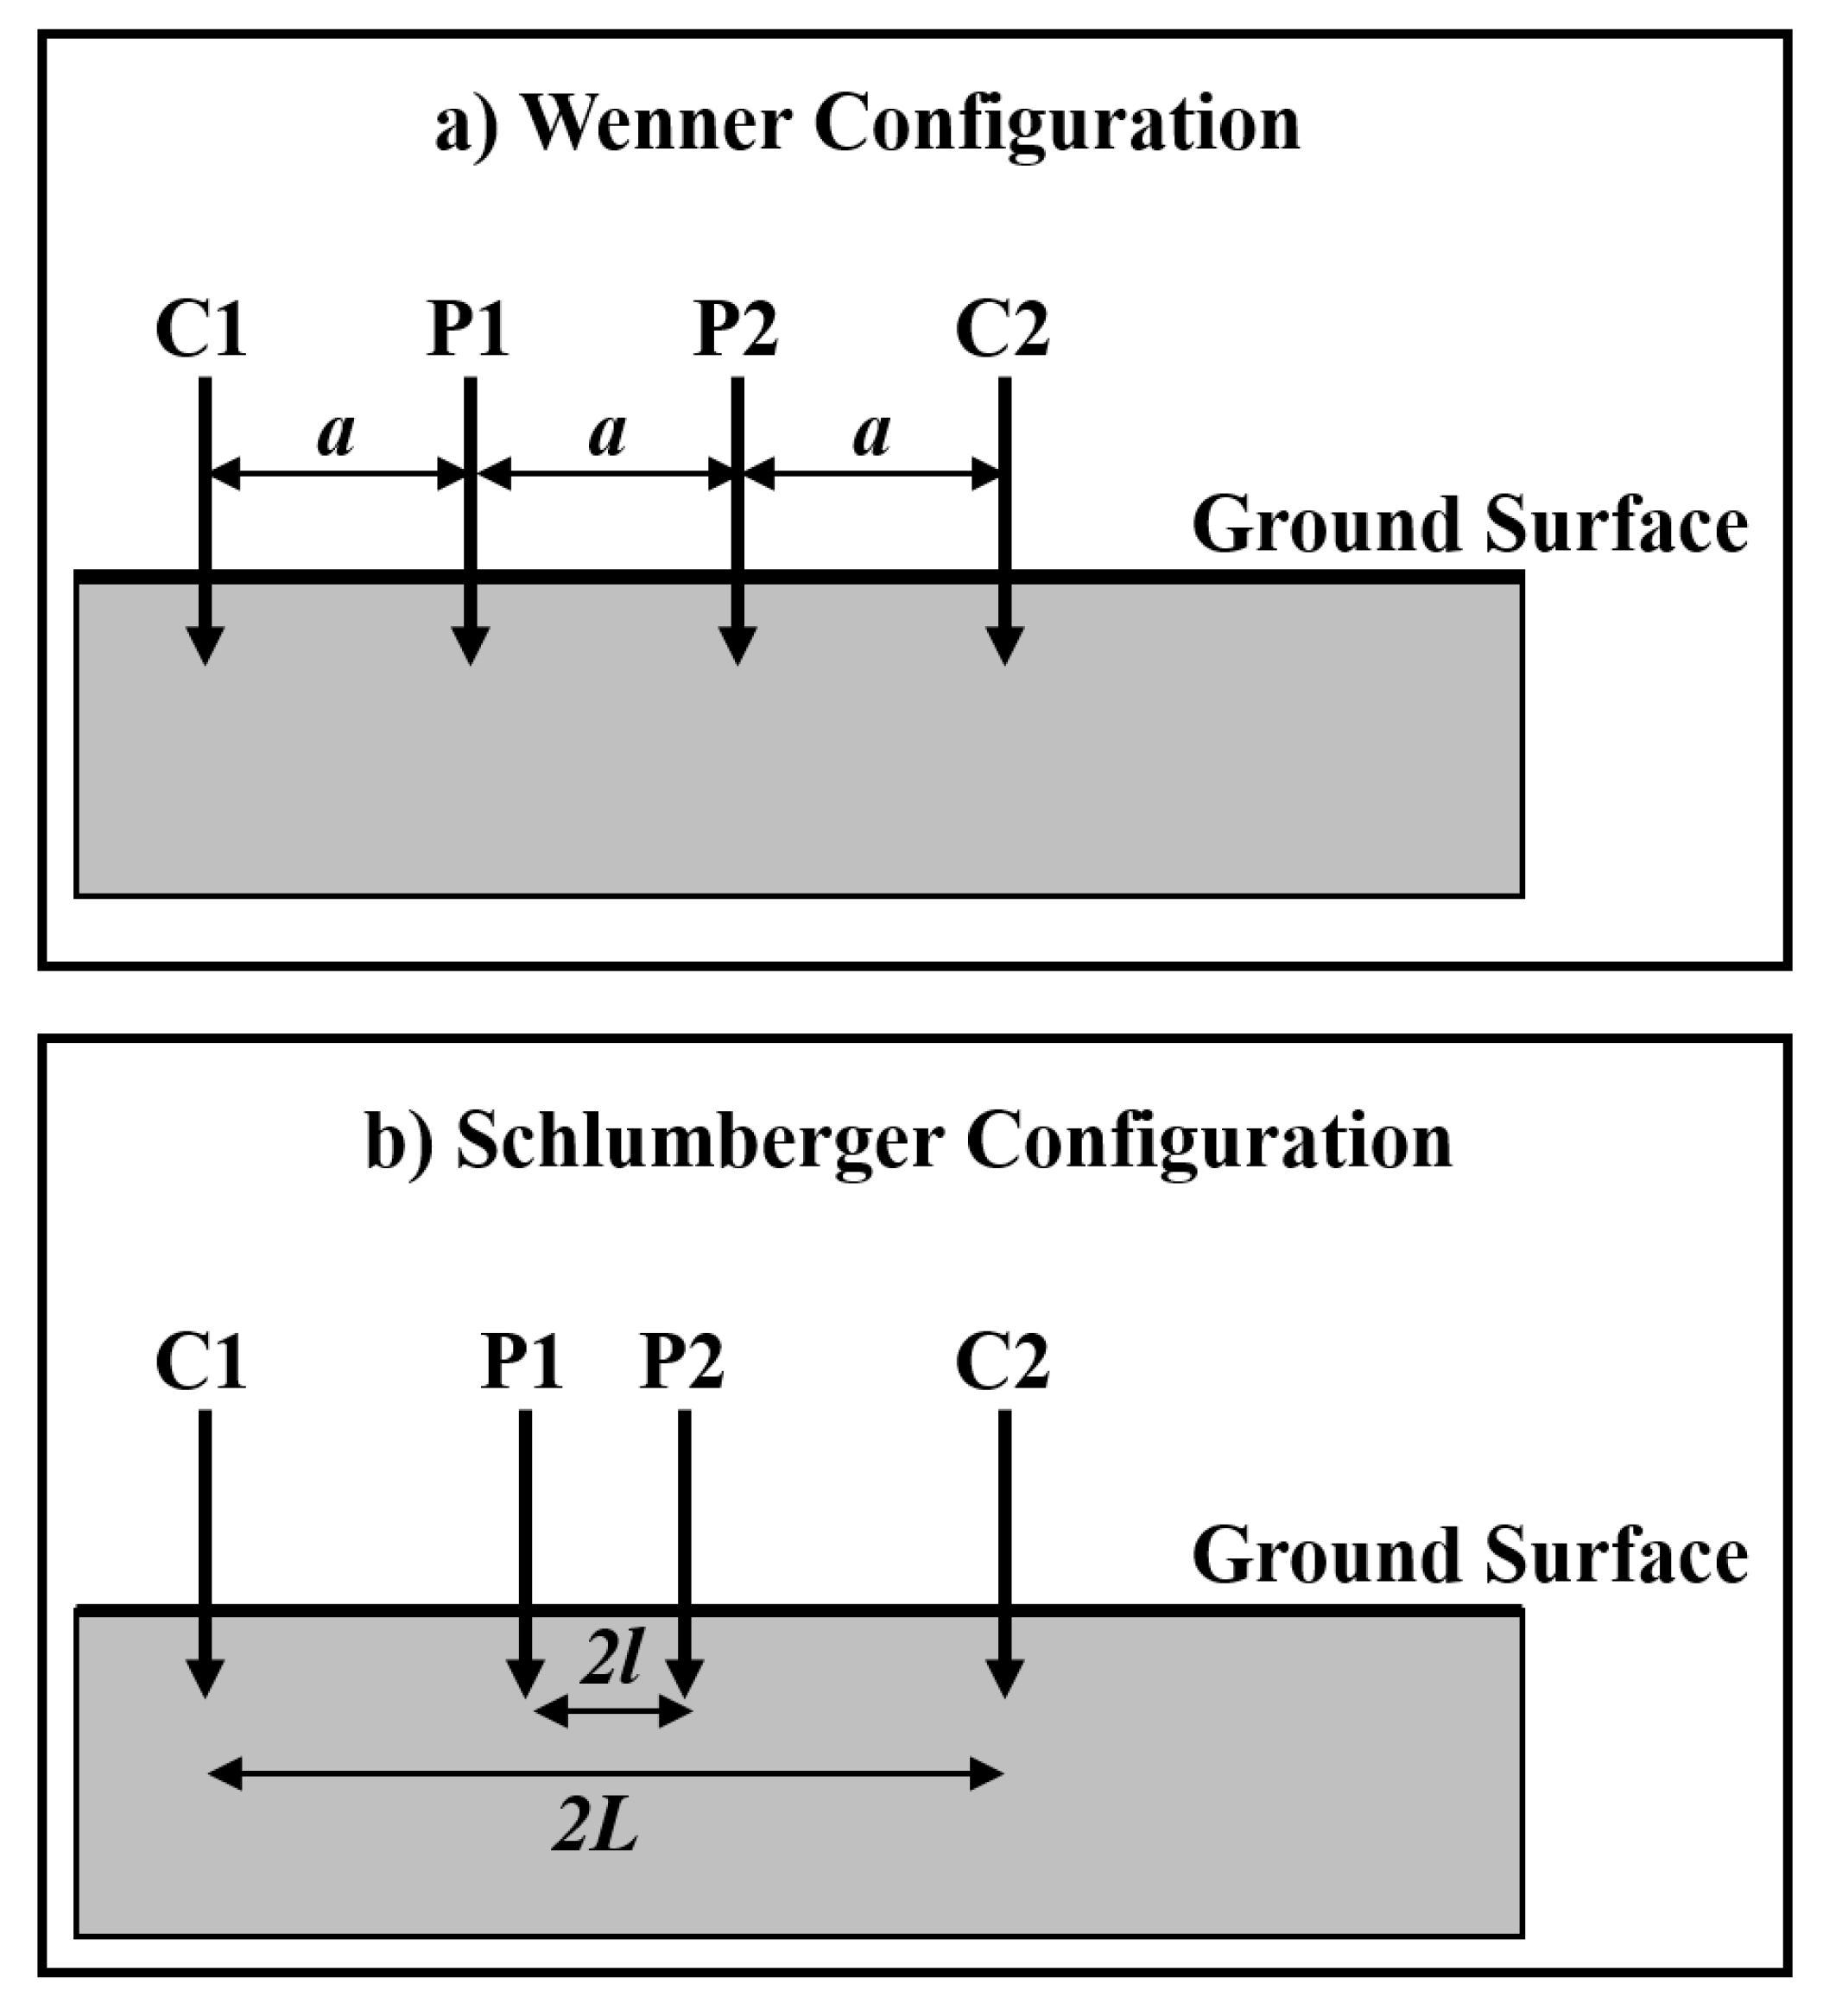
- Wenner spread (Figure 2a). This is a commonly used electrode spread in field measurements. In this spread the electrodes are uniformly spaced in a line with the offset between each two successive electrodes equal to ‘a’. In this case, the geometrical factor ‘k’ in Equation (2) is reduced to .
- 2.
- Schlumberger spread (Figure 2b). The current electrodes in this spread are spaced much further apart than the potential electrodes, where the offset between the current electrodes is equal to ‘2L’ and the offset between the potential electrodes is equal to ‘2l’. Here, the geometrical factor ‘k’ in Equation (2) is reduced to ; for more details see [16].
2.3. Laboratory Analyses
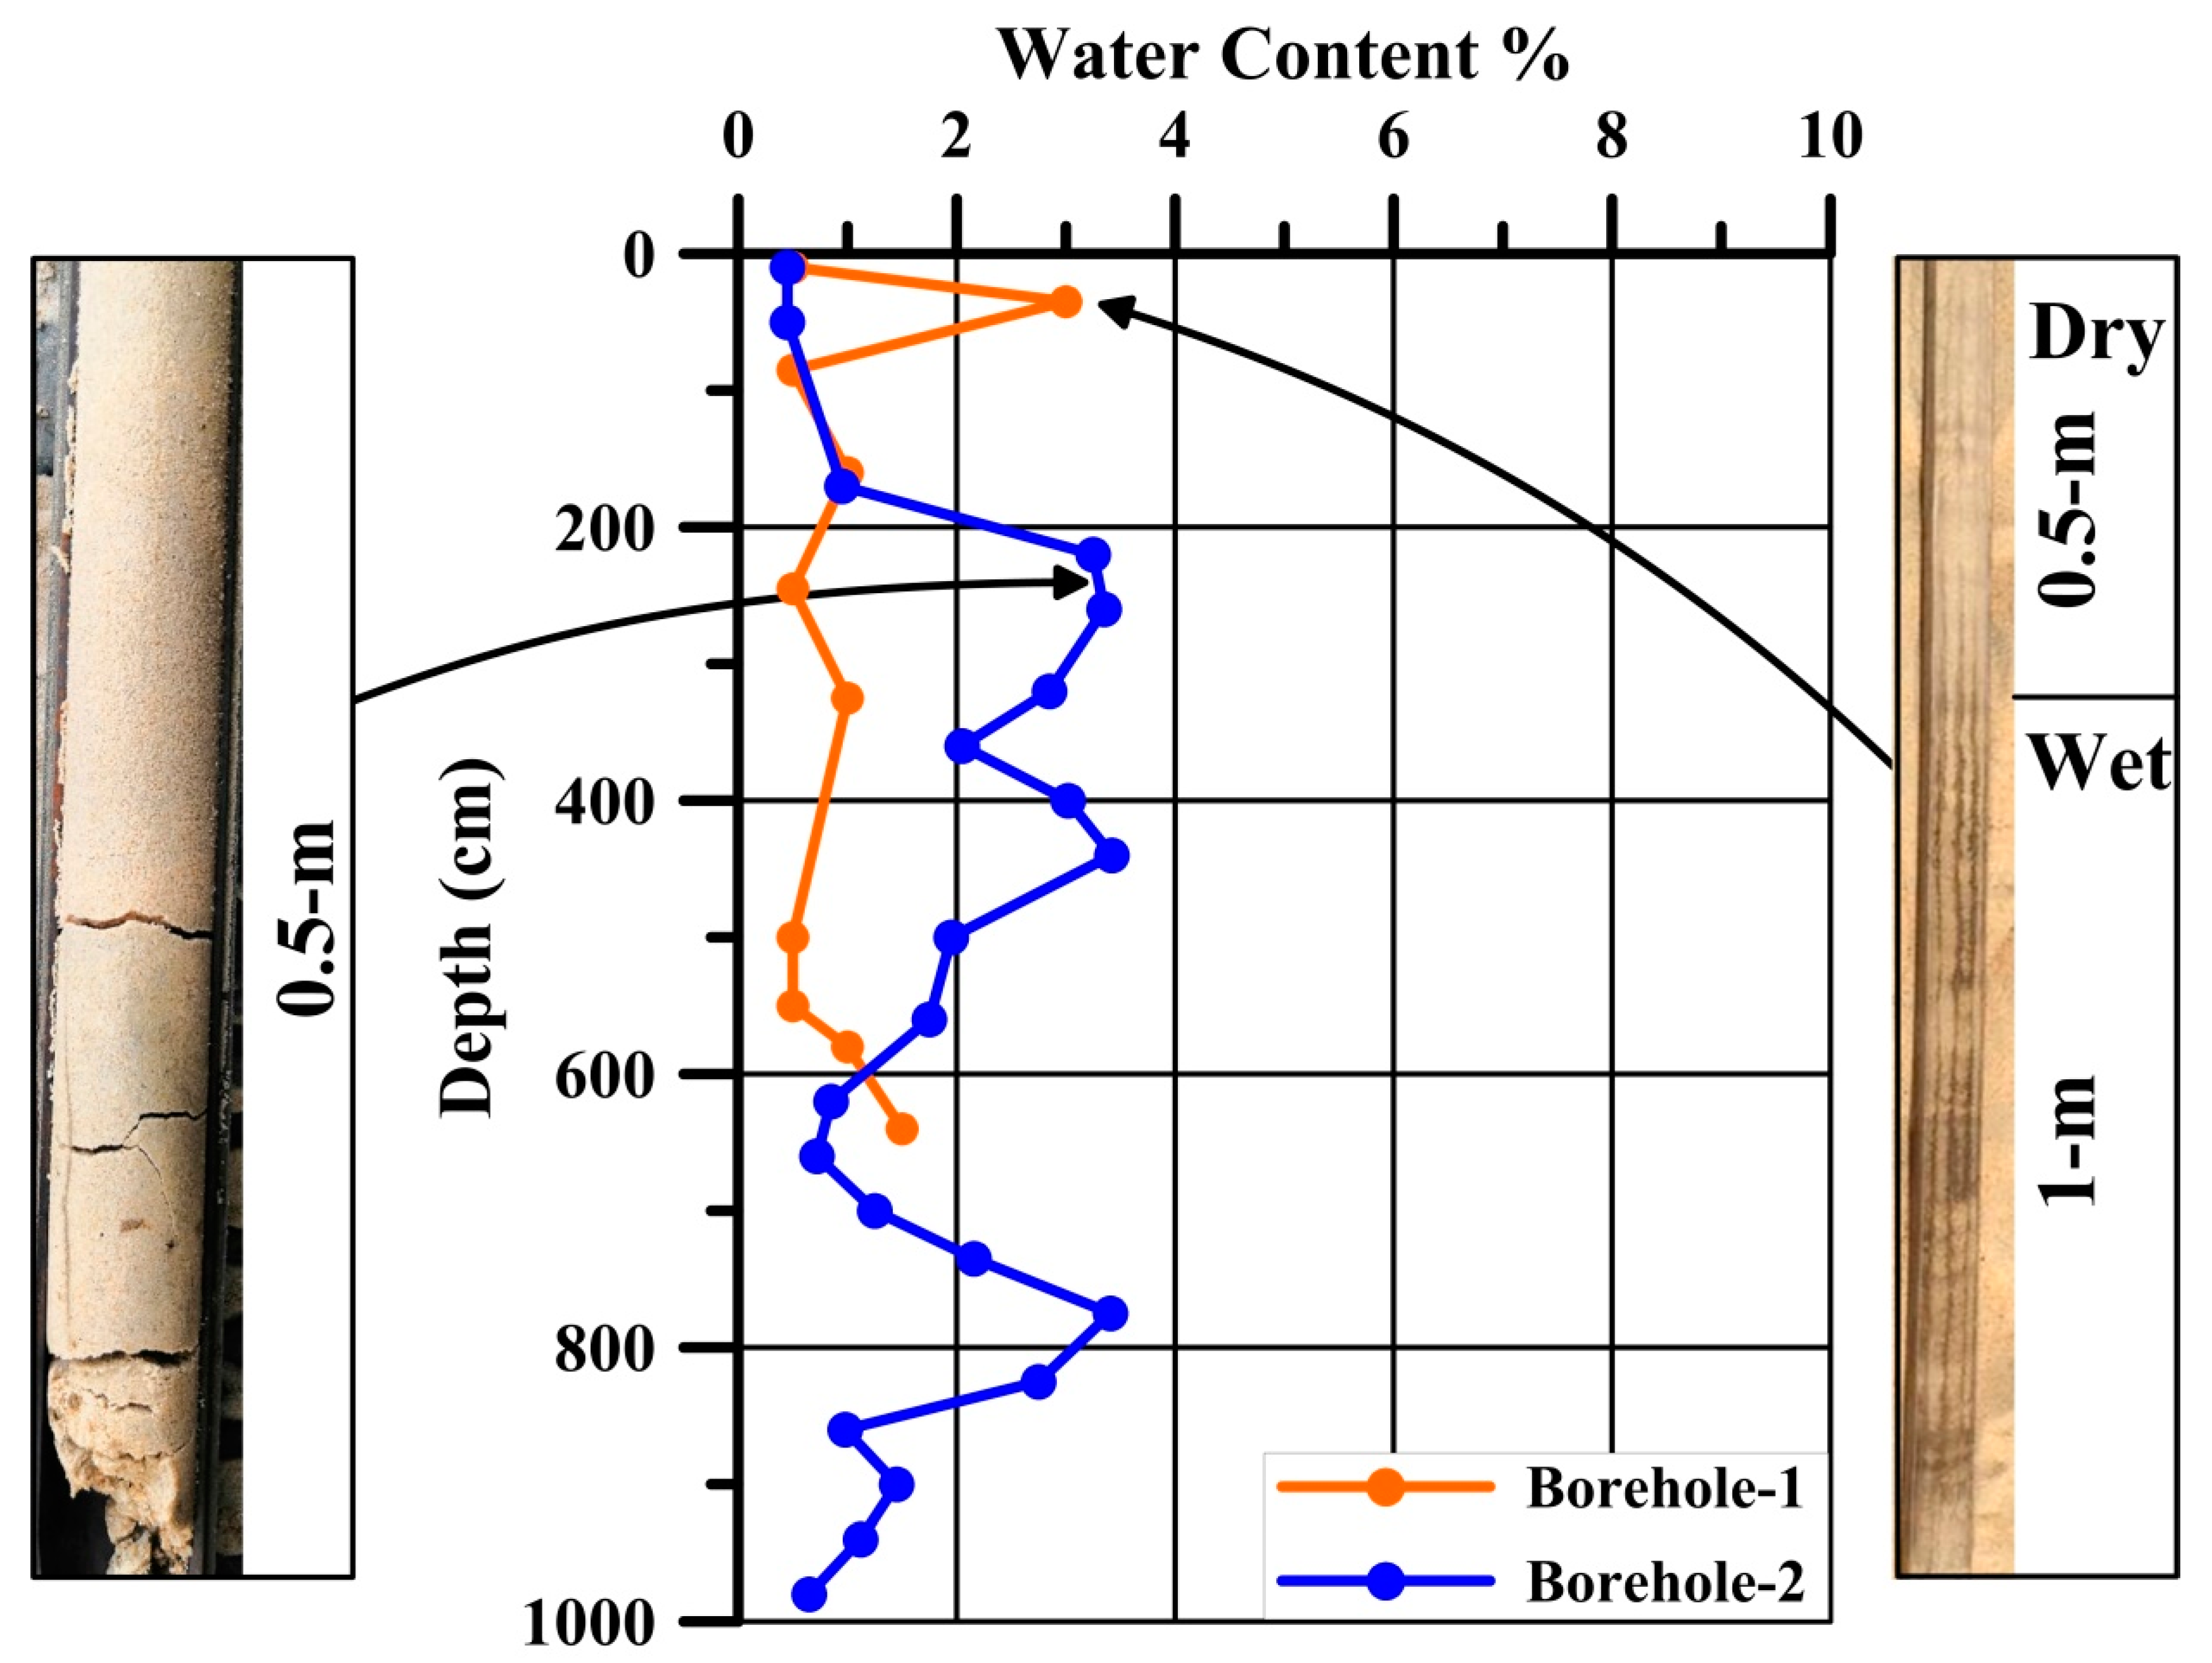
2.3.1. Water Content
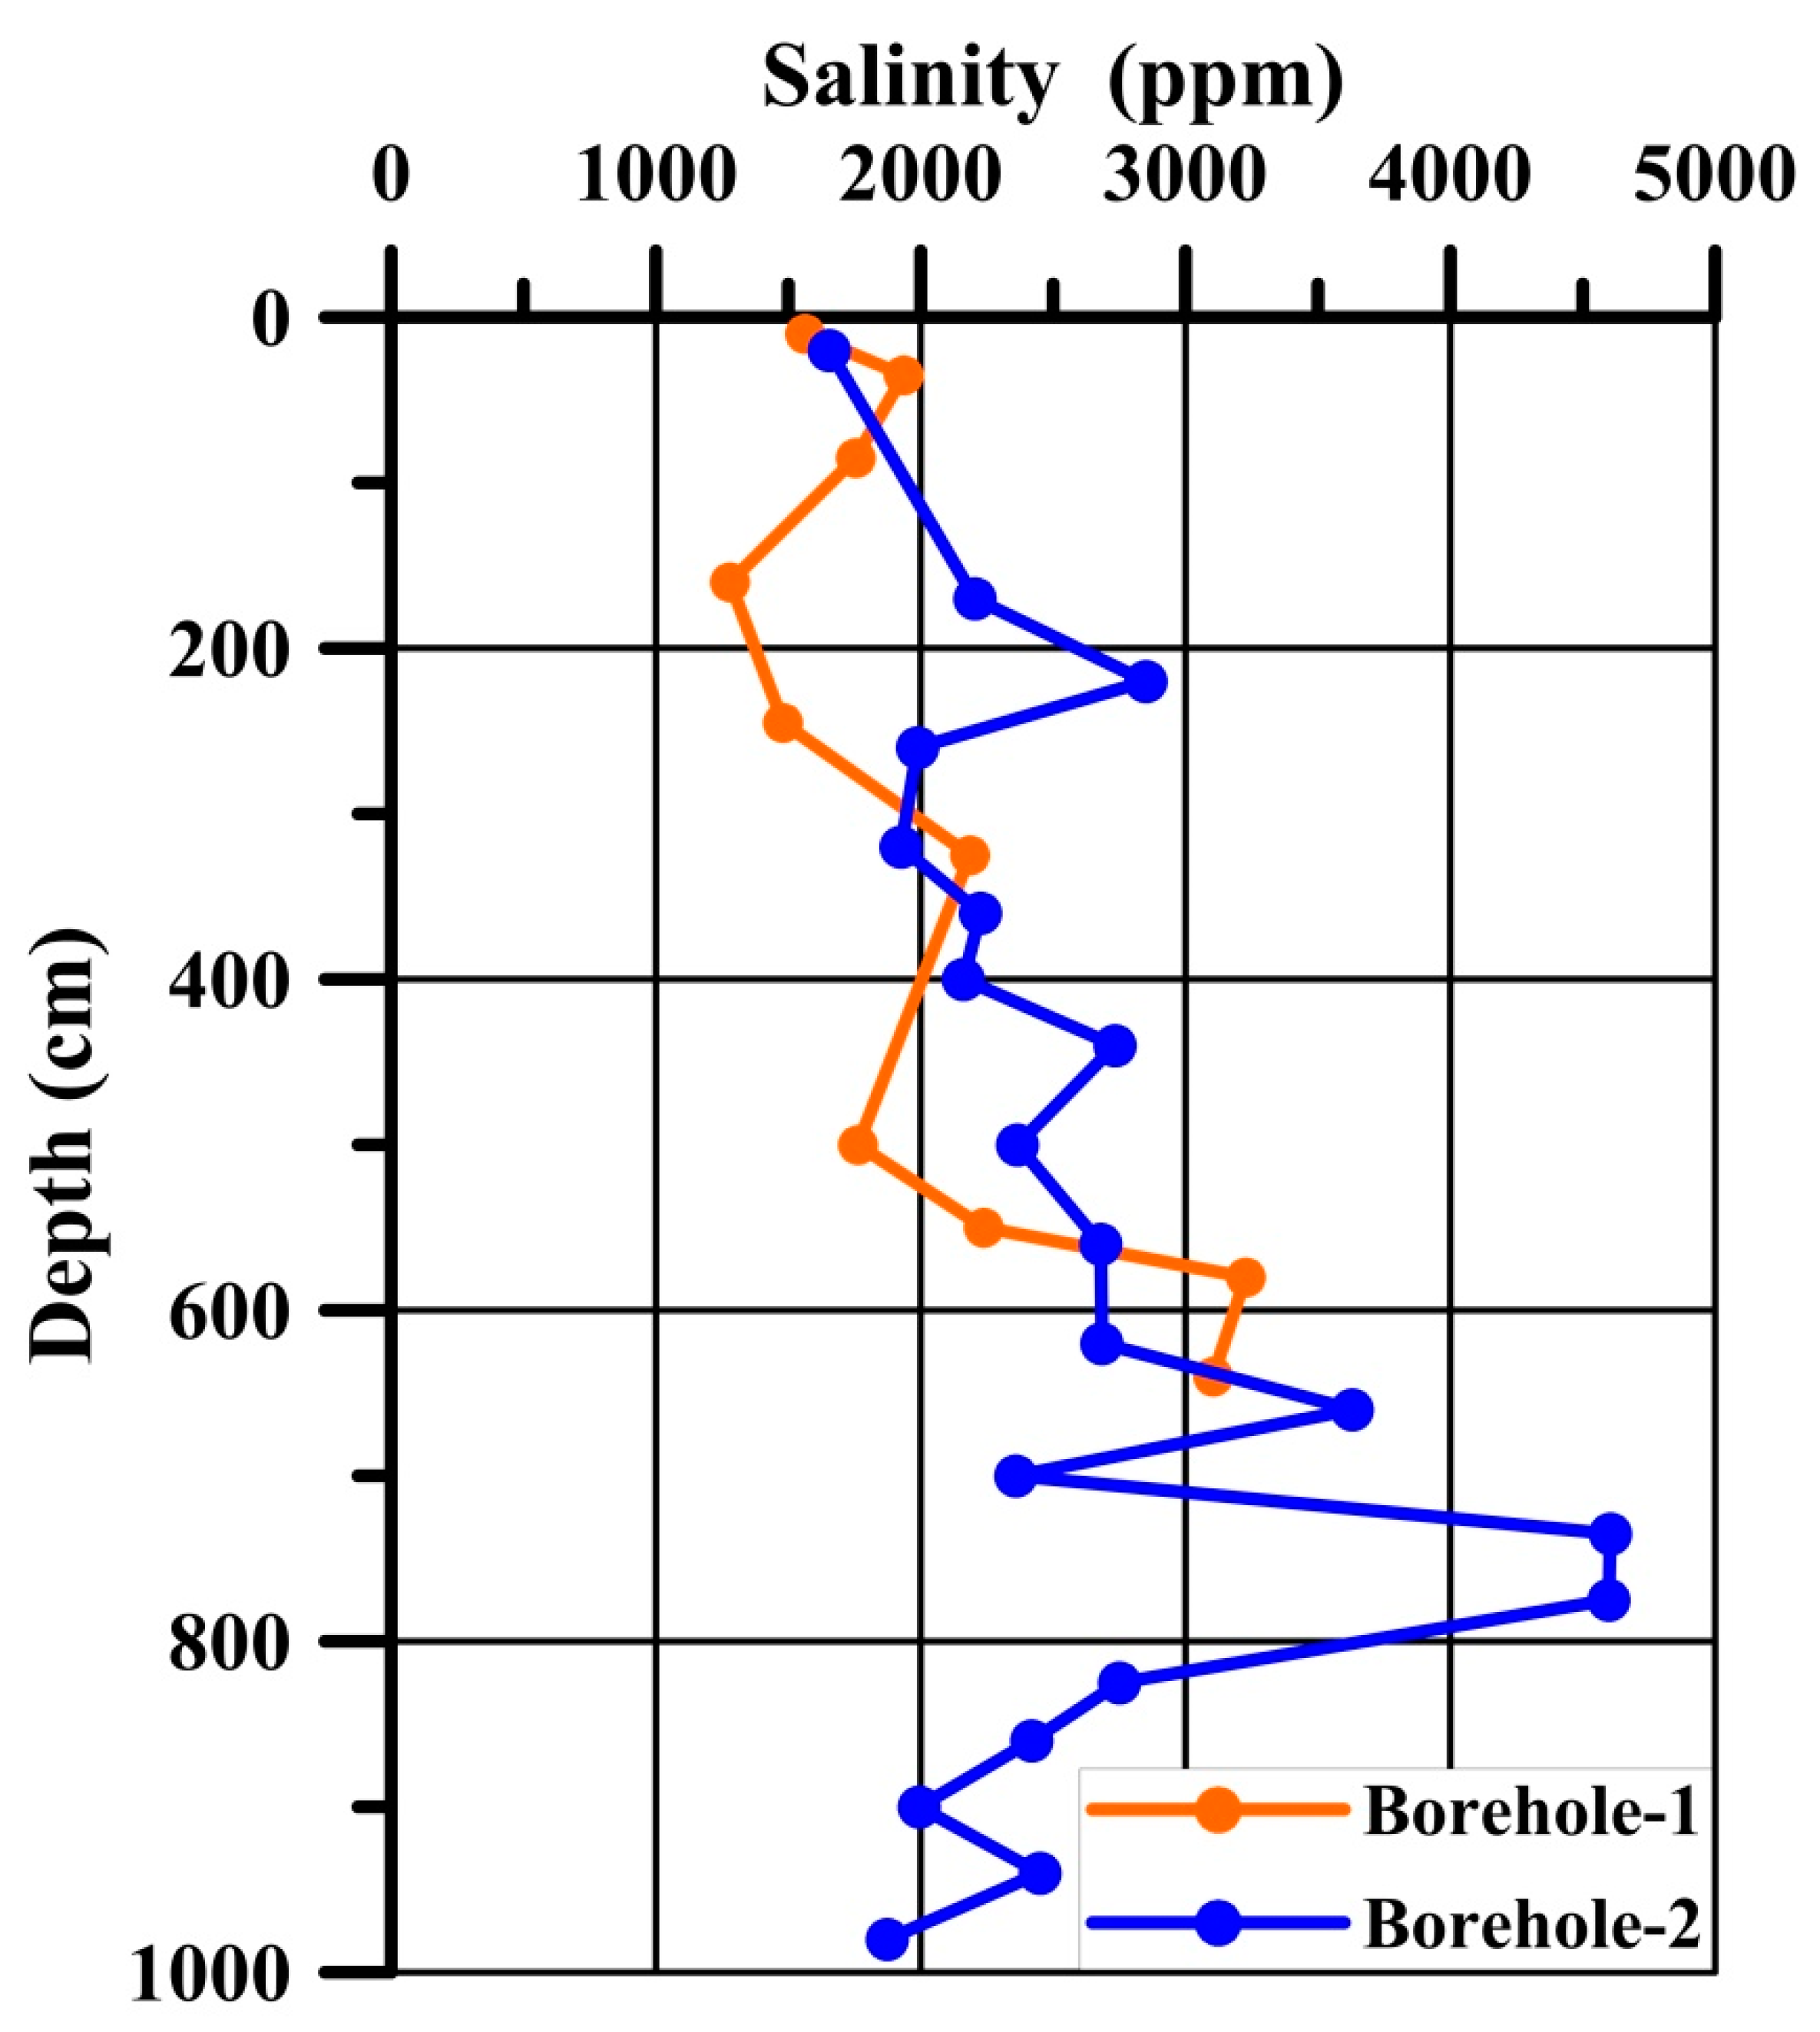
2.3.2. Salinity
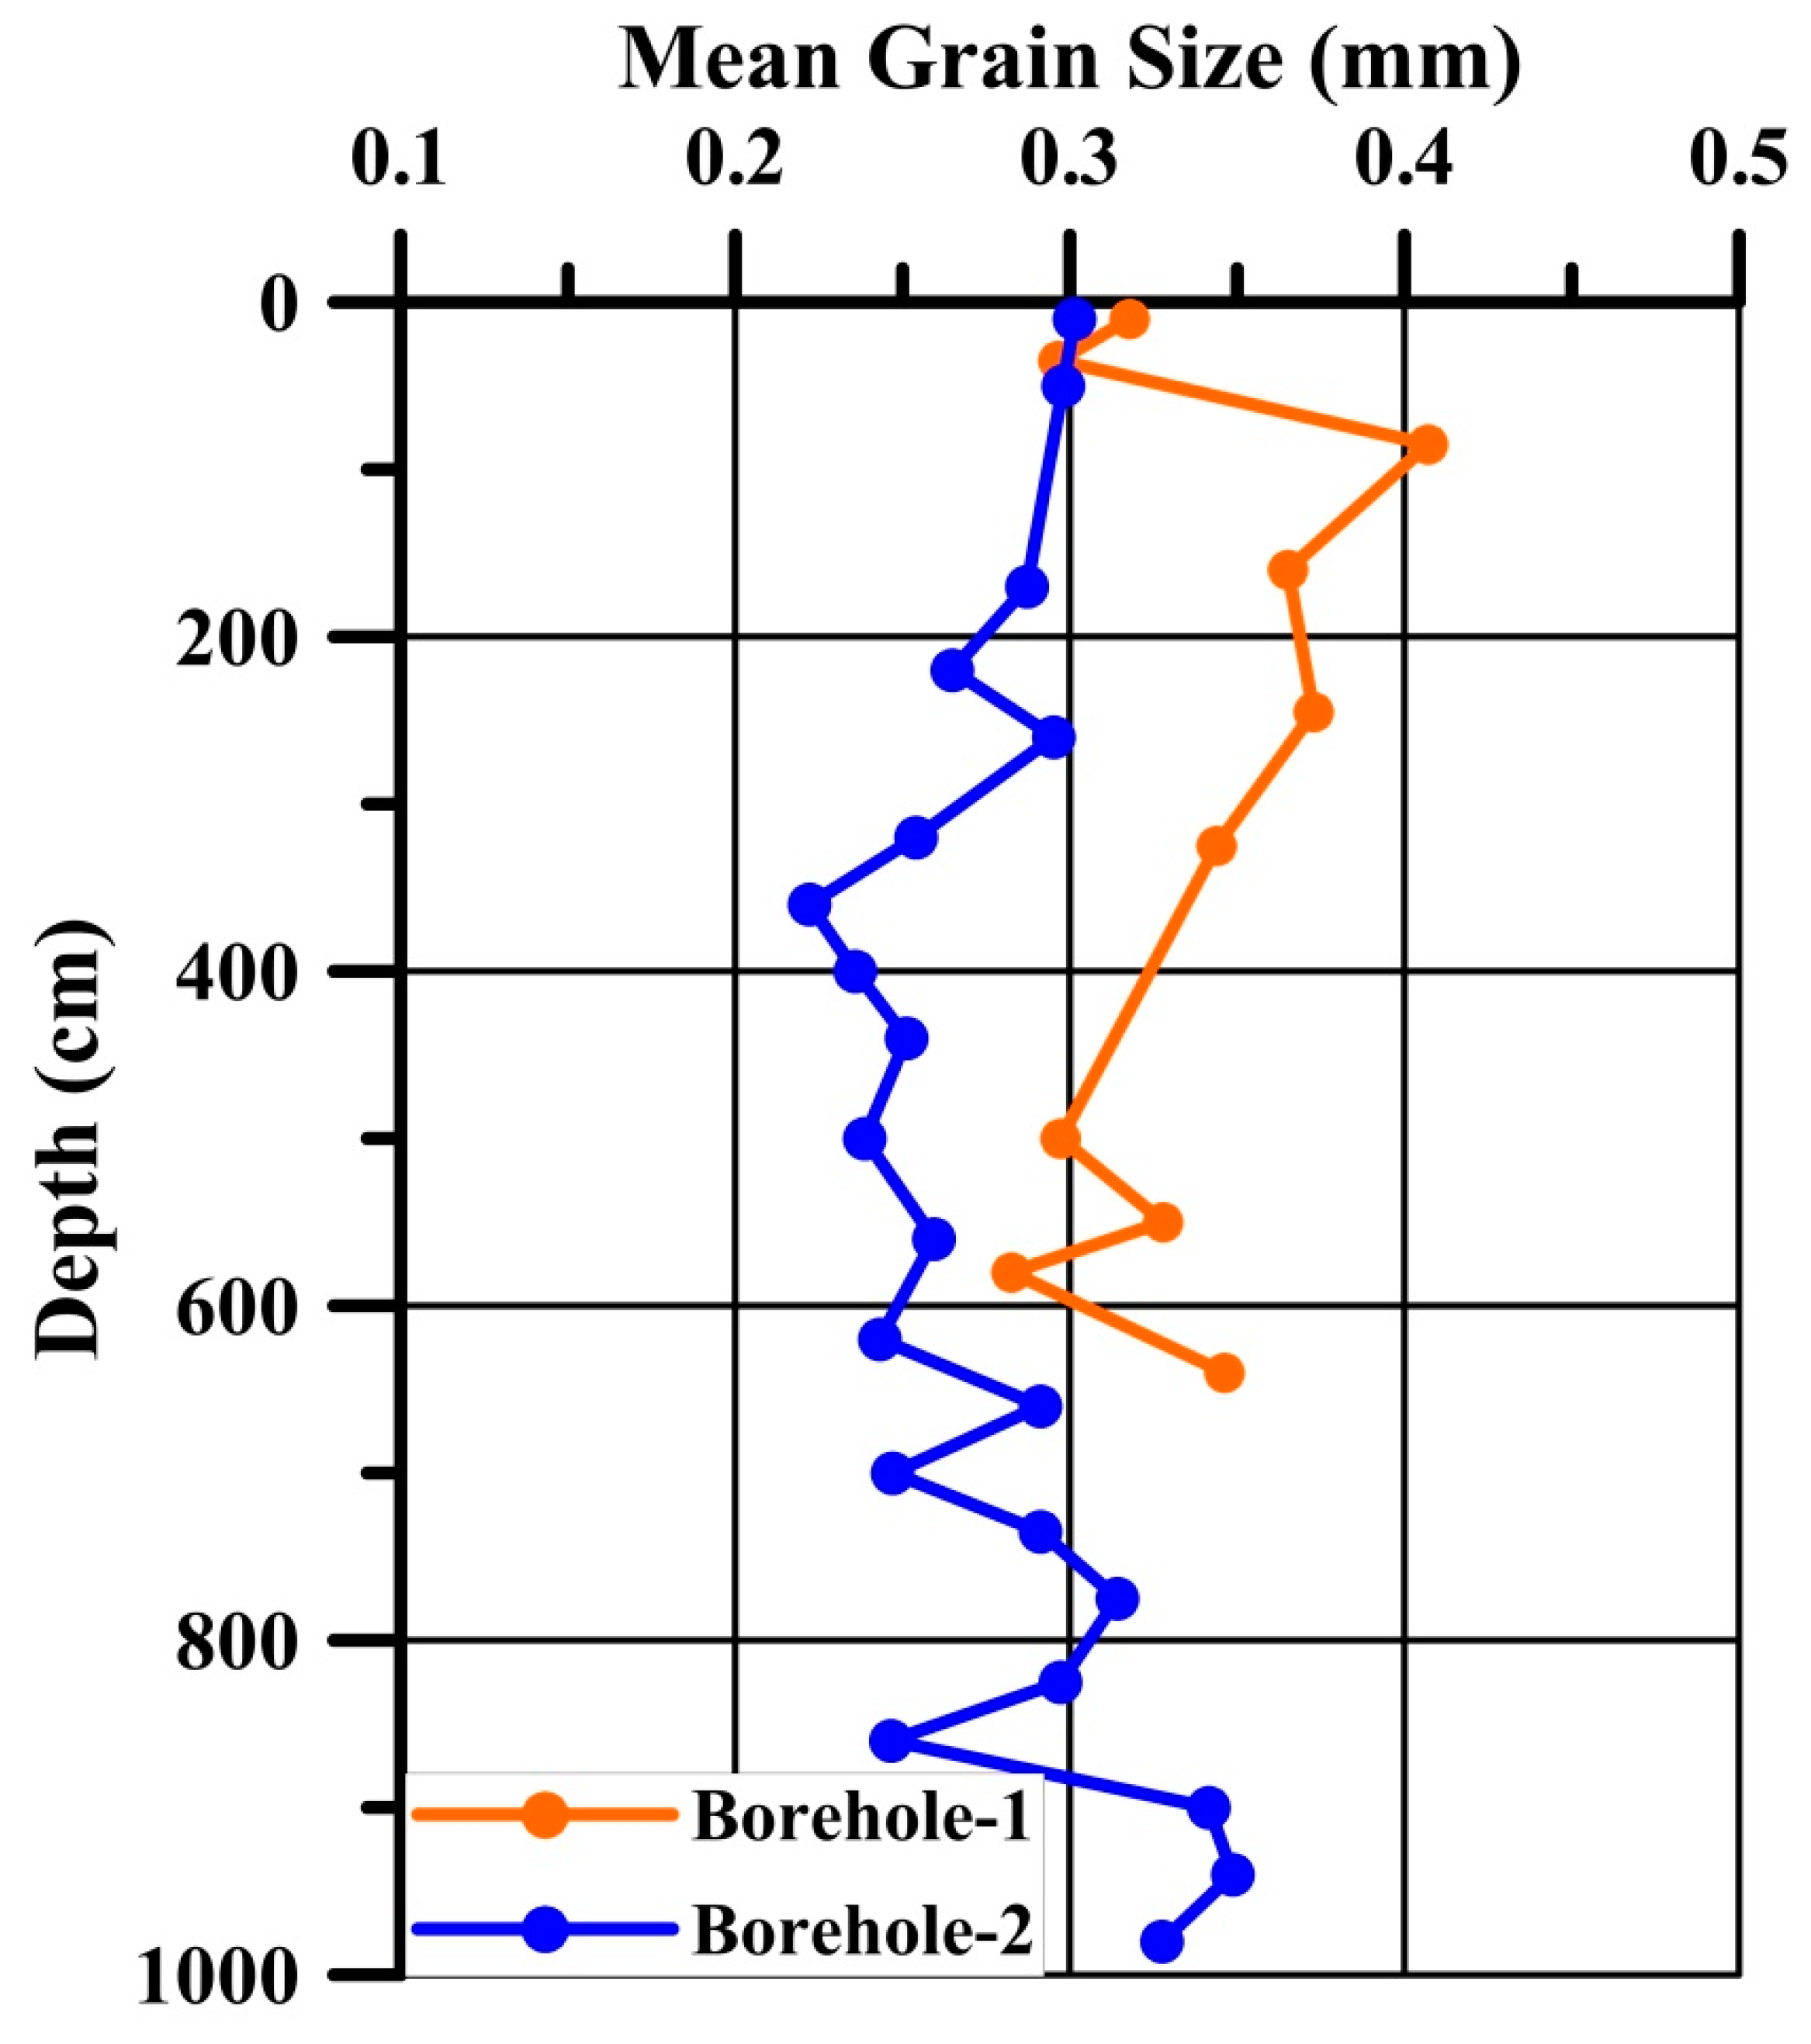
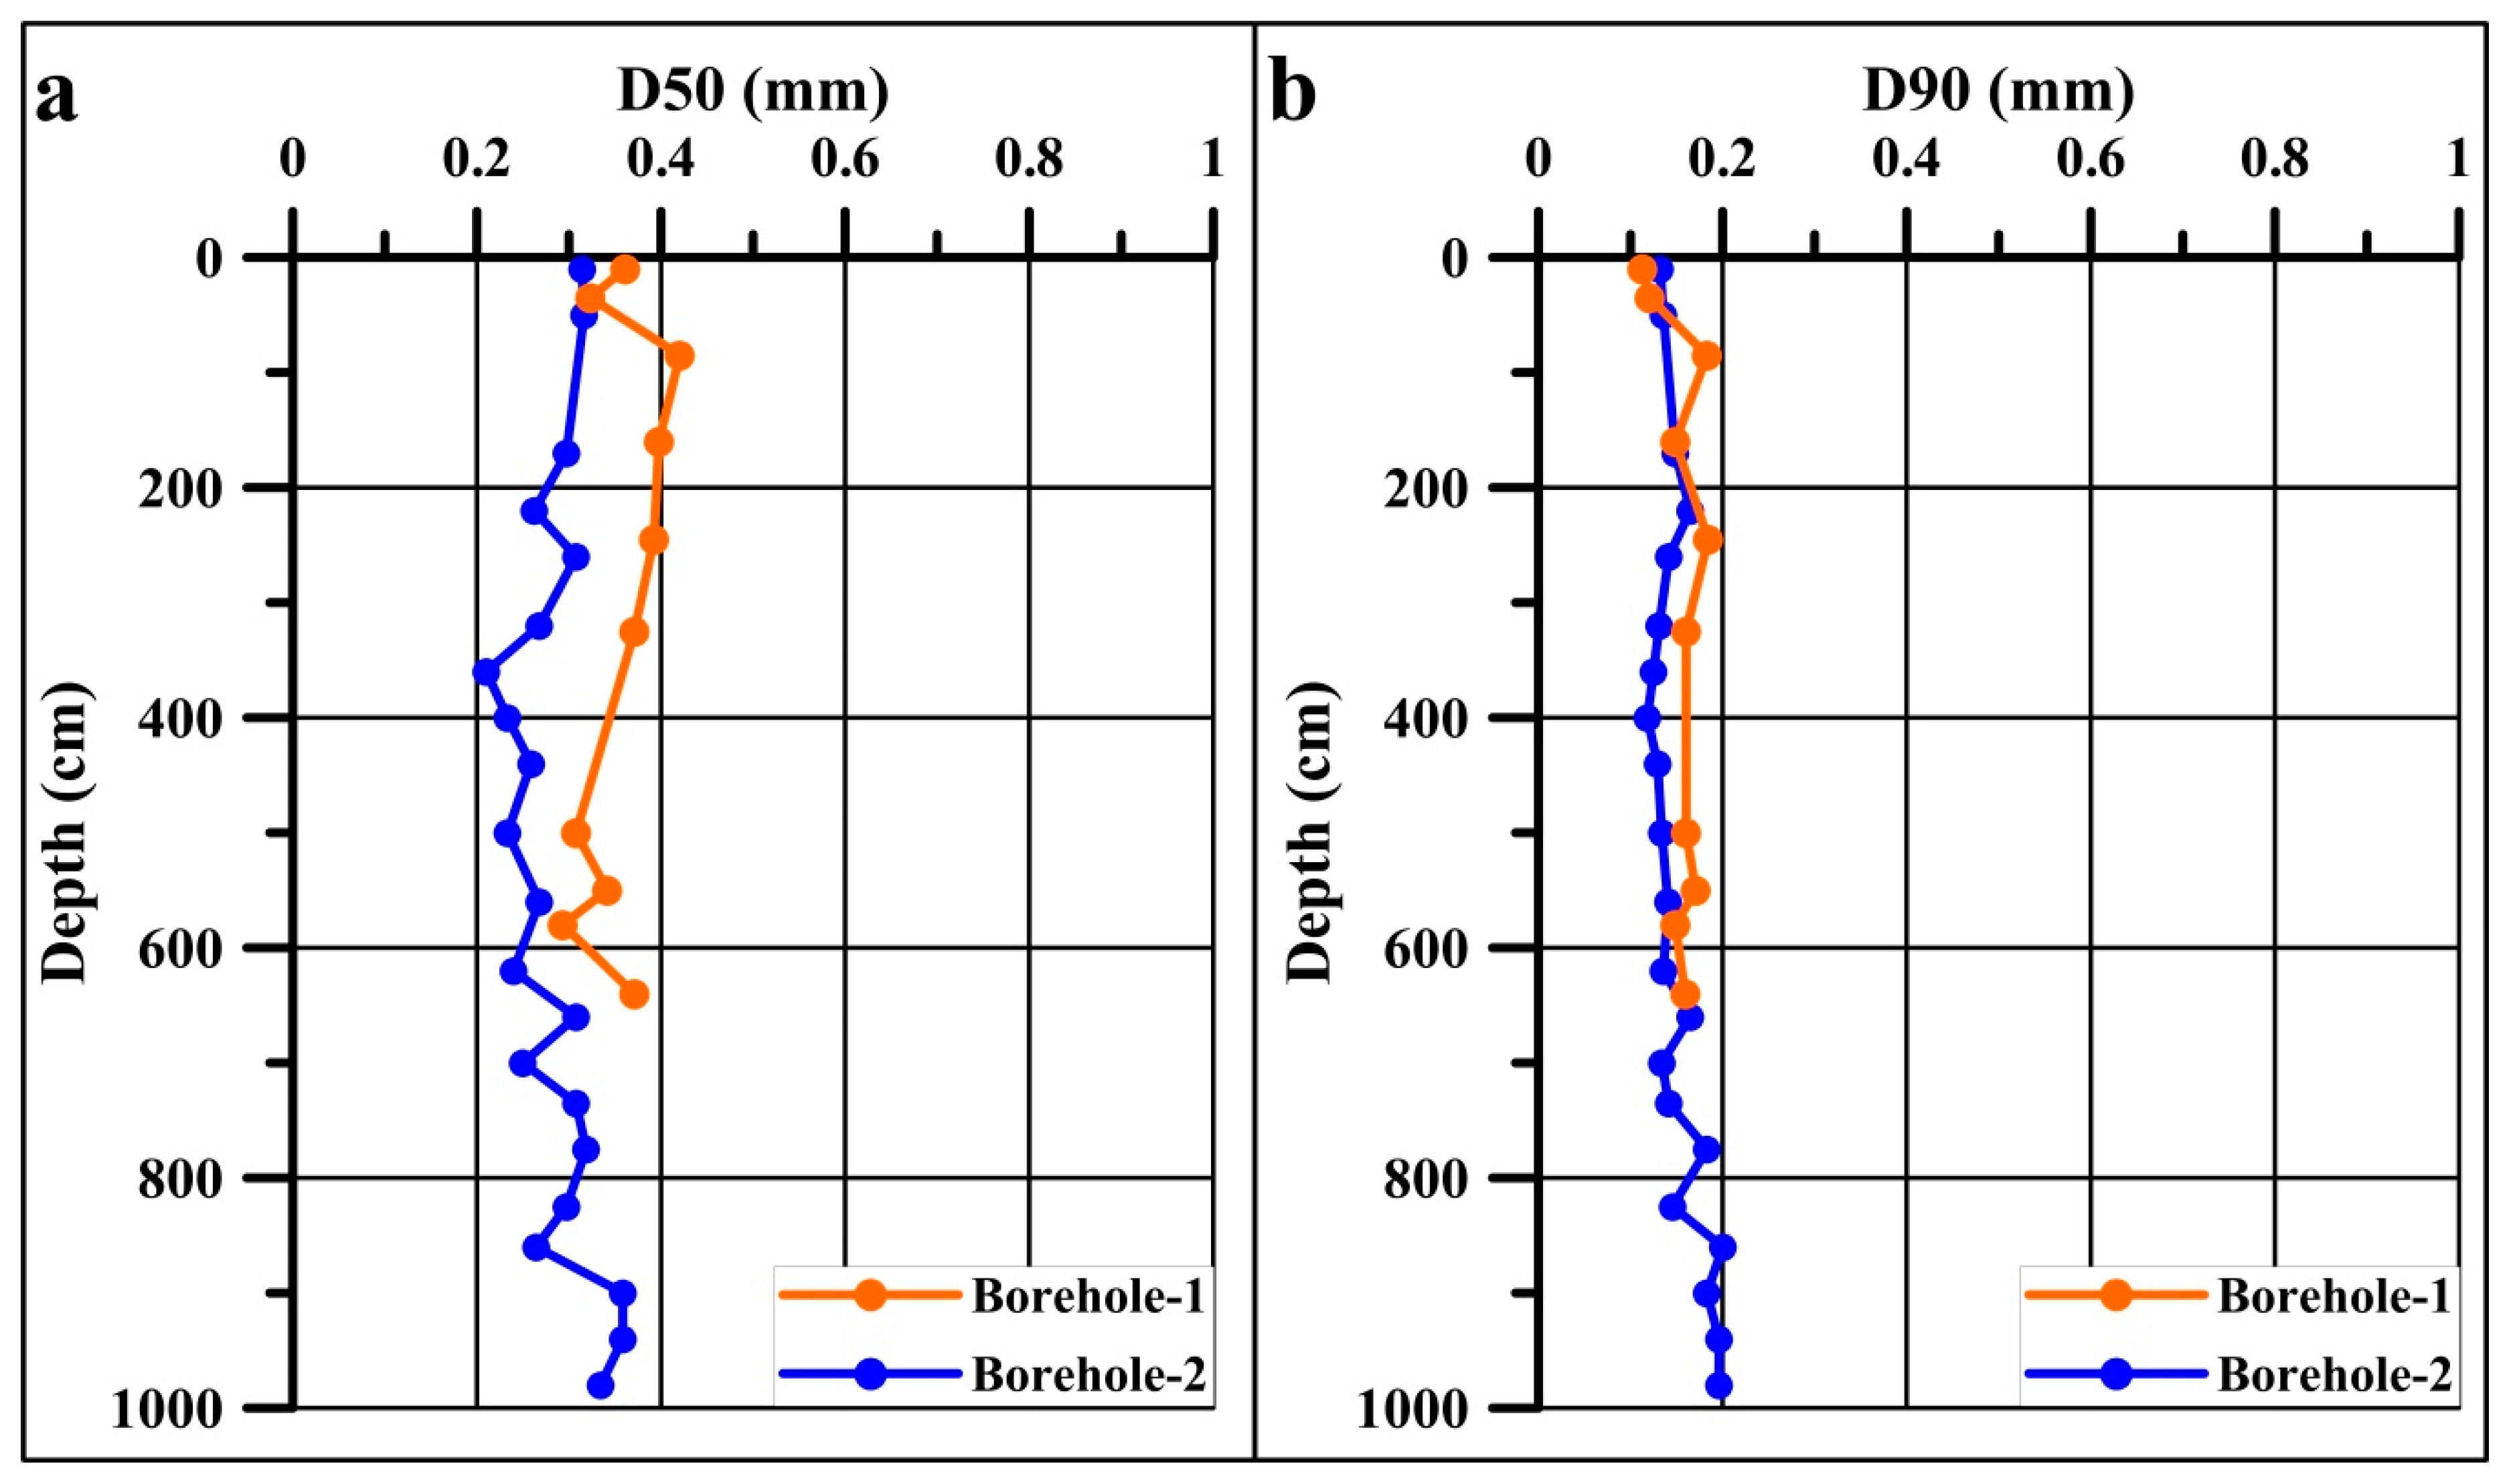
2.3.3. Grain Size Distribution
2.3.4. Mineral and Chemical Composition
3. Results
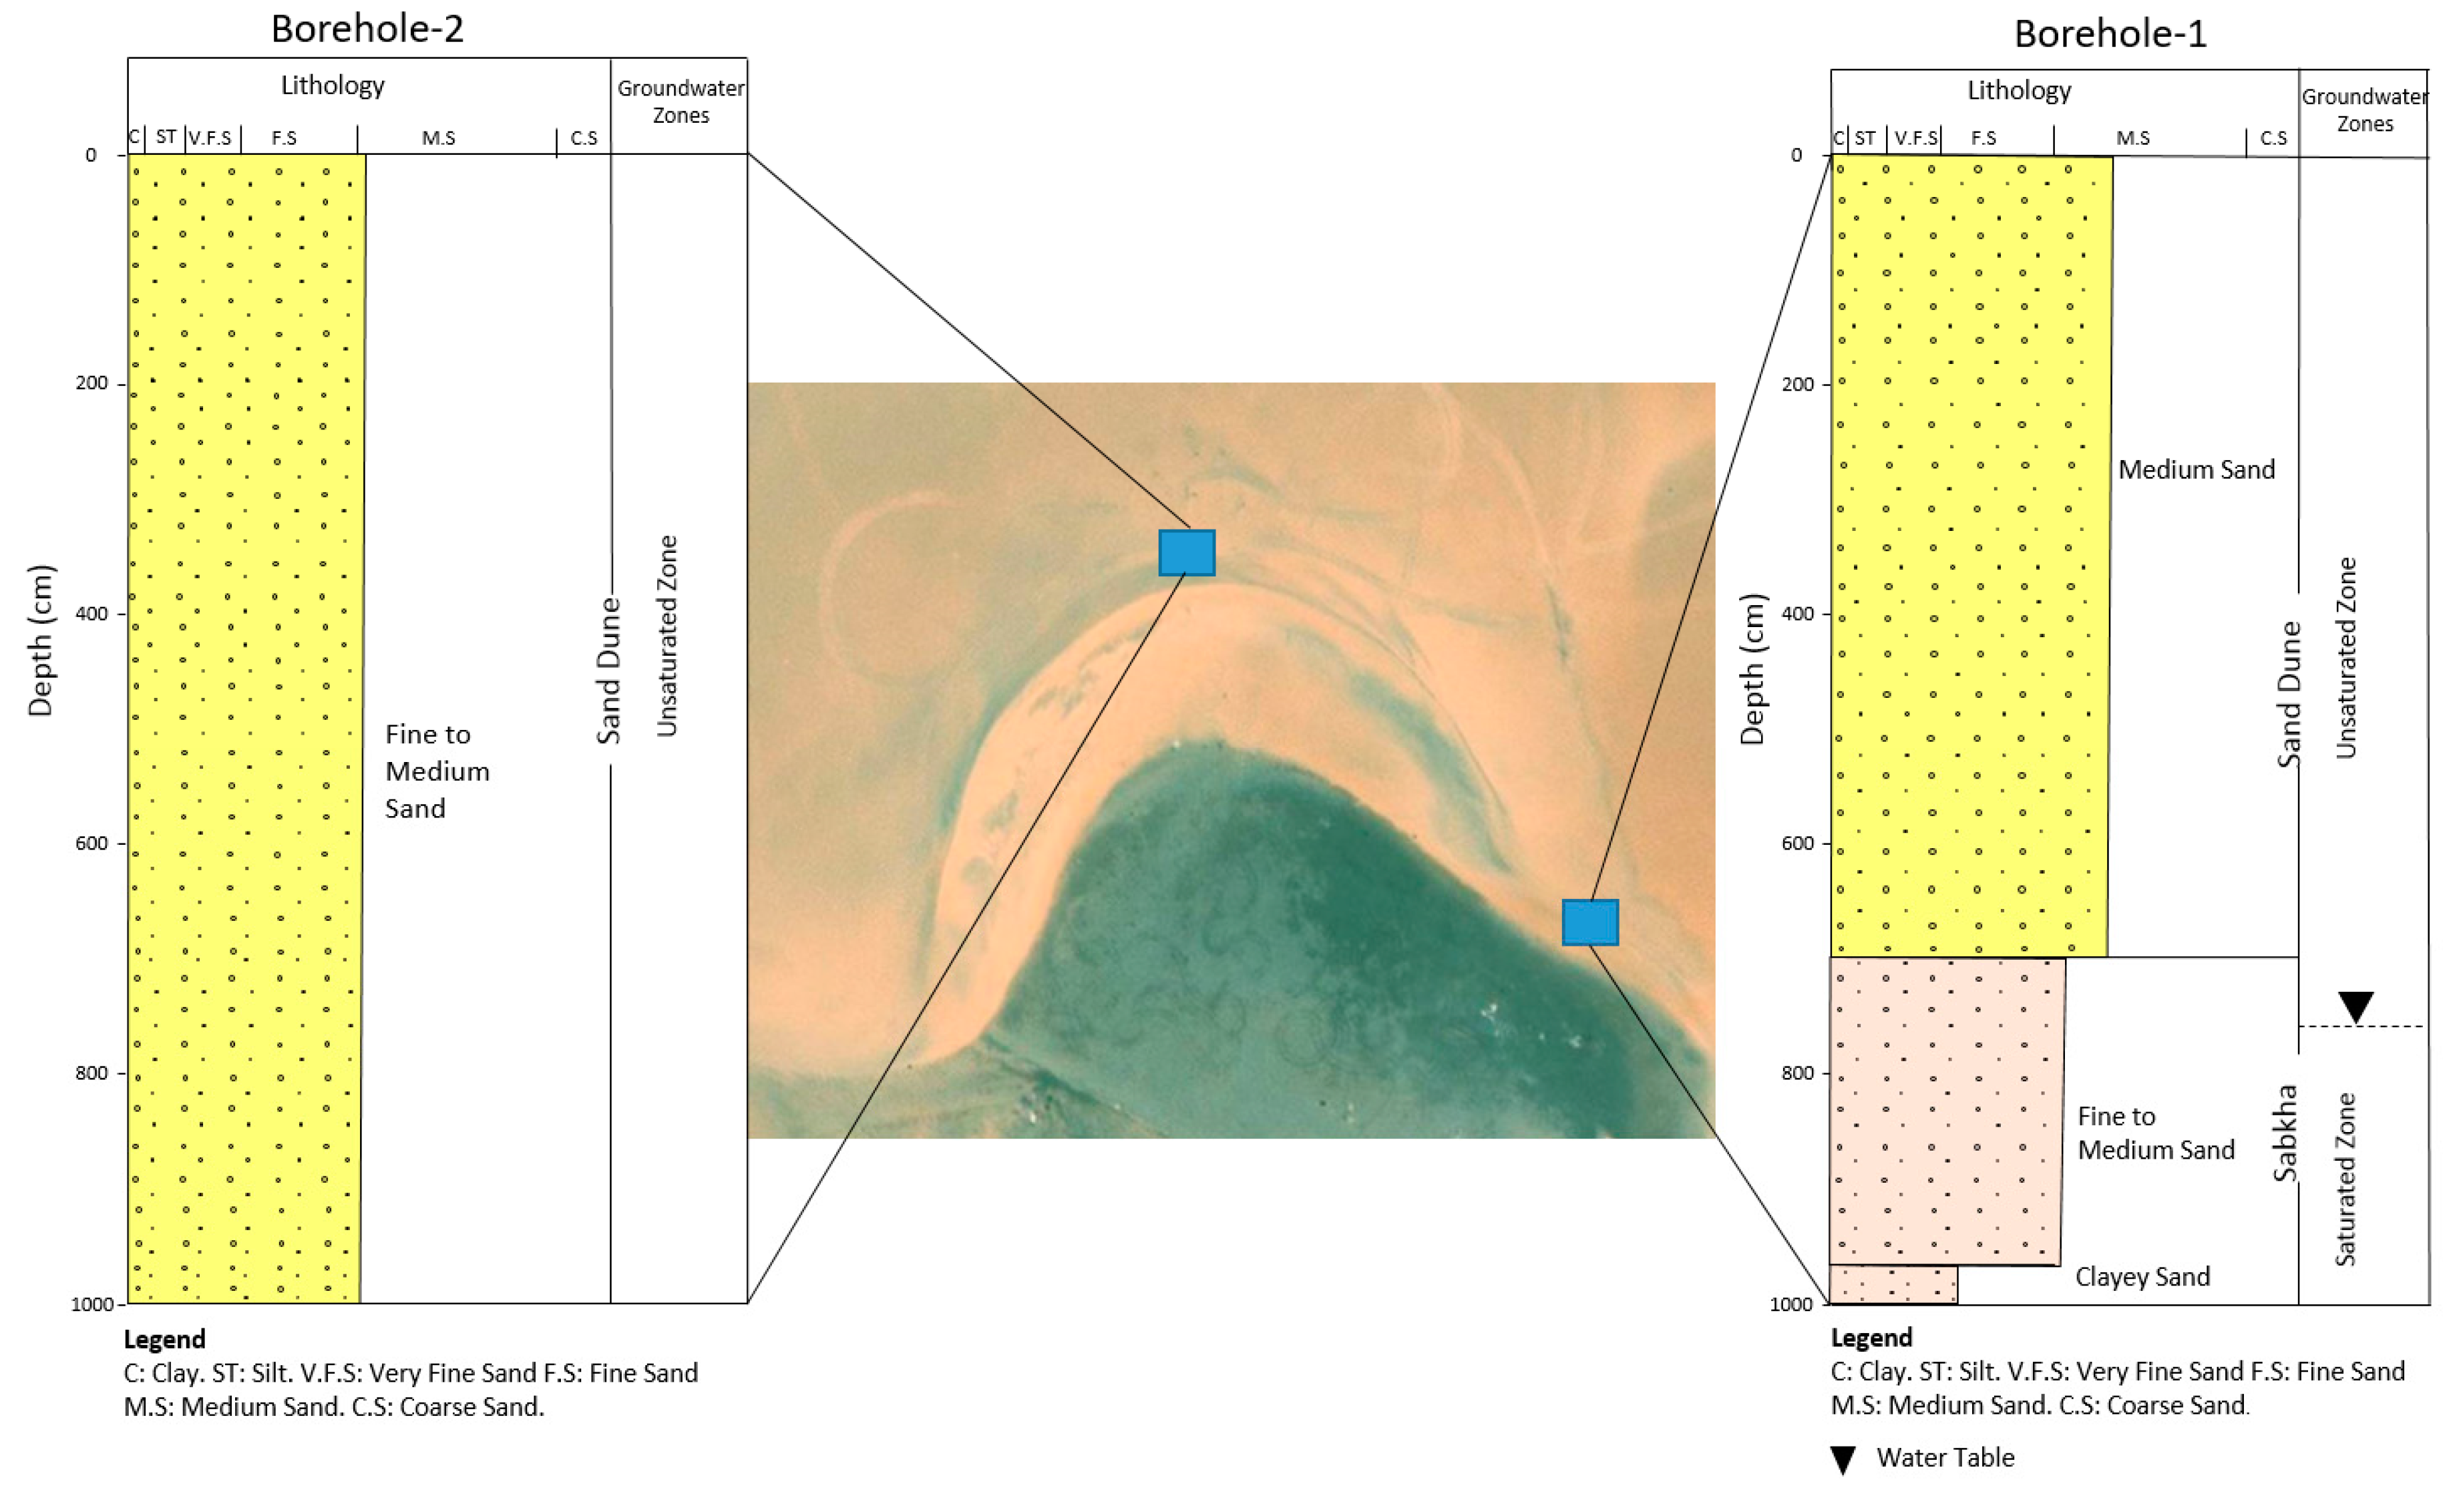
3.1. Lithology of the Sand Dune
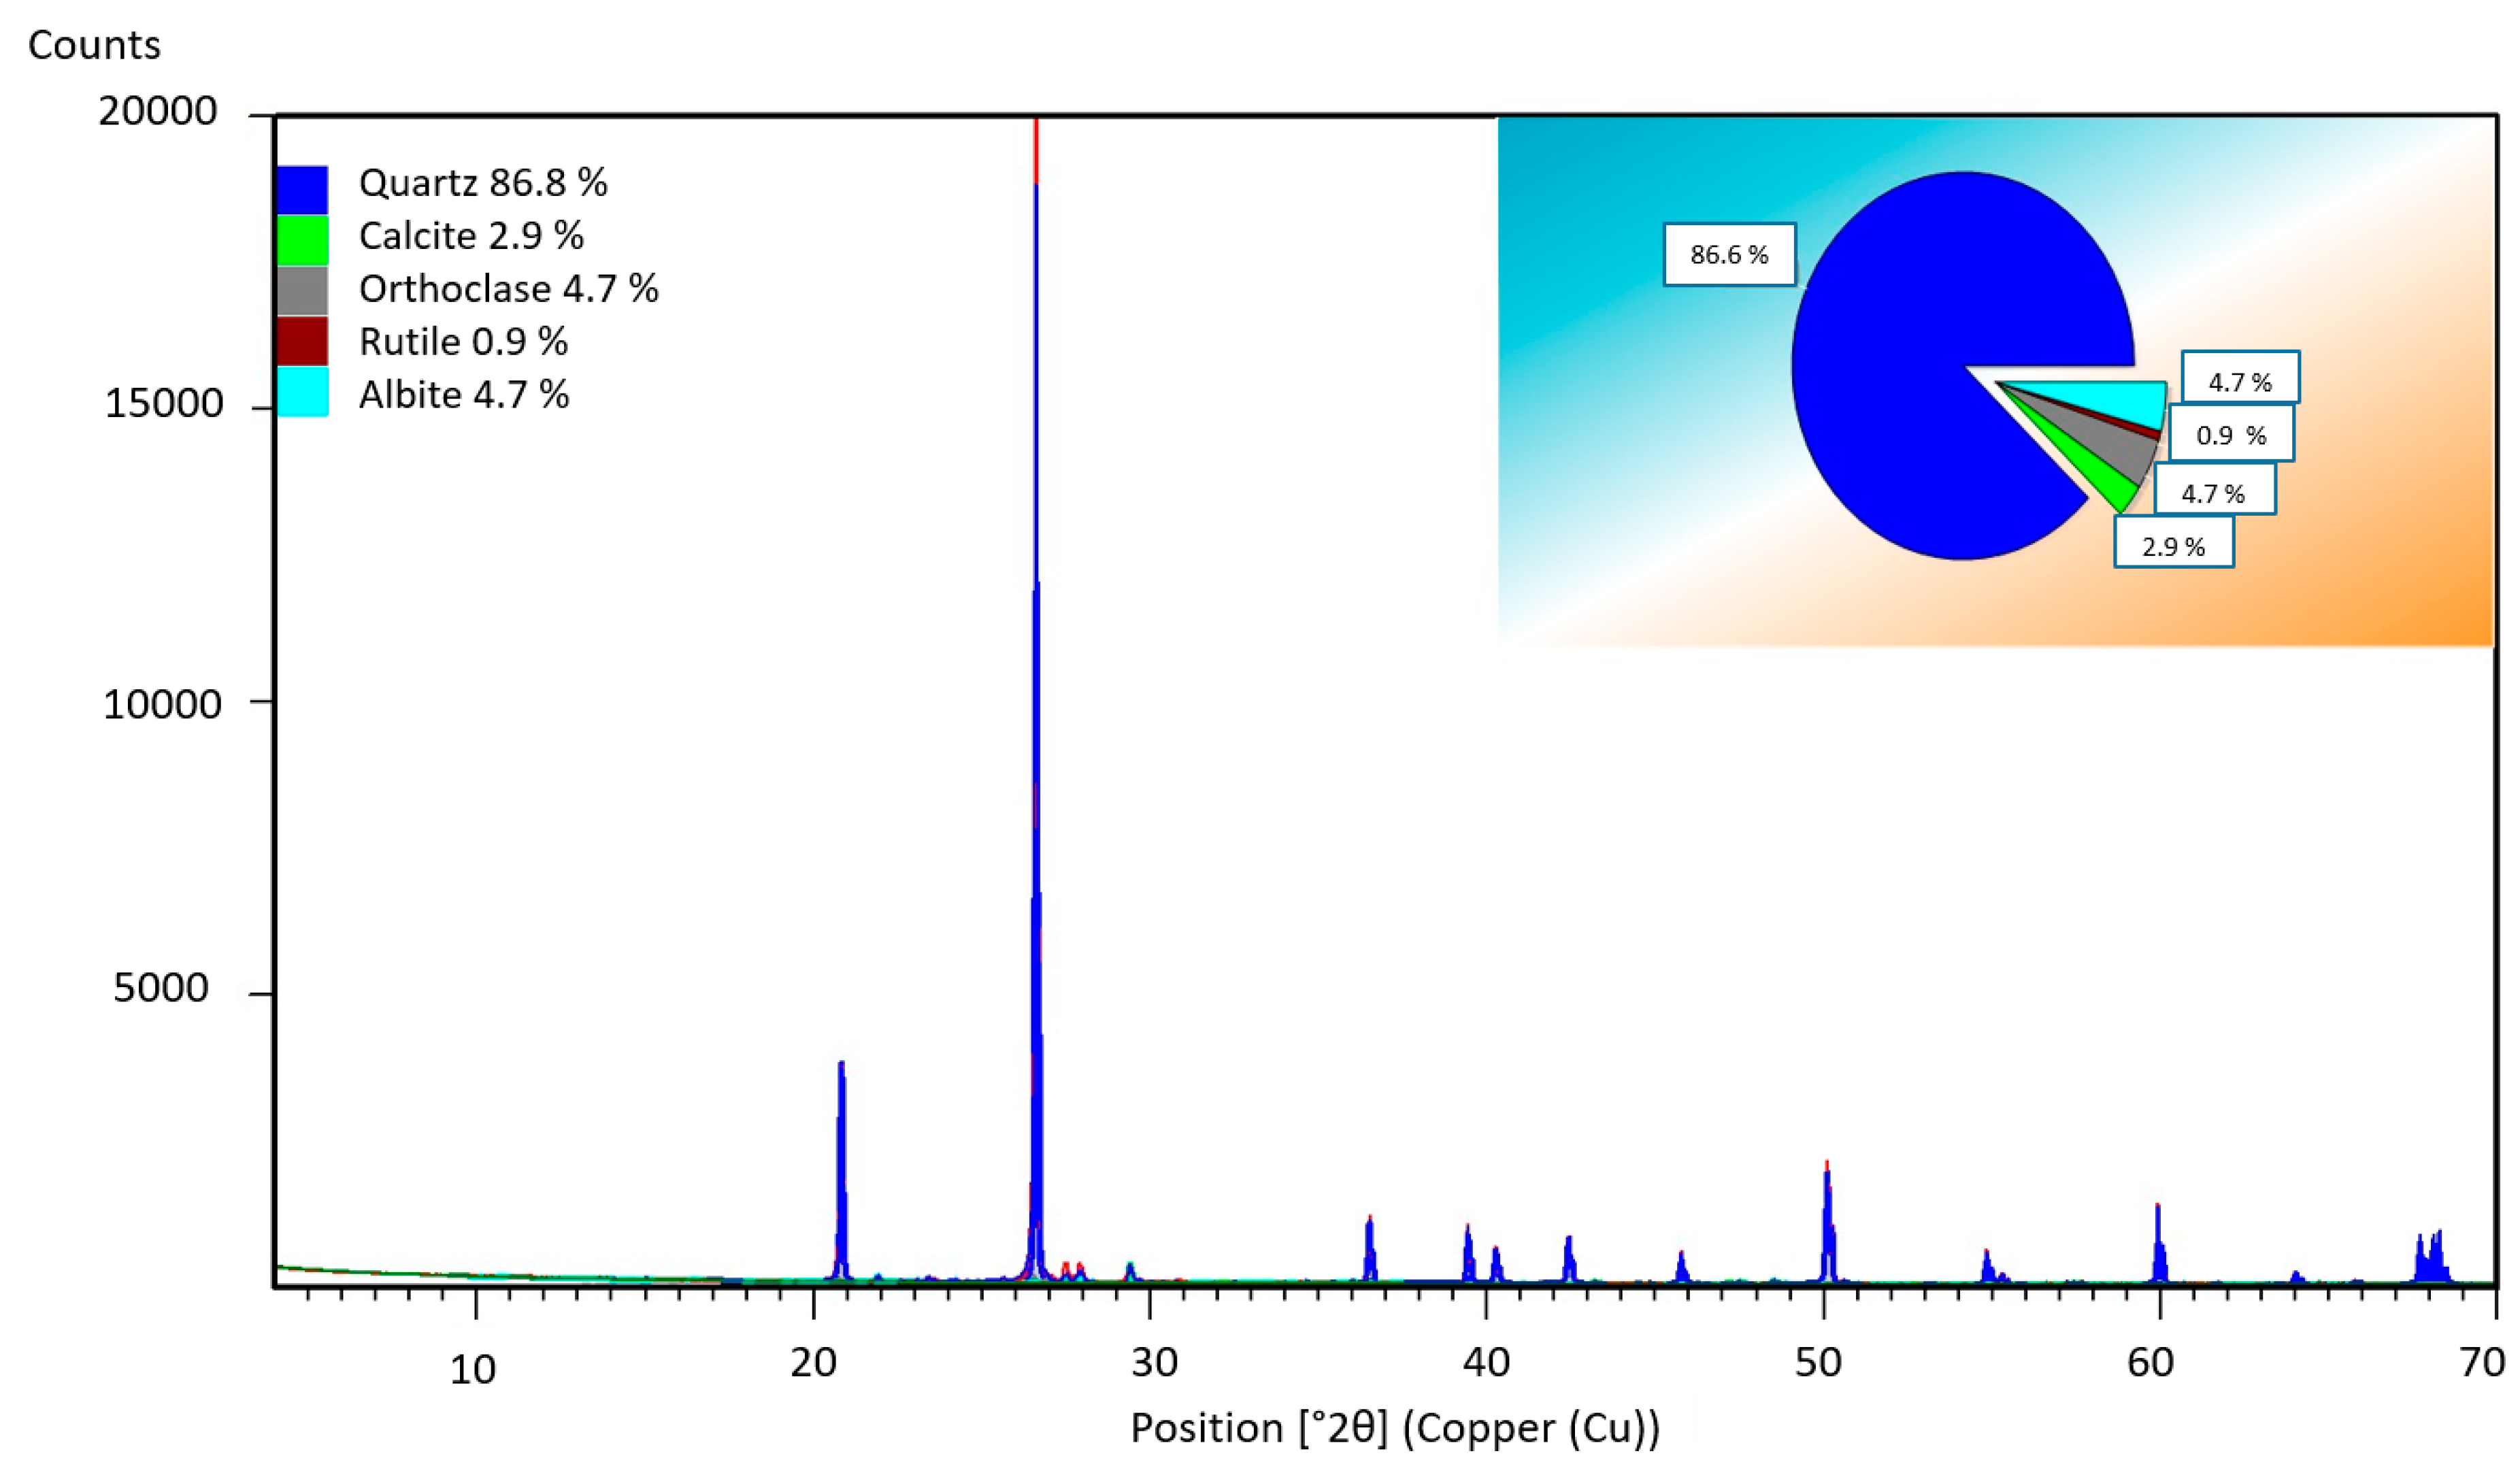
3.2. Mineral Composition of Sands
3.3. Water Content
3.4. Sand Salinity
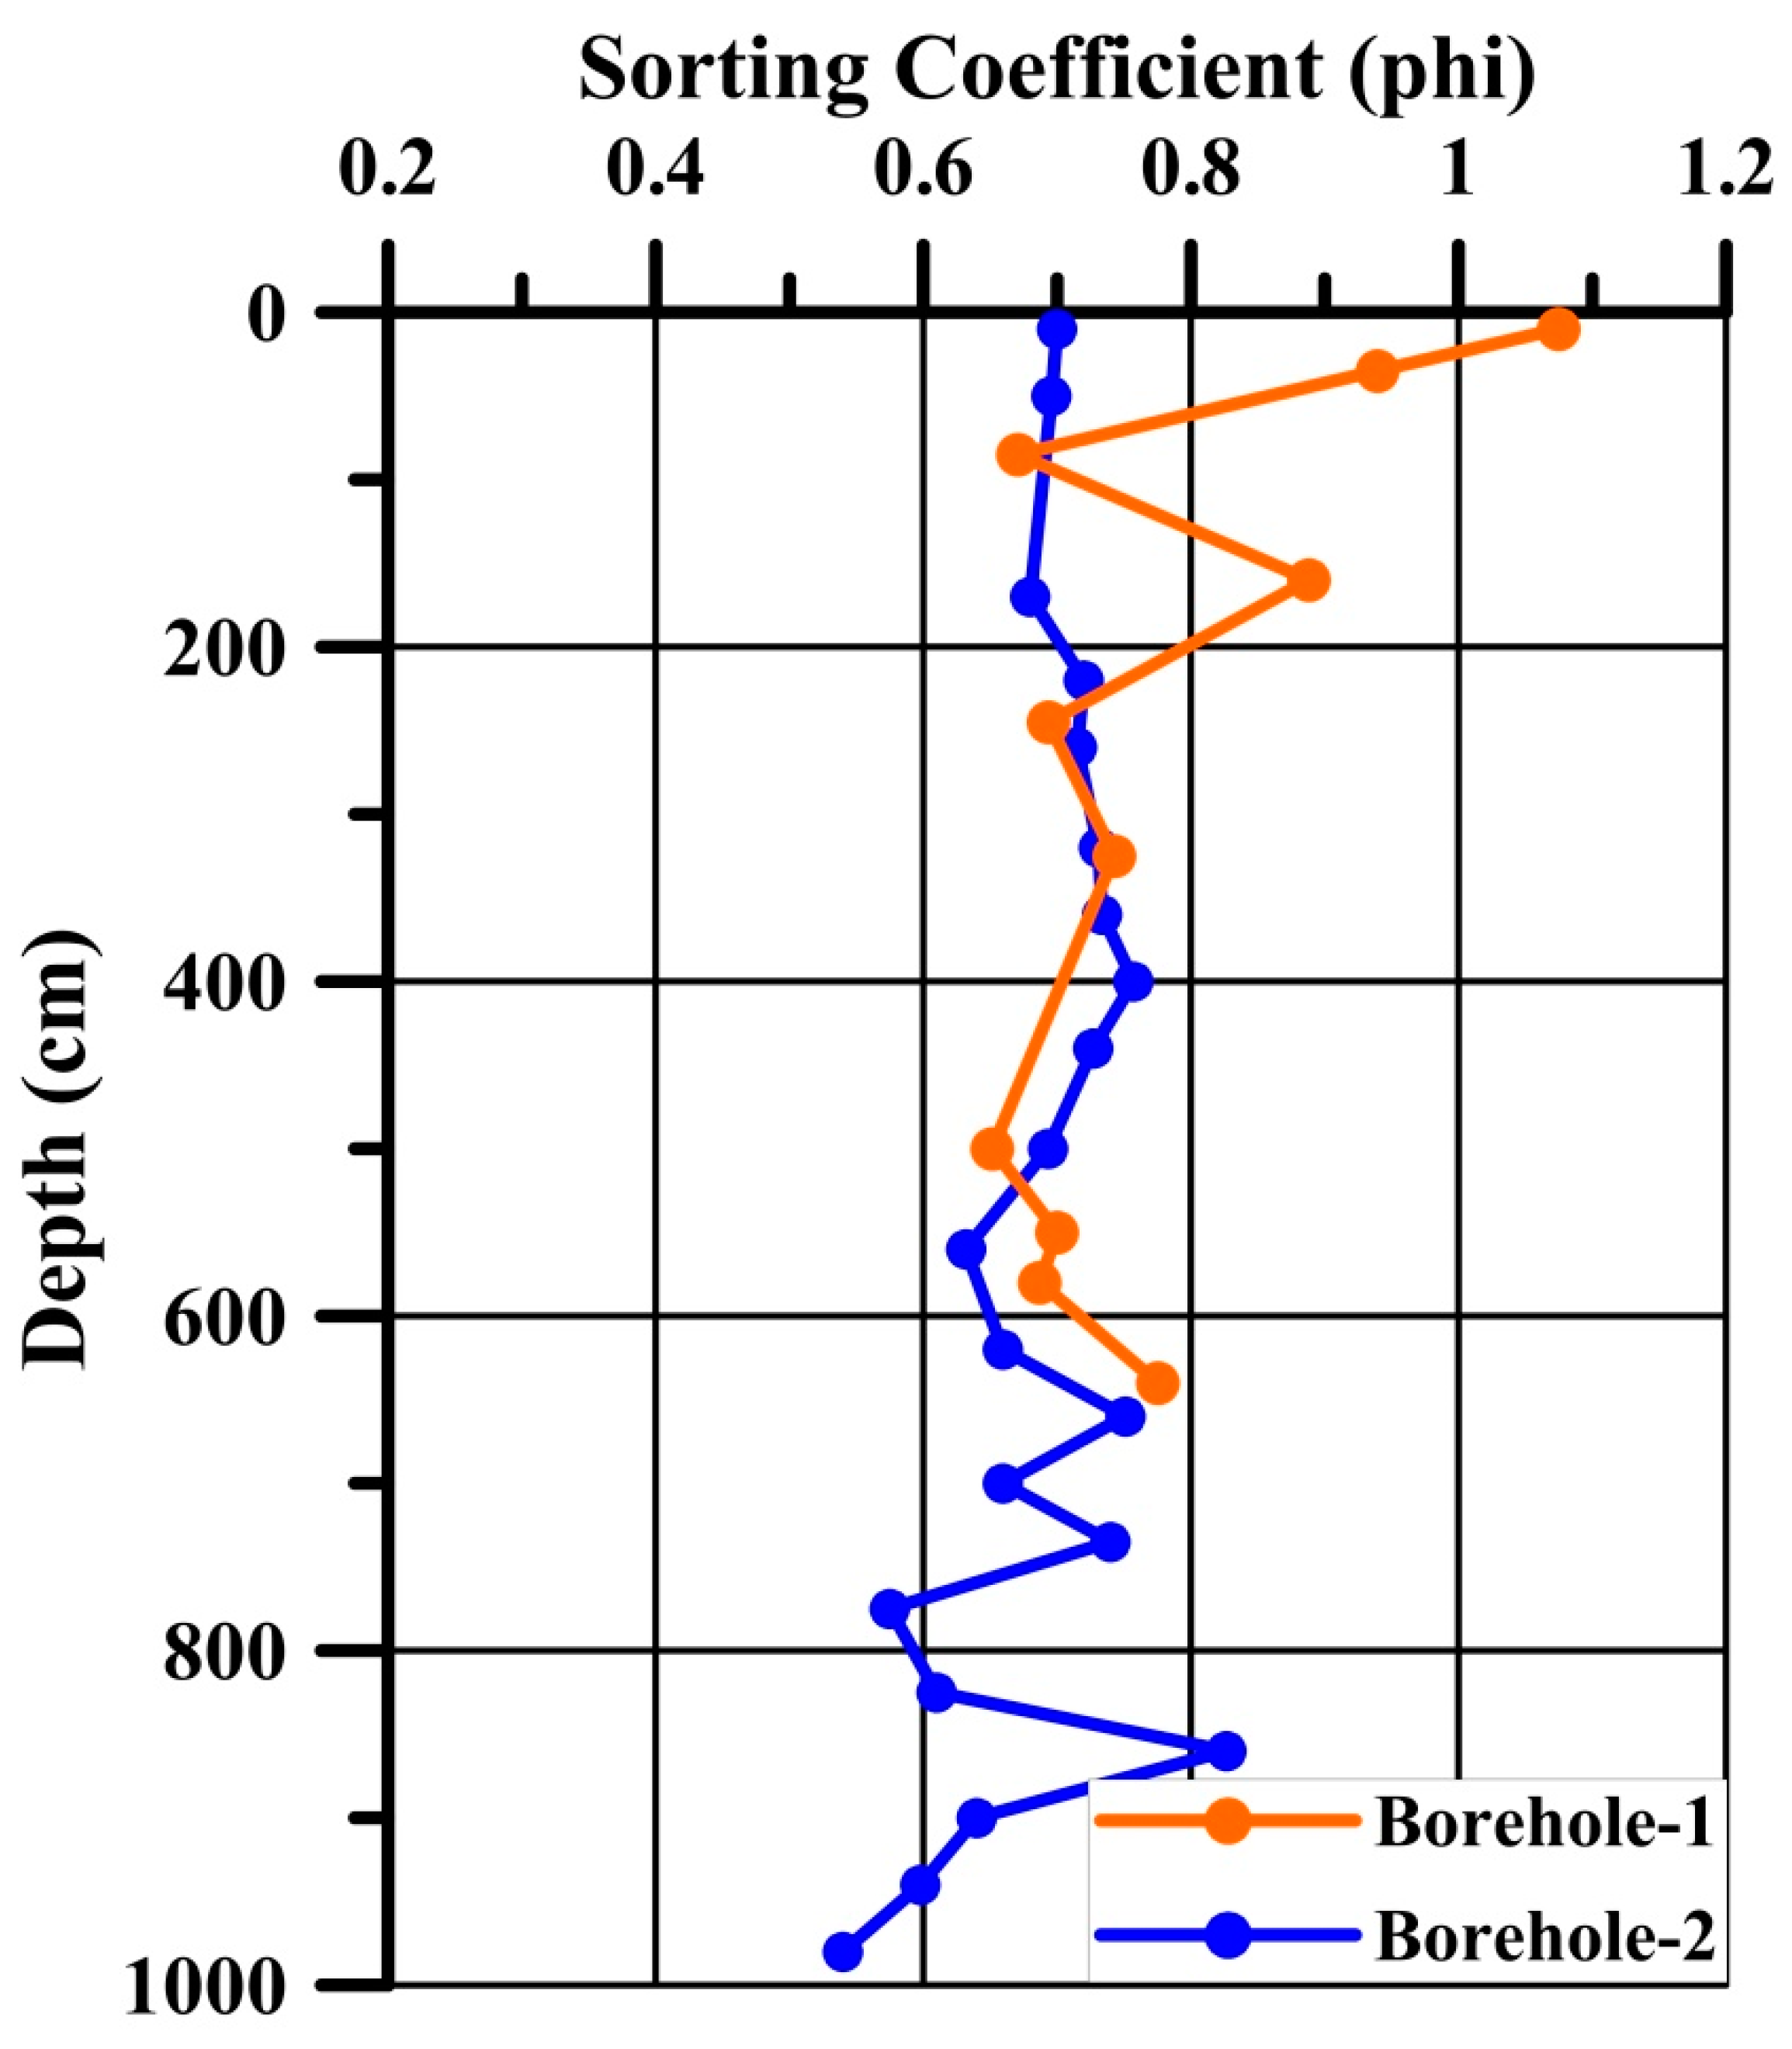
3.5. Sand Texture
3.6. Electrical Resistivity Results
- Zone 1: This zone shows high resistivity values (~660 Ohm-m) at the shallow depth (0 to 0.6 m). High values are associated with the dry sand on the top of the dune.
- Zone 2: The resistivity decreases to about 170 Ohm-m at a depth between 0.6 m and 1.3 m, and is marked as “A” in Figure 10. This low-resistivity zone is associated with high water content as shown in Figure 5, due to the infiltrated rainwater from the last precipitation event, and it is vertically-shifted down in the ERT section.
- Zone 3: At a depth ranging from 2.5 m to 5.8 m, the resistivity increases to 1300 Ohm-m, and is marked as “B” in Figure 10. This corresponds to the dry sand.
- Zone 4: Finally, the resistivity gradually decreases until reaching 4.6 Ohm-m at the bottom of the ERT section. This is due to the effects of the saline groundwater and the sabkha layer.
4. Discussion
5. Conclusions
Author Contributions
Funding
Acknowledgments
Conflicts of Interest
References
- Edgell, S. Arabian Deserts: Nature, Origin and Evolution; Springer: Dordrecht, The Netherlands, 2006; pp. 1–644. [Google Scholar]
- Anton, D. Modern eolian deposits of the eastern province of Saudi Arabia. Dev. Sedimentol. 1983, 38, 365–378. [Google Scholar]
- Fryberger, S.G.; AL-SARI, A.M.; Clisham, T.J.; Rizvi, S.A.; AL-HINAI, K.G. Wind sedimentation in the Jafurah sand sea, Saudi Arabia. Sedimentology 1984, 31, 413–431. [Google Scholar] [CrossRef]
- Garzanti, E.; Vermeesch, P.; Andò, S.; Vezzoli, G.; Valagussa, M.; Allen, K.; Kadi, K.A.; Al-Juboury, A.I. Provenance and recycling of Arabian desert sand. Earth-Science Rev. 2013, 120, 1–19. [Google Scholar] [CrossRef]
- Anton, D.; Vincent, P. Parabolic dunes of the Jafurah desert, eastern province, Saudi Arabia. J. Arid Environ. 1986, 11, 187–198. [Google Scholar] [CrossRef]
- Benaafi, M.; Abdullatif, O. Sedimentological, mineralogical, and geochemical characterization of sand dunes in Saudi Arabia. Arab. J. Geosci. 2015, 8, 11073–11092. [Google Scholar] [CrossRef]
- Lebbe, L.C. Mathematical model of the evolution of the fresh water lens under the dunes and beach with semi-diurnal tides. in 8th salt water intrusion meeting, Bari. Geol. Appl. Idrogeol. 1983, 18, 211–226. [Google Scholar]
- Greggio, N.; Giambastiani, B.; Balugani, E.; Amaini, C.; Antonellini, M. High-Resolution Electrical Resistivity Tomography (ERT) to Characterize the Spatial Extension of Freshwater Lenses in a Salinized Coastal Aquifer. Water 2018, 10, 1067. [Google Scholar] [CrossRef] [Green Version]
- Newton, B.T.; Allen, B. Hydrologic Investigation at White Sands National Monument; Aquifer Mapping Program; New Mexico Bureau of Geology and Mineral Resources: Socorro, NM, USA, 2014; Available online: https://geoinfo.nmt.edu/publications/openfile/downloads/500-599/559/OFR559_White_Sands_with_Appendices_LR.pdf (accessed on 27 February 2020).
- Kowalczyk, S.; Żukowska, K.A.; Mendecki, M.J.; Łukasiak, D. Application of electrical resistivity imaging (ERI) for the assessment of peat properties: A case study of the Całowanie Fen, Central Poland. Acta Geophys. 2017, 65, 223–235. [Google Scholar] [CrossRef] [Green Version]
- Groen, M.; Kok, A.; van der Made, K.J.; Post, V.E.A. The use of mapping the salinity distribution using geophysics on the island of Terschelling for groundwater model calibration. In Proceedings of the 20th Salt Water Intrusion Meeting, Naples, FL, USA, 23–27 June 2008. [Google Scholar]
- Loke, M.H.; Chambers, J.E.; Rucker, D.F.; Kuras, O.; Wilkinson, P.B. Recent developments in the direct-current geoelectrical imaging method. J. Appl. Geophys. 2013, 95, 135–156. [Google Scholar] [CrossRef]
- Hanafy, S.M. Mapping the Qademah fault with traveltime, surface-wave, and resistivity tomograms. In SEG Technical Program Expanded Abstracts; SEG: New Orleans, LA, USA, 2015; pp. 3347–3351. [Google Scholar]
- Hanafy, S.M.; Jonsson, S.; Klinger, Y. Imaging normal faults in alluvial fans using geophysical techniques: Field example from the coast of Gulf of Aqaba, Saudi Arabia. In SEG Technical Program Expanded Abstracts; SEG: Denver, CO, USA, 2014; pp. 4670–4674. [Google Scholar]
- Loke, M.H. Electrical resistivity surveys and data interpretation. In Solid Earth Geophysics Encyclopedia, 2nd ed.; Springer: Berlin, Germany, 2011; pp. 276–283. [Google Scholar]
- Zohdy, A.A.; Eaton, G.P.; Mabey, D.R. Application of Surface Geophysics to Ground-Water Investigations; Techniques of Water-Resources Investigations, USGS: Reston, VA, USA, 1974; 116p. [Google Scholar] [CrossRef]
- Folk, R.L.; Ward, W.C. A Study in the Significance of Grain-Size Parameters. J. Sediment. Petrol. 1957, 27, 3–26. [Google Scholar] [CrossRef]
- Folk, R.L. Genesis of longitudinal and oghurd dunes elucidated by rolling upon grease. Geol. Soc. Am. Bull. 1971, 82, 3461–3468. [Google Scholar] [CrossRef]
- Sidwell, R.G.; Tanner, W.F. Sand grain patterns of west Texas dunes. Am. J. Sci. 1939, 237, 181–187. [Google Scholar] [CrossRef]
- Zhang, Z.; Dong, Z. Grain size characteristics in the Hexi Corridor Desert. Aeolian Res. 2015, 18, 55–67. [Google Scholar] [CrossRef]
- Zhang, Z.; Dong, Z.; Hu, G.; Parteli, E. Migration and morphology of asymmetric barchans in the Central Hexi Corridor of Northwest China. Geosciences 2010, 8, 204. [Google Scholar] [CrossRef] [Green Version]
- Zhang, Z.C.; Dong, Z.B. Dune field patterns and wind environments in the middle reaches of the Heihe Basin. J. Desert Res. 2014, 34, 332–341. [Google Scholar]
- Zhang, Y.; Liu, J.; Xu, X.; Tian, Y.; Li, Y.; Gao, Q. The response of soil moisture content to rainfall events in semi-arid area of Inner Mongolia. Procedia Environ. Sci. 2010, 2, 1970–1978. [Google Scholar] [CrossRef] [Green Version]
- Zhou, J.; Fu, B.; Gao, G.; Lü, N.; Lü, Y.; Wang, S. Temporal stability of surface soil moisture of different vegetation types in the Loess Plateau of China. Catena 2015, 128, 1–15. [Google Scholar] [CrossRef]
- Wang, Z.; Wang, L.; Liu, L.; Zheng, Q. Preliminary study on the spatiotemporal distribution of moisture content in sand dunes in the southern marginal zone of the Mu Us Desert. Arid Zone Res. 2007, 24, 61–65. [Google Scholar]
- Zhao, J.; Ma, Y.; Luo, X.; Yue, D.; Shao, T.; Dong, Z. The discovery of surface runoff in the megadunes of Badain Jaran Desert, China, and its significance. Sci. China Earth Sci. 2017, 60, 707–719. [Google Scholar] [CrossRef]


© 2020 by the authors. Licensee MDPI, Basel, Switzerland. This article is an open access article distributed under the terms and conditions of the Creative Commons Attribution (CC BY) license (http://creativecommons.org/licenses/by/4.0/).
Share and Cite
Benaafi, M.; Hanafy, S.M.; Al-Shuhail, A.; El-Husseiny, A.; Dvorkin, J. Integrated Geological, Hydrogeological, and Geophysical Investigations of a Barchan Sand Dune in the Eastern Region of Saudi Arabia. Water 2020, 12, 682. https://doi.org/10.3390/w12030682
Benaafi M, Hanafy SM, Al-Shuhail A, El-Husseiny A, Dvorkin J. Integrated Geological, Hydrogeological, and Geophysical Investigations of a Barchan Sand Dune in the Eastern Region of Saudi Arabia. Water. 2020; 12(3):682. https://doi.org/10.3390/w12030682
Chicago/Turabian StyleBenaafi, Mohammed, Sherif M. Hanafy, Abdullatif Al-Shuhail, Ammar El-Husseiny, and Jack Dvorkin. 2020. "Integrated Geological, Hydrogeological, and Geophysical Investigations of a Barchan Sand Dune in the Eastern Region of Saudi Arabia" Water 12, no. 3: 682. https://doi.org/10.3390/w12030682