Article

Development of a Metric of Aquatic Invertebrates for Volunteers (MAIV): A Simple and Friendly Biotic Metric to Assess Ecological Quality of Streams

by
Paulo Pinto
1,*,
José Max Barbosa Oliveira-Junior
2,3,
Francisco Leitão
3,
Maria M. Morais
1,
Luis Chícharo
4,
Paula Vaz
5,
Sofia M. A. Delgado
6,
Catherina Voreadou
7,
Eduardo A. Morales
1 and
Maria Alexandra Teodósio
3,*
1
Instituto de Ciências da Terra (ICT), Universidade de Évora, Largo dos Colegiais, 7000 Évora, Portugal
2
Instituto de Ciências e Tecnologia das Águas (ICTA), Universidade Federal do Oeste do Pará (UFOPA), Rua Vera Paz, s/n (Unidade Tapajós) Bairro Salé, Santarém, 68040-255 Pará, Brazil
3
Centro de Ciências do Mar (CCMAR), Universidade do Algarve (UAlg), Campus de Gambelas, 8005-139 Faro, Portugal
4
Centro de Investigação Marinha e Ambiental (CIMA), Universidade do Algarve (UAlg), Campus de Gambelas, 8005-139 Faro, Portugal
5
Agência Portuguesa do Ambiente (APA)-ARH Algarve, Rua do Alportel, no. 10, 2º, 8000-293 Faro, Portugal
6
Independent environmental consultant, Rua Dr. Eduardo, no. 117, 2205-644 Tramagal, Portugal
7
Natural History Museum of Crete, University of Crete. B.O. Box 2208, 71409 Iraklion, Greece
*
Authors to whom correspondence should be addressed.
Water 2020, 12(3), 654; https://doi.org/10.3390/w12030654
Submission received: 20 December 2019 / Revised: 12 February 2020 / Accepted: 24 February 2020 / Published: 28 February 2020
(This article belongs to the Section Water Quality and Contamination)

Abstract

:
Citizen science activities, involving local people in volunteer-supported and sustainable monitoring programs, are common. In this context, the objective of the present work was to develop a simple Metric of Aquatic Invertebrates for Volunteers (MAIV), including a user-friendly tool that can be easily accessed by volunteers, and to evaluate the efficiency of a volunteer monitoring program following an audit procedure. To obtain MAIV values, macroinvertebrate communities were reduced to 18 surrogate taxa, which represented an acceptable compromise between simplicity, efficiency, and reproducibility of the data, compared to the regular Water Framework Directive monitoring. When compared to results obtained with the National Classification System of Portugal, MAIV accurately detected moderate, poor, and bad ecological status. Thus, MAIV can be used by volunteers as a complement to the official monitoring program, as well as a prospective early warning tool for local problems related to ecological quality. Volunteers were students supervised by their teachers. Results obtained by volunteers were compared to results obtained by experts on macroinvertebrate identification to measure the efficiency of the procedure, by counting gains and losses on sorting, and identification. Characteristics of groups of volunteers (age and school level) did not influence significantly the efficiency of the procedure, and generally results of volunteers and experts matched.

1. Introduction

The European Water Framework Directive (WFD) instructed all member states to achieve good ecological status in all water bodies [1]. The process required the implementation of monitoring programs to assess the ecological integrity of each water body in a continuous manner. Within this context, bioassessment became relevant in ecological monitoring, and substantial effort was put into developing multimetric indices that would best express human pressures on ecosystems [2].
Bioassessment programs need qualified expertise to make key decisions in the field and to identify organisms in the laboratory. A rather interesting way to circumvent the low number of experts in ecological monitoring has been the development of citizen science (CS), that is, the science done in conjunction with volunteers, under the direction of professionals and scientific institutions [3]. In addition to the benefits for science, CS produces important societal benefits through innovative thinking and by improving: (a) societal conditions through scientific outreach; (b) education for the promotion of conservation [4]; and (c) relationships among institutional actors, bringing together individuals from diverse backgrounds [5].
CS activities involving local people in volunteer-supported and sustainable monitoring programs is a common practice [6,7,8,9,10,11,12]. For example, in Canada, both federal and provincial governments have initiated aquatic biomonitoring networks such as the Ontario Benthic Biomonitoring Network (OBBN), accessible to both volunteers and scientists [3]. In general, CS has been used in hydrological observations and/or in the monitoring of surface water quality in all different continents of the globe. This is the case of Europe [13], North America [14], Central America [15], South America [11], Oceania [16], Asia [17], and Africa [18], demonstrating that CS is a low-cost and crucial tool in raising awareness on the importance of good water quality [13], and important in decision-making instances [19]. When educators are involved in CS, the benefits for school environmental education are multiple [20,21]. The improvement of student learning skills and the professional development of science teachers through engagement in scientific inquiry and research, are two of such benefits. These ultimately improve literacy in Science, Technology, Engineering, and Mathematics (STEM). STEM is defined as the ability to read and/or write science texts, tables, and graphics, and the derived skill to apply scientific knowledge [22].
The integration of results coming from CS volunteer programs as a part of the National Classification System (NCS) must be used carefully, because potential conflicts might occur between environmental authorities and volunteers [23]. As an attempt to prevent such conflicts, certain compromises are required [24], for example: (a) water authorities need to have valuable and precise results to support management actions, but volunteers prefer more friendly tools that are not necessarily precise; (b) water authorities desire results to accomplish legislative requirements, whilst volunteers are most likely driven by self-interest (hobbies, leisurely pursuits) [20,25]. Thus, a participative balance has to be reached in choosing the sites to be monitored [24], and an equilibrium must be set between friendly tools and realistic results, quick results and valuable data, and inexpensive and sufficiently precise results. The challenge is to come up with the friendliest tool for volunteers to produce useful information for management proposals. For this, water authorities should know how volunteer results differ from expert results, because any metric of ecological quality is of little use without an understanding of the uncertainties in its estimation [26,27,28,29].
To develop a supported and sustainable volunteer monitoring program, it is necessary that volunteers have grasped the basic scientific concepts through adequate literature or through training courses [30]. To prevent errors, sampling and laboratory protocols need to be simple and standardized. Finally, an expert audit should be implemented to assess the quality of the results, detecting main gaps and improvements to be made, thus increasing the efficiency of the process.
Macroinvertebrates are probably the most popular biological quality element evaluated by volunteers on lotic ecosystems [29]. Macroinvertebrates are easy to collect with simple equipment and to identify with the naked eye in the field. They colonize all aquatic habitats and they have a great diverse sensitivity to physical, chemical, organic, and morphological pressures. However, the general metrics and multimetric indices developed to assess ecological status based on macroinvertebrates require counting and identification of, at least, all sampled families or even the identification of some species [2]. The amount of work and time required for these identifications could be annoying to volunteers, increasing the risk of low accuracy and desistance. Thus, to maintain the interest of the volunteers, it is necessary to simplify the metrics through a reduction of the taxonomic detail [29] and to reduce the counting process, thus obtaining quick results but maintaining the accuracy.
The starting point of the present study was a set of tools developed by the European project on Conservation and Sustainable Development of Freshwater Ecosystems (CONFRESH, 
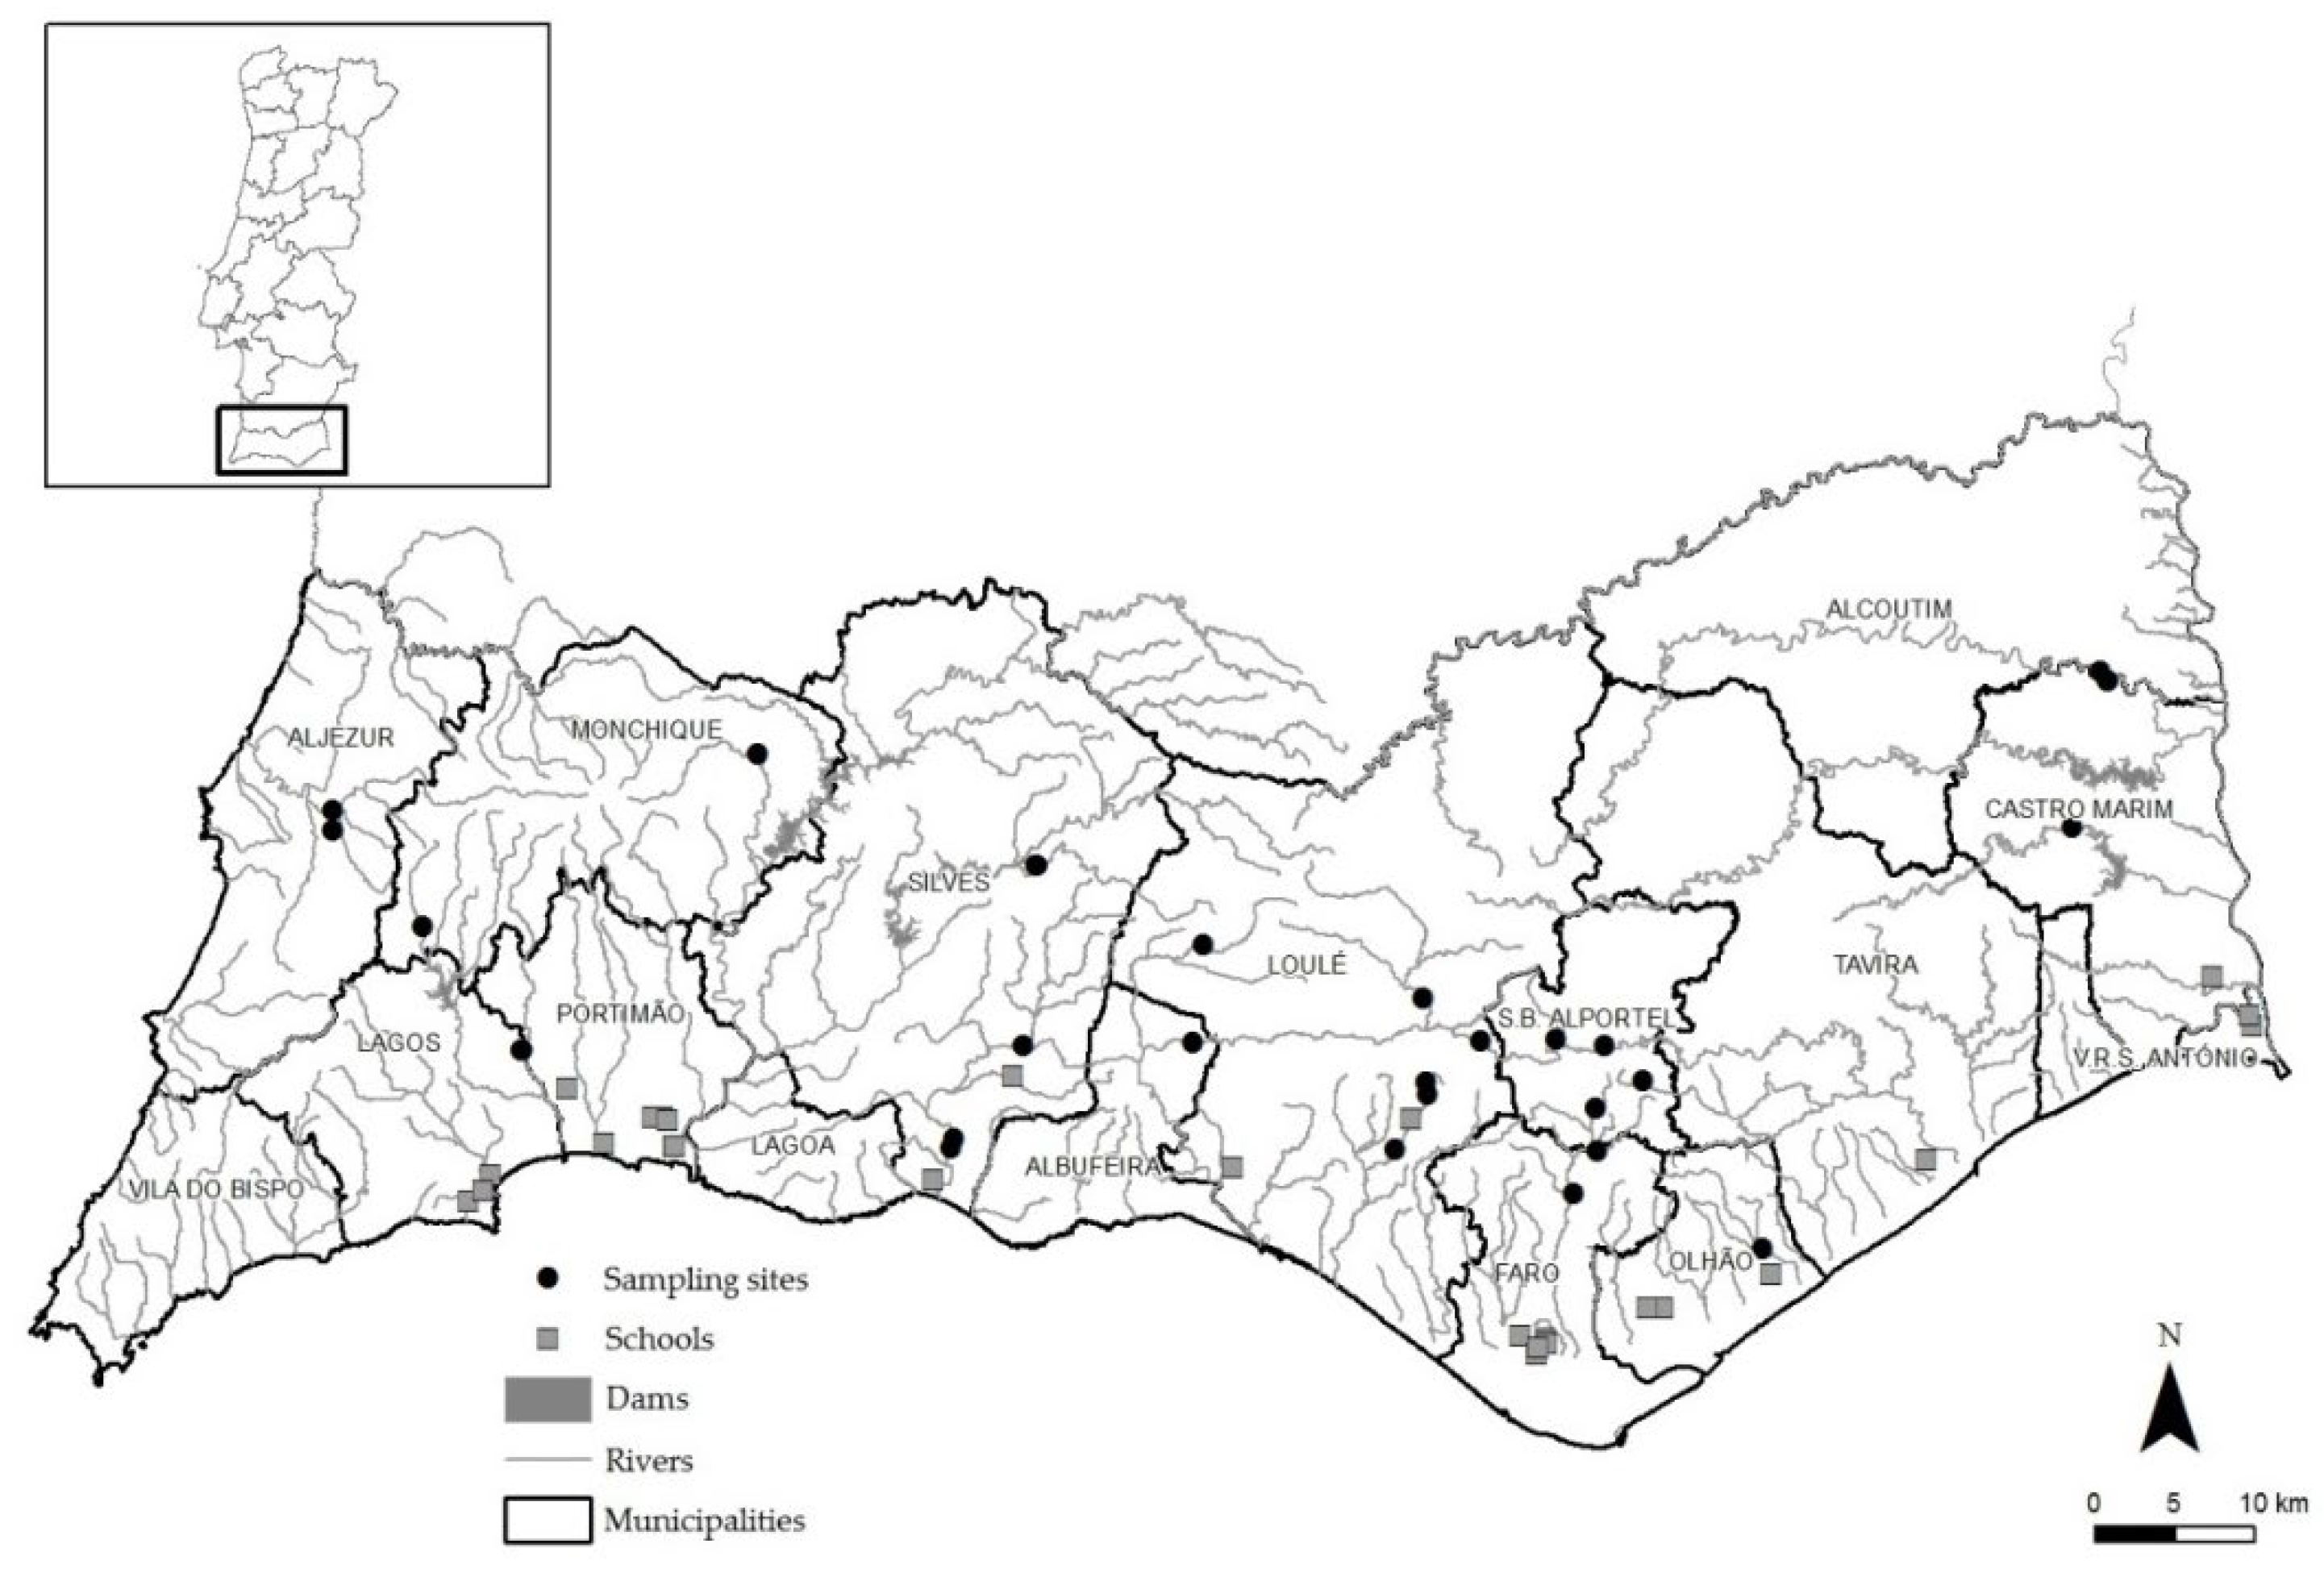
https://www.nhmc.uoc.gr/en/museum/programs/1814) to assess stream ecological quality based on macroinvertebrate communities. These tools were applied in a regional project conducted by the Regional Hydrographic Administration of Algarve of the Portuguese Environmental Agency (APA-ARHAlg). The objective was to evaluate the accuracy of the results obtained by students from 5th to 12th grades (volunteers), during extracurricular activities supervised by their teachers and following a participatory/contributory model of participation [
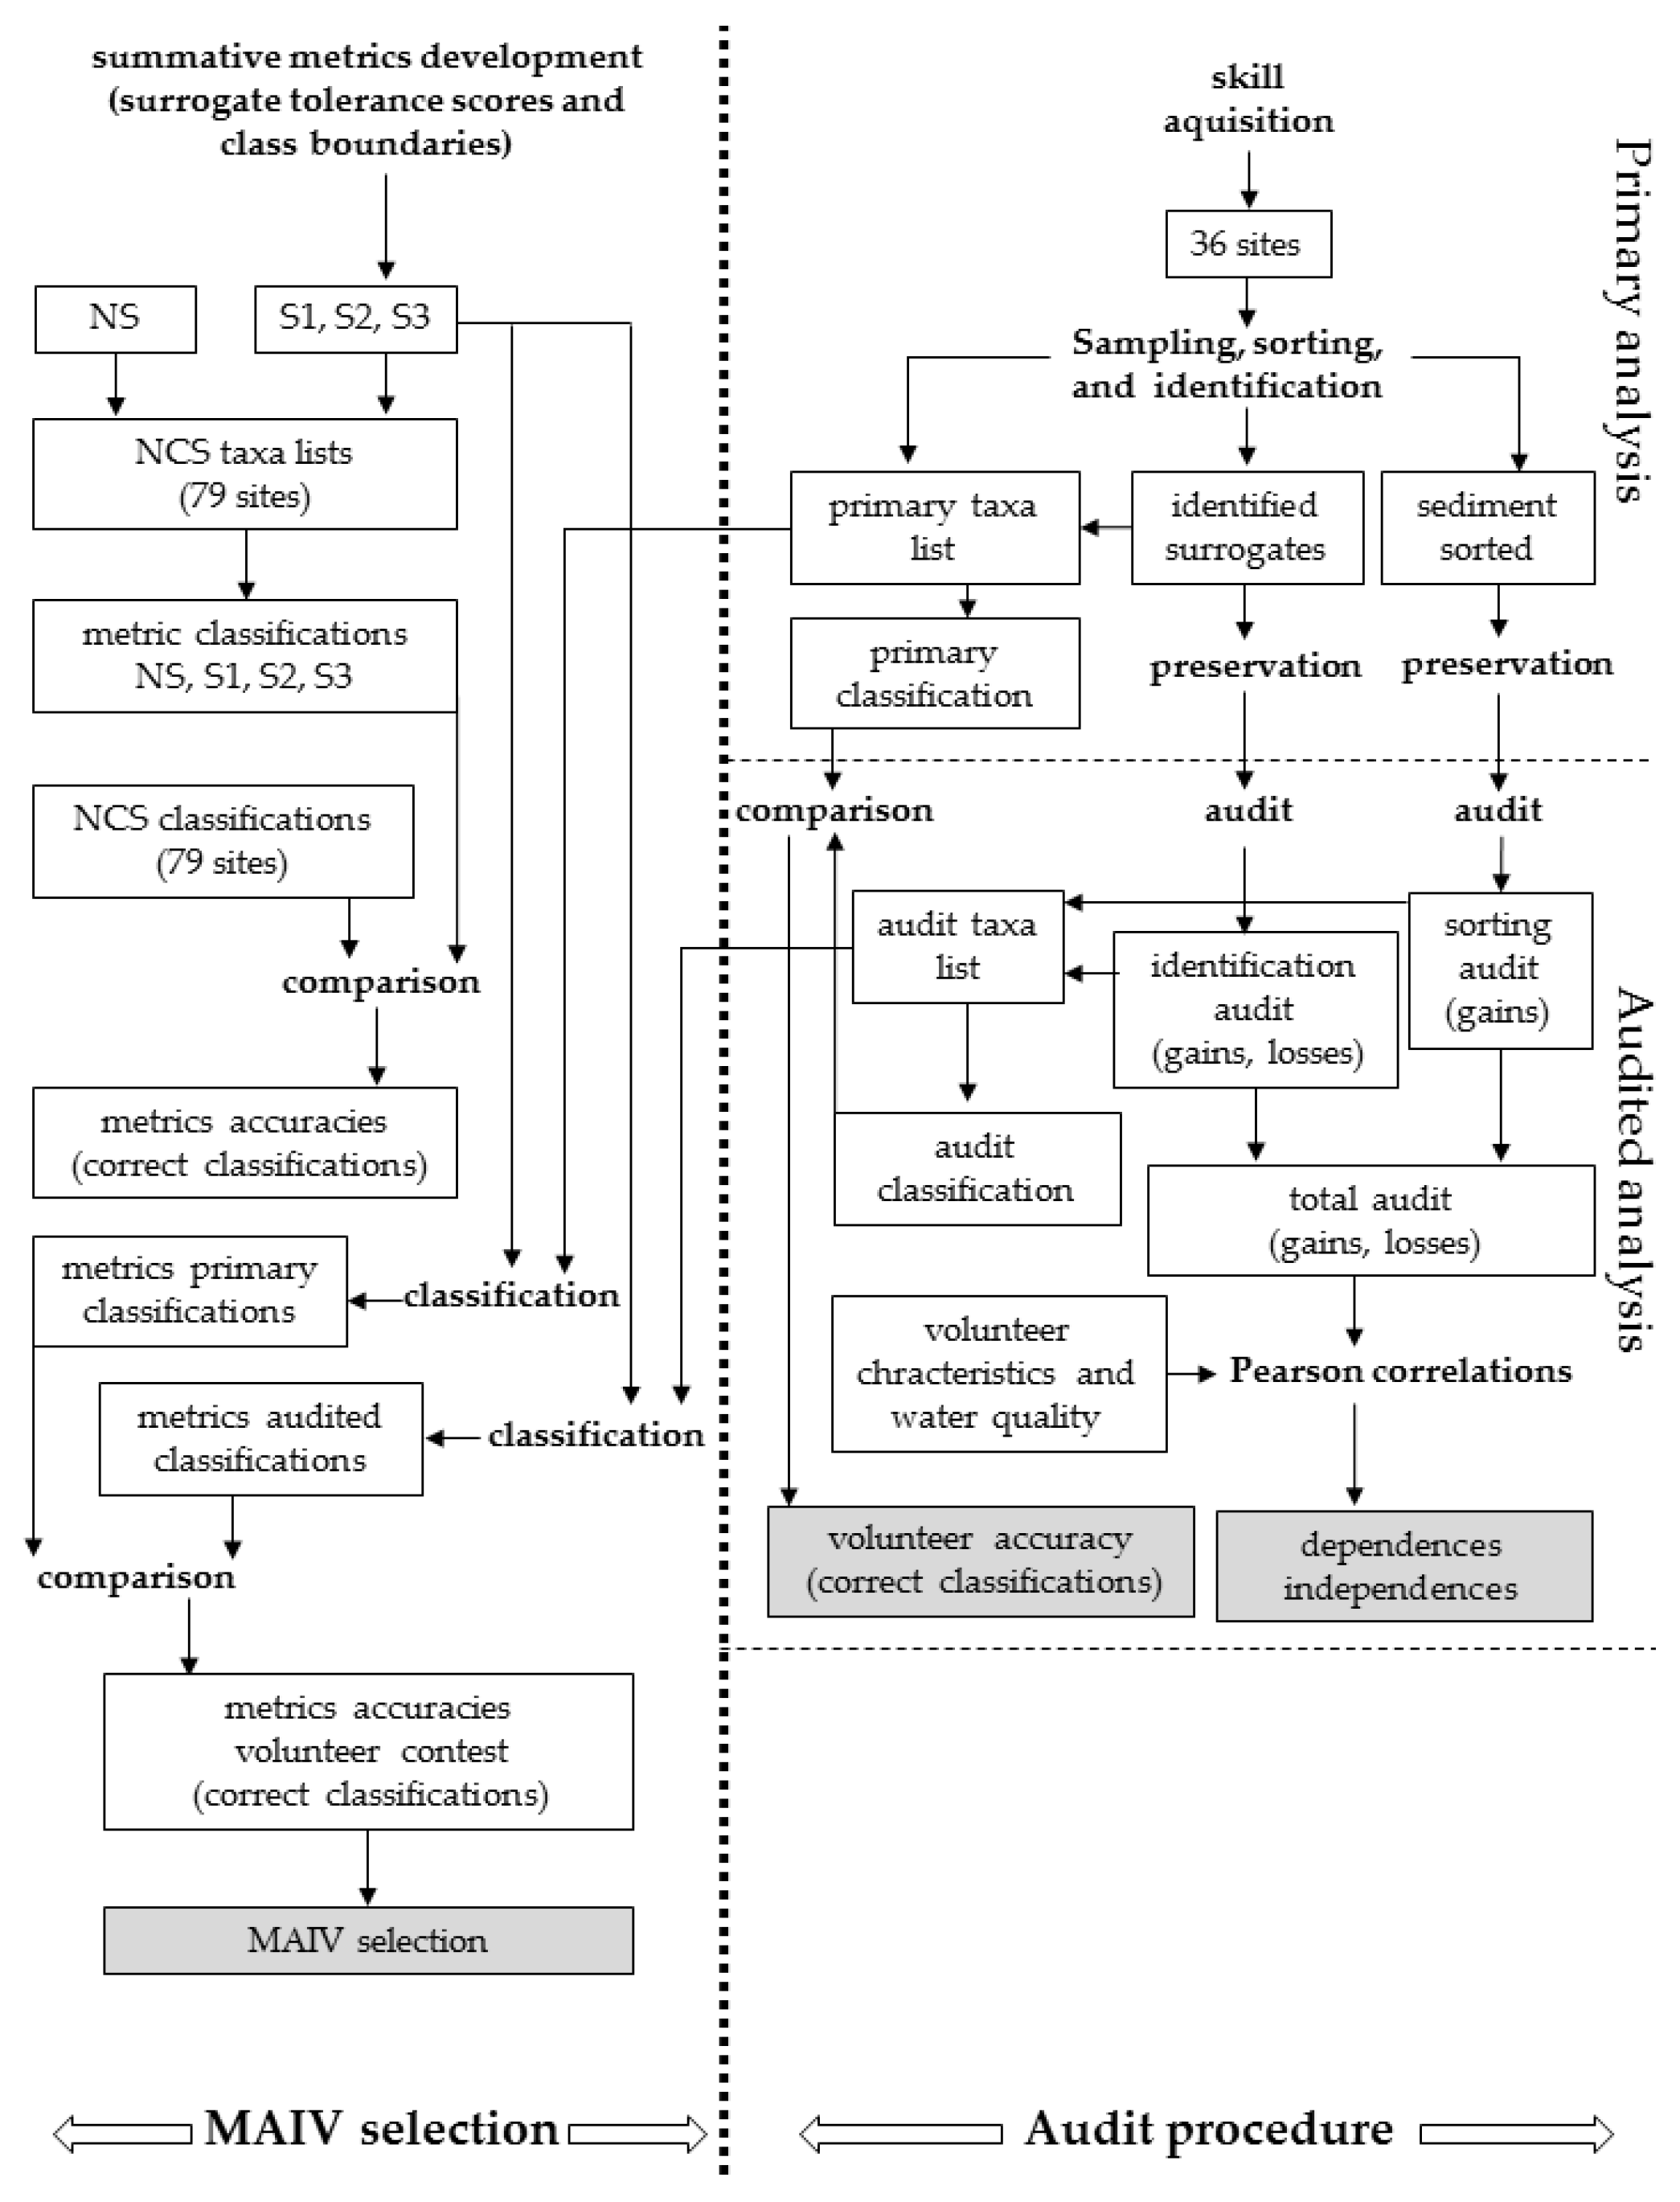
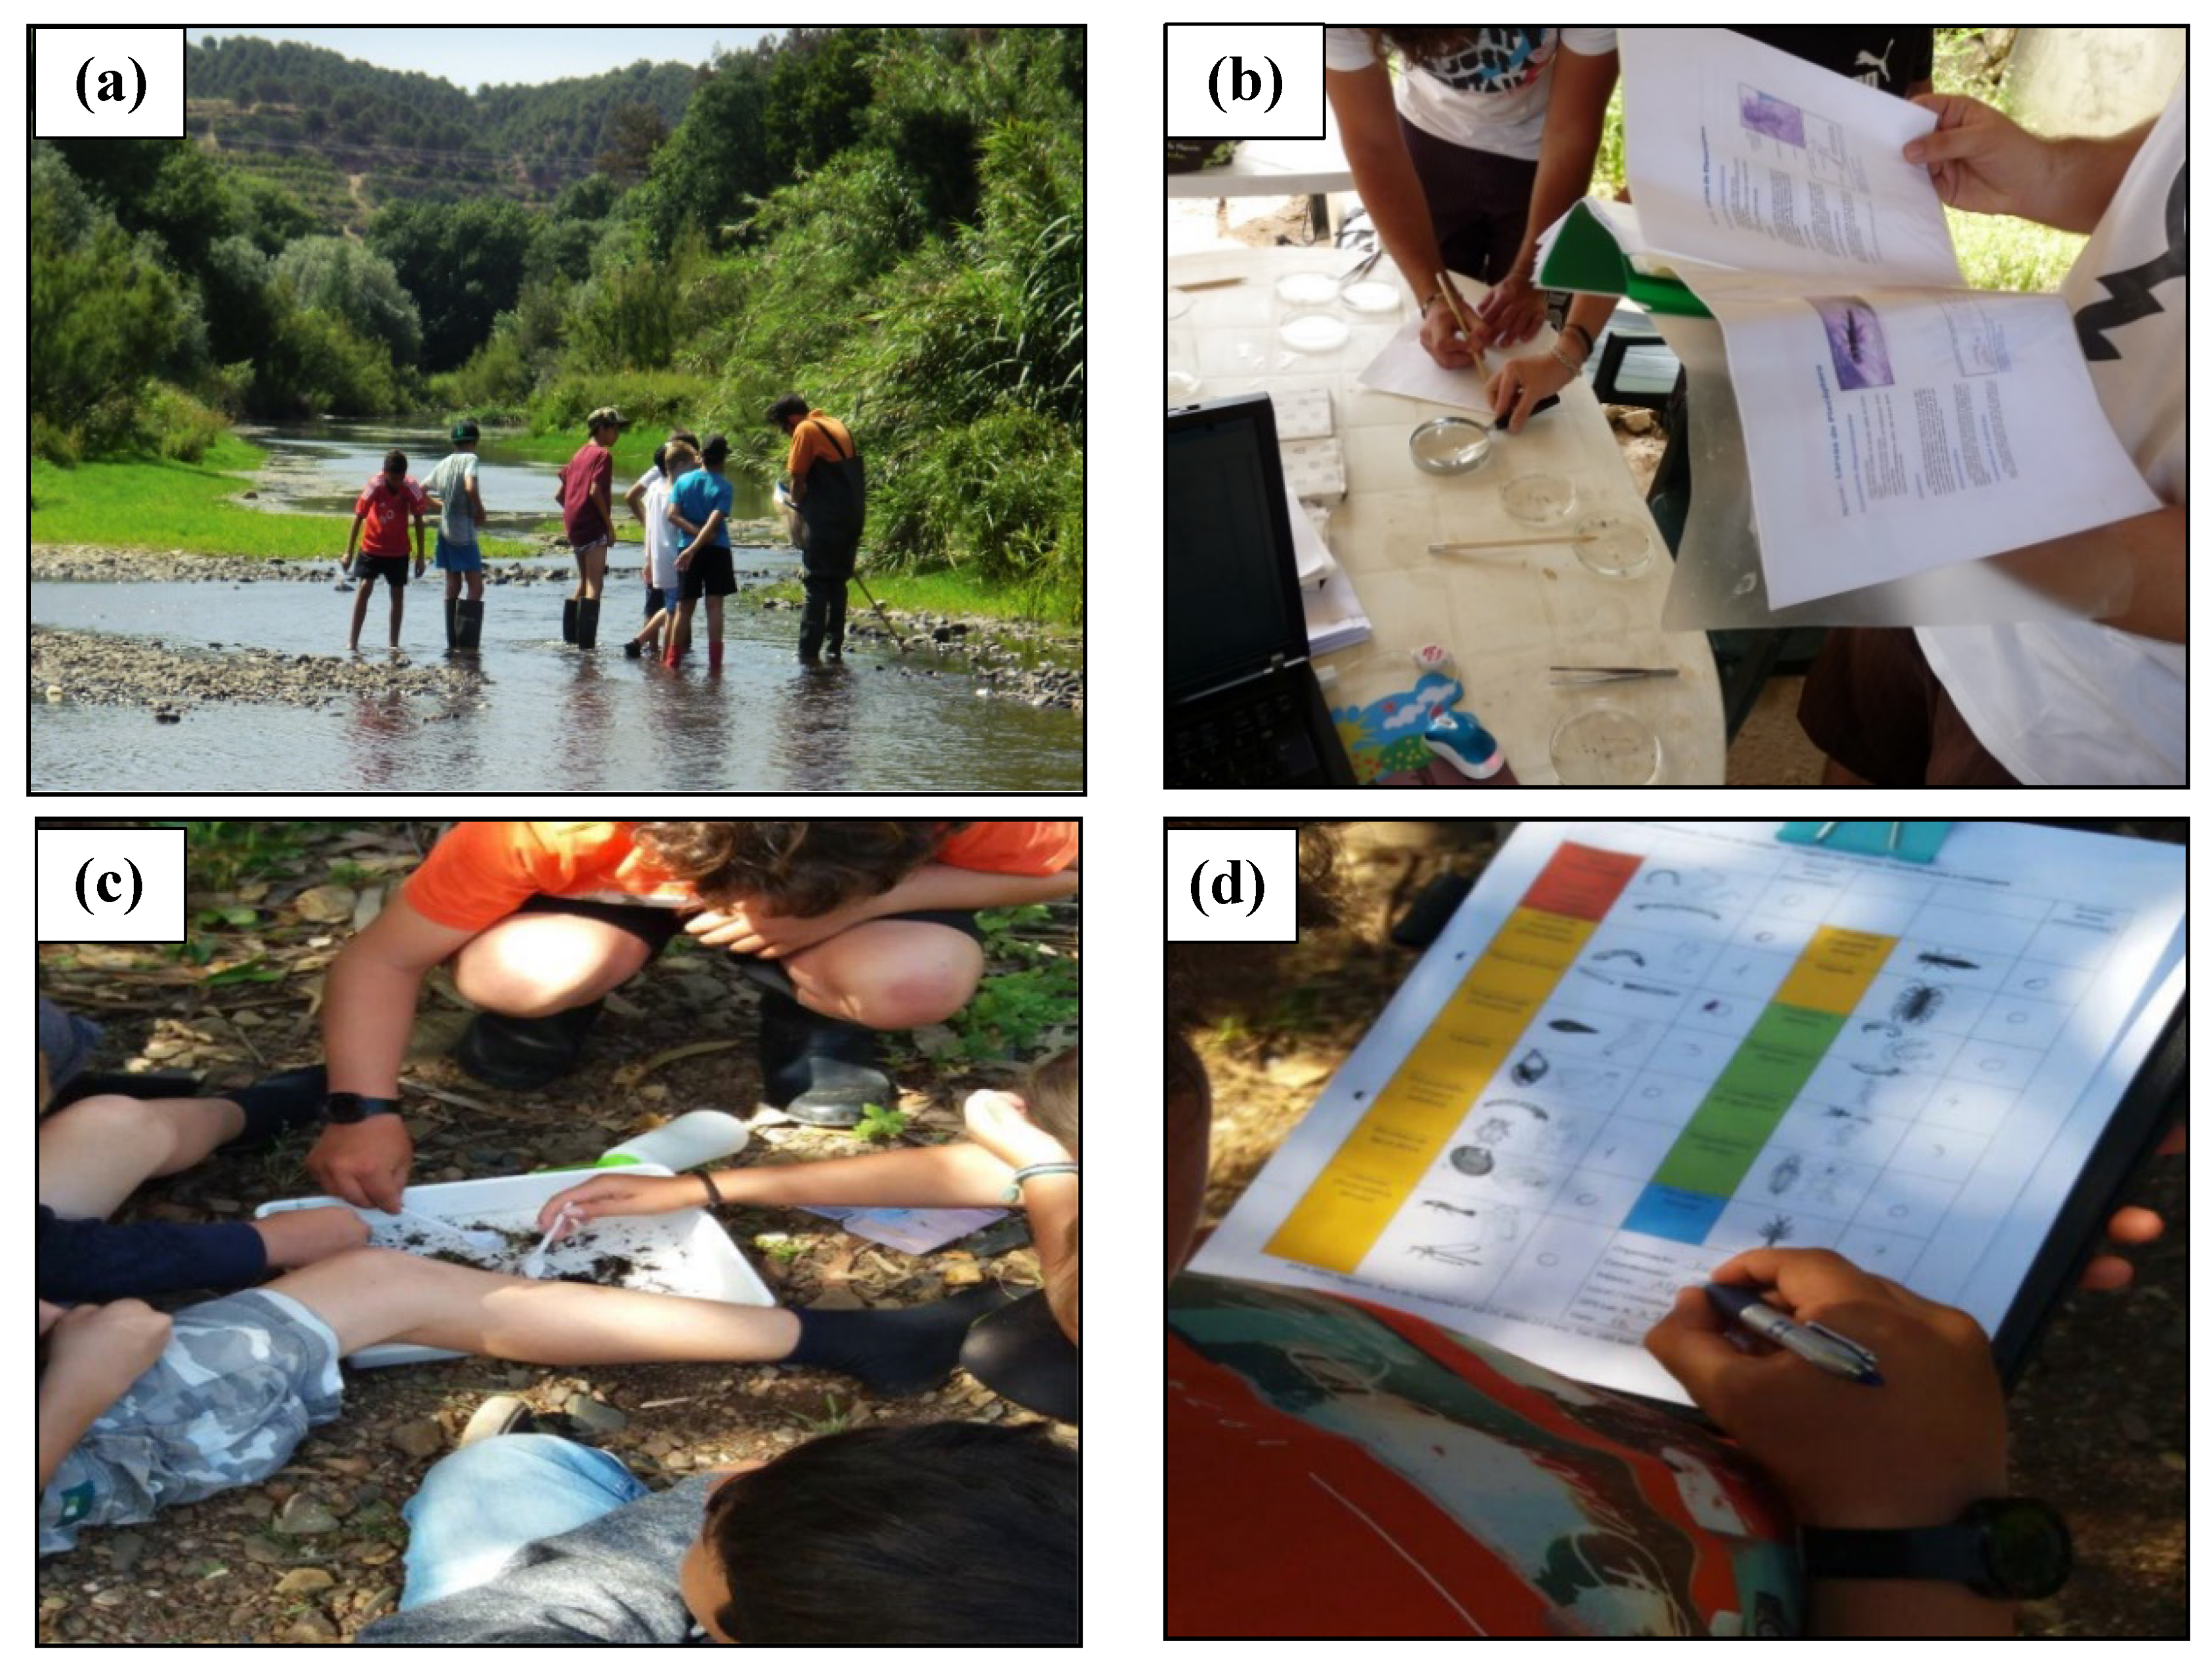
31]. The following steps were used for this activity: (1) APA-ARHAlg selected study sites, (2) teachers were taught skills on stream ecology and monitoring during courses given by experts, (3) teachers and their students (volunteers) collected and examined the samples and determined on their own the ecological class of each sampling site, and (4) experts on macroinvertebrate taxonomy audited the results. During the audit procedure, experts reanalyzed samples and quantified the differences between the two analyses, expressing them as the accuracy of the results obtained by volunteers. It was expected, as a hypothesis, that the characteristics of volunteers (age, number of students, and number of teachers) could influence the accuracy of the results and, in opposition, that this accuracy is independent from the ecological quality.
We intended to test if simple tolerance metrics based on the reduction of the more than 120 macroinvertebrate families to just 18 surrogates (Class, Order, and Family), as proposed by the CONFRESH project, did not significantly compromise the quality of the biological assessment when compared to the results of the National Classification System of Portugal. Thus, the aim of this paper is to propose a simple Metric of Aquatic Invertebrates for Volunteers (MAIV) through a reduction of the taxonomic detail, eliminating the counting process but maintaining the accuracy. We propose MAIV as an upgrade of the metric calculated by the CONFRESH project, since its score is the sum of tolerance scores of all surrogates (summative metric) and not only the tolerance score of the most sensible surrogate (nonsummative metric), thus increasing accuracy.

2. Materials and Methods

A synthetic overview to follow the methodological procedures adopted in this study is presented on Figure 1.

2.1. Study Area and Sampling Period

The study was developed in the Algarve region (southern Portugal), characterized by Mediterranean climate conditions, where the aquatic environment is shaped by sequential changes of annual flooding and drying, directly affecting the physical and biological characteristics of the streams [32]. Most of the streams are temporary, and urbanization, agriculture, and cattle raising are the most important human pressures. From 17 streams, selected by APA-ARHAlg in this region and covering the four river types presented in Algarve (southern rivers with medium to large dimensions, drainage area more than 100 km2 (M–L); southern mountainous siliceous rivers (M–S); southern small siliceous rivers (S–S), drainage area less than 100 km2; and calcareous rivers of Algarve (C)), 36 samples were collected during spring 2010, after a period of intense precipitation (Figure 2).

2.2. Teacher Training Courses and Volunteer Skills

Skills to implement this volunteer monitoring program were developed in six similar teacher training courses on “Conservation and Sustainability of Freshwater Ecosystems”, covering the entire Algarve region, between January and May 2010. These courses were supported by bibliography on aquatic ecology, field and laboratory procedures, and macroinvertebrate identification [33,34], developed by the CONFRESH project. Additional information regarding the WFD and basin management was provided [1]. The training courses were organized into four sequential parts: (1) theoretical lectures on aquatic ecology, basin management, and monitoring; (2) field activities preceded by laboratory practical lectures; (3) question-and-answer sessions to solve doubts and to help with macroinvertebrate identification to family level, and (4) presentation of results. The institutions collaborating with the courses were the six Teacher Training Centers, Regional Hydrographic Administration of Algarve of the Portuguese Environmental Agency (APA-ARHAlg), Algarve Educational Authority, University of Évora, and University of Algarve.
In total, 87 teachers attended the courses and applied/transferred the obtained skills to their 807 students distributed in 23 secondary schools. This was done during extracurricular activities, forming 36 volunteer groups (students under teacher supervision). The students were from 36 classes with sizes varying from 4 to 66 students per class, degrees from 5th and 7th–12th, ages from 11 to 16, and number of teachers from 1 to 3 teachers per class (Table S1). None of the students had previous experience with macroinvertebrate assessment.

2.3. Habitat Description and Composite Human Pressure Gradient Calculation

Site habitat description was done by filling a form in the field. This form was produced by the APA-ARHAlg, covering four main categories of descriptors that were categorized as presence/absence on both banks of each river reach (land use, settlements on the river, water status, and river status) (Table S2).
Based on the results obtained from site habitat description, a Multiple Correspondence Analysis (MCA), applied to a matrix of the 36 samples described by presence (Yes)/absence (No) of 32 descriptors (Table S2), covering land use (11), settlements on the stream (7), state of the water (11), and stream characteristics (3) was performed, and the composite human pressure gradient established by the scores of the samples on the first dimension of the MCA.

2.4. Macroinvertebrate Sampling and Laboratory Procedures

In a 50-m-long reach at each site, the percent cover of the aquatic habitats was estimated (boulders, stones, sand, silt, macrophytes and algae, and coarse particulate organic matter—CPOM), following the procedure adopted by the Portuguese monitoring program [35]. The composite sample consisted of six kick subsamples (each 1 m in length) collected with a hand net (0.5 mm mesh size, 25 cm front) (Figure 3a). These six kick subsamples were distributed along the reach covering different habitats, according to their percent cover. Each composite sample was sorted live in the field or immediately fixed after collection with formalin, kept in plastic flasks, and transported to the laboratory.
Macroinvertebrates were sorted and identified into 18 surrogates (Table S3), following the teaching materials developed by CONFRESH [33,34] (Figure 3b,c) and complemented by other more complex keys [36]. In order to simplify the identification process, a key was developed to identify the 18 surrogates (see Figure S1; Tables S4 and S5). The ecological quality class for each sample was the score of the most sensitive taxa present in the sample (Figure 3d; Table S3). All macroinvertebrate sampling and laboratory procedures were done by volunteers (students under constant supervision by teachers).

2.5. Audit Procedure

The objective of the audit procedure was to quantify the accuracy of the results obtained by the volunteers. To attain this objective, the volunteer results (primary analysis), were checked by experts (auditors) from the universities of Évora and Algarve. The accuracy of the volunteer results was measured by the quantification of the differences between primary and audited analysis, following an adaptation of the audit procedure implemented during the European STAR (Standardisation of River Classifications) project [37].
The primary analysis consisted of: (1) sorting the organisms in each sediment sample, (2) identification down to the established 18 surrogates (Table S3), and (3) establishment of the respective water quality class (Table S3). Once the primary analysis was completed, the remaining sediment from each sample was kept in plastic flasks and preserved in 70% alcohol. Likewise, the macroinvertebrates identified by the volunteers were kept in individual vials and preserved in 70% alcohol. Flasks and vials were labeled accordingly, affixed with the respective taxa list (primary taxa list) and ecological quality class (primary classification), and sent to the auditors.
Experts (auditors) checked the sorting and identification done during the primary analysis, termed the sorting audit and identification audit, respectively. On the sorting audit, the auditors re-sorted the sediment of each sample, detecting the remaining surrogates not collected during the primary analysis. Every surrogate (Table S3) found by the auditors and not detected in the primary analysis was considered a gain of the sorting audit. The sorting audit, for each sample, was quantified by the respective number of gains.
For the identification audit, the auditors checked the identifications of the primary taxa list. Two situations were possible during the identification audit: (a) gains of the identification audit were recorded if a new surrogate not previously found by the primary analysis was identified; and (b) losses of the identification audit were recorded when individuals of a given surrogate were allocated into different surrogates, thus increasing the number of surrogates present. The result of the identification audit was quantified by the number of gains and losses. The integration of the sorting and identification audits corresponded to the total audit. After the audit procedure, a new taxa list was obtained (audited taxa list), and the respective ecological quality class recalculated (audited classification).
Spearman correlations between the results of the total audits and volunteer characteristics were calculated to detect possible effects of the latter (Table S1) on the accuracy of the volunteer assessment. Spearman correlations between total audit results and water quality were also calculated to test the independence between the accuracy of the volunteers and water integrity. For these last correlations, water integrity was measured in two ways: (1) ecological quality class obtained by the audited classification, and (2) the composite gradient of human pressures obtained by the scores of the samples on the first dimension of the MCA.

2.6. Accuracies of Simple New Tolerance Metrics Compared to the NCS

In order to select an accurate and simple tolerance metric for macroinvertebrates, two kinds of metrics, based on the 18 surrogates were tested: (1) the CONFRESH metric [33], which score (value ranging from 2 to 5) is that of the most sensitive surrogate present in the sample. This score is a very simplistic picture of the ecological state of the site (nonsummative metric—NS); and (2) a set of three metrics, which final score is the sum of the tolerance scores of all surrogates present in the sample (summative metrics—S1, S2, and S3). These added scores give a better and more accurate depiction of the ecological state of each site. For S1, all surrogates included in the same group of tolerance had the same tolerance score adopted by the CONFRESH metric, ranging from 5 (the most sensitive surrogate) to 2 (the most tolerant surrogate). For S2, the tolerance score of each surrogate was based on the mean of the family tolerance scores established by the Iberian Biological Monitoring Working Party (IBMWP) [38] (e.g., the Trichoptera tolerance score is 8.5, corresponding to the mean of the tolerance scores established by IBMWP for its respective 20 families). In this S2 metric, all surrogates of each group of tolerance have the same score calculated as the mean score of all their respective surrogates. At S3, surrogates from each group of tolerance have different scores, according to the mean of their taxa scores. All these mean scores were rounded to the nearest natural number. A synthetic overview of the tolerance scores of each surrogate included in each group of tolerances is presented in Table 1. For each summative metric (S1, S2, and S3), a similar procedure was adopted to establish the boundaries between ecological classes: (1) the highest possible score was calculated, adding the scores of all surrogates (59 for S1, 94 for S2, and 88 for S3); (2) the boundary between high and good classes was established as 35% of the maximal possible value of the score (approximately the lower level of the boundary of high–good classes established for the Portuguese monitoring program [35]); (3) the remaining 65% was divided into four equal intervals to establish the boundaries between the other ecological classes, following the procedure of the Portuguese monitoring program [35]; and (4) the boundaries were rounded up to the nearest natural number to prevent decimal numbers (Table 2).
To evaluate the accuracy of these tested metrics, the APA-ARHAlg provided the data set of the National Classification System (NCS) for the study area, consisting of 79 sites with the official classification already established (NCS classification), as well as its respective taxa list (NCS taxa list). For all 79 sites, classifications of the four tested metrics (NS, S1, S2, and S3) were calculated (metric classifications), based on the NCS taxa lists. NCS classification and metric classifications were compared, and their respective accuracies measured by the number of correct/incorrect classifications, with the NCS classification as the benchmark. These comparisons were done for ecological classifications based on five ecological quality classes (high, good, moderate, poor, and bad), and on two ecological quality classes (high + good and moderate + poor + bad). This was to comply with the WFD target, which is to attain at least the good ecological status. These comparisons were done to all sites and again separately for each river type (southern rivers with medium to large dimensions, drainage area more than 100 km2 (M–L); southern mountainous siliceous rivers (M–S); southern small siliceous rivers (S–S), drainage area less than 100 km2; and calcareous rivers of Algarve (C)) [35].

2.7. Metric Accuracies Under a Real Volunteer Contest Procedure

The accuracy of the four tested metrics (NS, S1, S2, S3) was also assessed under a real volunteer contest procedure, because the selected metric had to be used by volunteers. To quantify their accuracies, primary and audited classifications were calculated based on the respective primary taxa lists and audited taxa lists. Primary and audited classifications were compared, and their accuracies measured by the number of correct classifications, assuming the audited analysis as the benchmark.

3. Results

3.1. Gradient of Human Pressures

The ordination obtained by the MCA shows a clear increasing gradient of human pressures along the first dimension (Figure 4). An opposition is evident between nondisturbed and disturbed sites (Figure 4a) and between land use, e.g., forest versus agriculture (mainly explained by dimension Dim1, approximately 46% and 37%, respectively) (Figure 4b). Concerning the existence of settlements along the streams, an increase of impact intensity is observed along the first axis, from small dams and springs to houses, roads, and irrigations (mainly explained by Dim1; approximately 46%) (Figure 4c). An opposition is also evident between water state (Dim1 = 27.2%) (Figure 4d) denoting a clear relationship with the ecological status, and for this reason, considered the composite gradient of human pressures.

3.2. Audit

The audit procedure applied to the 36 samples collected by volunteers showed that gains and losses are mostly associated with identification (Table 3). It is also evident that there was a higher number of gains during the entire audit procedure as compared to the losses (Table 3). Concerning the identification done by volunteers, there were gains practically in all surrogates, with Diptera, Ephemeroptera, Coleoptera, and Plecoptera being the highest contributors (Table 4).
Results included in Table 5 showed no significant correlations in terms of gains and losses with the characteristics of the groups of volunteers (p > 0.05). The only significant correlations (p < 0.05) were obtained for human pressures, expressed as the scores of the samples along the first MCA dimension (Figure 4).
For the great majority of the sites (22), primary and audited classifications match closely (Table 6). When classifications do not match, primary classifications were underevaluated in one class (eight cases) or in two classes (four cases).

3.3. Accuracies of Simple New Tolerance Metrics Compared to the NCS

All metric classifications are significantly correlated (p < 0.01) with the NCS classification (Table 7). However, a more detailed analysis, based on the incorrect classifications for five and for two quality classes, gave different results. The NS shows a higher tendency for overevaluations than S1, S2, and S3 (Figure 5). The exception occurs with the southern mountains river type without any unimodal pattern, showing a relative minimum for the correct classifications. However, results for the southern mountains and the southern medium–large river types are based on a lower number of sites. Similar results occur when only two ecological quality classes are considered (graphs in the right column of Figure 5).
No more than 18% of the classifications obtained by S1, S2, and S3 for the two ecological quality classes, assuming an uncertainty of 5% around the boundary (Figure 6a–e), are incorrect. Once again, the river types with the lowest number of sites (south mountains and large–medium river types) do not fit into these trends.

3.4. Metric Accuracies Under a Real Volunteer Contest Procedure

The comparison of primary classifications and audited classifications, for the four tested metrics (NS, S1, S2, S3) and on the 36 sites collected by the volunteers (Table 8), shows that the number of correct classifications tends to be higher than the underevaluations and the overevaluations. When five quality classes are considered, the number of underevaluations is very close to the correct evaluations, but when two classes are considered, the correct classifications compose the great majority of the summative metrics (S1, S2, S3), showing that NS has the lowest value of correct classifications (Table 8).

4. Discussion

Evaluating the accuracy that volunteers have in determining the ecological quality class of a site using macroinvertebrates comprises four main components: (1) sampling, (2) sorting, (3) identification, and (4) acceptability of the final results (assignation to an ecological quality class). The sampling procedure, if well standardized, seems not to be a significant source of error [28]. Sorting seems to be the most interesting phase to volunteers. The curiosity stimulates the demand of new (different) macroinvertebrates and a constant attention is devoted to this task, this being a possible reason for the absence of gains on the sorting audit. The most important source of error occurred during identification, leading to some gains and to a few losses. Gains probably resulted from two different sources: (1) error on the identification of morphologically similar surrogates (e.g., Ephemeroptera and Plecoptera, Diptera and some larvae of Coleoptera, or Trichoptera) and (2) confusion with grains of gravel (e.g., Gastropoda) or small plant pieces (e.g., Oligochaeta). In any case, mean gains per sample were not too high. Thus, it can be concluded that these results are acceptable and can probably be enhanced with more experience and adequate materials to support the identification process [39].
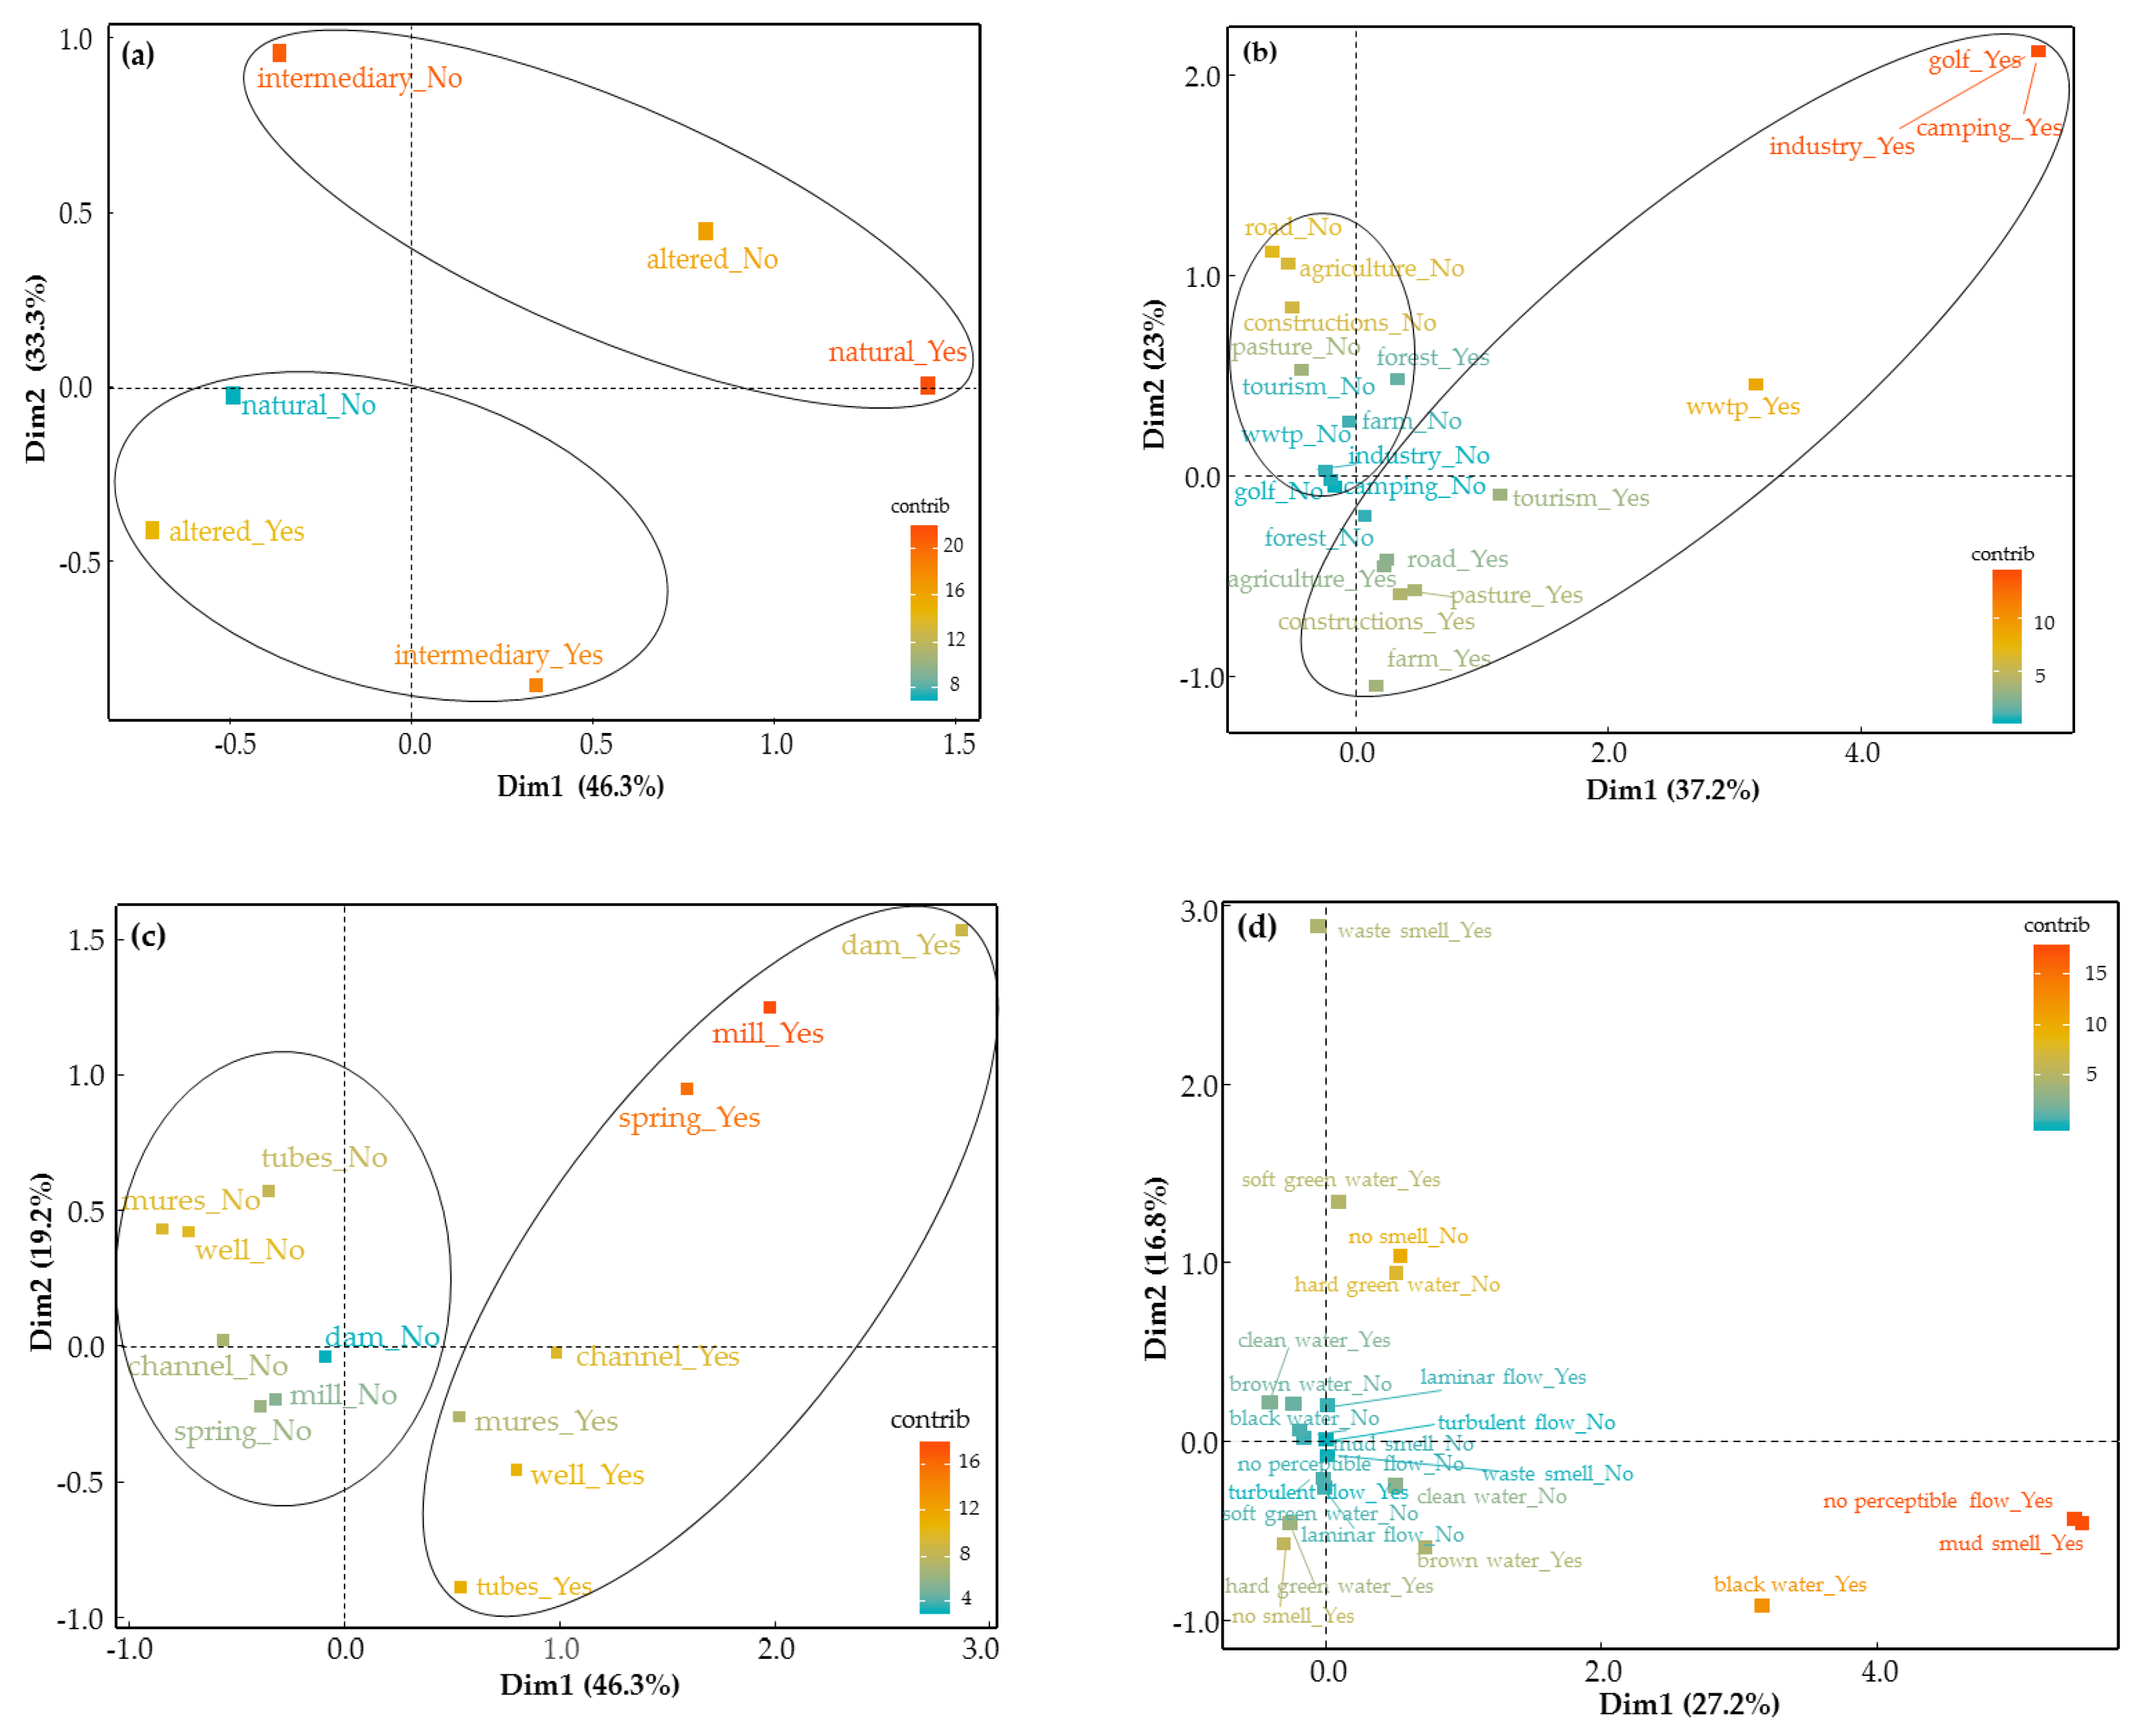
Results showed independence of gains and losses from the characteristics of the groups of volunteers, thereby rejecting the initial hypothesis. Then, the adopted procedure of sorting and identification can be applied to a wide universe of possible volunteers. However, number of gains and losses seem to be dependent on human pressures, thus rejecting the hypothesis of independence. The most degraded sites tend to be dominated by a small number of more tolerant taxa [40], making it difficult to single out the few different ones; therefore, more gains were detected (positive significant correlation, Table 5). In contrast, sites with better quality tend to have richer communities [40], and individuals belonging to the same surrogate can be distributed by several surrogates. However, those gains and losses did not affect the ecological quality assessment, because the number of correct classifications (the same between primary and audited analyses) outweighed the incorrect ones, a fact that confirms other studies done with experts [37] and nonexperts [29,41].
Previous studies also assessed the reliability of stream monitoring by volunteers in relation to professionals (e.g., [6,16,26,27,29,42,43]) and most of them concluded that, with appropriate resourcing and robust protocols, volunteer data closely agree with the professional data used by government reporting and decision making. High correlations were also obtained between primary and audit analyses in New Zealand for %EPT—Ephemeroptera, Plecoptera and Trichoptera [16] and in the U.S.A. by the volunteer programs in Virginia [43] and Seattle [26].
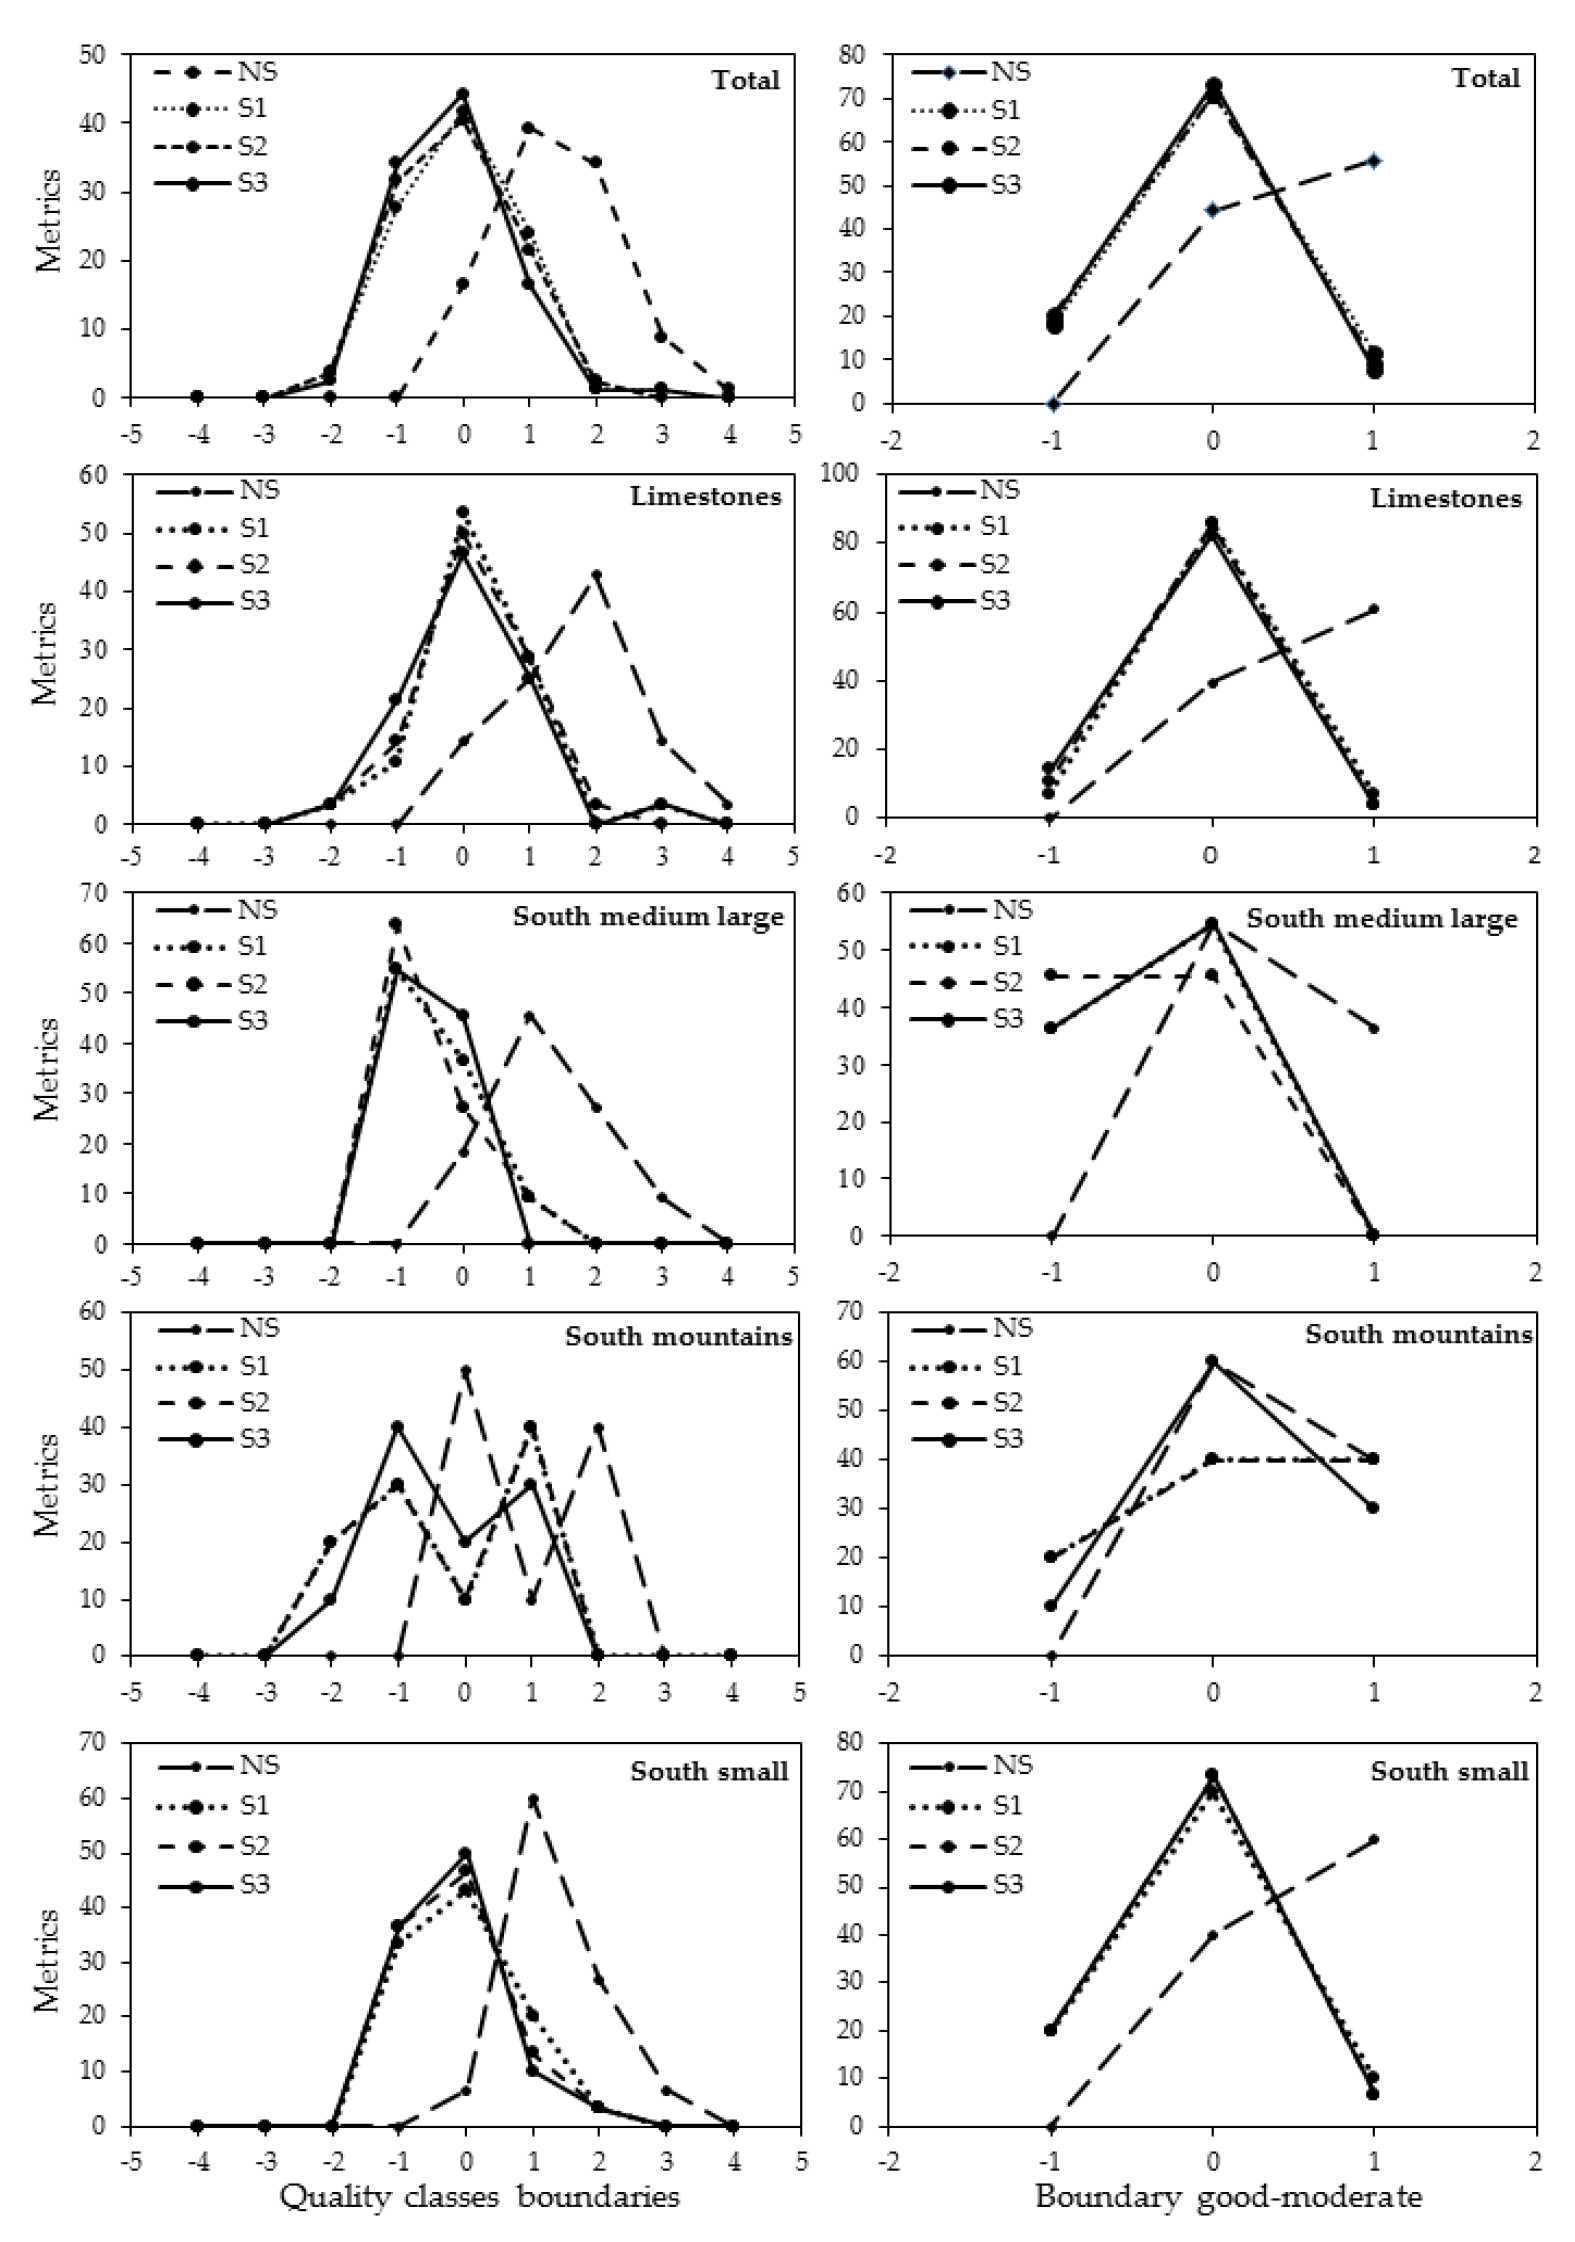
Although significant correlations were obtained between scores of the four tested metrics and the NCS, the three summative metrics gave better results when the quality classes were compared. This confirms the hypothesis of a better performance of the summative metrics. Generally, the NS tended to overevaluate the ecological assessment because it reduces information to only the most sensitive taxa, independently from community composition. The summative metrics accounting for the tolerance scores of all the surrogates present were found to balance taxa richness and tolerances. Reducing the five quality classes of the WFD to two classes, separated by the good–moderate boundary, showed that the number of correct classifications increased, making these summative metrics more acceptable to classify water bodies that are below the good quality status (the environmental target of the WFD).
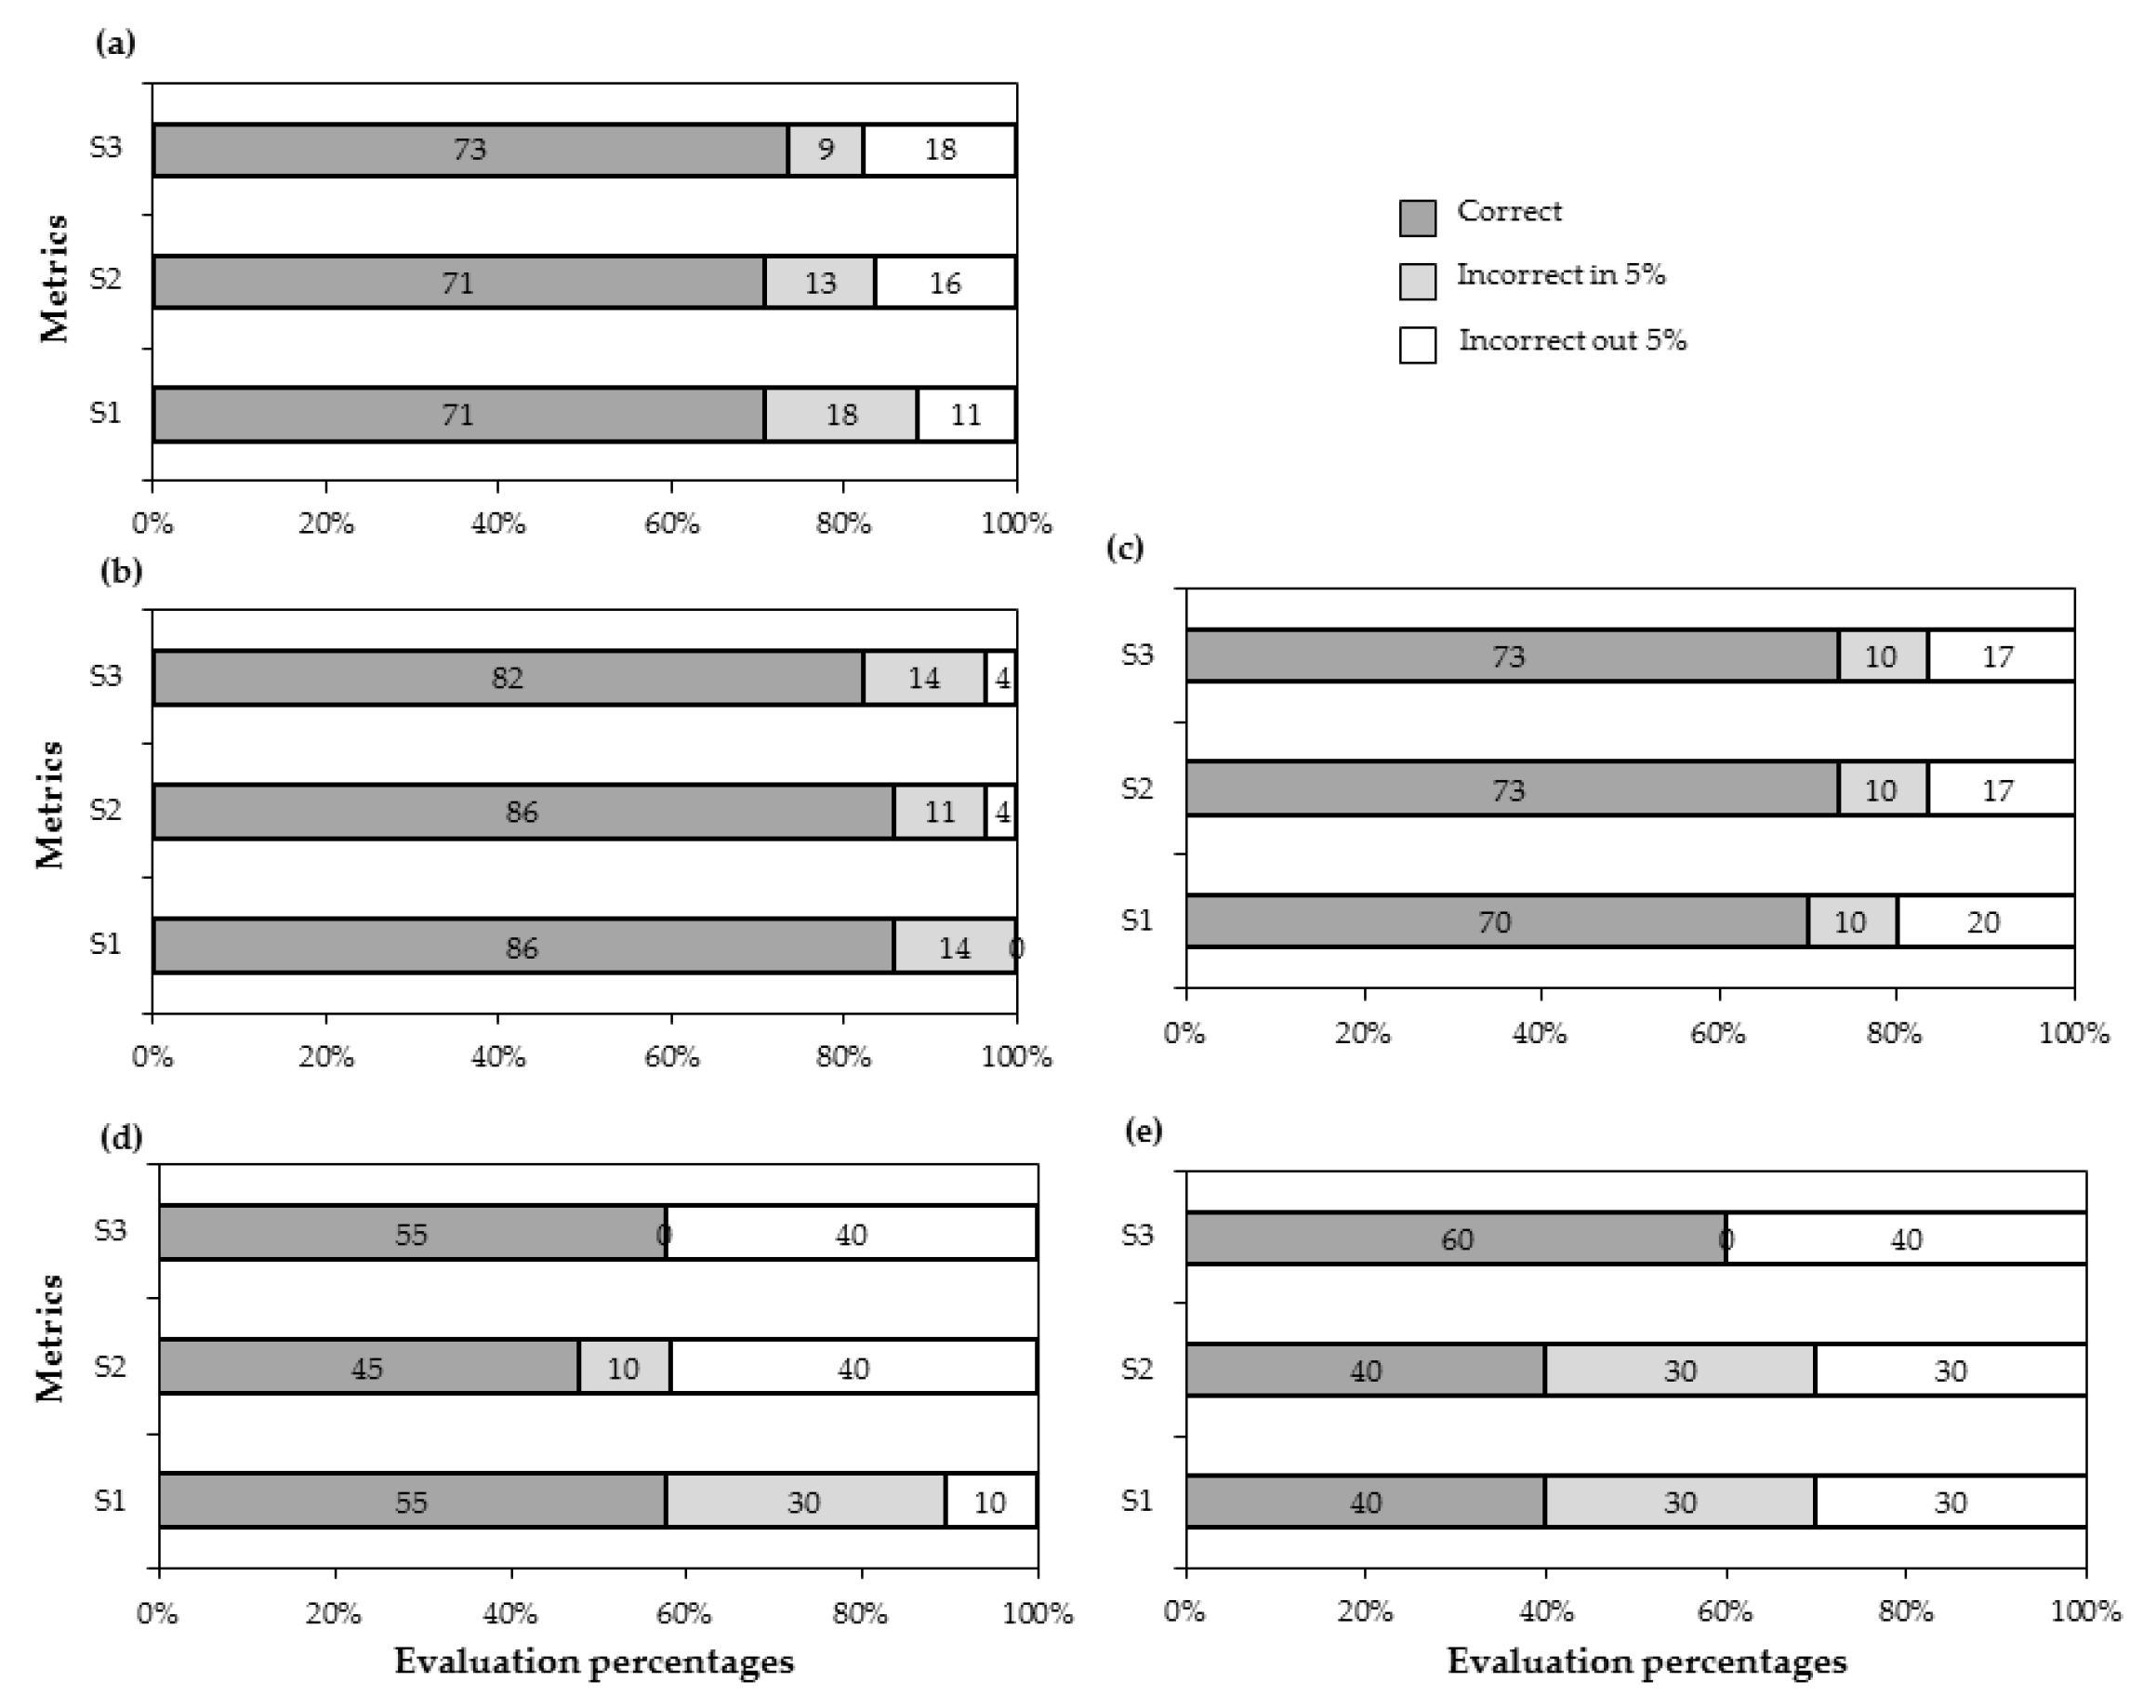
The accuracy of the volunteer procedure (difference between primary and audited analyses) is very similar to the tested metrics (summative and nonsummative) when five ecological quality classes are established. However, if only two quality classes are established (boundary good/moderate), the accuracy of the summative metrics is higher than the nonsummative one.
Since the results obtained by S1, S2, and S3 were very similar and more accurate than those obtained by NS, S2 was selected to be the Metric of Aquatic Invertebrates for Volunteers (MAIV) for two main reasons: (1) the tolerance scores of the surrogates are based on published results [38] and (2) the scores of all surrogates included in each of the four groups of tolerance are equal, thus, easier to use. A detailed calculation protocol of the MAIV is provided in Tables S4 and S5.
The MAIV proved to be adequate for volunteers, because it is based on a set of a few surrogates easily recognized by nonexpert people, saving time when compared to other volunteer monitoring experiences in which the identification is done to the family level [26]. In addition, its application is independent from the characteristics of the volunteers, and the determination of the ecological quality class is simple and quick, keeping volunteers interested. However, the use of MAIV, to complement the NCS raised some concerns that need to be pointed out. In fact, MAIV reduces the assessment to one tolerance metric, while the NCS [35] is based on an index composed by metrics of tolerance, composition, and diversity. This is the reason for the lower accuracy of MAIV in arranging water bodies into five ecological quality classes. However, MAIV still is a good tool for the detection of water bodies that are below the good ecological quality status (the WFD environmental target).
The use of single volunteer data (MAIV classifications) for management purposes can be risky, due to the lower precision. However, its use integrated with a set of samples to detect geographical and/or temporal environmental patterns can be an important complement for water authorities, as already pointed out by Deutsch et al. [9], saving time and costs [30,44,45]. Thus, to prevent incorrect management decisions based on MAIV, it is advisable to keep an interval of 5% of uncertainty around the good–moderate boundary (scores 41 to 49).
The results obtained in the present exercise show that MAIV can be applied to different Portuguese river types with the same boundaries, with acceptable results, like the south limestone and south small rivers types. But no definitive conclusions can be reached concerning the other two river types, due to the reduced number of sites used in the exercise. However, if the MAIV will be used in a first step by volunteers, it had to be kept simple. Different boundaries for different river types could introduce a complexity not important for the objective of MAIV. This latter metric could provide an extensive coverage of river assessments, complementing the NCS. Thus, the obtained results by MAIV could act as a warning of human pressures on river sites that are not regularly assessed by the NCS, indicating where more detailed monitoring or management actions could be needed.
The involvement of the educational community in the training courses proved to be quite effective. Teachers had the chance to develop their professional profile by improving the STEM literacy, through theoretical lectures that related to practical aspects (i.e., field and laboratory practical lectures) on conservation and sustainability of freshwater ecosystems. Some other benefits of this study were student citizenship, connection of knowledge, awareness and behavior, and partnering student biomonitoring research with community needs, as well as those of stakeholders and policy makers. In general terms, volunteers are strongly encouraged by interaction with scientists, and identified learning as one of the main rewards of taking part in CS projects, as documented by other studies [46,47,48]. The training procedure confirmed that SC, providing only theoretical information, is insufficient to elicit the required behavioral changes, with the training on identification being a key factor to the success of volunteer monitoring programs [27,49]. But identification should be complemented with other tools [11,42,43] such as simplified identification keys [27]. Hence, if it is desired to elicit new perspectives on how the behavior of individuals connect them to services provided by their ecosystem, and if the premise that “individuals act ethically as an integral part of an interconnected society and biosphere” is to be accomplished, it should be reached through personal belief rather than rational understanding [50].
Although there has been an increase in the number of studies on environmental monitoring research, precise tools to measure data quality are still scarce [25,51], compared to other volunteer practices, such as those in the health sector, for example [25]. More effort is required to evaluate data quality and to adjust more specific and simple methodologies, this to give credibility to volunteer data and enhance the effect on environmental community education [25]. A compromise is needed, between less uncertainties in environmental data and environmental community education, supporting volunteers in a balanced way.
The dimension of the regional project reported herein, involving six teacher training centers, is too large to be repeated, mainly due to the limited available resources (time and budget). However, the skills obtained by citizens was the seed for the creation of several small groups of volunteers (environmental school clubs involving senior citizens) that are being trained specifically in sampling procedures and identification; a much lower effort than organizing six entire training courses.

5. Conclusions

After training, students are able to identify aquatic invertebrates using simplified invertebrate keys and indices, a skill that can be used to accurately detect ecological status lower than good. Protocols and methods used for the monitoring of streams proved to be well accepted by volunteers. Voluntary monitoring as well as economic viability may contribute to social perceptions regarding environmental issues (e.g., [11]). The MAIV proved to be a good compromise between simplicity and result acceptability. Results show that the MAIV does hold up as a method for citizen scientists to use and that compared to the use of the same method by professionals, it is quite appropriate for volunteers. MAIV, used in a first step by trained volunteers, can be a valuable complement of the official monitoring program, adding value to the detection of possible ecological problems in sampling sites. The audit procedure showed a good performance by volunteers, with results not being significantly different from those obtained by experts. Concerning the evaluated metrics, summative metrics (sum of the scores of all present surrogates) are more accurate than the nonsummative metric, which final score is the highest surrogate tolerance score.

Supplementary Materials

The following are available online at https://www.mdpi.com/2073-4441/12/3/654/s1. Table S1: Characteristics of volunteer groups (student classes), according to the scholar degree (covering degrees from the 5th to the 12th years of scholarity), mean age of the students, number of teachers involved, and number of students for each class. A few schools merged different classes in the same group; those cases correspond to two to three scholar degrees or two to three mean ages. Table S2: Categories in the field form distributed by the four main descriptors. Table S3: Macroinvertebrate surrogate groups and respective ecological quality class. Tables S4 and S5: Calculation of the Metric of Aquatic Invertebrates for Volunteers (MAIV)—(S4) Tolerance scores of the surrogates. The scores increase as the tolerance decrease. (S5) Boundaries between ecological quality classes. Figure S1: The flow key to identify the surrogate taxa.

Author Contributions

Conceptualization, P.P., F.L., P.V., C.V., M.M.M, L.C., and M.A.T.; Methodology, P.P., J.M.B.O.-J., F.L., M.M.M., L.C., P.V., S.M.A.D., C.V., E.A.M., and M.A.T.; Validation, P.P., F.L., M.M.M., L.C., P.V., S.M.A.D., C.V., E.A.M., and M.A.T.; Formal Analysis, P.P., J.M.B.O.-J., F.L., M.M.M., L.C., P.V., S.M.A.D., C.V., E.A.M., and M.A.T.; Investigation, P.P., F.L., M.M.M., L.C., P.V., S.M.A.D., C.V., E.A.M., and M.A.T.; Resources, P.P. and M.A.T.; Writing—Original Draft Preparation, P.P., J.M.B.O.-J., F.L., M.M.M., L.C., P.V., S.M.A.D., C.V., E.A.M., and M.A.T.; Writing—Review and Editing, P.P., J.M.B.O.-J., F.L., M.M.M., L.C., P.V., S.M.A.D., C.V., E.A.M., and M.A.T.; Visualization, P.P., J.M.B.O.-J., F.L., M.M.M., L.C., P.V., S.M.A.D., C.V., E.A.M., and M.A.T.; Supervision, P.P. and M.A.T.; Project Administration, P.P. and M.A.T.; Funding Acquisition, P.P. and M.A.T. All authors have read and agreed to the published version of the manuscript.

Funding

This study received partially funds from FCT—Portuguese Foundation for Science and Technology through project UID/Multi/04326/2013.

Acknowledgments

This study results from an enthusiastic task force among teachers, students, managers, and scientists, only possible due to the support of the Algarve Educational Authority and the interest and effort of the directors of the Teacher Training Centers (TTC): Ana Cristina Madeira (TTC Rui Grácio); Maria Fernanda Branco (TTC of Portimão and Monchique); Filomena Rua (TTC Albufeira, Lagoa and Silves); Natalina Cabeços (TTC from Coast to mountains); José Manuel Ribeirinho (TTC of Ria Formosa schools); Eduarda Guerreiro (TTC School Association of Algarve Levante). J.M.B.O.-J. thanks Universidade Federal do Oeste do Pará (Ufopa) for his authorization to leave the country to participate in the Postdoctoral Internship at the Universidade do Algarve/CCMAR, Portugal (Ordinance No. 708/GR-Ufopa of 27 November 2018, rectified by No. 178, of 4 April 2019).

Conflicts of Interest

The authors declare no conflict of interest. The funders had no role in the design of the study; in the collection, analyses, or interpretation of data; in the writing of the manuscript, or in the decision to publish the results.

References

  1. European Union. Directive 2000/60/EC of the European Parliament and of the Council Establishing a Framework for the Community Action in the Field of Water Policy (WFD); European Union: Brussels, Belgium, 2000. [Google Scholar]
  2. Birk, S.; Bonne, W.; Borja, A.; Brucet, S.; Courrat, A.; Poikane, S.; Solimini, A.; Van De Bund, W.; Zampoukas, N.; Hering, D. Three hundred ways to assess Europe’s surface waters: An almost complete overview of biological methods to implement the Water Framework Directive. Ecol. Indic. 2012, 18, 31–41. [Google Scholar] [CrossRef]
  3. Teichert, S. The Influence of Capacity and Attitudes in the Use of Water Quality Citizen Science and Volunteer Benthic Monitoring in the Freshwater Management Activities of Ontario’s Conservation Authorities. Ph.D. Thesis, Western University, London, ON, Canada, April 2016. Available online: https://ir.lib.uwo.ca/etd/3690 (accessed on 17 July 2019).
  4. Macknick, J.E.; Enders, S.K. Transboundary forestry and water management in Nicaragua and Honduras: From conflicts to opportunities for cooperation. J. Sustain. Forest. 2012, 31, 376–395. [Google Scholar] [CrossRef]
  5. Woolley, A.W.; Chabris, C.F.; Pentland, A.; Hashmi, N.; Malone, T.W. Evidence for a collective intelligence factor in the performance of human groups. Science 2010, 330, 686–688. [Google Scholar] [CrossRef] [PubMed] [Green Version]
  6. Penrose, D.L.; Call, S.M. Volunteer monitoring of benthic macroinvertebrates: Regulatory biologists’ perspectives. J. N. Am. Benthol. Soc. 1995, 14, 203–209. [Google Scholar] [CrossRef]
  7. Cuthill, M. An Interpretive Approach to Developing Volunteer-based Coastal Monitoring Programmes. Local Environ. 2000, 5, 127–137. [Google Scholar] [CrossRef]
  8. Currin, C.A.; Delano, P.C.; Valdes-Weaver, L.M. Utilization of a citizen monitoring protocol to assess the structure and function of natural and stabilized fringing salt marshes in North Carolina. Wetl. Ecol. Manag. 2008, 16, 97–118. [Google Scholar] [CrossRef]
  9. Deutsch, W.; Lhotka, L.; Ruiz-Córdova, S. Group Dynamics and Resource Availability of a Long-Term Volunteer Water-Monitoring Program. Soc. Nat. Resour. 2009, 22, 637–649. [Google Scholar] [CrossRef]
  10. Kebo, S.; Bunch, M. Canadian ENGOs in governance of water resources: Information needs and monitoring practices. Environ. Monit. Assess. 2013, 185, 9451–9460. [Google Scholar] [CrossRef]
  11. França, J.S.; Solar, R.; Hughes, H.M.; Callisto, M. Student monitoring of the ecological quality of neotropical urban streams. Ambio 2019, 48, 867–878. [Google Scholar] [CrossRef]
  12. Manfrin, C.; Souty-Grosset, C.; Anastácio, P.M.; Reynolds, J.; Giulianini, P.G. Detection and Control of Invasive Freshwater Crayfish: From Traditional to Innovative Methods. Diversity 2019, 11, 5. [Google Scholar] [CrossRef] [Green Version]
  13. Brouwer, S.; Van der Wielen, P.W.J.J.; Schriks, M.; Claassen, M.; Frijns, J. Public Participation in Science: The Future and Value of Citizen Science in the Drinking Water Research. Water 2018, 10, 284. [Google Scholar] [CrossRef] [Green Version]
  14. Lowry, C.S.; Fienen, M.N.; Hall, D.M.; Stepenuck, K.F. Growing Pains of Crowdsourced Stream Stage Monitoring Using Mobile Phones: The Development of CrowdHydrology. Front. Earth Sci. 2019, 7, 128. [Google Scholar] [CrossRef] [Green Version]
  15. Shahady, T.; Boniface, H.J. Water quality management through community engagement in Costa Rica. Environ. Stud. Sci. 2018, 8, 488–502. [Google Scholar] [CrossRef] [Green Version]
  16. Storey, R.G.; Wright-Stow, A.; Kin, E.; Davies-Colley, R.; Stott, R. Volunteer stream monitoring: Do the data quality and monitoring experience support increased community involvement in freshwater decision making? Ecol. Soc. 2016, 21, 32. [Google Scholar] [CrossRef] [Green Version]
  17. Thatoe Nwe Win, T.; Bogaard, T.; van de Giesen, N. A Low-Cost Water Quality Monitoring System for the Ayeyarwady River in Myanmar Using a Participatory Approach. Water 2019, 11, 1984. [Google Scholar] [CrossRef] [Green Version]
  18. Dumakude, N.; Graham, M. Assessing Wetland Health Using a Newly Developed Land Cover Citizen Science Tool for Use by Local People Who Are Not Wetland Specialists. S. Afr. J. Environ. Educ. 2017, 33, 71–83. [Google Scholar] [CrossRef] [Green Version]
  19. Seibert, J.; Strobl, B.; Etter, S.; Hummer, P.; van Meerveld, H.J. (Ilja).Virtual Staff Gauges for Crowd-Based Stream Level Observations. Front. Earth Sci. 2019, 7, 70. [Google Scholar] [CrossRef] [Green Version]
  20. Hobbs, S.J.; White, P.C.L. Motivations and barriers in relation to community participation in biodiversity recording. J. Nat. Conserv. 2012, 20, 364–373. [Google Scholar] [CrossRef]
  21. Johnson, B. Can Education Improve the Environment? Applying the Pressure-State-Response Environmental Indicator Framework to Environmental Education Program Outcomes. Ph.D. Thesis, Antioch University-New England, Keene, NH, USA, June 2013. Available online: https://aura.antioch.edu/etds/55 (accessed on 5 August 2019).
  22. Norris, S.P.; Phillips, L.M. How literacy in its fundamental sense is central to scientific literacy. Sci. Educ. 2003, 87, 224–240. [Google Scholar] [CrossRef]
  23. Nerbonne, J.F.; Nelson, K.C. Volunteer macroinvertebrate monitoring: Tensions among group goals, data quality, and outcomes. Environ. Manag. 2008, 42, 470–479. [Google Scholar] [CrossRef]
  24. Stelzer, R.S.; Kashian, D.R. The role of conservation partnerships between scientists and nonprofit agencies in freshwater science and management. Freshw. Sci. 2014, 33, 670–673. [Google Scholar] [CrossRef] [Green Version]
  25. Measham, T.G.; Barnett, G.B. Environmental Volunteering: Motivations, modes and outcomes. Aust. Geogr. 2008, 39, 537–552. [Google Scholar] [CrossRef]
  26. Fore, L.; Paulsen, K.; O’Laughlin, K. Assessing the performance of volunteers in monitoring streams. Freshw. Biol. 2001, 46, 109–123. [Google Scholar] [CrossRef]
  27. Nerbonne, J.F.; Vondracek, B. Volunteer macroinvertebrate monitoring: Assessing training needs through examining error and bias in untrained volunteers. J. N. Am. Benthol. Soc. 2003, 22, 152–163. [Google Scholar] [CrossRef] [Green Version]
  28. Clarke, R.T.; Hering, D. Errors and uncertainty in bioassessment methods-major results and conclusions from the STAR project and their application using STARBUGS. In The Ecological Status of European Rivers: Evaluation and Intercalibration of Assessment Methods; Furse, M.T., Hering, D., Brabec, K., Buffagni, A., Sandin, L., Verdonschot, P.F.M., Eds.; Springer: Dordrecht, The Netherlands, 2006; Volume 188, pp. 433–439. [Google Scholar] [CrossRef]
  29. Moffett, E.R.; Neale, M.W. Volunteer and professional macroinvertebrate monitoring provide concordant assessments of stream health. N. Z. J. Mar. Freshw. Res. 2015, 49, 366–375. [Google Scholar] [CrossRef]
  30. Schugurensky, D.; Munde, K. Volunteer work and learning: Hidden dimensions of labour force training. In International Handbook of Educational Policy; Bascia, N., Cumming, A., Datnow, A., Laithwood, K., Livingstone, D., Eds.; Springer: Berlin/Heidelberg, Germany, 2005; Volume 13, pp. 997–1022. [Google Scholar] [CrossRef] [Green Version]
  31. Buytaert, W.; Zulkafli, Z.; Grainger, S.; Acosta, L.; Alemie, T.C.; Bastiaensen, J.; De Bièvre, B.; Bhusal, J.; Clark, J.; Dewulf, A.; et al. Citizen science in hydrology and water resources: Opportunities for knowledge generation, ecosystem service management, and sustainable development. Front. Earth Sci. 2014, 2, 26. [Google Scholar] [CrossRef] [Green Version]
  32. Sabater, S.; Guasch, H.; Muñoz, I.; Romaní, A. Hydrology, light and the use of organic and inorganic materials as structuring factors of biological communities in Mediterranean streams. Limnetica 2006, 25, 335–348. [Google Scholar] [CrossRef]
  33. Bis, B.; Kosmala, G. Identification Cards for Macroinvertebrates. Produced by the EC Funded Project CONFRESH 226682-CP-1-2005-GR-COMENIUS-C21. 2008. Available online: http://www.nhmc.uoc.gr/confresh (accessed on 15 August 2010).
  34. Morais, M.; Pinto, P.; Gonçalves, C. Chapter 3 lakes rivers and estuaries: 34–55. In Freshwater Ecosystems of Europe, an Educational Approach, Supporting Material for Teachers’ Training Seminars; Coord Voreadau, C., Ed.; Produced by the EC Funded Project CONFRESH 226682-CP-1-GR-COMENIUS-C-21; 2008; Available online: http://www.nhmc.uoc.gr/confresh (accessed on 15 August 2010).
  35. INAG, I.P. Manual Para A Avaliação Biológica Da Qualidade Da Água Em Sistemas Fluviais Segundo A Diretiva Quadro Da Água, Protocolo De Amostragem E Análise Para Os Macroinvertebrados Bentónicos; Ministério do Ambiente, Ordenamento do Território e do Desenvolvimento Regional, Instituto da Água, I.P.: Lisboa, Portugal, 2008; 61p.
  36. Tachet, H.; Richoux, F.; Bournaud, M.; Usseglio-Polatera, P. Invertébés D’eau Douce: Systématique, Biologie, Écologie, 1st ed.; CNRS Éditions: Paris, Frence, 2000; p. 587. [Google Scholar]
  37. Haase, P.; Murray-Bligh, J.; Lohse, S.; Pauls, S.; Sundermann, A.; Gunn, R.; Clarke, R. Assessing the impact of errors in sorting and identifying macroinvertebrate samples. Hydrobiologia 2006, 566, 505–521. [Google Scholar] [CrossRef]
  38. Alba-Tercedor, J.; Sanchez-Ortega, A. Un Método rápido y simple para evaluar la calidad biológica de las aguas corrientes basado en Hallawell. Limnética 1988, 4, 51–56. [Google Scholar]
  39. U.S. Environmental Protection Agency (USEPA). Volunteer Stream Monitoring: A Methods Manual; EPA Office of Wetlands, Oceans, and Watersheds (4503F): Washington, DC, USA, 1997; EPA 841-B-97-003.
  40. Ortiz, J.D.; Puig, M.A. Point source effects on density, biomass and diversity of benthic macroinvertebrates in a Mediterranean stream. River Res. Appl. 2007, 23, 155–170. [Google Scholar] [CrossRef]
  41. Metzeling, L.; Chessman, B.; Hardwick, R.; Wong, V. Rapid assessment of rivers using macroinvertebrates: The role of experience, and comparisons with quantitative methods. Hydrobiologia 2003, 510, 39–52. [Google Scholar] [CrossRef]
  42. Sharpe, A.; Conrad, C. Community based ecological monitoring in Nova Scotia: Challenges and opportunities. Environ. Monit. Assess. 2006, 113, 395–409. [Google Scholar] [CrossRef] [PubMed]
  43. Gowan, C.; Ruby, M.; Knisley, R.; Grimme, L. Stream monitoring methods suitable for citizen volunteers working in the Coastal Plain and Lower Piedmont regions of Virginia. Am. Entomol. 2007, 53, 48–57. [Google Scholar] [CrossRef]
  44. Levrel, H.; Fontaine, B.; Henry, P.Y.; Jiguet, F.; Julliard, R.; Kerbiriou, C.; Couvet, D. Balancing state and volunteer investment in biodiversity monitoring for the implementation of CBD indicators: A French example. Ecol. Econ. 2010, 69, 1580–1586. [Google Scholar] [CrossRef] [Green Version]
  45. Hartmann, A.; Moog, O. Entwicklung und Validierung der Screening-Methode zur Abschätzung des ökologischen Zustandes von Fließgewässern in Österreich. Österreichische Wasser-Und Abfallwirtsch. 2012, 64, 300–306. [Google Scholar] [CrossRef]
  46. Hungerford, H.; Volk, T.; Ramsey, J. Instructional impacts of environmental education on citizenship behaviour and academic achievement: Research on Investigating and Evaluating Environmental Issues and Actions: 1979–2000. In Proceedings of the 29th Annual Conference of the North American Association for Environmental Education, South Padre Island, TX, USA, 7 October 2000. [Google Scholar]
  47. Rickinson, M. Learners and learning in environmental education: A critical review of the evidence. Environ. Educ. Res. 2001, 7, 207–320. [Google Scholar] [CrossRef]
  48. Chawla, L.; Cushing, D.F. Education for strategic environmental behavior. Environ. Educ. Res. 2007, 13, 437–452. [Google Scholar] [CrossRef] [Green Version]
  49. Kremen, C.; Ullmann, K.S.; Thorp, R.W. Evaluating the quality of citizen-scientist data on pollinator communities. Conserv. Biol. 2011, 25, 607–617. [Google Scholar] [CrossRef]
  50. McAlpine, C.A.; Seabrook, L.M.; Ryan, J.G.; Feeney, B.J.; Ripple, W.J.; Ehrlich, A.; Ehrlich, P.R. Transformational change: Creating a safe operating space for humanity. Ecol. Soc. 2015, 20, 56. [Google Scholar] [CrossRef] [Green Version]
  51. Mayio, A.; Brossman, M.; Markowitz, A. The Volunteer Monitor’s Guide to Quality Assurance Project Plans; United States Environmental Protection Agency: Washington, DC, USA, 1996; pp. 1–59.
Figure 1. Flow diagram summarizing the methodology adopted for the present study. Inside white boxes are intermediate and final results, being the latter highlighted in grey. Arrows indicated the sequence of the procedures. Metric of Aquatic Invertebrates for Volunteers (MAIV), National Classification System (NCS), summative metrics (S1, S2, and S3), nonsummative metric (NS).
Water 12 00654 g001
Figure 2. Geographical distribution of the sampling sites complemented with the location of the secondary schools involved in the study. Dams and municipality boundaries are also depicted.
Water 12 00654 g002
Figure 3. (a) Habitat assessment and macroinvertebrate sampling, (b) screening, (c) identification, and (d) classification of macroinvertebrates by volunteers in the Algarve region, southern Portugal.
Water 12 00654 g003
Figure 4. Multiple Correspondence Analysis (MCA) showing the first two dimensions (Dim1 and Dim2) with samples arranged according to data in field forms. Four groups of descriptors are represented separately to avoid overlap of the vectors—(a) stream characteristics, (b) land use, (c) settlements on the stream, and (d) state of the water. The importance of contributing variable categories is shown by the color scale (from blue to red). Yes = Presence, No = Absence, wwtp = wastewater treatment plant.
Water 12 00654 g004
Figure 5. Comparison of metric classifications (NS, S1, S2, S3) with the NCS classification. Negative numbers correspond to underevaluations, 0 corresponds to correct evaluations, and positive numbers correspond to overevaluations. The absolute values on the x-axis correspond to the number of classes the metric classification differs from the NCS classification. The y-axis corresponds to the frequency of the underevaluations, correct evaluations, and overevaluations. The graphs in the left column correspond to five ecological quality classes. Graphs on the right correspond to two ecological quality classes. The results are reported for the all the sites and for each river type.
Water 12 00654 g005
Figure 6. Comparison summative metric classifications (S1, S2, S3) with the NCS classification for two ecological quality classes, showing the percentage of correct and incorrect classifications, and the 5% interval of uncertainty. The results are reported for the (a) total sites and to each river type: (b) south limestones, (c) south small, (d) south medium–large, and (e) south mountains.
Water 12 00654 g006
Table 1. Tolerance scores established for surrogates for the different tested metrics. The nonsummative (NS) metric score corresponds to the highest surrogate score. Scores of the other metrics (S1, S2, S3) are obtained by the sum of the scores of all the surrogates present. The Mean IBMWP column shows the mean tolerance score attributed by IBMWP (Iberian Biological Monitoring Working Party) to families included in the surrogate. The number of families included in each mean are shown in parentheses.
TaxaNSS1Mean IBMWPS2S3
Oligochaeta221.0 (1)21
Chironomidae22.0 (1)22
Planaria335.0 (3)55
Hirudinea32.5 (4)52
Gastropoda34.3 (11)54
Bivalvia34.5 (2)54
Isopoda36.0 (2)56
Anisoptera37.5 (5)57
Zygoptera36.7 (3)57
Coleoptera33.8 (13)54
Simuliidae33.0 (1)53
Diptera34.2 (19)54
Amphipoda446.0 (3)66
Crustacea44.5 (2)64
Ephemeroptera47.5 (11)67
Trichoptera48.5 (20)68
Megaloptera44.0 (1)64
Plecoptera559.6 (7)1010
Table 2. Score limits of the ecological quality classes for each tested metric.
Quality ClassesNSS1S2S3
High437 to 5961 to 9461 to 98
Good328 to 3646 to 6046 to 60
Moderate219 to 2731 to 4531 to 45
Fair19 to 1815 to 3015 to 30
Bad11 to 81 to141 to 15
Table 3. Gains and losses (totals and means per sample) for the three audits (sorting, identification, and total). A total of 36 samples were audited. Standard deviations appear inside parentheses.
Gains and LossesSorting AuditIdentification AuditTotal Audit
TotalMeanTotalMeanTotalMean
Gains10(0.2)1003(2.6)1013(2.6)
Losses00(0.0)211(1.0)211(1.0)
Table 4. Gains and losses of the identification audit, distributed by the surrogates. The vernacular names of the taxa are inside parentheses.
Taxa GainsLosses
Planaria (flatworm)00
Oligochaeta (worms)70
Chironomidae larvae (midge blood larvae)90
Simuliidae larvae (black-fly larvae)80
Diptera larvae (fly larvae)92
Hirudinea (leach)31
Gastropoda (freshwater snail)90
Coleoptera adults and larvae (beetle)103
Bivalvia (freshwater mussels)00
Zygoptera larvae (damselfly)60
Anisoptera larvae (dragonfly)50
Isopoda (freshwater slater)00
Amphipoda (freshwater scud)00
Trichoptera larvae (caddisfly)61
Ephemeroptera larvae (mayfly)140
Crustacea (shrimps and crabs)40
Megaloptera larvae (alderfly)00
Plecoptera larvae (stonefly)100
Table 5. Pearson correlation of the total audit (gains and losses) with the volunteer group characteristics, the human pressures (composite gradient), and the quality classes.
Gains and LossesScholar DegreeAge of StudentsNumber of StudentsNumber of TeachersHuman PressuresQuality Classes
Total gains0.100.04−0.220.240.63 **0.07
Total losses−0.12−0.220.14−0.17−0.330 *−0.14
Number363335373637
* p < 0.05; ** p < 0.01.
Table 6. Comparison of primary and audited classifications. Underevaluation occurs when primary classification is lower than the audited classification, with the opposite for overevaluation. When both classifications match, it is considered as correct.
UnderevaluationsCorrectOverevaluations
Two ClassesOne ClassOne ClassTwo Classes
Primary to Audited 482200
Table 7. Spearman correlations between the National Classification System (NCS) classification and metric classifications (** p < 0.01).
National Classification SystemMetrics
NSS1S2S3
NCS 0.496 **0.548 **−0.58 **0.60 **
Number of sites79797979
Table 8. Comparison of quality classes, between primary and audited analyses of 33 samples analyzed by the volunteers for the tested metrics (NS, S1, S2, S3). Underevaluation occurs when the class quality of the primary analysis is lower than the audited analysis; an overevaluation occurs in the opposite case. When both classifications match, it is considered as correct. Three samples were not included due to deficient preservation of the material sent to the auditors.
Tested Metrics 5 Quality Classes2 Quality Classes
UnderCorrectOverUnderCorrectOver
S1131913282
S2131732301
S3151622292
NS1122010230

