Freshwater Reptile Persistence and Conservation in Cities: Insights from Species Occurrence Records


1
Environment, Energy and Science Group, NSW Department of Planning, Industry and the Environment, 4 Parramata Square, Parramatta, NSW 2150, Australia
2
Palaeontology, Geobiology and Earth Archives Research Centre (PANGEA), School of Biological, Earth and Environmental Sciences UNSW, Kensington 2052, Australia
3
Lancaster Environment Centre, Lancaster University Library Avenue, Lancaster University, Lancaster LA1 4YQ, UK
*
Author to whom correspondence should be addressed.
Water 2020, 12(3), 651; https://doi.org/10.3390/w12030651
Submission received: 25 October 2019
/
Revised: 17 February 2020
/
Accepted: 24 February 2020
/
Published: 28 February 2020
(This article belongs to the Special Issue Multiplicity, Characteristics, Main Impacts, and Stewardship of Natural and Artificial Freshwater Environments: Consequences for Biodiversity Conservation)
Abstract
:Reptiles are rarely included in urban freshwater biodiversity monitoring and conservation. We explored the global persistence of freshwater dependent turtles, lizards, crocodilians and snakes in cities with a population greater than 100,000 using species occurrence data in online databases from a five-year period (2013–2018). We then used ecological niche models to help identify the locations of suitable habitats for three freshwater reptile species in Sydney, Australia. Our Global analysis showed that sightings of a majority of known species of crocodilians and freshwater turtles were recorded in databases within this 5-year period in contrast to about one in three freshwater lizard species and one in ten freshwater snake species and that freshwater reptiles were observed within 50 km of the center of 40% of the 3525 cities. While global databases hold substantial recent species occurrence records for some regions, they contain very little data for large parts of the world. Modelling showed that potential suitable habitat for the three freshwater species in Sydney was distributed across areas with different levels of urban development. The persistence of populations of freshwater reptiles in and around a large proportion of the world’s cities show that this group can play an important role in urban biodiversity conservation.
1. Introduction
The number of people living in cities is expected to reach 6.3 billion by 2050, representing an increase of 62% from 2014 [1]. Importantly the growth of urban populations between 2000 and 2030 is expected to be around 70%, while the growth of urban land cover in the same period is expected to be 200% [2]. One implication of these predictions is that biodiversity conservation in cities will play an increasingly important role in protecting and restoring earth’s biodiversity in the 21st century. The two main strategies for optimizing biodiversity in cities are: designating areas that are exclusively reserved for nature and planning how other parts of the urban environment can be shared between human populations and nature [3]. It is also important to understand the food, habitat and connectivity requirements of different species. Freshwater reptiles are typically dependent on components of both aquatic and terrestrial environments. This could make them either more vulnerable or more resilient to a specific threat compared with strictly aquatic or strictly terrestrial species. Hence, the persistence of freshwater reptiles in cities can provide very useful information on the status of urban ecosystems. In some climatic zones monitoring freshwater reptiles can complement the well-established and widely used indicators of freshwater ecosystem health, e.g., macroinvertebrates [4], fish [5] and diatoms [6], and of terrestrial ecosystems, e.g., birds [3], but this potential has not yet been explored at a global scale.
Having agreed criteria and species lists for reptiles that depend on freshwater ecosystems could help guide management actions aimed at improving freshwater biodiversity. The first global attempt to assess species richness and endemism of freshwater reptiles was under the Freshwater Animal Diversity Assessment (FADA) [7]. In that program Freshwater species included: “real aquatic” species, which accomplish all or part of their life cycle in water, and “water-dependent” or “paraquatic” species, which show close and specific dependency on aquatic habitats [7]. Limno-terrestrial species, which require an aqueous matrix in strictly terrestrial habitats, were not considered freshwater species [7]. Freshwater species, hence, include all inland aquatic and paraquatic species as well as some species that live in marine and estuarine environments but show a genuine tolerance to freshwater [7]. Many species included in FADA lists, however, present special cases that do not neatly fit into these definitions. These special cases were addressed by experts in papers on individual groups [7]. Some of the FADA papers included very clear definitions of what constitutes a freshwater species within a specific group but others were less definitive. For example, freshwater birds were defined as species for which disappearance of a freshwater habitat would lead to the disappearance of the species with little chance to adapt [8]. The definition used to attribute 73 lizard species to freshwater was more operational: “lizard species which, on the basis of literature records, and our own observations, appear to be partly dependent on freshwater habitats or resources for their existence” [9]. None of the lizard species were considered strictly aquatic [9]. Similarly, all 23 species of the order Crocodilia were considered semi-aquatic and were listed as freshwater species, including the Saltwater Crocodile, Crocodylus porosus [10]. Many freshwater species of snakes belong to genera, which also include marine or terrestrial species [11] and many morphological specializations seen in freshwater snake species have also been observed in strictly terrestrial or strictly marine snake species. Comprehensive biological information that could confirm freshwater habit was lacking for many species and genera of snakes, hence, the proposed list of 153 freshwater snakes was considered provisional [11]. The list of freshwater turtle species provided for FADA [12] was not accompanied by a precise definition of a freshwater turtle. The 257 Freshwater turtle species included in the FADA list were in 79 genera. Typical environments listed for several of these genera included terrestrial environments but no marine habitats [12]. Since the initial publications in 2008, there have been several unpublished revisions of the FADA lists of lizards, snakes and turtles, resulting in a greater number of freshwater species in all three groups (Aaike DeWever pers. comm, May 2018). Distinguishing freshwater species from marine and terrestrial species helps to prioritize species in conservation activities focused on freshwaters. Hence, this classification is useful provided it is recognized that (1) there are probably large differences between major reptile groups i.e., snakes, lizards, turtles in the nature of dependency of species on freshwater; and (2) degree of dependence on freshwater or any type of aquatic environment can vary greatly among species within a genus [9,11] or even among age groups within a population of one species [12]. While current lists of freshwater snakes, lizards and turtles will continue to be refined, they are probably adequate for freshwater biodiversity assessments at broad spatial scales in most parts of the world.
The objectives of making cities more livable and optimizing their contribution to regional and global biodiversity conservation can be helped by applying principles of systematic conservation planning [13] in urban planning. Special considerations for freshwater will be necessary [14] and may include the use of wetland, river and aquifer types [15], or mapping likely suitable habitat for individual species [16] or a combination of these, as surrogate features. Ecological niche modeling for freshwater reptile species can help identify the locations of likely suitable habitat for these species [17]. These locations can be included in surrogate features for spatial prioritization of conservation actions focused on freshwater ecosystems [16] and to design monitoring programs for assessing the status of freshwater reptile populations in cities.
We predict that, despite the multiple threats they face in urban environments, freshwater reptile species persist in and around a large proportion of cities. A larger number of freshwater reptile species would be expected in and around cities located in tropical and subtropical regions, especially in South and Central America and South East Asia where overall freshwater reptile diversity is high [9,11]. We expect that current global geographic patterns of freshwater reptile persistence in cities will be reflected in recent species occurrence records available from online databases. Where there are such populations in or near cities, important conservation gains should be possible by careful urban planning that supports specific actions to protect and restore freshwater reptile habitats. The success of these actions depends on the availability of potential habitat, ecology of the reptile species and likely support from communities and governments. We expect that ecological niche modelling techniques that help identifying suitable habitat for freshwater reptiles in an around urban centers could be useful in evaluating the likelihood of success of such actions in and around each city and in selecting the locations where the actions will be most effective.
2. Materials and Methods
To examine the current prevalence of freshwater reptiles in and near cities, records of reptile sightings were extracted from the Global Biodiversity Information Facility (GBIF https://www.gbif.org/). GBIF is an international network and research infrastructure funded by the world’s governments aimed at providing anyone, anywhere, open access to various types of biodiversity data. To focus on contemporary distributions and current behavior of observers, we restricted the data to sightings made between January 2013 and April 2018 under two of the nine categories in the “basis of record” field [18]: human observation and observation. The data were downloaded as three separate files for Squamata [19], Testudines [20] and Crocodilia [21]. The Squamata data were then split into Serpentes (snakes) and Lacertilia (lizards), generating the four major reptile groups used in the analyses here. All species of Crocodilia were included in the analysis for that group based on the assessment for the Freshwater Animal Diversity Assessment [7]. For other groups the lists of freshwater species currently accepted by FADA (Aaike DeWever pers. comm.) was used (Table S1) to extract a global dataset of sightings of freshwater reptile species in the five-year period (2013–2018). After removing records that did not have full species names and geographic coordinates, the sightings extracted from GBIF were mapped and two subsets were extracted: (1) records that were within 50 km of the center of a city with a population greater than 100,000 [22]; and (2) records within 10 km of the center of these cities. This information was used to map patterns in both the number of species observed and the number of sightings made in around 3525 cities in the five-year period. We used the geographic coordinates from the Maxmind Free World Cities Database. (http://www.maxmind.com) [22] to represent the position of the city center. The 10 and 50 km distances were chosen to capture major patterns of richness. We aimed to obtain two assessments of freshwater reptiles near cities: one largely confined to the heavily developed areas closer to the city center; and another one that includes the outer suburbs, where there is a greater likelihood of intact habitat for some species. We used the number of species in the two different zones to determine: (1) the species within a major reptile group recorded within 50 km and 10 km to any city center as a proportion of all the species observed in that group in the same period anywhere in the world; (2) the freshwater reptile species recorded within 50 km and 10 km of the center of cities within a Freshwater Ecoregion of the World (FEOW) [23] as a proportion of all the freshwater reptile species recorded in the region in the same period; (3) the proportion of the sightings in each major freshwater reptile group in each of the three areas anywhere in the world (greater than 50 km from the center of a city, between 50 and 10 km from the center of a city and less than 10 km to the center of a city); and (4) the proportion of the freshwater reptile sightings made in each of the three areas in each FEOW region. The size of the populations and areas occupied varied greatly among the selected cities. For many cities the larger radius will probably include peri-urban or even rural landscapes. Hence, some of the freshwater reptile populations, especially in the larger circle should be referred to as being near the city rather than inside it. The proximity of these populations to the city center means that they could be important as source populations of species subject to urban habitat restoration and the construction and maintenance of corridors that connect source and sink populations.
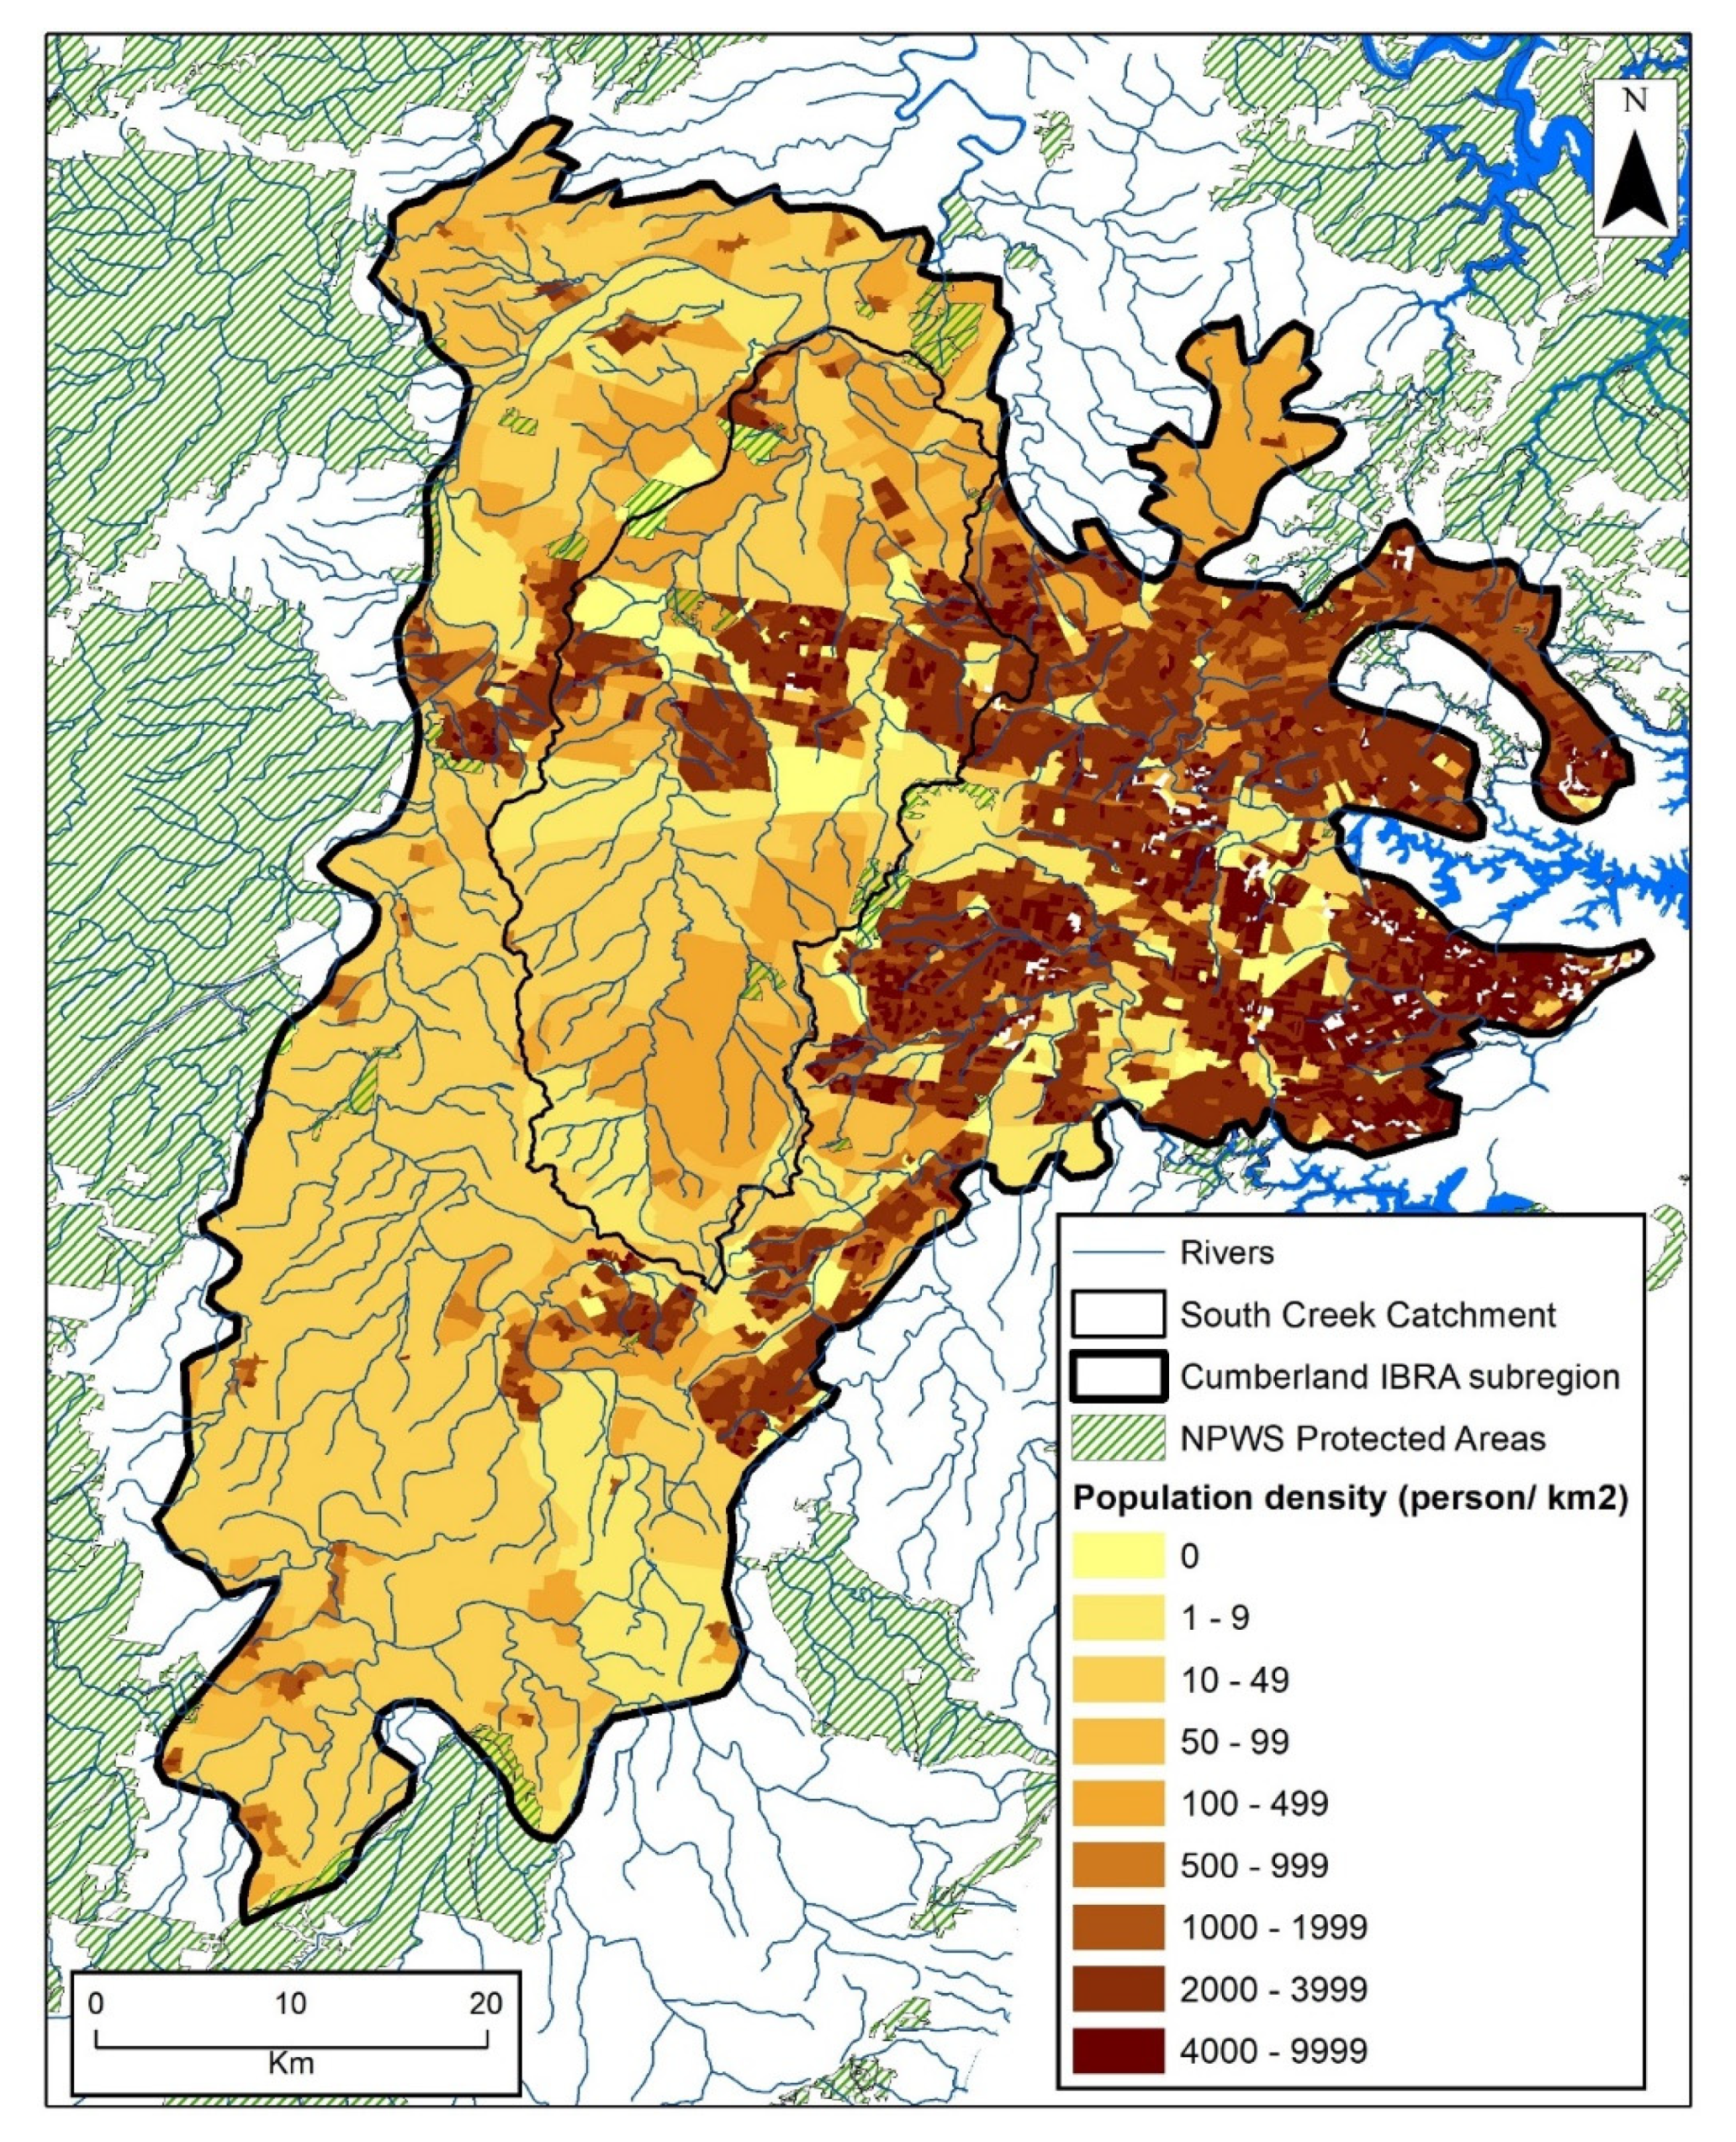
The Western part of Sydney, Australia was chosen as the location for a case study of the effect of urban development on freshwater reptile habitats. The catchment of South Creek in Western Sydney (620 km2, Figure 1) is of special interest because of the current rapid urban development [24]. To represent population densities in this region we used the 2011 census provided by the Australian Bureau of Statistics. The population densities were grouped into blocks of 500 people.
We used ecological niche modelling to map potential suitable habitat for selected species within the Cumberland Interim Biogeographic Regionalisation (IBRA) subregion [25], which contains the entire South Creek catchment (Figure 1). For this exercise, we chose species that had a sufficient number of sightings in the region to support the analysis. These were: eastern water dragon Intellagama lesueurii (GRAY, 1831), eastern water skink Eulamprus quoyii DUMÉRIL & BIBRON, 1839; and eastern snake-necked turtle Chelodina longicollis (SHAW, 1794). We used the Maxent software [26] for ecological niche modelling. Maxent takes a list of species presence locations as input, as well as a set of environmental predictors (e.g., precipitation, temperature) across a user-defined landscape that is divided into grid cells [26]. From this landscape, MaxEnt extracts a sample of background locations that it contrasts against the presence locations [26].
The input species occurrence data were sighting records of greater than 100 m accuracy, extracted from the Bionet Atlas (http://www.bionet.nsw.gov.au/). For the Maxent models the maximum allowed iteration was set at 5000 and the number of replicates as 10. To generate a test dataset, sightings were randomly allocated to a training or test dataset using the default 90:10 split for I. lesueurii and the E. quoyii but a 75:25 split for C. longicollis. A higher proportion of test sites was allocated to C. longicollis because the 10% allocation resulted in only six test sites, which was too small to reliably test the models. The location of up to 10,000 pseudo-absences were chosen from locations containing accurate reptile sightings in the region. Pseudo-absences were chosen at random but weighted by density of points available to account for sampling bias.
Environmental data was drawn from the New South Wales Office of Environment and Heritage datasets used to support mapping of native vegetation across the State [27]. Datasets containing unexplained discontinuities across the region, i.e., artefacts, were not used as predictors. In modelling habitat suitability, it was assumed that microhabitats in the region would change frequently and that the detailed structure of the habitats at locations where species were sighted may be very different before and after the sightings. For this reason, as potential predictors we used environmental variables not greatly affected by human activity within the region. After removing strongly correlated factors (>0.7), additional predictor variables were added through forward selection using the Akaike Information Criterion (AIC) [28]. The habitat suitability maps were based on all occurrence data for the species. To indicate the usefulness of the models for prioritizing areas in terms of their relative importance as habitat we used the area under the Receiver Operating Characteristic Curve (AUC) [29].
3. Results
3.1. Global Patterns in Freshwater Reptiles in Cities
The recent lists of freshwater reptile species have 84 more snakes, 29 more lizards and 12 more turtles (Table 1) compared with the numbers published for FADA [7]. A small number of snake and lizard species on the list obtained from the FADA database was attributed to mangroves or estuaries, thus, we omitted these. The final list (Table S1) includes species with a range of tolerances to saltwater and those with a wide aquatic to terrestrial gradient that may be placed in different categories in relation to their ecological preferences along both gradients. The FADA database contained such a classification only for freshwater snakes which were split into two distinct categories: semi-aquatic and aquatic. Hence, for some analyses here, we have split the snake species into these two categories.
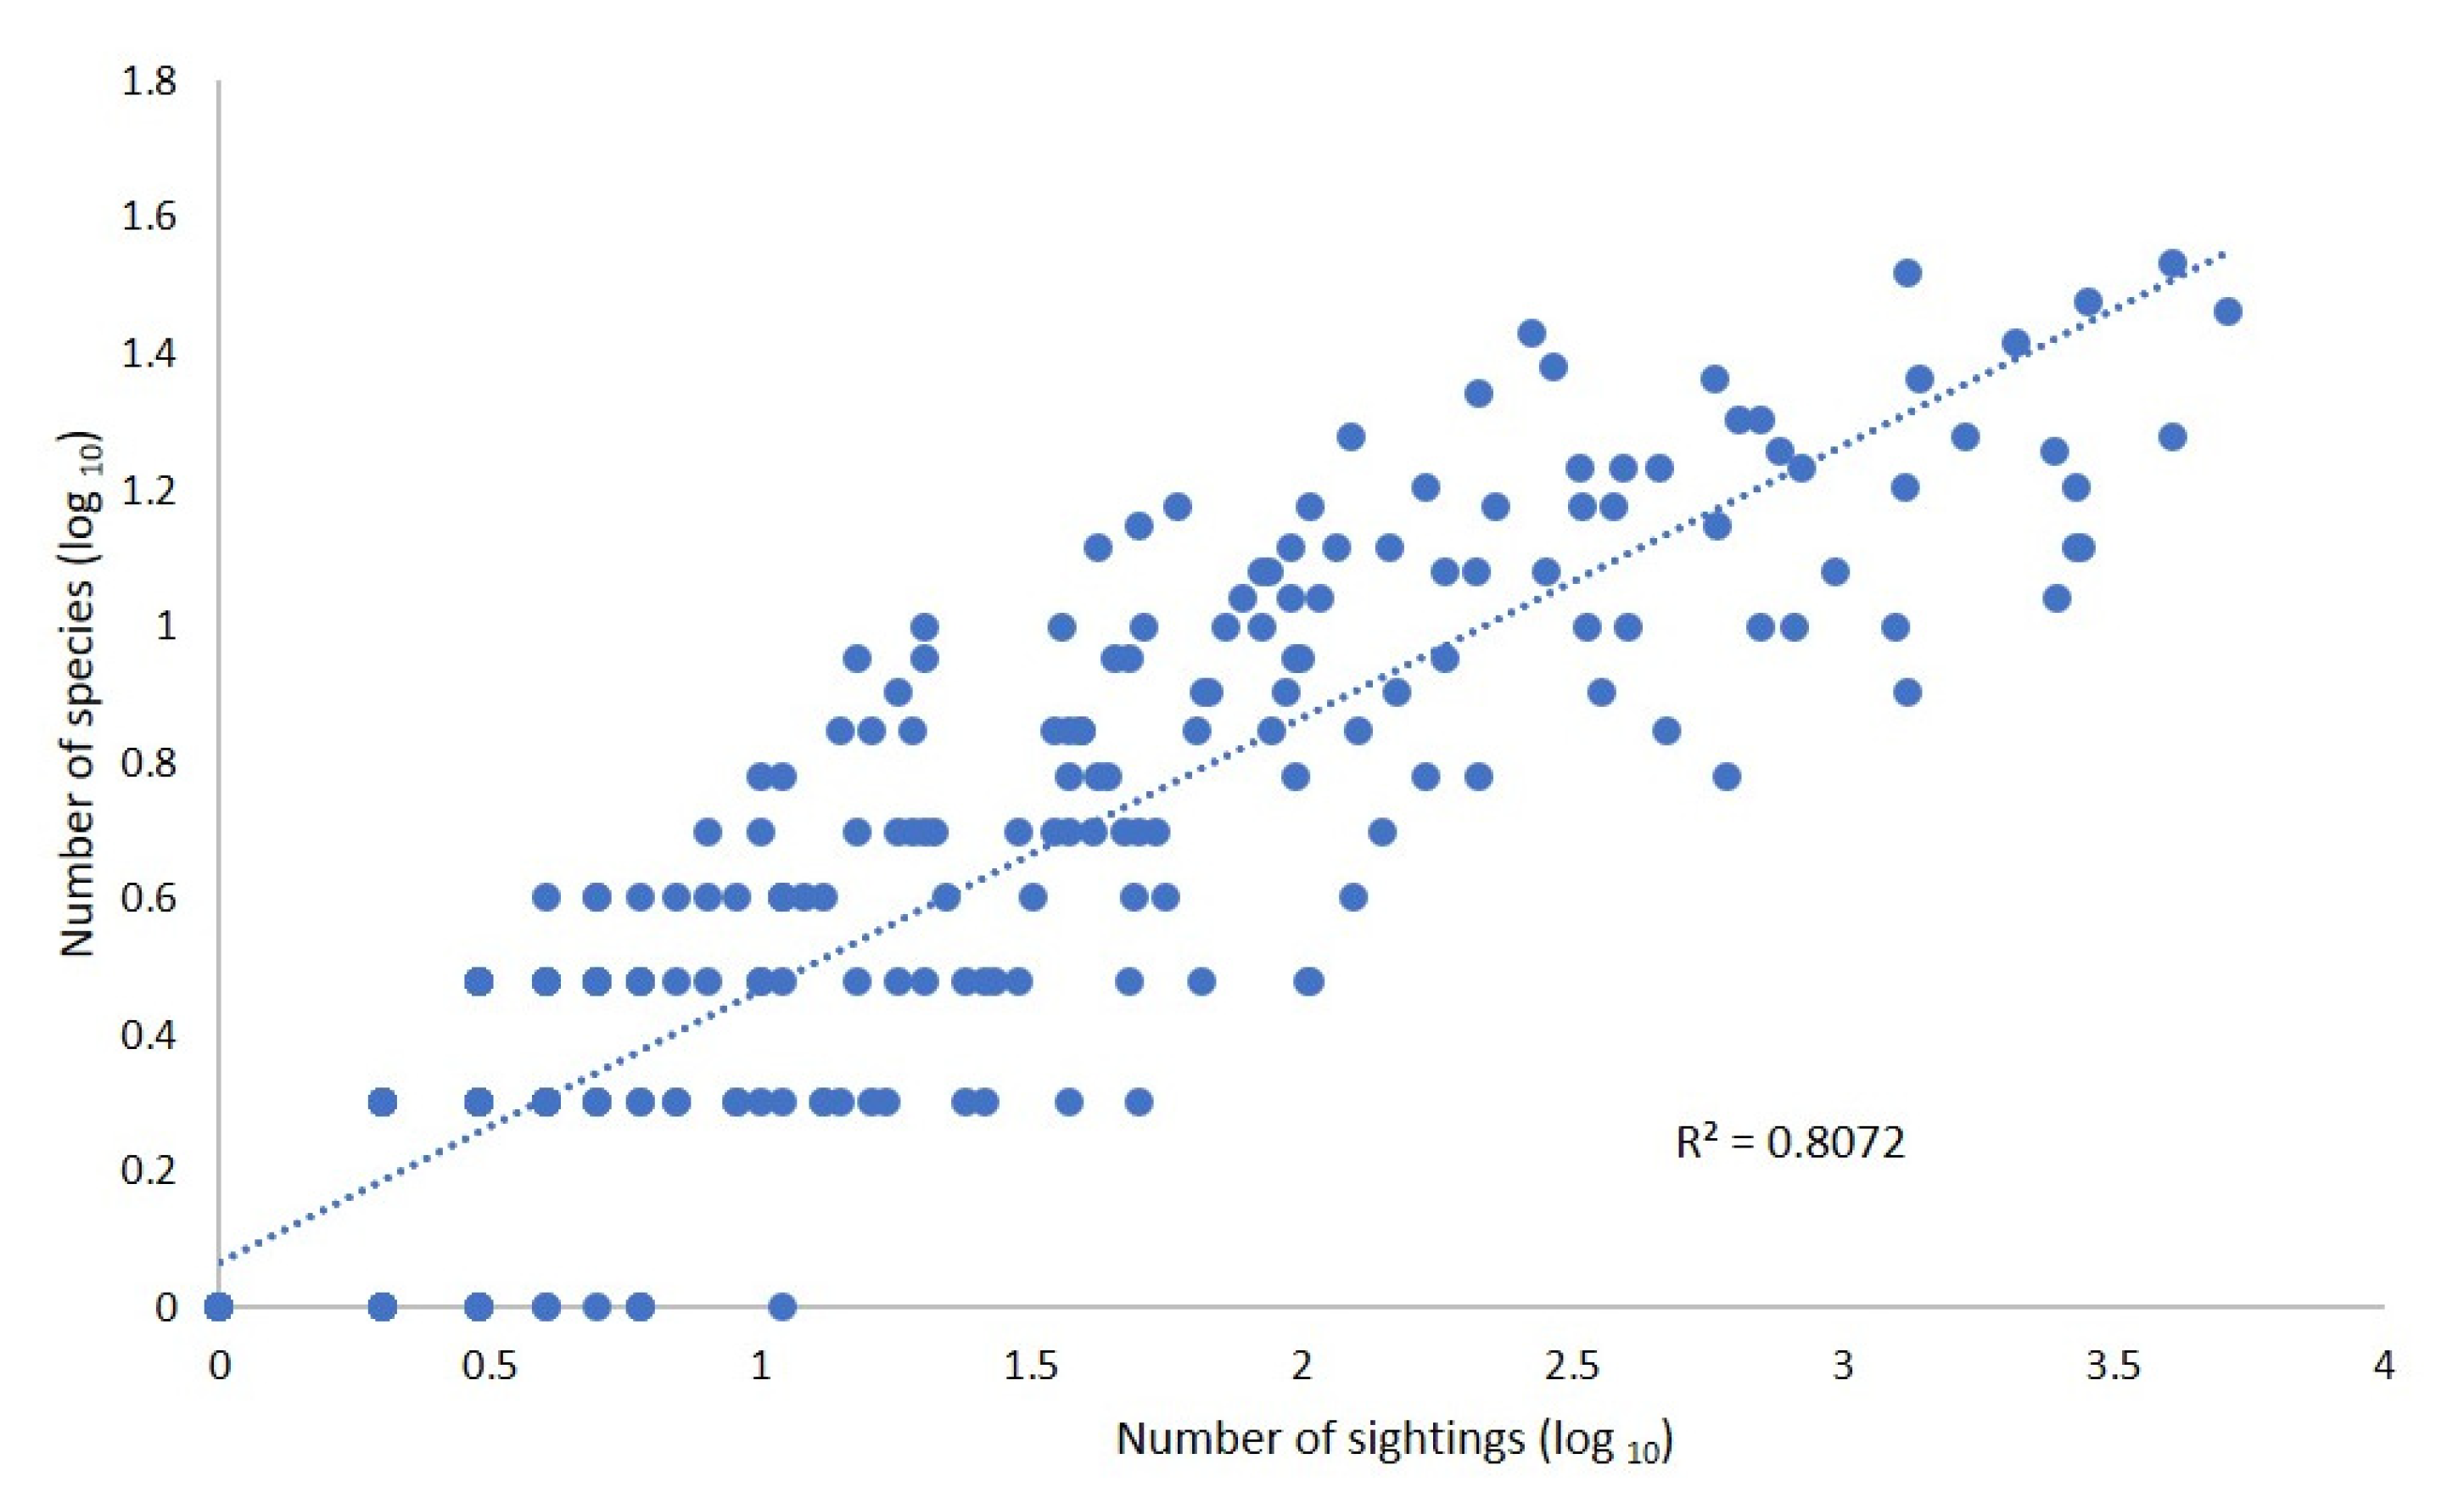
Based on the list given in Table S1, 57,452 sightings of freshwater reptiles were recorded in GBIF between from January 2013 until April 2018 (Table 1). Freshwater reptile sightings were made at 265 of the 426 regions of the Freshwater Ecoregions of the World (FEOW) included in this analysis (Table S3). The number of sightings recorded varied greatly among FEOW regions (Table S3). The FEOW regions that had the 10 highest number of sightings were in Eastern USA, Central and Western Europe and Eastern Australia. The number of sightings exceeded 2000 at each of these 10 regions. In contrast, five or fewer sightings were recorded from each of 100 FEOW regions that had the lowest number of sightings. There was a strong relationship between the number of sightings in a region and the number of species observed there (Figure 2).
Freshwater reptiles were recorded from within 1327 of the world’s 3525 cities with a population exceeding 100,000 as of 2 May 2018 (Table S2). At 311 of these cities five or more reptile species were recorded in this period. The four major reptile groups differ greatly in the percentage of species sighted in cities between 2013 and 2018 globally (Figure 3, Figure 4, Figure 5 and Figure 6).
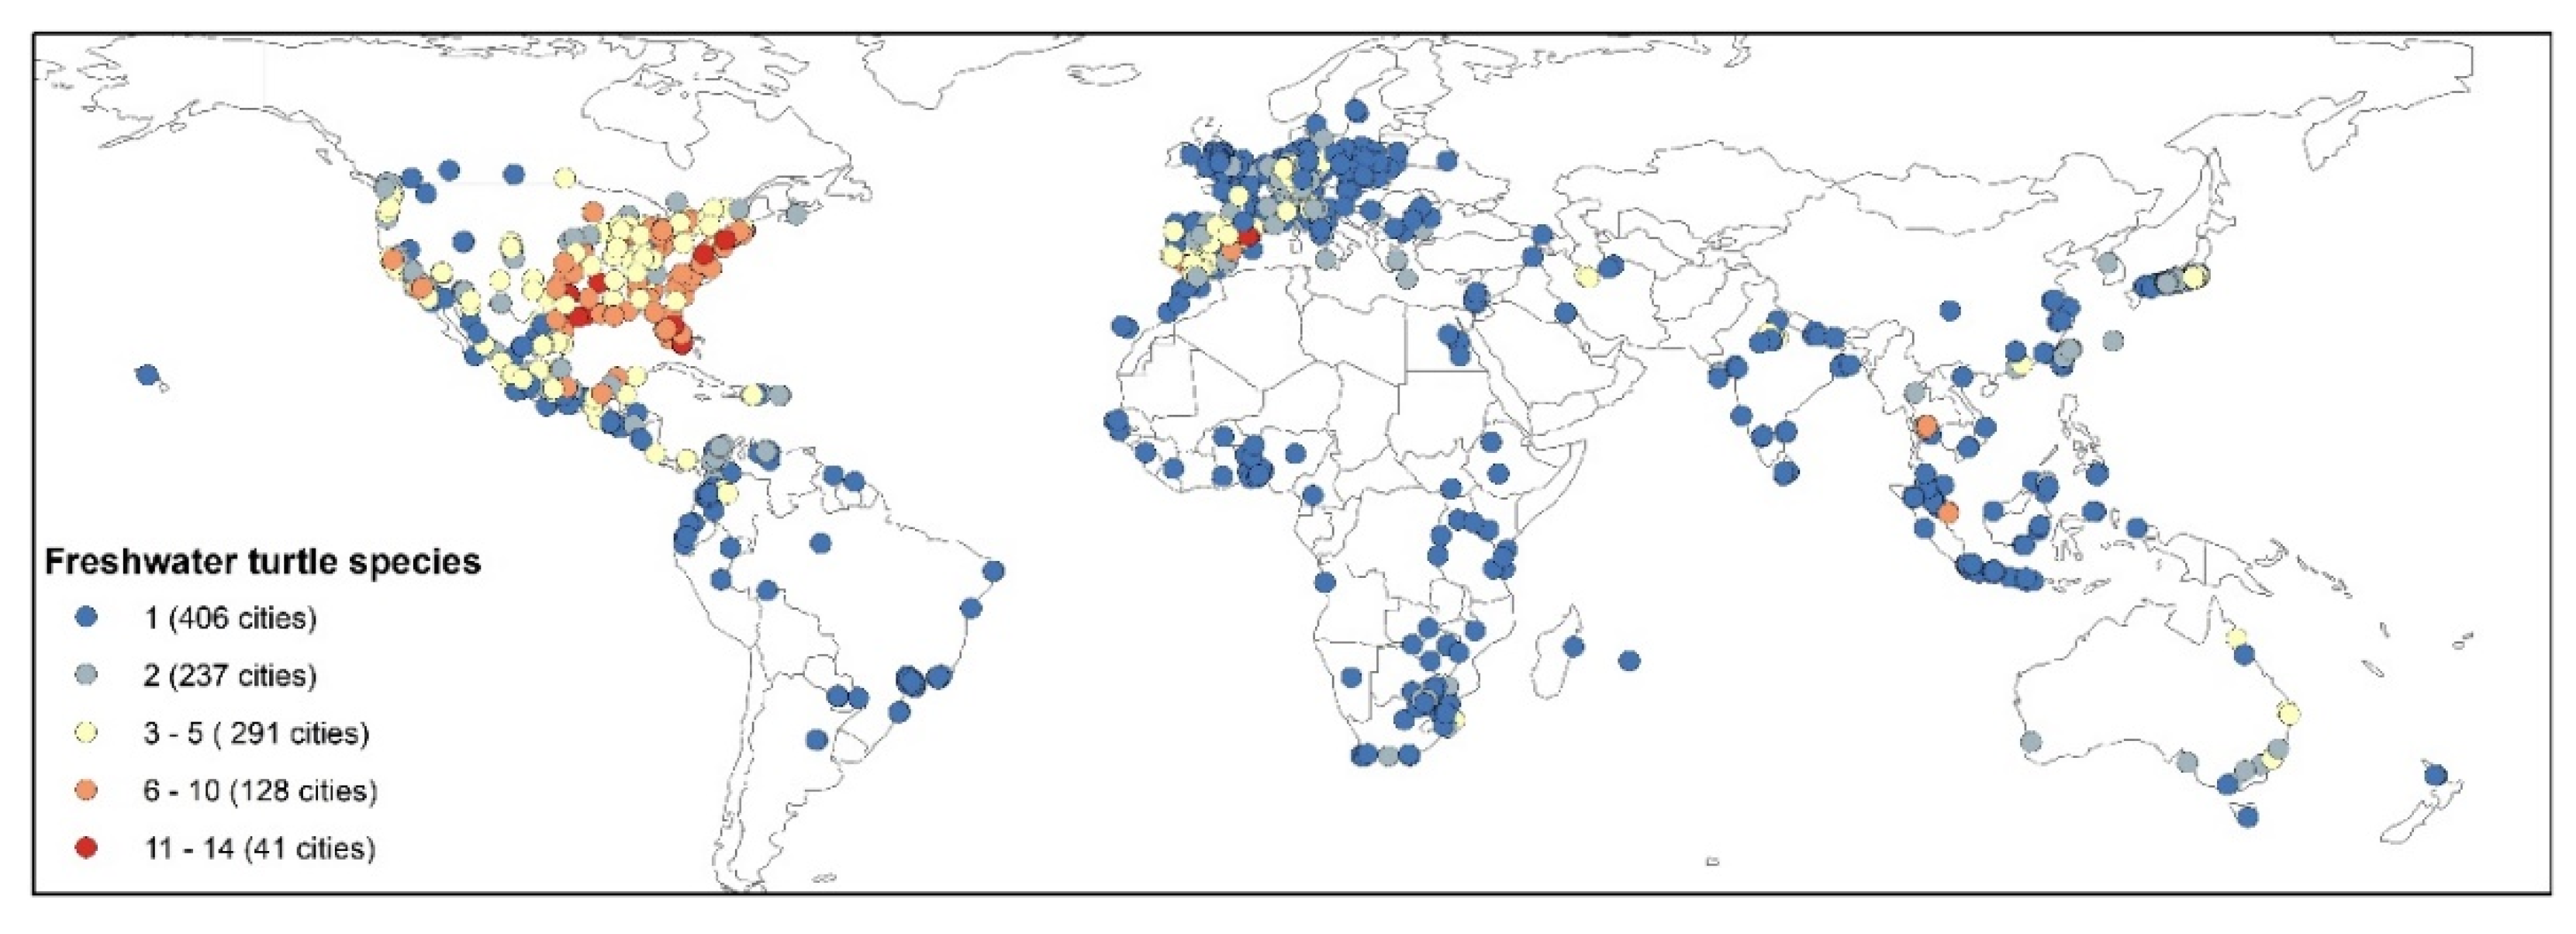
Turtles were the most sighted group (Table 1), but almost a third (29.4%) of the turtle sightings was the Pond Slider Trachemys scripta (THUNBERG in SCHOEPFF, 1792), which is considered an invasive species in most of its current range. This range includes parts of 98 FEOW regions, which is much greater than for any other freshwater reptile species. The species which was recorded from the second largest number of FEOW regions was the Common Snapping Turtle Chelydra serpentina (LINNAEUS, 1758) (37 regions) followed by the Nile Monitor Varanus niloticus (LINNAEUS, 1766) (36 regions). Turtle sightings were made within 50 km of most city centers in North and Central America, Western Europe, Australia and Southern Africa (Figure 3, Table S2). Turtles were also sighted in many cities throughout Africa, the Indian Subcontinent, the northern parts of South America and South-East Asia. Cities with sightings of very high numbers of turtle species included Barcelona, Singapore, Bangkok and many cities in eastern and South-eastern United States (Figure 3, Table S2).
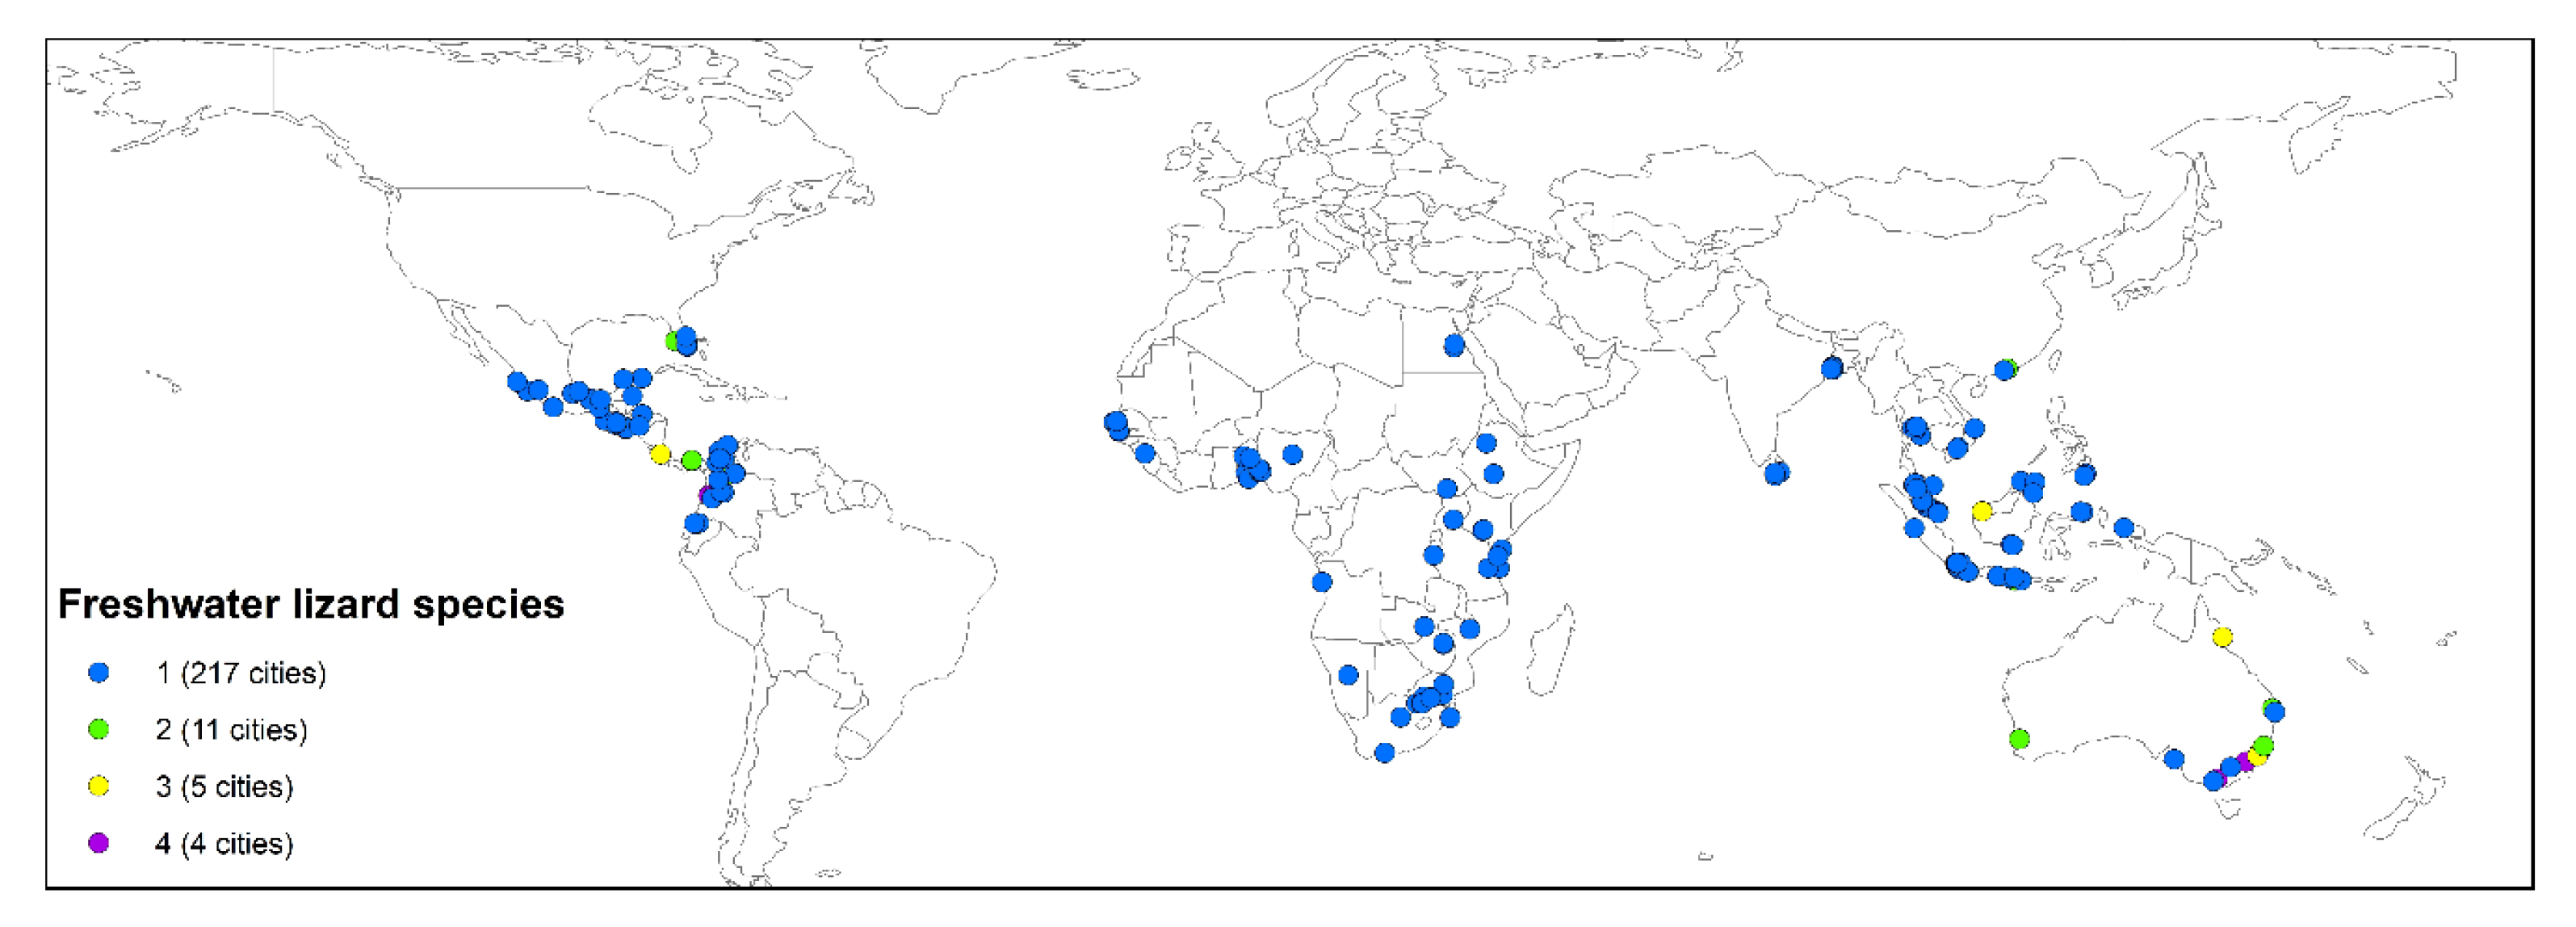
Cities of South-Eastern Australia and Western Colombia had the greatest number of freshwater lizard species, and sightings were made in many cities in Southern temperate zones in Africa and Australia (Figure 4). In contrast, very few freshwater lizard sightings were made north of the Tropic of Cancer.
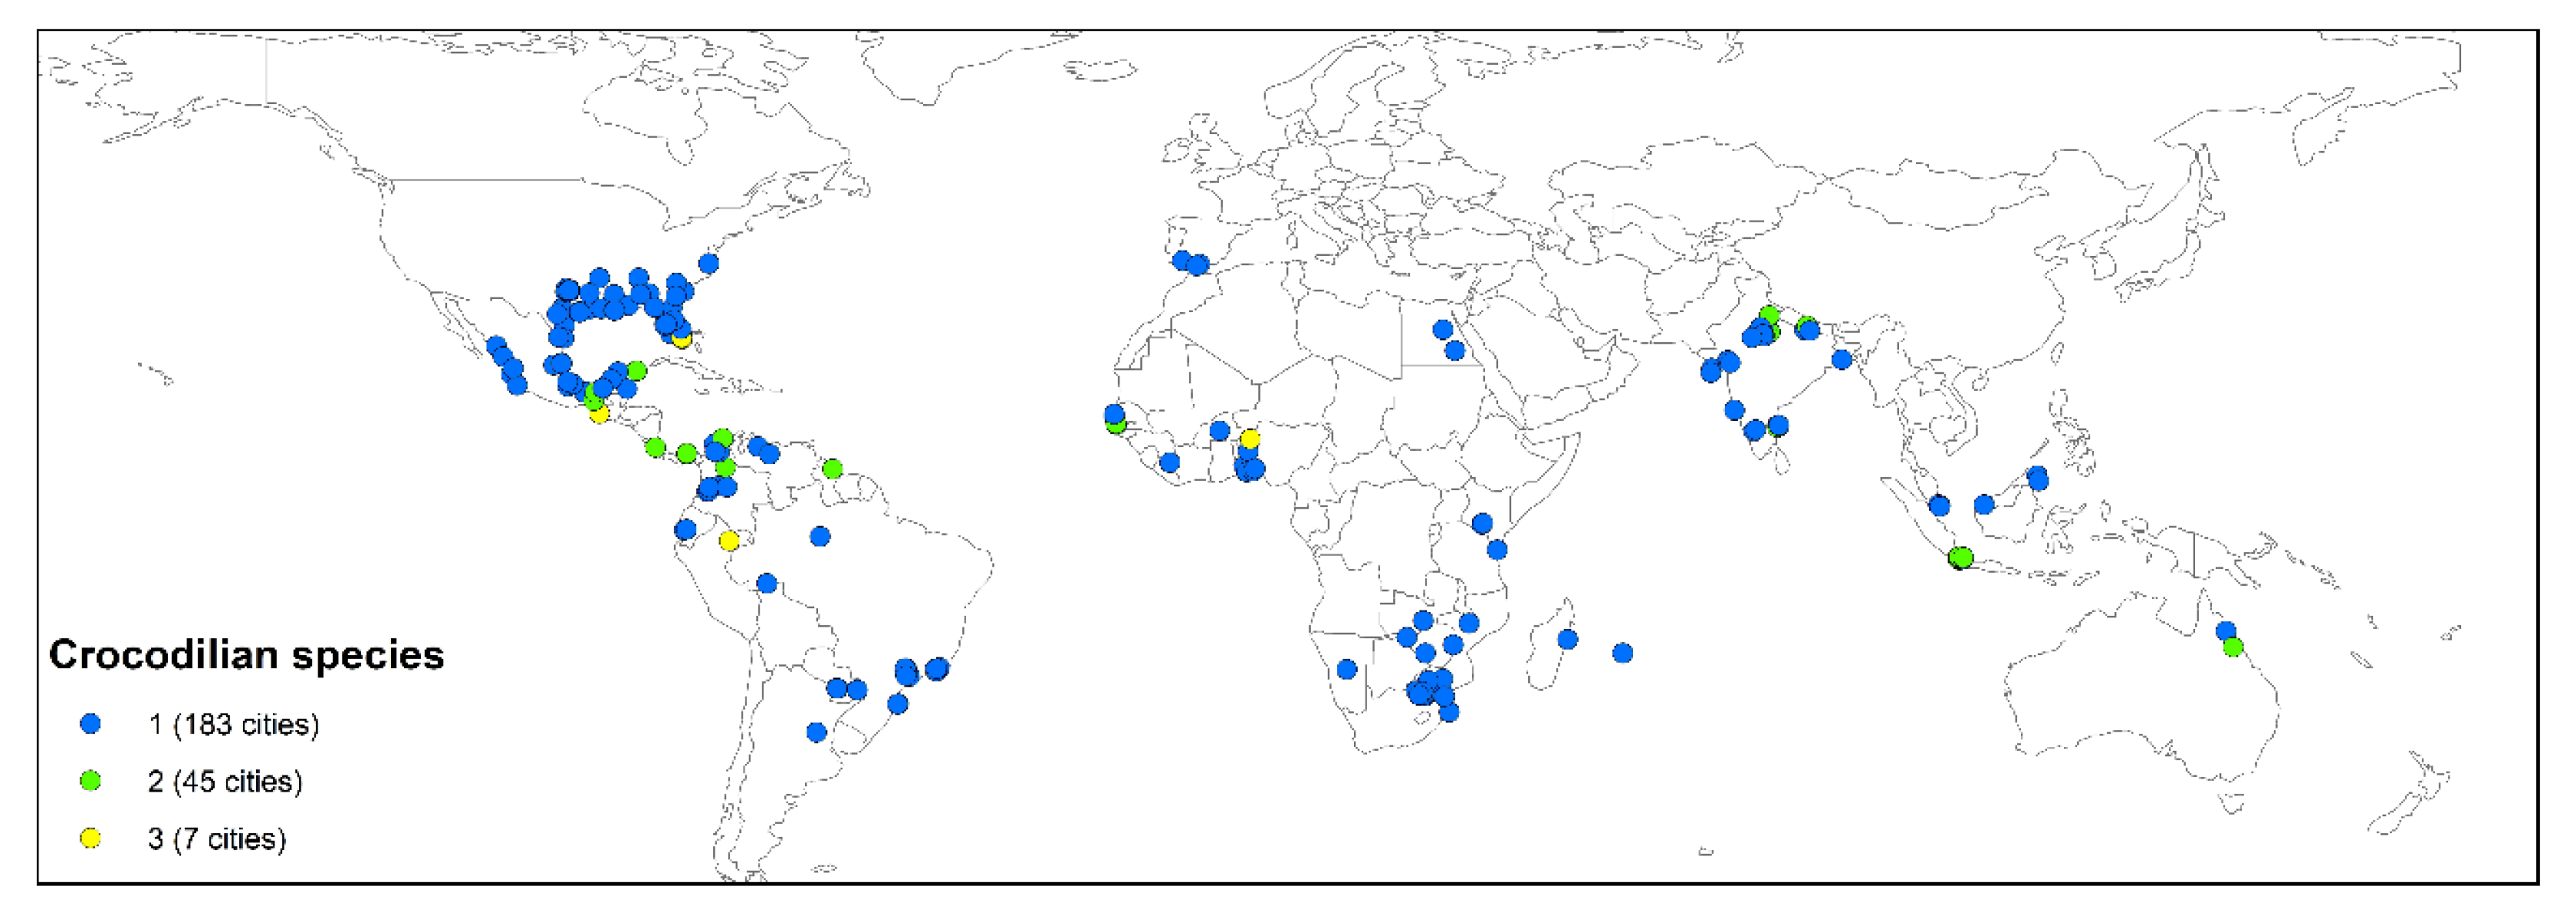
All except for three species of crocodilians were sighted by human observers in the five-year period (Figure 5).
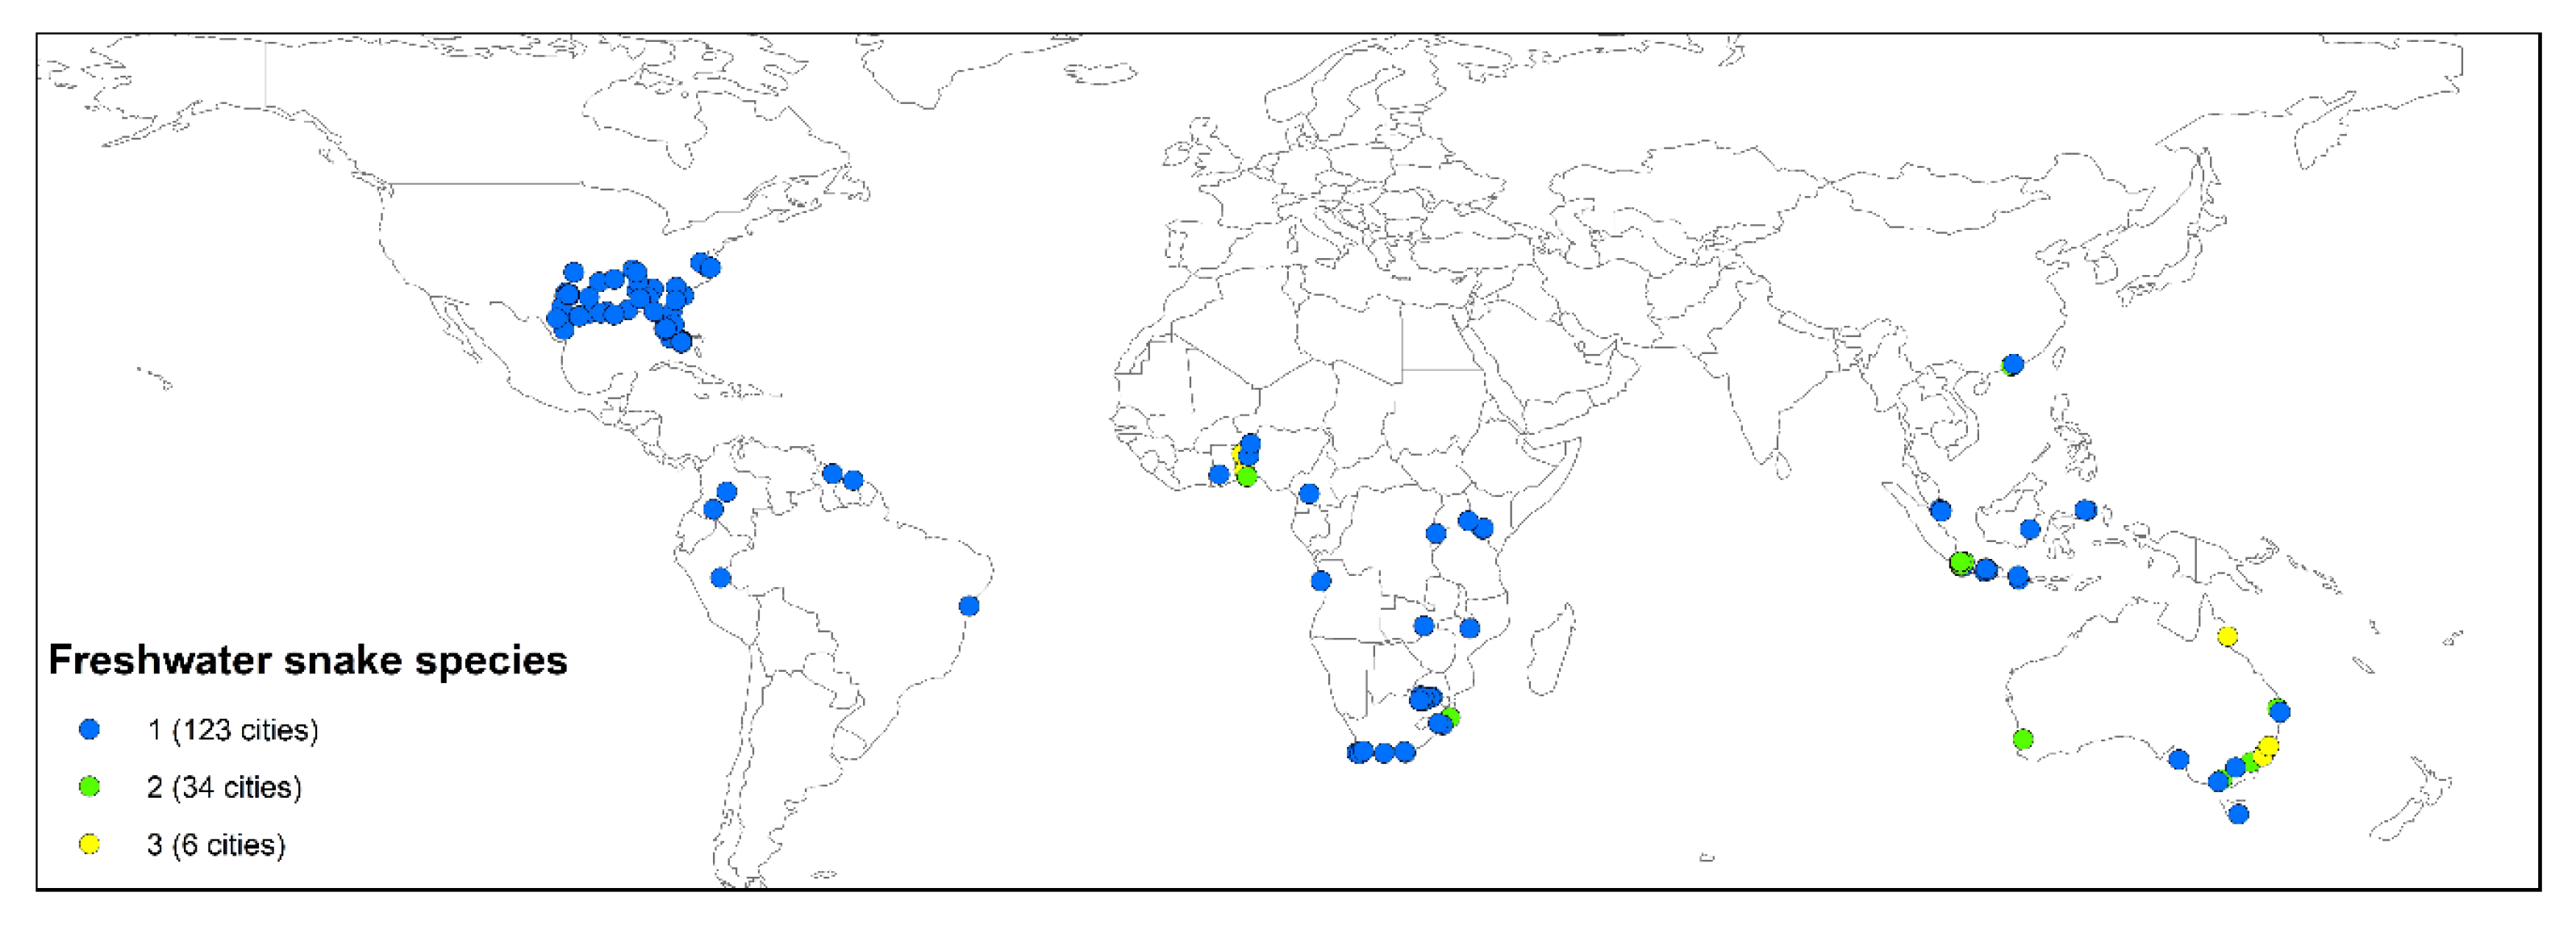
With the exception of sightings made in Eastern USA, freshwater snake sightings in cities were largely confined to the tropics and the southern hemisphere (Figure 6).
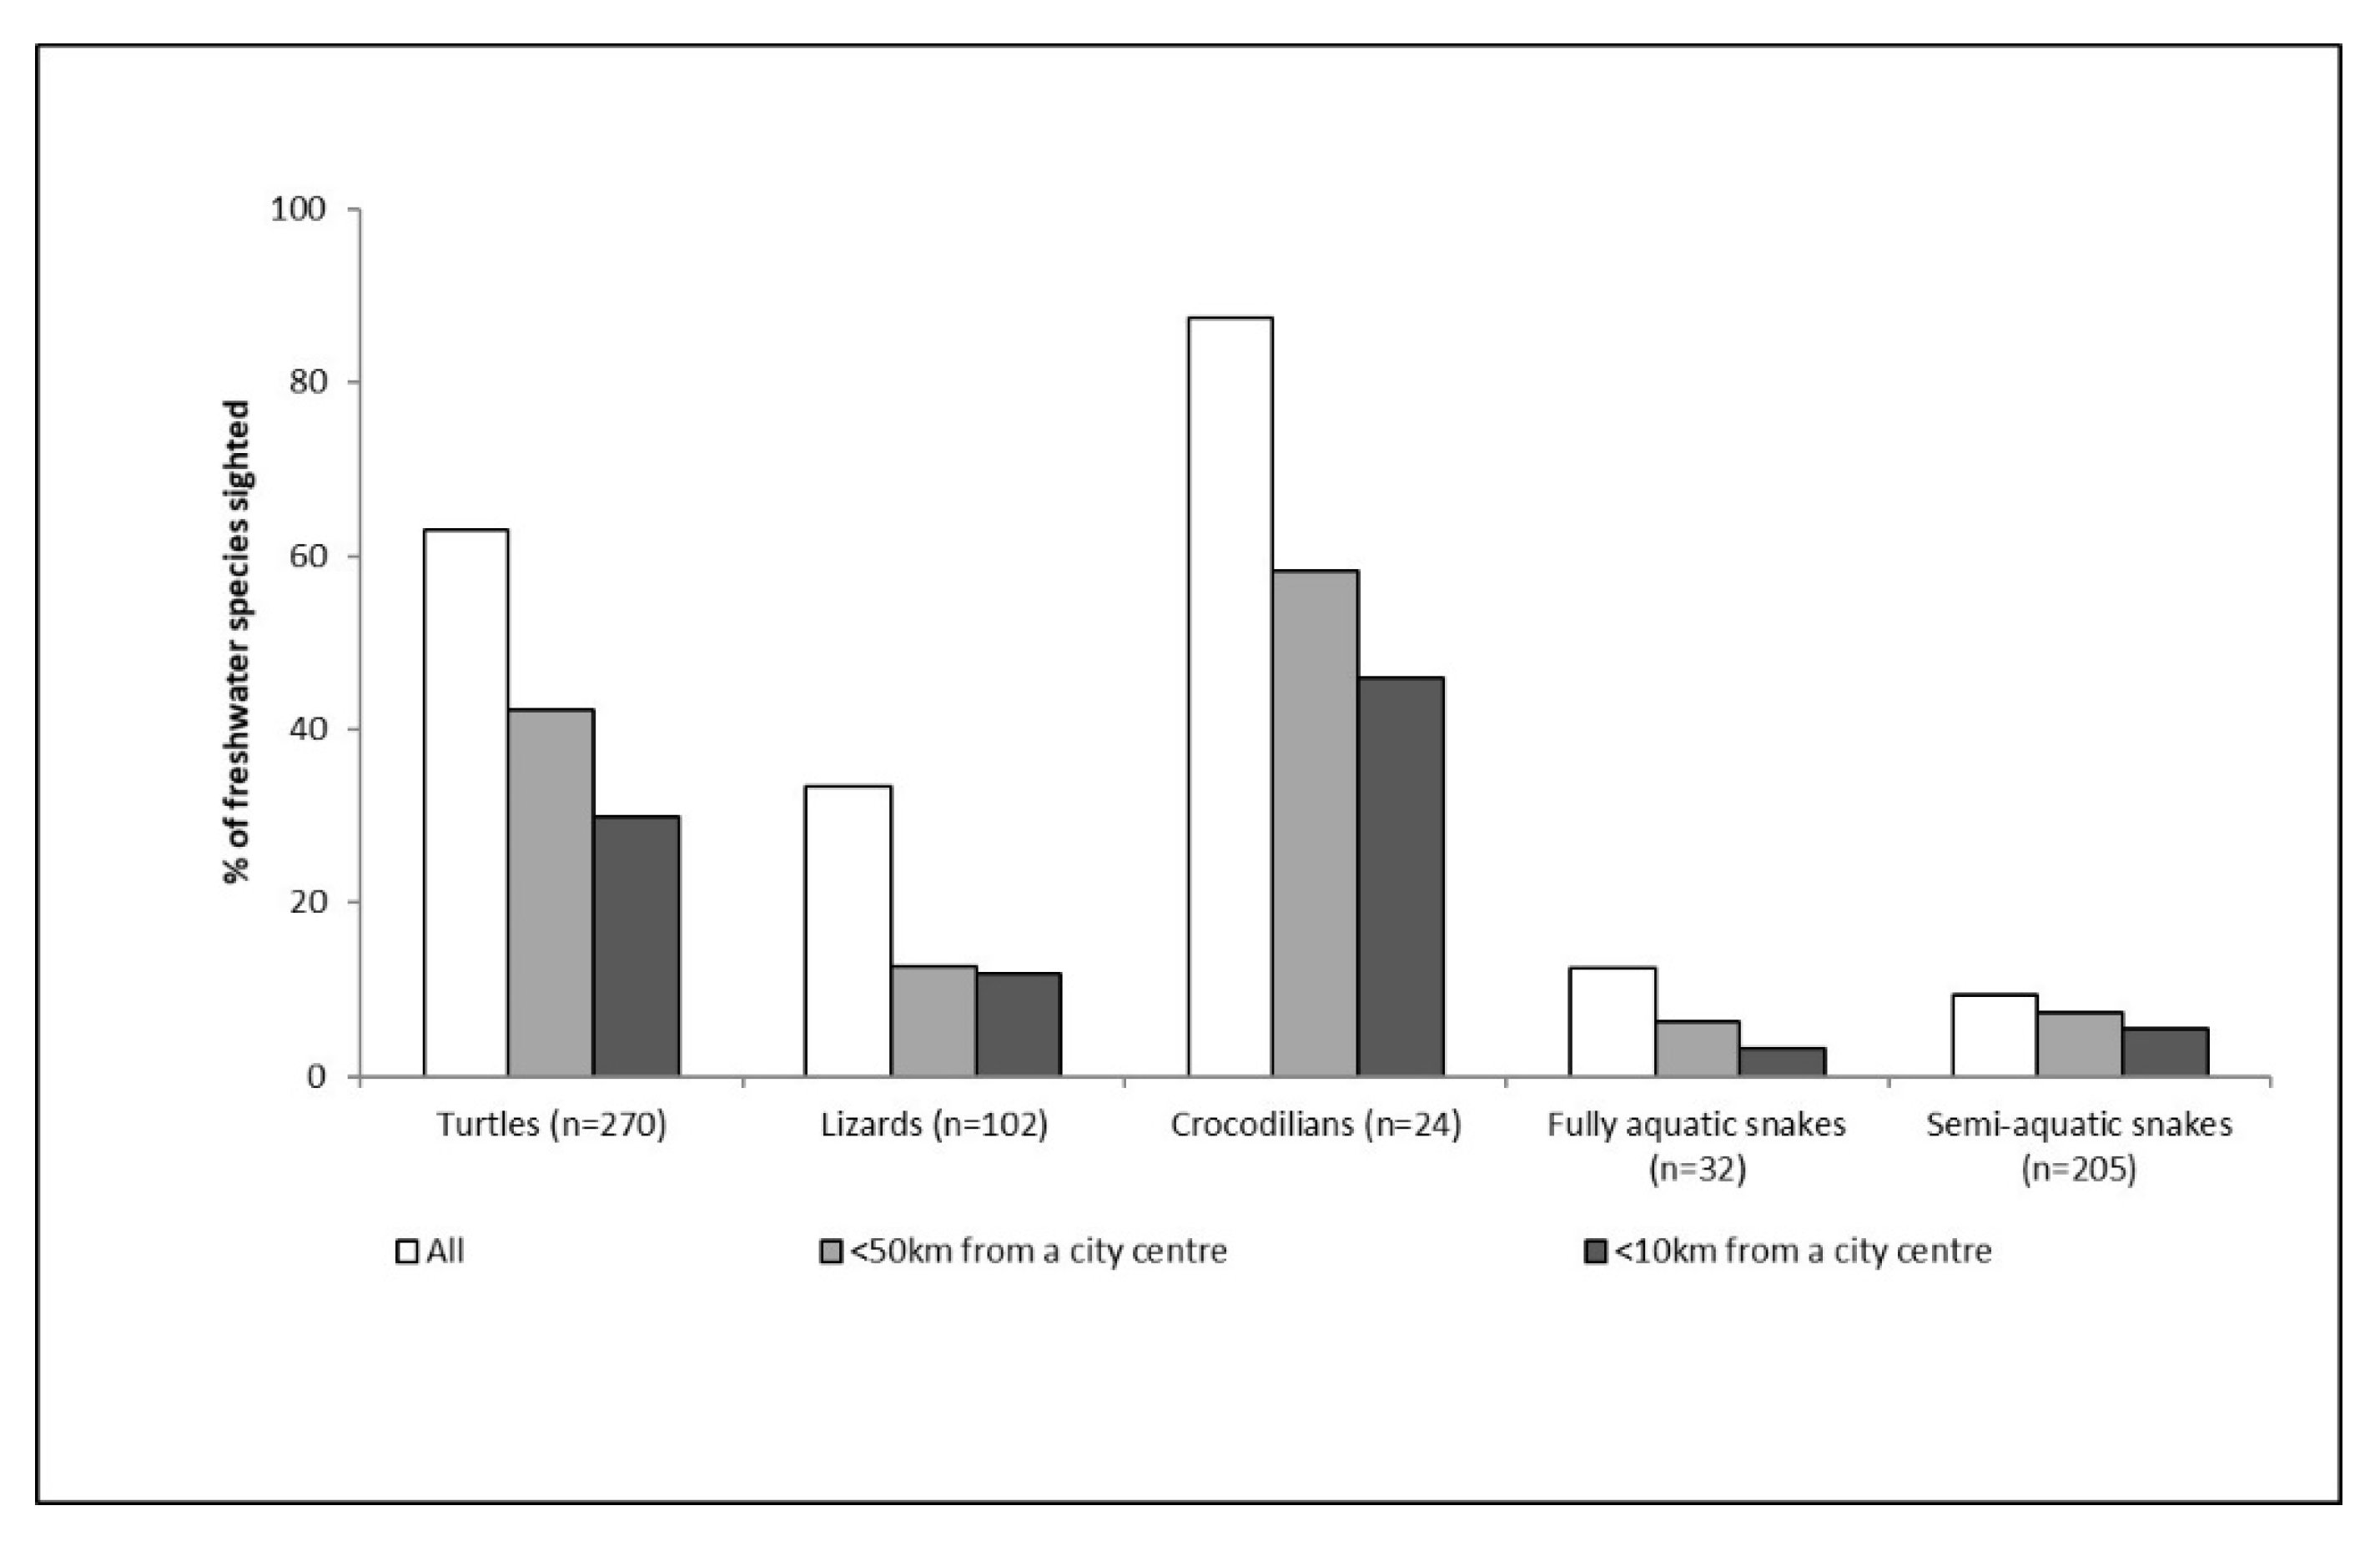
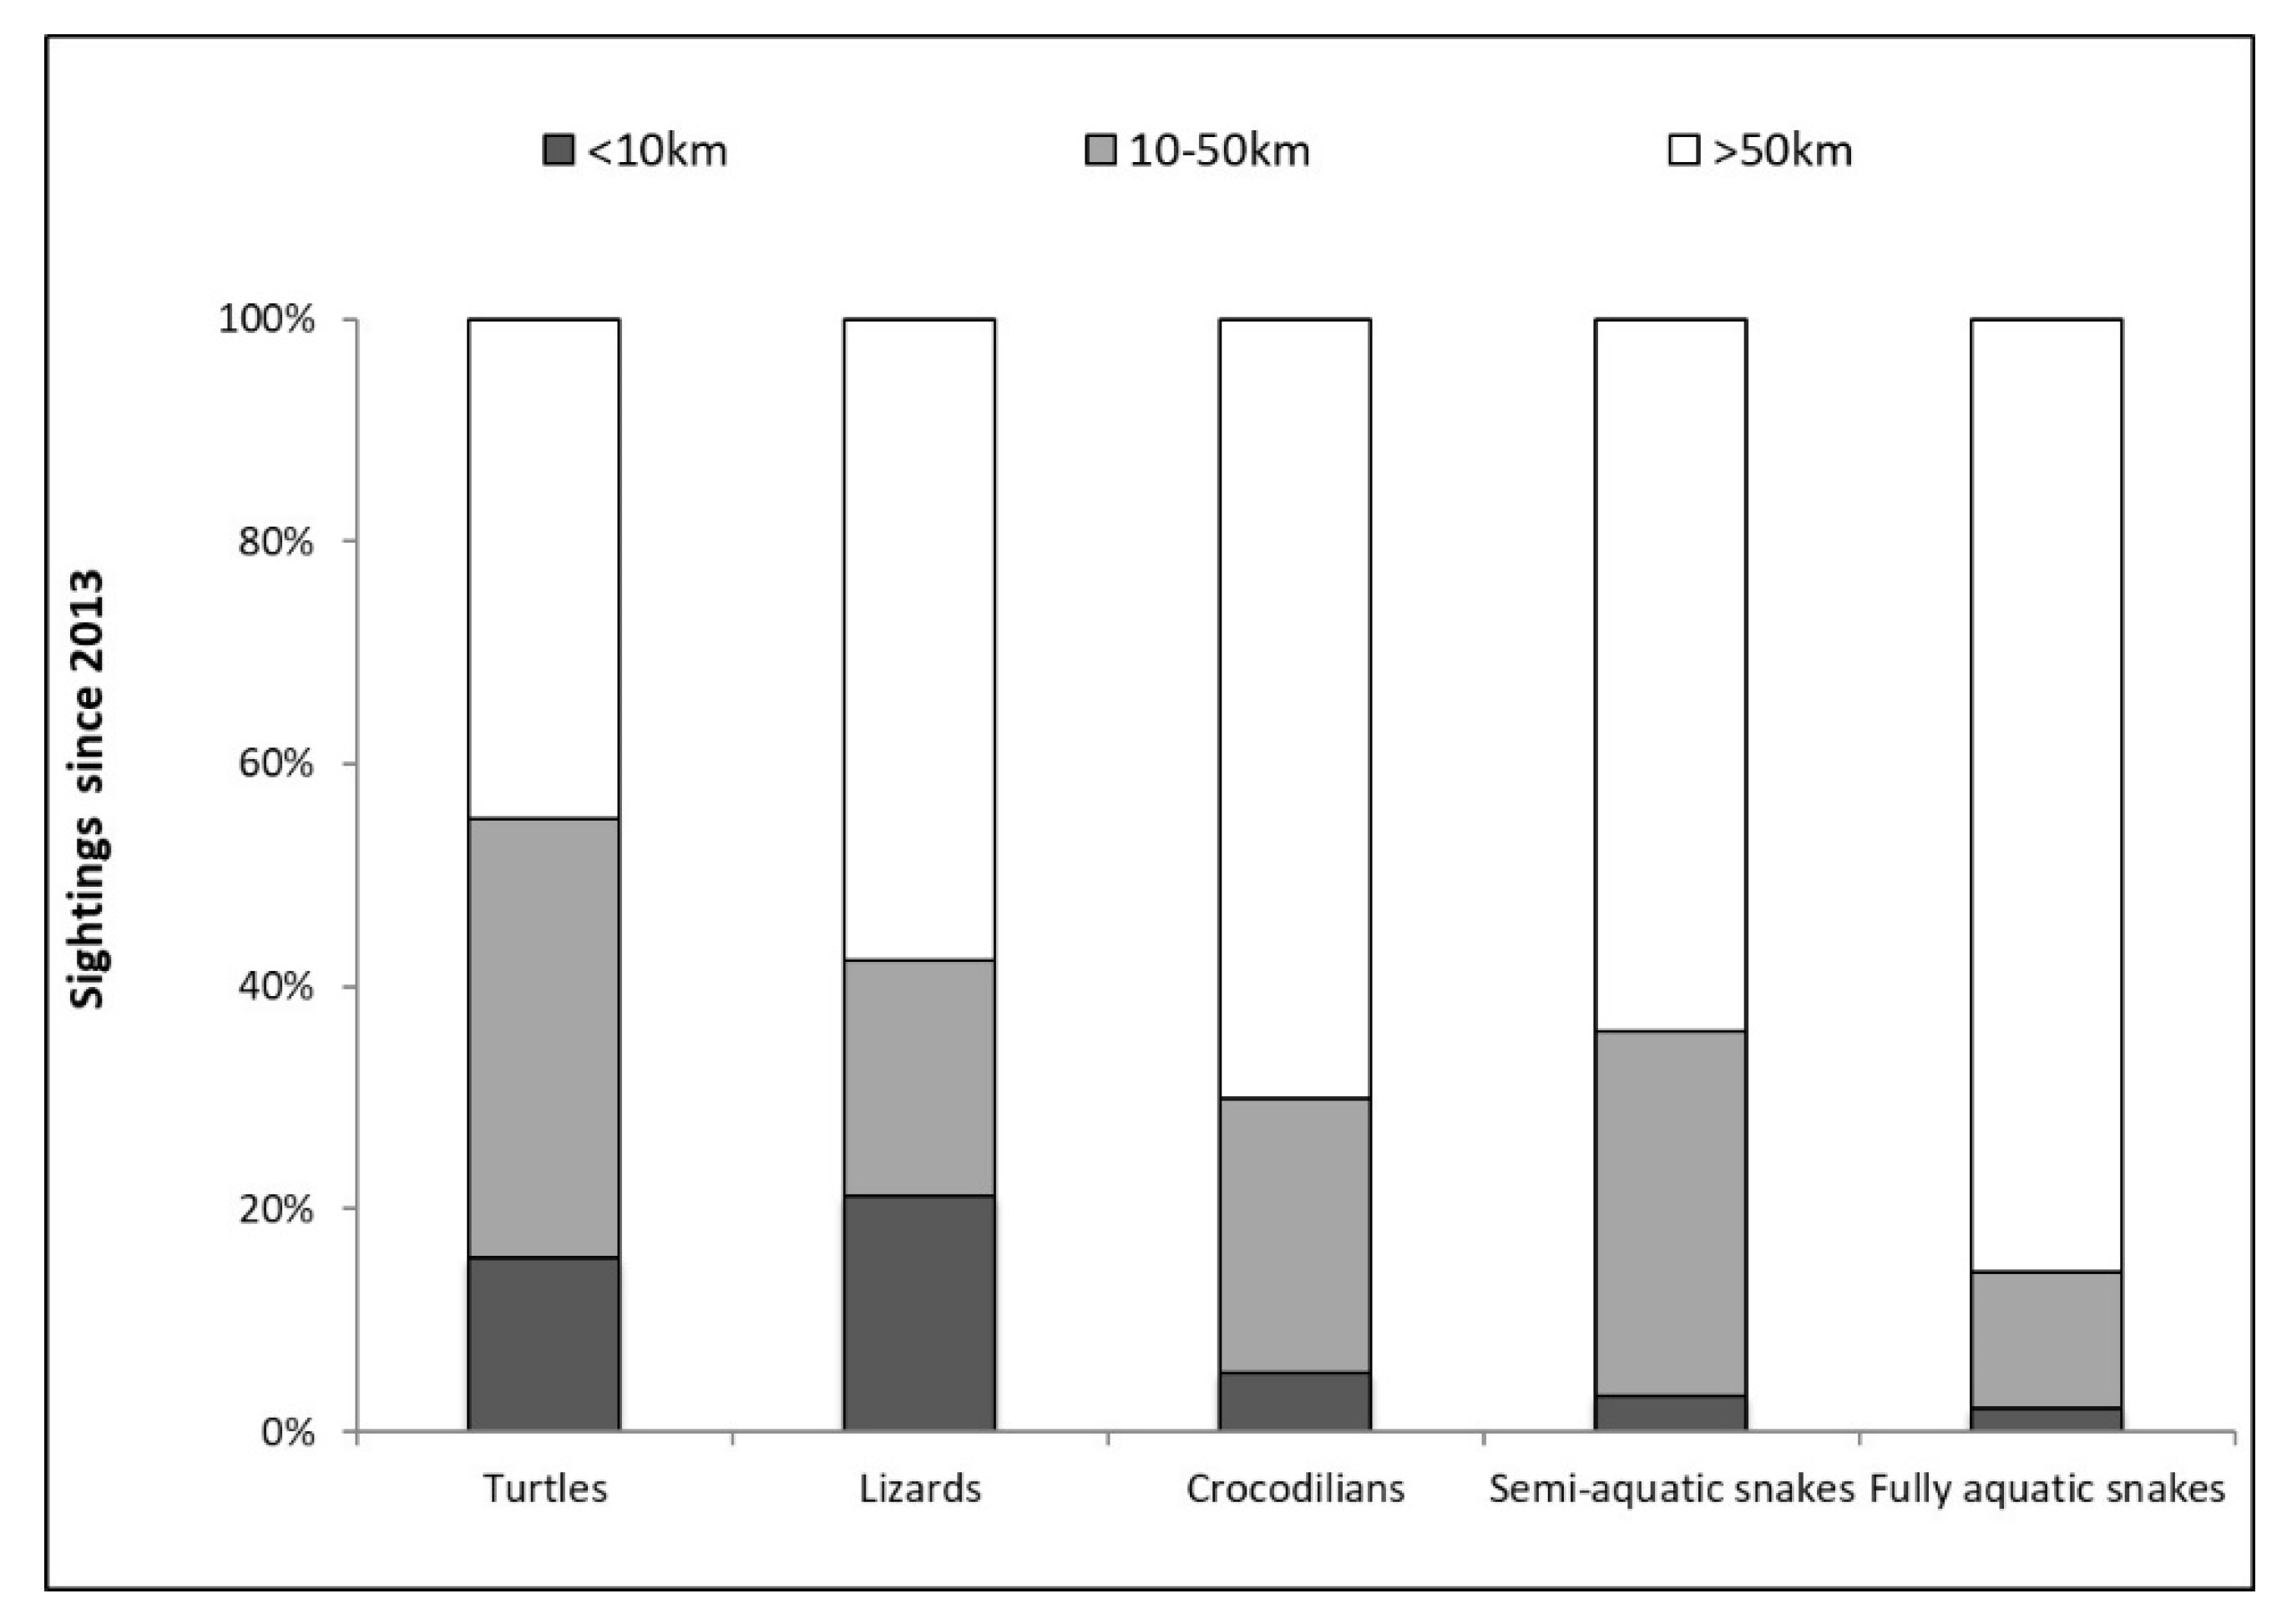
The four major reptile groups differed the percentage of known freshwater species sighted in the five-year period (Figure 7), the proportion of species sighted within 10 km and between 10 and 50 km to the city center (Figure 7) and the percentage of sightings made within 10 km and between 10 and 50 km of a city center (Figure 8). A majority of known crocodilians and freshwater turtle species was sighted within this 5-year period in contrast to about one in three freshwater lizard species and one in ten freshwater snake species (Figure 8). Only a subset of the freshwater species observed within 50 km of a city center were observed within 10 km distance to the city center for all reptile groups but this difference was very small for lizards (Figure 8). Over 2/3 of crocodilian species sighted were seen within 10 km of a city center. Among the four groups, turtles had the greatest percentage of sightings in cities, having more sightings within 50 km of a city center compared with sightings elsewhere but about 2/3 of these sightings were at greater than 10 km distance to a city center (Figure 8). The other groups were not very different in the % of sightings made within 50 km of a city center (Figure 8). However, for crocodilians and snakes, only a very small proportion of these observations were made within 10 km of the city center (Figure 8).
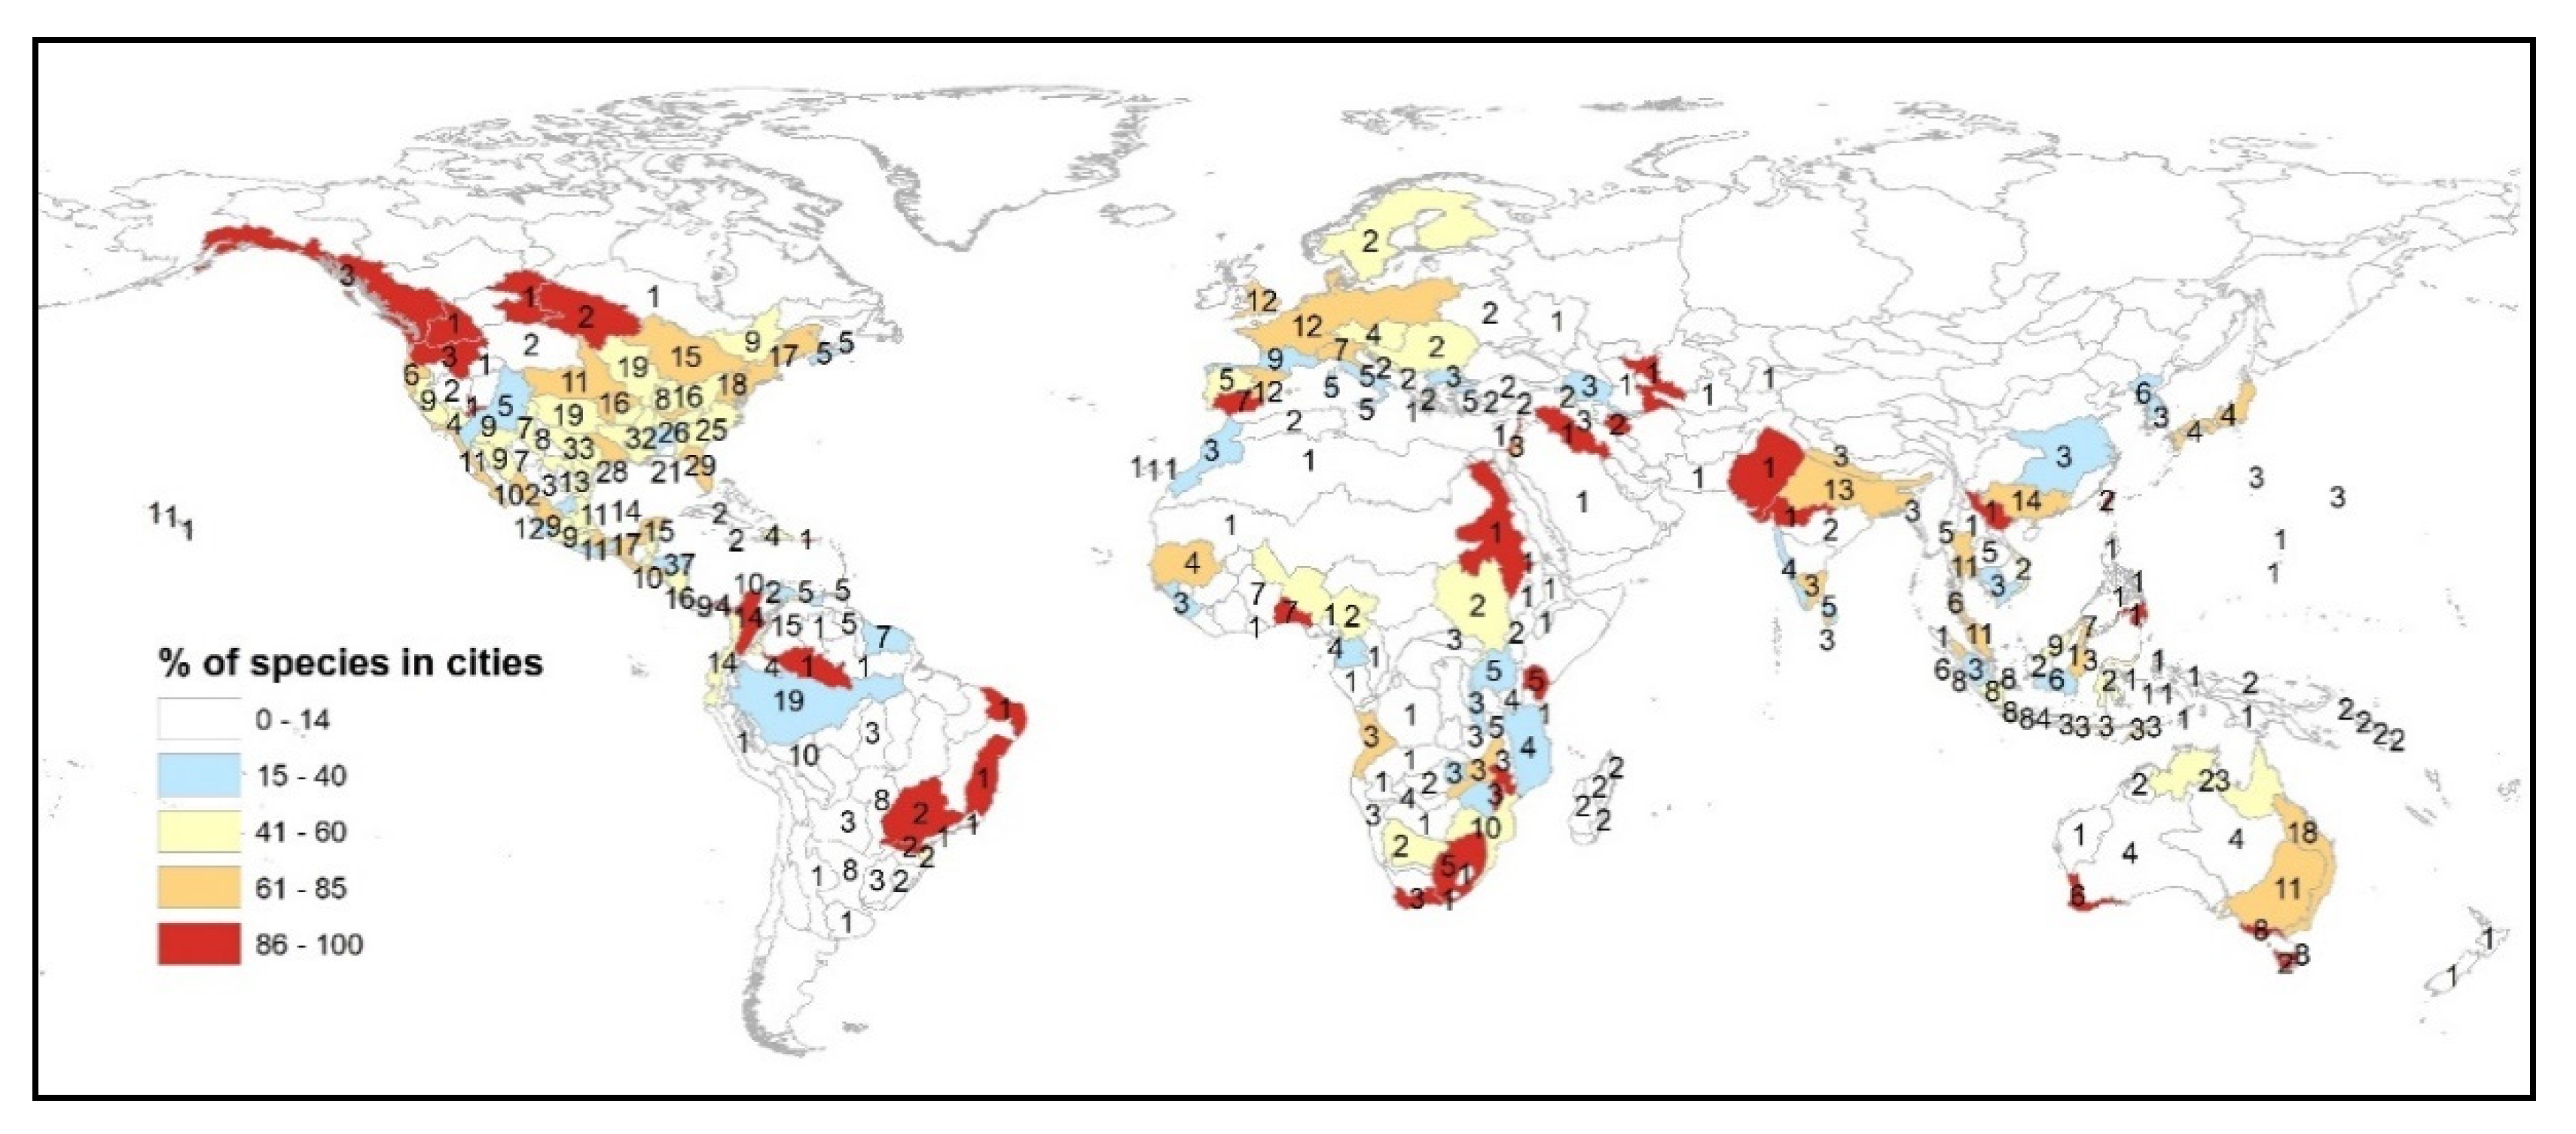
Many of the regions in which a very high percentage of freshwater reptile species were observed in cities only had one or two species recorded from the whole region (Figure 2, Table S3). The total number of sightings recorded from these regions were also mostly very low. There were some regions that had very high representation of the fauna in cities as well as high observed richness (Figure 9, Table S3). One of these was Magdalena-Sinu FEOW region in Colombia, where 228 sightings were made and 15 freshwater reptile species were recorded, 13 of which were observed in one or more of the 34 cities. Representation of freshwater species was also high in the Central Western Europe FEOW region where 2754 sightings were made and 13 freshwater reptile species were recorded and 11 of these were observed in one or more of the 250 cities. In contracts in the Amazonas Lowlands regions of comparable size the Central Wester Europe only 123 sightings were made of 19 species, six of which were observed in one or more of just four cities of the region.
3.2. Ecological Niche Models for Three Freshwater Reptile Species in Sydney
For all three species the variation in the AUC among replicates was small and there was very little difference in AUC between training and test locations (Table 2). The lower AUC for E. quoyii compared I. lesueurii and C. longicollis (Table 2) indicated that the predictions for E. quoyii might be less useful than those for the other two species. Only 10 of the 63 environmental grids used as input variables were selected as predictors. Distance from stream and topographic position were selected as predictors for all three species but the other variables differed between species (Table 3). I. lesueurii differed from the other two species in having substrate variables (clay and sand content) as predictors and E. quoyii differed from the other two species in having climate variables (temperature and rainfall) as predictors.
The predicted habitat suitability for I. lesueurii declined sharply with distance from the drainage line in lower (northern) parts of the region (Figure 10). River reaches with continuous highly suitable habitats for I. lesueurii were outside of the South Creek catchment to the west along the Hawkesbury River bordering large protected areas (Figure 1 and Figure 10).
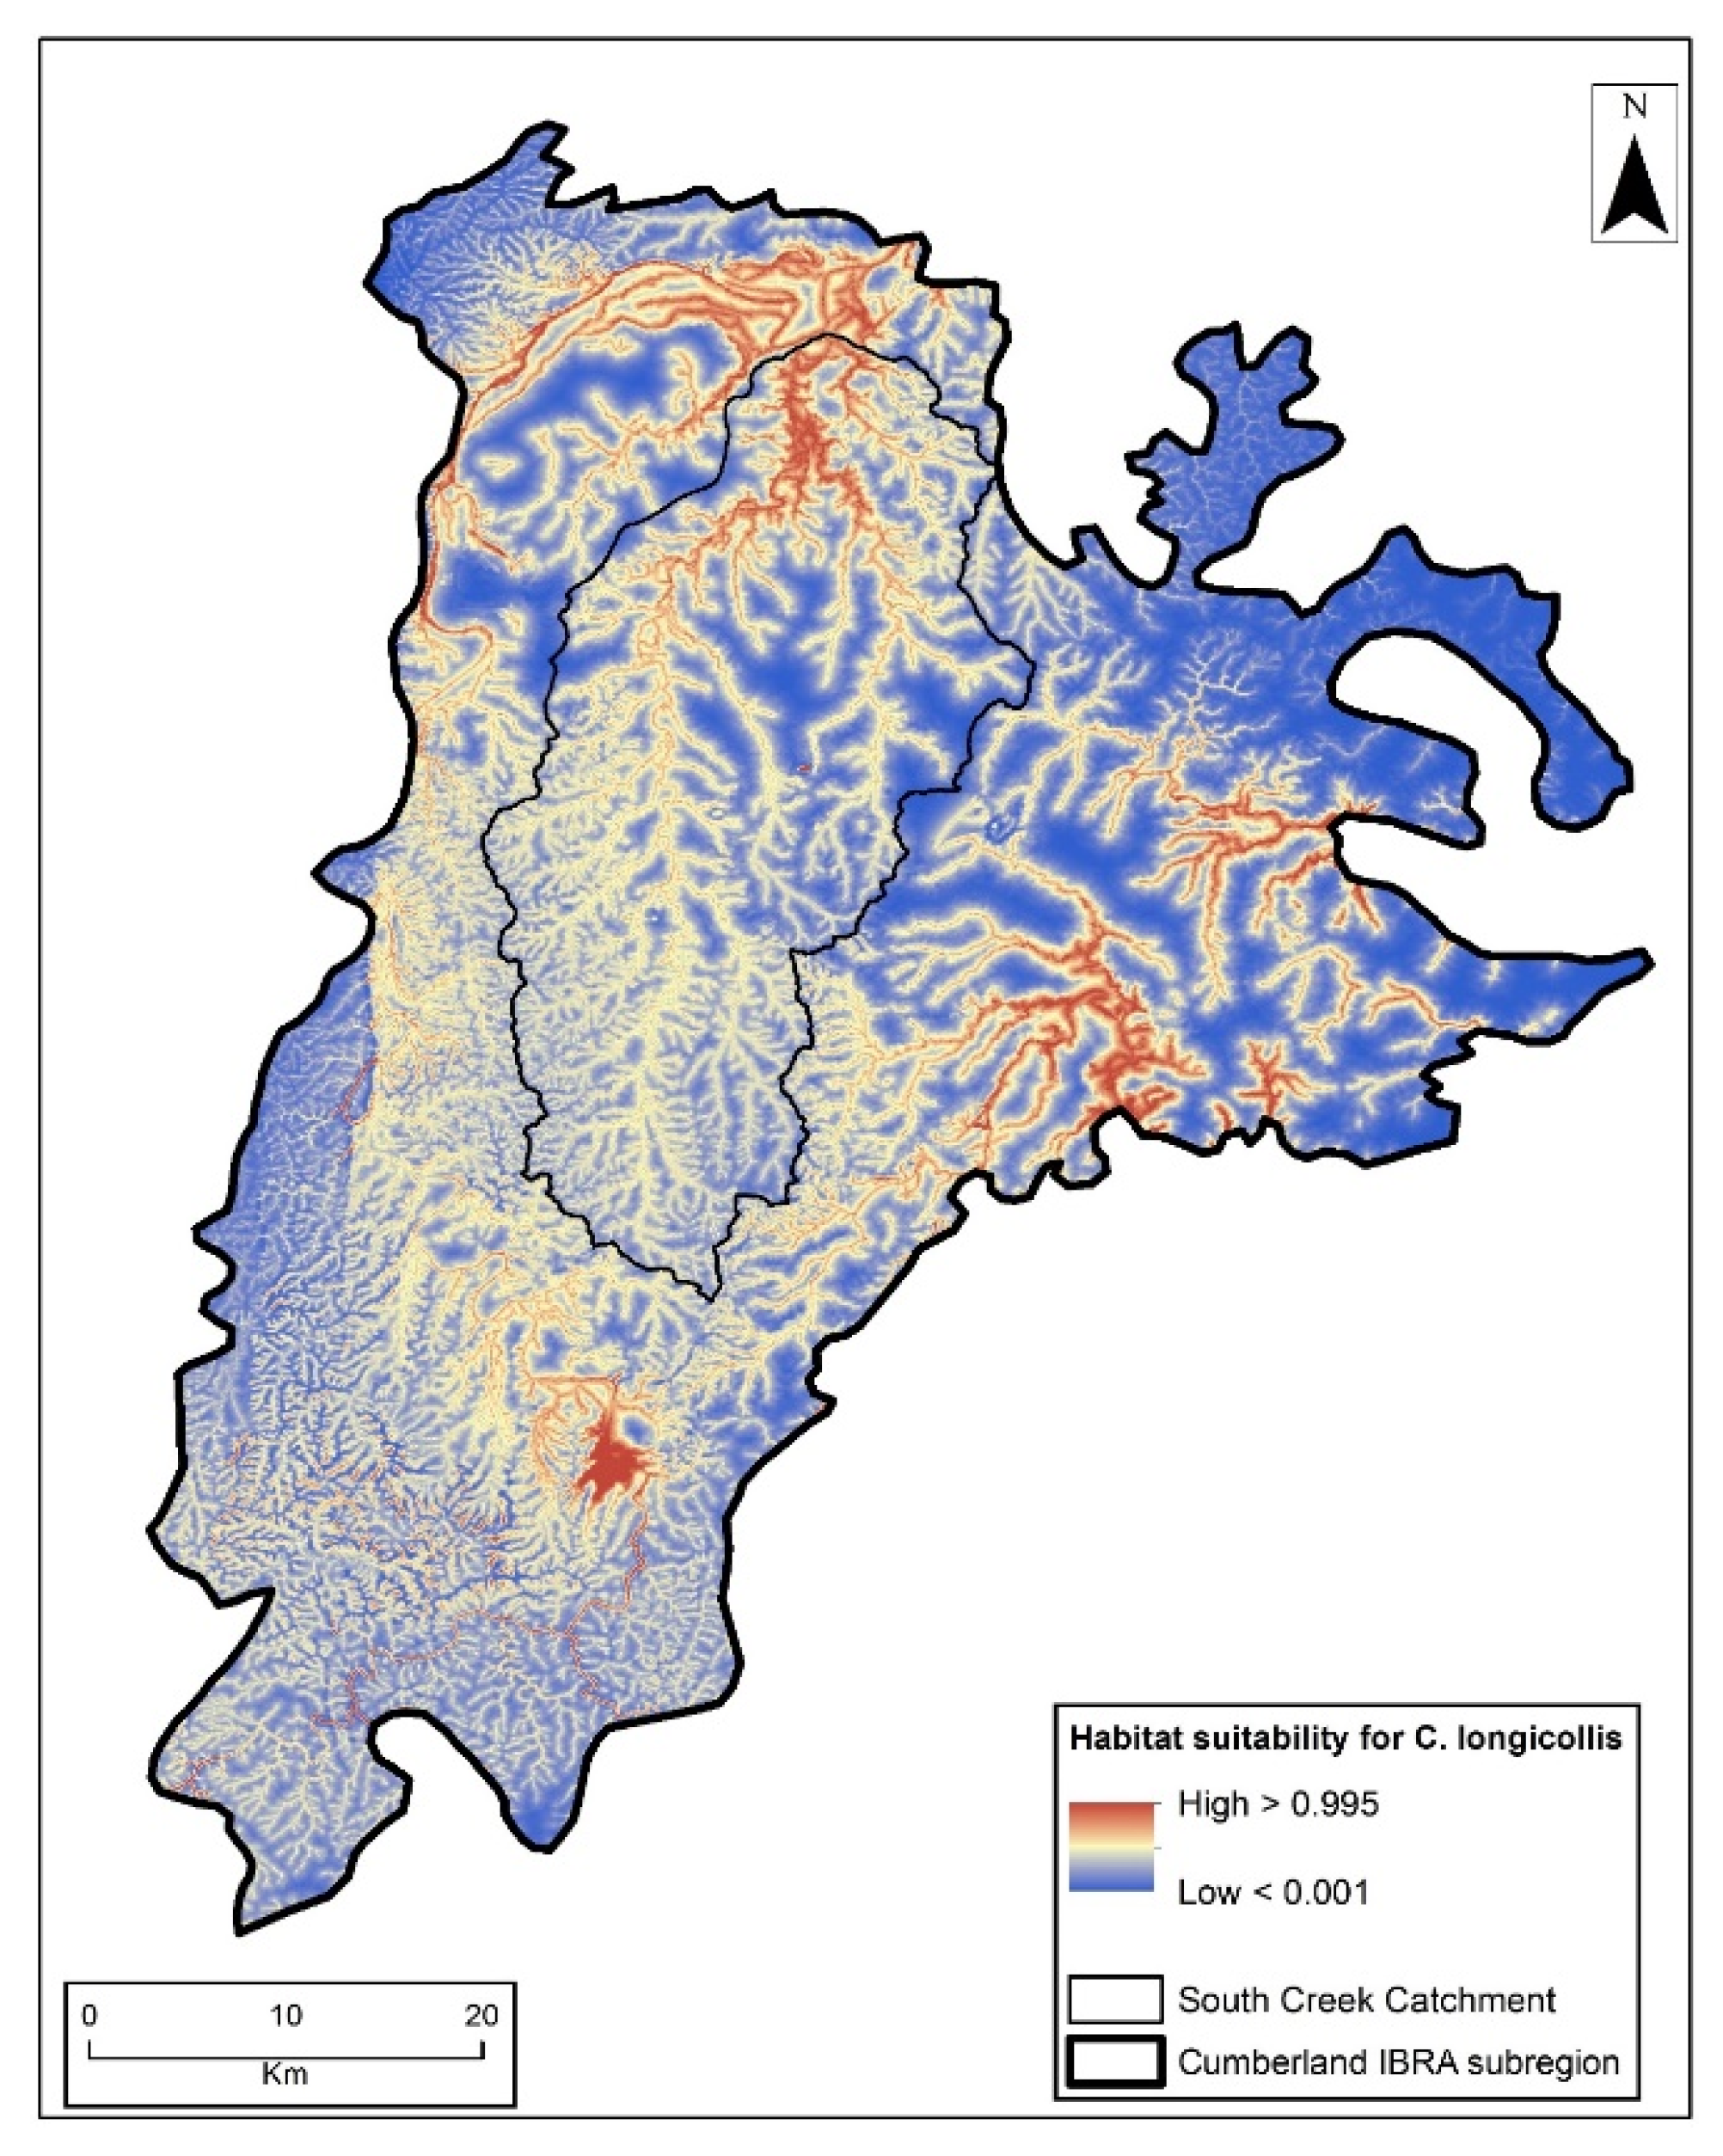
The predicted highest suitable habitat areas for C. longicollis in the Cumberland region included higher order stream channels of lower South Creek Catchment (Figure 11).
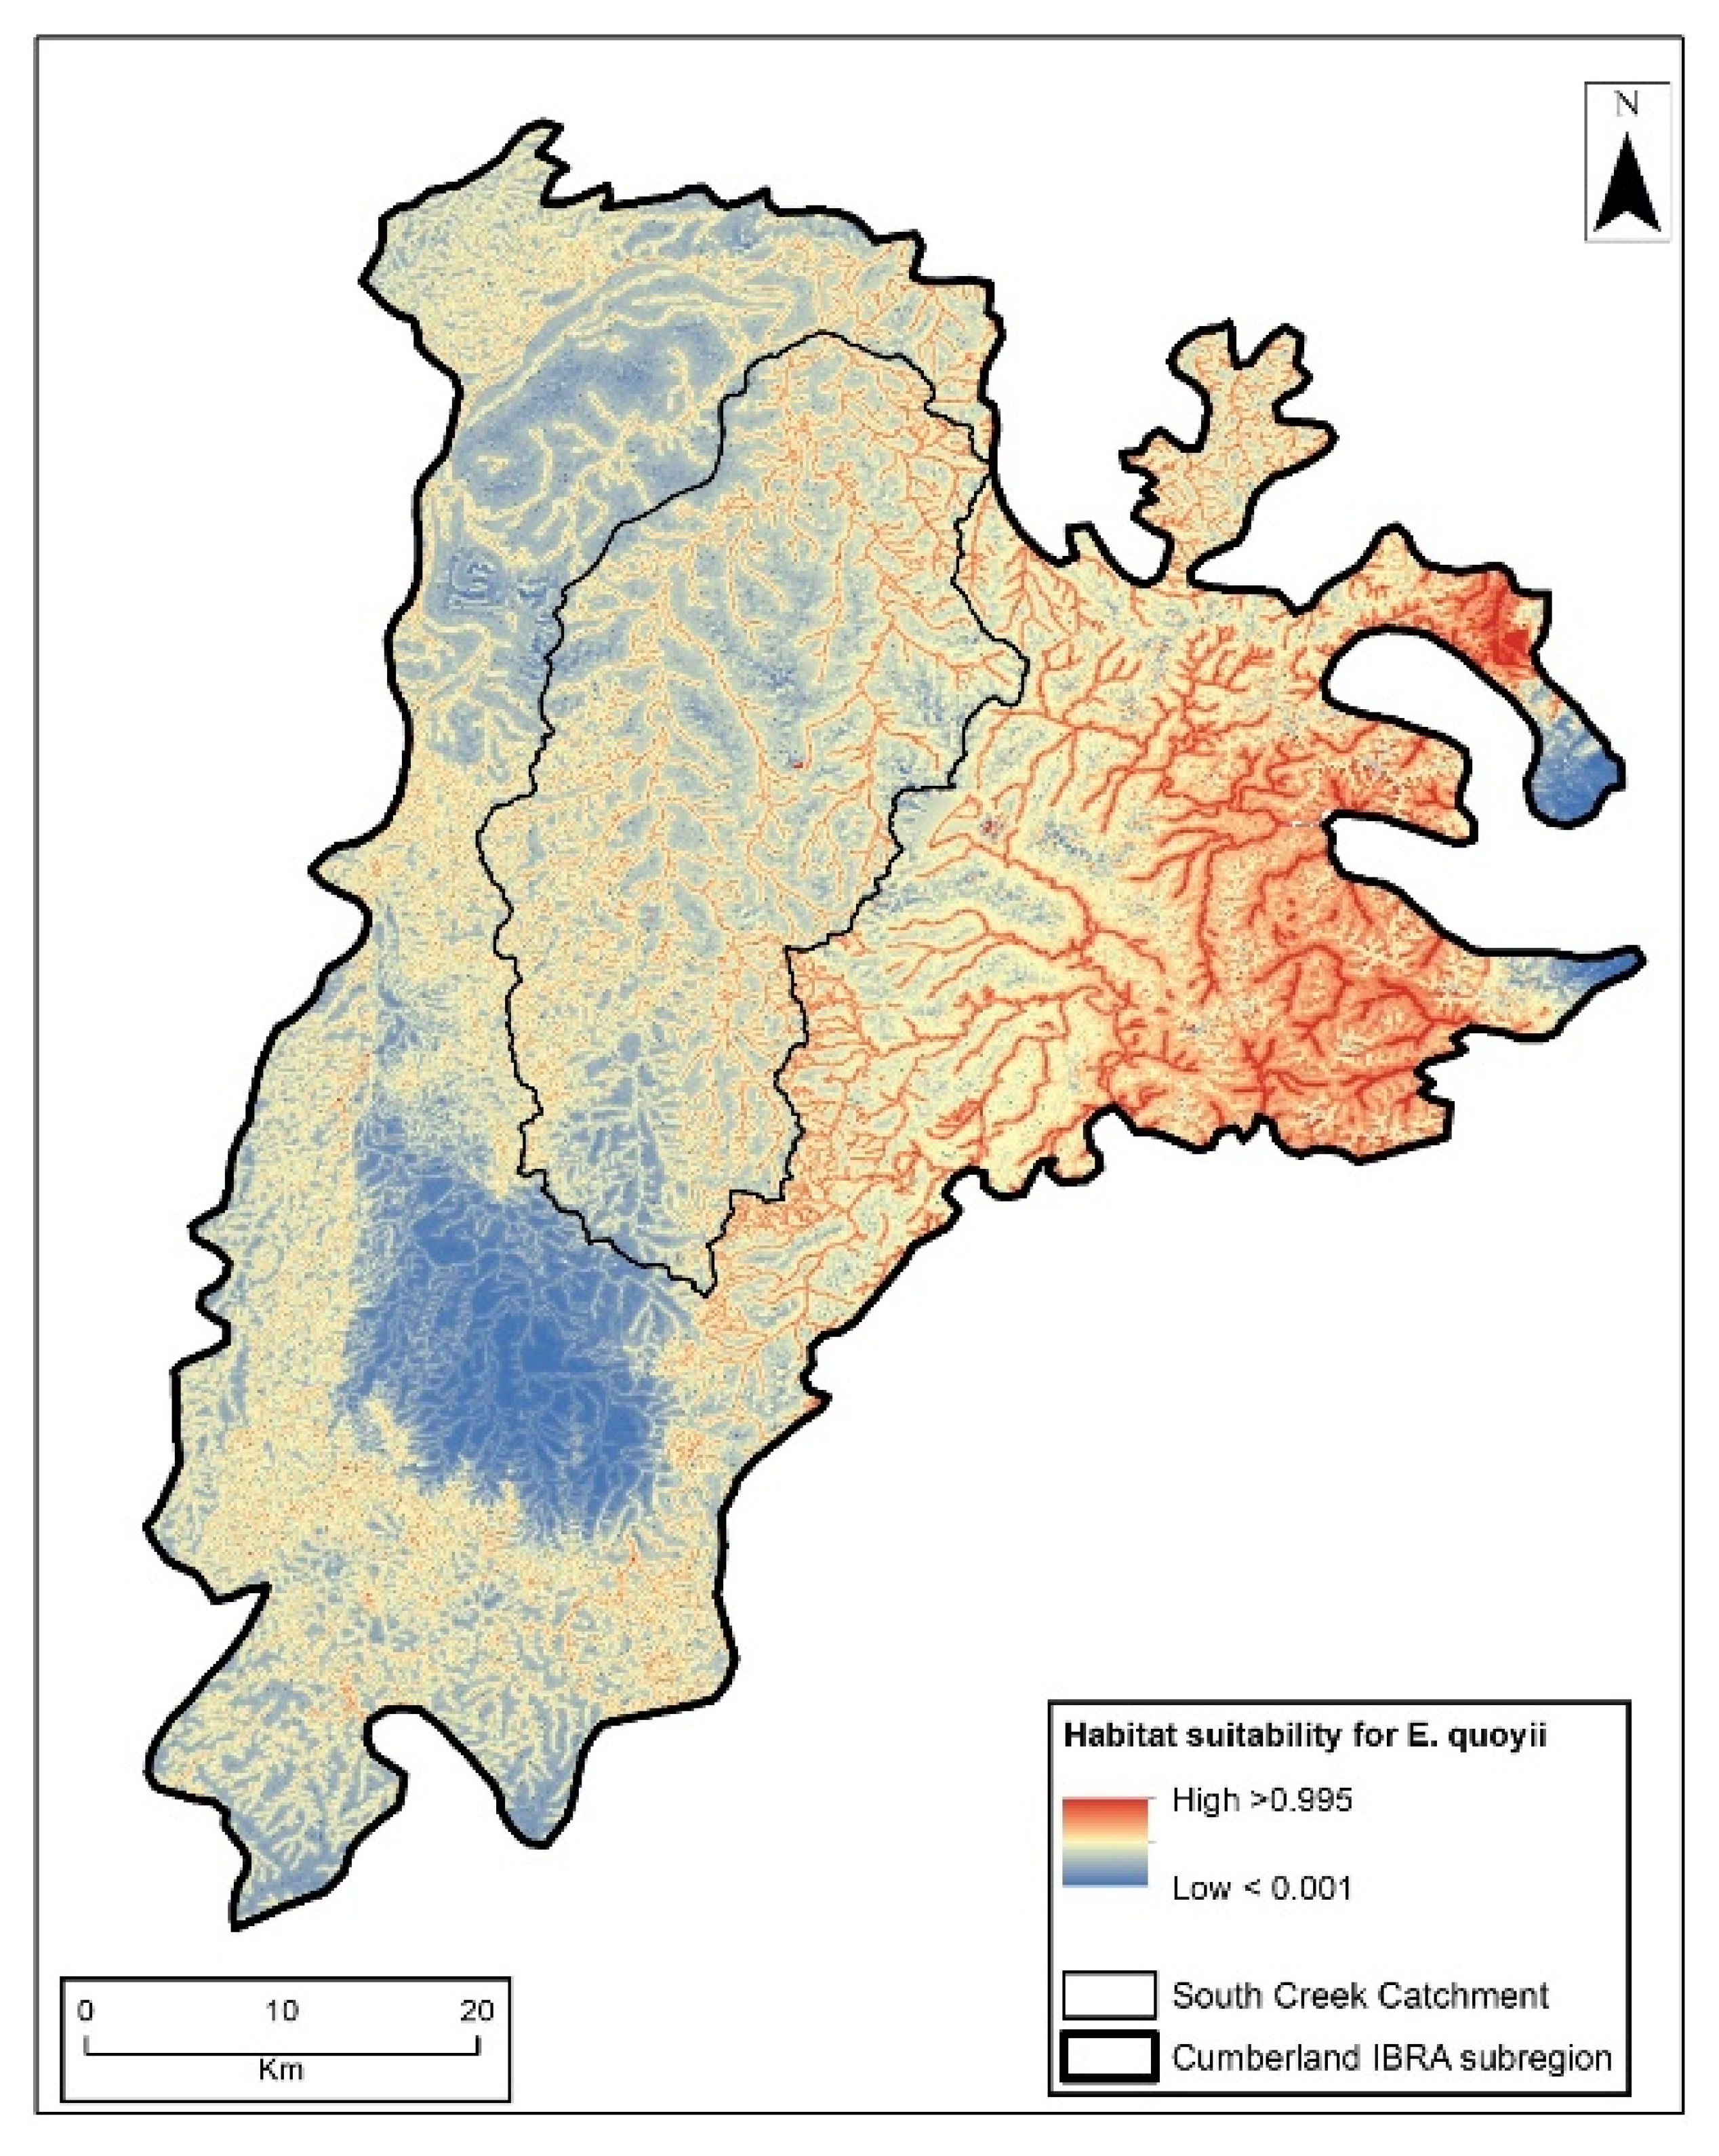
For E. quoyii there was little contrast in habitat suitability between drainage lines and other areas (Figure 12). Hence, most of the entire South Creek catchment was predicted to have to moderately suitable habitat for E. quoyii (Figure 12). This was in sharp contrast to both I. lesueurii (Figure 10) and C. Longicollis (Figure 11). For both these species, parts of the South Creek catchment were not predicted to have any suitable habitat.
Nine environmental variables were used in the final habitat suitability models (Table 3). At the beginning of the modelling exercise, we used 90 of the 102 environmental variables (Table S4). Hence, we removed 12 variables prior to analysis. Four of those variables are in the RS group (Table S4 page 8). These variables are highly influenced by human activities in the catchment. Only recent data were available for these variables at the locations where species were observed. Many of these sightings were made several decades ago prior to urban development. Hence, using these variables as predictors was likely to result in poor models. We also removed the eight variables in the Geophysics group (Table S4 page 4) after we noticed that the maps of these variables contained an East-West band of approximately 1 km width in the southern part of our study area. This band appeared which to be and artefact of combining datasets from different region. Using these variables in the models had the potential of introducing additional uncertainty to the predictions of the models.
4. Discussion
The primary objective of our global analysis was to determine the extent to which freshwater reptile species still persist in the cities of the world. Freshwater reptile sightings in this period were made in around more than a third of the 3525 cities and many of those cities supported several species from more than one of the major reptile groups, i.e., turtles, lizards, snakes and crocodilians. These results support our prediction that populations of freshwater reptile species persist in or near a large proportion of the world’s cities.
Global geographic patterns of persistence of freshwater reptiles in and around cities could help identify the factors that help or hinder persistence in a given city or region. Global patterns of species richness and endemism of freshwater reptiles had been assessed under Freshwater Animal Diversity Assessment (FADA) at the level of the eight zoogeographical regions of the world [7]. This assessment showed that the Oriental and Neotropical zoogeographical regions each had greater species richness of freshwater lizards [9], crocodilians [10], freshwater snakes [11] and freshwater turtles [12] than any of the other six zoogeographical regions of the world. In contrast, the GBIF data we used here showed FEOW regions in North America (Nearctic zoogeographic region) as having much higher species richness than the rest of the world (Figure 9, Table S3). Those data also showed many FEOW regions in South America (Neotropical zoogeographical region) and South- East Asia (Oriental zoogeographic region) as having much lower species richness than Western and Central Europe and Eastern Australia (Figure 9, Table S3). The strong relationship between the number of sighting records in a region and species (Figure 2) suggests that there were probably too few sightings from a great majority of FEOW regions to adequately represent species richness in those regions. Hence, the five-year species sighting records from GBIF are unlikely to have accurately captured global patterns in the persistence of freshwater reptiles in cities.
Online databases serve as a useful resource for examining global patterns in species richness and distributions. However, the geographic bias mentioned above as well as several other factors need to be considered when interpreting these data. The datasets downloaded from GBIF [19,20,21] originated from a wide variety of sources and there was often little or no information available about these sources. These global data sets were used to establish lists of species recorded at different distances from the center of a city assuming that the geographic coordinates were accurate enough for the purpose of these analyses. Many of these sightings did not have geographic uncertainty estimates, but because a great majority of sightings in this period (2013–2018) were made using mobile devices containing a GPS, the geographic coordinates were assumed to be accurate enough to generate reliable species lists. These assumptions should be tested, but regardless of the outcome of such testing, these data have several important attributes. Firstly, a great majority of these sightings were incidental rather than based on systematic surveys, thus these data sets are reflective of the current capacity of non-experts to observe species in an around cities. With greater use of citizen science platforms for making species sightings, the share of non-expert observations in online databases is likely to increase, especially in cities. Consequently, some of the biases inherent in such observations are likely to prevail in online databases. Hence, at a global scale the strengths and weaknesses of the species sightings for the period of analysis (2013–2018), together with information social and economic factors and technological change can help deciding how to shape effective monitoring of freshwater reptiles. The GBIF data clearly shows that a small number of ecoregions have a very large proportion of the sightings and the sampling effort is strongly and positively correlated with the number of species recorded (Figure 2). Another implication of this result isthat many of the 161 FEOW regions, from which there were no records, could also support freshwater reptiles. There is a need for better representation of ecoregions in Asia, Africa and South America before GBIF data can be used to understand the roles of factors such as climate, nature of urban development and the state of national economies in the persistence of freshwater reptiles in and around cities.
There were some big differences among the major freshwater reptile groups, in aspects of the GBIF data. For example, the absence of recent (2013–2018) records for a great majority of freshwater snake species (Figure 7) suggests that current monitoring activities do not pick up most snake species. Hence, the data available on snakes may not be particularly useful for understanding the persistence of this group in cities. Although a majority of freshwater lizard species were also absent from recent records (Figure 7), this group in particular could have an important place in freshwater reptile conservation in cities given that between 2013 and 2018 one in five sightings of freshwater lizard species were made within 10 km of the center of a city (Figure 8). The suitability of crocodilian species for monitoring might be greatly influenced by size and behavior. Their large size might be one of the main reasons for there being recent sightings of all except for three the of the 24 crocodilian species (Figure 7), but their size probably makes it harder for crocodilians to survive closer to the center of a city. Turtle sightings near cities extend over a very large part of the world (Figure 6), including temperate regions in both Northern and Southern Hemisphere; in a great majority of the cities just one turtle species was observed and in many cities the species seen was the invasive Trachemys scripta..This species was observed in 95 freshwater ecoregions and these observations accounted for almost a third of all turtle sightings in GBIF for the five year period. On the whole turtle observations in cities should probably be treated with caution because many freshwater of turtle species are used in the pet trade so sightings may not allways indicate the presence of established outdoor populations.Our results suggest that turtles, crocodilians and freshwater lizards are probably relatively easy to observe in cities but there is a need for further separate analysis of persistence in cities for each of the major freshwater reptile groups.
The Sydney case study demonstrated the use of species occurrence data at a finer scale than was possible in the global analysis. The sightings records used for modelling were filtered using much stricter quality criteria that what would be assumed for GBIF data. Ecological niche models using high resolution (~30 m) environmental data indicate how each of the species is likely to use space at that grain size. However, the environmental requirements represented by the predictors (Table 3) do not say much about the specific habitat requirements of these species. For example, they do not show that I. lesueurii needs open areas relatively free from vegetation cover, often on uncompacted sandy soils, and habitat heterogeneity allowing for thermoregulation [33], and that E. quoyii needs rocks and logs in open areas for basking [34,35]. While maps based on ecological niche models can help to roughly determine areas in which suitable habitats might occur across urban and peri-urban areas, detailed ecological information on each species would often also be needed to guide specific conservation actions.
Their ability to survive urban pressures together with the sensitivity of some species to these pressures suggest that freshwater reptiles might have an important role in biodiversity conservation in cities. The global analyses showed that even cities that have the greatest species richness probably do not support enough taxa for freshwater reptiles to be used in measures of community composition such as those for urban birds [3] and urban freshwater macroinvertebrates [4]. However, placement of freshwater reptiles into groups of discrete categories of responses to urbanization, i.e., urban avoiders, urban adapters, urban exploiters [3], may help to develop specific strategies that explicitly account for some important differences among species. An assessment of the effects of urban development on lizards in Sydney placed both I. lesueurii and E. quoyii in a group called urban battlers [36], which is probably equivalent to the urban adapters category used for birds [3]. It would be useful to test the value of this approach in many cities across the world and for all four groups of reptiles.
5. Conclusions
- Populations of freshwater reptile species persist in or near a large proportion of the world’s cities many of which have several species in more than one of the major reptile groups (turtles, crocodilians, snakes and lizards).
- Online databases hold substantial recent data for some Freshwater Ecoregions in North America, Europe and Australia and include a large number of sightings in and around cities. However, the data from tropical regions in South and Central America, Africa and South-east especially for snakes and lizards in tropical regions need to improve significantly to accurately assess global patterns of the persistence of freshwater reptiles in cities.
- In cities that currently have populations of freshwater reptile species, ecological niche modelling based on species occurrence records and environmental data can help to identify patterns of past decline, determine potential for recovery and identify spatial priorities for conservation actions.
Supplementary Materials
The following are available online at https://www.mdpi.com/2073-4441/12/3/651/s1, Table S1: Freshwater dependent reptile species, Table S2: Cities of the World with a population greater than 100,000, Table S3: Number of species and sightings of freshwater reptiles and observation near cities in Each Freshwater Ecoregion of the World, Table S4: Environmental variables dataset for habitat suitability modelling.
Author Contributions
Conceptualization, E.T., J.D.-C. and M.P.; methodology, E.T. and A.B.; formal analysis, E.T.; investigation, E.T.; writing—original draft preparation, E.T.; writing—reviewing E.T., A.B., J.D.-C. and M.P. All authors have read and agreed to the published version of the manuscript.
Funding
This research received no external funding.
Acknowledgments
In The list of freshwater turtle species was compiled by the IUCN/SSC Tortoise and Freshwater Turtle Specialist Group and the list of Squamata in freshwater was compiled by Andrew Durso. Both these lists were provided by Aaike De Wever in his capacity of Data Manager for Freshwater Animal Diversity Assessment (FADA). We thank the three anonymous reviewers for insightful and helpful comments and suggestions.
Conflicts of Interest
The authors declare no conflict of interest.
References
- United Nations Department of Economic and Social Affairs Population Division. World Urbanization Prospects: 2014 Revision; Working Paper No. ST/ESA/SER.A/366; UN Bureau of Economic and Social Affairs: New York, NY, USA, 2014. [Google Scholar]
- Güneralp, B.; Seto, K.C. Futures of global urban expansion: Uncertainties and implications for biodiversity conservation. Env. Res. Lett. 2013, 8, 014025. [Google Scholar] [CrossRef]
- Geschke, A.; James, S.; Bennett, A.F.; Nimmo, D.G. Compact cities or sprawling suburbs? Optimising the distribution of people in cities to maximise species diversity. J. Appl. Ecol. 2018, 55, 2320–2331. [Google Scholar] [CrossRef]
- Lunde, K.B.; Resh, V.H. Development and validation of a macroinvertebrate index of biotic integrity (IBI) for assessing urban impacts to Northern California freshwater wetlands. Environ. Monit. Assess. 2012, 184, 3653–3674. [Google Scholar] [CrossRef] [PubMed]
- Roset, N.; Grenouillet, G.; Goffaux, D.; Pont, D.; Kestemont, P. A review of existing fish assemblage indicators and methodologies. Fish. Manag. Ecol. 2007, 14, 393–405. [Google Scholar] [CrossRef]
- Lobo, E.A.; Heinrich, C.G.; Schuch, M.; Wetzel, C.E.; Ector, L. Diatoms as bioindicators in rivers. In River Algae; Springer: Cham, Switzerland, 2016; pp. 245–271. [Google Scholar]
- Balian, E.V.; Lévêque, C.; Segers, H.; Martens, K. An introduction the Freshwater animal diversity assessment. Hydrobiologia 2008, 595, 3–8. [Google Scholar] [CrossRef]
- Dehorter, O.; Guillemain, M. Global diversity of freshwater birds (Aves). Hydrobiologia 2008, 595, 619–626. [Google Scholar] [CrossRef]
- Bauer, A.M.; Jackman, T. Global diversity of lizards in freshwater (Reptilia: Lacertilia). Hydrobiologia 2008, 595, 581–586. [Google Scholar] [CrossRef]
- Martin, S. Global diversity of crocodiles (Crocodilia, Reptilia) in freshwater. Hydrobiologia 2008, 595, 587–591. [Google Scholar] [CrossRef]
- Pauwels, O.S.; Wallach, V.; David, P. Global diversity of snakes (Serpentes; Reptilia) in freshwater. Hydrobiologia 2008, 595, 599–605. [Google Scholar] [CrossRef]
- Bour, R. Global diversity of turtles (Chelonii; Reptilia) in freshwater. Hydrobiologia 2008, 595, 593–598. [Google Scholar] [CrossRef]
- Margules, C.R.; Pressey, R.L. Systematic conservation planning. Nature 2000, 405, 243–253. [Google Scholar] [CrossRef] [PubMed]
- Linke, S.; Turak, E.; Nel, J. Freshwater conservation planning: The case for systematic approaches. Freshwater Biol. 2011, 56, 6–20. [Google Scholar] [CrossRef]
- Linke, S.; Turak, E.; Asmyhr, M.G.; Hose, G. 3D conservation planning: Including aquifer protection in freshwater plans refines priorities without much additional effort. Aquat. Conserv. 2019, 29, 1063–1072. [Google Scholar] [CrossRef] [Green Version]
- Esselman, P.C.; Allan, J.D. Application of species distribution models and conservation planning software to the design of a reserve network for the riverine fishes of northeastern Mesoamerica. Freshwater Biol. 2011, 56, 71–88. [Google Scholar] [CrossRef] [Green Version]
- Jetz, W.; McGeoch, M.; Guralnick, R.; Ferrier, S.; Beck, J.; Costello, M.; Fernandez, M.; Geller, G.; Keil, P.; Cory Merow, C.; et al. Essential information for mapping and monitoring of species populations for policy, management, and education. Nat. Ecol. Evol. 2019, 3, 539. [Google Scholar] [CrossRef] [PubMed] [Green Version]
- Gaiji, S.; Chavan, V.; Ariño, A.H.; Otegui, J.; Hobern, D.; Sood, R.; Robles, E. Content assessment of the primary biodiversity data published through GBIF network: Status, challenges and potentials. Biodivers. Inform. 2013, 8. [Google Scholar] [CrossRef]
- GBIF. GBIF Occurrence Download. 2018. Available online: https://doi.org/10.15468/dl.gpklhn Squamata (accessed on 21 October 2019).
- GBIF. GBIF Occurrence Download. 2018. Available online: https://doi.org/10.15468/dl.jzggqr Testudines (accessed on 21 October 2019).
- GBIF. GBIF Occurrence Download. 2018. Available online: https://doi.org/10.15468/dl.s7q8a2 Crocodilia (accessed on 21 October 2019).
- Maxmind. Free World Cities Database. Available online: http://www.maxmind.com/ (accessed on 2 May 2018).
- Abell, R.; Thieme, M.L.; Revenga, C.; Bryer, M.; Kottelat, M.; Bogutskaya, N.; Coad, B.; Mandrak, N.; Balderas, S.C.; Bussing, W.; et al. Freshwater ecoregions of the world: A new map of biogeographic units for freshwater biodiversity conservation. BioScience 2008, 58, 403–414. [Google Scholar] [CrossRef] [Green Version]
- MacDonald, P. Sydney’s Housing Demand is Swallowing Farms on the Harbour City’s Fringes. ABC News. Available online: http://www.abc.net.au/news/2018-03-13/sydney-farms-disappearing-due-to-urban-sprawl/9523428 (accessed on 8 May 2018).
- Thackway, R.; Cresswell, I.D. An Interim Biogeographic Regionalisation for Australia: A framework for Establishing the National System of Reserves, Version 4.0; Australian Nature Conservation Agency: Canberra, Australia, 1995; p. 88. [Google Scholar]
- Phillips, S.J.; Anderson, R.P.; Schapire, R.E. Maximum entropy modelling of species geographic distributions. Ecol. Model. 2006, 190, 231–259. [Google Scholar] [CrossRef] [Green Version]
- NSW Office of Environment and Heritage. The NSW State Vegetation Type Map: Methodology for a Regional-Scale Map of NSW Plant Community Types; NSW Office of Environment and Heritage: Sydney, Australia, 2017; ISBN 978-1-76039-729-6. OEH 2017/0134. Available online: http://www.environment.nsw.gov.au (accessed on 10 May 2018).
- Warren, D.L.; Seifert, S.N. Ecological niche modelling in Maxent: The importance of model complexity and the performance of model selection criteria. Ecol. Appl. 2011, 21, 335–342. [Google Scholar] [CrossRef] [Green Version]
- Elith, J.H.; Graham, C.P.; Anderson, R.; Dudík, M.; Ferrier, S.; Guisan, A.J.; Hijmans, R.; Huettmann, F.R.; Leathwick, J.; Lehmann, A.; et al. Novel methods improve prediction of species’ distributions from occurrence data. Ecography 2006, 29, 129–151. [Google Scholar] [CrossRef] [Green Version]
- National Committee on Soil and Terrain. Australian Soil and Land Survey Field Handbook (No. 1); CSIRO Publishing: Clayton, Australia, 2009. [Google Scholar]
- Weiss, A. Topographic position and landforms analysis. In Proceedings of the Poster Presentation, ESRI User Conference, San Diego, CA, USA, 9–13 July 2001; Volume 200. [Google Scholar]
- Geoscience Australia. 1 s SRTM Digital Elevation Model (DEM). Bioregional Assessment Source Dataset. Available online: http://data.bioregionalassessments.gov.au/dataset/9a9284b6-eb45-4a13-97d0-91bf25f1187b (accessed on 18 March 2019).
- Garden, J.G.; McAlpine, C.A.; Possingham, H.P.; Jones, D.N. Habitat structure is more important than vegetation composition for local-level management of native terrestrial reptile and small mammal species living in urban remnants: A case study from Brisbane, Australia. Austral Ecol. 2007, 32, 669–685. [Google Scholar] [CrossRef]
- Cogger, H. Reptiles and Amphibians of Australia; CSIRO Publishing: Clayton, Australia, 2014. [Google Scholar]
- Law, B.S.; Bradley, R.A. Habitat use and basking site selection in the water skink, Eulamprus quoyii. J. Herpetol. 1990, 24, 235–240. [Google Scholar] [CrossRef]
- Shea, G.M. The suburban terrestrial reptile fauna of Sydney–winners and losers. In The Natural History of Sydney; 2010; pp. 154–197. [Google Scholar]
Figure 1.
Population density within the study area in Western Sydney. These data come from the 2011 census and was provided by the Australian Bureau of Statistics. The data covers the same extent as the habitat suitability modelling (Cumberland IBRA subregion). The areas of primary interest in relation to urban development is the South Creek Catchment. The protected areas managed by New South Wales National Parks and Wildlife Service (NSW NPWS) in an around the bioregion are also shown.

Figure 2.
The relationship between the number of sightings made and number of species recorded within an ecoregion. Each point is a Freshwater Ecoregion of the World (FEOW) region (n = 265).
Figure 2.
The relationship between the number of sightings made and number of species recorded within an ecoregion. Each point is a Freshwater Ecoregion of the World (FEOW) region (n = 265).

Figure 3.
Number of freshwater turtle species sighted between January 2013 and April 2018 within 50 km of a city with a population of more than 100,000.
Figure 3.
Number of freshwater turtle species sighted between January 2013 and April 2018 within 50 km of a city with a population of more than 100,000.

Figure 4.
Number of freshwater lizard species sighted between January 2013 and April 2018 within 50 km of a city with a population of more than 100,000.
Figure 4.
Number of freshwater lizard species sighted between January 2013 and April 2018 within 50 km of a city with a population of more than 100,000.

Figure 5.
Number of crocodilian species sighted between January 2013 and April 2018 within 50 km of a city with a population of more than 100,000.
Figure 5.
Number of crocodilian species sighted between January 2013 and April 2018 within 50 km of a city with a population of more than 100,000.

Figure 6.
Number of freshwater snake species sighted between January 2013 and April 2018 within 50 km of a city with a population of more than 100,000.
Figure 6.
Number of freshwater snake species sighted between January 2013 and April 2018 within 50 km of a city with a population of more than 100,000.

Figure 7.
Percentage of freshwater species in each reptile group, sighted between January 2013 and April 2018. The unshaded bars represent the percentage of all known species in the group, sighted during that period anywhere in the world. The light gray and dark gray bars represent the percentage of known species sighted within 50 and 10 km of the center of a city.

Figure 8.
Freshwater reptile species sightings from GBIF (2013–2018) in each major group by the distance the center of a city. No shading represents the percentage sightings made at more than 50 km from a city center.
Figure 8.
Freshwater reptile species sightings from GBIF (2013–2018) in each major group by the distance the center of a city. No shading represents the percentage sightings made at more than 50 km from a city center.

Figure 9.
Regional species richness of Freshwater reptiles and their level of representation in cities of the region. The numbers represent number of species of freshwater reptiles recorded in GBIF (2013–2018) from each Freshwater Ecoregions of the World (FEOW) region. The colors represent the level of representation of this fauna within 10 km of the center of a city in that FEOW Region. One invasive species Trachemys scripta was omitted from the data used to produce this map.

Figure 10.
Predicted habitat suitability for the eastern water dragon (Intellagama lesueurii), in the Cumberland Interim Biogeographic Regionalisation of Australia (IBRA) subregion.
Figure 10.
Predicted habitat suitability for the eastern water dragon (Intellagama lesueurii), in the Cumberland Interim Biogeographic Regionalisation of Australia (IBRA) subregion.

Figure 11.
Predicted habitat suitability for the eastern snake-necked turtle (Chelodina longicollis) in the Cumberland Interim Biogeographic Regionalisation of Australia (IBRA) subregion.
Figure 11.
Predicted habitat suitability for the eastern snake-necked turtle (Chelodina longicollis) in the Cumberland Interim Biogeographic Regionalisation of Australia (IBRA) subregion.

Figure 12.
Predicted habitat suitability for the eastern water skink (Eulamprus quoyii) in the Cumberland Interim Biogeographic Regionalisation of Australia (IBRA) subregion.
Figure 12.
Predicted habitat suitability for the eastern water skink (Eulamprus quoyii) in the Cumberland Interim Biogeographic Regionalisation of Australia (IBRA) subregion.


Table 1.
The number of species attributed to freshwater in each major group of reptiles and the number of sightings in the Global Biodiversity Information Facility (GBIF) of any species in each group between January 2013 to April 2018.
Table 1.
The number of species attributed to freshwater in each major group of reptiles and the number of sightings in the Global Biodiversity Information Facility (GBIF) of any species in each group between January 2013 to April 2018.
| Group of Reptile | Number of Known Species in Freshwater | Number of Sightings |
|---|---|---|
| Turtles | 270 | 35,968 |
| Lizards | 101 | 4830 |
| Crocodilians | 23 | 6286 |
| Snakes | 237 | 10,368 |
| All reptiles | 631 | 57,452 |
Table 2.
Some attributes of the ecological niche models for the three species. AUC is the Area Under the Receiver Operating Characteristics Curve. AUC ranges from 0 to 1, where a score of 1 indicates perfect discrimination and a score of 0.5 implies a predictive discrimination that is no better than random [15].
| Model Attribute | I. Lesueurii | C. Longicollis | E. Quoyii |
|---|---|---|---|
| Number of training samples | 174 | 48 | 300 |
| Number of test samples | 19 | 16 | 33 |
| AUC training | 0.80 | 0.82 | 0.72 |
| AUC test | 0.81 | 0.80 | 0.71 |
| AUC standard deviation | 0.05 | 0.04 | 0.04 |
Table 3.
The relative contribution of the environmental variables to the predictions for each of the three species. The Euclidean distance gives the distance from each cell in the raster to the closest stream of any order. Particle sizes for sand (0.02–2 mm) and clay (0.0002–0.002 mm) are as defined by [30]. The Topographic Position Index (TPI) compares the elevation of each cell in a digital elevation model (DEM) to the mean elevation of a distance of 250 and 2000 m around each cell [31]. The 1 s DEM-S is a national elevation data product derived from the Shuttle Radar Topography Mission (SRTM) data [32].
| Description of the Environmental Variable | Spatial Resolution | I. lesueurii | C. longicollis | E. quoyii |
|---|---|---|---|---|
| Average daily minimum temperature—Winter (°C) | 1 s | - | - | 41.74 |
| Euclidean distance to all streams (i.e., all orders: 1 to 9) (m) | 30 m | 60.11 | 36.07 | 35.42 |
| Sand content proportionally combined depths from 0 to 100 cm (%) | 3 s | 2.60 | - | - |
| Clay content (100–200 cm) (%) | 3 s | 1.81 | - | - |
| Precipitation of Wettest Period (mm) | 1 s | - | 21.68 | - |
| Annual Precipitation (mm) | 1 s | - | - | 13.23 |
| 1 sec SRTM smoothed Digital Elevation Model (DEM-S) (mm) | 1 s | 2.33 | 39.22 | - |
| Topographic position index using a neighborhood of 250 m radius | 1 s | - | 3.02 | 2.53 |
| Topographic position index using a neighborhood of 2000 m radius. | 1 s | 33.15 | - | - |
| Beer’s Aspect-transformation of aspect to a continuous scaled variable. Changed for the southern hemisphere by setting maximum value (2) to South East slopes (coolest) and minimum (0) to North West slopes (warmest) | 1 S | - | - | 7.09 |
© 2020 by the authors. Licensee MDPI, Basel, Switzerland. This article is an open access article distributed under the terms and conditions of the Creative Commons Attribution (CC BY) license (http://creativecommons.org/licenses/by/4.0/).
Share and Cite
MDPI and ACS Style
Turak, E.; Bush, A.; Dela-Cruz, J.; Powell, M. Freshwater Reptile Persistence and Conservation in Cities: Insights from Species Occurrence Records. Water 2020, 12, 651. https://doi.org/10.3390/w12030651
AMA Style
Turak E, Bush A, Dela-Cruz J, Powell M. Freshwater Reptile Persistence and Conservation in Cities: Insights from Species Occurrence Records. Water. 2020; 12(3):651. https://doi.org/10.3390/w12030651
Chicago/Turabian StyleTurak, Eren, Alex Bush, Jocelyn Dela-Cruz, and Megan Powell. 2020. "Freshwater Reptile Persistence and Conservation in Cities: Insights from Species Occurrence Records" Water 12, no. 3: 651. https://doi.org/10.3390/w12030651
Note that from the first issue of 2016, this journal uses article numbers instead of page numbers. See further details here.