Water Crisis in Petorca Basin, Chile: The Combined Effects of a Mega-Drought and Water Management

 , , , ,
Abstract
:1. Introduction
2. Data and Methods
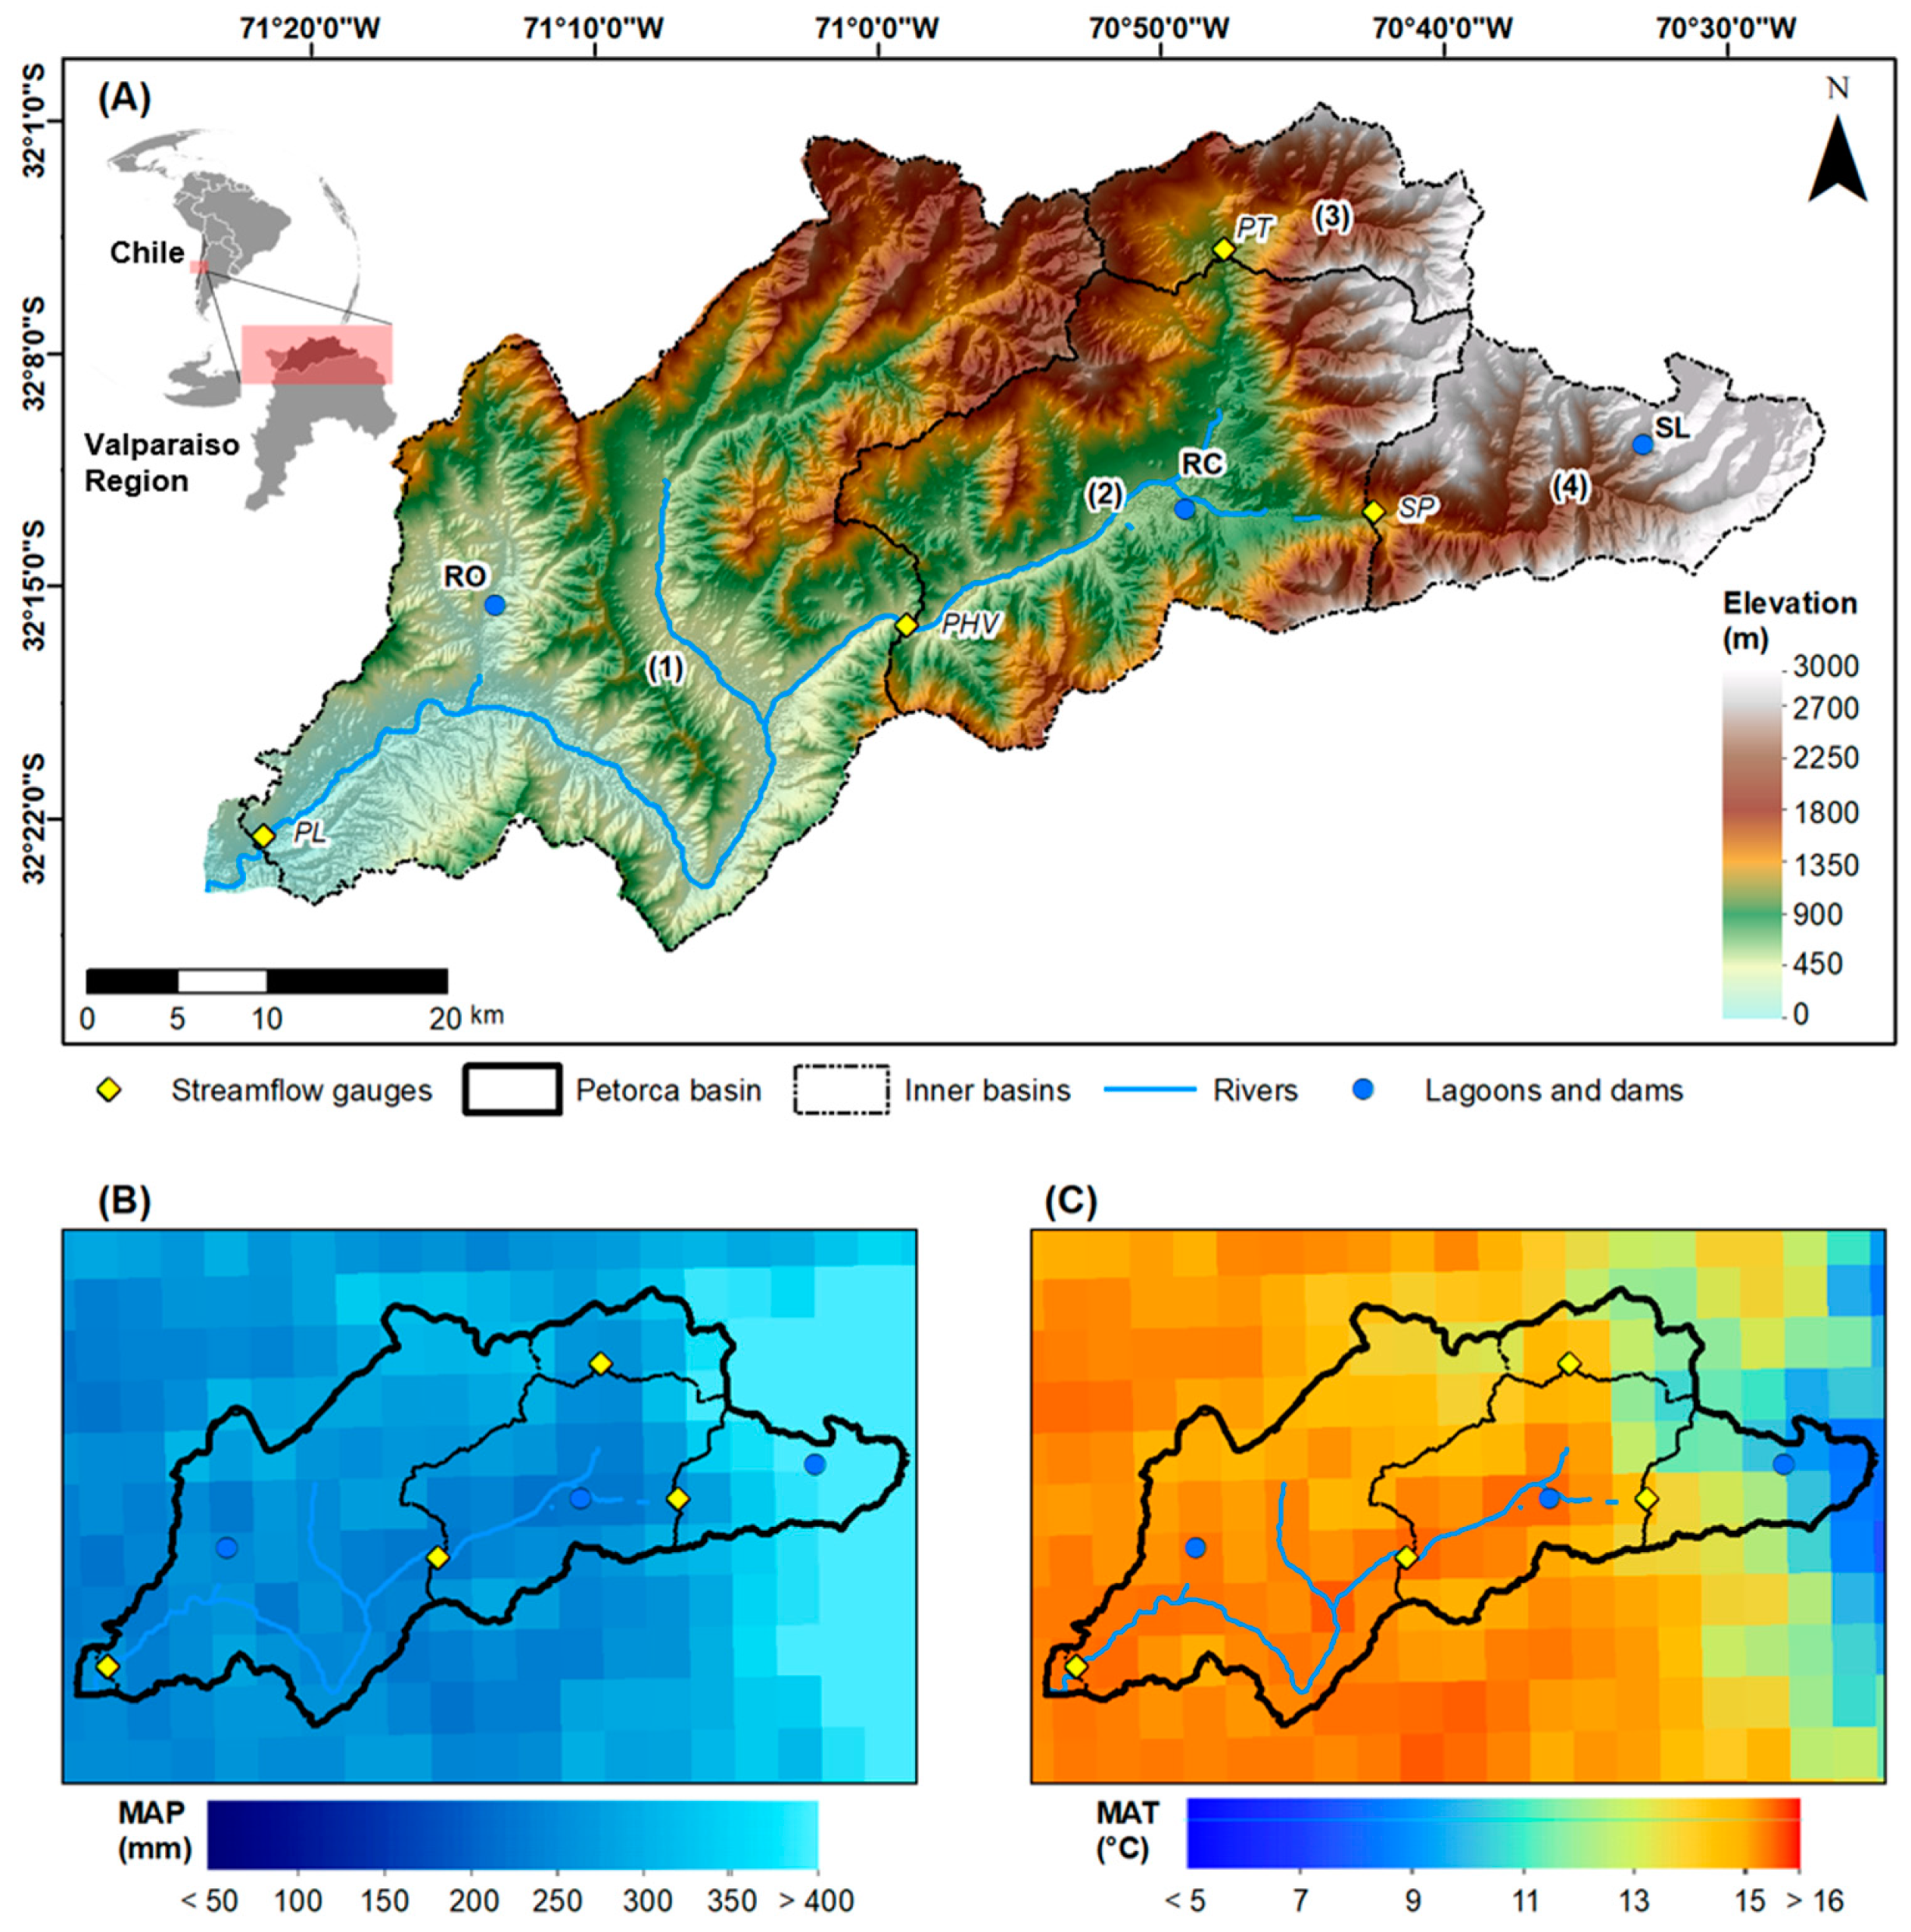
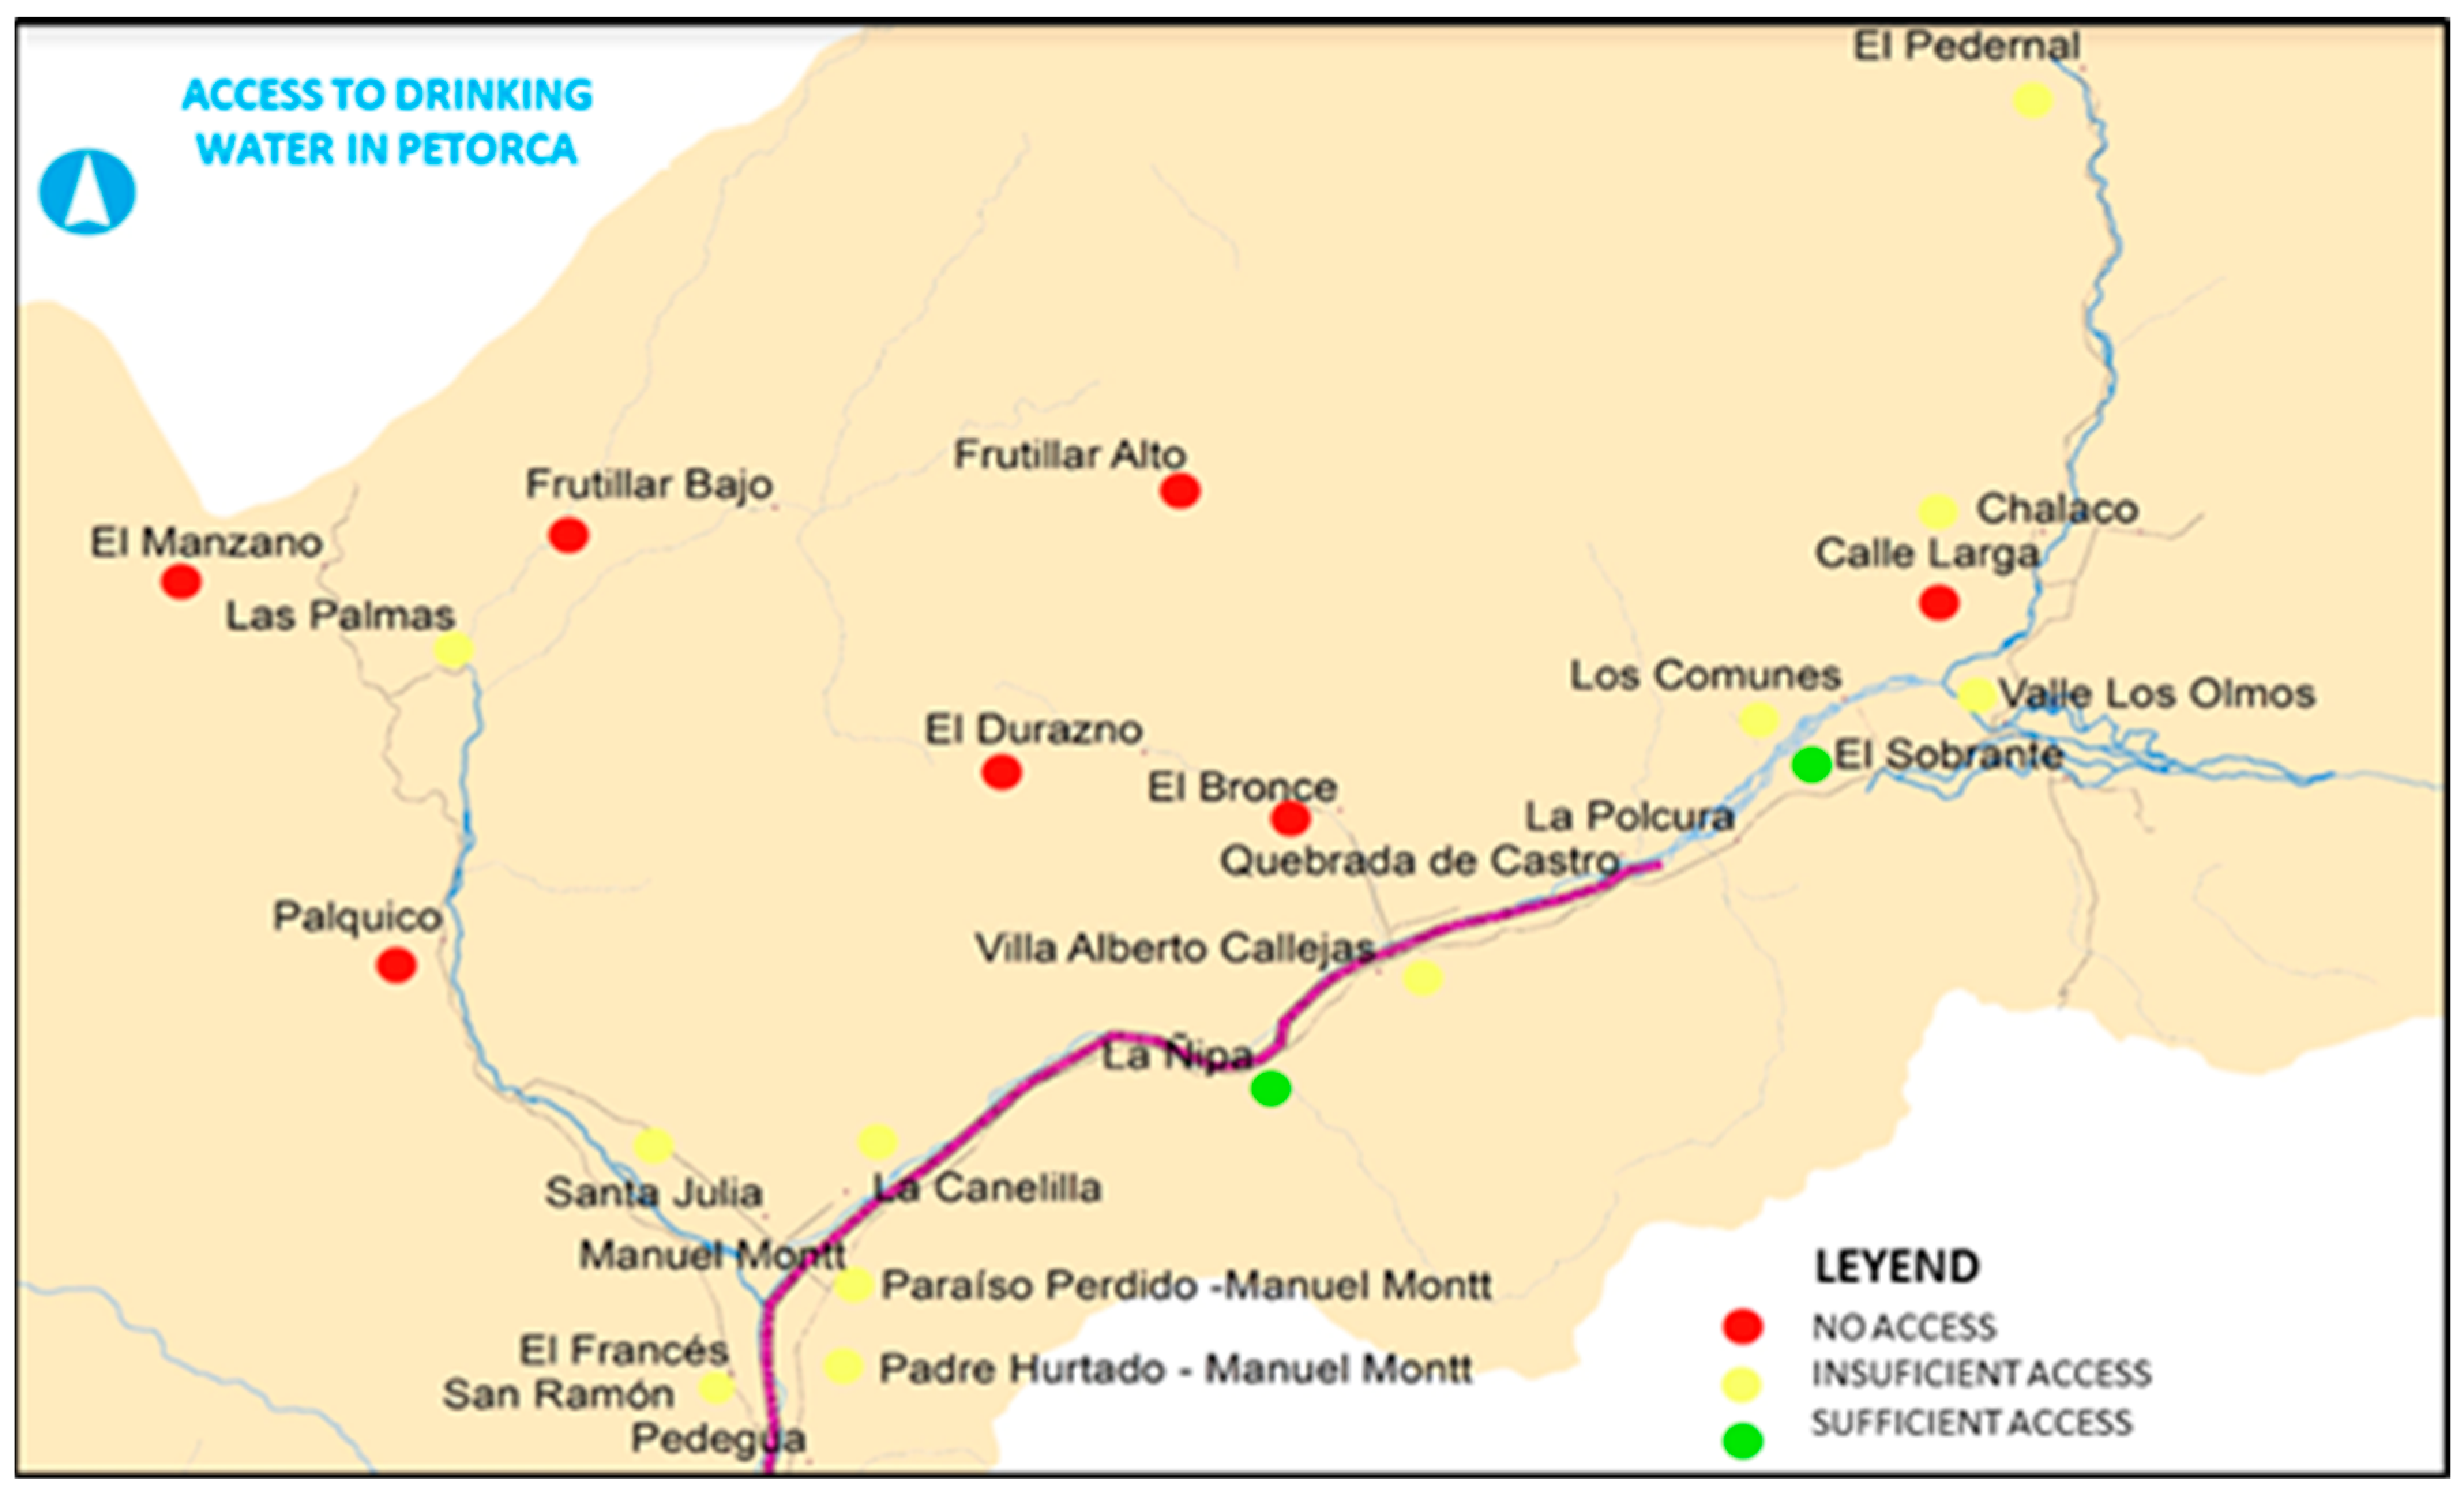
2.1. Study Area
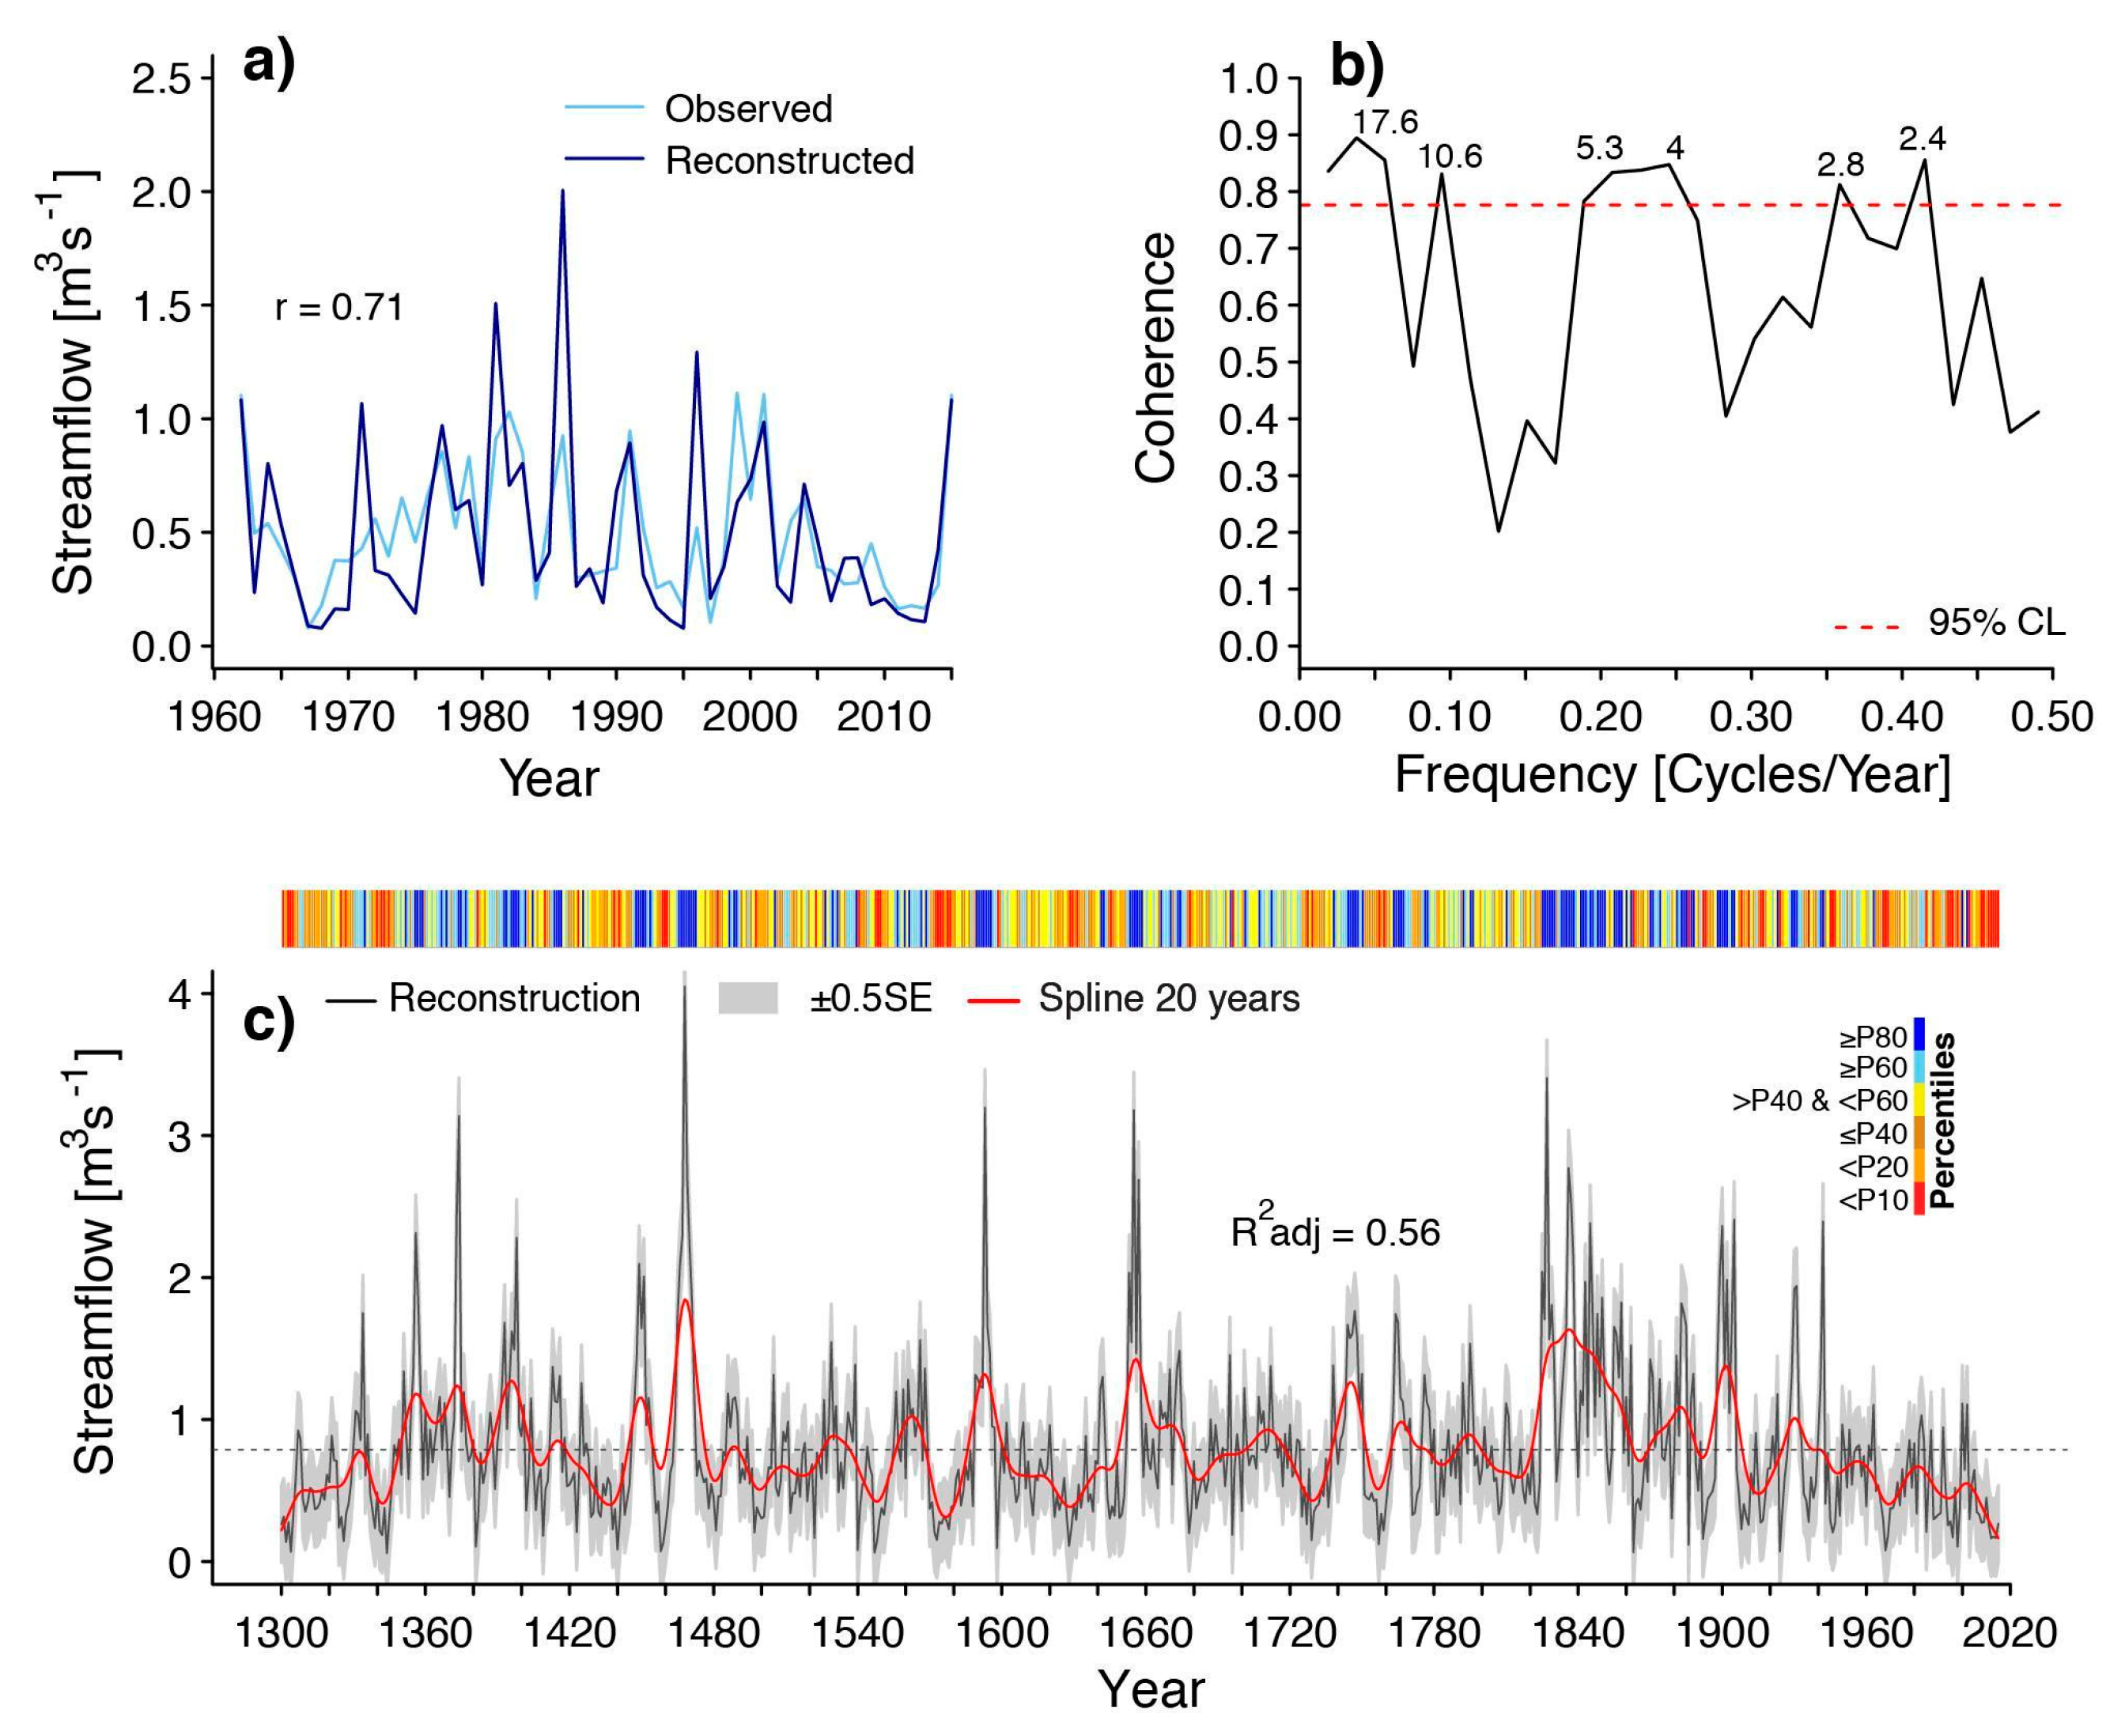
2.2. Streamflow Reconstruction
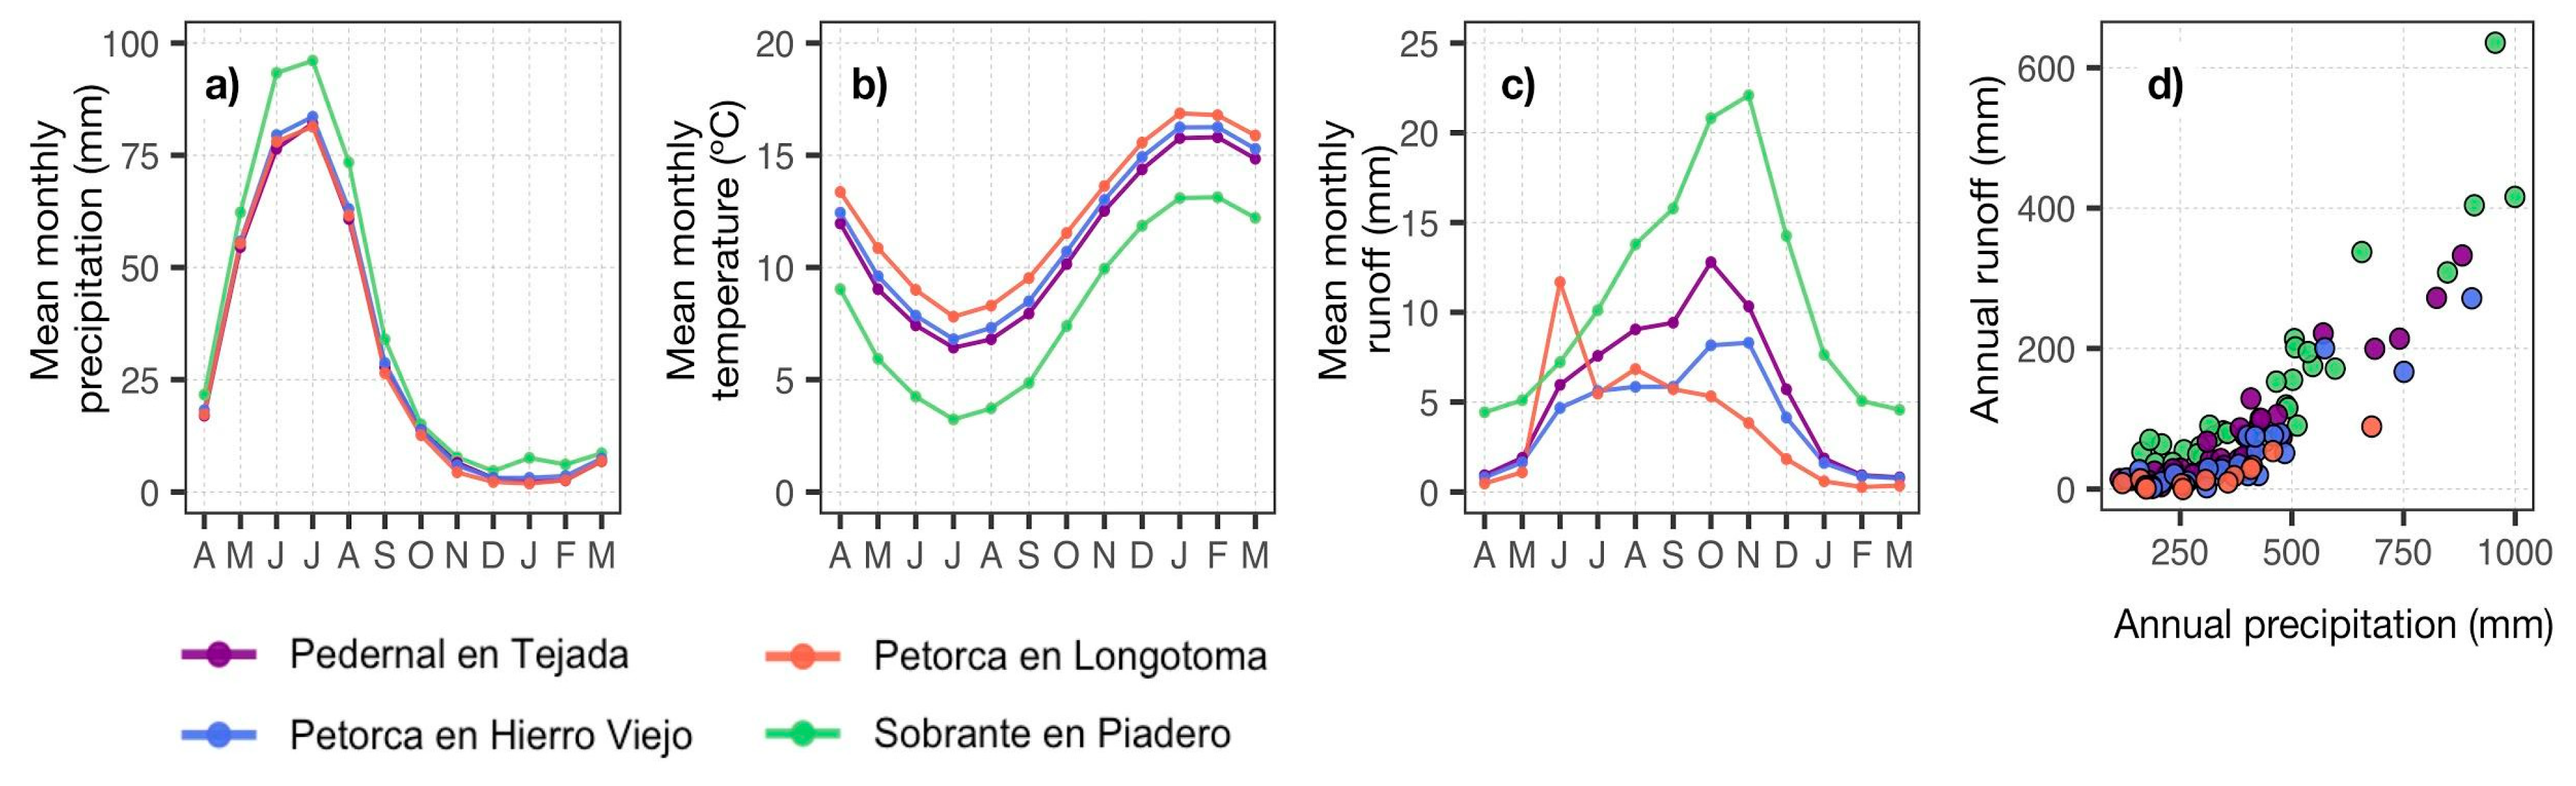
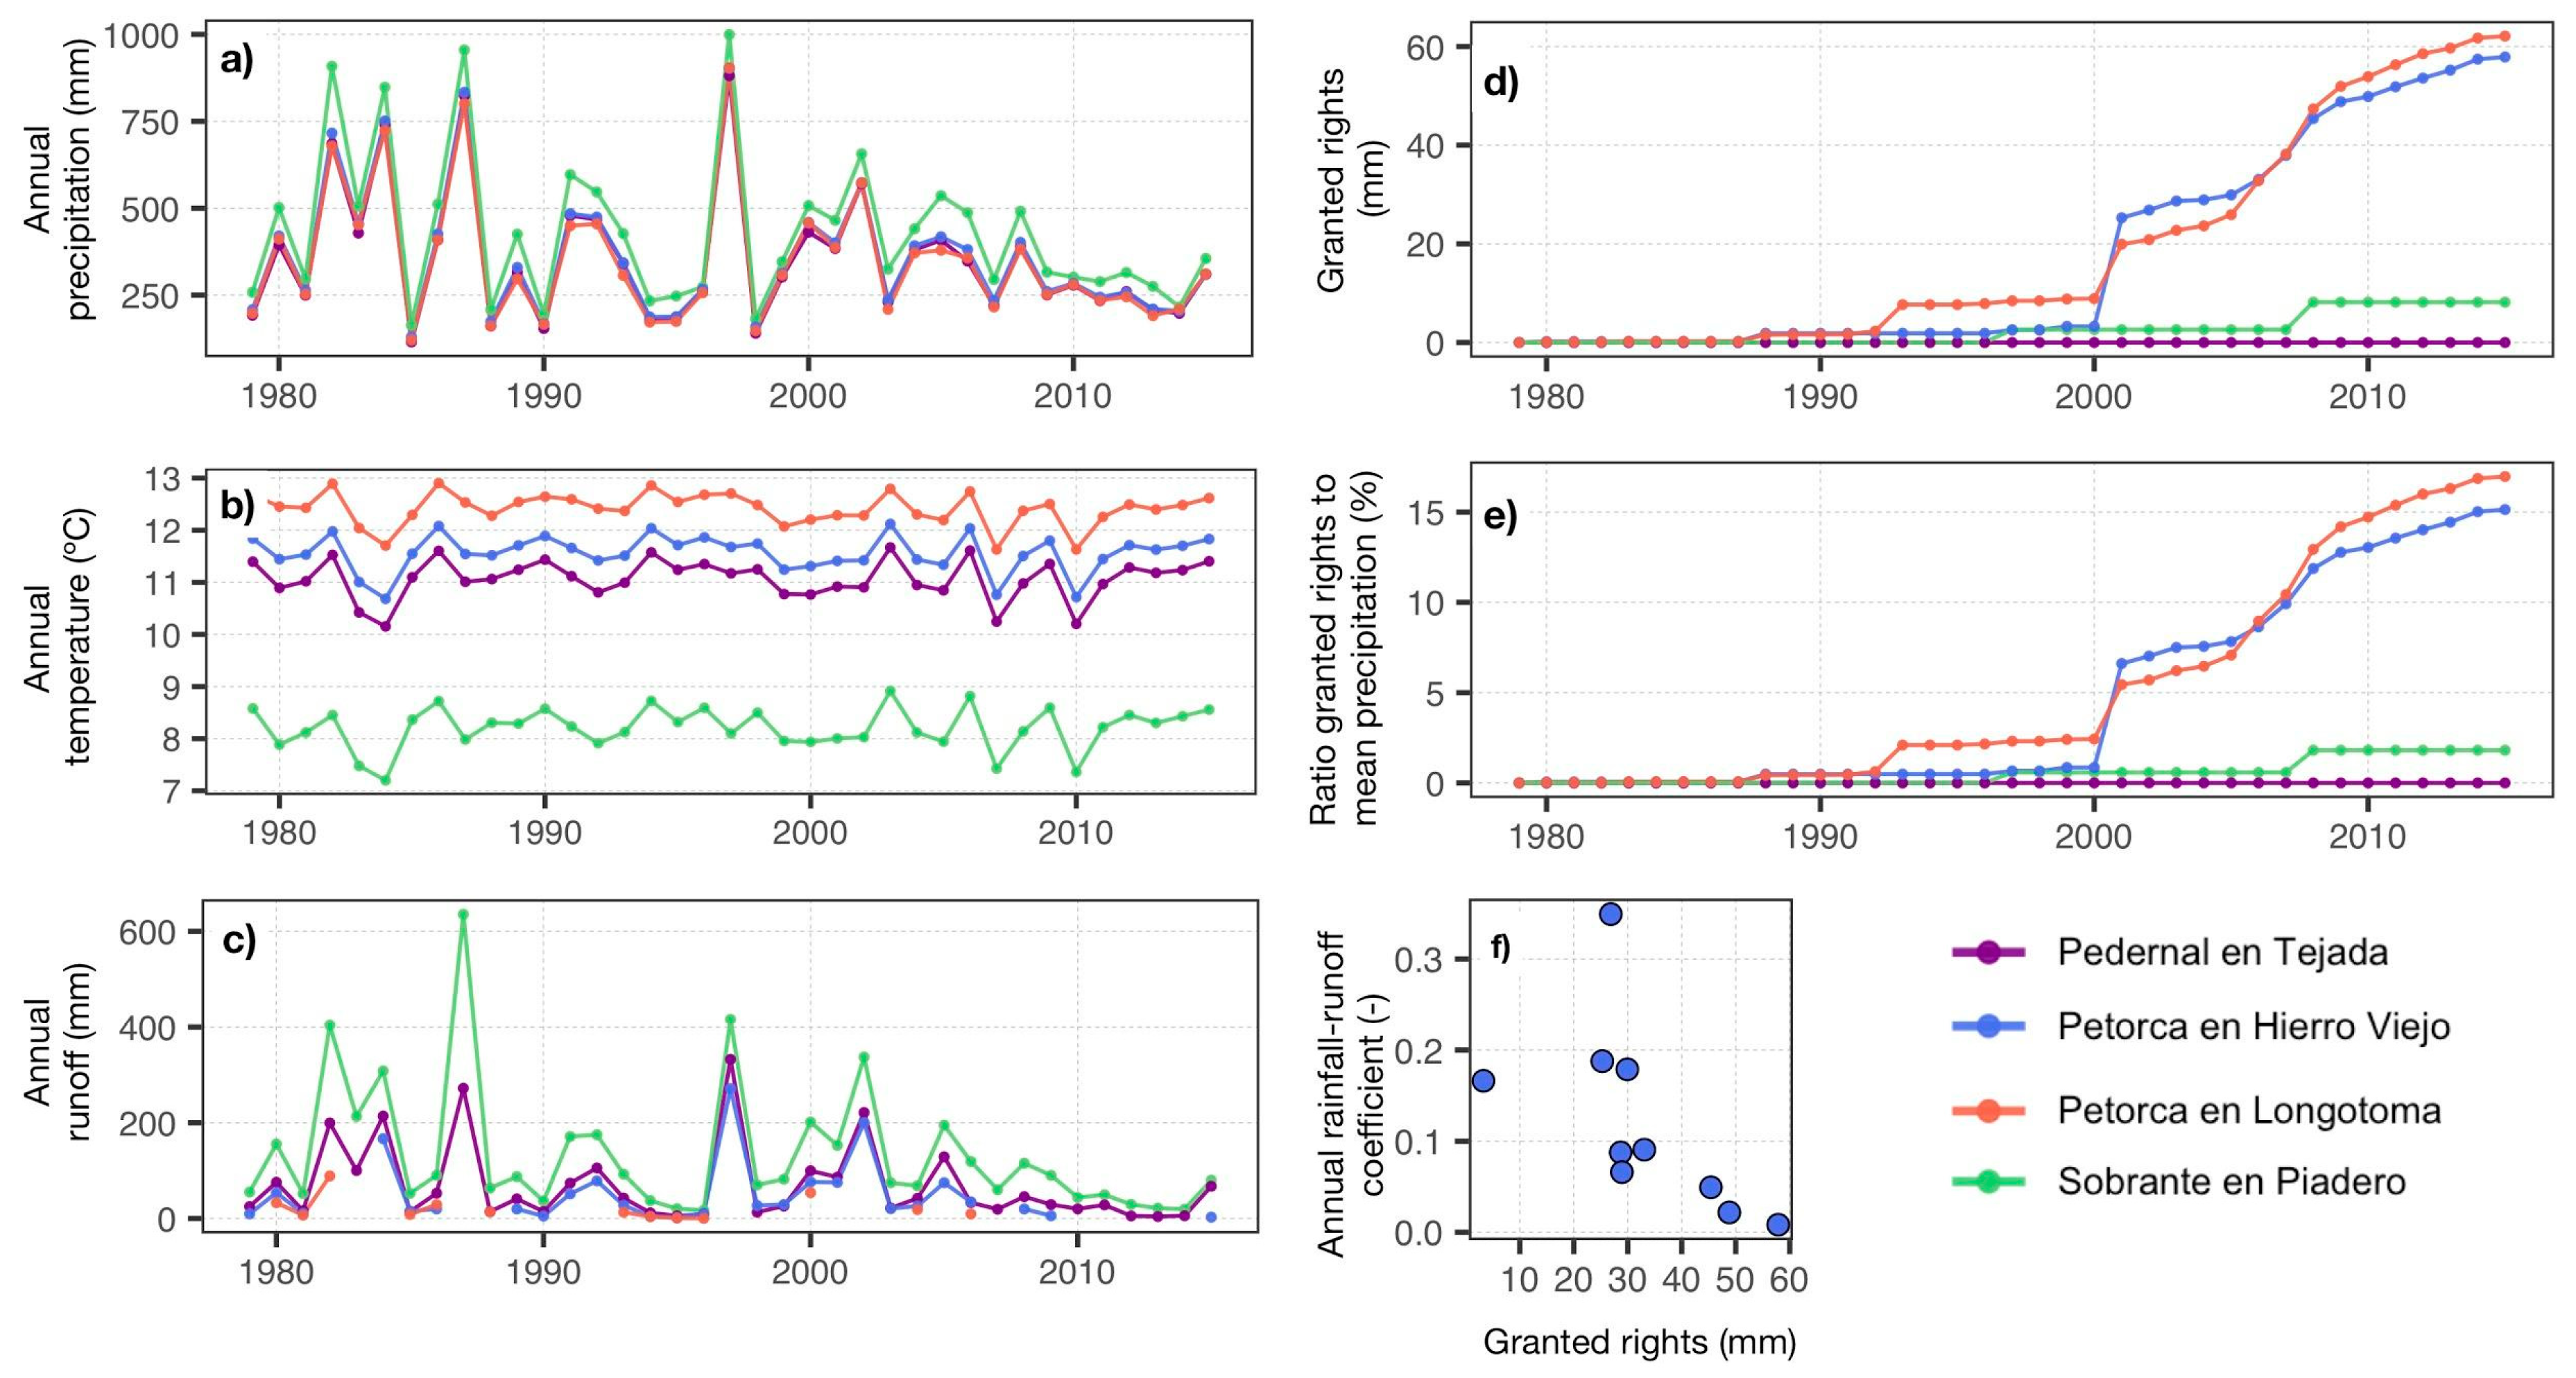
2.3. Hydrology and Water Allocation
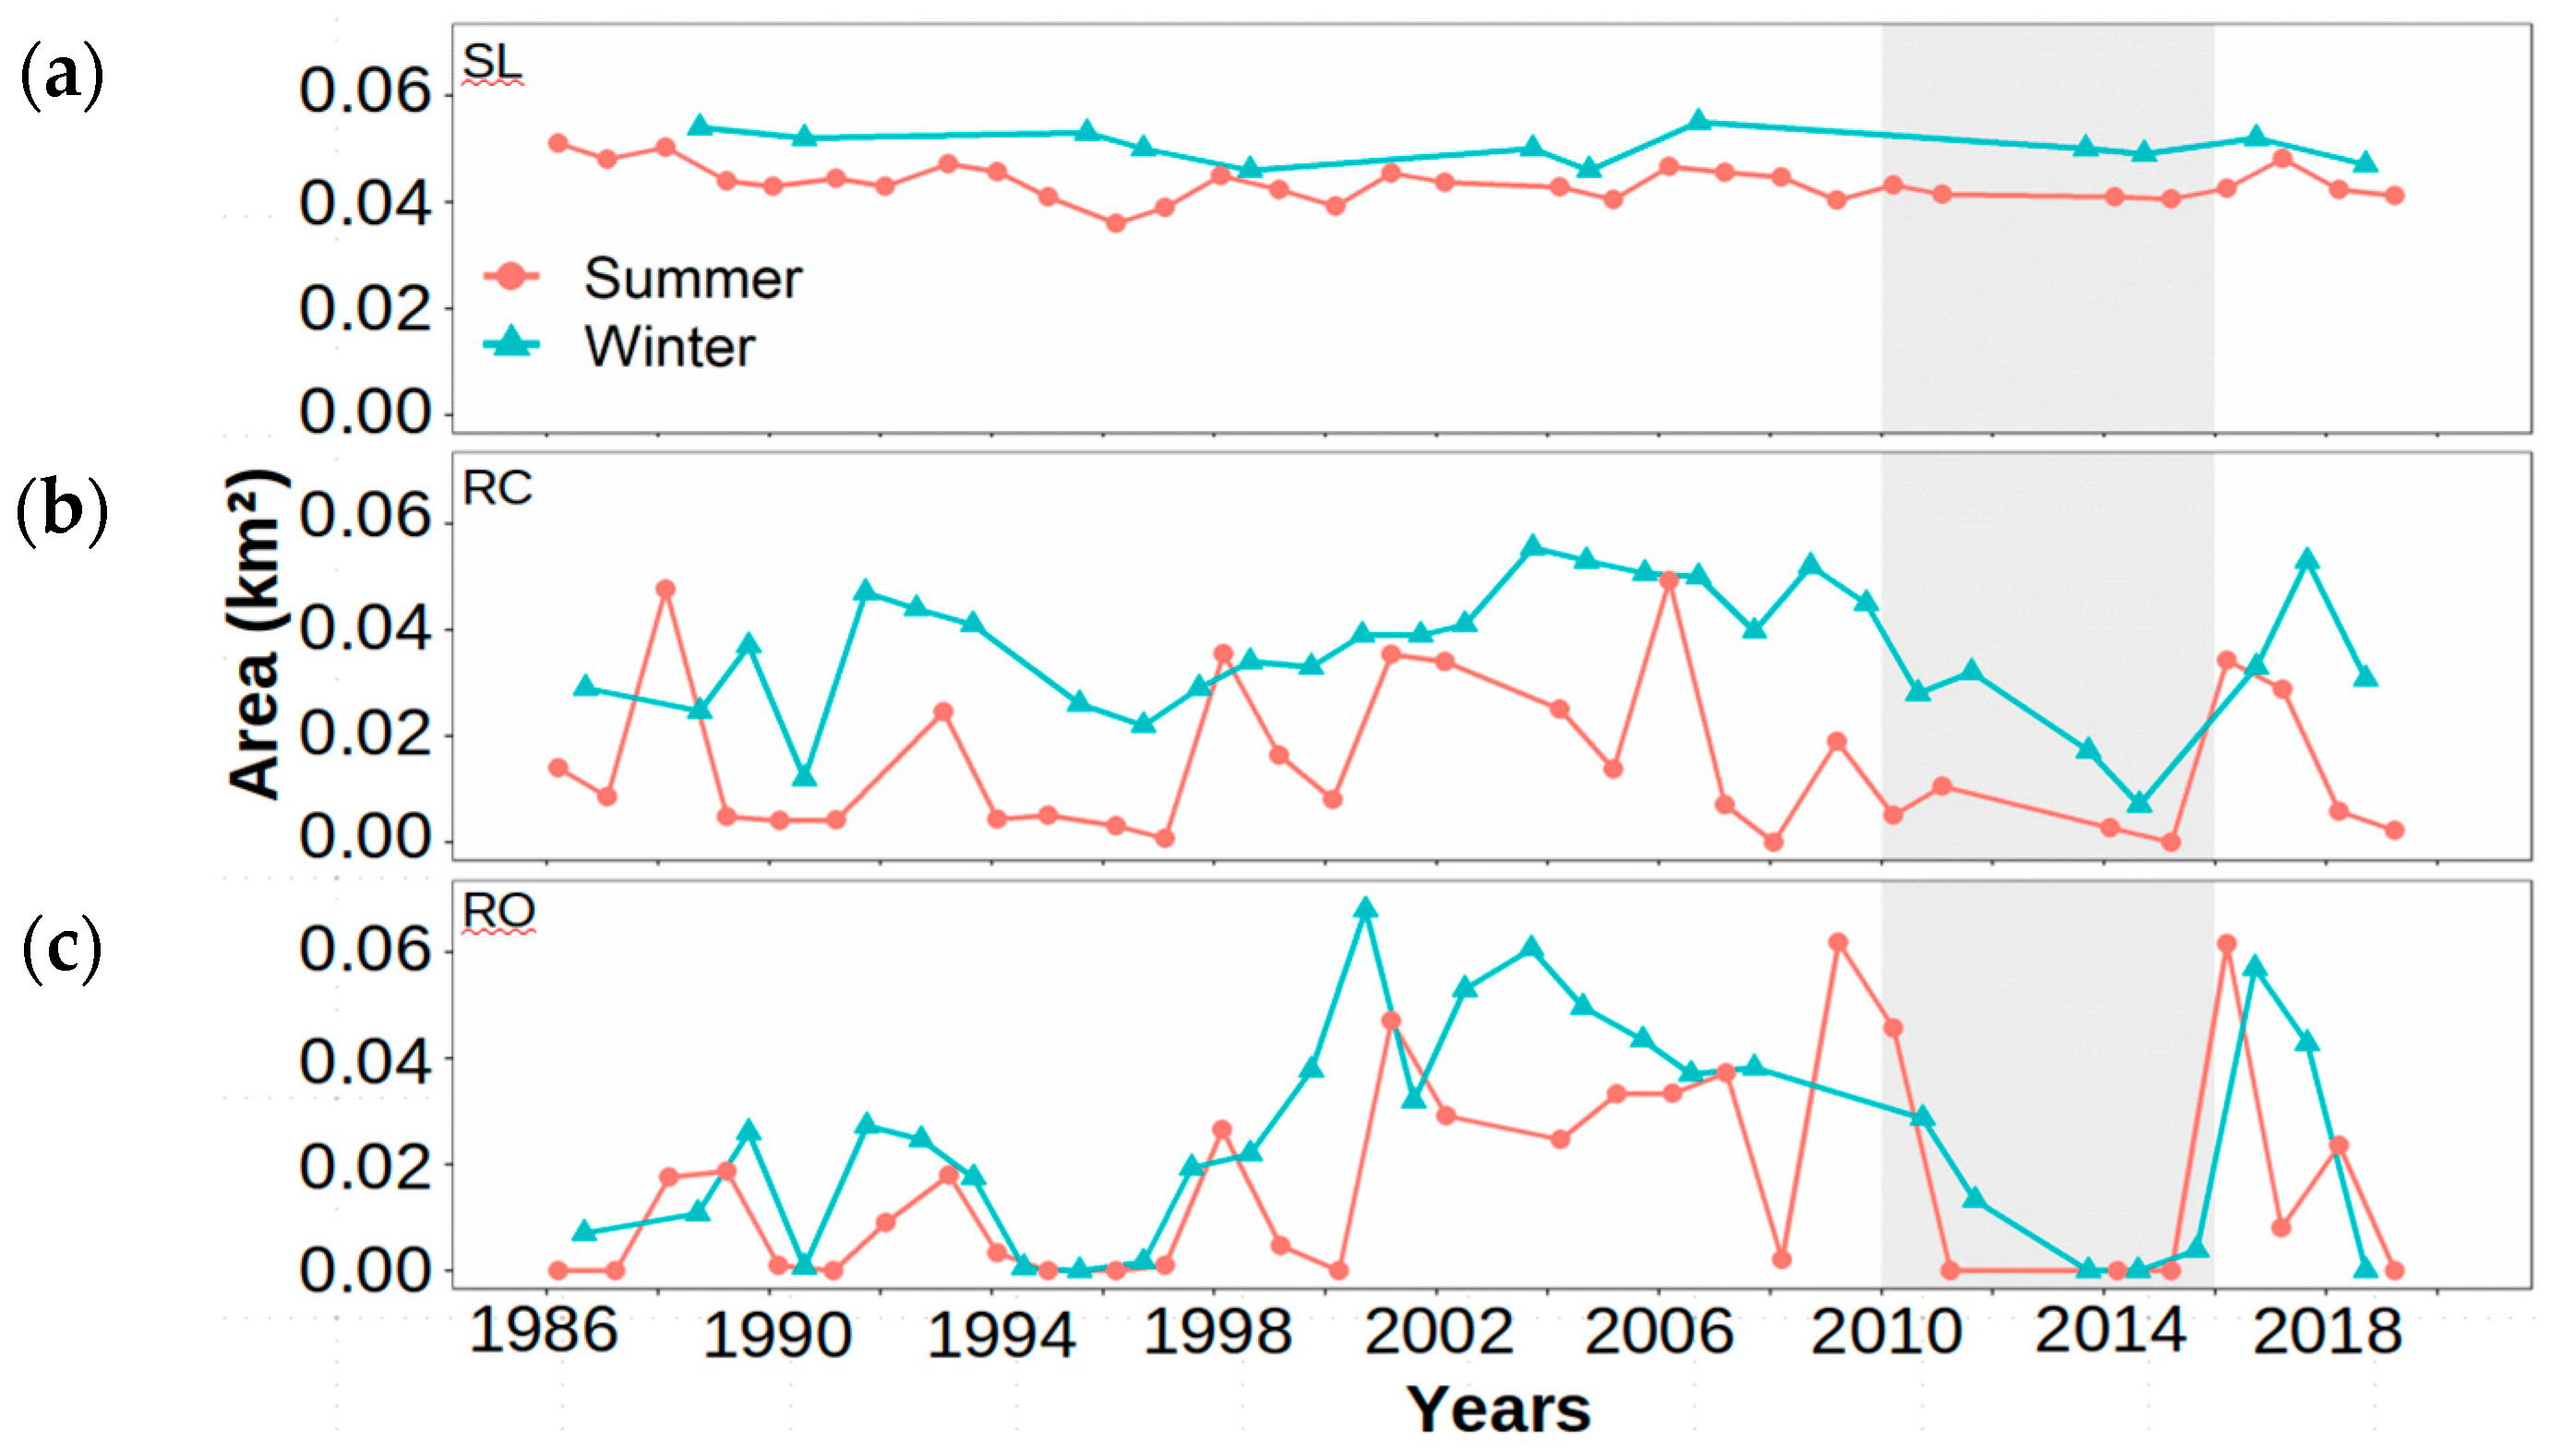
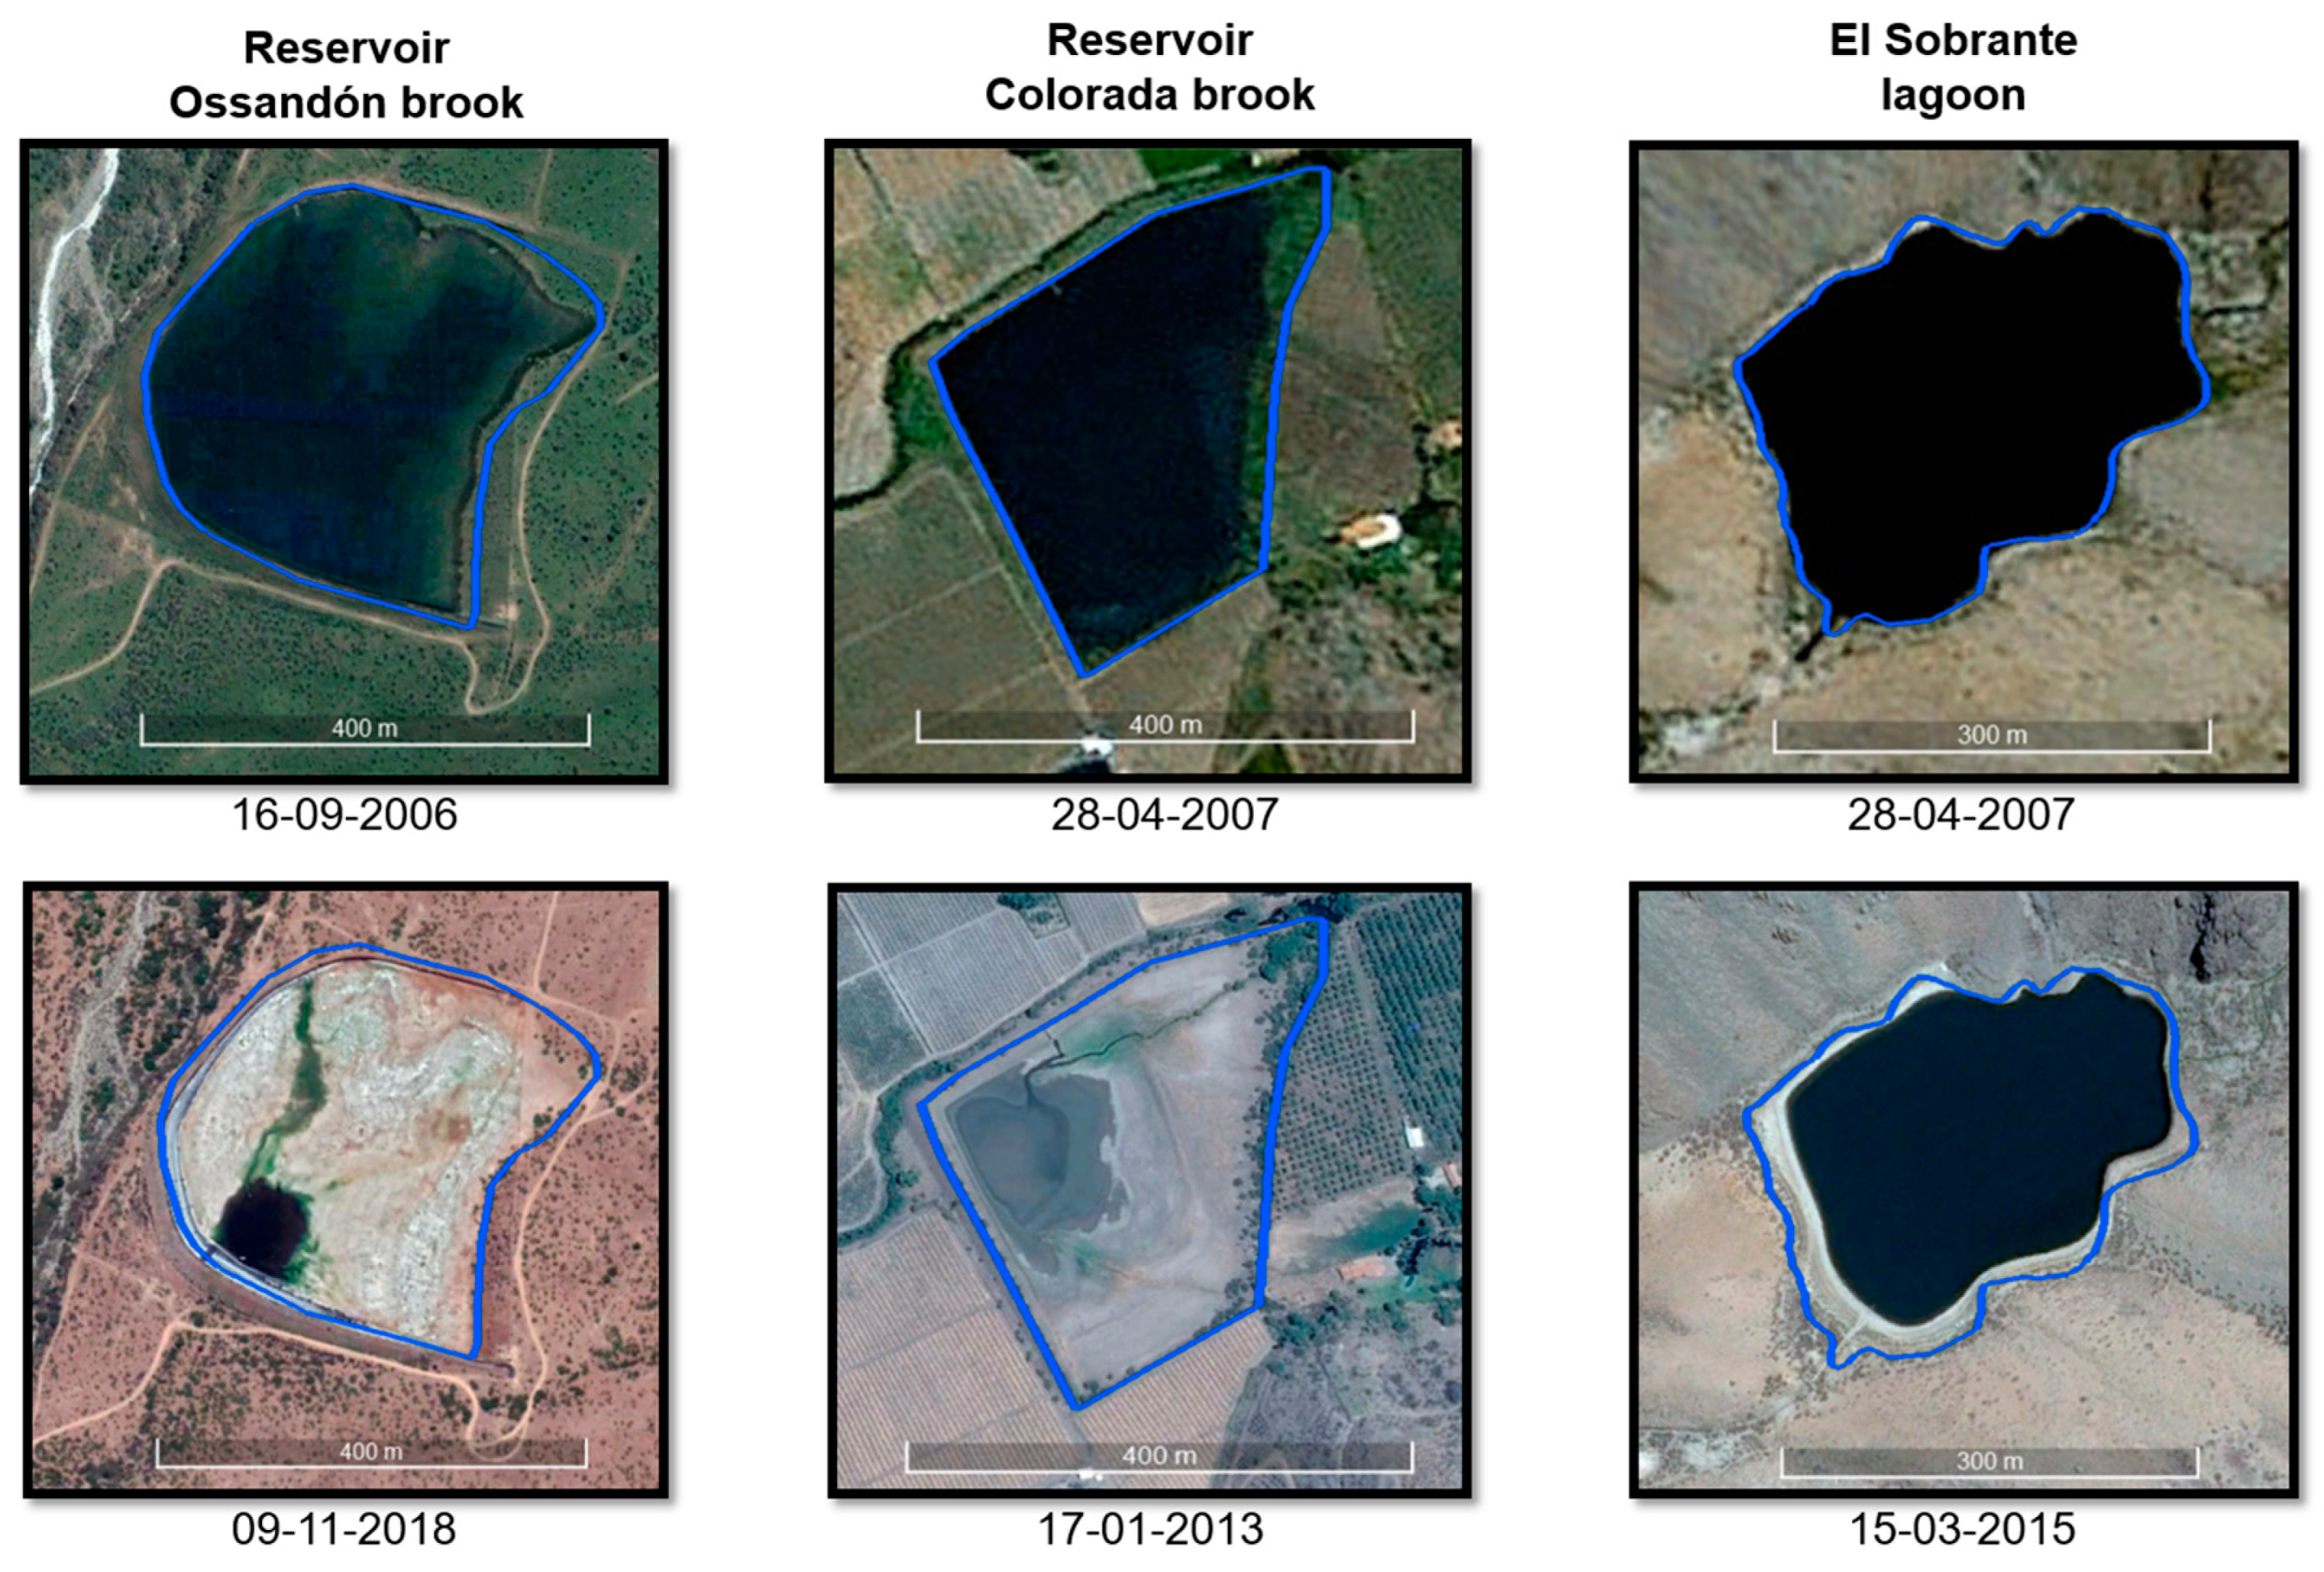
2.4. Time Series of Water Bodies Surface Area from Landsat Data
3. Results
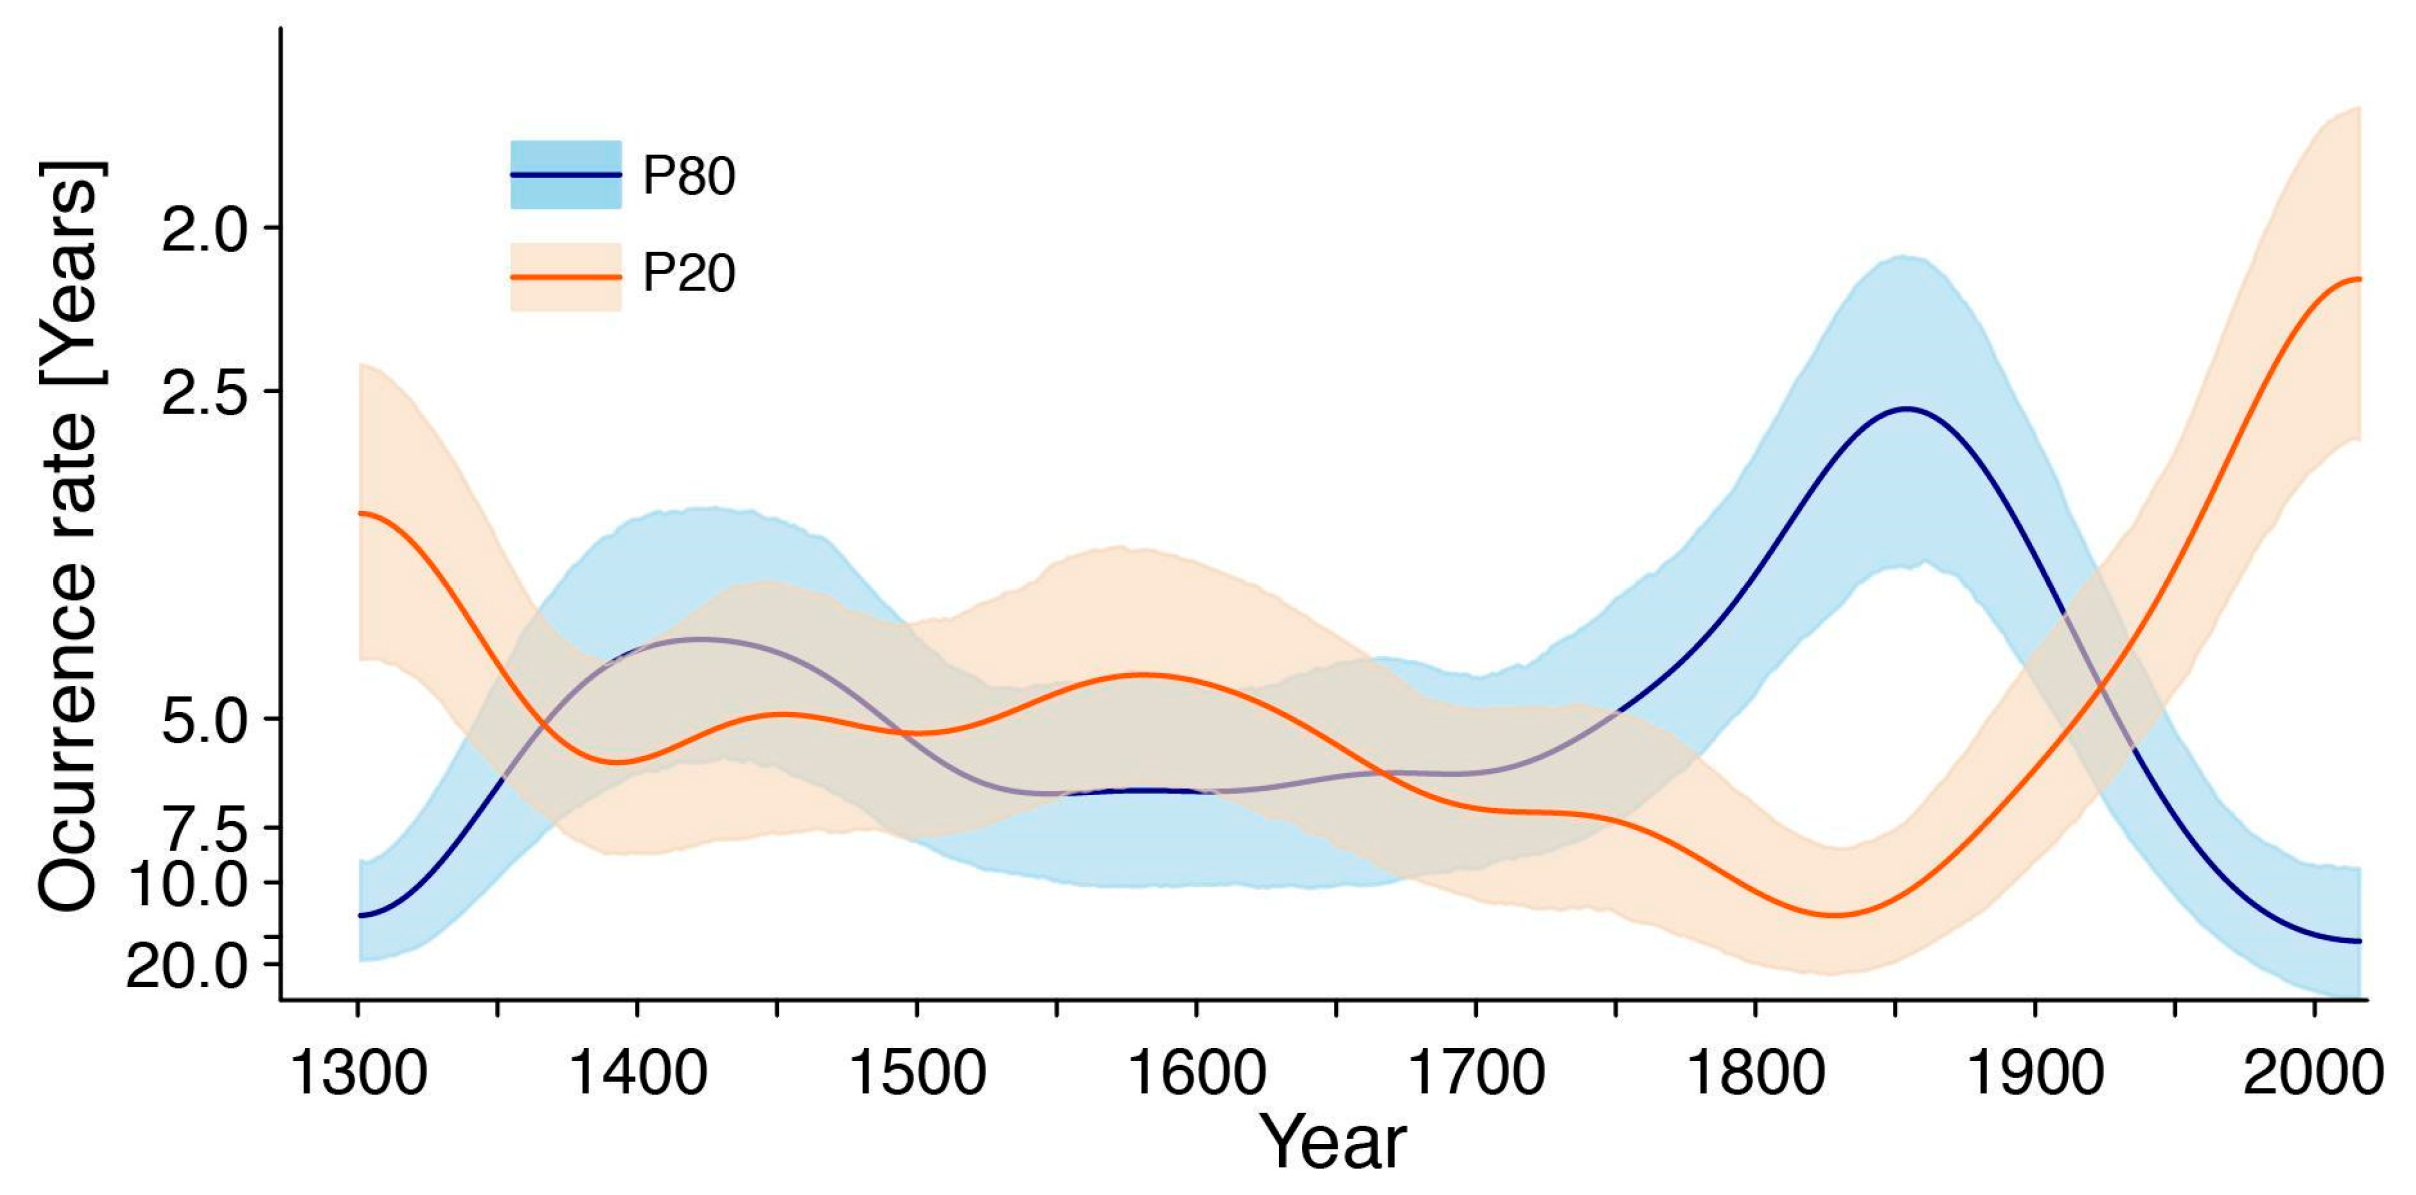
3.1. Multi-Year Mega-Drought in a Multi-Centennial Context
3.2. Hydrological Response over the Last Decades
4. Discussion
4.1. The 700 Years of Petorca River Streamflow Reconstruction and the Current MD
4.2. Hydrological Changes, Water Allocation, and Water Crisis
5. Conclusions
Supplementary Materials
Author Contributions
Funding
Acknowledgments
Conflicts of Interest
Appendix A

Appendix B

References and Note
- WRI. Aqueduct™ Water Risk Atlas (Aqueduct 3.0). 2019. Available online: https://www.wri.org/aqueduct/ (accessed on 15 January 2020).
- CEPAL. La economía del cambio climático en Chile: Síntesis. 2009. Available online: https://repositorio.cepal.org/bitstream/handle/11362/32827/1/S2009772_es.pdf (accessed on 5 October 2019).
- Government of Chile Intended Nationally Determined Contribution of Chile: Towards the Climate Agreement of Paris. 2015. Available online: https://www4.unfccc.int/sites/submissions/INDC/Published%20Documents/Chile/1/INDC%20Chile%20english%20version.pdf (accessed on 24 January 2020).
- Santibáñez, F.; Santibáñez, P.; Solis, L. Análisis de vulnerabilidad silvoagropecuaria en Chile frente a escenarios de Cambio Climático. In Análisis de Vulnerabilidad del Sector Silvoagropecuario, Recursos Hídricos y Edáficos de Chile Frente a Escenarios de Cambio Climático; Centro AGRIMED, Universidad de Chile: Santiago Metropolitan Region, Chile, 2008; Available online: Ftp://dgf.uchile.cl/pub/maisa/SOC28/Capitulo4_Vulnerabilidad_Silvoagropecuaria/IV%20-%20Vulnerabilidad%20-%20Informe%20Final.pdf (accessed on 6 October 2019).
- Ponce, R.; Blanco, M.; Giupponi, C. The economic impacts of climate change on the Chilean agricultural sector. A non-linear agricultural supply model. Chil. J. Agric. Res. 2014, 74, 404–412. [Google Scholar] [CrossRef] [Green Version]
- MMA. Plan de Acción Nacional de Cambio Climático 2017–2022. 2017. Available online: https://mma.gob.cl/wp-content/uploads/2017/07/plan_nacional_climatico_2017_2.pdf (accessed on 6 October 2019).
- CEPAL. La economía del cambio climático en Chile. 2012. Available online: https://repositorio.cepal.org/bitstream/handle/11362/35372/1/S2012058_es.pdf (accessed on 6 October 2019).
- Garreaud, R.D.; Alvarez-Garreton, C.; Barichivich, J.; Boisier, J.P.; Christie, D.; Galleguillos, M.; LeQuesne, C.; McPhee, J.; Zambrano-Bigiarini, M. The 2010–2015 megadrought in central Chile: Impacts on regional hydroclimate and vegetation. Hydrol. Earth Syst. Sci. 2017, 21, 6307–6327. [Google Scholar] [CrossRef] [Green Version]
- Boisier, J.P.; Rondanelli, R.; Garreaud, R.D.; Muñoz, F. Anthropogenic and natural contributions to the Southeast Pacific precipitation decline and recent megadrought in central Chile. Geophys. Res. Lett. 2016, 43, 413–421. [Google Scholar] [CrossRef] [Green Version]
- INE. Compendio Estadístico, Instituto Nacional de Estadísticas. 2017. Available online: www.ine.cl (accessed on 26 February 2020).
- INE. Censo Agropecuario. 2017b. Available online: www.ine.cl (accessed on 8 October 2019).
- Garreaud, R.D.; Boisier, J.P.; Rondanelli, R.; Montecinos, A.; Sepúlveda, H.H.; Veloso-Aguila, D. The Central Chile Mega Drought (2010–2018): A climate dynamics perspective. Int. J. Climatol. 2020, 40, 421–439. [Google Scholar] [CrossRef]
- Barría, P.; Rojas, M.; Moraga, P.; Muñoz, A.; Bozkurt, D.; Alvarez-Garreton, C. Anthropocene and streamflow: Long-term perspective of streamflow variability and water rights. Elem. Sci. Anth. 2019, 7, 2. [Google Scholar] [CrossRef]
- Bauer, C.J. Results of Chilean water markets: Empirical research since 1990. Water Resour. Res. 2004, 40, W09S06. [Google Scholar] [CrossRef]
- Hearne, R.; Donoso, G. Water Markets in Chile: Are They Meeting Needs? In Water Markets for the 21st Century. Global Issues in Water Policy; Easter, K., Huang, Q., Eds.; Springer: Dordrecht, The Netherlands, 2014; Volume 11, pp. 103–126. [Google Scholar] [CrossRef]
- Budds, J. Power, nature and neoliberalism: The political ecology of water in Chile. Singap. J. Trop. Geogr. 2004, 3, 322–342. [Google Scholar] [CrossRef]
- Panez-Pinto, A.; Mansilla-Quiñones, P.; Moreira-Muñoz, A. Agua, tierra y fractura sociometabólica del agronegocio. Actividad frutícola en Petorca, Chile. Bitácora Urbano Territorial 2018, 28, 153–160. [Google Scholar] [CrossRef]
- Budds, J. La demanda, evaluación y asignación del agua en el contexto de escasez: Un análisis del ciclo hidrosocial del valle del río La Ligua, Chile. Rev. Geogr. Norte Gd. 2012, 52, 167–184. [Google Scholar] [CrossRef] [Green Version]
- DGA. Definición sobre los derechos de aprovechamiento de aguas subterráneas provisionales en las Áreas de Restricción La Ligua y Petorca, Región de Valparaíso. Informe Técnico N°70. 2004. Available online: http://documentos.dga.cl/SUB5475.pdf (accessed on 8 October 2019).
- INDH. Informe misión de observación Provincia de Petorca. 2014. Available online: https://bibliotecadigital.indh.cl/bitstream/handle/123456789/774/Informe.pdf?sequence=1 (accessed on 8 October 2019).
- Nieto, I.; Velasco, M.; Pohl, N.; Muñoz, G. Water Issues in Chile: How Does a Dry River Sound? Leonardo 2018, 51, 189–190. [Google Scholar] [CrossRef]
- Fragkou, M.C.; Budds, J. Desalination and the disarticulation of water resources: Stabilising the neoliberal model in Chile. Trans. Inst. Br. Geogr. 2019, 1–16. [Google Scholar] [CrossRef]
- DGA. Informe Técnico: Evaluación del actual nivel de explotación de los acuíferos de La Ligua y Petorca. 2018. Available online: http://documentos.dga.cl/SUB5805.pdf (accessed on 22 November 2019).
- Panez-Pinto, A.; Faúndez-Vergara, R.; Mansilla-Quiñones, C. Politización de la crisis hídrica en Chile: Análisis del conflicto por el agua en la provincia de Petorca. Agua y Territorio 2017, 10, 131–148. [Google Scholar] [CrossRef]
- Guiloff, M.; Mewes, I.; Rivera, R.; Edwards, J. El derecho al agua como un Derecho Humano: El caso de la provincia de Petorca. In Centro de Derechos Humanos, Facultad de Derecho Universidad Diego Portales. Informe anual sobre Derechos Humanos en Chile 2013; Universidad Diego Portales: Santiago de Chile, Chile, 2013; Available online: http://www.derechoshumanos.udp.cl/wp/wp-content/uploads/2013/10/libro_DD_HH_capitulo7.pdf (accessed on 10 January 2020).
- Bolados García, P. Conflictos socio-ambientales/territoriales y el surgimiento de identidades post neoliberales (Valparaíso-Chile). Izquierdas 2016, 31, 102–129. [Google Scholar] [CrossRef] [Green Version]
- Bolados García, P.; Henríquez Olguín, F.; Ceruti Mahn, C.; Sánchez Cuevas, A. La eco-geo-política del agua: Una propuesta desde los territorios en las luchas por la recuperación del agua en la provincia de Petorca (Zona central de Chile). Revista Rupturas 2018, 8, 167–199. Available online: https://www.scielo.sa.cr/pdf/rup/v8n1/2215-2989-rup-8-01-159.pdf (accessed on 15 January 2020). [CrossRef] [Green Version]
- Aguilera-Betti, I.; Muñoz, A.A.; Klock-Barría, K.; Chávez, R.O.; Lastra, J.; González-Reyes, A.; Rojas-Badilla, M. Water availability changes during the 2010–2015 mega-drought in the Petorca basin: Response of agriculture, native vegetation and water access in one of the most drought affected basin of Chile. In Proceedings of the Hidden Geographies International Conference, Ljubljana, Slovenia, 29–31 August 2019. [Google Scholar]
- DGA. Evaluación de los Recursos Hídricos Superficiales de las Cuencas de los ríos Petorca y La Ligua, Va Región. 2006. Available online: http://documentos.dga.cl/SUP4496.pdf (accessed on 15 January 2020).
- MOP. Actualización Informe Evaluación de los Recursos Hídricos Superficiales de las Cuencas del río Petorca y río La Ligua, Región de Valparaíso. 2013. Available online: http://documentos.dga.cl/SUP5426.pdf (accessed on 15 January 2020).
- Productos grillados CR2MET. Available online: http://www.cr2.cl/datos-productos-grillados/ (accessed on 28 January 2020).
- Alvarez-Garreton, C.; Mendoza, P.A.; Boisier, J.P.; Addor, N.; Galleguillos, M.; Zambrano-Bigiarini, M.; Lara, A.; Puelma, C.; Cortes, G.; Garreaud, R.; et al. The CAMELS-CL dataset: Catchment attributes and meteorology for large sample studies—Chile dataset. Hydrol. Earth Syst. Sci. 2018, 22, 5817–5846. [Google Scholar] [CrossRef] [Green Version]
- Fritts, H.C. Tree Rings and Climate; Elsevier: London, UK, 1976. [Google Scholar] [CrossRef]
- Cook, E.R.; Briffa, K.R.; Jones, P.D. Spatial regression methods in dendroclimatology: A review and comparison of two techniques. Int. J. Climatol. 1994, 14, 379–402. [Google Scholar] [CrossRef]
- Weisberg, S. Applied Linear Regression; Wiley: Hoboken, NJ, USA, 1985. [Google Scholar]
- Ostrom, C.W. Time Series Analysis: Regression Techniques; Sage: Newcastle upon Tyne, UK, 1990; Volume 9. [Google Scholar]
- Sauchyn, D.; Vanstone, J.; Perez-Valdivia, C. Modes and Forcing of Hydroclimatic Variability in the Upper North Saskatchewan River Basin Since 1063. Can. Water Resour. J. 2011, 36, 205–217. [Google Scholar] [CrossRef]
- Muñoz, A.A.; González-Reyes, A.; Lara, A.; Sauchyn, D.; Christie, D.; Puchi, P.; Urrutia-Jalabert, R.; Toledo-Guerrero, I.; Aguilera-Betti, I.; Mundo, I.; et al. Streamflow variability in the Chilean Temperate-Mediterranean climate transition (35°S–42°S) during the last 400 years inferred from tree-ring records. Clim. Dyn. 2016, 47, 4051–4066. [Google Scholar] [CrossRef]
- Cowling, A.; Hall, P.; Phillips, M.J. Bootstrap Confidence Regions for the Intensity of a Poisson Point Process. J. Am. Stat. Assoc. 1996, 91, 1516–1524. [Google Scholar] [CrossRef]
- R Core Team. R: A Language and Environment for Statistical Computing; R Foundation for Statistical Computing: Vienna, Austria, 2019; Available online: https://www.R-project.org/ (accessed on 20 December 2019).
- Mann, M.E.; Lees, J.M. Robust estimation of background noise and signal detection in climatic time series. Clim. Change 1996, 33, 409–445. [Google Scholar] [CrossRef]
- Gorelick, N.; Hancher, M.; Dixon, M.; Ilyushchenko, S.; Thau, D.; Moore, R. Google Earth Engine: Planetary-scale geospatial analysis for everyone. Remote Sens. Environ. 2017, 202, 18–27. [Google Scholar] [CrossRef]
- USGS Earth Explorer Portal. Available online: https://earthexplorer.usgs.gov/ (accessed on 15 November 2019).
- McFeeters, S.K. The use of the Normalized Difference Water Index (NDWI) in the delineation of open water features. Int. J. Remote Sens. 1996, 17, 1425–1432. [Google Scholar] [CrossRef]
- Mundo, I.A.; Masiokas, M.H.; Villalba, R.; Morales, M.S.; Neukom, R.; Le Quesne, C.; Urrutia, R.B.; Lara, A. Multi-century tree-ring based reconstruction of the Neuquén River streamflow, northern Patagonia, Argentina. Clim. Past 2012, 8, 815–829. [Google Scholar] [CrossRef] [Green Version]
- Lara, A.; Villalba, R.; Urrutia, R. A 400-year tree-ring record of the Puelo River summer–fall streamflow in the Valdivian Rainforest eco-region, Chile. Clim. Chang. 2008, 86, 331–356. [Google Scholar] [CrossRef]
- Lara, A.; Bahamondez, A.; González-Reyes, A.; Muñoz, A.A.; Cuq, E.; Ruiz-Gómez, C. Reconstructing streamflow variation of the Baker River from tree-rings in Northern Patagonia since 1765. J. Hydrol. 2015, 529, 511–523. [Google Scholar] [CrossRef]
- Urrutia, R.B.; Lara, A.; Villalba, R.; Christie, D.A.; Le Quesne, C.; Cuq, A. Multicentury tree ring reconstruction of annual streamflow for the Maule River watershed in south central Chile. Water Resour. Res. 2011, 47, W06527. [Google Scholar] [CrossRef] [Green Version]
- Ferrero, M.E.; Villalba, R.; De Membiela, M.; Ferri Hidalgo, L.; Luckman, B.H. Tree-ring based reconstruction of Río Bermejo streamflow in subtropical South America. J. Hydrol. 2015, 525, 572–584. [Google Scholar] [CrossRef]
- Barria, P.; Peel, M.C.; Walsh, K.J.E.; Muñoz, A. The first 300-year streamflow reconstruction of a high-elevation river in Chile using tree rings. Int. J. Climatol. 2018, 38, 436–451. [Google Scholar] [CrossRef]
- Fernández, A.; Muñoz, A.; González-Reyes, Á.; Aguilera-Betti, I.; Toledo, I.; Puchi, P.; Sauchyn, D.; Crespo, S.; Frene, C.; Mundo, I.; et al. Dendrohydrology and water resources management in south-central Chile: Lessons from the Río Imperial streamflow reconstruction. Hydrol. Earth Syst. Sci. 2018, 22, 2921–2935. [Google Scholar] [CrossRef] [Green Version]
- Fritts, H.C. Reconstructing Large-Scale Climatic Patterns from Tree-Ring Data; University of Arizona Press: Tucson, AZ, USA, 1991. [Google Scholar]
- Hughes, M.K.; Swetnam, T.W.; Diaz, H.F. (Eds.) Dendroclimatology. In Developments in Paleoenvironmental Research; Springer: Berlin, Germany, 2011. [Google Scholar] [CrossRef]
- González-Reyes, Á.; McPhee, J.; Christie, D.A.; Le Quesne, C.; Szejner, P.; Masiokas, M.H.; Villalba, R.; Muñoz, A.A.; Crespo, S. Spatiotemporal Variations in Hydroclimate across the Mediterranean Andes (30°–37°S) since the Early Twentieth Century. J. Hydrometeorol. 2017, 18, 1929–1942. [Google Scholar] [CrossRef]
- Le Quesne, C.; Stahle, D.W.; Cleaveland, M.K.; Therrell, M.D.; Aravena, J.C.; Barichivich, J. Ancient Austrocedrus Tree-Ring Chronologies Used to Reconstruct Central Chile Precipitation Variability from a.d. 1200 to 2000. J. Clim. 2006, 19, 5731–5744. [Google Scholar] [CrossRef] [Green Version]
- Le Quesne, C.; Acuña, C.; Boninsegna, J.A.; Rivera, A.; Barichivich, J. Long-term glacier variations in the Central Andes of Argentina and Chile, inferred from historical records and tree-ring reconstructed precipitation. Palaeogeogr. Palaeoclimatol. Palaeoecol. 2009, 281, 334–344. [Google Scholar] [CrossRef]
- Masiokas, M.H.; Cara, L.; Villalba, R.; Pitte, P.; Luckman, B.H.; Toum, E.; Christie, D.A.; Le Quesne, C.; Mauget, S. Streamflow variations across the Andes (18°–55°S) during the instrumental era. Sci. Rep. 2019, 9, 1–13. [Google Scholar] [CrossRef] [PubMed]
- Saavedra, F.A.; Kampf, S.K.; Fassnacht, S.R.; Sibold, J.S. Changes in Andes snow cover from MODIS data, 2000–2016. Cryosphere 2018, 12, 1027–1046. [Google Scholar] [CrossRef] [Green Version]
- Saavedra, F.A.; University of Playa Ancha, Valparaíso, Chile. Personal communication, 2019.
- Osses Sandoval, P. Impacto de la megasequía 2010–2015 Sobre los Niveles de Aguas Subterráneas en las Cuencas de los ríos Petorca y La Ligua, Región de Valparaíso. Bachelor’s Thesis, Pontifical Catholic University of Valparaíso, Valparaíso, Chile, November 2019. [Google Scholar]
- Vilches, C.; Water Resources Office, Municipality of Petorca, Chile. Personal communication, 2020.
- Valdés-Pineda, R.; García-Chevesich, P.; Valdés, J.B.; Pizarro-Tapia, R. The First Drying Lake in Chile: Causes and Recovery Options. Water 2020, 12, 290. [Google Scholar] [CrossRef] [Green Version]
- Chávez, R.O.; Pontifical Catholic University of Valparaíso, Valparaíso, Chile. Personal communication, 2020.
- Appeal Court ruling. Protection Number-9709-2019, of the Fifth Chamber of the Court of Appeals of Valparaíso. 2019.
- Social Water Conflicts Portal. Available online: http://www.derechoalagua.cl/mapa-de-conflictos/ (accessed on 30 January 2020).
- Frene, C.; Molina, C.; Santibáñez, J.; Ojeda, G.; Donoso, C.; Sanzana, J.; Andrade, P.; Núñez-Ávila, M. Agua en Chile: Diagnósticos Territoriales y Propuestas para Enfrentar la Crisis; América Ltda: Santiago de Chile, Chile, 2016. [Google Scholar]
- Donoso, G. (Ed.) Water Policy in Chile; Global Issues in Water Policy Series; Springer: Berlin, Germany, 2018; 224p, ISBN 978-3-319-76701-7. [Google Scholar]
- Christensen, J.H.; Hewitson, B.; Busuioc, A.; Chen, A.; Gao, X.; Held, R.; Jones, R.; Kolli, R.K.; Kwon, W.K.; Laprise, R.; et al. Regional climate projections. In Climate Change, 2007: The Physical Science Basis. Contribution of Working group I to the Fourth Assessment Report of the Intergovernmental Panel on Climate Change; University Press: Cambridge, UK, 2007; Volume 11, pp. 847–940. [Google Scholar]
- Mariotti, A.; Pan, Y.; Zeng, N.; Alessandri, A. Long-term climate change in the Mediterranean region in the midst of decadal variability. Clim. Dyn. 2015, 44, 1437–1456. [Google Scholar]
- Polade, S.D.; Gershunov, A.; Cayan, D.R.; Dettinger, M.D.; Pierce, D.W. Precipitation in a warming world: Assessing projected hydro-climate changes in California and other Mediterranean climate regions. Sci. Rep. 2017, 7, 1–10. [Google Scholar] [CrossRef]
- Mbow, H.O.P.; Reisinger, A.; Canadell, J.; O’Brien, P. Special Report on Climate Change, Desertification, Land Degradation, Sustainable Land Management, Food Security, and Greenhouse Gas Fluxes in Terrestrial Ecosystems (SR2); IPCC: Geneva, Switzerland, 2017. [Google Scholar]


| Site Name and Code | Coordinates | Elevation | Dating | Tree Ring Series | Series Intercorrelation |
|---|---|---|---|---|---|
| El Asiento (ELA) | 32°39.073’ S, 70°48.857’ W | 1700–1900 | 451–2017 | 222 | 0.691 |
| Name | Area km2 | Outlet Elevation m a.s.l. | Catchment Mean Elevation m a.s.l. | Mean Slope m/km | Annual Precipitation mm |
|---|---|---|---|---|---|
| Petorca en Longotoma | 1969.5 | 9 | 1296 | 206.3 | 285 |
| Petorca en Hierro Viejo | 947.2 | 412 | 1782 | 216.1 | 304 |
| Pedernal en Tejada | 56.1 | 1454 | 1625 | 186.4 | 284 |
| Sobrante en Piadero | 241.1 | 1312 | 2610 | 226.2 | 389 |
| Annual | Quinquennial | Decadal | |||||||||
|---|---|---|---|---|---|---|---|---|---|---|---|
| Low | High | Low | High | Low | High | ||||||
| Year | [m3/s] | Year | [m3s−1] | Period | [m3s−1] | Period | [m3s−1] | Period | [m3s−1] | Period | [m3s−1] |
| 1344 | 0.0575 | 1468 | 4.0499 | 2011–2015 | 0.2068 | 1466–1470 | 2.6681 | 2006–2015 | 0.2716 | 1463–1472 | 1.9753 |
| 1547 | 0.0614 | 1827 | 3.4060 | 1300–1304 | 0.2126 | 1653–1657 | 2.1828 | 1570–1579 | 0.2917 | 1836–1845 | 1.6650 |
| 1863 | 0.0639 | 1593 | 3.1976 | 1341–1345 | 0.2313 | 1825–1829 | 2.1049 | 1337–1346 | 0.3237 | 1897–1906 | 1.5509 |
| 1304 | 0.0680 | 1655 | 3.1801 | 1547–1551 | 0.2378 | 1834–1838 | 2.0941 | 1622–1631 | 0.3545 | 1652–1661 | 1.5224 |
| 1924 | 0.0697 | 1374 | 3.1381 | 1456–1460 | 0.2432 | 1898–1902 | 1.8331 | 1965–1974 | 0.3653 | 1588–1597 | 1.3674 |
© 2020 by the authors. Licensee MDPI, Basel, Switzerland. This article is an open access article distributed under the terms and conditions of the Creative Commons Attribution (CC BY) license (http://creativecommons.org/licenses/by/4.0/).
Share and Cite
Muñoz, A.A.; Klock-Barría, K.; Alvarez-Garreton, C.; Aguilera-Betti, I.; González-Reyes, Á.; Lastra, J.A.; Chávez, R.O.; Barría, P.; Christie, D.; Rojas-Badilla, M.; et al. Water Crisis in Petorca Basin, Chile: The Combined Effects of a Mega-Drought and Water Management. Water 2020, 12, 648. https://doi.org/10.3390/w12030648
Muñoz AA, Klock-Barría K, Alvarez-Garreton C, Aguilera-Betti I, González-Reyes Á, Lastra JA, Chávez RO, Barría P, Christie D, Rojas-Badilla M, et al. Water Crisis in Petorca Basin, Chile: The Combined Effects of a Mega-Drought and Water Management. Water. 2020; 12(3):648. https://doi.org/10.3390/w12030648
Chicago/Turabian StyleMuñoz, Ariel A., Karin Klock-Barría, Camila Alvarez-Garreton, Isabella Aguilera-Betti, Álvaro González-Reyes, José A. Lastra, Roberto O. Chávez, Pilar Barría, Duncan Christie, Moises Rojas-Badilla, and et al. 2020. "Water Crisis in Petorca Basin, Chile: The Combined Effects of a Mega-Drought and Water Management" Water 12, no. 3: 648. https://doi.org/10.3390/w12030648