Effects of Dam Regulation on the Hydrological Alteration and Morphological Evolution of the Volta River Delta

1
State Key Laboratory of Water Environment Simulation & School of Environment, Beijing Normal University, Beijing 100875, China
2
Tang Scholar, Beijing Normal University, Beijing 100875, China
*
Author to whom correspondence should be addressed.
Water 2020, 12(3), 646; https://doi.org/10.3390/w12030646
Submission received: 16 January 2020
/
Revised: 25 February 2020
/
Accepted: 27 February 2020
/
Published: 28 February 2020
(This article belongs to the Special Issue Techniques and Applications in Water Science and Engineering: Selected Papers from the Inaugural International Symposium on Water Modelling (iSymWater2019))
Abstract
:The Volta River in West Africa is one of the most regulated rivers influenced by dams in the world, and the regulation has resulted in substantial impacts on the hydrological alteration and morphological evolution of the Volta River Delta. However, comprehensive analyses of the relevant effects are still lacking to date. In this study, inter-annual variations of river discharge and sediment load for pre- and post-Akosombo Dam periods (1936 to 2018) were analyzed through simple regression and Mann–Kendall (MK) trend analysis whereas the intra-annual variations were dictated by the non-uniformity and regulated coefficients. The shoreline changes were further evaluated using Landsat remote sensing images (1972 to 2018) to explore the effects of hydrological alteration on the morphological evolution of the Volta River Delta. Hydrological analyses show that the inter- and intra-annual variations are much higher in the pre-dam period, suggesting the substantial regulation of the Akosombo Dam on the Volta River. The dam regulation has more significant effects on the sediment load delivered to the delta than the river discharge, which decreased by 92.32% and 23.23%, respectively. Morphological analyses show that the progradation-erosion of the Volta River Delta constantly fluctuates within a relatively small range (maximum 0.5%) after the 1970s. The relationship between the variations of the delta area and sediment load implicates that a quasi-equilibrium state may have been established at the Volta River Delta, given the current sediment load. Our findings provide references for the future regulation and restoration of the Volta River Delta.
1. Introduction
Deltas host more than half a billion of the world’s population and one of the most productive ecosystems on Earth [1,2]. However, the world’s deltas are subject to continuous climate change and anthropogenic activities, such as sea-level rise, subsidence, and reduced sediment load, etc. [1,3,4,5,6]. Among these natural and anthropogenic stressors, dam regulations that lead to hydrological alteration have caused substantial impacts on the morphological evolution of the world’s deltas [7,8,9,10,11]. Understanding the potential effects of dam regulations on the affected deltas’ hydrology and morphology thus becomes a vital task in their protection and restoration [12,13].
The Volta River in West Africa is considered one of the most regulated rivers by dams worldwide [8,14,15,16]. The Volta River Delta was richly supplied with sediments from the Volta River [17]. However, the construction of the Akosombo Dam in 1964 has intercepted and reduced significantly fluvial sediment supply from the river with a decreasing rate of 90% [17,18]. The drastically reduced sediment supply has caused severe adverse effects on the river delta [19], e.g., coastal erosion [20]. Furthermore, the reduction in fluvial sediment supply to the Volta River Delta has resulted in the regime shift of the Volta River Delta from the river-dominated delta to wave-dominated delta [20,21]. In addition to the reduction of the fluvial sediment input, the high alongshore sediment transport has also exacerbated the erosion of the delta [20].
Considering the extent of dam regulations on the Volta River Delta and the economic and ecological importance of the area [20,22], significant attention has been given to the delta [17,18,20,23,24]. However, apart from Ly (1980) [18] who quantitatively analyzed the sediment retention by the Akosombo Dam and its impacts on the shoreline of the delta several decades ago, little research has been conducted to quantify the subsequent influences of the dam regulations on the hydrological alterations and morphological evolution of the Volta River Delta.
In this study, the hydrological alterations were analyzed using monthly and annual river discharge and sediment load from 1936 to 2018. The inter-annual variations for pre- and post-Akosombo Dam periods were analyzed using simple regression and the Mann–Kendall (MK) trend analysis in Section 3.1. The intra-annual variations represented by the non-uniformity coefficient (Cy) and the regulated coefficient (Cr) were calculated for the pre-Akosombo (1936–1964), the pre-Kpong (1970 to 1982) and the post-Kpong (1983–2018) Dam periods to examine the impacts of dam regulation during different periods in Section 3.2. Available Landsat remote sensing images of the Volta River Delta from 1972 to 2018 were interpreted to analyze the associated morphological evolution in Section 3.3. The paper is concluded with a summary of the major findings of the study.
2. Methodology
2.1. Study Site
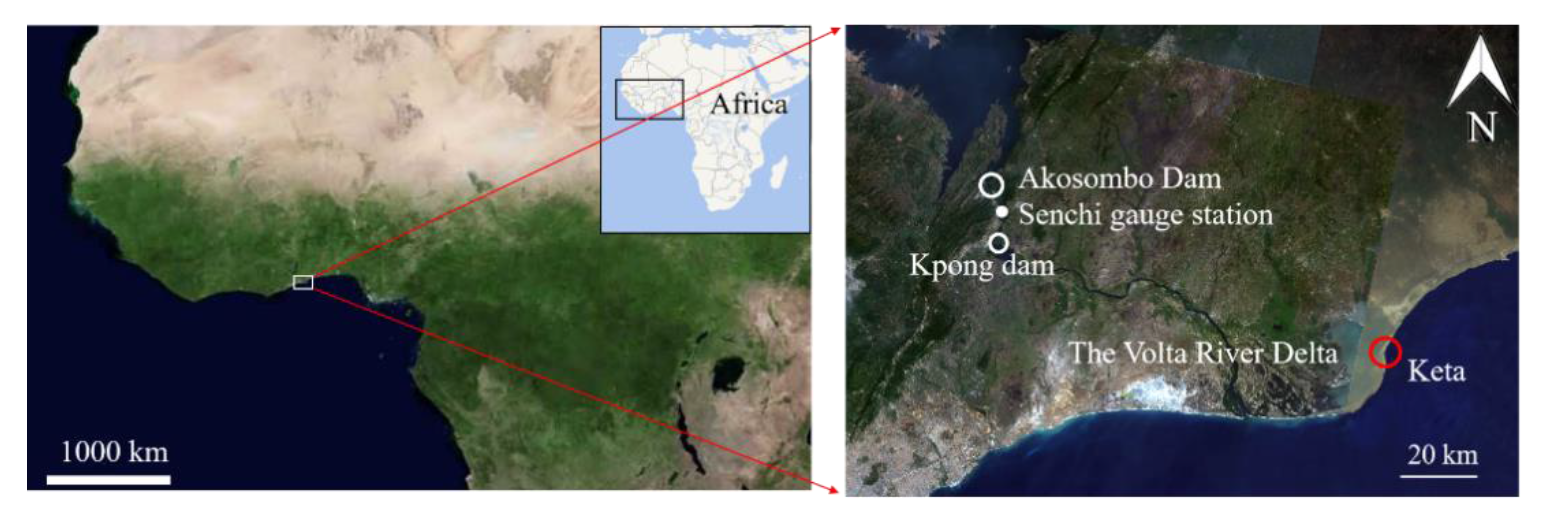
The Volta River Delta is the coastal plain of the Volta River, which ranges from 5°25′ to 6°20′ N and 0°4′ to 1°10′ E along the eastern coast of Ghana with a total area of approximately 4562 km2 in Ghana [22] and an active portion near the river mouth of approximately 2430 km2 [25], forming the interface between the Volta River and the Atlantic Ocean (Figure 1). As one of the largest river deltas in West Africa, the Volta River Delta is a sanctuary for about 80% of migratory birds that stop-over in Ghana, and hosts important species in its lagoon and mangrove habitats [20]. In addition to its ecological functions, the delta is also of crucial socio-economic importance [26] with diverse economic activities comprising agriculture, fishery, salt harvesting, and tourism [22].
The Akosombo and Kpong Dams were built on the Volta River in 1964 and 1982, respectively. The two dams generate about 1060 MW of hydropower, providing 80% of Ghana’s electric power needs. The Akosombo Dam is about 100 km upstream from the river mouth along the river channel, and the Kpong Dam is 24 km downstream of Akosombo along the river channel. The reservoir capacity and area for the Akosombo Dam are 147,960 million m3 and 8482.250 km2, whereas those for the Kpong Dam are 200 million m3 and 25.2 km2.
2.2. Datasets
Annual river discharge data of the Volta River (1936 to 1961) downstream of the Akosombo Dam at the Senchi gauge station (Figure 1) were provided by the Water Resources Institute of the Council for Scientific and Industrial Research (CSIR-WRI), Ghana. Monthly river discharge data downstream of Akosombo Dam (1970 to 2018) and Kpong (1984 to 2018) dam at the Akosombo and Kpong gauge station (Figure 1), respectively, were acquired from the Volta River Authority, Ghana. The average monthly river discharge (1936 to 1961) before the construction of the Akosombo Dam was obtained from CSIR-WRI, Ghana. We further calculated monthly ratios from the average monthly river discharge data for the pre-dam period and then derived the monthly river discharge data for the pre-dam period by dividing the annual discharge according to the ratios of the river discharge for different months. As directly measured sediment data on the Volta River was unavailable, the sediment rating curve [17] was used to estimate the sediment load from the associated river discharge (details elaborated in Section 2.3).
High-quality Landsat remote sensing data of the Volta River Delta coastline from a Multispectral Scanner (MSS), a Thematic Mapper (TM), and an Enhanced Thematic Mapper (ETM+) were downloaded from USGS (https://earthexplorer.usgs.gov). Two separate sets of remote sensing images that cover the whole Volta River Delta, i.e., path 192, row 56 and path 193, row 56 for TM and ETM images (or path 206, row 56 and path 207, row 56 for MSS images), with least possible time interval as well as minimum cloud cover along the shoreline were selected for each year. Table 1 shows relevant information on the acquisition dates, image type, resolution, and band type of remote sensing images. Notably, the two dates in each acquisition date cell in Table 1 are for path 192, row 56 and path 193, row 56 for TM and ETM images (or path 206, row 56 and path 207, row 56 for MSS images), respectively.
2.3. Estimation of Sediment Load
The relationship between sediment load and river discharge on major coastal rivers in Ghana proposed by Boateng et al. (2012) [17] was adopted in this study to estimate the sediment load, which reads:
where Qw represents the river discharge (m3/s), and Qs denotes the suspended sediment load (m3/day). The estimates of sediment load before Akosombo Dam construction were multiplied by 10 to reflect the reported about 90% reduction of sediment post-Akosombo Dam in the literature such as [17,18,27]. The assumption is also consistent with the sediment trapping efficiency of the Akosombo Dam reported in reference [28], which ranges from 87% to 96% for different calculation formulas. Moreover, the annual sediment load estimated from the sediment rating curve was around 180 million m3/year before dam construction, which was close to the reported estimated yield prior to dam construction (153 million m3/year) in reference [29]. The post-dam estimates of about 10 to 13 million m3/year also match the measured sediment load after dam construction (12 million m3/year) in reference [17]. All data mentioned above refer to the sediment load delivered to the river delta.
In this study, we focused on the effects of sediment trapping and alteration of river discharge induced by dams on the sediment load by using a sediment rating curve. The effects of the land use/land cover changes and climate change (such as rainfall) on the sediment yield were neglected since the sediment trapping efficiency of the Akosombo Dam has been proved to be the dominant factor for the changes of sediment load downstream the dam [28]. Notably, however, the sediment load calculated in this study was derived from the river discharge at the dam and thus should be considered a proxy of sediment load to the delta. In reality, the riverbed downstream of the dam could make a morphological adjustment to the altered flow regime, and hence ameliorate the reduced sediment load to the delta caused by dams.
2.4. Hydrological Alteration
The mean and standard deviations of annual river discharge and sediment load were calculated for the period before Akosombo Dam construction (1936 to 1963) and after Akosombo Dam construction (1970 to 2018) to explore the relationship between dam regulation and inter-annual variations of river discharge and sediment load. Mann–Kendall (MK) trend test was employed to detect the trend and test its significance. The method tests an assumption of the beginning of a developing trend within a sample (xi, xj, …, xn) of the random variable X, based on the rank series R of the progressive or retrogressive rows of this sample [30]. The MK test statistic, dk is calculated as [31,32]:
Under the null hypothesis of no trend, the statistic dk is distributed as a normal distribution with the expected value of E[dk] and the variance Var[dk] as follows [31,32]:
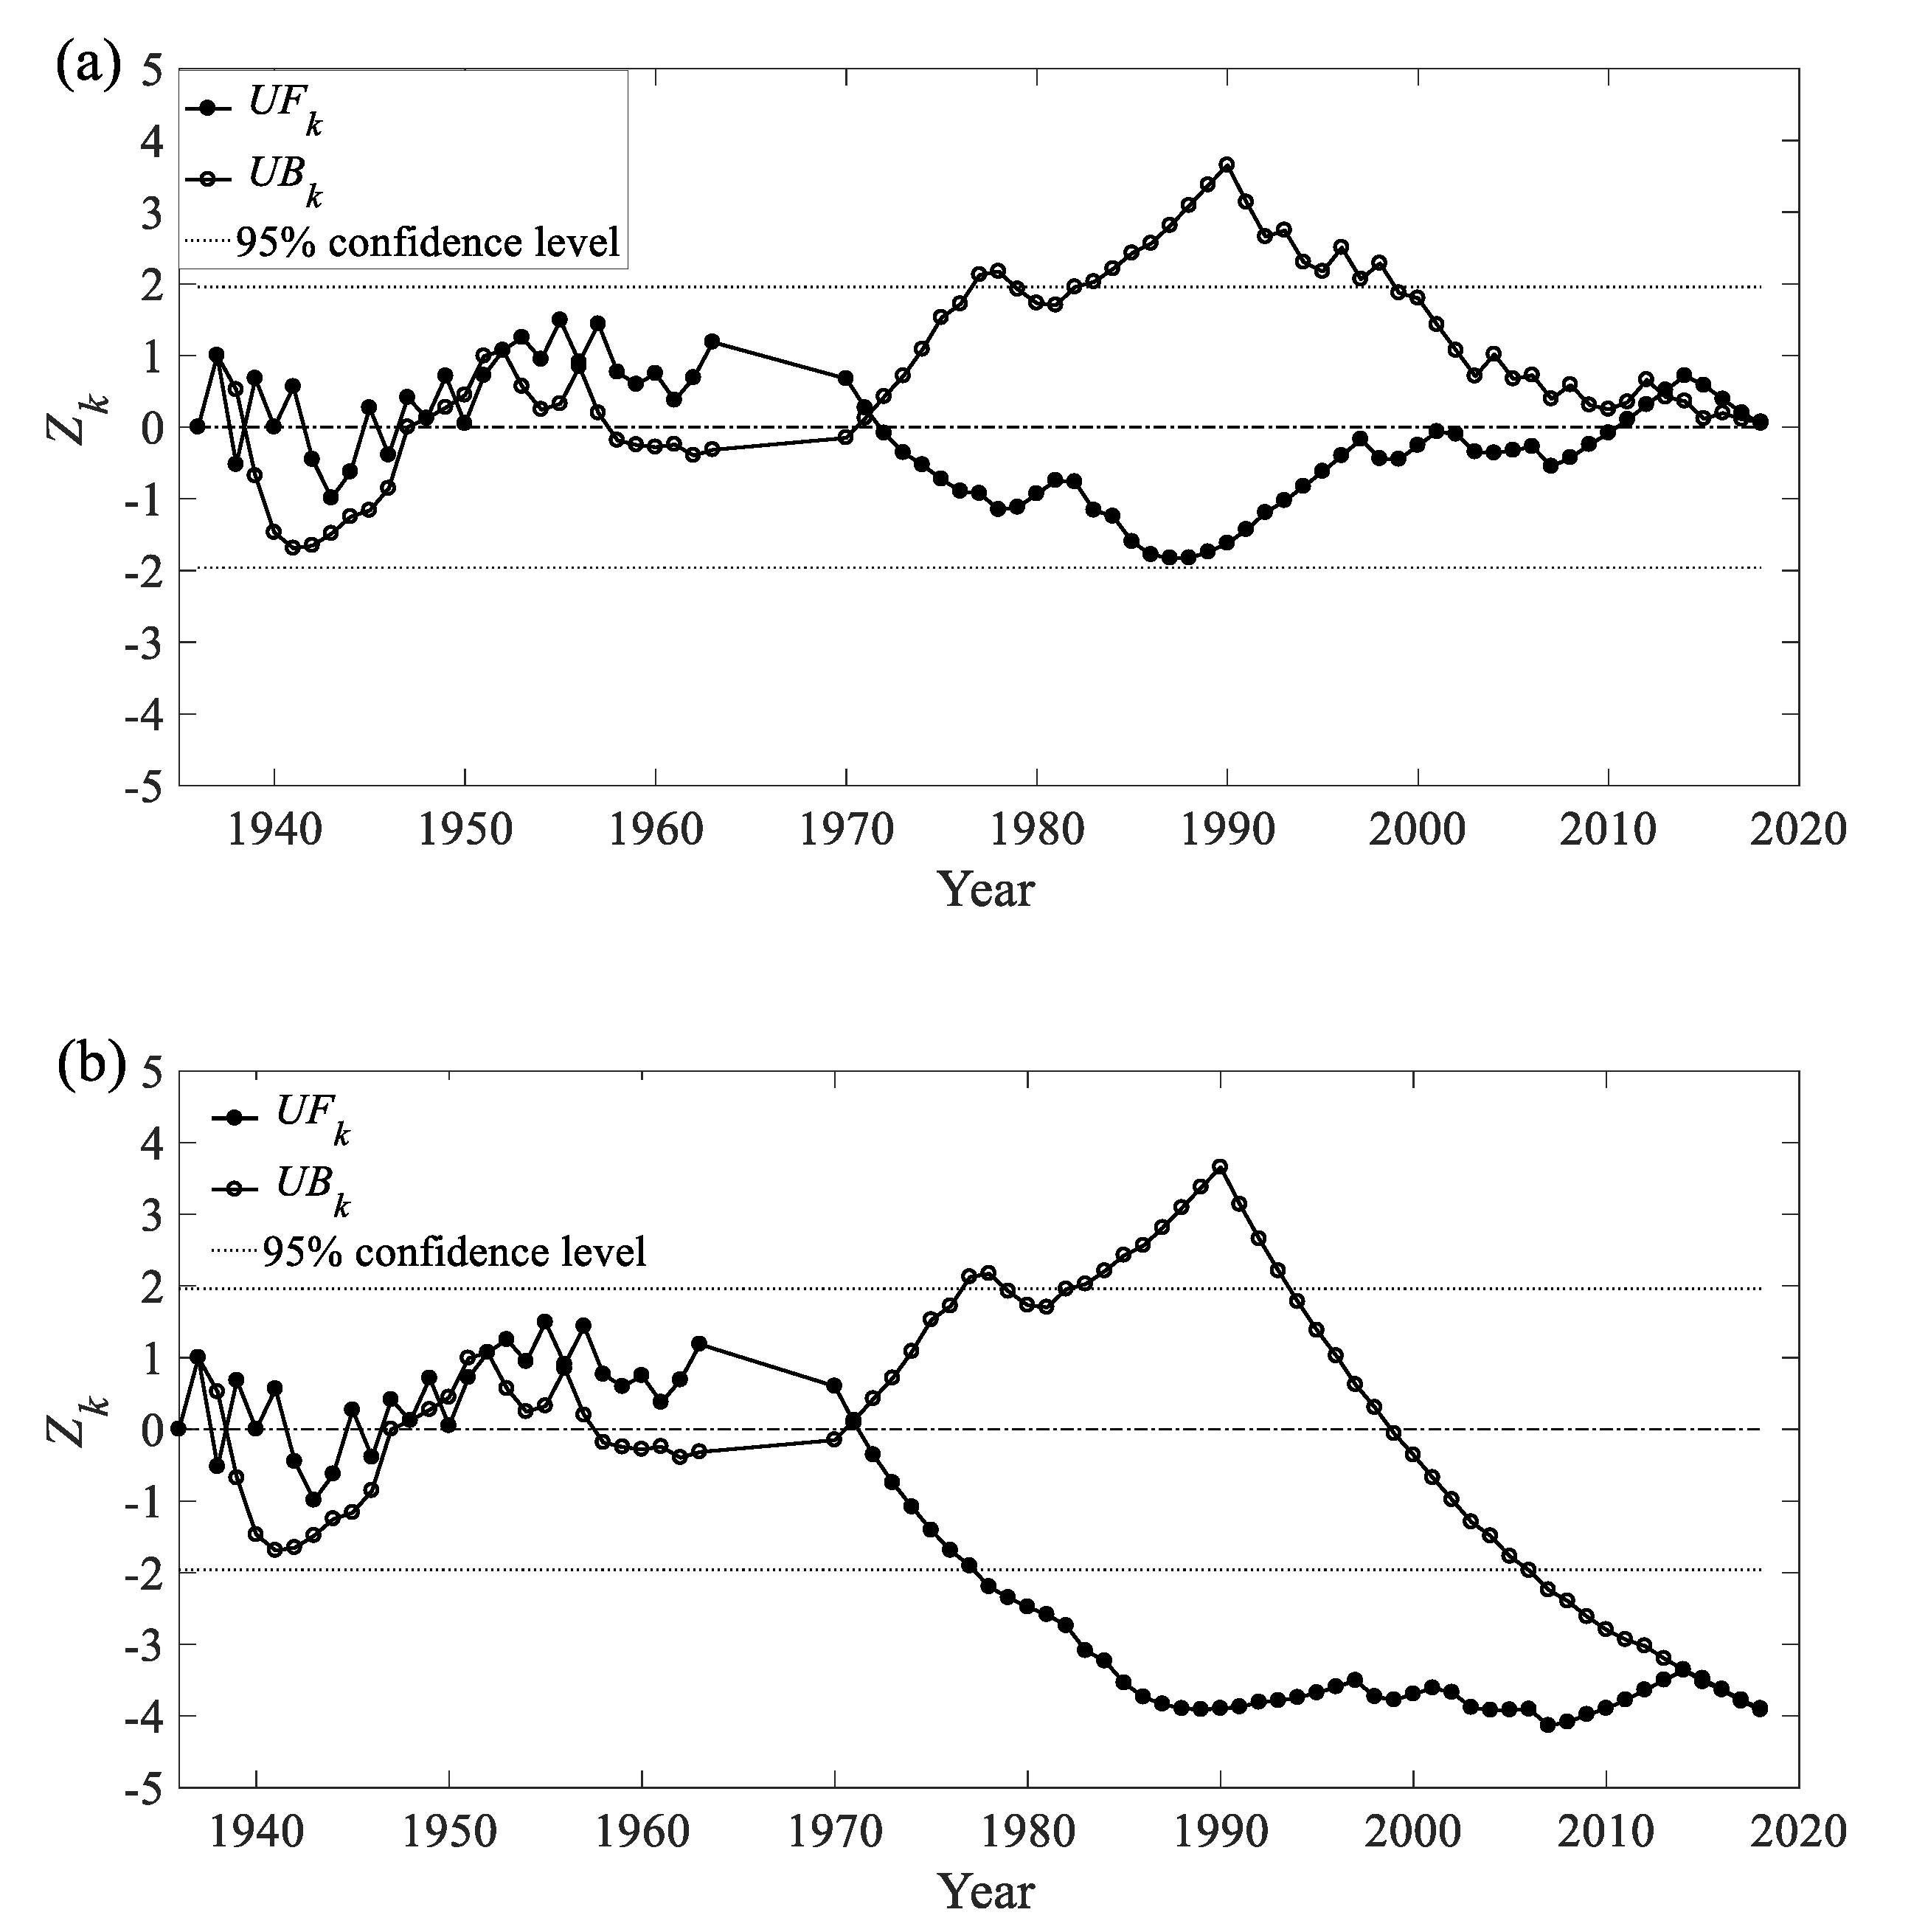
The Zk values calculated with progressive and retrograde series of X are denoted as UFk and UBk, respectively. A positive or negative UFk value represents an increasing or decreasing trend. When |UFk| < 1.96, the trend is not significant within a 95% confidence level. The intersecting points of the UFk and UBk lines indicate the beginning time of a developing trend of the time series.
Nonuniformity coefficient, Cy, which compares the standard deviation with the mean discharge, and regulated coefficient, Cr, which represents the total monthly water/sediment discharges that are larger than the mean river discharge, from Li et al. (2012) [33] were adopted to quantify the intra-annual variation and distribution of river discharge and sediment load:
where σ is the standard deviation of the monthly river discharge, Q(t) is the monthly river discharge or sediment load for t-month, and is the average of Q(t). The coefficients were compared for pre- and post-dam periods. Cy and Cr attain zero when the monthly river discharges are the same in a year, and larger Cy and Cr represent more variability of river discharge and sediment load.
2.5. Morphological Evolution
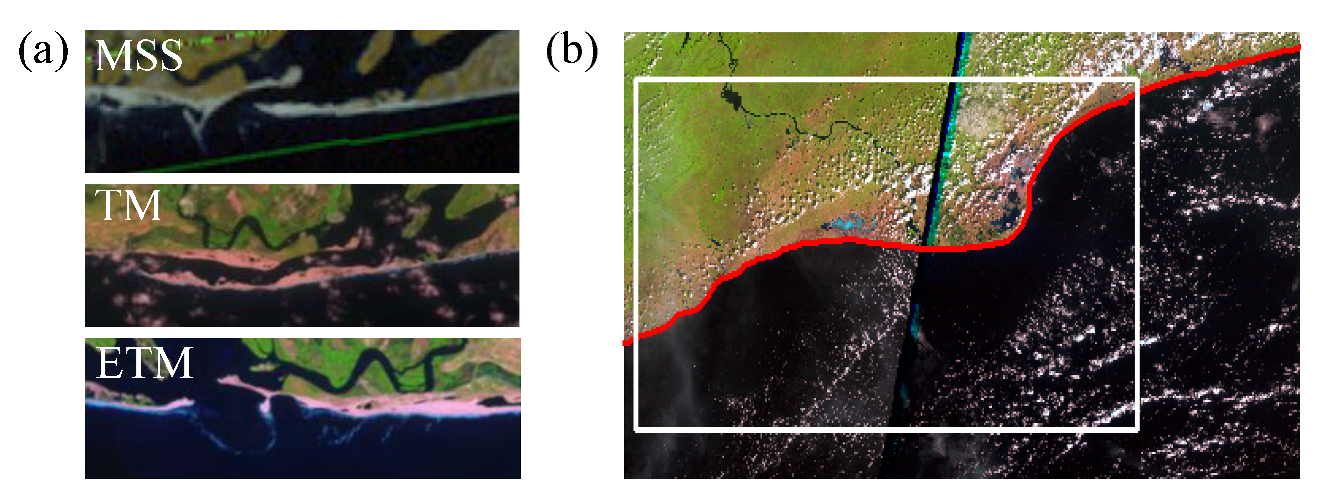
In this study, the following steps were taken for remote sensing analyses. Firstly, the 2 separate sets of remote sensing images that cover the whole Volta River Delta were merged, from which the images of the study area were extracted using coordinates (6.3° N, 0.226° W) for the upper left and (5.2° N, 1.81° E) for lower right. The projection coordinates for the images were UTM 31 N. Secondly, the pre-processed images were used to detect the shoreline manually using 432 bands and 543 bands pseudo-color image for MSS and TM/ETM+ images, respectively [13,34], which allowed the accurate identification and delineation of the shoreline (Figure 2a). In order to ensure consistency and accuracy on the derived delta area, a common polygon (white rectangle in Figure 2b) was used to intersect with the delineated shoreline (red line in Figure 2b). The coordinates selected for the polygon (in UTM 31 N) were (146,679, 588,419) for the lower left and (314,146, 684,940) for the upper right. Finally, the delta area within the polygon and the delineated shoreline were calculated (Figure 2b). The tidal range of the Volta Delta was about 1 m, which was relatively small. As such, the uncertainty of the shoreline extraction due to tidal variation was presumably small [23].
To assess the delta areal changes, the areal changes at the end of two consecutive years were calculated. A positive value represents progradation, and a negative value represents erosion. To compare the influence of sediment load on the delta areal changes, the corresponding cumulative sediment load for each period was calculated and then plotted against the associated delta areal changes following [35].
3. Results and Discussion
3.1. Effects of Dam Regulation on Inter-Annual Variations of River Discharge and Sediment Load
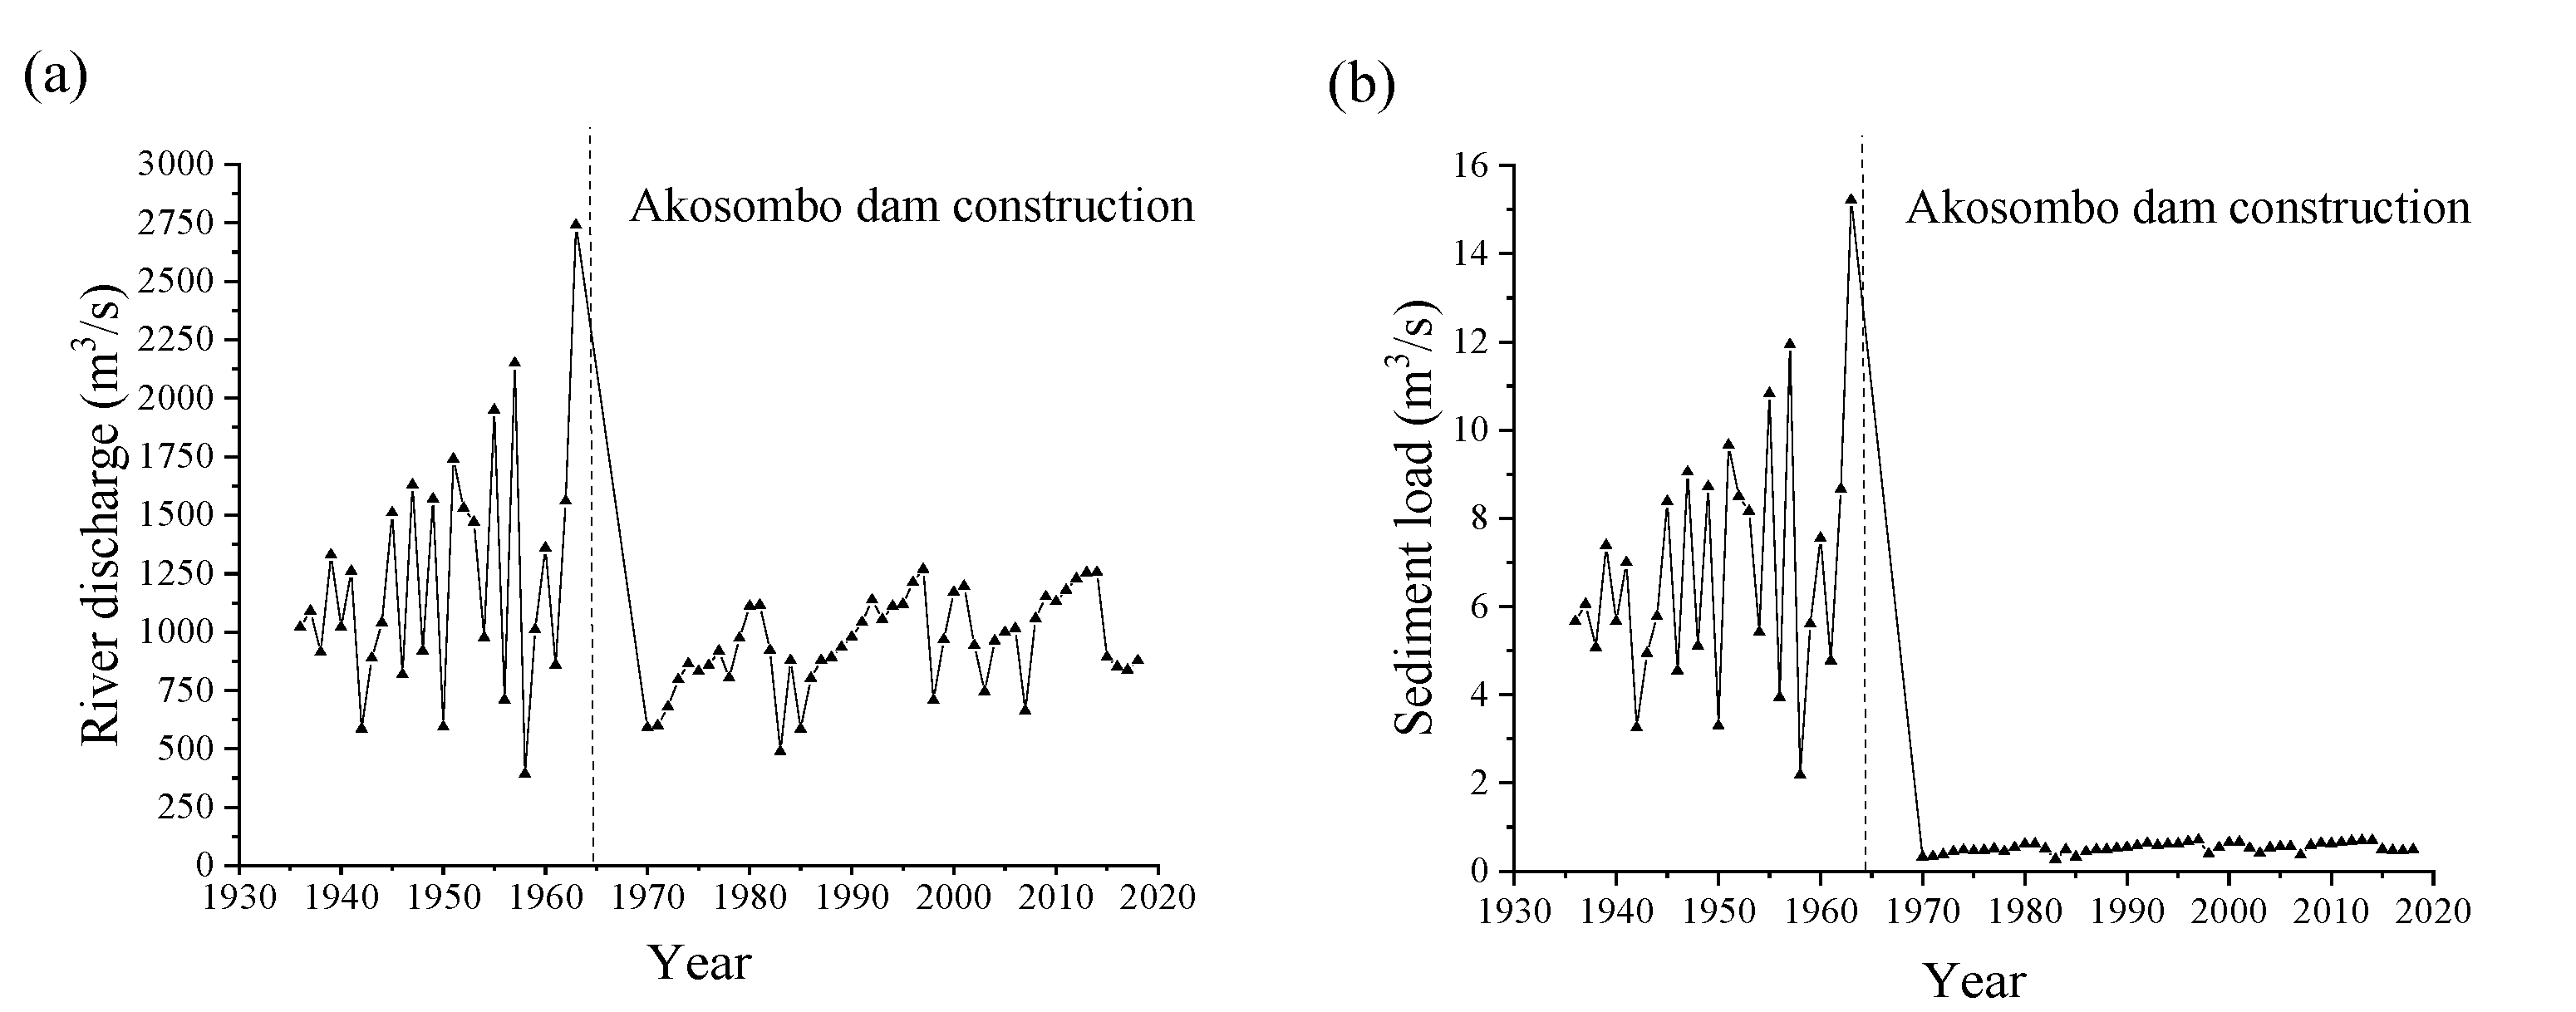
The annual river discharge and sediment load for the period from 1936 to 1963 (pre-Akosombo Dam construction) and that from 1970 to 2018 (post-Akosombo Dam construction) were plotted in Figure 3. The average river discharge and sediment load for the pre-dam period were 1237.00 m3/s and 6.87 m3/s with a standard variation of 516.80 m3/s and 2.87 m3/s, respectively, whereas those for the post-dam period were 949.55 m3/s and 0.53 m3/s with a standard variation of 196.10 m3/s and 0.11 m3/s, respectively. Decreasing percentages of river discharge and sediment loads were 23.23% and 92.32%, respectively, after the construction of the Akosombo Dam.
The total decreasing rate of sediment load was subject to two concurrent effects, namely, the decrease of river discharge and the sediment trapping in the reservoir. Using the sediment rating curve given in Equation (1) and incorporating a 90% sediment load reduction yields a total decreasing rate of 92.32%. If we only considered the reduction of sediment load due to decreasing river discharge, the decreasing rate will drop to 23.23%.
Notably, the reduction of sediment load due to dam retention can result in the erosion of the downstream river channel, which could offset the sediment reduction to the river delta. In addition, the reduction of flood peaks caused by the dam could reduce the sediment carrying capacity, causing the opposite effect. However, the investigation of the above-mentioned effects needs [36,37] detailed morphodynamic modeling of the river channel downstream of the dam.
As shown in Figure 4, the MK analyses showed that trends of river discharge and sediment load before the construction of the Akosombo Dam shift between increasing and decreasing trends constantly with the UFk values fluctuating above and below zero. However, the trends were not significant under the 95% confidence level (within ± 1.96). However, there was a continuous decreasing trend after 1970 (the intersecting points of the UFk and UBk lines) for both river discharge and sediment load with consistent negative UFk values. However, the decreasing trend of the river discharge was not significant under the 95% confidence level, while the decreasing trend of the sediment load was significant, which was consistent with the larger decreasing rate of the sediment load mentioned above.
Generally, the construction of the Akosombo Dam plays an important role in the decreases of river discharge and sediment load to the Volta River Delta from 1963 to 2018 (Figure 3 and Figure 4). Furthermore, the dam appears to reduce the inter-annual changes of the annual river discharge and sediment load by regulating the natural variability of the flow regime of the Volta River, which is indicated by the less fluctuated UFk values above and below zero.
3.2. Effects of Dam Regulation on the Intra-Annual Variations of River Discharge and Sediment Load
The nonuniformity coefficient (Cy) and regulated coefficient (Cr) were used to describe the intra-annual variations of river discharge and sediment load in this study. Table 2 shows that the construction of the dams results in a smaller Cy and Cr, which suggests a more uniform intra-annual river discharge and sediment load for the Volta River Delta, and the Akosombo Dam affects the intra-annual variations of river discharge and sediment load more significantly than the Kpong dam.
In this study, river discharge and sediment load exhibited a substantial decrease after the construction of the Akosombo Dam (Figure 3), and the beginning of the decreasing trend coincides with the time of the construction of the Akosombo Dam (Figure 4). Furthermore, the intra-annual variations of river discharge and sediment load also exhibited a significant decease after the dam construction (Table 2). Therefore, the Akosombo Dam was presumably dominant in inducing the hydrological alteration. Notably, however, the land use/land cover changes and climate change (such as rainfall) can also affect the water and sediment yield from the catchment and cause additional effects [38].
3.3. Effects of Dam Regulation on Delta Morphological Evolution
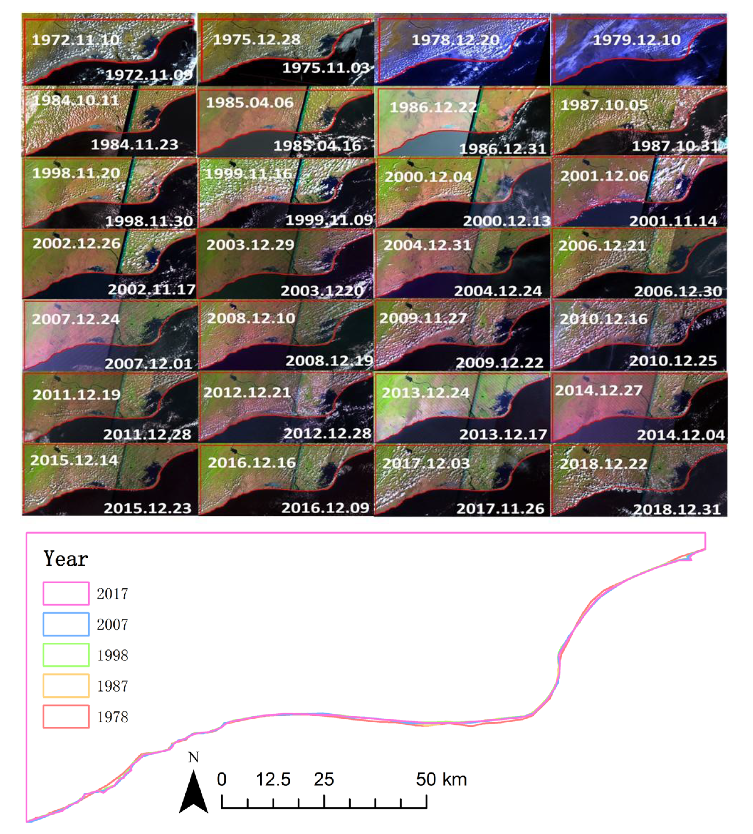
Figure 5 shows that the pseudo-color images using 432 bands and 543 bands for MSS and TM/ETM+ images, respectively, separate the land and ocean distinctly. The shorelines (shown in red lines) extracted from the Volta River Delta from 1972 to 2018 are also shown in Figure 5, and the delta area was further calculated as the area encompassed by the shoreline and the landward boundaries.
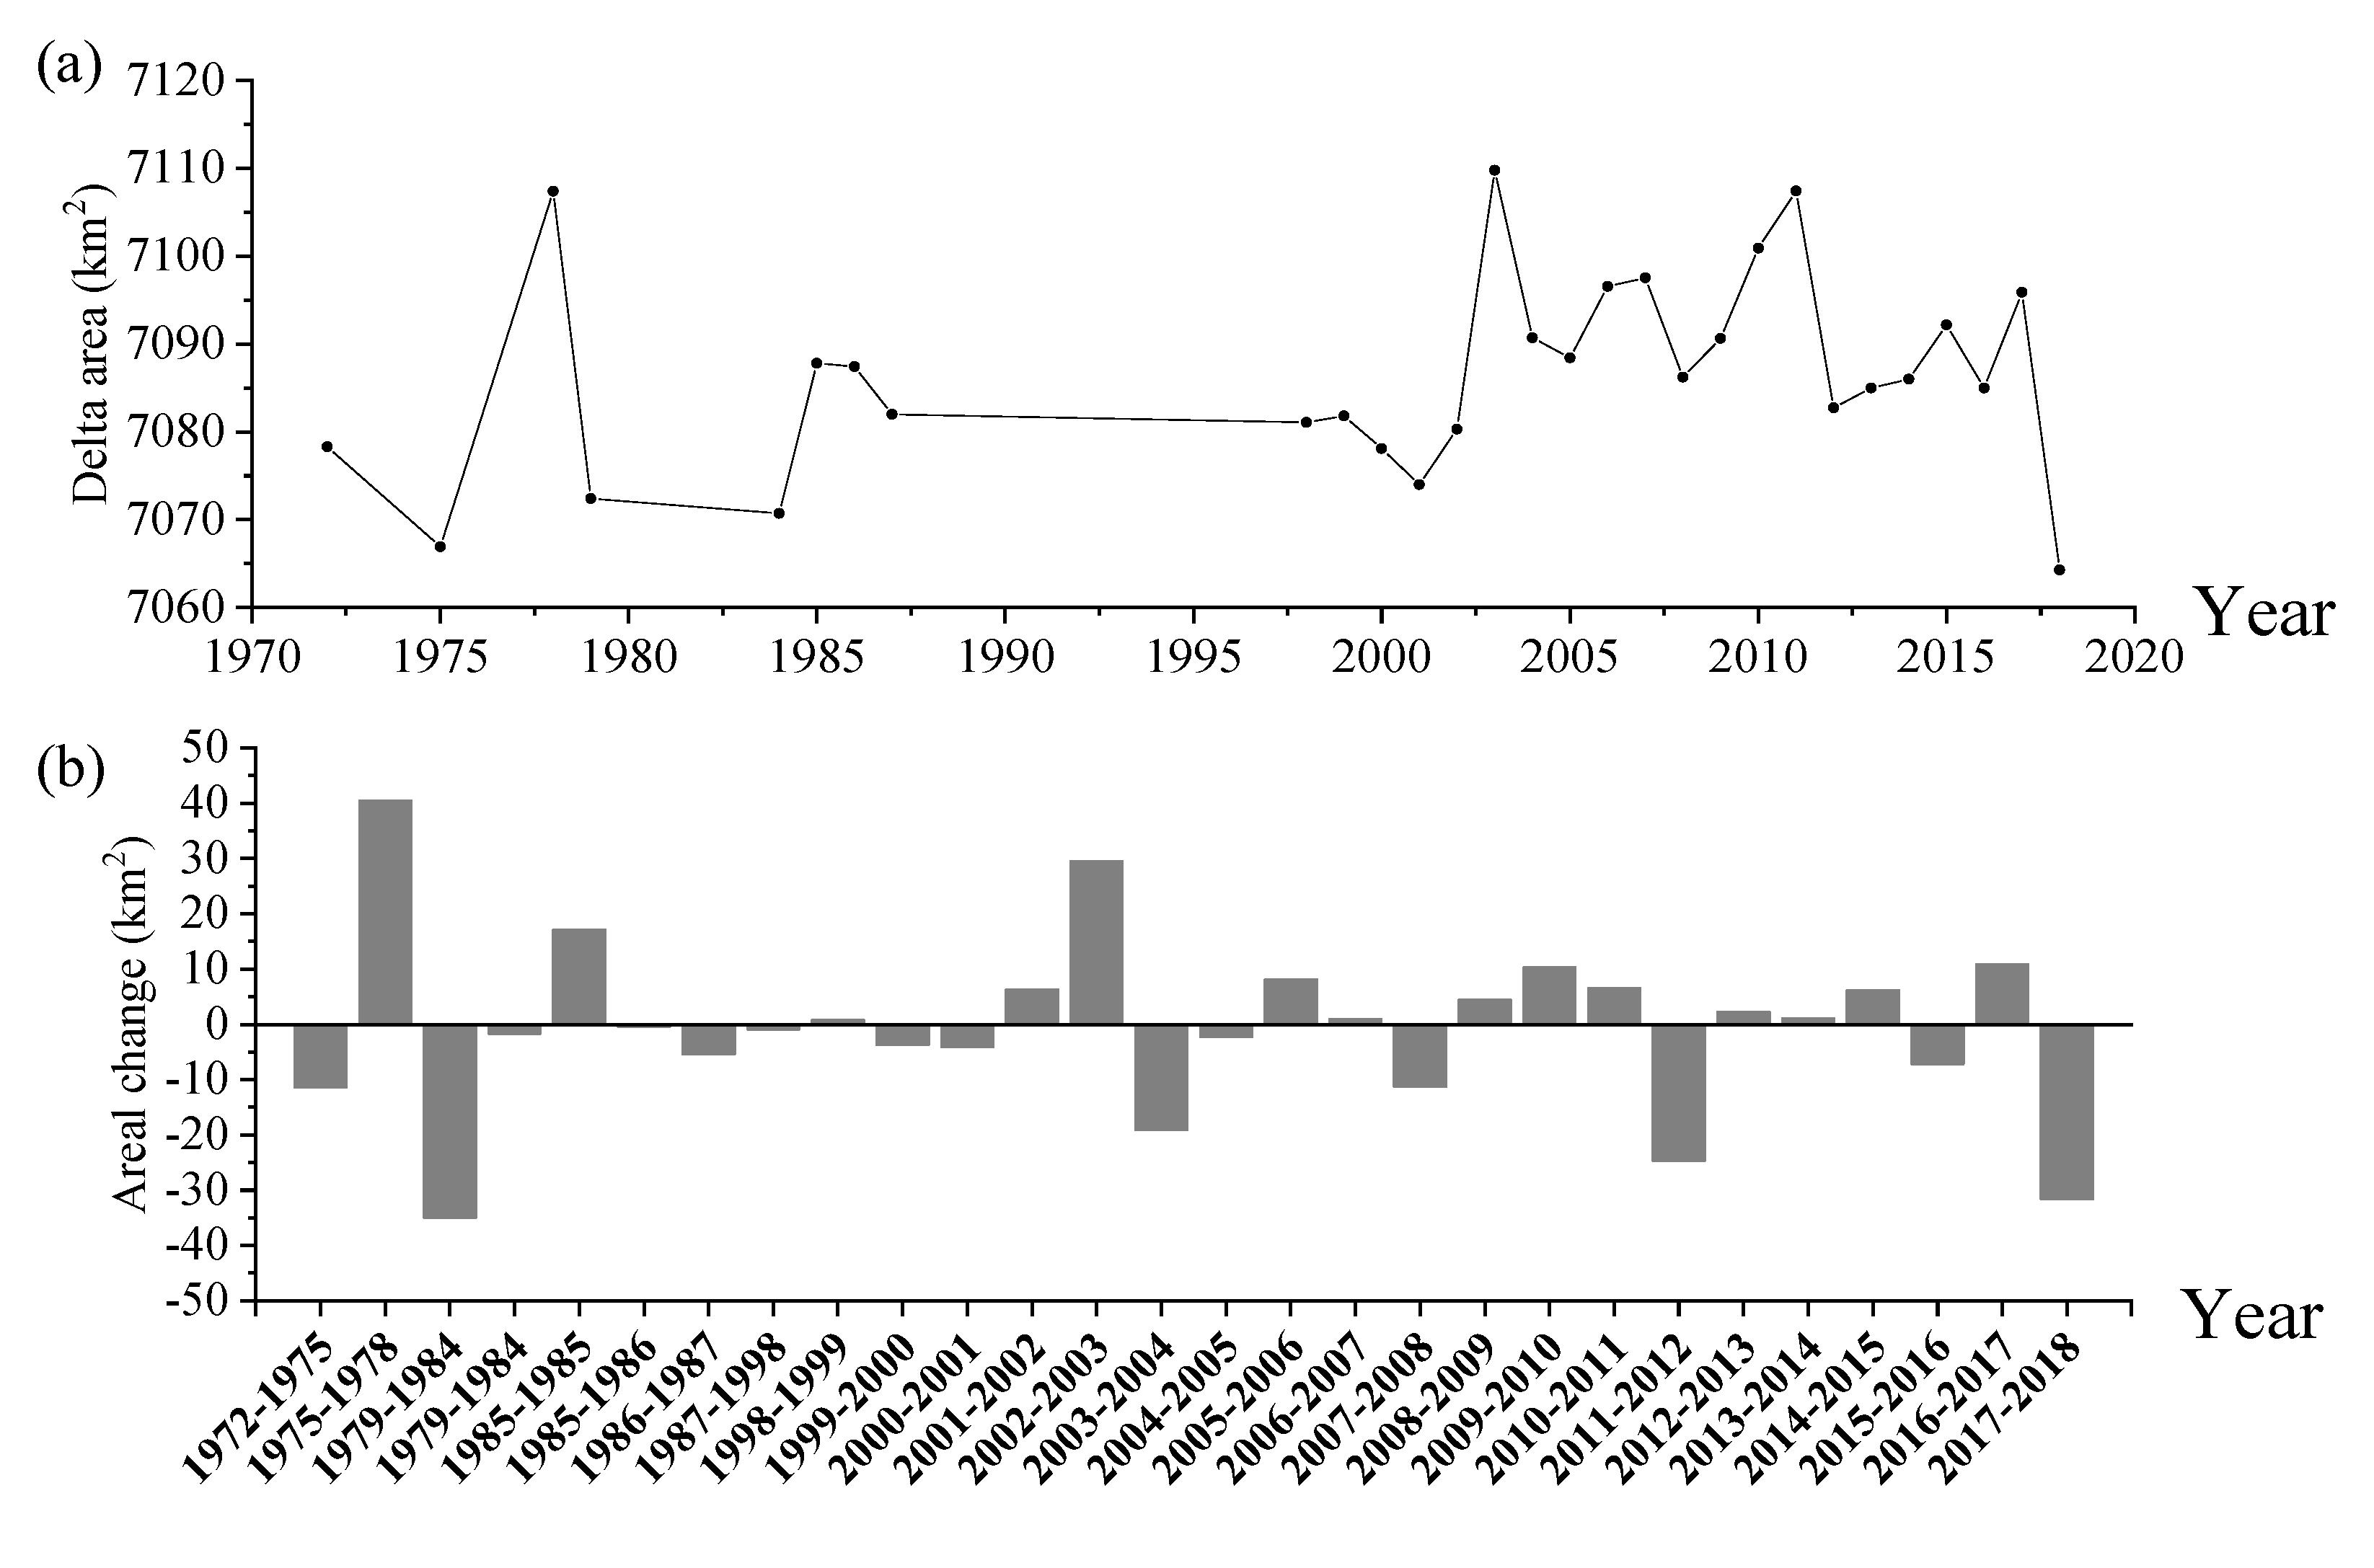
As shown in Figure 6a, the calculated delta area ranges from 7064 km2 to 7107 km2. The percentages of progradation-erosion shown in Figure 6b suggests a stable delta area since the 1970s, despite the alternating progradation and erosion in different years. The highest progradation (0.56%) occurred in the period from 1975 to 1978. The minimum progradation-erosion was recorded at 0.01%. The alternating progradation and erosion patterns of the Volta River Delta were consistent with the field observations of the Appeaning Addo (2015) [23].
Previous studies showed that the Volta River Delta was subject to severe local erosion due to the significant reduction of sediment load at an earlier stage of the post-dam period [18]. In their study, an average shoreline retreat derived from two town maps between 1923 and 1949 in the Keta area (Figure 1, red circle) was reported at 4 m/year. The retreat rate increased to 6 m/year from 1956 to 1975, with the most rapid erosion occurring after 1964 at an average value of 8 to 10 m/year [18]. However, based on the regional results of our study, the shoreline changes at the latter stage of the post-dam period (1972–2018) seemed to reach a quasi-equilibrium state with minimal change.
The stable shoreline was consistent with some recent studies on local shorelines, which analyzed the progradation-erosion patterns of several sections of the shoreline along the Ghana coast [23]. Their results showed that the selected shoreline sections of the Volta River Delta were accreting at an average rate of about 0.53 m/year, in contrast to the earlier trend reported with a reduction of the shoreline at a rate of about 8 to 10 m/year [18]. The progradation of the three sections was attributed to the implementation of the Keta sea defense project [23].
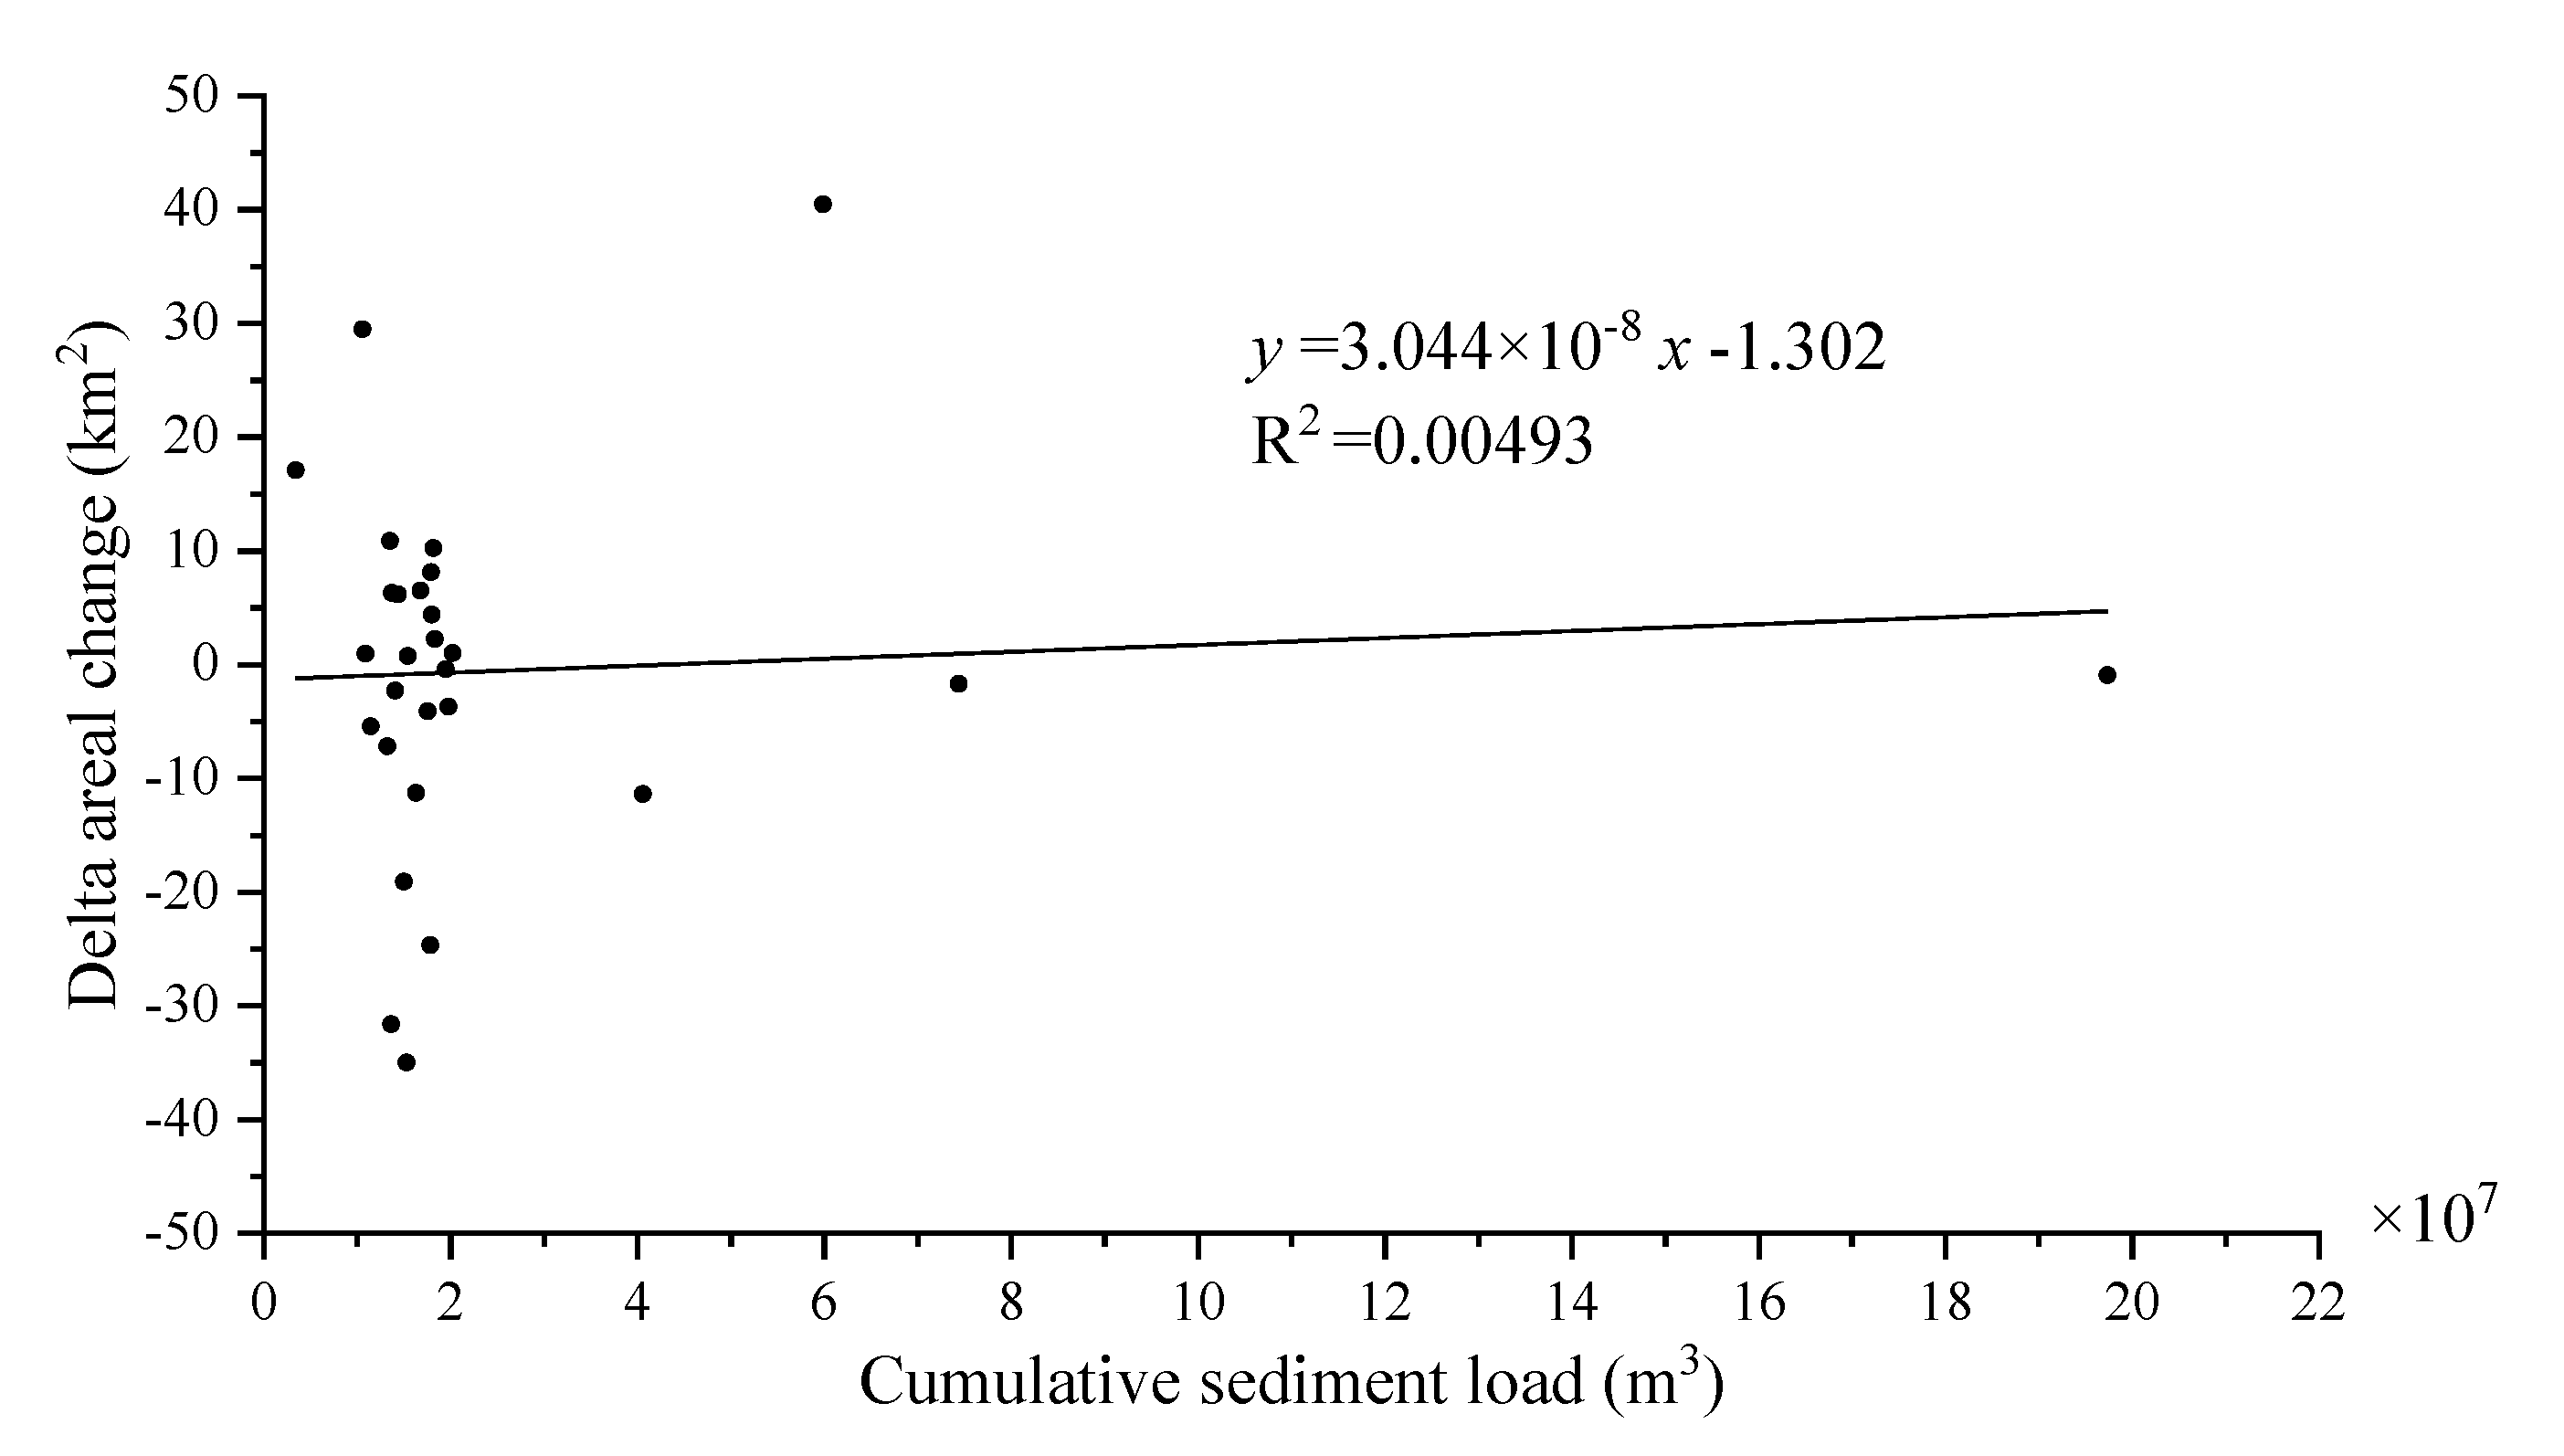
The correlation of the areal changes of the Volta River Delta with the associate sediment load for the period from 1972 to 2018 (Figure 7) showed much scattering. Notably, since we neglected the potential sediment source from the erosion of the lower reach of the river channel as a result of the dam [36,37], the weak correlation may be partly due to the uncertainty associated with the estimated sediment load. Nevertheless, the results from this study suggested the proposition from the previous studies [18,39], i.e., the dam construction as the major influencing factor of shoreline change of the Volta River Delta may not hold at the current stage. After the construction of the Akosombo Dam, there could be an initial reduction in sediment load and subsequent erosion of the shoreline of the Volta River Delta [18,39]. However, this lasted for a certain period until the delta reached a quasi-equilibrium state on the altered sediment supply. Besides, the attaining of the quasi-equilibrium state was presumably related to the rapid shoreline orientation changes induced by the high regional alongshore sediment transport [39], the beach nourishment, and the sea defense projects along the coast [20]. With a stable sediment load after the construction of the dams (Figure 3b), the delta was expected to remain in the quasi-equilibrium state unless other changes arise in the future.
4. Conclusions
The effects of the dam regulations on the hydrological alterations, including the inter- and intra-annual variations and the subsequent influence on the morphological evolution of the Volta River Delta, especially the shoreline and delta areal changes were analyzed in this study. The river discharge and sediment load decreased by 23.23% and 92.32%, respectively, after dam construction. The inter- and intra-annual variations of river discharge and sediment load are more significant in the pre-dam construction period than the post-dam construction period as expected. The changes in shoreline and delta area of the Volta River Delta from 1972 to 2018 are relatively small, with a maximum progradation-erosion rate of 0.5%. The relationship between the variation of the delta area and the cumulative sediment load is insignificant. It is reported in the literature that the Volta River Delta underwent severe erosion before the 1970s due to the reduced sediment supply. However, the present results implicate that the delta has approached a quasi-equilibrium state since the 1970s. Further analyses on the land use/cover changes, climate change, morphodynamic adjustment of the downstream river channel on the sediment load to the Volta River Delta that is neglected in this study are recommended for future studies. Our results provide references for the future development and restoration of the Volta River Delta.
Author Contributions
Conceptualization, D.S. and M.A.; methodology, W.G. and M.A.; validation, D.S., W.G., and D.L.; formal analysis, W.G. and M.A.; investigation, M.A.; resources, M.A.; data curation, M.A.; writing—original draft preparation, M.A.; writing—review and editing, D.L., W.G., and D.S.; visualization, M.A.; supervision, D.S. All authors have read and agreed to the published version of the manuscript.
Funding
This work was supported by the Key Project of the National Natural Science Foundation of China (grant 51639001), the Joint Funds of the National Natural Science Foundation of China (grant U1806217), and the Interdisciplinary Research Funds of Beijing Normal University.
Acknowledgments
To the China Scholarship Council and Chinese Government, whose sponsorship has made this work possible. To Water Resources Institute of the Council for Scientific and Industrial Research, Accra, Ghana, and Volta River Authority, Accra, Ghana, for making data available for the project.
Conflicts of Interest
The authors declare no conflict of interest.
References
- Syvitski, J.P.M.; Kettner, A.J.; Overeem, I.; Hutton, E.W.; Hannon, M.T.; Brakenridge, G.R.; Day, J.; Vörösmarty, C.; Saito, Y.; Giosan, L. Sinking deltas due to human activities. Nat. Geosci. 2009, 2, 681–686. [Google Scholar] [CrossRef]
- Giosan, L.; Syvitski, J.; Constantinescu, S.; Day, J. Climate change: Protect the world’s deltas. Nature 2014, 516, 31–33. [Google Scholar] [CrossRef] [Green Version]
- Syvitski, J.P.M.; Vorosmarty, C.J.; Kettner, A.J.; Green, P. Impact of humans on the flux of terrestrial sediment to the global coastal ocean. Science 2005, 308, 376–380. [Google Scholar] [CrossRef]
- Blum, M.D.; Roberts, H.H. Drowning of the Mississippi Delta due to insufficient sediment supply and global sea-level rise. Nat. Geosci. 2009, 2, 488–491. [Google Scholar] [CrossRef]
- Kirwan, M.L.; Megonigal, J.P. Tidal wetland stability in the face of human impacts and sea-level rise. Nature 2013, 504, 53–60. [Google Scholar] [CrossRef] [PubMed]
- Waters, C.N.; Zalasiewicz, J.; Summerhayes, C.; Barnosky, A.D.; Poirier, C.; Gałuszka, A.; Cearreta, A.; Edgeworth, M.; Ellis, E.C.; Ellis, M. The Anthropocene is functionally and stratigraphically distinct from the Holocene. Science 2016, 351, 137–147. [Google Scholar] [CrossRef] [PubMed]
- Snoussi, M.; Haïda, S.; Imassi, S. Effects of the construction of dams on the water and sediment fluxes of the Moulouya and the Sebou Rivers, Morocco. Reg. Environ. Chang. 2002, 3, 5–12. [Google Scholar] [CrossRef]
- Nilsson, C.; Reidy, C.A.; Dynesius, M.; Revenga, C. Fragmentation and flow regulation of the world’s large river systems. Science 2005, 308, 405–408. [Google Scholar] [CrossRef] [Green Version]
- Yang, S.; Milliman, J.; Li, P.; Xu, K. 50,000 dams later: Erosion of the Yangtze River and its delta. Glob. Planet. Chang. 2011, 75, 14–20. [Google Scholar] [CrossRef]
- Wu, X.; Bi, N.; Xu, J.; Nittrouer, J.A.; Yang, Z.; Saito, Y.; Wang, H. Stepwise morphological evolution of the active Yellow River (Huanghe) delta lobe (1976–2013): Dominant roles of riverine discharge and sediment grain size. Geomorphology 2017, 292, 115–127. [Google Scholar] [CrossRef]
- Gao, W.L.; Shao, D.D.; Wang, Z.B.; Nardin, W.; Yang, W.; Sun, T.; Cui, B.S. Combined effects of unsteady river discharge and wave conditions on river mouth bar morphodynamics. Geophys. Res. Lett. 2018, 45, 12903–12911. [Google Scholar] [CrossRef] [Green Version]
- Edmonds, D.A. Restoration sedimentology. Nat. Geosci. 2012, 5, 758–759. [Google Scholar] [CrossRef]
- Gao, W.L.; Shao, D.D.; Wang, Z.B.; Nardin, W.; Rajput, P.; Yang, W.; Sun, T.; Cui, B.S. Long-term cumulative effects of intra-annual variability of unsteady river discharge on the progradation of delta lobes: A modeling perspective. J. Geophys. Res. Earth Surf. 2019, 124, 960–973. [Google Scholar] [CrossRef] [Green Version]
- Hart, D. Volta River Project: A Case Study in Politics and Technology. Ph.D. Thesis, University of Edinburgh, Edinburgh, UK, 1977. [Google Scholar]
- Gyau-Boakye, P.; Tumbulto, J. The Volta Lake and declining rainfall and streamflows in the Volta River Basin. Environ. Dev. Sustain. 2000, 2, 1–11. [Google Scholar] [CrossRef]
- Oguntunde, P.G.; Friesen, J. Hydroclimatology of the Volta River Basin in West Africa: Trends and variability from 1901 to 2002. Phys. Chem. Earth 2006, 31, 1180–1188. [Google Scholar] [CrossRef]
- Boateng, I.; Bray, M.; Hooke, J. Estimating the fluvial sediment input to the coastal sediment budget: A case study of Ghana. Geomorphology 2012, 138, 100–110. [Google Scholar] [CrossRef]
- Ly, C.K. Sources of beach sand from the central and eastern coasts of Ghana, West Africa. Mar. Geol. 1980, 44, 229–240. [Google Scholar] [CrossRef]
- Gyau-Boakye, P. Environmental impacts of the Akosombo dam and effects of climate change on the lake levels. Environ. Dev. Sustain. 2001, 3, 17–29. [Google Scholar] [CrossRef]
- Roest, L.W. The Coastal System of the Volta Delta, Ghana: Strategies and Opportunities for Development. Master’s Thesis, Delft University of Technology, Delft, The Netherlands, 2018. [Google Scholar]
- Bosboom, J.; Stive, M.J. Coastal Dynamics I: Lectures Notes CIE4305; Delft University of Technology: Delft, The Netherlands, 2012. [Google Scholar]
- Addo, K.A.; Nicholls, R.J.; Codjoe, S.N.A.; Abu, M. A biophysical and socioeconomic review of the Volta Delta, Ghana. J. Coast. Res. 2018, 34, 1216–1226. [Google Scholar] [CrossRef] [Green Version]
- Addo, K.A. Assessment of the volta delta shoreline change. J. Coast. Zone Manag. 2015, 18, 1–6. [Google Scholar]
- Anthony, E.J.; Almar, R.; Aagaard, T. Recent shoreline changes in the Volta River delta, West Africa: The roles of natural processes and human impacts. Afr. J. Aquat. Sci. 2016, 41, 81–87. [Google Scholar] [CrossRef]
- Ericson, J.P.; Vörösmarty, C.J.; Dingman, S.L.; Ward, L.G.; Meybeck, M. Effective sea-level rise and deltas: Causes of change and human dimension implications. Glob. Planet. Chang. 2006, 50, 63–82. [Google Scholar] [CrossRef]
- Anthony, E.J. Wave influence in the construction, shaping and destruction of river deltas: A review. Mar. Geol. 2015, 361, 53–78. [Google Scholar] [CrossRef]
- Besset, M.; Anthony, E.J.; Bouchette, F. Multi-decadal variations in delta shorelines and their relationship to river sediment supply: An assessment and review. Earth-Sci. Rev. 2019, 193, 199–219. [Google Scholar] [CrossRef] [Green Version]
- Giardino, A.; Schrijvershof, R.; Nederhoff, C.M.; de Vroeg, H.; Brière, C.; Tonnon, P.K.; Caires, S.; Walstra, D.J.; Sosa, J.; van Verseveld, W.; et al. A quantitative assessment of human interventions and climate change on the West African sediment budget. Ocean Coast. Manag. 2018, 156, 249–265. [Google Scholar] [CrossRef]
- Taylor, J.C.; van de Giesen, N.; Steenhuis, T.S. West Africa: Volta discharge data quality assessment and use. JAWRA J. Am. Water Resour. Assoc. 2006, 42, 1113–1126. [Google Scholar] [CrossRef]
- Zhang, Q.; Xu, C.; Becker, S.; Jiang, T. Sediment and runoff changes in the Yangtze River basin during past 50 years. J. Hydrol. 2006, 331, 511–523. [Google Scholar] [CrossRef]
- Mann, H.B. Nonparametric tests against trend. Econom. J. Econom. Soc. 1945, 13, 245–259. [Google Scholar] [CrossRef]
- Kendall, M.G. Rank Correlation Methods; Griffin: London, UK, 1975. [Google Scholar]
- Li, D.; Wang, W.; Hu, S.; Li, Y. Characteristics of annual runoff variation in major rivers of China. Hydrol. Process. 2012, 26, 2866–2877. [Google Scholar] [CrossRef]
- Cui, B.L.; Li, X.Y. Coastline change of the Yellow River estuary and its response to the sediment and runoff (1976–2005). Geomorphology 2011, 127, 32–40. [Google Scholar] [CrossRef]
- Kong, D.; Miao, C.; Borthwick, A.G.L.; Duan, Q.; Liu, H.; Sun, Q.; Ye, A.; Di, Z.; Gong, W. Evolution of the Yellow River Delta and its relationship with runoff and sediment load from 1983 to 2011. J. Hydrol. 2015, 520, 157–167. [Google Scholar] [CrossRef] [Green Version]
- Brandt, S.A. Classification of geomorphological effects downstream of dams. Catena 2000, 40, 375–401. [Google Scholar] [CrossRef]
- Smith, V.B.; Mohrig, D. Geomorphic signature of a dammed sandy river: The lower Trinity River downstream of Livingston Dam in Texas, USA. Geomorphology 2017, 297, 122–136. [Google Scholar] [CrossRef]
- Wang, H.; Yang, Z.; Saito, Y.; Liu, J.P.; Sun, X.; Wang, Y. Stepwise decreases of the Huanghe (Yellow River) sediment load (1950–2005): Impacts of climate change and human activities. Glob. Planet. Chang. 2007, 57, 331–354. [Google Scholar] [CrossRef]
- Anthony, E.J.; Blivi, A. Morphosedimentary evolution of a delta-sourced, drift-aligned sand barrier–lagoon complex, western Bight of Benin. Mar. Geol. 1999, 158, 161–176. [Google Scholar] [CrossRef]
Figure 1.
The location of the Volta River Delta.

Figure 2.
(a) Pseudo-color images using 432 bands and 543 bands for the multispectral scanner (MSS) and thematic mapper (TM)/enhanced thematic mapper (ETM+) images (b) extraction of the shoreline of the Volta River Delta. The red line is the example of extracted shoreline, and the white polygon is the intersected polygon.

Figure 3.
(a) Annual river discharge and (b) annual sediment load of the Volta River before and after Akosombo Dam construction.
Figure 3.
(a) Annual river discharge and (b) annual sediment load of the Volta River before and after Akosombo Dam construction.

Figure 4.
Mann–Kendall (MK) trend test analysis of annual: (a) River discharge and (b) sediment load of the Volta River.
Figure 4.
Mann–Kendall (MK) trend test analysis of annual: (a) River discharge and (b) sediment load of the Volta River.

Figure 5.
Shorelines extracted from the remote sensing images from 1972 to 2018.

Figure 6.
Results of (a) delta area and (b) progradation-erosion patterns over different periods of the Volta River Delta.
Figure 6.
Results of (a) delta area and (b) progradation-erosion patterns over different periods of the Volta River Delta.

Figure 7.
Relationship between the cumulative sediment load and areal change of the Volta River Delta.
Figure 7.
Relationship between the cumulative sediment load and areal change of the Volta River Delta.


Table 1.
List of Landsat images used in this study.
| Acquisition Date | Image Type | Resolution (m) | Band | Acquisition Date | Image Type | Resolution (m) | Band |
|---|---|---|---|---|---|---|---|
| 10 November 1972/ 9 November 1972 | MSS | 60 | 4 | 16 November 2005/ 25 November 2005 | ETM+ | 30 | 6 |
| 28 December 1975/ 3 December 1975 | 21 December 2006/ 30 December 2006 | ||||||
| 20 December 1978/ 3 December 1978 | 24 December 2007/ 1 December 2007 | ||||||
| 10 December 1979/ 10 December 1979 | 10 December 2008/ 19 December 2008 | ||||||
| 11 October 1984/ 23 November 1984 | TM | 30 | 6 | 27 November 2009/ 22 December 2009 | |||
| 6 April 1985/ 16 April 1985 | 16 December 2010/ 25 December 2010 | ||||||
| 22 December 1986/ 31 December 1986 | 19 December 2011/ 28 December 2011 | ||||||
| 5 October 1987/ 30 October 1987 | 21 December 2011/ 30 December 2012 | ||||||
| 20 November 1998/ 30 November 1998 | 24 December 2013/ 17 December 2013 | ||||||
| 16 November 1999/ 9 November 1999 | ETM+ | 30 | 6 | 27 December 2014/ 4 December 2014 | |||
| 13 December 2000/ 4 December 2000 | 14 December 2015/ 23 December 2015 | ||||||
| 6 December 2001/ 14 November 2001 | 16 December 2016/ 9 December 2016 | ||||||
| 6 December 2002/ 17 November 2002 | 3 December 2017/ 26 November 2017 | ||||||
| 26 December 2003/ 20 November 2003 | 22 December 2018/ 31 December 2018 | ||||||
| 31 December 2004/ 24 December 2004 |
Table 2.
The nonuniformity coefficient (Cy) and regulated coefficient (Cr) for the river discharge and sediment load for the periods of pre-Akosombo Dam, pre-Kpong Dam, and post-Kpong Dam.
Table 2.
The nonuniformity coefficient (Cy) and regulated coefficient (Cr) for the river discharge and sediment load for the periods of pre-Akosombo Dam, pre-Kpong Dam, and post-Kpong Dam.
| River Discharge | |||
|---|---|---|---|
| Coefficient | Pre-Akosombo | Pre-Kpong | Post-Kpong |
| Cy | 1.45 | 0.07 | 0.09 |
| Cr | 0.55 | 0.03 | 0.04 |
| Sediment load | |||
| Cy | 1.44 | 0.04 | 0.09 |
| Cr | 0.55 | 0.03 | 0.04 |
© 2020 by the authors. Licensee MDPI, Basel, Switzerland. This article is an open access article distributed under the terms and conditions of the Creative Commons Attribution (CC BY) license (http://creativecommons.org/licenses/by/4.0/).
Share and Cite
MDPI and ACS Style
Amenuvor, M.; Gao, W.; Li, D.; Shao, D. Effects of Dam Regulation on the Hydrological Alteration and Morphological Evolution of the Volta River Delta. Water 2020, 12, 646. https://doi.org/10.3390/w12030646
AMA Style
Amenuvor M, Gao W, Li D, Shao D. Effects of Dam Regulation on the Hydrological Alteration and Morphological Evolution of the Volta River Delta. Water. 2020; 12(3):646. https://doi.org/10.3390/w12030646
Chicago/Turabian StyleAmenuvor, Mawusi, Weilun Gao, Dongxue Li, and Dongdong Shao. 2020. "Effects of Dam Regulation on the Hydrological Alteration and Morphological Evolution of the Volta River Delta" Water 12, no. 3: 646. https://doi.org/10.3390/w12030646
Note that from the first issue of 2016, this journal uses article numbers instead of page numbers. See further details here.