A Study on Setting Disaster-Prevention Rainfall by Rainfall Duration in Urban Areas Considering Natural Disaster Damage: Focusing on South Korea


1
Department of Civil Engineering and Landscape Architectural, Daegu Technical University, Daegu 42734, Korea
2
Department of Aeronautics and Civil Engineering, Hanseo University, Seosan 31962, Korea
*
Author to whom correspondence should be addressed.
Water 2020, 12(3), 642; https://doi.org/10.3390/w12030642
Submission received: 4 February 2020
/
Revised: 19 February 2020
/
Accepted: 21 February 2020
/
Published: 27 February 2020
(This article belongs to the Special Issue Urban Hydrology and Water Management – Past Research and Future Directions)
Abstract
:Inundation damage occurs in urban regions due to short flood reach time and increased surface runoff caused by urbanized impervious areas. Furthermore, heavy rainfall frequency has increased because of climate change, thus exceeding the design frequency and resulting in sewer pipes’ lack of flood control capacity, with damage expanding from low-lying areas. Despite many urban disaster-mitigation policies, complex causes and uncertainties make reducing urban inundation damage difficult. This study established a rainfall-related disaster-prevention standard by time duration considering rainfall characteristics targeting urban disaster-induced inundation damage. Based on the South Korean urbanization rate and population, seven target regions were selected. Rainfall by time duration was analyzed with respect to disaster length (number of days) from 2010–2017. The average rainfall for durations from 1–24 h were analyzed according to disaster length (1–13 days). Using the results, an equation was proposed for rainfall estimation by length of disaster resulting in urban inundation damage, through multiple regression analysis. An equation was developed for rainfall-related disaster-prevention in urban areas considering the length of disaster and rainfall duration. This was accomplished by selecting a duration whereby the average rainfall of duration corresponded to 50% of total rainfall during the disaster period.
1. Introduction
Urban areas developed for convenience and safety as a result of social and economic changes [1,2]. They result from spatial changes based on population concentrations, and typical urban development activities include industrial construction, residential expansion, and maintenance of traffic networks for product transportation. Such urban infrastructures are called “gray urbanization” because they are constructed using highly durable cement and asphalt [3,4,5].
Despite the benefits of urban areas, gray urbanization infrastructure results in an increased risk of flooding. The increase in impervious areas, caused by the prevalence of asphalt and cement, combined with more frequent heavy rains in a short period due to climate change result in increased runoff and shortened flood reach times [5,6,7]. In recent years, many human lives have been lost and large financial losses have occurred because of urban inundation damage worldwide [8,9], including in the United States, Japan, Singapore, the United Kingdom, China, Italy, and South Korea [10,11,12,13]. Inundation damage caused by a natural disaster in even a small section of a city causes great harm, which can trigger not only social and economic problems, but also environmental and ecological ones. Despite natural disaster damage prevention and disaster mitigation measures in urban areas, the range and magnitude of flooding effects have risen disproportionately to these measures because of rapid urbanization and climate change [14,15,16,17,18,19,20,21].
The increasing frequency of heavy rainfall in short periods due to climate change, and the increase of runoff due to the greater expanse of impervious urban areas are increasing damage from flooding [22,23]. Many studies have estimated the degree of damage of a natural disaster by applying a parameter for the size of an urban center’s impervious area [24]. These parameters of urban areas are categorized into natural environment factors (rainfall frequency, rainfall intensity, etc.), environmental factors (impervious areas, embankments, etc.), and socioeconomic factors (population, economy, etc.) [5,25]. Flood-related disasters are caused in particular by the high degree of impervious areas and short reach time, and disaster prevention and mitigation systems for urban infrastructures should be developed to address these specific aspects as well as the effects of climate change [5,26,27,28,29]. Most existing studies on natural disasters’ effects in urban areas focused on the characteristics of inundation damage, but mainly considered only the characteristics of urban areas. No study has analyzed the characteristics of inundation damage based on the data from actual natural disasters in urban areas.
In inundation damage analysis of urban areas, the flow process on the ground’s surface was analyzed using mainly 2D spreading models based on the surface flow considering infrastructure such as buildings, roads, and sewer pipes through SWMM or XP-SWMM [30,31,32,33]. These analyses showed that the major causes of urban inundation damage were complex interactions between ground surface runoff and insufficient design capacity of sewer pipes [33,34,35,36]. This was determined based on estimations that when rainfall occurred, 40% evaporated, 50% was absorbed, and 10% ran off on ground surfaces in natural regions, whereas the ground surface runoff increased up to 55% in urban regions with 75%–100% impervious surfaces [37]. Some study results showed that sewer pipes’ insufficient water control capacity and low-lying areas affected by increased runoff from impervious areas were the causes of inundation damage in urban regions. However, as previously stated, most studies analyzed only the effect of short-term rainfall on inundation damage and did not consider the duration of rainfall to analyze the characteristics of rainfall that induced inundation damage in urban regions.
Studies on inundation damage in urban areas caused by natural disasters have been performed using methods such as rainfall analysis, urban characteristics, and inundation area estimation [38,39,40,41,42,43,44]. However, this is difficult to predict because of hydrological effects of environmental changes and real-time spatial changes [45,46,47,48]. Policymakers worldwide have stressed that similar unpredictable phenomena must be considered as causes of urban inundation damage [40,49,50]. Furthermore, many studies proposed the need for specific disaster mitigation management schemes to resolve these uncertain factors [51,52,53,54,55,56,57,58]. Because complex damage causes are difficult to identify and the uncertainty involved in predicting urban inundation damage is too great, mitigation measures do not consider past inundation damage cases, nor do disaster mitigation baselines consider rainfall characteristics.
This study aimed to address this gap by investigating disaster-prevention and mitigation methods based on rainfall by duration, considering the damage caused by natural disasters in urban regions of South Korea. The target regions were selected based on urbanization ratio and population. Data on the damage caused by rainfall-related natural disasters from 2010 to 2017 relate to the selected urban regions. This study analyzed the mean rainfall by duration according to the disaster period of inundation damage that occurred in the urban regions, and calculated the regression equation of rainfall by duration. Furthermore, a formula for rainfall-related disaster prevention was developed for mitigation of inundation damage in an urban region by selecting a representative rainfall duration time for each length of disaster occurrence.
2. Materials and Methods
2.1. Status of Natural Disaster Damage in Urban Regions
2.1.1. Target Regions
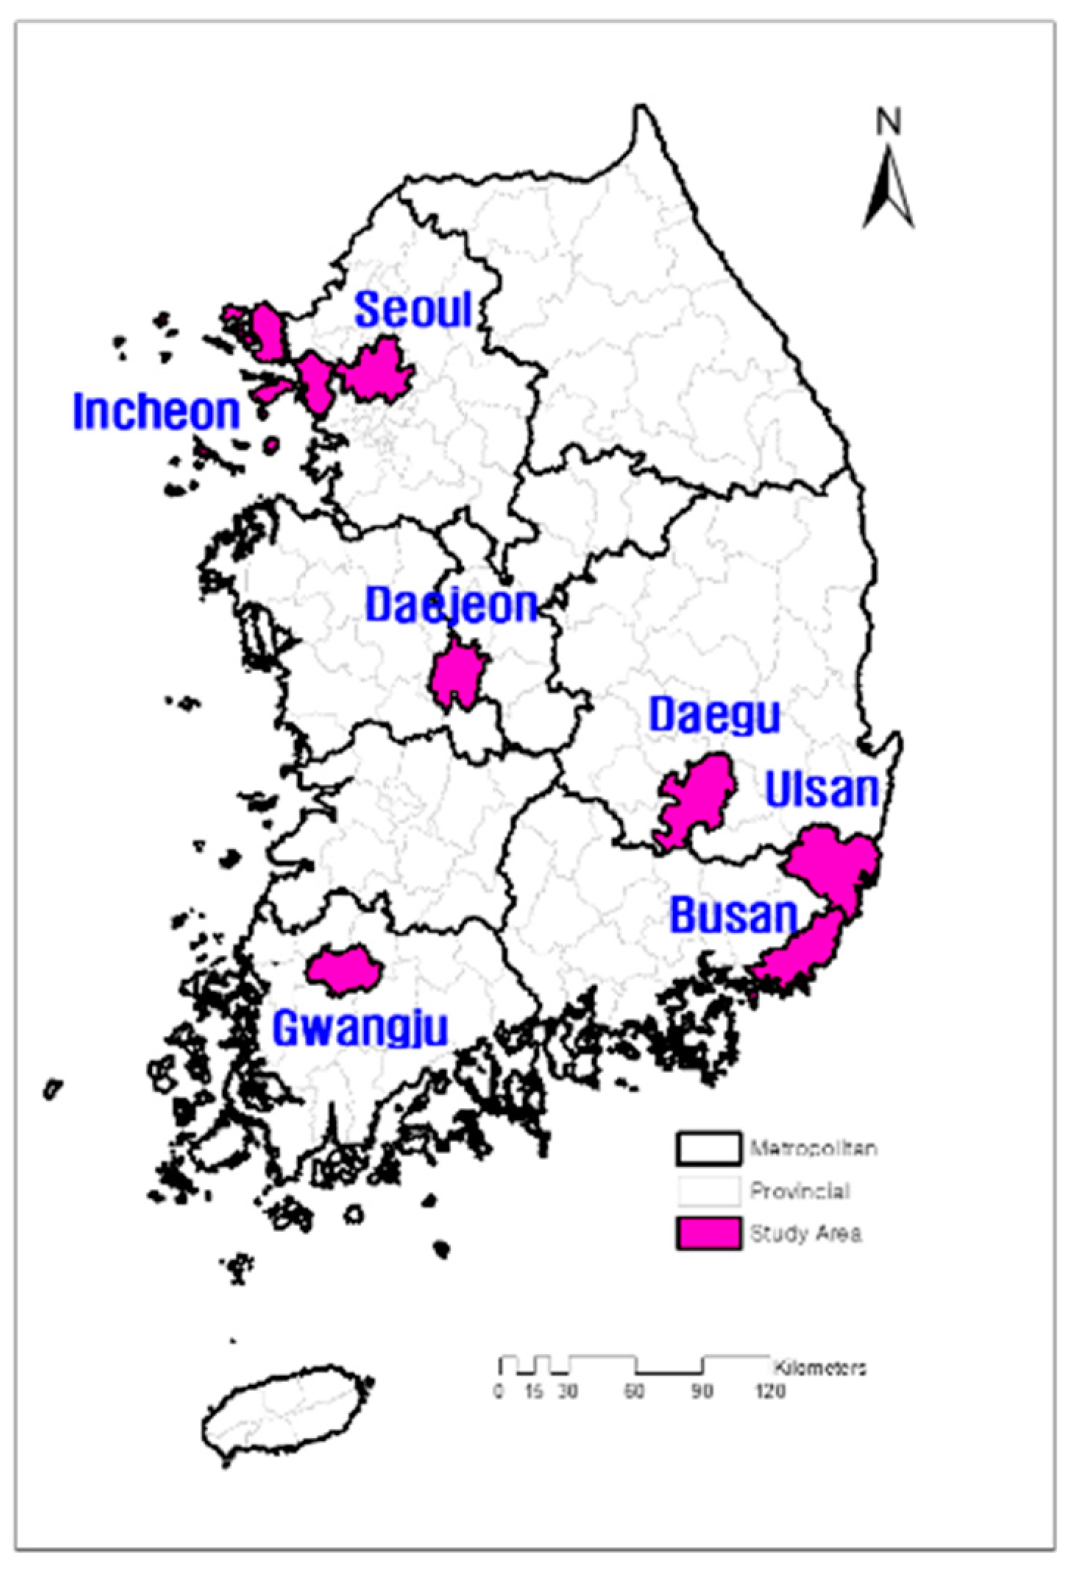
This study examined the characteristics of urban areas in 17 cities/provinces of South Korea to select the target regions for analysis of natural disaster damage status. As shown in Figure 1, the administrative regions of South Korea are divided into 17 regions including one special city, six metropolitan cities, one special autonomous city, and eight provinces. The cities/provinces classified as administrative regions are managed by subdividing cities into gu/dong (types of districts) and the other regions into gun/myeon (types of townships).
As shown in Table 1, the populations and geographic characteristics of South Korea are as follows: the total population is approximately 52 million people, the total area is 100,364 km2, and the area of urban regions is 17,636 km2. The population per area is 520 people/km2 and the urbanization ratio corresponds to 16.6%. This study aimed to select target regions that presented urban characteristics from the 17 cities/provinces, which was designated as cities and provinces whereby the proportion of urban areas was about 50% and the population per area was greater than or equal to 1.00 (thousand people/km2). Using these criteria, the following seven administrative regions were selected as the target urban regions of this study: Seoul Special City, Busan Metropolitan City, Daegu Metropolitan City, Incheon Metropolitan City, Gwangju Metropolitan City, Daejeon Metropolitan City, and Ulsan Metropolitan City.
2.1.2. Status of Natural Disaster Damages
This study investigated the damage from natural disasters that occurred from 2010 to 2017 in the seven urban target regions of South Korea outlined in Section 2.1.1. Five types of natural disasters occurred in the urban areas: extreme wind, typhoon, wind wave, extreme wind and wind wave, and heavy rainfall. Figure 2 shows the number of damage occurrences and the damage cost by length of natural disaster.
In the target urban areas, 159 natural disasters occurred, including 102 incidents of heavy rainfall (the largest number) and five incidents of wind waves (the smallest number). The total cost of damage to urban areas was US$292,417,000. The rainfalls induced the most expensive damages at US$163,600,000 and the extreme winds induced the least expensive damages at US$210,000. The occurrence period of natural disasters in urban areas lasted from 1 to 13 days, and 3-day disasters occurred 31 times (most frequent), while 13-day disasters occurred five times (least frequent) with the smallest damage cost. With respect to the damage cost by length of disaster occurrence period, the largest damage cost occurred in the 4-day disasters (US$130,106,000) whereas the smallest damage cost occurred in the 13-day disasters (US$284,000).
Table 2 shows the occurrence count and the damage cost by year for the types of natural disasters that occurred in urban areas from 2010 to 2017. Natural disasters occurred approximately 20 times annually on average, and the count by year ranged from 9 (2015) to 39 (2012). The mean annual damage cost was approximately US$36.6 million, and the cost by year ranged from US$964,000 (2013) to US$90,919,000 (2014). Among urban natural disasters, heavy rainfall in 2012 was the most common event with 18 occurrences, while damages from heavy rainfall in 2014 cost the most at US$90,821,000. The least frequent events were extreme wind in 2014, typhoon in 2013, and wind wave in 2015, which each occurred just once. On the other hand, heavy rainfall in 2015 caused the least expensive damage at US$4,000.
2.2. Rainfall Characteristics According to Natural Disaster Damage
2.2.1. Status of Rainfall Observatories
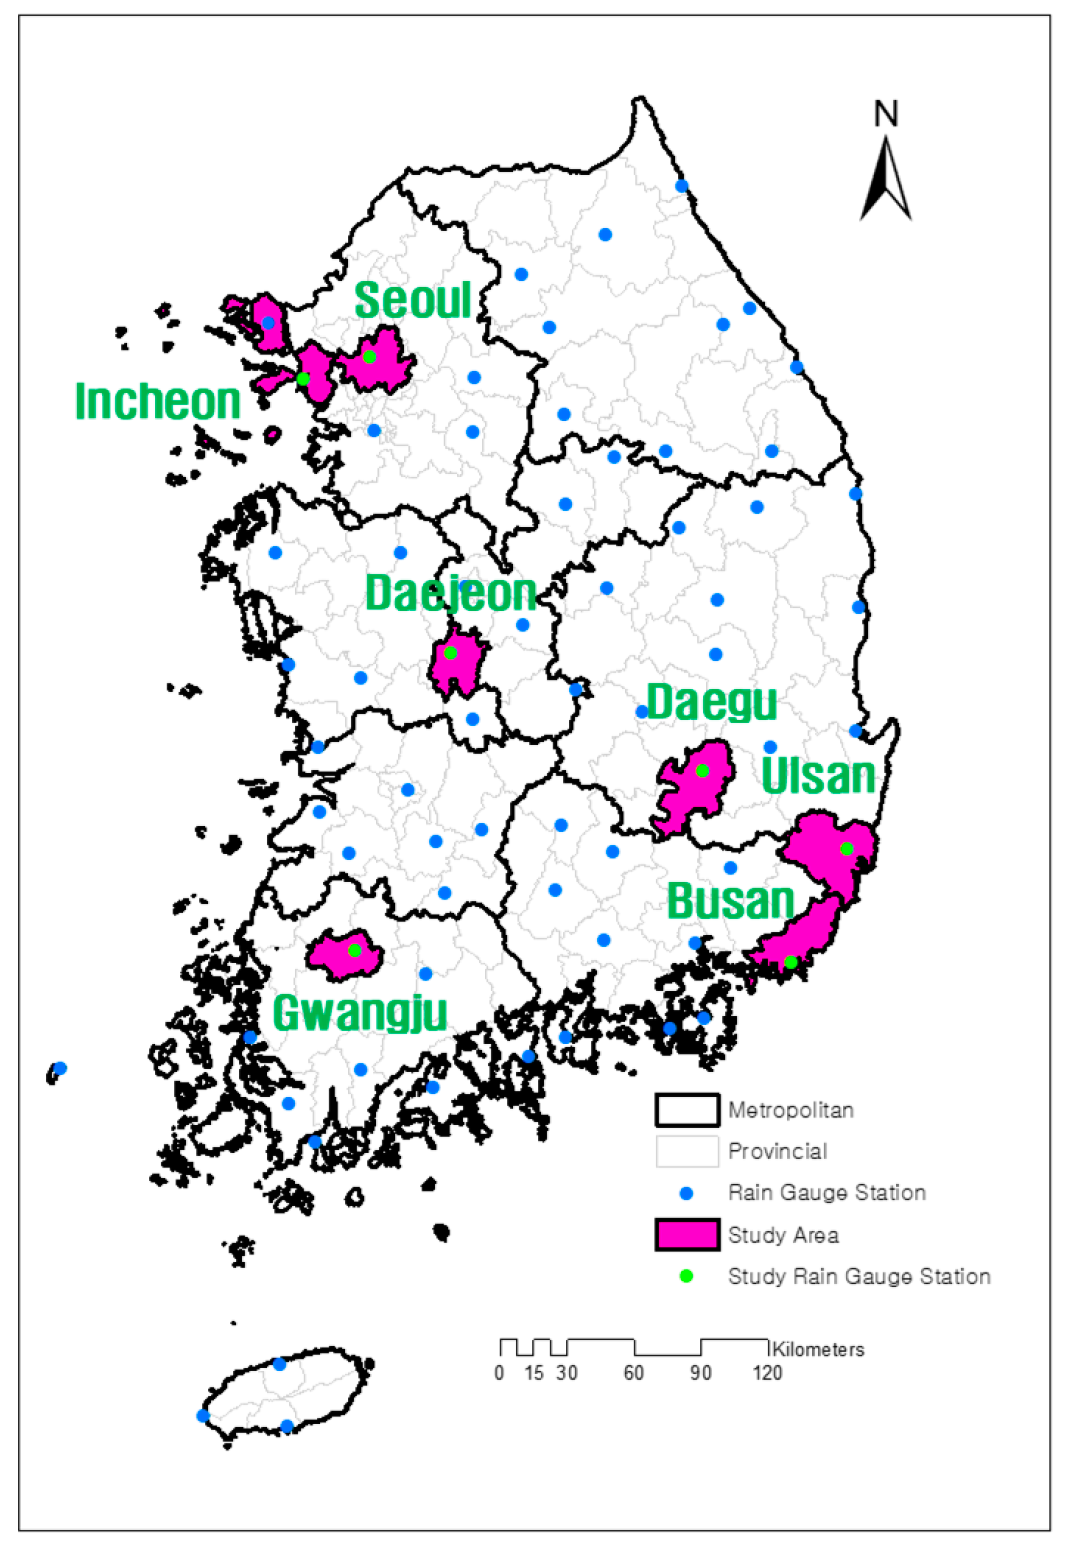
The Korea Meteorological Administration (KMA) operates 74 rainfall observatories nationwide and has over 30 years of weather observation data in various design standards. In Korea, when incorporating rainfall data into various aspects of planning and design, verified data from these stations from a period of more than 30 years are used. This study utilized the rainfall observatories of the target regions to examine the characteristics of rain occurrence according to the damages caused by natural disasters in urban regions, as shown in Figure 3.
The target regions selected in this have rainfall observatories with over 30 years of rainfall observation history. Table 3 shows the rainfall observatories’ coordinates, observation elevation, and starting date of observation by region.
2.2.2. Rainfall Characteristics with Respect to Occurrence of Natural Disaster Damages
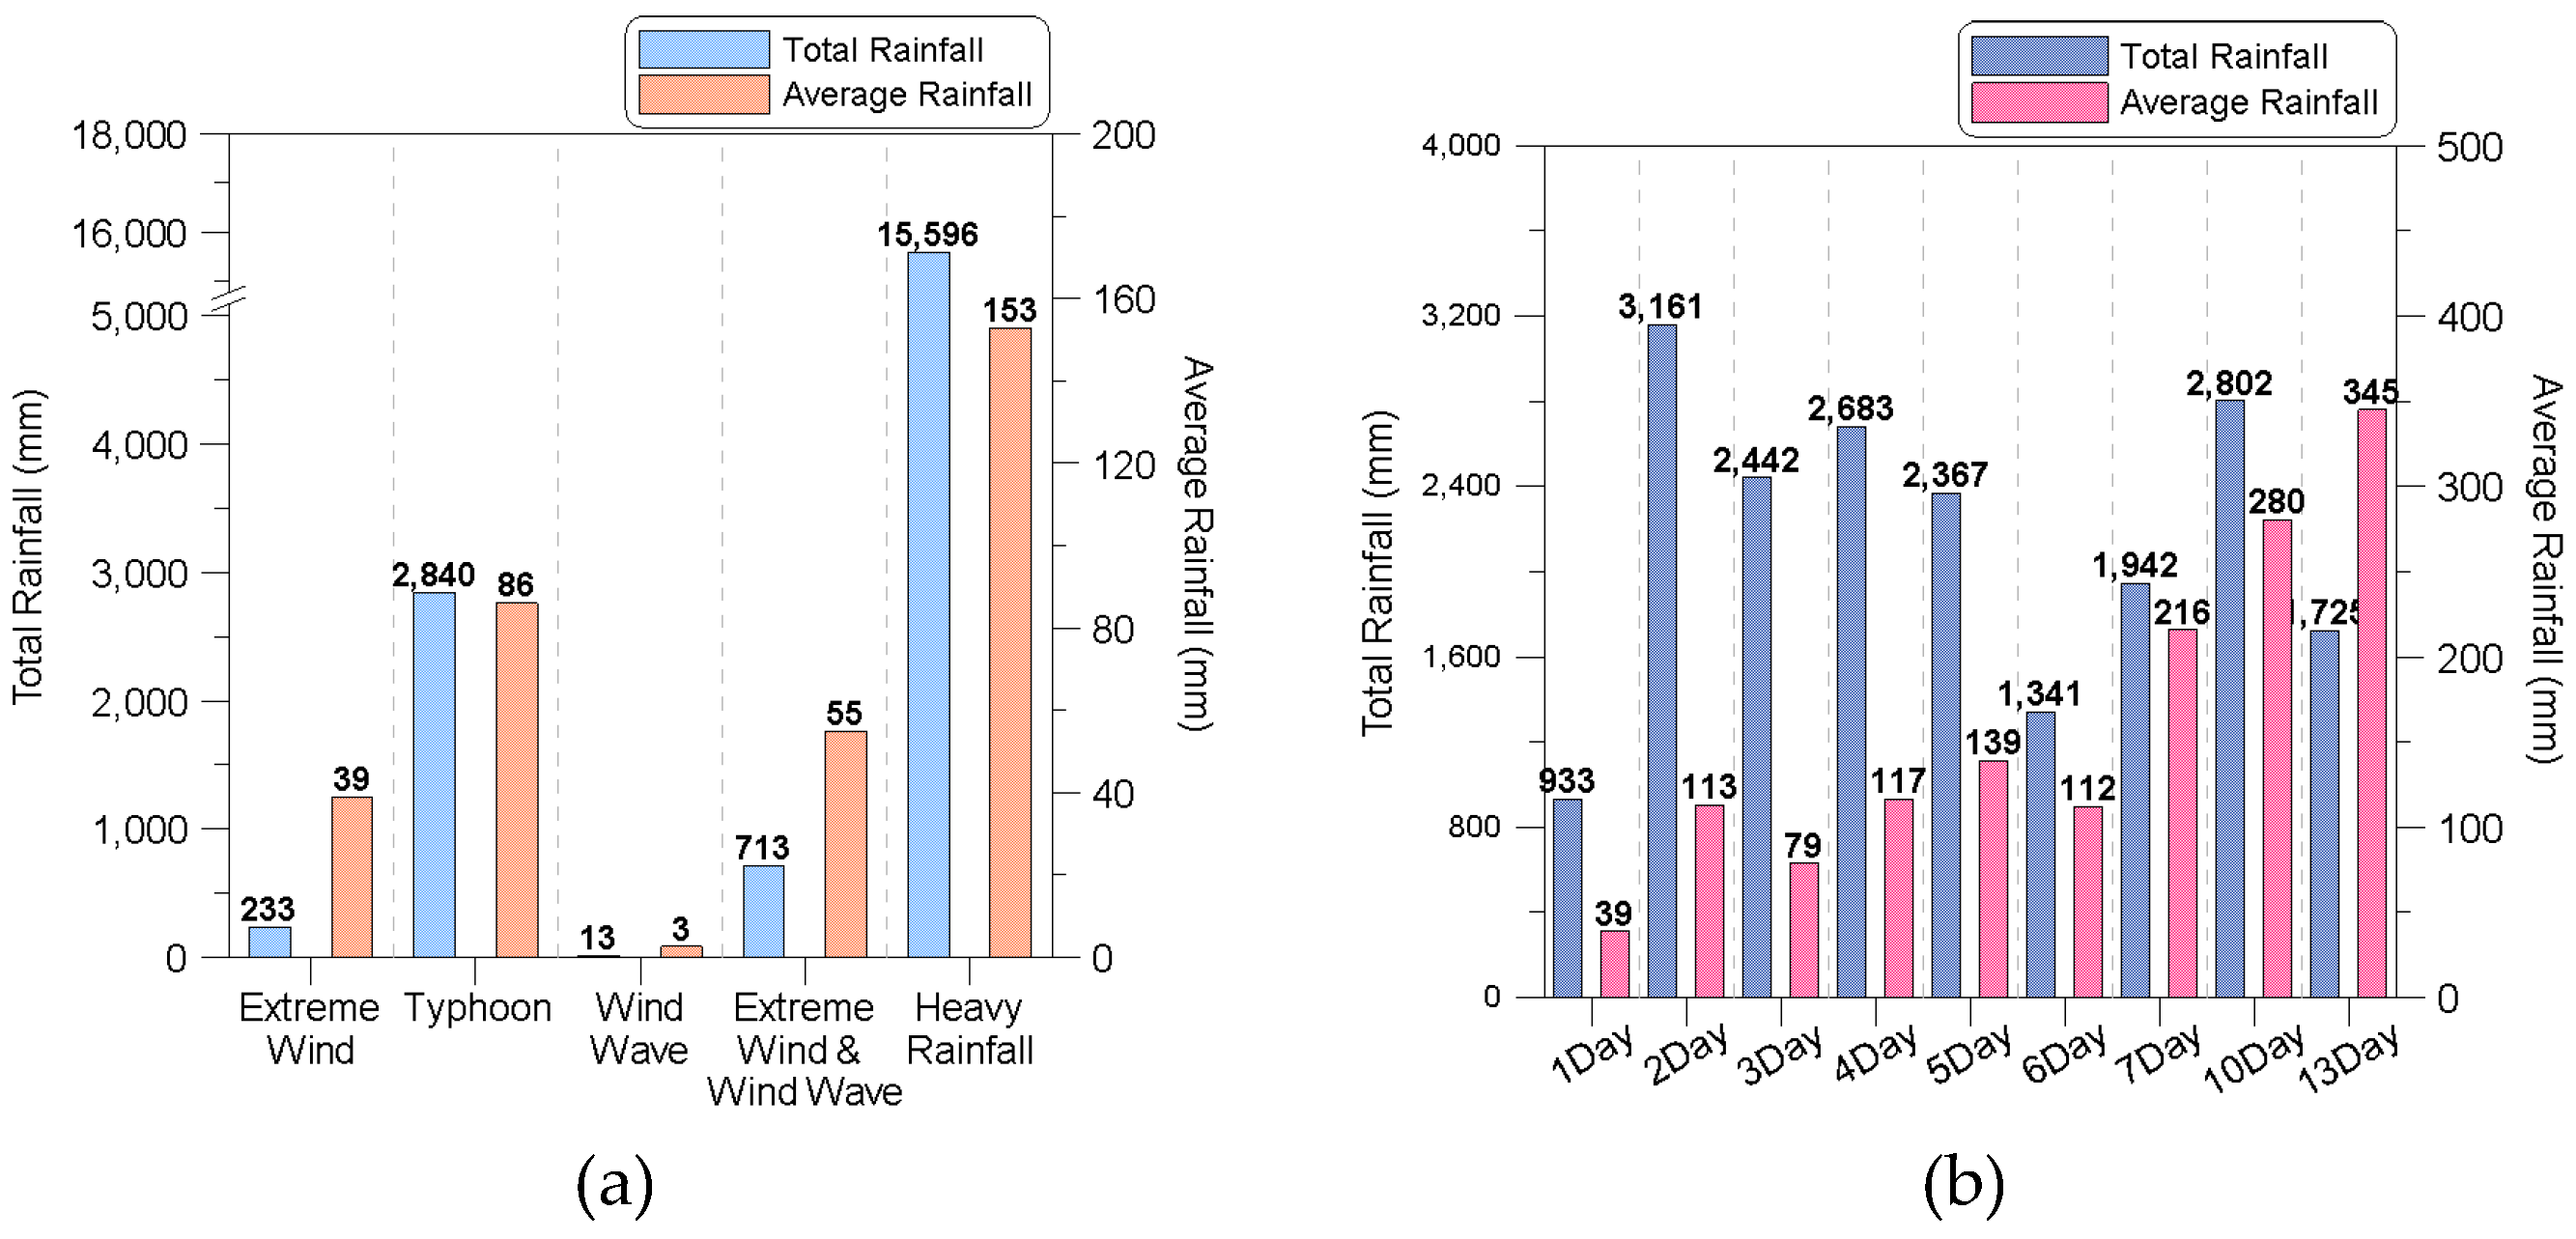
This study analyzed the rainfall characteristics with respect to the length of natural disasters from 2010 to 2017. Figure 4 shows the total and average rainfalls in the urban regions by natural disaster type and length. The total rainfall during the damage periods was 19,395 mm, ranging from 13 to 15,596 mm annually; the average rainfall was 122 mm, with a 3 mm minimum and 153 mm maximum. The rainfall characteristics of urban regions by natural disaster showed that damage occurred in various rainfall conditions such as wind waves with an average rainfall of 3 mm and heavy rainfall with an average of 153 mm. The total rainfall characteristics by length of disaster showed that damages occurred in urban regions when the total rainfall was less than 1,000 mm for 1-day events, greater than 2,000 mm in 2–5-day periods, and between 1,300–3,000 mm in 6–13-day periods. In addition, the analysis showed that natural disasters occurred when the average rainfall was 40 mm or larger in a 1-day period, over about 100 mm in 2–6-day periods, and over about 200 mm in 7–13-day periods.
Table 4 shows the annual total and average rainfall by type of natural disaster that occurred in urban regions from 2010 to 2017. The annual total rainfall for the natural disasters of urban regions in this period ranged from 286 to 5,087 mm. Meanwhile, damage occurred when the annual average rainfall was between 43 and 254 mm. The largest annual damage caused by natural disaster was displayed by heavy rainfall in 2011, whereby the total rainfall was 4596 mm and the average was 287 mm. On the other hand, the smallest annual damage was inflicted by the wind wave in 2015 with 13 mm of rainfall.
3. Results
3.1. Development of Rainfall Estimation Equation by Duration According to Length of Disaster
3.1.1. Rainfall Characteristics by Time Duration with Respect to Length of Disaster
The damage caused by natural disasters occurred 159 times over eight years in the target urban regions, and various rainfall characteristics were investigated in terms of disaster length in days and time duration in hours. Rainfall representing damage from natural disasters can be classified by the magnitude of rainfall with respect to the length of rainfall occurrence and time duration. The maximum rainfall that occurred is used in various design standards to estimate a representative rainfall that produces natural disaster damage. Therefore, this study analyzed the maximum rainfall for the length of disaster occurrence periods of 1–13 days and time durations of 1–24 h.
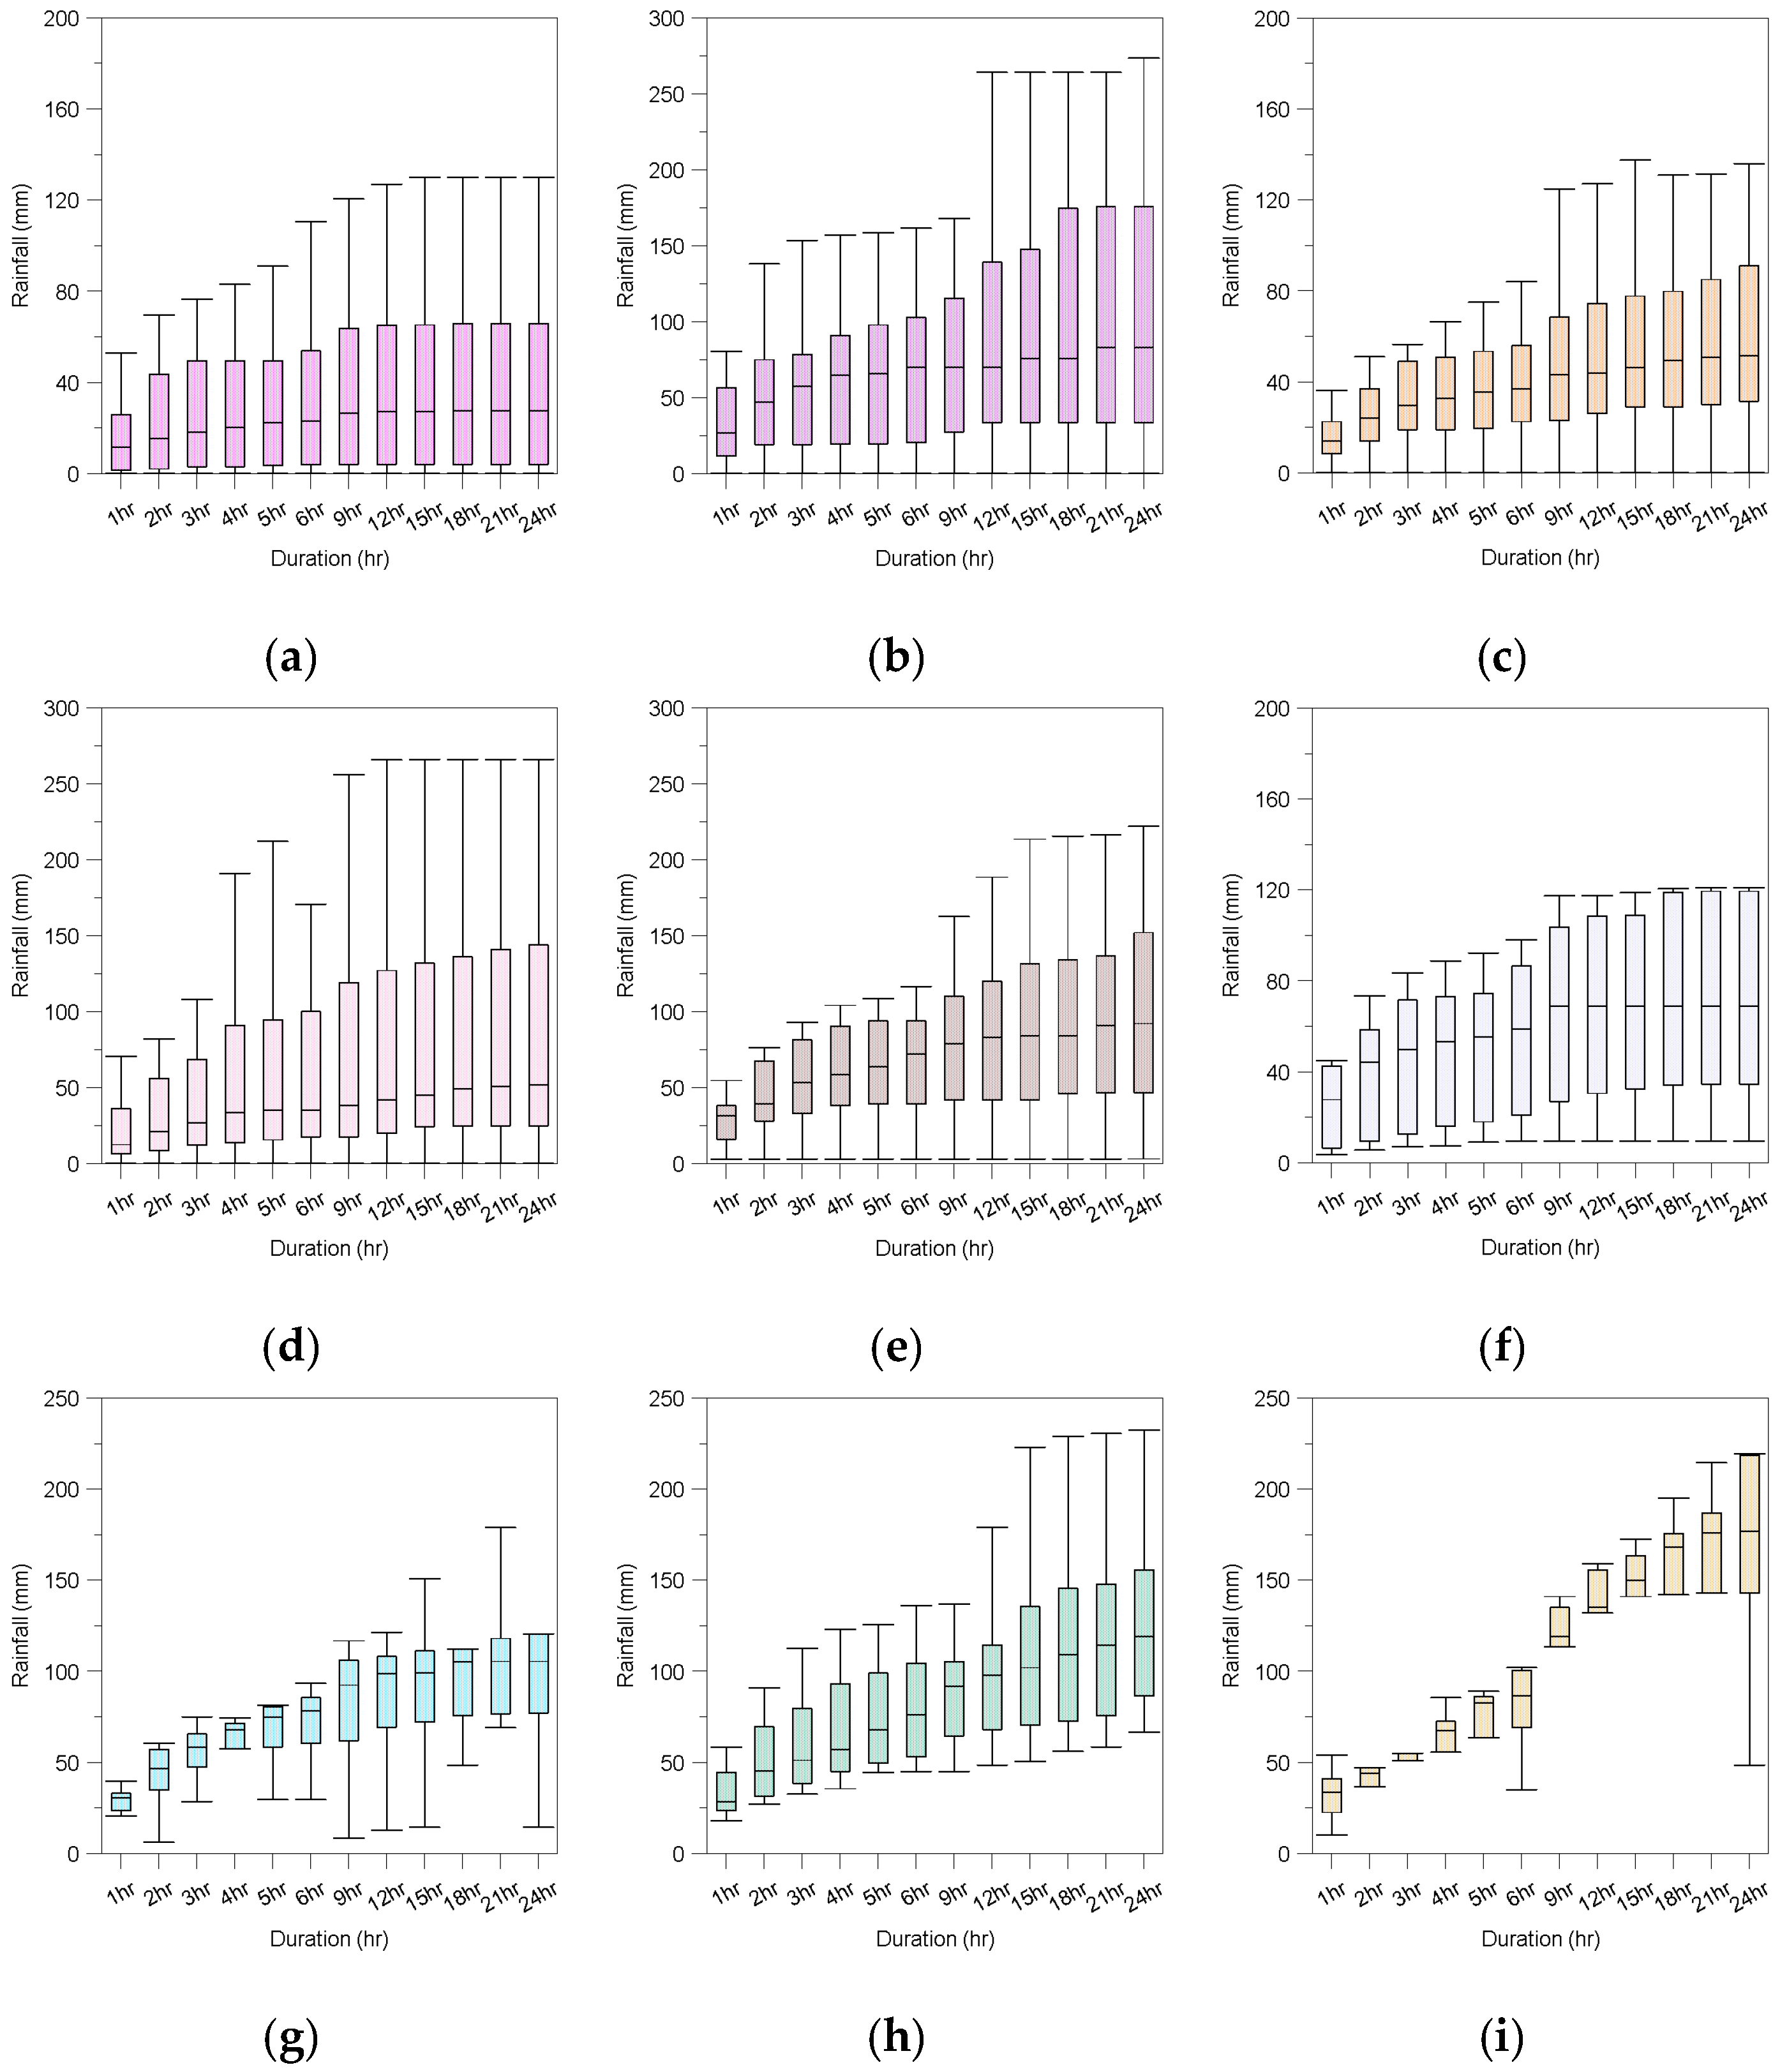
The maximum rainfall was calculated by time duration with respect to the length of the period in which natural disasters occurred. Figure 5 shows the ranges of maximum rainfalls using box-plot graphs. As the time duration increased, the range of maximum rainfall increased for the corresponding length of disaster occurrence period. Damage occurred due to natural disasters when the maximum rainfall was less than or equal to 50 mm at 1-hour duration and in the range of 150–250 mm at 24-hour duration. Furthermore, as the length of disaster increased from 1 to 13 days and the time duration increased from 1 to 24 h, the magnitude of rainfall increased. The rainfall by duration as shown in the box-plot graphs increased about two times for 1–6-day periods and about 3–5 times for 7–13-day periods.
The range of maximum rainfall by time duration was examined for the respective lengths of disasters in urban regions. Furthermore, average rainfall was used as the rainfall representing each damage event. Table 5 shows the average rainfall representing the time durations for different lengths of disasters in urban regions. The average rainfall was 17 mm at 1-day and 1-hour (the shortest disaster occurrence period and duration), and 161 mm at 13-day and 24 h (the longest). The average rainfall by duration for respective lengths of disaster occurrence period showed that rainfall increased as the length of disasters and duration increased. However, it did not increase continuously from 1 to 13-day periods. The analysis showed a trend that the average rainfall decreased at 3-days and 6-days and increased again in steps.
Natural disaster damage occurred when the average rainfall by duration was 17–32 mm in 1-day periods, 32–102 mm for 2-day, 17–62 mm for 3-day, 24–95 mm for 4-day, 29–103 mm for 5-day, 24–71 mm for 6-day, 27–111 mm for 7-day, 33–131 mm for 10-day, and 32–161 mm for 13-day.
The duration when the average rainfall corresponded to 50% of total rainfall according to the length of disaster occurrence period was 1–3 h for 1–6-day periods and 4–7 h for 7–13-day periods. The duration when the average rainfall corresponded to 80% was 5 h for 1-day periods, 7–10 h for 2–7-day periods, and 11–12 h for 10–13-day periods. Damage from natural disasters occurred in urban areas in as little as 1–3 h and before 12 h at the latest, depending on the length of disaster.
3.1.2. Development of Rainfall Estimation Equation for Occurrence of Natural Disaster Damage in Urban Areas
In general, inundation damage in urban areas occurs due to sewer pipes’ insufficient water control capacity caused by increased impervious areas from gray urbanization and short reach time. Furthermore, when rain falls for a long period, damage from natural disasters occurs because of external inundation by overflowing rivers and complex reactions between sewer pipes and rivers. Major facilities in urban areas are installed based on design standards, but it is difficult to reflect the increases of heavy rainfall and typhoons, which are effects of recent climate change, in these standards.
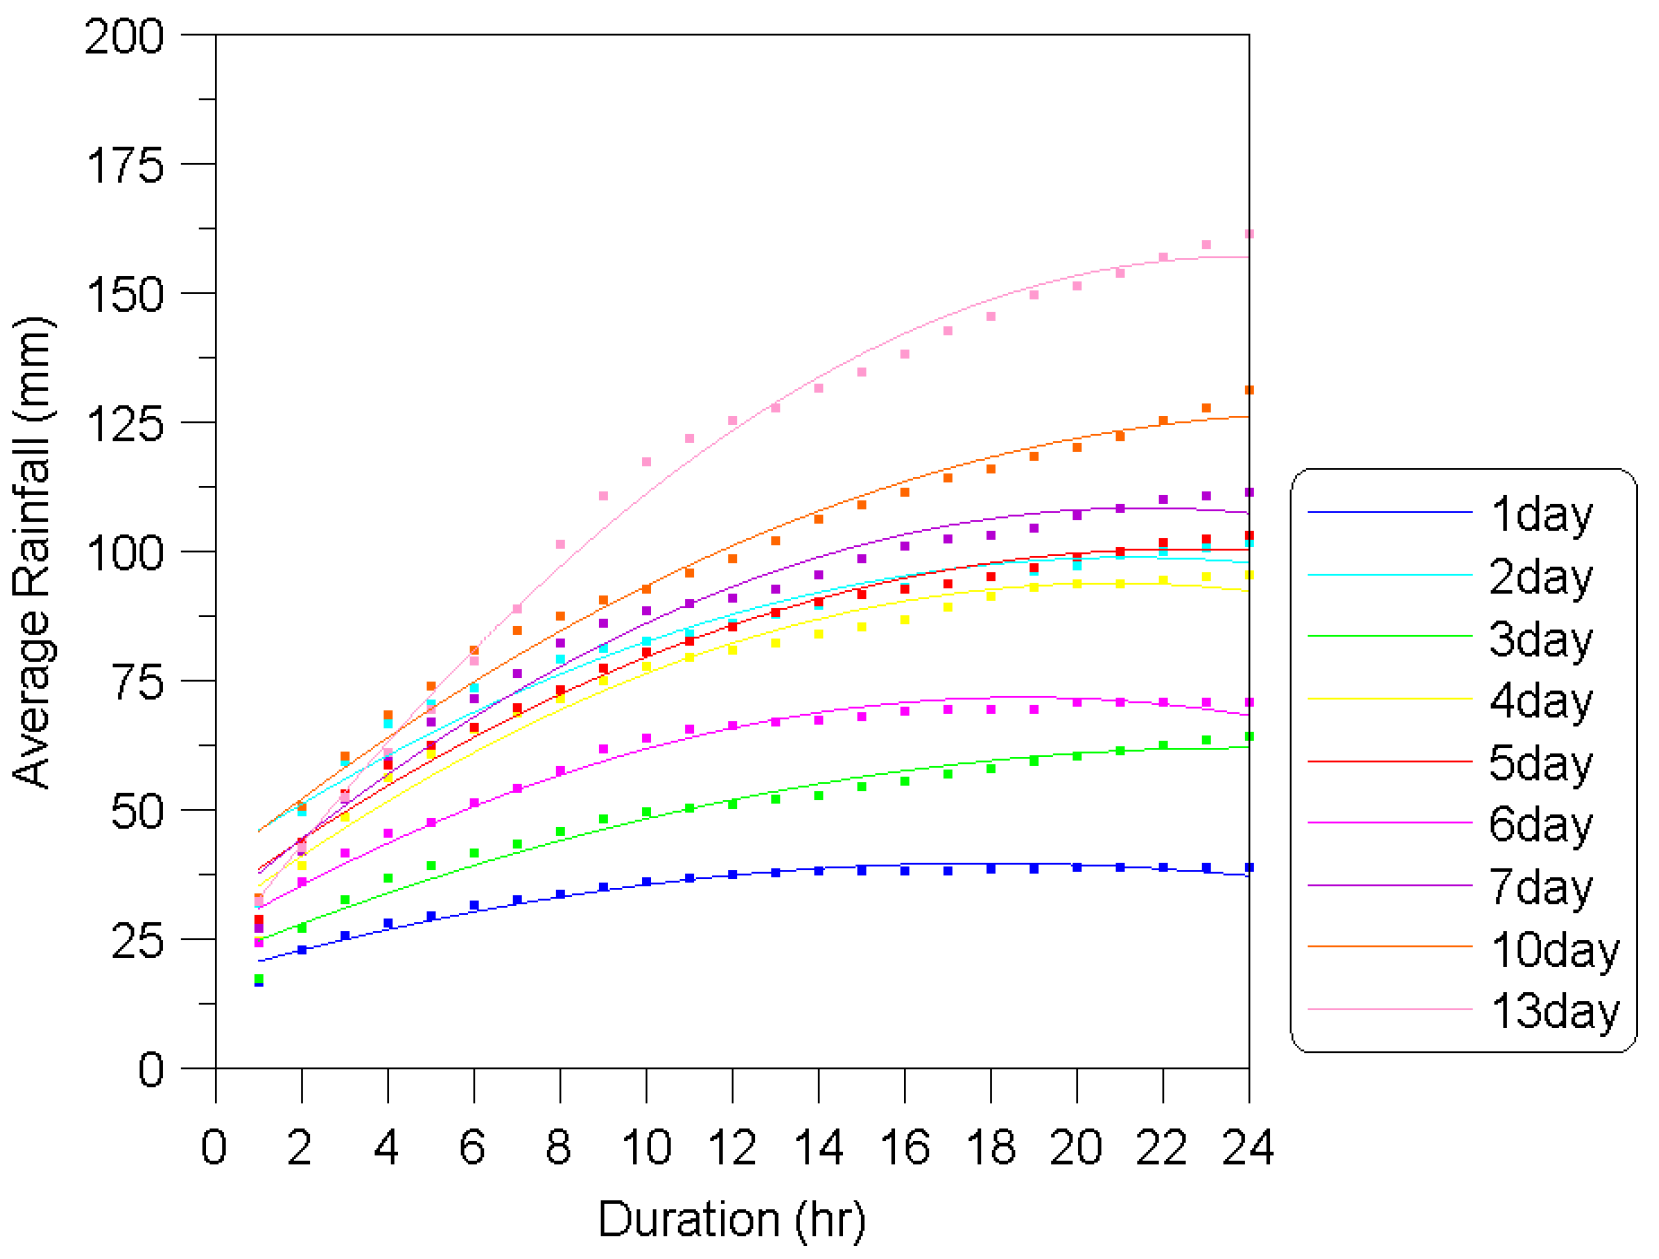
This study aimed to develop an estimation equation of rainfall by duration according to length of disasters targeting the damages in urban areas due to natural disasters. Section 3.1.1 analyzed the average rainfall representing the duration for different lengths of disaster occurrence period based on the damages occurred in urban areas due to natural disasters from 2010 to 2017. With respect to the relationship between the length of disaster and rainfall inducing natural disaster damages, Figure 6 shows the graph of regression analysis for 1–13 days using the duration (1–24 h) as x-axis and the average rainfall as y-axis.
A quadratic regression equation was calculated to estimate the rainfall with respect to occurrence of natural disaster damage in urban areas. Equation (1) is an integrated equation that can apply the disaster occurrence periods of 1–13 days.
where Z is the average rainfall (mm), X is the duration (hours), and a, b, and c are constants.
For the rainfall equation with respect to occurrence of natural disaster damage in an urban area, the regression equation was calculated nine times using 1-day, 2-day, 3-day, 4-day, 5-day, 6-day, 7-day, 10-day, and 13-day durations. R-squared was 0.94–0.99, showing high correlations (Table 6). The constant values of parameters for the lengths of disaster occurrence periods were 18.29–40.59 for a, 2.38–11.31 for b, and 0.07–0.24 for c.
3.2. Development of Disaster-Prevention Rainfall Equation for Disaster Mitigation
3.2.1. Characteristics of Disaster-Prevention Rainfall by Duration for Disaster Mitigation
Damage from natural disaster occurs in urban areas based on various effects such as rainfall duration, length of disaster, and geographic characteristics. Section 3.1 examined the cases of damage in urban areas due to natural disasters from 2010 to 2017 and provided an estimation equation for analyzing the relationship between the length of disaster occurrence period (days) and the rainfall duration (hours).
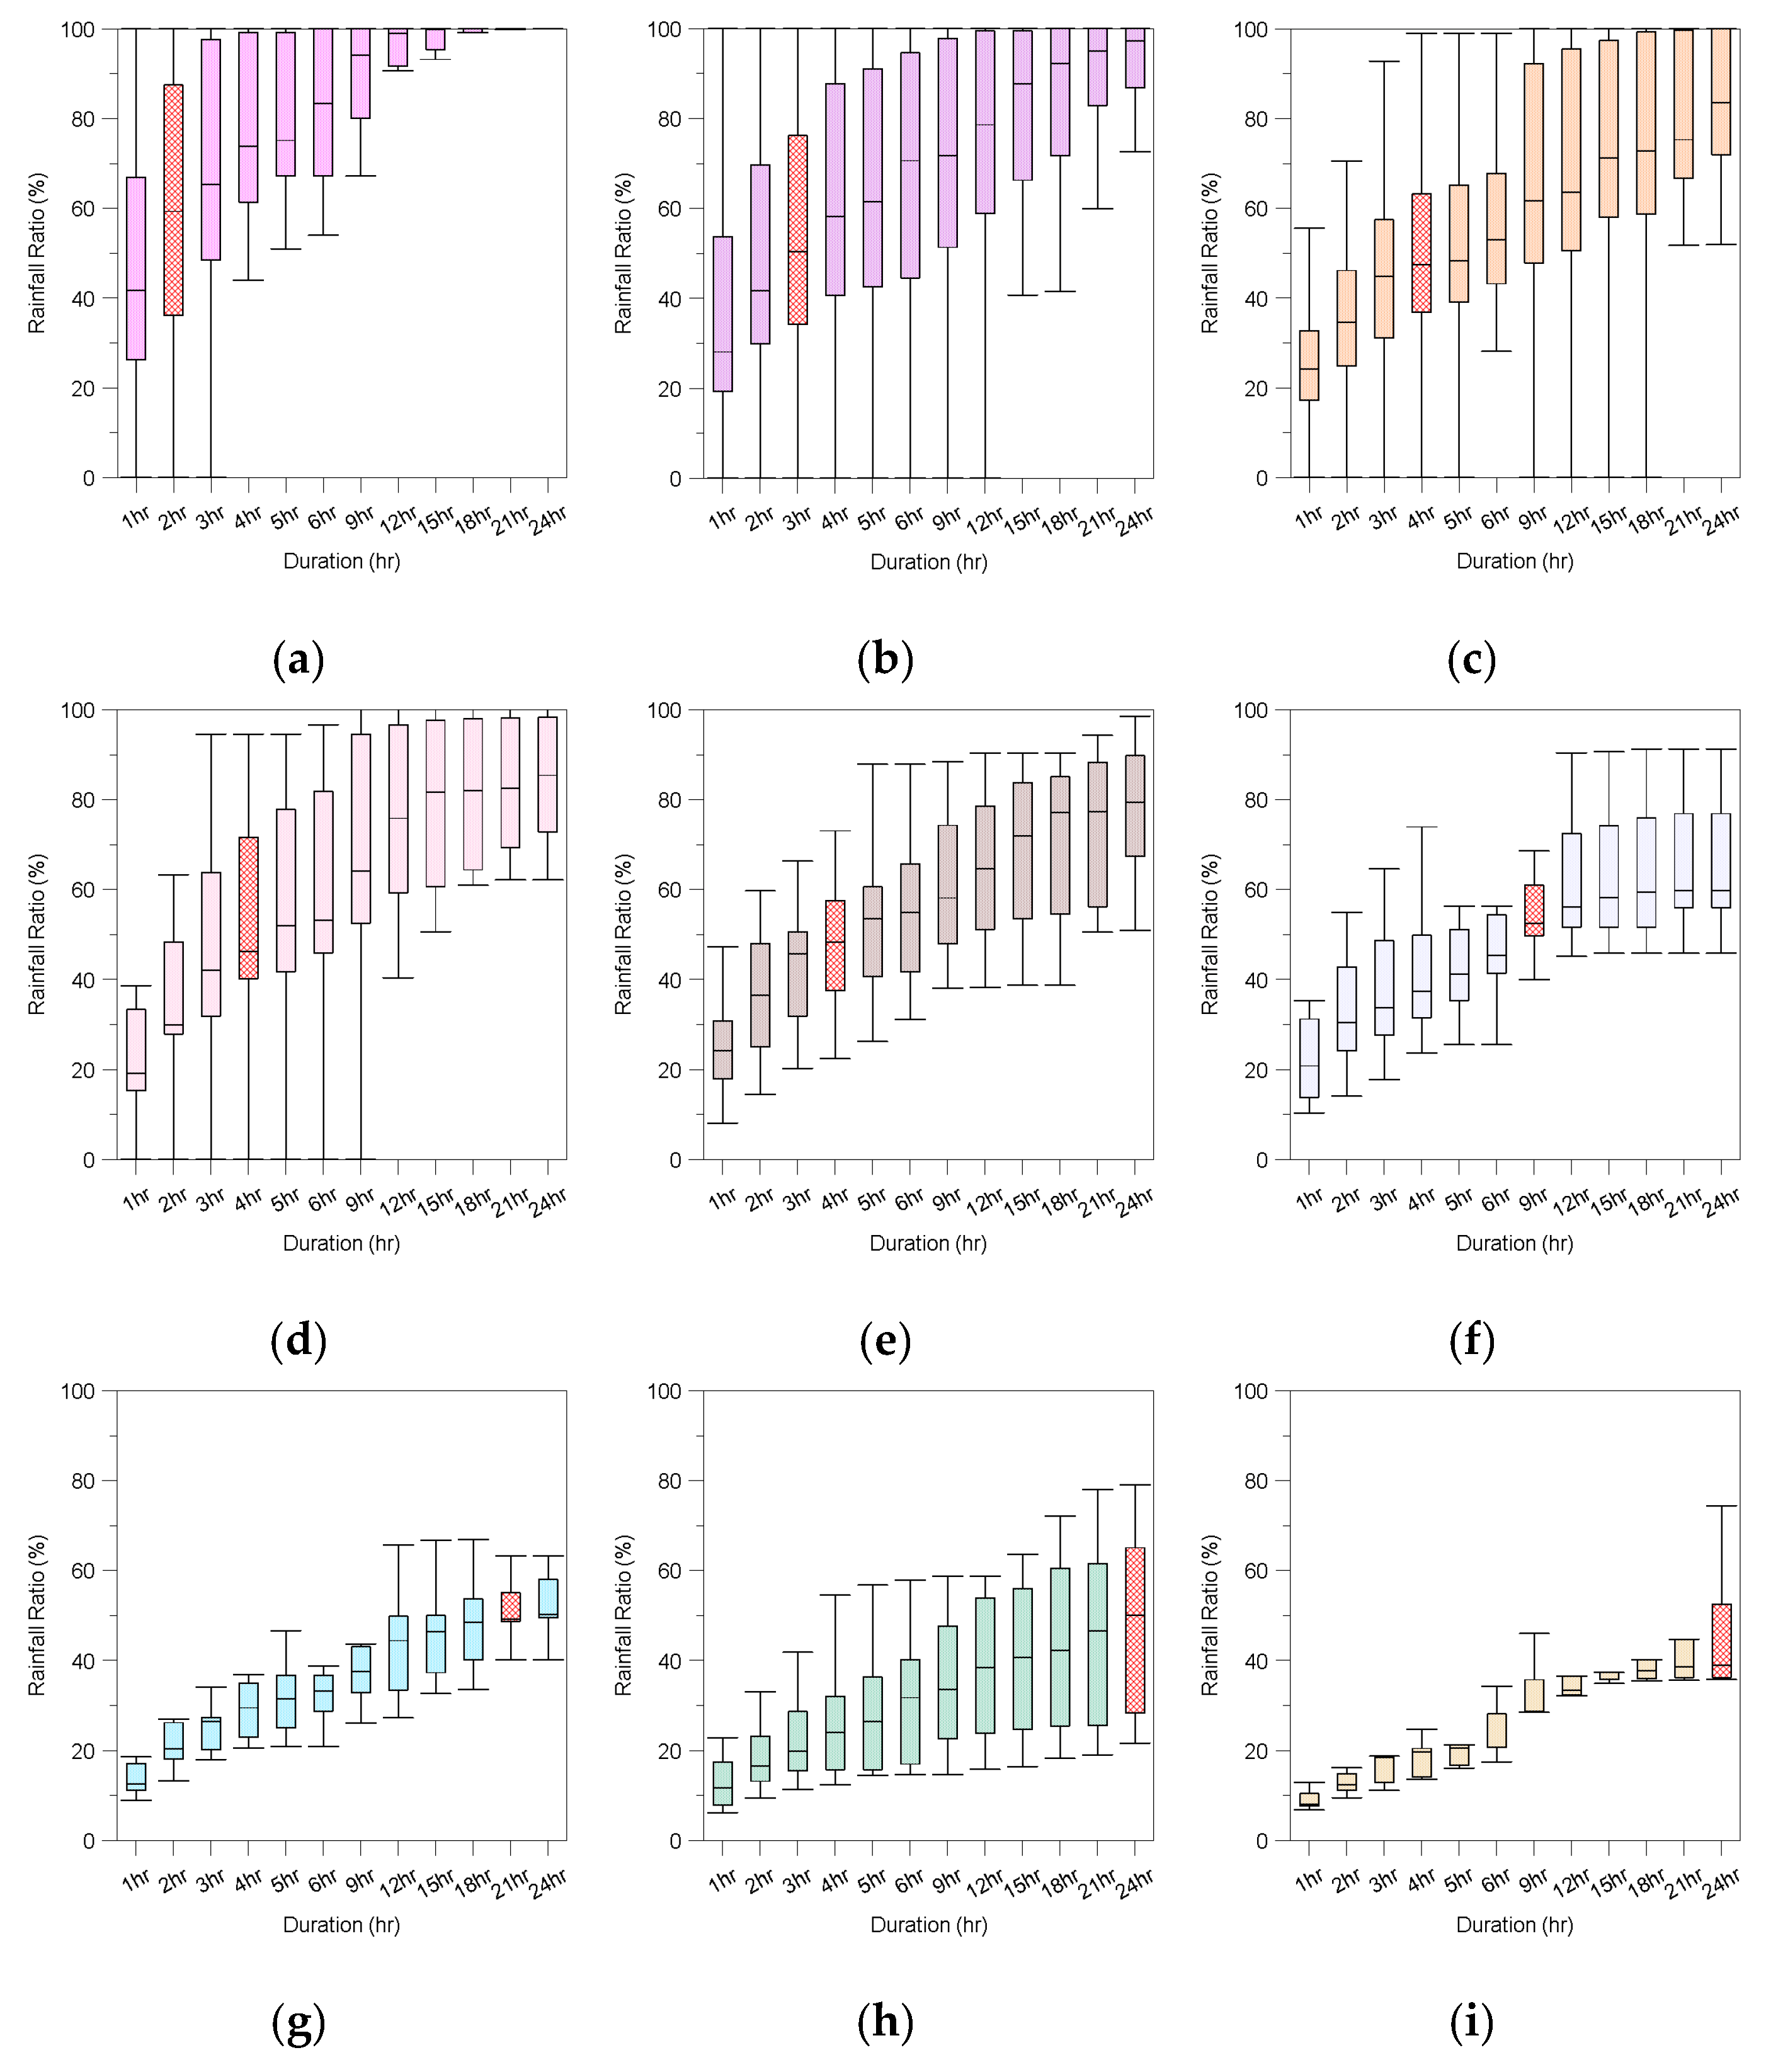
This study aimed to establish a disaster-prevention standard for disaster mitigation of rainfall in urban areas by setting a representative rainfall duration according to the length of disaster. To establish the standard of rainfall-related disaster-prevention, the ratio of average rainfall by duration to total rainfall according to the length of disaster was calculated using 1–13 days for the length of disaster occurrence period and 1–24 h for the rainfall duration, as shown in Figure 7.
The design standards of South Korea do not specify the selection of rainfall with respect to duration that represents the length of a natural disaster in an urban area. The results of analyzing the ratio of average rainfall to total rainfall by duration according to the length of disaster demonstrated that it was appropriate to select the duration, in which about 50% of total rainfall occurs, for the representative duration’s rainfall that can consider all different lengths of disaster occurrence periods.
The rainfall-related disaster-prevention standard proposed in this study for disaster mitigation in urban areas is a result of performing analysis based on the cases of damage from natural disasters in the past and included all disaster lengths. The longest period of disaster occurrence in urban areas was 13 days and the ratio of average rainfall by duration to total rainfall corresponded to about 50% at 24 h.
About 50% ratio by duration occurred at 2 h for 1-day periods, 3 h for 2-day, 4 h for 3–5-day, 9 h for 6-day, 21 h for 7-day, and 24 h for 10-day and 13-day. These results imply that the damage risks from short-duration rainfall in urban areas reported by previous studies can be sufficiently reflected; furthermore, they can be applied to long-term damages as well.
Table 7 shows the ratio of rainfall to total rainfall by duration according to the length of disaster. The minimum ratio was 9% and the maximum was 83%. The ratio of rainfall to total rainfall decreased as the duration and length of disaster period increased. The rainfall ratio of durations 1–24 h according to the length of disaster was 44–83% for 1-day period, 34–83% for 2-day, 24–78% for 3-day, 23–82% for 4-day, 27–77% for 5-day, 21–64% for 6-day, 14–53% for 7-day, 13–50% for 10-day, and 9–48% for 13-day. The relationship of rainfall ratio with the length of disaster and duration showed that rainfall ratio decreased as the length of disaster increased and increased as the duration increased. The rainfall ratio for the duration of 24 h corresponded to about 80% when the length of disaster occurrence period was 1–5 days, about 60% for 6-day period; and about 50% for 7–13-day period.
3.2.2. Development of Equation for Rainfall-Related Disaster-Prevention of Urban Areas
Damage from natural disasters in urban areas occurred due to the effect of rainfall by duration in disaster periods as short as 1 day and as long as 13 days. A mitigation standard capable of considering the rainfall duration for different lengths of disasters based on past natural disaster damage should be established to develop an estimation equation of disaster-prevention rainfall for disaster mitigation in urban areas. Section 3.2.1 analyzed the ratio of average rainfall by duration to the total rainfall of disaster periods, and the results showed that the duration at which the rainfall ratio corresponded to about 50% was appropriate for the rainfall-related disaster-prevention standard for disaster mitigation of urban areas. The parameters used for the development of the disaster-prevention rainfall equation for urban areas were length of disaster occurrence period, duration, and average rainfall, as shown in Table 8.
For the rainfall-related disaster-prevention estimation equation of urban areas, Equation (2) was provided by applying multiple regression analysis. The dependent variable Z in the equation is the average rainfall, an independent variable Y is the length of disaster, and X is the duration. In the equation developed using the multiple regression analysis, the value of adjusted R² is 0.932, F=55.572 for the dependent displacement and two independent displacements, and the level of significance Sig = 0.000, which is smaller than 0.05, indicating that the significance is quite high for the use of the rainfall-related disaster-prevention equation for disaster mitigation in urban areas (Table 9).
The regression coefficient and multicollinearity index were analyzed for each parameter of a dependent variable and independent variables in the disaster-prevention rainfall equation for urban areas. T-test showed that the regression coefficient for each independent variable was significant with the significance level of 1.934–2.307%. Multicollinearity shows the correlation of independent variables, and the VIF value was 6.016, which was less than 10, confirming that the multicollinearity for independent variables was at a significant level.
4. Discussion
This study investigated rainfall damage from natural disasters in urban areas to establish an urban rainfall-related disaster-prevention standard for disaster mitigation by rainfall duration in South Korea. The outcomes of this study are as follows. First, an equation was developed for estimation of rainfall by duration according to the length of disasters for urban areas where damage from natural disasters occurred. Second, a rainfall-related disaster-prevention standard was established using an equation that set the representative rainfall by duration according to the length of disaster to mitigate damage in urban areas.
Existing studies investigated inundation damage based on the effect of sewer pipes and increased runoff in urban settings [30,31,32,33]. Effects of inundation damages and mitigation measures were proposed by applying rainfall conditions, such as past cases of damage, changes in land use, rainfall in 1–3-hour durations, and 1-day rainfall periods [33,34,35,36]. The results of previous studies showed the damage characteristics of urban areas but had difficulty in considering the overall effects for disaster mitigation.
As the first outcome, this study proposed respective equations of rainfall by duration according to the length of disasters, in which damage caused by natural disasters is expected in urban areas. In this outcome, an equation was used to calculate the relationship of rainfall with the length of disaster and rainfall duration whereby damages occurred due to natural disasters in an eight-year period, targeting seven urban regions of South Korea. This study developed a comprehensive equation that can consider not only the damages occurring in a short period (as shown in Section 3) but also damages occurring over a long period. Many studies have mentioned that runoff in urban areas produces damage from increased rainfall, short reach time, and increase in impervious area. However, damage in urban areas actually occurs with respect to various lengths of disaster occurrence period, and rainfall increases as the duration increases. Although there is a limitation as rainfall does not occur continuously during a disaster occurrence period, mitigation measures are needed for long-period rainfall as well.
The predictability is low and the uncertainty is high for natural disaster damage to urban areas because they occur due to not only the impacts of rainfall, sewer pipes, and land uses, but also complex effects between these factors [45,46,48]. Therefore, a minimal standard should be established to resolve such uncertainties [51,52,53,54,55,56,57,58]. The existing studies’ results proposed improvement of sewer pipes, installation of mitigation facilities, policy improvement methods, etc. but had difficulty in presenting a quantitative standard for prevention of disaster in urban areas.
To resolve this problem, this study proposed a rainfall-related disaster-prevention equation for urban areas. A minimal standard was established for occurrence of damage in urban areas through multiple regression analysis by selecting a representative rainfall by duration according to the length of disaster. The rainfall duration corresponding to about 50% of total rainfall according to the length of disaster was selected as the representative rainfall of a disaster’s length and duration. The rainfall-related disaster-prevention is a minimal standard that can mitigate overall disaster in urban areas. It was calculated by considering the length of disaster and rainfall duration in past damage cases.
Because great damage occurs even in a small section of a city, people’s safety increases as the standard for disaster mitigation increases. However, an approach is needed, based on the concept that disasters larger than a minimal standard should be mitigated, that considers the design standards of facilities across society, their year of installation, financial factors, etc. Therefore, this study proposed a disaster-prevention rainfall standard for urban areas considering all lengths of disaster.
5. Conclusions
Because of recent global climate changes, rainfall frequency has increased, exceeding the frequency assumed by the design of disaster-prevention and -mitigation standards. Coupled with short reach time and high degree of impervious areas in cities, this has led to high human and financial costs. Because residential houses and social infrastructures are concentrated in the urban areas, great damage is induced even if only a small area is affected. This study developed rainfall equations for the mitigation of natural disaster-induced damage based on past damage from natural disasters in urban areas to set the disaster-prevention rainfall.
Eight target regions were selected among 17 administrative regions (cities and provinces) of South Korea by applying the following criteria: the urbanization ratio is about 50% and the population per area is over 1.00 (thousand people/km2). The selected urban regions were Seoul and seven other metropolitan South Korean cities. They were administrative regions that had carried out urban developments since the 1980s. The damages of natural disasters occurred in eight years from 2010 to 2017 were classified into five types and the total occurrence frequency and the total damage cost were 159 times and US$292,417, respectively. Among the rainfall observatories operated by the KMA in the target regions, the following were selected: rainfall observatories having observation data of over 30 years and applied to various design standards. The damages of natural disasters occurred in urban areas when the average rainfall was 122 mm with the minimum of 3 mm and the maximum of 153 mm.
For the calculation of rainfall by duration according to the length of disaster, the average rainfall data were used with respect to the durations of 1–24 h and the disaster of 1–13 days. The rainfall equation for the natural disaster damage in urban areas was calculated using a regression equation for 1–13 days with the duration (1–24 h) as x-axis and the average rainfall as y-axis. The rainfall equation for natural disaster damage occurrence in urban areas is and the parameters a, b, and c were calculated according to the length of disaster occurrence period. The coefficient of the equation was over 0.94–0.99, showing high correlation.
The equation of disaster-prevention rainfall was developed by selecting representative rainfalls for the duration and the length of disaster to mitigate the disasters in urban areas. For the representative rainfall calculation, 50% was used as the ratio of average rainfall of duration to total rainfall. Applying multiple regression analysis, in the disaster-prevention rainfall equation for urban areas was calculated and the analysis showed a high correlation of 0.932.
The two equations developed in this study consider damages from natural disasters occurring in urban areas and can be used as a baseline for determining occurrence/non-occurrence of disasters. Furthermore, this study developed a disaster-prevention rainfall equation for urban areas to establish a minimal standard of disaster mitigation. The purpose of the rainfall estimation equation by duration according to length of disaster is to predict the damage caused by a disaster by using the weather forecast. When the length of rainfall occurrence is predicted for an urban area, it is compared with rainfall that occurred during previous natural disasters and suggests a standard to judge prevention and response. The disaster-prevention rainfall equation for disaster mitigation is applied as the minimum standard for the installation of disaster mitigation facilities and infrastructure in urban areas. The installation of disaster mitigation facilities and infrastructure in urban areas is carried out in accordance with the design criteria.
The disaster-prevention rainfall equation can be used to assess the resilience of infrastructure and facilities to disaster by comparison with the information about the likely duration of rainfall.
In this study, the disaster-prevention rainfall equation that can be applied to various urban areas did not consider land use, which is a representative hydrological characteristic of urban areas. In a future study, the change of land use according to urban development and the damage effects of natural disasters will be compared and analyzed.
Author Contributions
Conceptualization, Y.S. and M.P.; methodology, M.P.; validation, Y.S. and M.P.; formal analysis: Y.S.; resources, Y.S.; data curation, Y.S.; writing—original draft preparation, Y.S.; writing—review and editing, M.P.; visualization, Y.S.; supervision, M.P.; project administration, M.P. All authors have read and agreed to the published version of the manuscript.
Acknowledgments
This work was funded by the Korea Meteorological Administration Research and Development Program under Grant KMI (2018-03010).
Conflicts of Interest
The authors declare no conflict of interest.
References
- Albano, R.; Sole, A.; Mirauda, D.; Adamowski, J. Modelling large floating bodies in urban area flash-floods via a Smoothed Particle Hydrodynamics model. J. Hydrol. 2016, 541, 344–358. [Google Scholar] [CrossRef]
- Guinot, V.; Sanders, B.F.; Schubert, J.E. Dual integral porosity shallow water model for urban flood modelling. Adv. Water Resour. 2017, 103, 16–31. [Google Scholar] [CrossRef] [Green Version]
- Mair, A. The homeless and the post-industrial city. Political Geogr. Q. 1986, 5, 351–368. [Google Scholar] [CrossRef]
- Dekay, M.; O’Brien, M. Grey city, green city. FORUM Appl. Res. Public Policy 2001, 16, 19–27. [Google Scholar]
- Satterthwaite, D. How urban societies can adapt to resource shortage and climate change. Philos. Trans. R. Soc. A 2011, 369, 1762–1783. [Google Scholar] [CrossRef] [Green Version]
- World Bank. Climate Resilient Cities, 2008 Primer: Reducing Vulnerabilities to Climate Change Impacts and Strengthening Disaster Risk Management in East Asian Cities; World Bank: Washington DC, USA, 2008. [Google Scholar]
- IPCC. Managing the Risks of Extreme Events and Disasters to Advance Climate Change Adaptation: Special Report of the Intergovernmental Panel on Climate Change; Cambridge University Press: Cambridge, UK, 2011.
- Wisner, B.; Blaikie, P.; Cannon, T.; Davis, I. At Risk: Natural Hazards, People’s Vulnerability and Disaster; Routledge: Abingdon, VA, USA, 1994. [Google Scholar]
- IPCC. Climate Change 2007; Cambridge University Press: Cambridge, UK, 2007.
- Duan, W.L.; He, B.; Takara, K.; Luo, P.P.; Nover, D.; Yamashiki, Y.; Huang, W.R. Anomalous atmospheric events leading to Kyushu’s flash floods, July 11–14, 2012. Nat. Hazards 2014, 73, 1255–1267. [Google Scholar] [CrossRef]
- Public Utilities Board of Singapore. Report on Key Conclusions and Recommendations of the Expert Panel on Drainage Design and Flood Protection Measures; PUB: Singapore, 2012.
- Escuder-Bueno, I.; Castillo-Rodríguez, J.T.; Zechner, S.; Jöbstl, C.; Perales-Momparler, S.; Petaccia, G. A quantitative flood risk analysis methodology for urban areas with integration of social research data. Nat. Hazards Earth Syst. Sci. 2012, 12, 2843–2863. [Google Scholar] [CrossRef]
- Parliamentary Office of Science and Technology. Urban Flooding, July 2007: POSTnote Number 289; POST: London, UK, 2007. [Google Scholar]
- Chen, S.Y.; Xue, Z.C.; Li, M.; Zhu, X.P. Variable sets method for urban flood vulnerability assessment. Sci. China Technol. Sci. 2013, 56, 3129–3136. [Google Scholar] [CrossRef]
- Zhu, Z.; Chen, Z.; Chen, X.; He, P. Approach for evaluating inundation risks in urban drainage systems. Sci. Total Environ. 2016, 553, 1–12. [Google Scholar] [CrossRef]
- Yin, J.; Yu, D.; Yin, Z.; Liu, M.; He, Q. Evaluating the impact and risk of pluvial flash flood on intra-urban road network: a case study in the city center of Shanghai, China. J. Hydrol. 2016, 537, 138–145. [Google Scholar] [CrossRef] [Green Version]
- IPCC. Climate Change 2014: Synthesis Report. Contribution of Working Groups I, II and III to the Fifth Assessment Report of the Intergovernmental Panel on Climate Change; IPCC: Geneva, Switzerland, 2014.
- Du, J.K.; Qian, L.; Rui, H.Y.; Zuo, T.H.; Zheng, D.P.; Xu, Y.P.; Xu, C.Y. Assessing the effects of urbanization on annual runoff and flood events using an integrated hydrological modeling system for Qinhuai River basin, China. J. Hydrol. 2012, 464–465, 127–139. [Google Scholar] [CrossRef]
- Yin, J.; Yu, D.; Yin, Z.; Wang, J.; Xu, S. Modelling the anthropogenic impacts on fluvial flood risks in a coastal mega-city: A scenario-based case study in Shanghai, China. Landsc. Urban Plan. 2015, 136, 144–155. [Google Scholar] [CrossRef]
- Luino, F.; Turconi, L.; Petrea, C.; Nigrelli, G. Uncorrected land-use planning highlighted by flooding: the Alba case study (Piedmont, Italy). Nat. Hazards Earth Syst. Sci. 2012, 12, 2329–2346. [Google Scholar] [CrossRef] [Green Version]
- Paliaga, G.; Faccini, F.; Luino, F.; Turconi, L. A spatial multicriteria prioritizing approach for geo-hydrological risk mitigation planning in small and densely urbanized Mediterranean basins. Nat. Hazards Earth Syst. Sci. 2019, 19, 53–69. [Google Scholar] [CrossRef] [Green Version]
- Marchi, L.; Borga, M.; Preciso, E.; Gaume, E. Characterisation of selected extreme flash floods in Europe and implications for flood risk management. J. Hydrol. 2010, 394, 118–133. [Google Scholar] [CrossRef]
- Roccati, A.; Faccini, F.; Luino, F.; De Graff, J.V.; Turconi, L. Morphological changes and human impact in the Entella River floodplain (Northern Italy) from the 17th century. CATENA 2019, 182, 104122. [Google Scholar] [CrossRef]
- Brody, S.D.; Zahran, S.; Highfield, W.E.; Grover, H.; Vedlitz, A. Identifying the impact of the built environment on flood damage in Texas. Disasters 2007, 32, 1–18. [Google Scholar] [CrossRef]
- Schwab, J. Planning for Post-Disaster Recovery and Reconstruction; American Planning Association: Chicago, IL, USA, 1998. [Google Scholar]
- Godschalk, D.R.; Beatley, T.; Berke, P.; Brower, D.J.; Kaiser, E.J. Natural Hazard Mitigation: Recasting Disaster Policy and Planning; Island Press: Washington, DC, USA, 1999. [Google Scholar]
- Bronstert, A.; Niehoff, D.; Bürger, G. Effects of climate and land-use change on storm runoff generation: Present knowledge and modelling capabilities. Hydrol. Process. 2002, 16, 509–529. [Google Scholar] [CrossRef]
- U.S. Environmental Protection Agency (EPA). Water-smart landscapes: Start with WaterSense; EPA: Washington, DC, USA, 2013.
- Choi, C.Y. Panel Models about Determining Factors of Urban Flood Damages in Korea and Policy Implications. Ph.D. Thesis, Seoul National University, Seoul, Korea, 2004. [Google Scholar]
- Oh, M.K.; Lee, D.R.; Kwon, H.H.; Kim, D.K. Development of flood inundation area GIS database for Samsung-1 drainage sector, Seoul, Korea. J. Korea Water Resour. Assoc. 2016, 49, 981–993. [Google Scholar] [CrossRef]
- Hromadka, T.V., II; Lai, C. Solving the two-dimensional diffusion flow model. In Hydraulics and Hydrology in the Small Computer Age: Proceedings of the American Society of Civil Engineers; ASCE: New York, NY, USA, 1985; pp. 555–562. [Google Scholar]
- Wasantha Lal, A.M. Performance comparison of overland flow algorithms. J. Hydraul. Eng. 1998, 124, 342–349. [Google Scholar]
- Hsu, M.H.; Chen, S.H.; Chang, T.J. Inundation simulation for urban drainage basin with storm sewer system. J. Hydrol. 2000, 234, 21–37. [Google Scholar] [CrossRef] [Green Version]
- Leandro, J.; Martins, R. A methodology for linking 2D overland flow models with the sewer network model SWMM 5.1 based on dynamic link libraries. Water Sci. Technol. 2016, 73, 3017–3026. [Google Scholar] [CrossRef] [PubMed]
- Lee, S.; Nakagawa, H.; Kawaike, K.; Zhang, H. Study on experimental validation of interaction model among sewer pipe, manhole and ground surface for development of integrated urban inundation model. In Proceedings of the 35th IAHR World Congress, Chengdu, China, 8–13 September 2013. [Google Scholar]
- Zhu, Z.; Chen, X. Evaluating the effects of low impact development practices on urban flooding under different rainfall intensities. Water 2017, 9, 548. [Google Scholar] [CrossRef]
- Randolph, J. Environmental Land Use Planning and Management; Island Press: Washington, DC, USA, 2015. [Google Scholar]
- Kaushik, C. Urban Flood Modelling—A Comparative Study for 1D and 2D Models; UNESCO-IHE: Delft, The Netherlands, 2006. [Google Scholar]
- Brown, J.D.; Spencer, T.; Moeller, I. Modelling storm surge flooding of an urban area with particular reference to modelling uncertainties: A case study of Canvey Island, United Kingdom. Water Resour. Res. 2007, 43, W06402. [Google Scholar] [CrossRef] [Green Version]
- Pall, P.; Aina, T.; Stone, D.A.; Stott, P.A.; Nozawa, T.; Hiberts, A.G.J.; Lohmann, D.; Allen, M.R. Anthropogenic greenhouse gas contribution to flood risk in England and Wales in autumn 2000. Nature 2011, 470, 382–385. [Google Scholar] [CrossRef]
- Yin, J.; Yin, Z.-E.; Hu, X.; Xu, S.; Wang, J.; Li, Z.; Zhong, H.; Gan, F. Multiple scenario analyses forecasting the confounding impacts of sea level rise and tides from storm induced coastal flooding in the city of Shanghai, China. Environ. Earth Sci. 2011, 63, 407–414. [Google Scholar] [CrossRef]
- Yin, Z.-E.; Yin, J.; Xu, S.Y.; Wen, J. Community-based scenario modelling and disaster risk assessment of urban rainstorm waterlogging. J. Geogr. Sci. 2011, 21, 274–284. [Google Scholar] [CrossRef]
- Zhou, Q.; Mikkelsen, P.S.; Halsnæs, K.; Arnbjerg-Nielsen, K. Framework for economic pluvial flood risk assessment considering climate change effects and adaptation benefits. J. Hydrol. 2012, 414–415, 539–549. [Google Scholar] [CrossRef]
- Alfieri, L.; Feyen, L.; Baldassarre, G.D. Increasing flood risk under climate change: A pan-European assessment of the benefits of four adaptation strategies. Clim. Change 2016, 136, 507–521. [Google Scholar] [CrossRef] [Green Version]
- Hine, D.; Hall, J.W. Information gap analysis of flood model uncertainties and regional frequency analysis. Water Resour. Res. 2010, 46, W01514. [Google Scholar] [CrossRef]
- Aich, V.; Liersch, S.; Vetter, T.; Fournet, S.; Andersson, J.C.M.; Calmanti, S.; van Weert, F.H.A.; Hattermann, F.F.; Paton, E.N. Flood projections within the Niger River Basin under future land use and climate change. Sci. Total Environ. 2016, 562, 666–677. [Google Scholar] [CrossRef] [PubMed]
- Jang, J.-H. An advanced method to apply multiple rainfall thresholds for urban flood warnings. Water 2015, 7, 6056–6078. [Google Scholar] [CrossRef] [Green Version]
- Zhou, L.; Wu, X.; Ji, Z.; Gao, G. Characteristic analysis of rainstorm-induced catastrophe and the countermeasures of flood hazard mitigation about Shenzhen city. Geomat. Nat. Haz. Risk 2017, 8, 1886–1897. [Google Scholar] [CrossRef] [Green Version]
- Cherqui, F.; Belmeziti, A.; Granger, D.; Sourdril, A.; Le Gauffre, P. Assessing urban potential flooding risk and identifying effective risk-reduction measures. Sci. Total Environ. 2015, 514, 418–425. [Google Scholar] [CrossRef] [PubMed]
- Meesuk, V.; Vojinovic, Z.; Mynett, A.E.; Abdullah, A.F. Urban flood modelling combining top-view LiDAR data with ground-view SfM observations. Adv. Water Resour. 2015, 75, 105–117. [Google Scholar] [CrossRef]
- Huong, H.T.L.; Pathirana, A. Urbanization and climate change impacts on future urban flooding in Can Tho city, Vietnam. Hydrol. Earth Syst. Sci. 2013, 17, 379–394. [Google Scholar] [CrossRef] [Green Version]
- Temmerman, S.; Meire, P.; Bouma, T.J.; Herman, P.M.; Ysebaert, T.; De Vriend, H.J. Ecosystem-based coastal defence in the face of global change. Nature 2013, 504, 79–83. [Google Scholar] [CrossRef]
- Jongman, B.; Hochrainer-Stigler, S.; Feyen, L.; Aerts, J.C.J.H.; Mechler, R.; Botzen, W.J.W.; Bouwer, L.M.; Pflug, G.; Rojas, R.; Ward, P.J. Increasing stress on disaster-risk finance due to large floods. Nat. Clim. Chang. 2015, 4, 264–268. [Google Scholar] [CrossRef]
- Aerts, J.C.J.H.; Botzen, W.J.W.; Emanuel, K.; Lin, N.; de Moel, H.; Michel-Kerjan, E.O. Evaluating flood resilience strategies for coastal megacities. Science 2014, 344, 473–475. [Google Scholar] [CrossRef]
- Bubeck, P.; Botzen, W.J.W.; Aerts, J.C.J.H. A review of risk perceptions and other factors that influence flood mitigation behavior. Risk Anal. 2012, 32, 1481–1495. [Google Scholar] [CrossRef] [Green Version]
- Lee, J.Y.; Moon, H.J.; Kim, T.I.; Kim, H.W.; Han, M.Y. Quantitative analysis on the urban flood mitigation effect by the extensive green roof system. Environ. Pollut. 2013, 181, 257–261. [Google Scholar] [CrossRef] [PubMed]
- Wang, J.; Gao, W.; Xu, S.Y.; Yu, L.Z. Evaluation of the combined risk of sea level rise, land subsidence, and storm surges on the coastal areas of Shanghai, China. Clim. Chang. 2012, 115, 537–558. [Google Scholar] [CrossRef]
- Audisio, C.; Turconi, L. Urban floods: a case study in the Savigliano area (North-Western Italy). Nat. Hazards Earth Syst. Sci. 2011, 11, 2951–2964. [Google Scholar] [CrossRef]
Figure 1.
Target regions.

Figure 2.
Status of natural disaster damage in urban areas (2010–2017): (a) occurrence count and damage cost by natural disaster type; (b) occurrence count and damage cost by length of disaster.
Figure 2.
Status of natural disaster damage in urban areas (2010–2017): (a) occurrence count and damage cost by natural disaster type; (b) occurrence count and damage cost by length of disaster.

Figure 3.
Rainfall observatories in the target regions.

Figure 4.
Total rainfall and average rainfall based on occurrence of natural disaster damages (2010–2017): (a) rainfall characteristics by natural disaster type; (b) rainfall characteristics by length of disaster occurrence period.
Figure 4.
Total rainfall and average rainfall based on occurrence of natural disaster damages (2010–2017): (a) rainfall characteristics by natural disaster type; (b) rainfall characteristics by length of disaster occurrence period.

Figure 5.
Maximum rainfall by time duration for different lengths of disasters: (a) 1-day; (b) 2-day; (c) 3-day; (d) 4-day; (e) 5-day; (f) 6-day; (g) 7-day; (h) 10-day; and (i) 13-day.
Figure 5.
Maximum rainfall by time duration for different lengths of disasters: (a) 1-day; (b) 2-day; (c) 3-day; (d) 4-day; (e) 5-day; (f) 6-day; (g) 7-day; (h) 10-day; and (i) 13-day.

Figure 6.
The rainfall by duration according to the length of natural disaster.

Figure 7.
Ratio of rainfall to total rainfall by duration according to length of disaster occurrence period: (a) 1-day; (b) 2-day; (c) 3-day; (d) 4-day; (e) 5-day; (f) 6-day; (g) 7-day; (h) 10-day; and (i) 13-day.
Figure 7.
Ratio of rainfall to total rainfall by duration according to length of disaster occurrence period: (a) 1-day; (b) 2-day; (c) 3-day; (d) 4-day; (e) 5-day; (f) 6-day; (g) 7-day; (h) 10-day; and (i) 13-day.


Table 1.
Population and geographic characteristics of South Korea.
| City/Province | Population (Thousand People) | Area (km2) | Population/ Area (Thousand People/km2) | Urban Area (km2) | Urbanization Ratio (%) | Target Region |
|---|---|---|---|---|---|---|
| Nationwide | 51,779 | 100,364 | 0.52 | 25,826 | 25.7 | |
| Seoul Special City | 9857 | 605 | 16.29 | 605 | 100 | ○ |
| Busan Metropolitan City | 3471 | 770 | 4.51 | 680 | 88.4 | ○ |
| Daegu Metropolitan City | 2475 | 884 | 2.8 | 565 | 64 | ○ |
| Incheon Metropolitan City | 2949 | 1063 | 2.77 | 504 | 47.4 | ○ |
| Gwangju Metropolitan City | 1464 | 501 | 2.92 | 501 | 100 | ○ |
| Daejeon Metropolitan City | 1502 | 539 | 2.79 | 539 | 100 | ○ |
| Ulsan Metropolitan City | 1165 | 1061 | 1.1 | 554 | 52.2 | ○ |
| Sejong Metropolitan Autonomous City | 280 | 465 | 0.6 | 42 | 9.1 | |
| Gyeonggi Province | 12,874 | 10,187 | 1.26 | 4166 | 40.9 | |
| Gangwon Province | 1550 | 16,828 | 0.09 | 4064 | 24.2 | |
| Chungcheongbuk Province | 1594 | 7408 | 0.22 | 1400 | 18.9 | |
| Chungcheongnam Province | 2117 | 8226 | 0.26 | 1684 | 20.5 | |
| Jeollabuk Province | 1855 | 8069 | 0.23 | 1391 | 17.2 | |
| Jeollanam Province | 1896 | 12,335 | 0.15 | 2343 | 19 | |
| Gyeongsangbuk Province | 2692 | 19,033 | 0.14 | 3457 | 18.2 | |
| Gyeongsangnam Province | 3380 | 10,540 | 0.32 | 1813 | 17.2 | |
| Jeju Special Self-Governing Province | 657 | 1850 | 0.36 | 1517 | 82 |
¹. ○ indicates selection as selected urban target region.
Table 2.
Occurrence count and damage cost of natural disasters by year.
| Years | 2010 | 2011 | 2012 | 2013 | 2014 | 2015 | 2016 | 2017 | Total | |
|---|---|---|---|---|---|---|---|---|---|---|
| Extreme Wind | Count | - | - | - | 2 | 1 | 3 | - | - | 6 |
| Damage Cost¹) | - | - | - | 69 | 83 | 58 | - | - | 210 | |
| Typhoon | Count | 7 | 4 | 16 | 1 | 3 | 2 | - | - | 33 |
| Damage Cost¹) | 8904 | 731 | 25,748 | 9 | 15 | 1139 | - | - | 36,546 | |
| Wind Wave | Count | 3 | - | - | 1 | - | 1 | - | - | 5 |
| Damage Cost¹) | 16 | - | - | 40 | - | 299 | - | - | 354 | |
| Extreme Wind & Wind Wave | Count | - | - | 5 | - | - | - | 5 | 3 | 13 |
| Damage Cost¹) | - | - | 2215 | - | - | - | 89,182 | 309 | 91,706 | |
| Heavy Rainfall | Count | 16 | 16 | 18 | 10 | 13 | 3 | 13 | 13 | 102 |
| Damage Cost¹) | 22,303 | 43,606 | 1253 | 847 | 90,821 | 4 | 1136 | 3630 | 163,600 | |
| Total | Count | 26 | 20 | 39 | 14 | 17 | 9 | 18 | 16 | 159 |
| Damage Cost¹) | 31,223 | 44,337 | 29,217 | 964 | 90,919 | 1500 | 90,318 | 3940 | 292,417 | |
¹ Unit: thousand US dollars.
Table 3.
Characteristics of rainfall observatories in the target regions.
| Observatory | Latitude | Longitude | Elevation (El.m) | Start Observation Period (Date) |
|---|---|---|---|---|
| Seoul | 37.57 | 126.97 | 85.50 | 1907.10.01 |
| Busan | 35.10 | 129.03 | 69.56 | 1904.04.09 |
| Daegu | 35.83 | 128.65 | 53.40 | 1907.01.31 |
| Incheon | 37.48 | 126.62 | 68.15 | 1904.08.29 |
| Gwangju | 35.17 | 126.89 | 72.38 | 1939.05.01 |
| Daejeon | 36.37 | 127.37 | 68.90 | 1969.01.01 |
| Ulsan | 35.56 | 129.32 | 34.57 | 1932.01.06 |
Table 4.
Annual total and average rainfalls of inundation damage occurrences by natural disaster type.
Table 4.
Annual total and average rainfalls of inundation damage occurrences by natural disaster type.
| Disaster | Rainfall | 2010 | 2011 | 2012 | 2013 | 2014 | 2015 | 2016 | 2017 | Total |
|---|---|---|---|---|---|---|---|---|---|---|
| Extreme Wind | Total | - | - | - | 44 | 58 | 131 | - | - | 233 |
| Average | - | - | - | 22 | 58 | 44 | - | - | 39 | |
| Typhoon | Total | 380 | 491 | 1589 | 85 | 209 | 88 | - | - | 2840 |
| Average | 54 | 123 | 99 | 85 | 70 | 44 | - | - | 86 | |
| Wind Wave | Total | 0 | - | - | - | - | 13 | - | - | 13 |
| Average | 0 | - | - | - | - | 13 | - | - | 3 | |
| Extreme Wind & Wind Wave | Total | - | - | 126 | - | - | - | 467 | 120 | 713 |
| Average | - | - | 25 | - | - | - | 93 | 40 | 55 | |
| Heavy Rainfall | Total | 2597 | 4596 | 2212 | 1183 | 1242 | 154 | 1737 | 1875 | 15,596 |
| Average | 162 | 287 | 123 | 118 | 96 | 51 | 134 | 144 | 153 | |
| Total | Total | 2977 | 5087 | 3927 | 1311 | 1509 | 386 | 2204 | 1995 | 19,395 |
| Average | 115 | 254 | 101 | 94 | 89 | 43 | 122 | 125 | 122 |
Table 5.
Average rainfall by duration representing disaster occurrence period.
| Duration (hr) | Average rainfall of disaster occurrence period (mm) | ||||||||
|---|---|---|---|---|---|---|---|---|---|
| 1-day | 2-day | 3-day | 4-day | 5-day | 6-day | 7-day | 10-day | 13-day | |
| 1 | 17 | 32 | 17 | 24 | 29 | 24 | 27 | 33 | 32 |
| 2 | 23 | 49 | 26 | 39 | 44 | 36 | 42 | 51 | 43 |
| 3 | 26 | 59 | 32 | 49 | 53 | 42 | 52 | 60 | 52 |
| 4 | 28 | 67 | 35 | 56 | 59 | 45 | 60 | 68 | 61 |
| 5 | 30 | 70 | 38 | 61 | 62 | 48 | 67 | 74 | 70 |
| 6 | 31 | 73 | 40 | 66 | 66 | 51 | 72 | 81 | 79 |
| 7 | 33 | 76 | 42 | 69 | 70 | 54 | 76 | 85 | 89 |
| 8 | 34 | 79 | 44 | 71 | 73 | 58 | 82 | 87 | 102 |
| 9 | 35 | 81 | 46 | 75 | 77 | 62 | 86 | 91 | 111 |
| 10 | 36 | 83 | 48 | 78 | 80 | 64 | 89 | 93 | 117 |
| 11 | 37 | 84 | 49 | 80 | 83 | 66 | 90 | 96 | 122 |
| 12 | 37 | 86 | 49 | 81 | 85 | 66 | 91 | 99 | 125 |
| 13 | 38 | 88 | 50 | 82 | 88 | 67 | 93 | 102 | 128 |
| 14 | 38 | 90 | 51 | 84 | 90 | 67 | 95 | 106 | 132 |
| 15 | 38 | 92 | 53 | 85 | 92 | 68 | 99 | 109 | 135 |
| 16 | 38 | 93 | 54 | 87 | 93 | 69 | 101 | 112 | 138 |
| 17 | 38 | 94 | 55 | 89 | 94 | 69 | 102 | 114 | 143 |
| 18 | 38 | 95 | 56 | 91 | 95 | 69 | 103 | 116 | 146 |
| 19 | 39 | 96 | 57 | 93 | 97 | 70 | 105 | 118 | 149 |
| 20 | 39 | 97 | 58 | 94 | 99 | 71 | 107 | 120 | 151 |
| 21 | 39 | 99 | 59 | 94 | 100 | 71 | 108 | 122 | 154 |
| 22 | 39 | 100 | 60 | 94 | 102 | 71 | 110 | 125 | 157 |
| 23 | 39 | 101 | 61 | 95 | 102 | 71 | 111 | 128 | 159 |
| 24 | 39 | 102 | 62 | 95 | 103 | 71 | 111 | 131 | 161 |
Table 6.
Parameters of rainfall equation for damage occurrence of urban area by length of disaster occurrence period.
Table 6.
Parameters of rainfall equation for damage occurrence of urban area by length of disaster occurrence period.
| Length of Disaster | Parameters | R-squared | ||
|---|---|---|---|---|
| a | b | c | ||
| 1-day | 18.29 | 2.38 | 0.07 | 0.96 |
| 2-day | 40.59 | 5.48 | 0.13 | 0.94 |
| 3-day | 21.35 | 3.40 | 0.07 | 0.96 |
| 4-day | 29.13 | 6.21 | 0.15 | 0.97 |
| 5-day | 32.62 | 6.03 | 0.13 | 0.98 |
| 6-day | 26.11 | 4.86 | 0.13 | 0.97 |
| 7-day | 30.54 | 7.23 | 0.17 | 0.97 |
| 10-day | 39.20 | 6.68 | 0.13 | 0.98 |
| 13-day | 21.56 | 11.31 | 0.24 | 0.99 |
Table 7.
Ratio of rainfall to total rainfall by duration according to the length of disaster occurrence period.
Table 7.
Ratio of rainfall to total rainfall by duration according to the length of disaster occurrence period.
| Duration (hr) | Rainfall Ratio (%) | ||||||||
|---|---|---|---|---|---|---|---|---|---|
| 1-day | 2-day | 3-day | 4-day | 5-day | 6-day | 7-day | 10-day | 13-day | |
| 1 | 44 | 34 | 24 | 23 | 27 | 21 | 14 | 13 | 9 |
| 2 | 56 | 48 | 36 | 37 | 39 | 31 | 21 | 19 | 13 |
| 3 | 61 | 54 | 44 | 45 | 46 | 37 | 25 | 23 | 16 |
| 4 | 67 | 60 | 48 | 51 | 50 | 41 | 29 | 26 | 19 |
| 5 | 69 | 62 | 52 | 55 | 52 | 44 | 32 | 29 | 21 |
| 6 | 72 | 64 | 55 | 59 | 54 | 47 | 33 | 31 | 24 |
| 7 | 74 | 66 | 57 | 63 | 57 | 49 | 35 | 33 | 28 |
| 8 | 75 | 68 | 60 | 65 | 59 | 52 | 38 | 34 | 31 |
| 9 | 77 | 69 | 63 | 68 | 62 | 55 | 39 | 36 | 33 |
| 10 | 79 | 71 | 65 | 70 | 63 | 57 | 41 | 36 | 35 |
| 11 | 80 | 72 | 65 | 72 | 64 | 60 | 42 | 37 | 37 |
| 12 | 81 | 73 | 66 | 73 | 66 | 60 | 43 | 38 | 37 |
| 13 | 82 | 74 | 67 | 74 | 67 | 61 | 44 | 39 | 38 |
| 14 | 82 | 75 | 68 | 75 | 69 | 62 | 46 | 40 | 39 |
| 15 | 82 | 76 | 69 | 76 | 69 | 62 | 47 | 41 | 40 |
| 16 | 83 | 78 | 70 | 77 | 70 | 63 | 48 | 42 | 41 |
| 17 | 83 | 78 | 71 | 78 | 71 | 63 | 48 | 44 | 42 |
| 18 | 83 | 79 | 72 | 79 | 72 | 63 | 49 | 45 | 43 |
| 19 | 83 | 80 | 73 | 80 | 73 | 64 | 49 | 46 | 44 |
| 20 | 83 | 80 | 74 | 81 | 74 | 64 | 51 | 46 | 45 |
| 21 | 83 | 82 | 75 | 81 | 75 | 64 | 51 | 47 | 46 |
| 22 | 83 | 82 | 76 | 82 | 76 | 64 | 52 | 48 | 47 |
| 23 | 83 | 83 | 77 | 82 | 76 | 64 | 52 | 49 | 47 |
| 24 | 83 | 83 | 78 | 82 | 77 | 64 | 53 | 50 | 48 |
Table 8.
Parameters for the equation of disaster-prevention rainfall estimation of urban area.
| Length of Disaster Occurrence Period (Days) | Duration (Hours) | Average Rainfall (mm) | Length of Disaster Occurrence Period (Days) | Duration (Hours) | Average Rainfall (mm) |
|---|---|---|---|---|---|
| 1 | 2 | 23 | 6 | 9 | 62 |
| 2 | 3 | 59 | 7 | 21 | 108 |
| 3 | 4 | 37 | 10 | 24 | 131 |
| 4 | 4 | 56 | 13 | 24 | 161 |
| 5 | 4 | 59 |
Table 9.
Analysis results of disaster-prevention rainfall equation for urban areas using multiple regression analysis.
Table 9.
Analysis results of disaster-prevention rainfall equation for urban areas using multiple regression analysis.
| Model Summarya | ||||||
| R | R Square | Adjusted R Square | Std. Error of the Estimate | |||
| 0.972a | 0.949 | 0.932 | 11.962 | |||
| a. Predictors: Day, Duration | ||||||
| ANOVAa | ||||||
| Sum of Squares | df | Mean Square | F | Sig. | ||
| Regression | 15903.469 | 2 | 7951.734 | 55.572 | 0.000b | |
| Residual | 858.531 | 6 | 143.089 | |||
| Total | 16762.000 | 8 | ||||
| a. Dependent Variable: Average Rainfall; b. Predictors: Day, Duration | ||||||
| Coefficientsa | ||||||
| Unstandardized Coefficients | Standardized Coefficients | t | Sig. | VIF | ||
| B | Std. Error | Beta | ||||
| (Constant) | 17.874 | 7.747 | 2.307 | 0.060 | ||
| Day | 6.586 | 2.678 | 0.557 | 2.459 | 0.049 | 6.016 |
| Duration | 2.097 | 1.084 | 0.438 | 1.934 | 0.101 | 6.016 |
| a. Dependent Variable: Average Rainfall. | ||||||
© 2020 by the authors. Licensee MDPI, Basel, Switzerland. This article is an open access article distributed under the terms and conditions of the Creative Commons Attribution (CC BY) license (http://creativecommons.org/licenses/by/4.0/).
Share and Cite
MDPI and ACS Style
Song, Y.; Park, M. A Study on Setting Disaster-Prevention Rainfall by Rainfall Duration in Urban Areas Considering Natural Disaster Damage: Focusing on South Korea. Water 2020, 12, 642. https://doi.org/10.3390/w12030642
AMA Style
Song Y, Park M. A Study on Setting Disaster-Prevention Rainfall by Rainfall Duration in Urban Areas Considering Natural Disaster Damage: Focusing on South Korea. Water. 2020; 12(3):642. https://doi.org/10.3390/w12030642
Chicago/Turabian StyleSong, Youngseok, and Moojong Park. 2020. "A Study on Setting Disaster-Prevention Rainfall by Rainfall Duration in Urban Areas Considering Natural Disaster Damage: Focusing on South Korea" Water 12, no. 3: 642. https://doi.org/10.3390/w12030642
Note that from the first issue of 2016, this journal uses article numbers instead of page numbers. See further details here.