Article

Integration of 3D Geological Modeling and Geothermal Field Analysis for the Evaluation of Geothermal Reserves in the Northwest of Beijing Plain, China

1
School of Water Resources and Environment, China University of Geosciences, Beijing 100083, China
2
Department of Geophysical Exploration, Beijing Institute of Geo-exploration Technology, Beijing 100120, China
3
School of Engineering and Technology, China University of Geosciences, Beijing 100083, China
*
Author to whom correspondence should be addressed.
Water 2020, 12(3), 638; https://doi.org/10.3390/w12030638
Submission received: 23 January 2020 / Revised: 19 February 2020 / Accepted: 25 February 2020 / Published: 27 February 2020
(This article belongs to the Section Water, Agriculture and Aquaculture)

Abstract

:
With the increasing demand for energy and the growing concern for atmospheric pollution in Beijing, China, the exploitation and utilization of geothermal resources are becoming more desirable. The study combined three-dimensional geological modeling with geothermal field analysis to make clear the potential and distribution of geothermal resources in the northwest of the Beijing plain, which could provide a scientific basis for rational utilization in the study area. Based on the analysis of the geological data and geothermal conditions, we created a 3D geological model of the study area, and then added isothermal surfaces into the model and analyzed the heat flow to enhance the understanding of the present geothermal field. After that, the volumes of different temperature intervals of heat reservoirs were calculated accurately and automatically by the integration of the model and the isothermal surfaces. Finally, the geothermal reserves were calculated by the improved volumetric method, and the distribution of resources was analyzed comprehensively. The results showed that, in the study area, the heat flow values ranged from 49 to 99 mW m−2, and the average elevations of 25 °C, 40 °C, and 60 °C isothermal surfaces were at −415 m, −1282 m, and −2613 m, respectively. The geothermal reserves were 5.42 × 10¹⁹ J and the volume of the heat reservoir was 4.88 × 10¹¹ m3. The geothermal resources of the study area had good potential and could support local green development.

1. Introduction

Geothermal energy is an efficient, environmentally friendly, and cheap renewable energy source [1]. Located in the northern part of the North China Plain, Beijing is underlain by relatively abundant geothermal resources [2,3]. With the increasing demand for energy and the growing concern for atmospheric pollution in Beijing, the development and utilization of geothermal energy are becoming more desirable [4]. Located in the northwest of the Beijing plain, the study area suffers from a lack of research on geothermal geology, and the potential and distribution of geothermal resources need to be clarified for rational development and utilization.
Common methods for calculating geothermal reserves include the volumetric “heat in place” method (volumetric method), analytical method, and numerical modeling [5]. In the volumetric method, the accuracy of the calculation of reserves is related to parameters such as the heat capacity, rock porosity, volume and temperature of the reservoir. Scholars have combined the volumetric method with other technical methods to improve the accuracy of geothermal potential assessment or provide the associated estimation uncertainty. Tian et al. combined the volumetric method with a microtremor survey, which calculated the heat capacity by using the specific thickness of the layers for each junior unit [6]. Pocasangre et al. presented a Python-based stochastic library for evaluating geothermal power potential using the volumetric method [7].
The combination of the volumetric method and 3D geological modeling can be used to calculate the volume of a reservoir accurately and automatically and assign values to parameters of each unit respectively to achieve an accurate calculation of geothermal reserves [8]. Moreover, 3D geological modeling is helpful to analyze the geothermal geological conditions and realize the visualization of geological structures, especially for regions in which complex geological settings are expected. Guglielmetti et al. carried out the combined use of 3D geological modeling and gravity surveys for geothermal prospection in the western Alps, which could allow a better characterization of geological structures involved in geothermal fluid circulation [9]. Fuchs et al. presented a 3D geothermal model and analyzed the deep basin temperature and heat-flow field in Denmark [10]. Fulignati et al. built a geological model that helps in visualizing and understanding the geology and geothermal system of the Mount Amiata, which was used as the basis of a 3D numerical model of the reservoir [11]. This study adopted the ROCKModel software independently developed by our research team, which could provide a computing model for numerical simulation [12].
The integration of 3D geological modeling and geothermal field analysis could help to analyze the potential and distribution of geothermal resources. By this integration, the study visualized the local geological structures and isothermal surfaces and then calculated the volumes of different temperature intervals of heat reservoirs accurately. Afterwards, the geothermal reserves were calculated by the improved volumetric method. Based on geothermal field analysis, the distribution of resources was analyzed comprehensively.

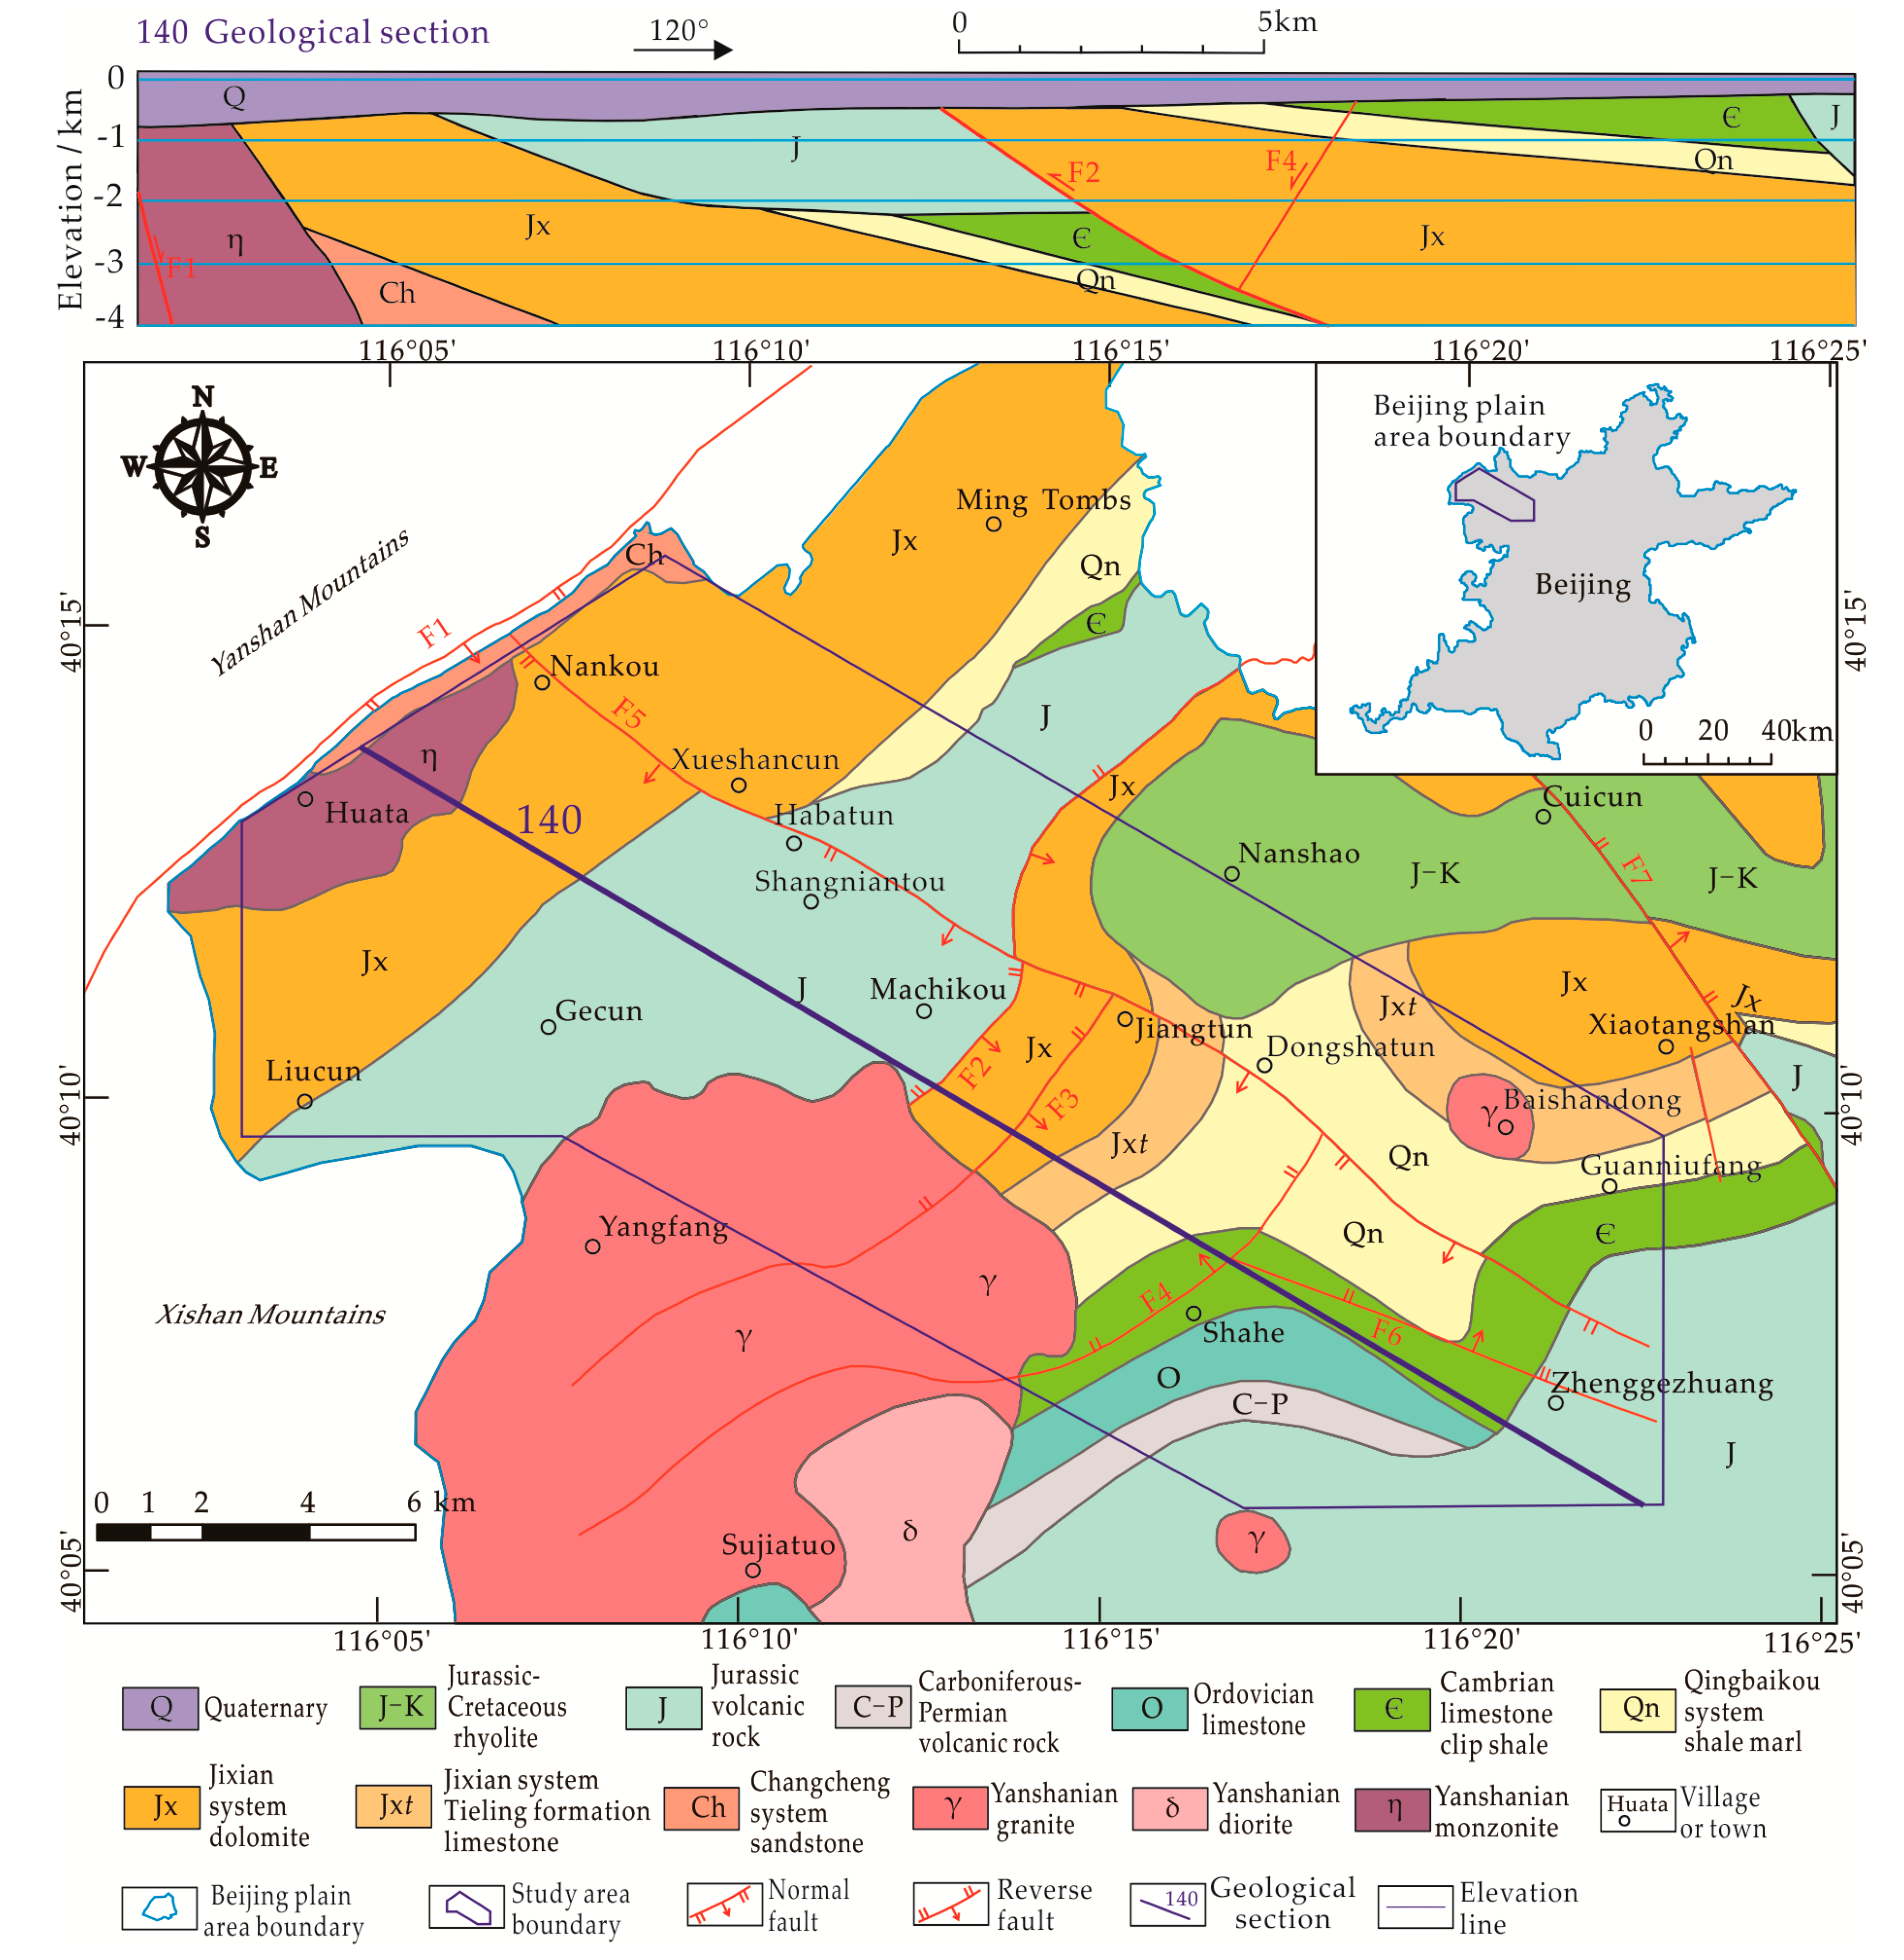
2. Description of the Study Area

The study area is located in the northwest of Beijing plain, with Xishan mountains in the west and Yanshan mountains in the north, and the terrain slopes from northwest to southeast. The range of the study area (Figure 1) was mainly delimited according to the planning area of Changping New Town, including the Changping New Town and the eastern part of Nankou Town with the same geological structure unit, with a total area of 260 km2. The Changping New Town is one of the 11 new cities that Beijing strives to develop, which needs the support of geothermal energy. According to the “Geologic exploration standard of geothermal resources”, the elevation range of the assessment of geothermal resources was above −4000 m in this study [13].
The geotectonic location of the study area belongs to the eastern margin of the Yanshanian platform fold belt in the north of the China–North Korea Paraplatform [14]. Fault F3 (Nankou fault) belongs to the Nankou–Sunhe fractured zone, which is a Quaternary active fault. The F3 is a normal-dip-slip fault, with the strike northwest and the dip southwest [15]. Fault F2 (Yingbishan fault) is cut by F3 in the middle, with the strike northeast and the dip southeast. The strata on different sides of F2 have a big gap and differences (Figure 1, 140 geological section). Fault F4 (Shahe fault) is a normal fault with a length of 16 km, with the strike northeast and the dip northwest. Cut by F4, Fault F6 (Zhenggezhuang fault) is a normal fault with a length of 13 km, with the strike northwest and the dip northeast. There are Yanshanian granitic intrusions in the Yangfang and the east of Baishan Town, respectively [16]. The Yanshanian monzonitic intrusion is developed in Huata in the west [17]. These intrusions not only squeeze the space of the heat reservoir but also affect the recharge, runoff, and discharge of groundwater [18].
The geothermal resources of Beijing are relatively rich, and ten geothermal fields including Shuangqiao, Xiaotangshan, and Tianzhu have been identified [19,20]. In the study area, the geothermal water is featured by low mineralization and weak alkaline water. The concentrations of fluoride and H2SiO3 reach the standard of the mineral water, which can be used for domestic heating, medical treatment, agricultural greenhouses, etc. [21] The geothermal geological conditions can be analyzed through four aspects of "source, channel, reservoir and caprock" [22,23]. The geothermal resources of the study area mainly belong to the conductive type of sedimentary basin, and the heat source is deep normal heating conduction. The main sources of geothermal water are the lateral runoff recharge from the Xishan and Yanshan mountains [24].
In the Fault F3 fractured zone, the thermal convection activity is strong. The width of the zone is about 500–800 m, which is an important channel of heat flow in the region [14]. The fault cuts through a series of strata and structures, which causes the obvious displacement of the heat reservoir and caprock in the hanging wall and footwall [25]. With different distances or sides of the F3, the volume and temperature of groundwater are quite different. For example, in the northeast of the F3, the temperature of the ZK6 (Figure 2) closer to the fault is much higher than the ZK7 whose strata and depth are the same as ZK6.
The primary geothermal reservoir is the Wumishan formation of the Jixian system in the Mesoproterozoic Erathem, which accounts for a large proportion of the total thickness of the Jixian system. The lithology of Wumishan formation is mainly dolomite, and its distribution is extensive [26]. The formation belongs to the bedrock fracture-type geothermal reservoir, which has good water abundance, and the average specific discharge of geothermal wells around the F3 is 150.15 m3 d−1·m−1 [14]. As the burial depth gets deeper, the permeability of the heat reservoir becomes smaller [27]. In the ZK5 of Xueshancun, the hydraulic conductivity of the heat reservoir buried in 800 m is 1.00 m d−1, whereas that of 800–1500 m is 0.08 m d−1 [18].
The caprock is a necessary condition for forming geothermal fields [28]. In the study area, the main caprocks include the Cenozoic Erathem Quaternary system (Q), Mesozoic Erathem Cretaceous system (K), Jurassic system (J), Paleozoic Erathem Ordovician system (O), Cambrian system (Є), and Neoproterozoic Erathem Qingbaikou system (Qn). The geothermal gradient of the Quaternary loose sediments is large, which is the most important capping layer in the study area. Divided by Fault F3, the thickness of Quaternary sediments in the hanging wall is about 500 m more than that of the footwall. In the Machikou sag of the hanging wall, there are two subsidence centers of Quaternary sediments, Habatun, and Jiangtun, with thicknesses of more than 900 m.

3. Data and Methods

3.1. 3D Geological Modeling Data

The 3D geological modeling data were mainly drawn by using the results of comprehensive geophysical surveys such as gravity, magnetic method, electrical sounding, and microtremor survey. Through the area gravity survey work in the study area, the framework of the fault structure was divided, and the uplift and sag of the bedrock were identified. Carrying out the area magnetic prospecting work in the study area, the distribution range of each intrusive body was studied. The study carried out radon measurement and arranged seven comprehensive sections with a total length of 17 km (Figure 2) for controllable source audio frequency magnetotelluric sounding (CSAMT), which determined the location of faults, the condition of deep strata, etc. The study laid out 20 microtremor points (Figure 2) to make clear the burial depth of the heat reservoir and assemblage characteristics of caprocks.
Based on the geophysical survey of the above paragraph with an accuracy of 1:25,000 to 1:50,000, combined with the secondary development of previous data, this research deduced the detailed inferences and interpretations of strata, structures, and rock masses for the entire region. Then, we obtained the geological sections, 1:50,000 bedrock and tectonic map, and the burial depth map of the geothermal reservoir roof. These geological data could meet the needs of 3D geological modeling. The strikes of geological sections were classified in two directions: seven geological sections in the northwest (100–220) and nine geological sections in the north (AA’–II’; Figure 2). Borehole data included deep geothermal boreholes and bedrock boreholes for other uses.

3.2. Present Geothermal Field Data

Thermal conductivity and geothermal gradient are two important parameters for the present geothermal field analysis [29]. The thermal conductivity of rock represented the capacity of heat conduction, which was the basic data for obtaining heat flow values. The test samples of thermal conductivity included 16 cores from boreholes ZK1, ZK3, ZK4, and ZK5, and 548 outcrops of the Pre-Cenozoic from the standard strata in the surrounding mountains [30]. Among the thickness-weighted average thermal conductivity of the strata, the Jixian system had the highest value of 5.06 W·mK−1, while the Cretaceous system had the lowest value of 2.05 W mK−1. The thermal conductivities of the Jurassic, Permian, and Carboniferous strata were 2–4 W·mK−1. The dolomite of the Wumishan formation in the Jixian system had the highest thermal conductivity in the whole region, with an average of 5.11 W·mK−1. The thermal conductivities of caprocks were relatively low, such as shale, sandstone, mudstone, and volcanic rocks.
The calculation of present geothermal gradients in the study area was mainly based on the measurement data of the steady-state continuous temperature and hole bottom temperature of the 23 wells (Table A1) [31]. For boreholes with steady-state continuous temperature data, the geothermal gradients of different strata were obtained by the linear regression of temperature-depth data of temperature-logging in a specific depth range of borehole. For boreholes without steady-state temperature measurement data, the hole bottom temperature data were used to estimate the geothermal gradients. In the study area, the depth of the constant temperature zone was 30 m, and the temperature was 13.5 °C. The average geothermal gradients of strata were calculated (Table A1), and the Quaternary sediment was as high as 3.38 °C hm−1; other strata were less than 2 °C·hm−1. Quaternary strata were the good thermal caprock in the area, which had a good effect of heat insulation. Jixian and Ordovician-Cambrian were aquifers with underground run off, and the geothermal gradients were relatively low. The geothermal gradients of the intrusive body in Yangfang, Huata, and Gecun were 1.97 °C·hm−1, and the value of the Baishandong granite body was 1.1 °C·hm−1.

3.3. 3D Modeling of Geological Structure and Isothermal Surfaces

3D geological modeling has many functions, including the visualization of 3D scenes, the accurate calculation of reserves and the correctness checking of original data [8]. The ROCKModel adopted in this 3D geological modeling was the software independently developed by the research group of Nengxiong Xu, and its overall framework is shown in Figure 3. The software includes three parts: original data transforming tools, solid modeling tools, and auxiliary tools. The ROCKModel can build and visualize models for complex geological objects and provide geometric models for numerical simulation [32].
This 3D geological modeling built a normal columnar geological body that ranged from the ground surface of the study area vertically to −4000 m. To facilitate the modeling and improve the accuracy of geothermal reserves, the study area was divided into six geological bodies by the faults, namely Parts Ⅰ–Ⅵ (Figure 2). The geological modeling included four main processes, as listed below.
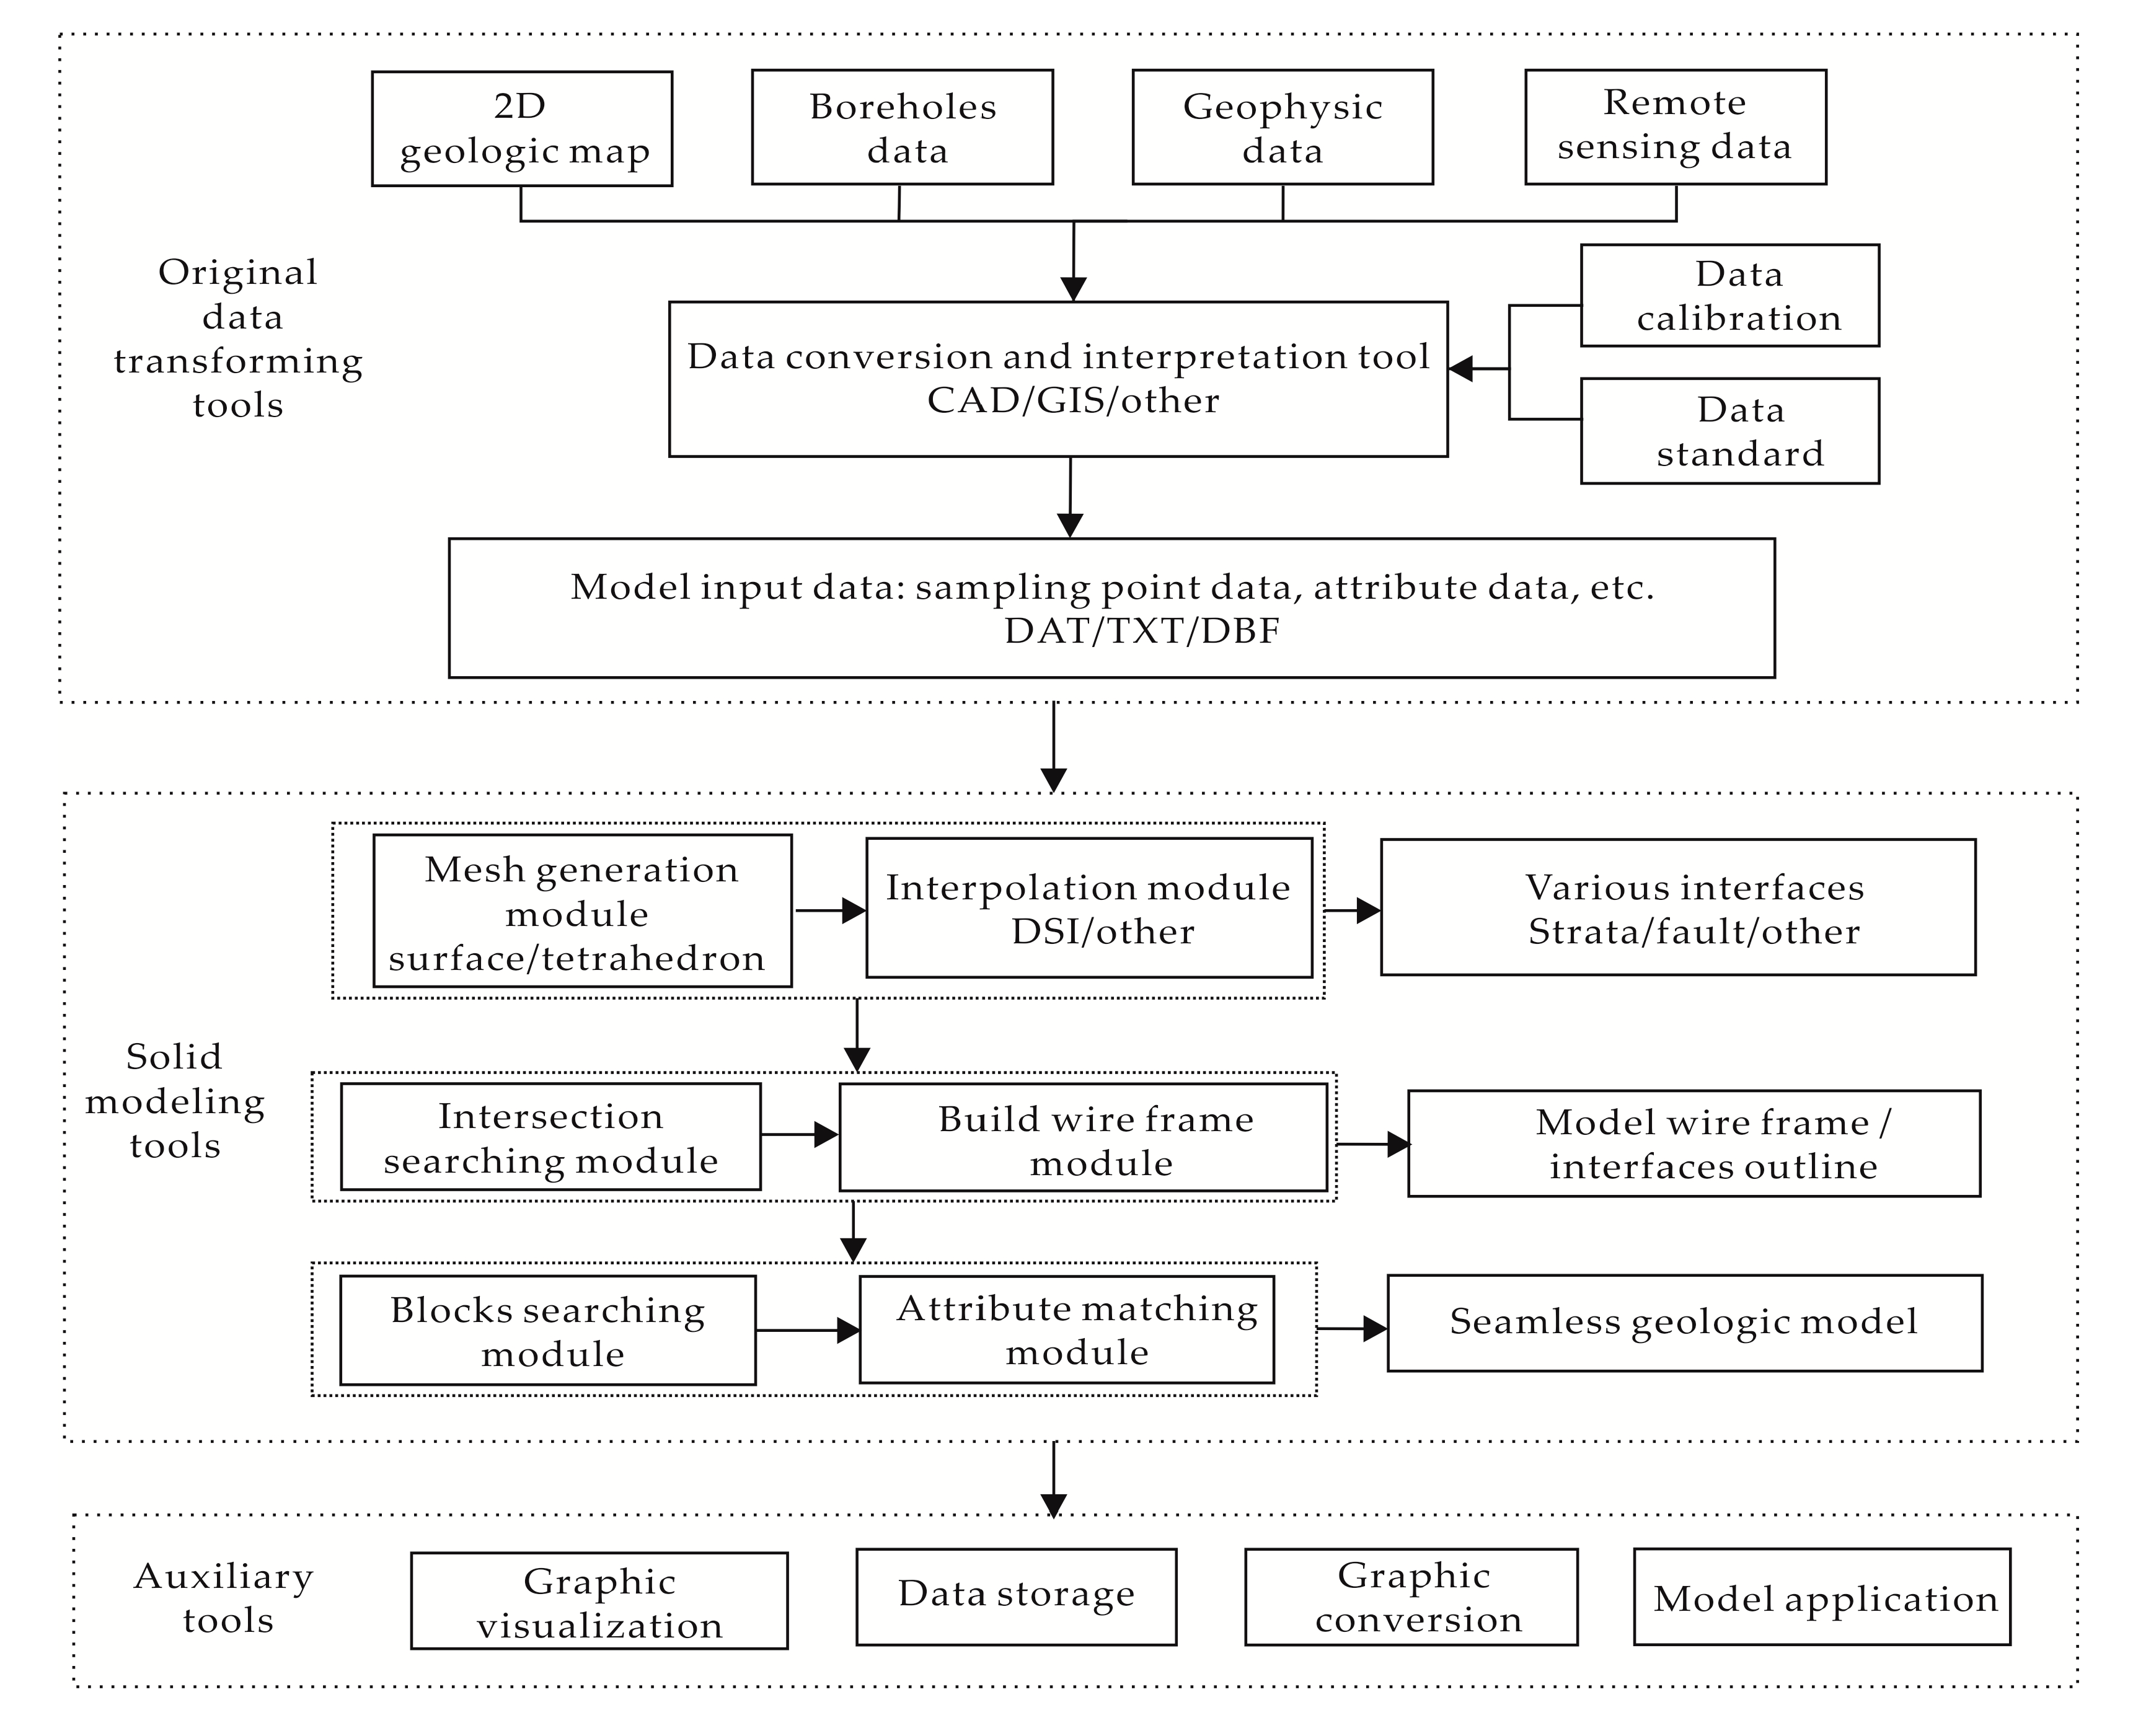
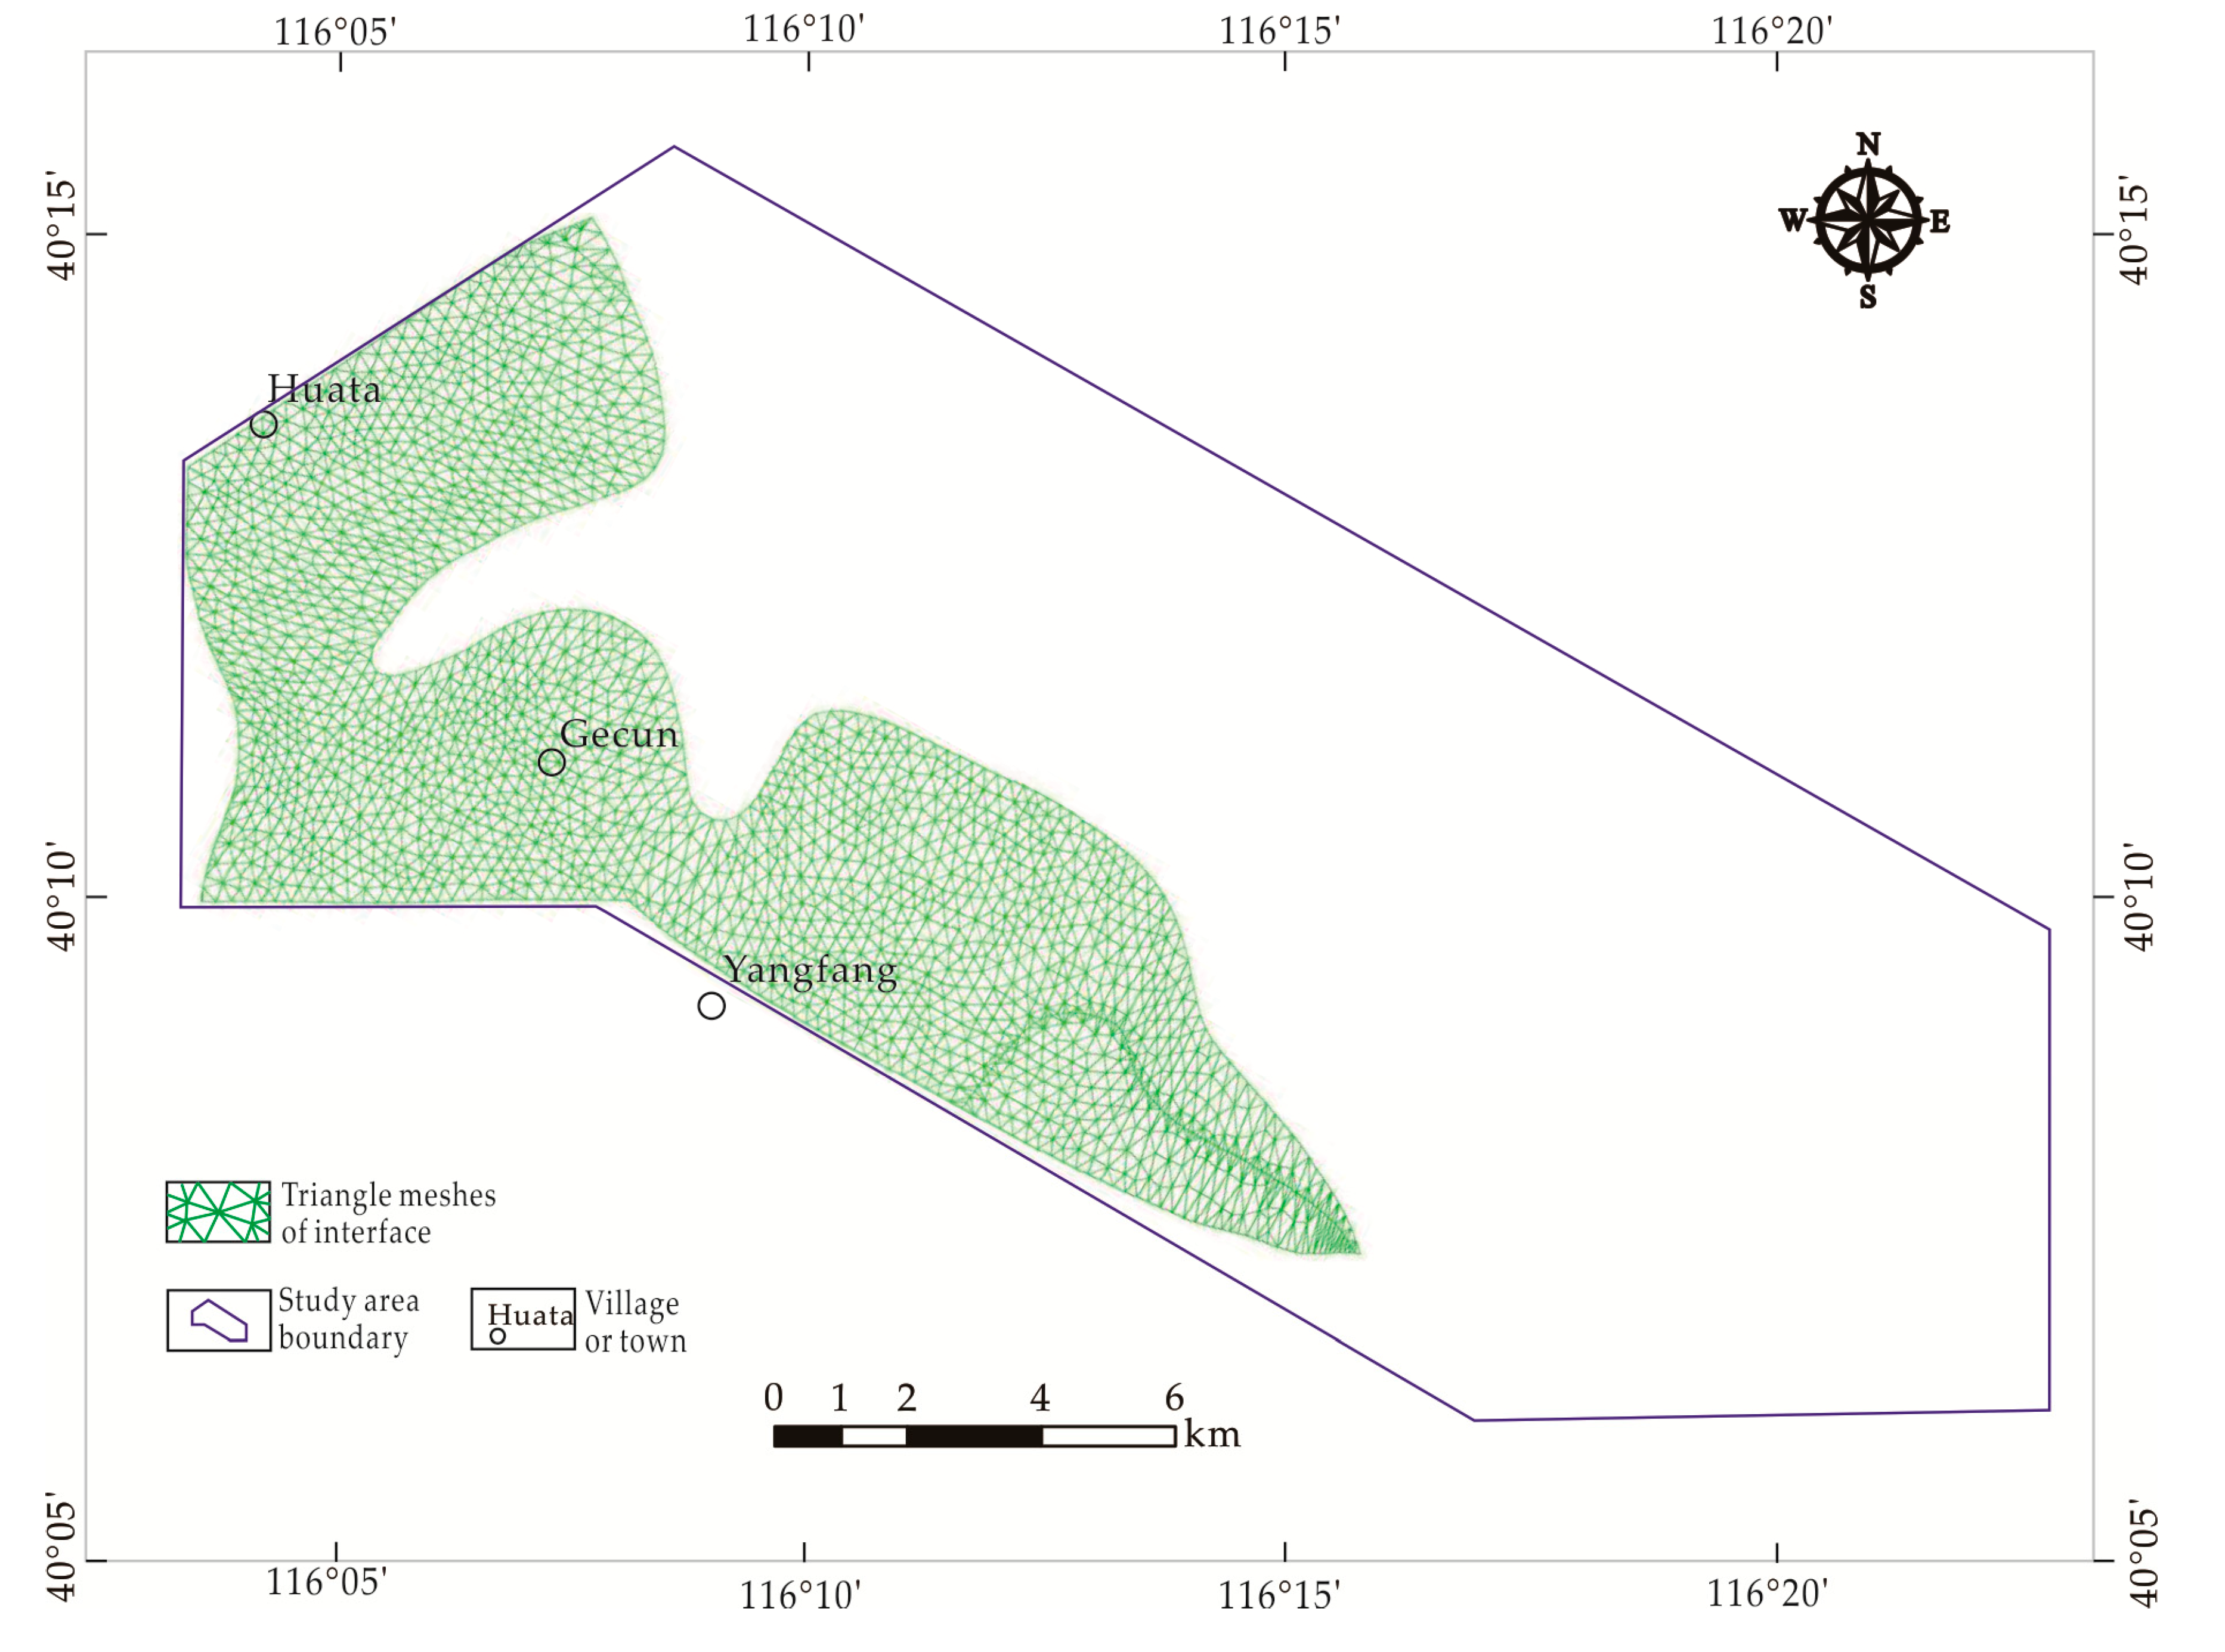
  • Create a set of initial interfaces. The projection of the interface on the horizontal plane was divided into triangle meshes, and the meshes were interpolated to obtain the initial surface. Then, we arranged the encryption points on the initial surface and performed 3D surface subdivision and Kriging interpolation to generate various interfaces with complex shapes. The set of initial interfaces included the ground surface, fault planes, and stratigraphic interfaces. Figure 4 shows a screenshot of the upper interface of the magmatic intrusions created in ROCKModel.
  • Create the wire frame of the model. By the intersection searching module, the intersection wires between two interfaces were obtained. We combined the boundary of the interfaces to generate the initial wire frame, and then found the intersection between any two boundaries in the initial wire frame. We inserted each intersection as a unique object into the corresponding boundary. After that, we dispersed the boundary to generate the set of simple arcs and created the wire frame of a model composed of simple arcs, thereby forming a boundary contour of all the original interfaces.
  • Interface modification and reconstruction. According to the intersection of the interfaces, we modified the boundary contours of the original interfaces and deleted the extra parts. The modified boundary contours were used as a constraint, and all interfaces were reconstructed and interpolated.
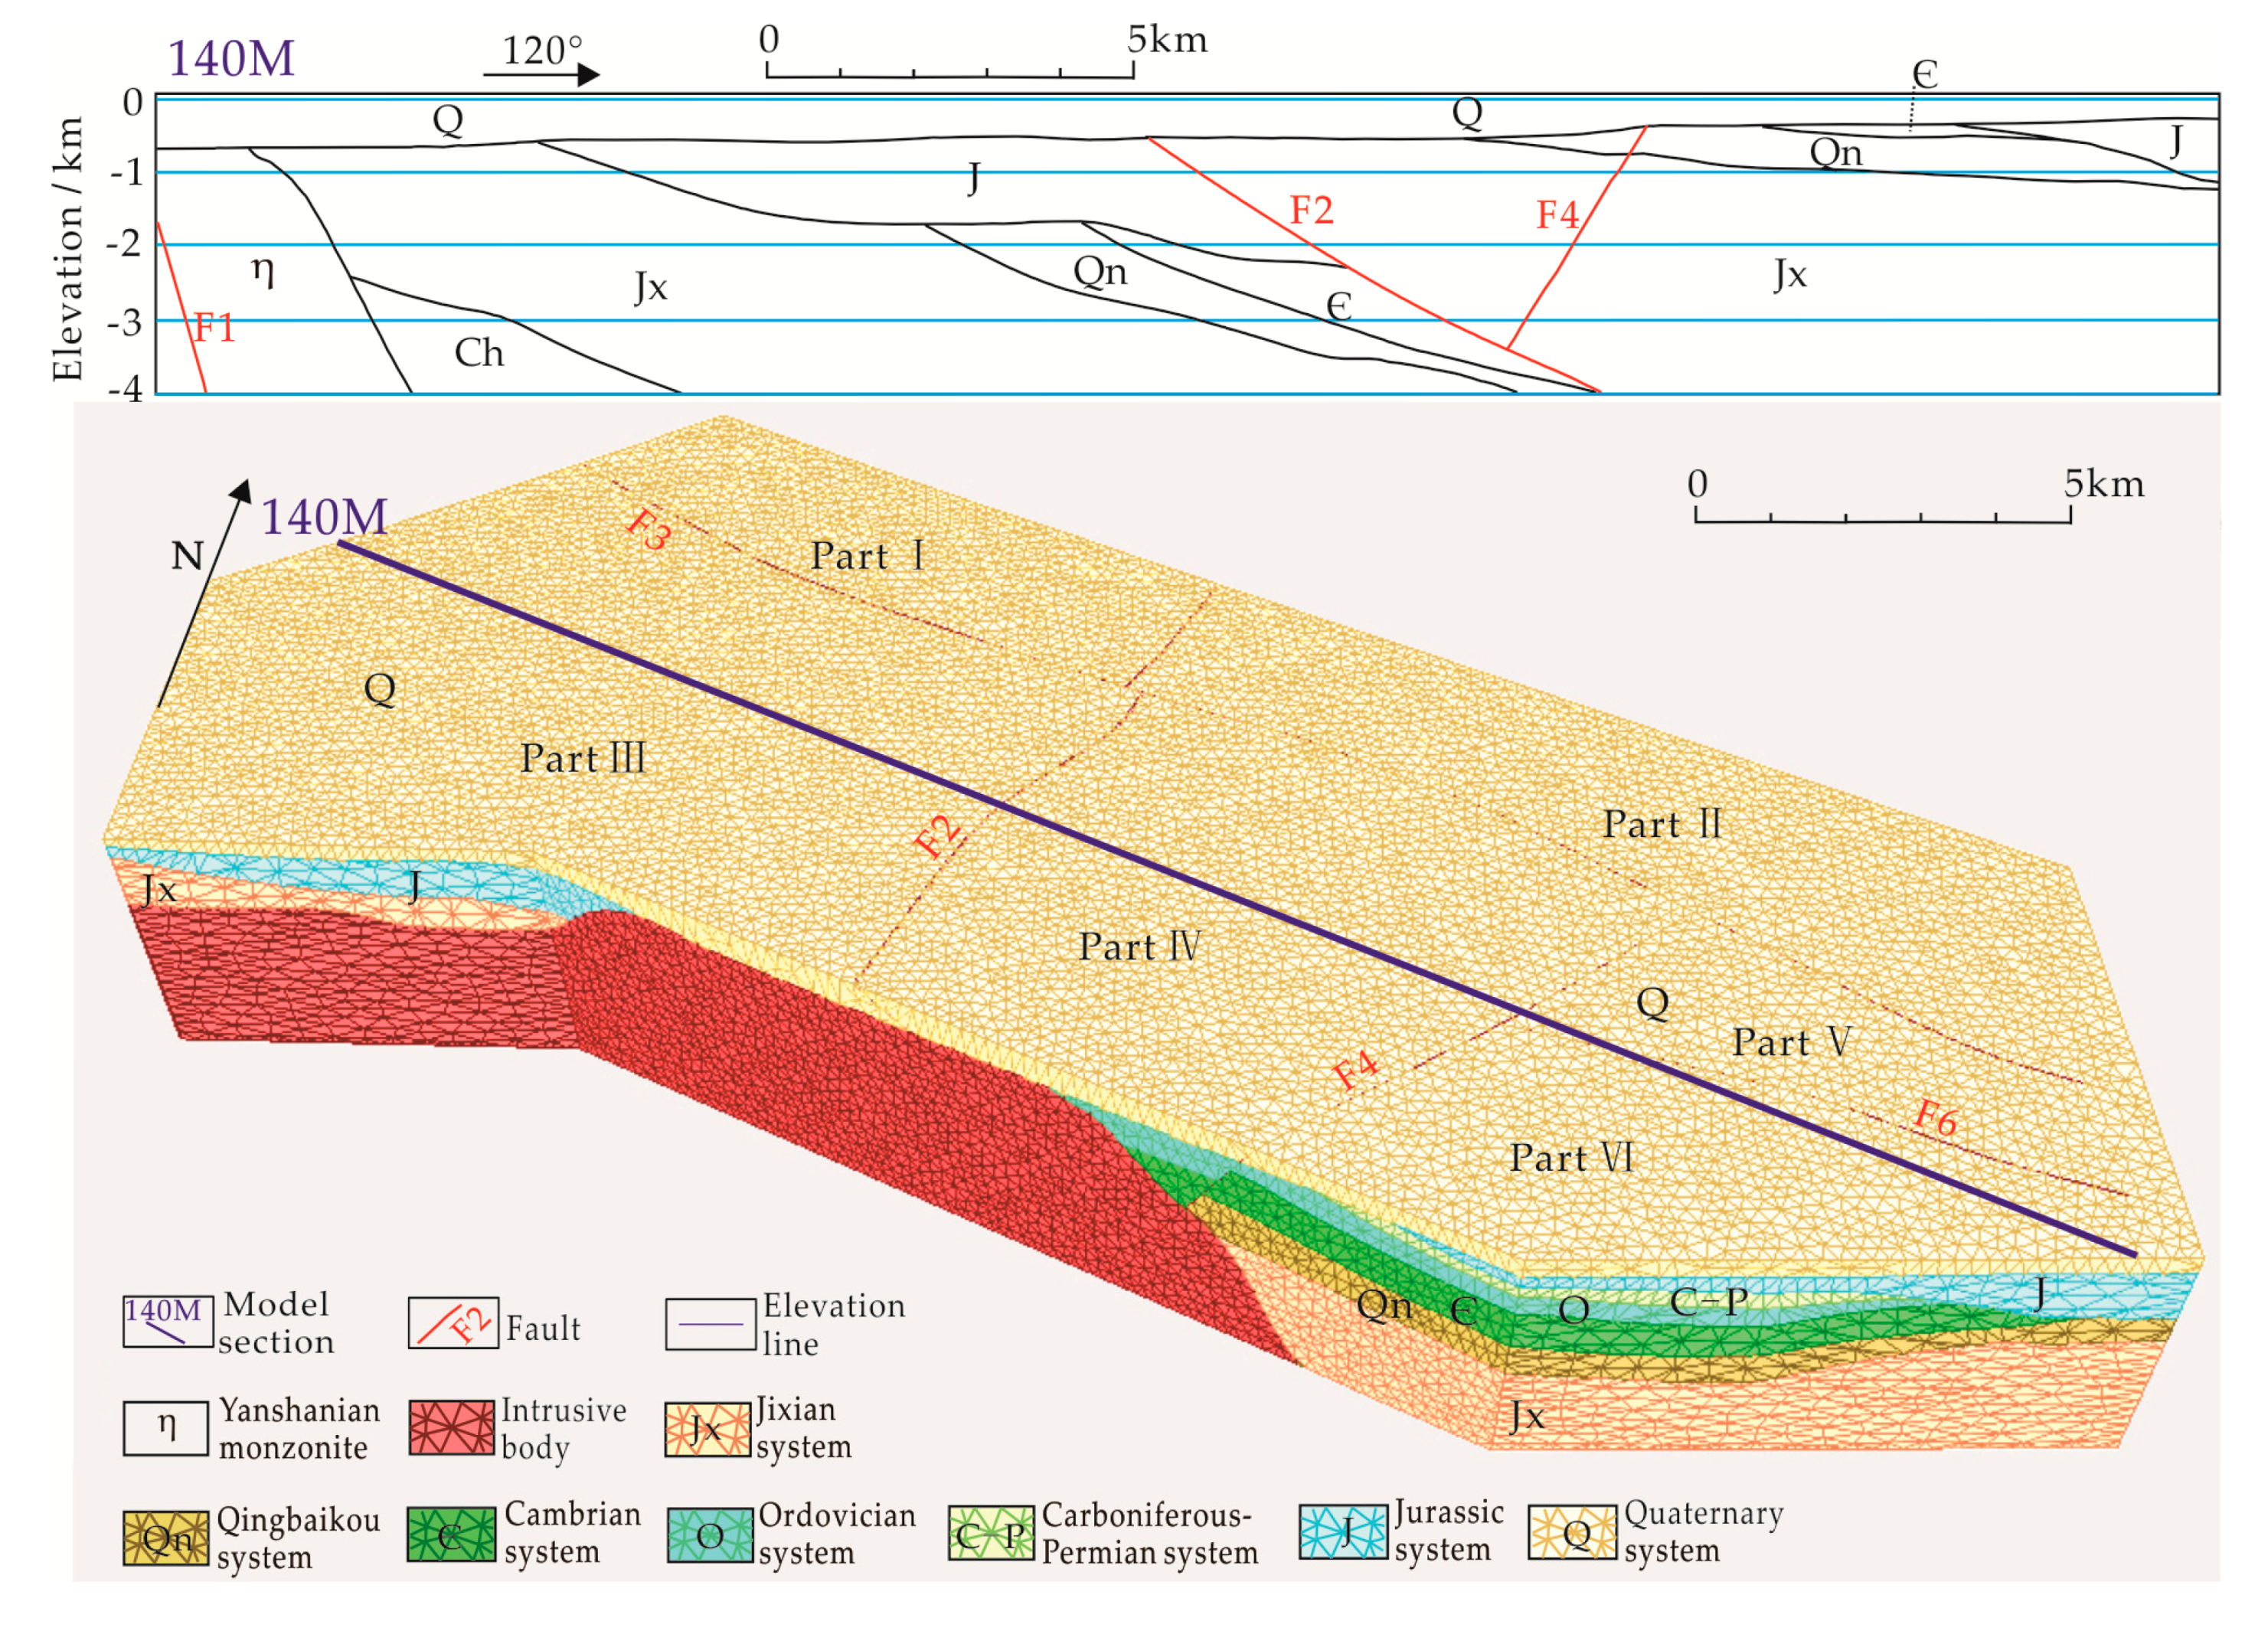
  • Block searching and attribute classification. By the function of the block searching module, we found 43 closed blocks. All the original interfaces had been converted into actual seamless interfaces. According to the attributes, the blocks were classified. Finally, the 3D geological model was completed [32].
To enhance the understanding of the geothermal field, the 25 °C, 40 °C, and 60 °C isothermal surfaces were added into the 3D geological structure model. According to the "Geologic exploration standard of geothermal resources" of China, these three temperatures are the dividing values of low-temperature geothermal resources, and the different temperature intervals had a corresponding utilization [13]. In the ROCKModel system, a program was written to achieve the following functions: according to the geothermal gradient of strata and the thickness of the strata model, the z values of the 25 °C, 40 °C, and 60 °C temperature nodes on the vertical Z-axes drawn from the nodes of the strata interface were calculated in the model. Then, the obtained nodes of the same temperature were used to create the isothermal interfaces in the ROCKModel by the mapping modeling method.

3.4. Improved Volumetric Method

The volumetric method was developed by the United States Geological Survey (USGS) in the 1970s [33]. This method is widely used and is simultaneously suitable for pore-type and fracture-type geothermal reservoirs. The method is frequently used for the early-stage exploration of geothermal resources [34]. The volumetric method can estimate the geothermal potential in the area, which calculates the volume of geothermal fluid and the reserves of geothermal resources.
Taking into account the degree of available data, geothermal conditions and the early stage of geothermal exploration, the volumetric method was used to calculate the geothermal resources. In the volumetric method, the volume of the geothermal reservoir was the product of its area and average thickness. On account of the reservoir not having a regular shape, the value of average thickness would exist errors. By the integration of 3D geological modeling and isothermal surfaces, the study calculated the volumes of different temperature intervals of the heat reservoir accurately and automatically and assigned values to parameters of different parts to achieve an accurate calculation of geothermal reserves. In the ROCKModel, a program was written to achieve a function that added up the volume of tetrahedron units of the geothermal reservoirs with the center of gravity under the 25 °C and 40 °C isothermal surfaces, thereby obtaining the volume of the geothermal reservoir whose temperature was higher than 25 °C and 40 °C in each part. By the existing data, testing data, and relevant specifications, the calculation parameters of each part were obtained, and then we calculated the reserves of geothermal resources by the improved volumetric method [13].
QL = Vφ + VSS (hH)
QE = αQL
Q = rCr (1 − φ) (t1t0) + QLρwCw(t1t0),
QR = ηQ
where QL is the volume of geothermal fluid in the geothermal reservoir, in m³; V is the volume of the geothermal reservoir, in m3; φ is the rock porosity of the geothermal reservoir, which refers to the results of pumping test of thermal wells in various places of the study area and the empirical value of the urban geothermal field, and the values of Part Ⅰ, Ⅱ, Ⅲ, and the other parts are 0.6%, 0.55%, 0.45%, and 0.5%, respectively; SS is the specific storativity, whose value is 1 × 10⁻⁷·m−1; h is the average hydraulic head of confined water, in m; H is the average elevation of geothermal reservoir roof, in m; QE is the volume of exploitable geothermal fluid, in m³; α is the exploitable coefficient, whose value is 0.25%; Q refers to the reserves of geothermal resources, in J; ρr is the rock density of the geothermal reservoir, according to the latest rock density test data, the value 2.81 × 10³ kg·m−3; Cr is the specific heat capacity of the geothermal reservoir rocks, with a value of 920 J·kg−1.°C−1; t1 is the temperature of the geothermal reservoir, in °C; t0 is the local average annual temperature, whose value is 14 °C; ρw is the geothermal water density, with a value of 980.49 kg·m−3; Cw is the specific heat capacity of geothermal water, with a value of 4186.9 J·kg−1·°C−1; QR refers to the recoverable reserves of geothermal resources, in J; and η is the recovery rate, the value of which is 15%.

4. Results and Discussion

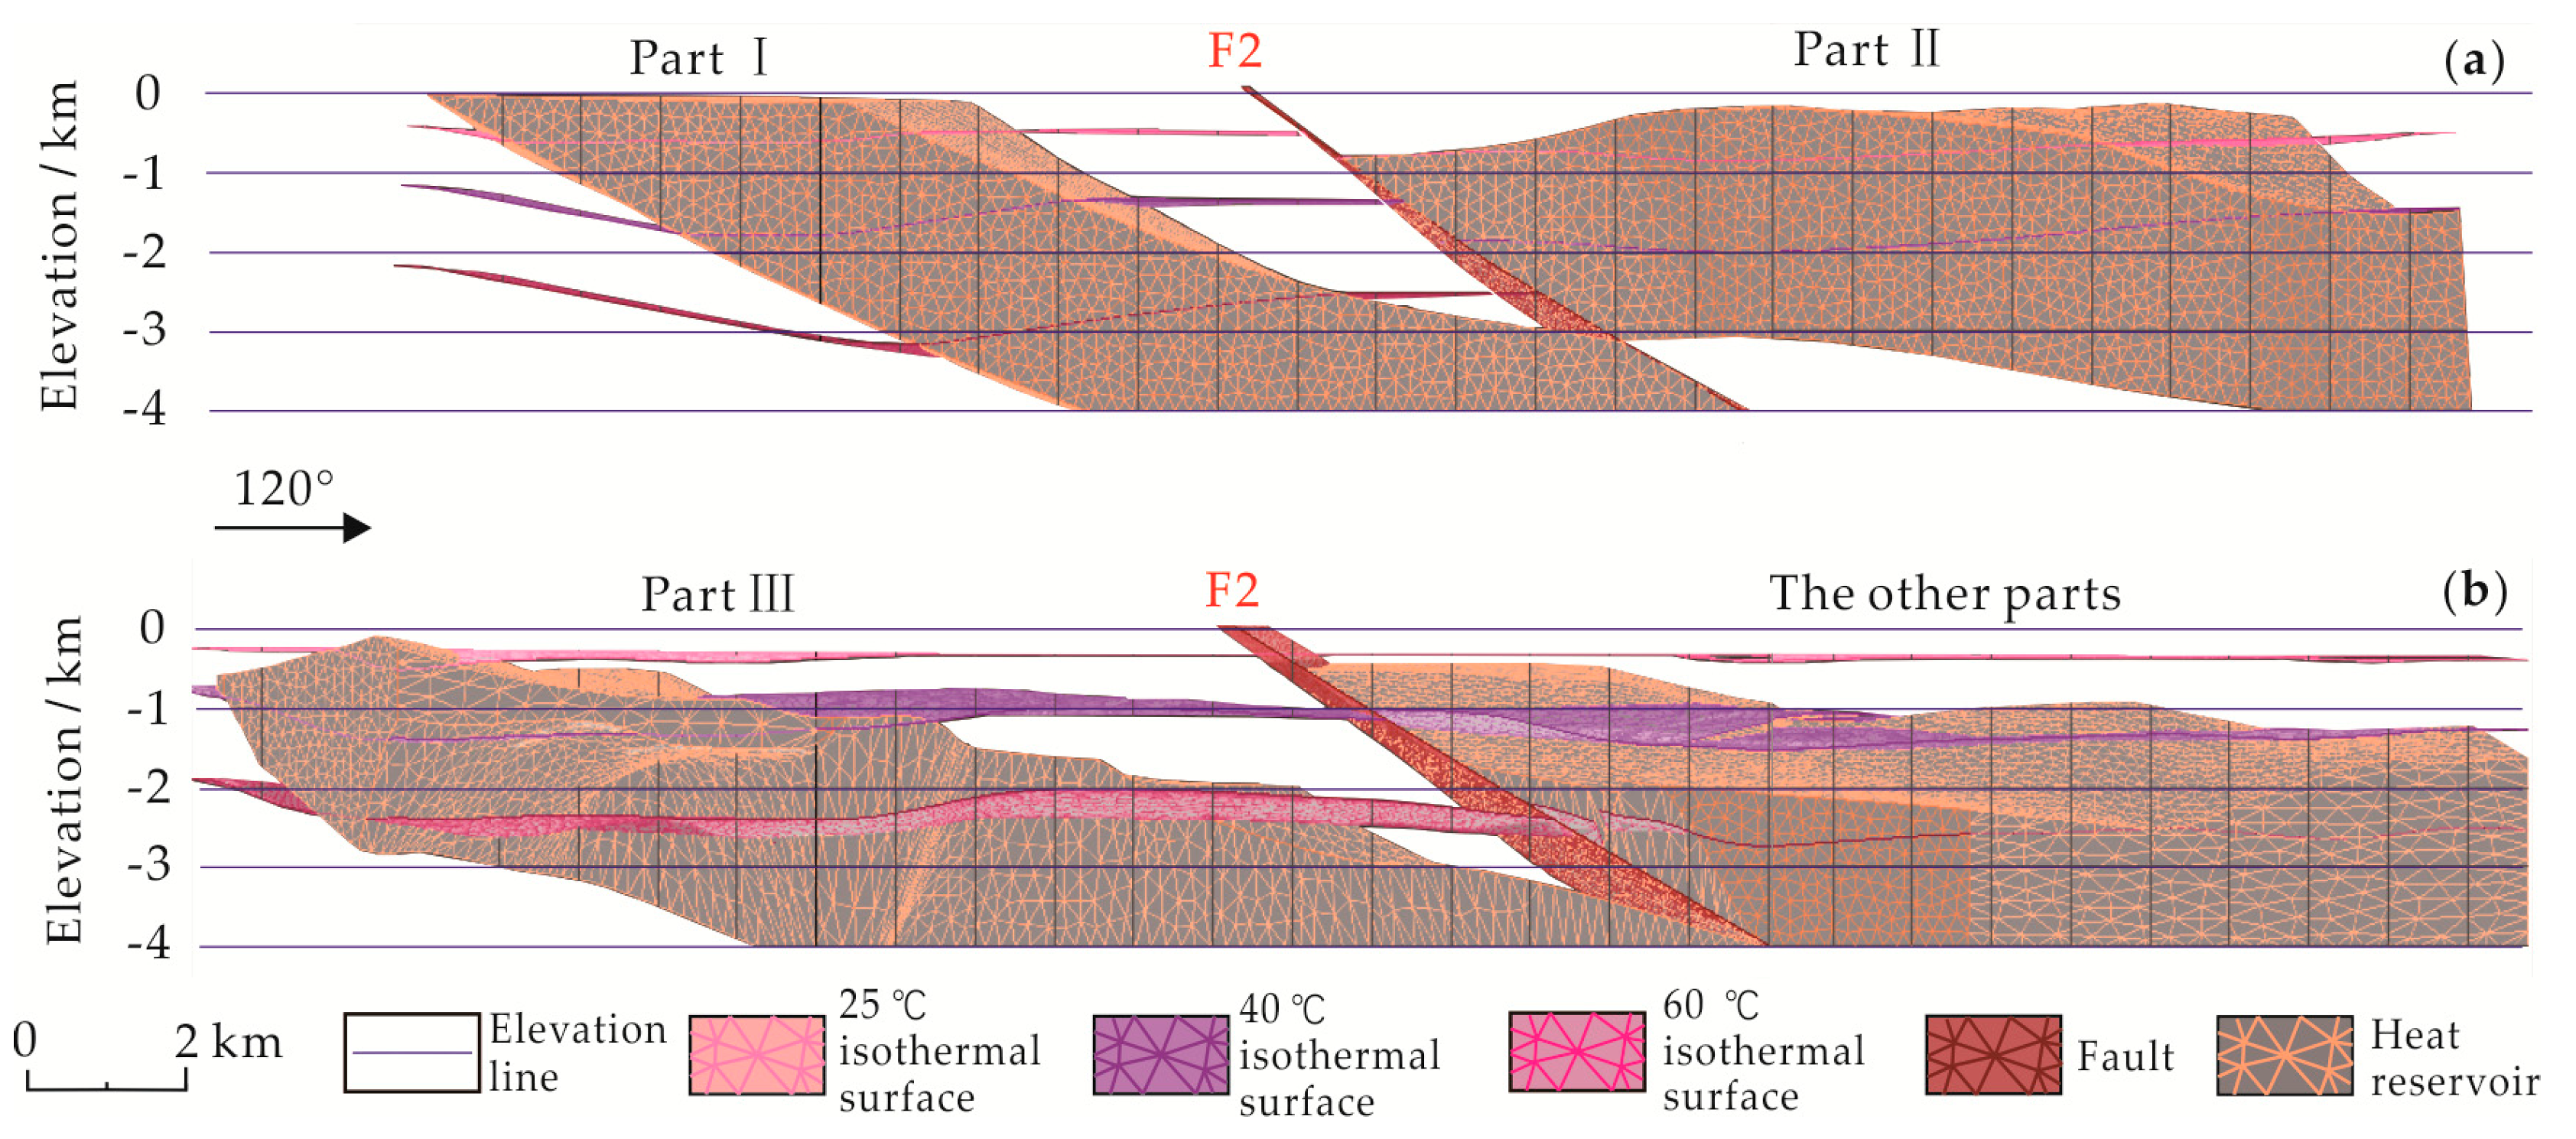
4.1. Integration of 3D Geological Model and Isothermal Surfaces

The three-dimensional geological model—the number of vertices of which was about 1.22 million—could be displayed by software such as the ROCKModel and 3ds Max. The integration of the 3D geological model and isothermal surfaces showed the strata, faults, and isothermal surfaces of the research area visually and stereoscopically. Furthermore, the integration was used for the calculation of geothermal resources. Figure 5 shows the geological model of the study area presented in 3ds Max. After the geological model was created, the original geological sections were compared with the sections, which were taken at the corresponding positions in the model. For example, the 140M model section presented in Figure 5 was compared with the 140 geological section in Figure 1. The comparison results showed that the strata, intrusive bodies, and faults of the model sections were consistent with the original geological sections.
Figure 6 shows the modeling results of the geothermal reservoir and isothermal surfaces. Divided by the Fault F2 and F3, the geothermal conditions of four regions had large differences, and in the adjacent Part Ⅳ, Ⅴ, and Ⅵ, the geothermal geological conditions were similar. Therefore, the study area was divided into four regions for analysis, namely Part Ⅰ, Ⅱ, Ⅲ, and the other parts. Figure 6a shows Parts Ⅰ and Ⅱ, located on the northeast side of Fault F3, and (b) is Part Ⅲ and the other parts located on the southwest side. The model gave a clear intuitional and stereoscopic view of the shape and distribution of the geothermal reservoir and fluctuations of the isothermal surfaces. Figure 6 shows that, in two walls of the Fault F2, the heat reservoirs exhibited large differences and displacements. The burial depths of the heat reservoirs increased from northwest to southeast in Part Ⅰ and Ⅲ, while the changes of burial depths are relatively smaller in Part Ⅱ and the other parts.

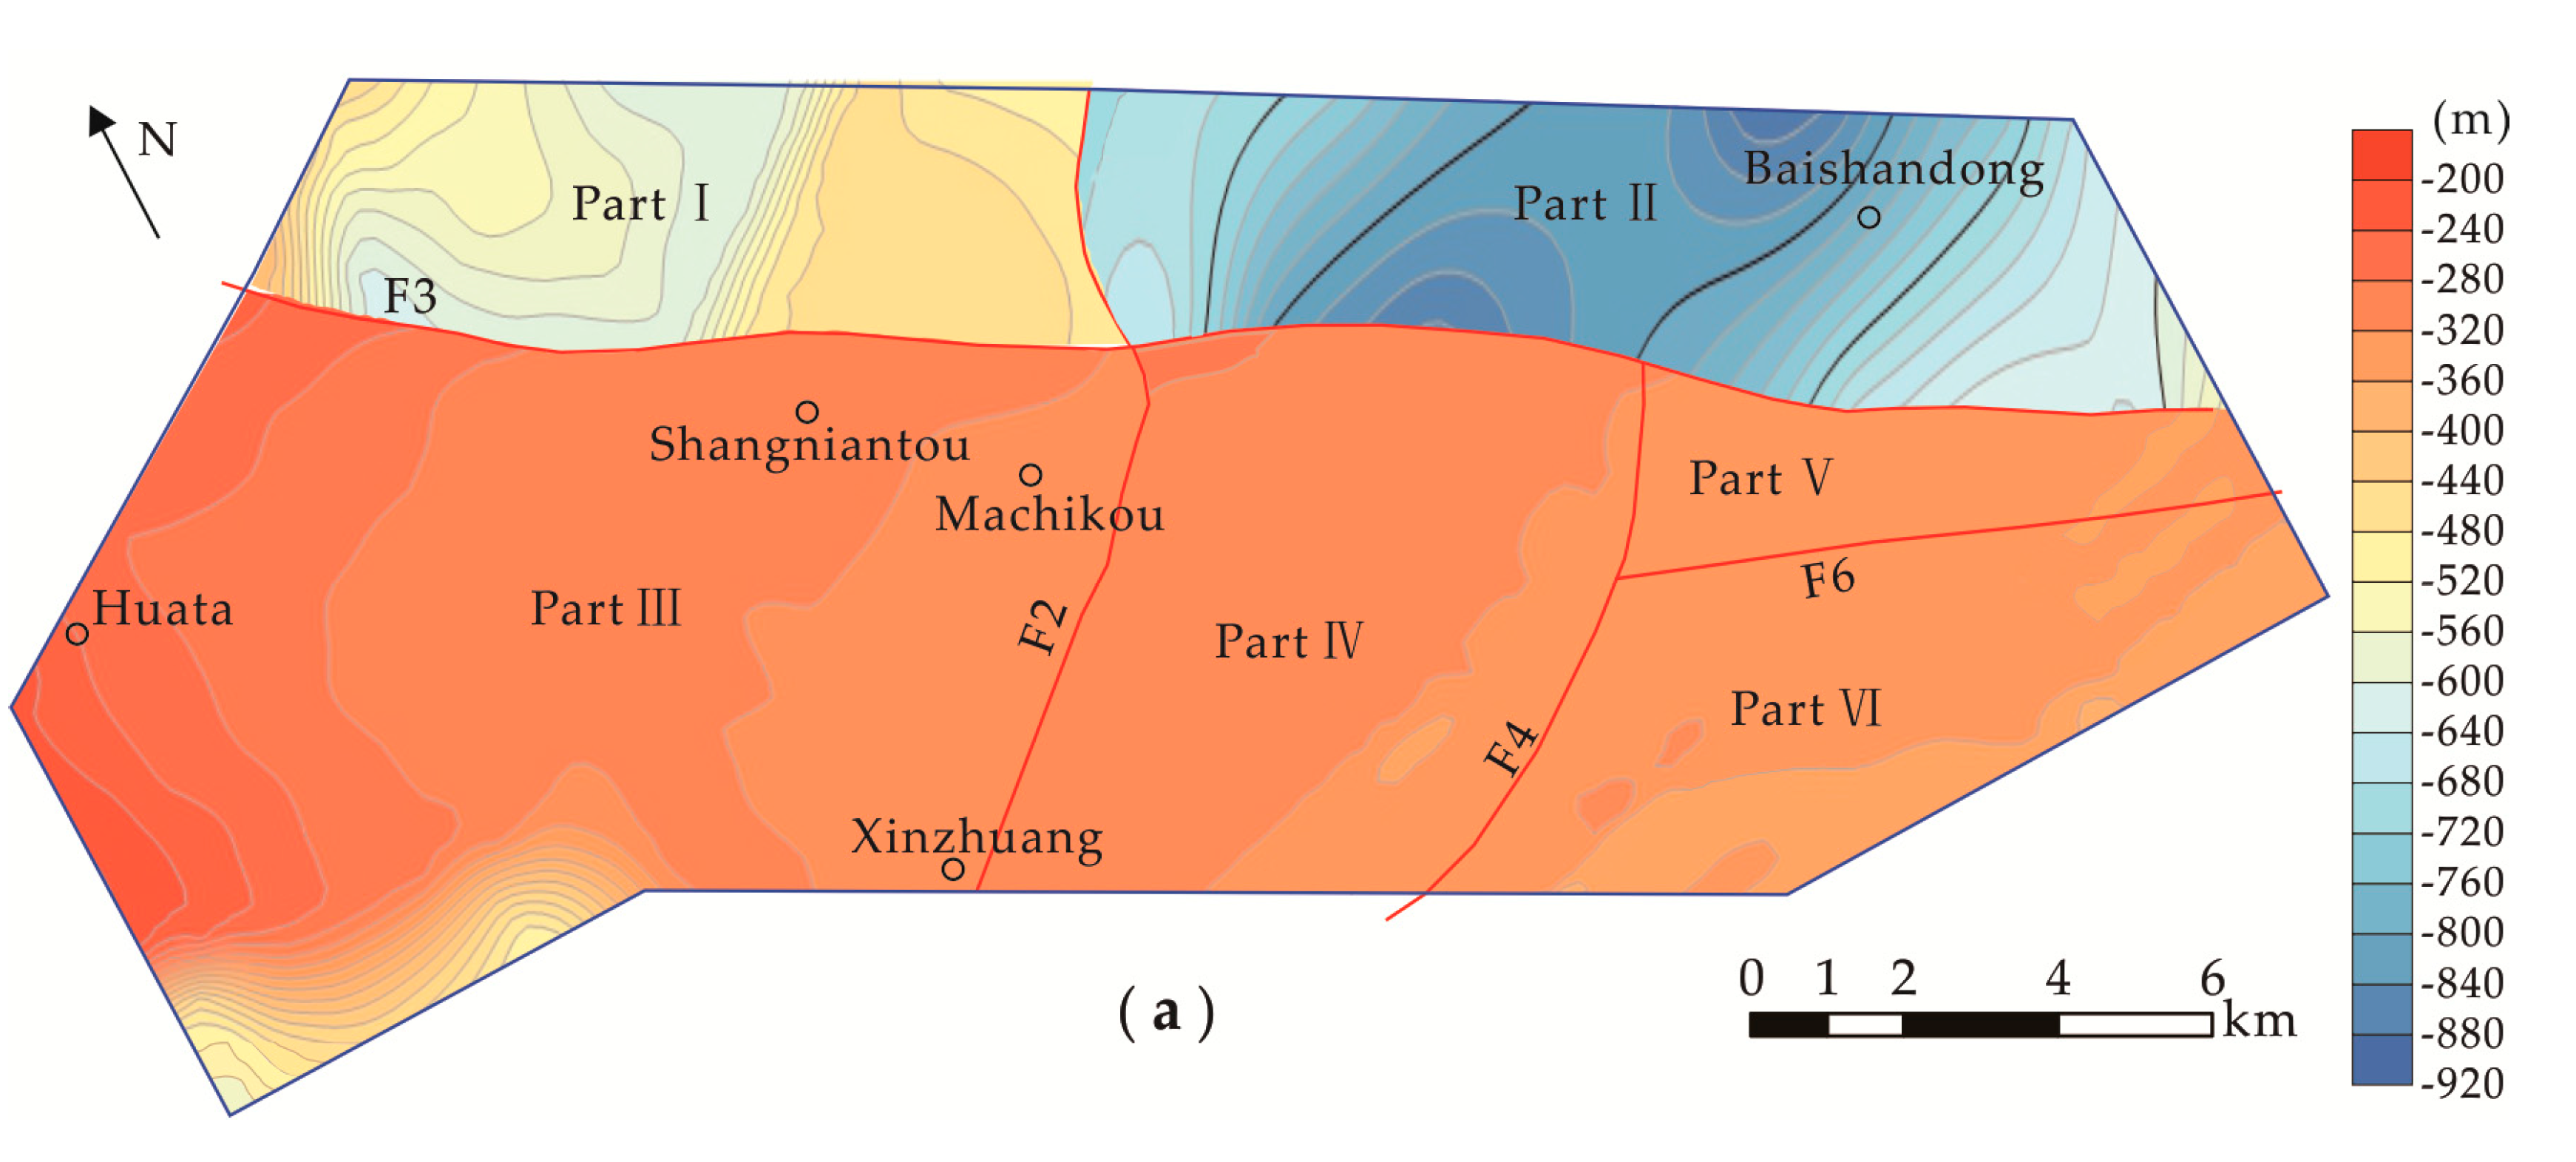
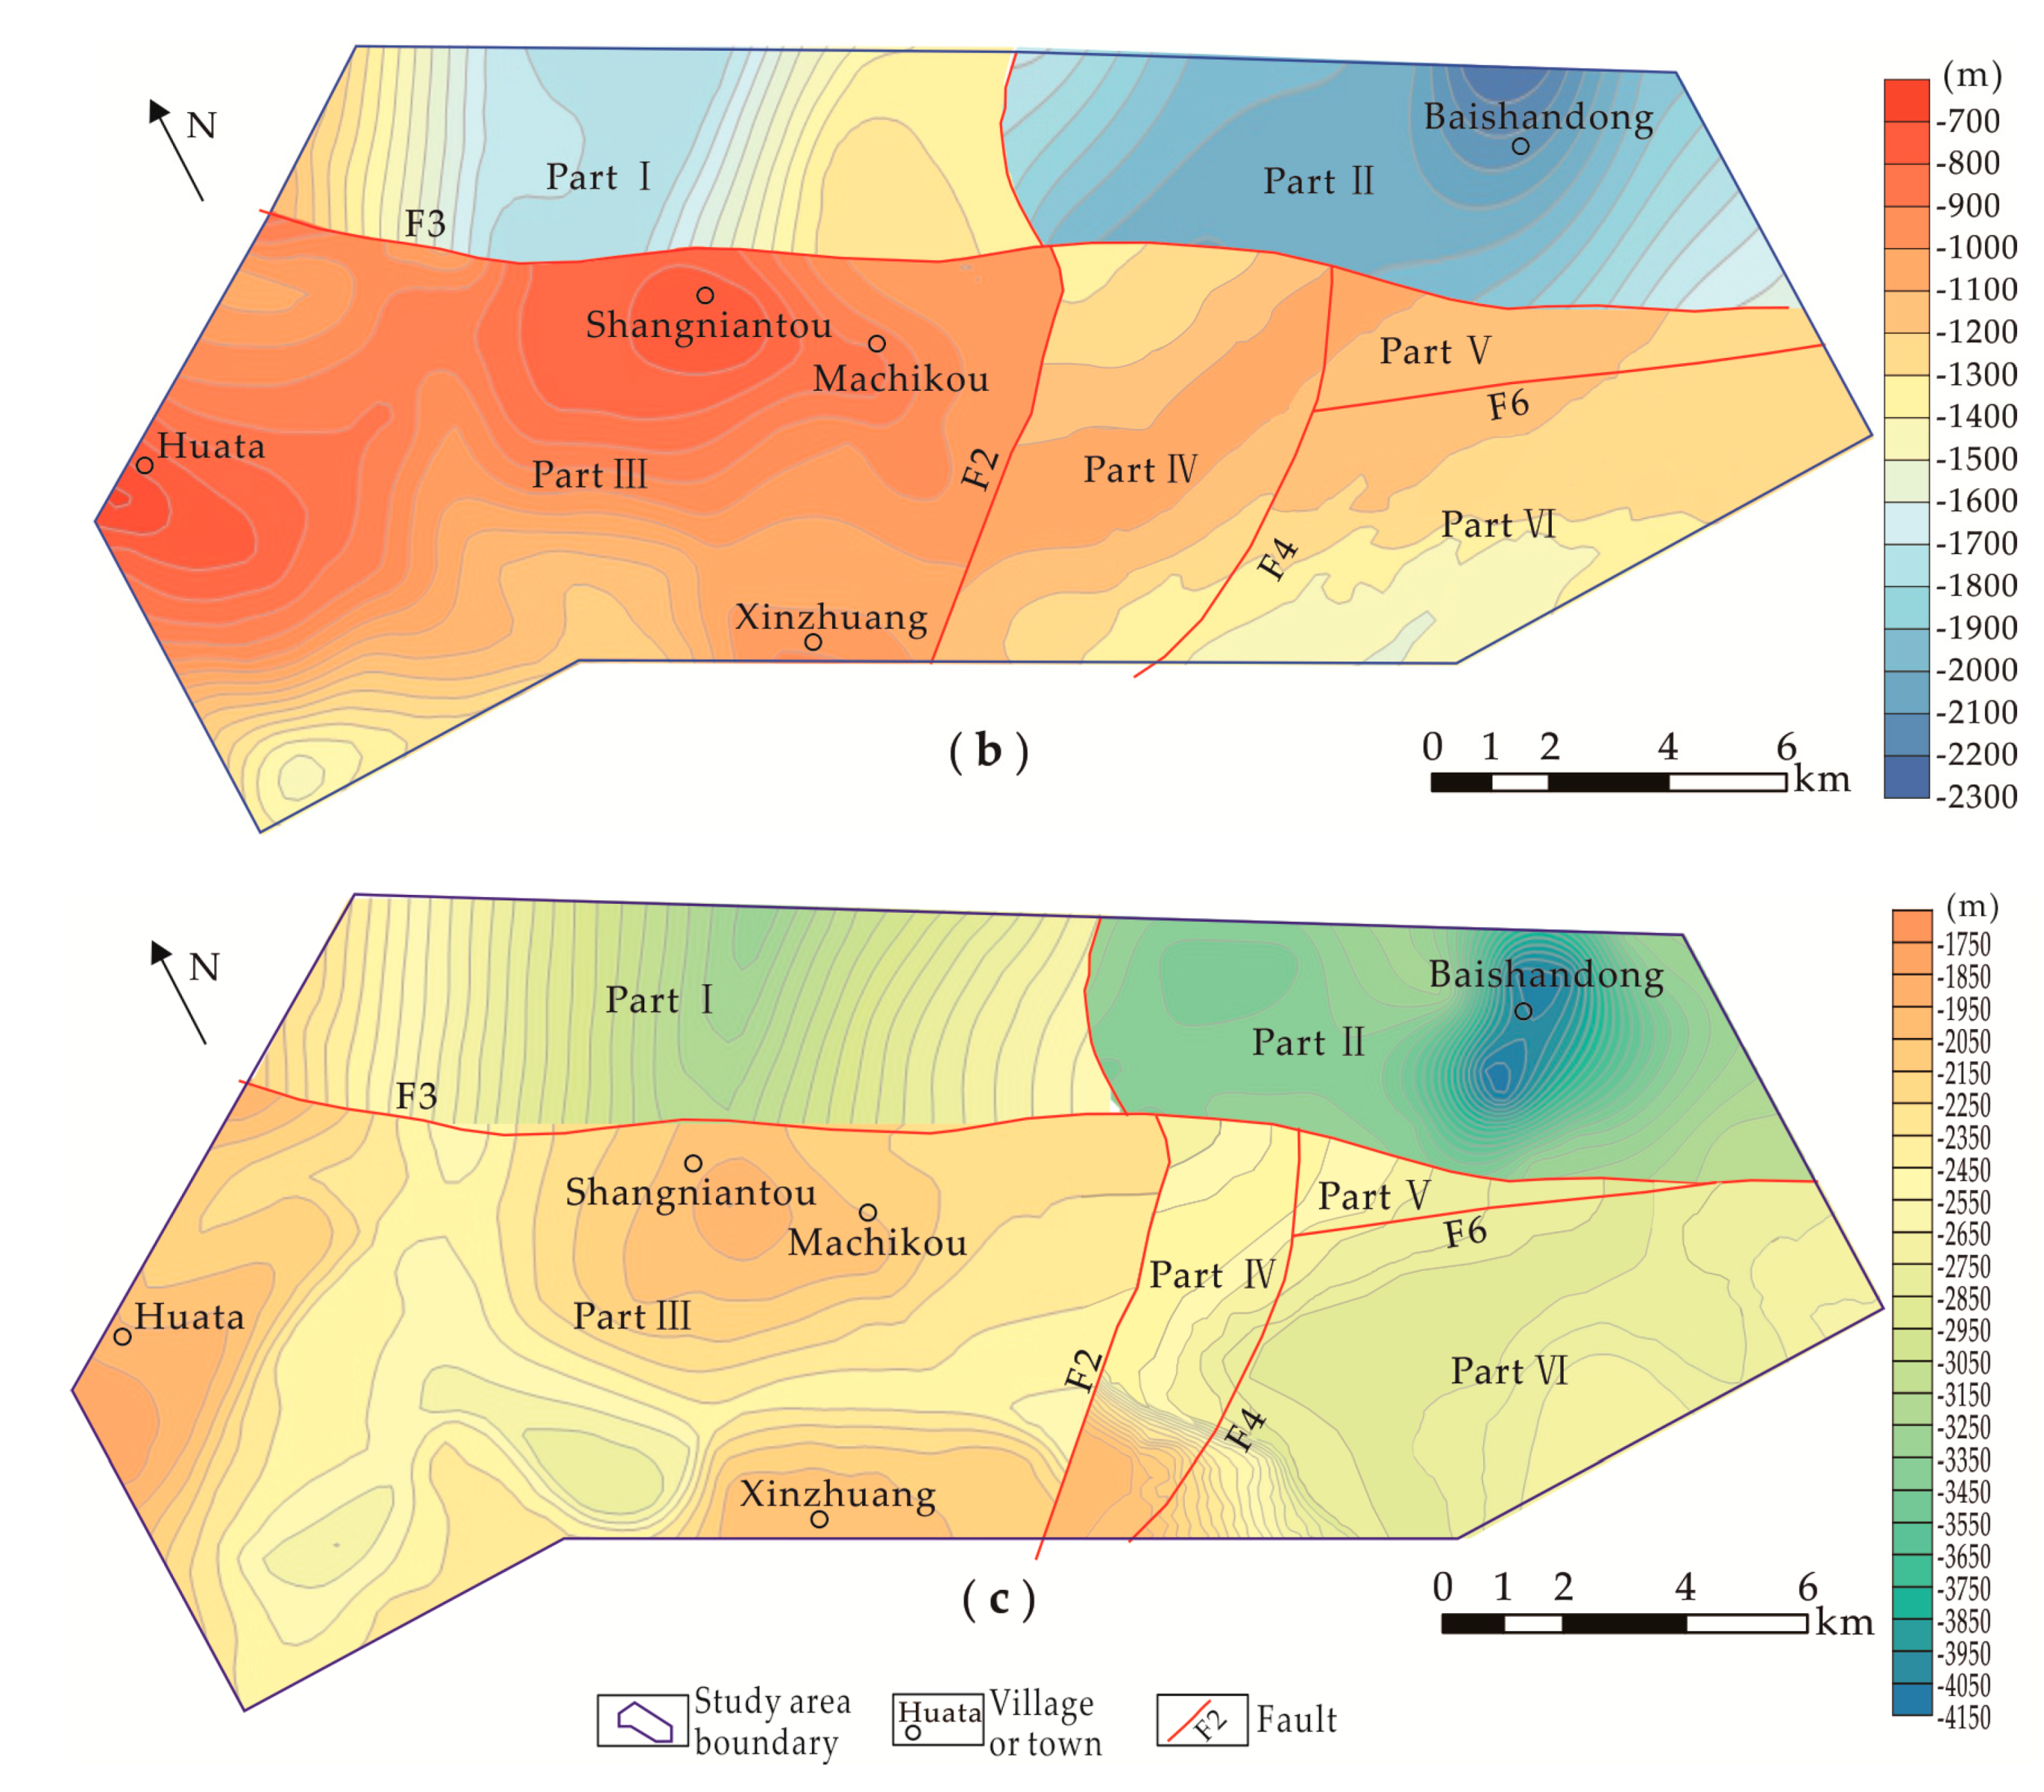
4.2. Present Geothermal Field Analysis

Based on the available data of temperature measurement from boreholes and the measurements of thermal conductivity on rock samples, this article analyzed the characteristics of regional terrestrial heat flow and created isothermal surfaces in the 3D geological model. Isothermal surface analysis could directly obtain the elevations of geothermal resources at a certain temperature, which was helpful for the corresponding utilization of different temperature intervals. By the temperature node data of the isothermal surface, the study obtained the average elevations of the 25 °C, 40 °C, and 60 °C surfaces in each part. In the study area, the average elevations of 25 °C, 40 °C, and 60 °C isothermal surfaces were at −415 m, −1282 m, and −2613 m, respectively.
The elevations of 25 °C isothermal surfaces of Parts Ⅰ and Ⅱ were −513 m and −679 m, respectively, while the average heights of isothermal surfaces in Part Ⅲ and the other parts were −400 to −300 m. Divided by Fault F3, it was up to 300 m for the difference of the average elevations of 25 °C isothermal surfaces between the hanging wall (Part Ⅰ and Ⅱ) and the footwall (Part Ⅲ and the other parts; Figure 7a). The reason for this was that, between two walls of F3, the thickness of the Quaternary sedimentary caprocks had a difference of more than 500 m, and the geothermal gradient of the Quaternary caprock was much higher than other strata.
The presence of intrusive bodies in the area affected the fluctuations of isothermal surfaces. In Parts Ⅱ and Ⅲ, the geothermal gradient values of the intrusive bodies had large differences, resulting in the minimum and maximum elevations of 40 °C and 60 °C isothermal surfaces in the study area. In Huata and Xinzhuang of Part Ⅲ, because of intrusive rocks, the burial depths of 40 °C and 60 °C isothermal surfaces are shallow (Figure 7b,c), while in Baishandong of Part Ⅱ, the intrusive body caused the burial depths of 40 °C and 60 °C isothermal surfaces to be deeper. The average elevation of 40 °C isothermal surface of Part Ⅱ was −1707 m, while the other parts were −1500 to −1000 m. Due to the sag of the basement in the Shangniantou area of Part Ⅲ, the burial depths of 40 °C and 60 °C isothermal surfaces were shallower. In the study area, the morphology of isothermal surfaces was mainly related to the fault structures, basement form, lithology, and thickness of the important caprock.
The measurement of terrestrial heat flow was determined by the geothermal gradient and thermal conductivity of rock. The value of heat flow was equivalent to the product of these two parameters. In the study area, the heat flow values ranged from 49 to 99 mW m−2, which increased from northwest to southeast overall (Figure 8). The northwest of the study area was the piedmont area, whose heat flow values were about 50 mW m−2. In the middle of the study area, there was a relatively high heat flow area, Xueshancun, whose values were greater than 65 mW m−2. In the southeast, the heat flow values were generally greater than 70 mW m−2. There were two high heat flow anomalous areas, Zhenggezhuang and Guanniufang area, with values up to 90 mW m−2. In the study area, the distribution of heat flow was related to the faults, lithology, and relief of bedrock.

4.3. Resources Calculation Results

In this study, the isothermal surfaces were created in the 3D geological model, and the volumes of the heat reservoir above 25 °C and 40 °C in each part were calculated. The volume proportions of different temperature intervals of the heat reservoir in the different parts are listed in Table 1. The total volume of the geothermal reservoir was 4.88 × 10¹¹ m³, which accounted for 46.9% of the total volume of the study area. The volume of the geothermal reservoir above 25 °C was 4.74 × 10¹¹ m³, which accounted for 97.2% of the volume of the geothermal reservoir. The temperatures of the geothermal reservoir in the study area were mainly within 25–90 °C, namely low-temperature geothermal resources. The 25–40 °C, 40–60 °C, and above 60 °C intervals accounted for about 17.6%, 37.9%, and 41.7% of the heat reservoir volume, and the average elevation of 60 °C isothermal surfaces was −2613 m. Therefore, the resources around 60 °C were relatively abundant and could be easily developed and utilized.
In this study, the improved volumetric method was used to calculate the reserves of geothermal resources in each part (Table 2). The total volume of geothermal fluid in the study area was 2.42 × 10⁹ m³, and the volume of exploitable fluid was 6.04 × 10⁶ m³. The total geothermal reserves were 5.42 × 10¹⁹ J. The recoverable geothermal reserves were 8.14 × 10¹⁸ J, which was equivalent to the thermal value of standard coal of 2.78 × 10⁸ t (each kilogram of standard coal was equal to 29,301 kJ). The results showed that the geothermal resources in the study area had good potential, which could provide support for the green development of Changping New Town by rational exploitation and utilization. In the process of exploitation, the reinjection technique should be used and groundwater dynamic monitoring needed to be reinforced.

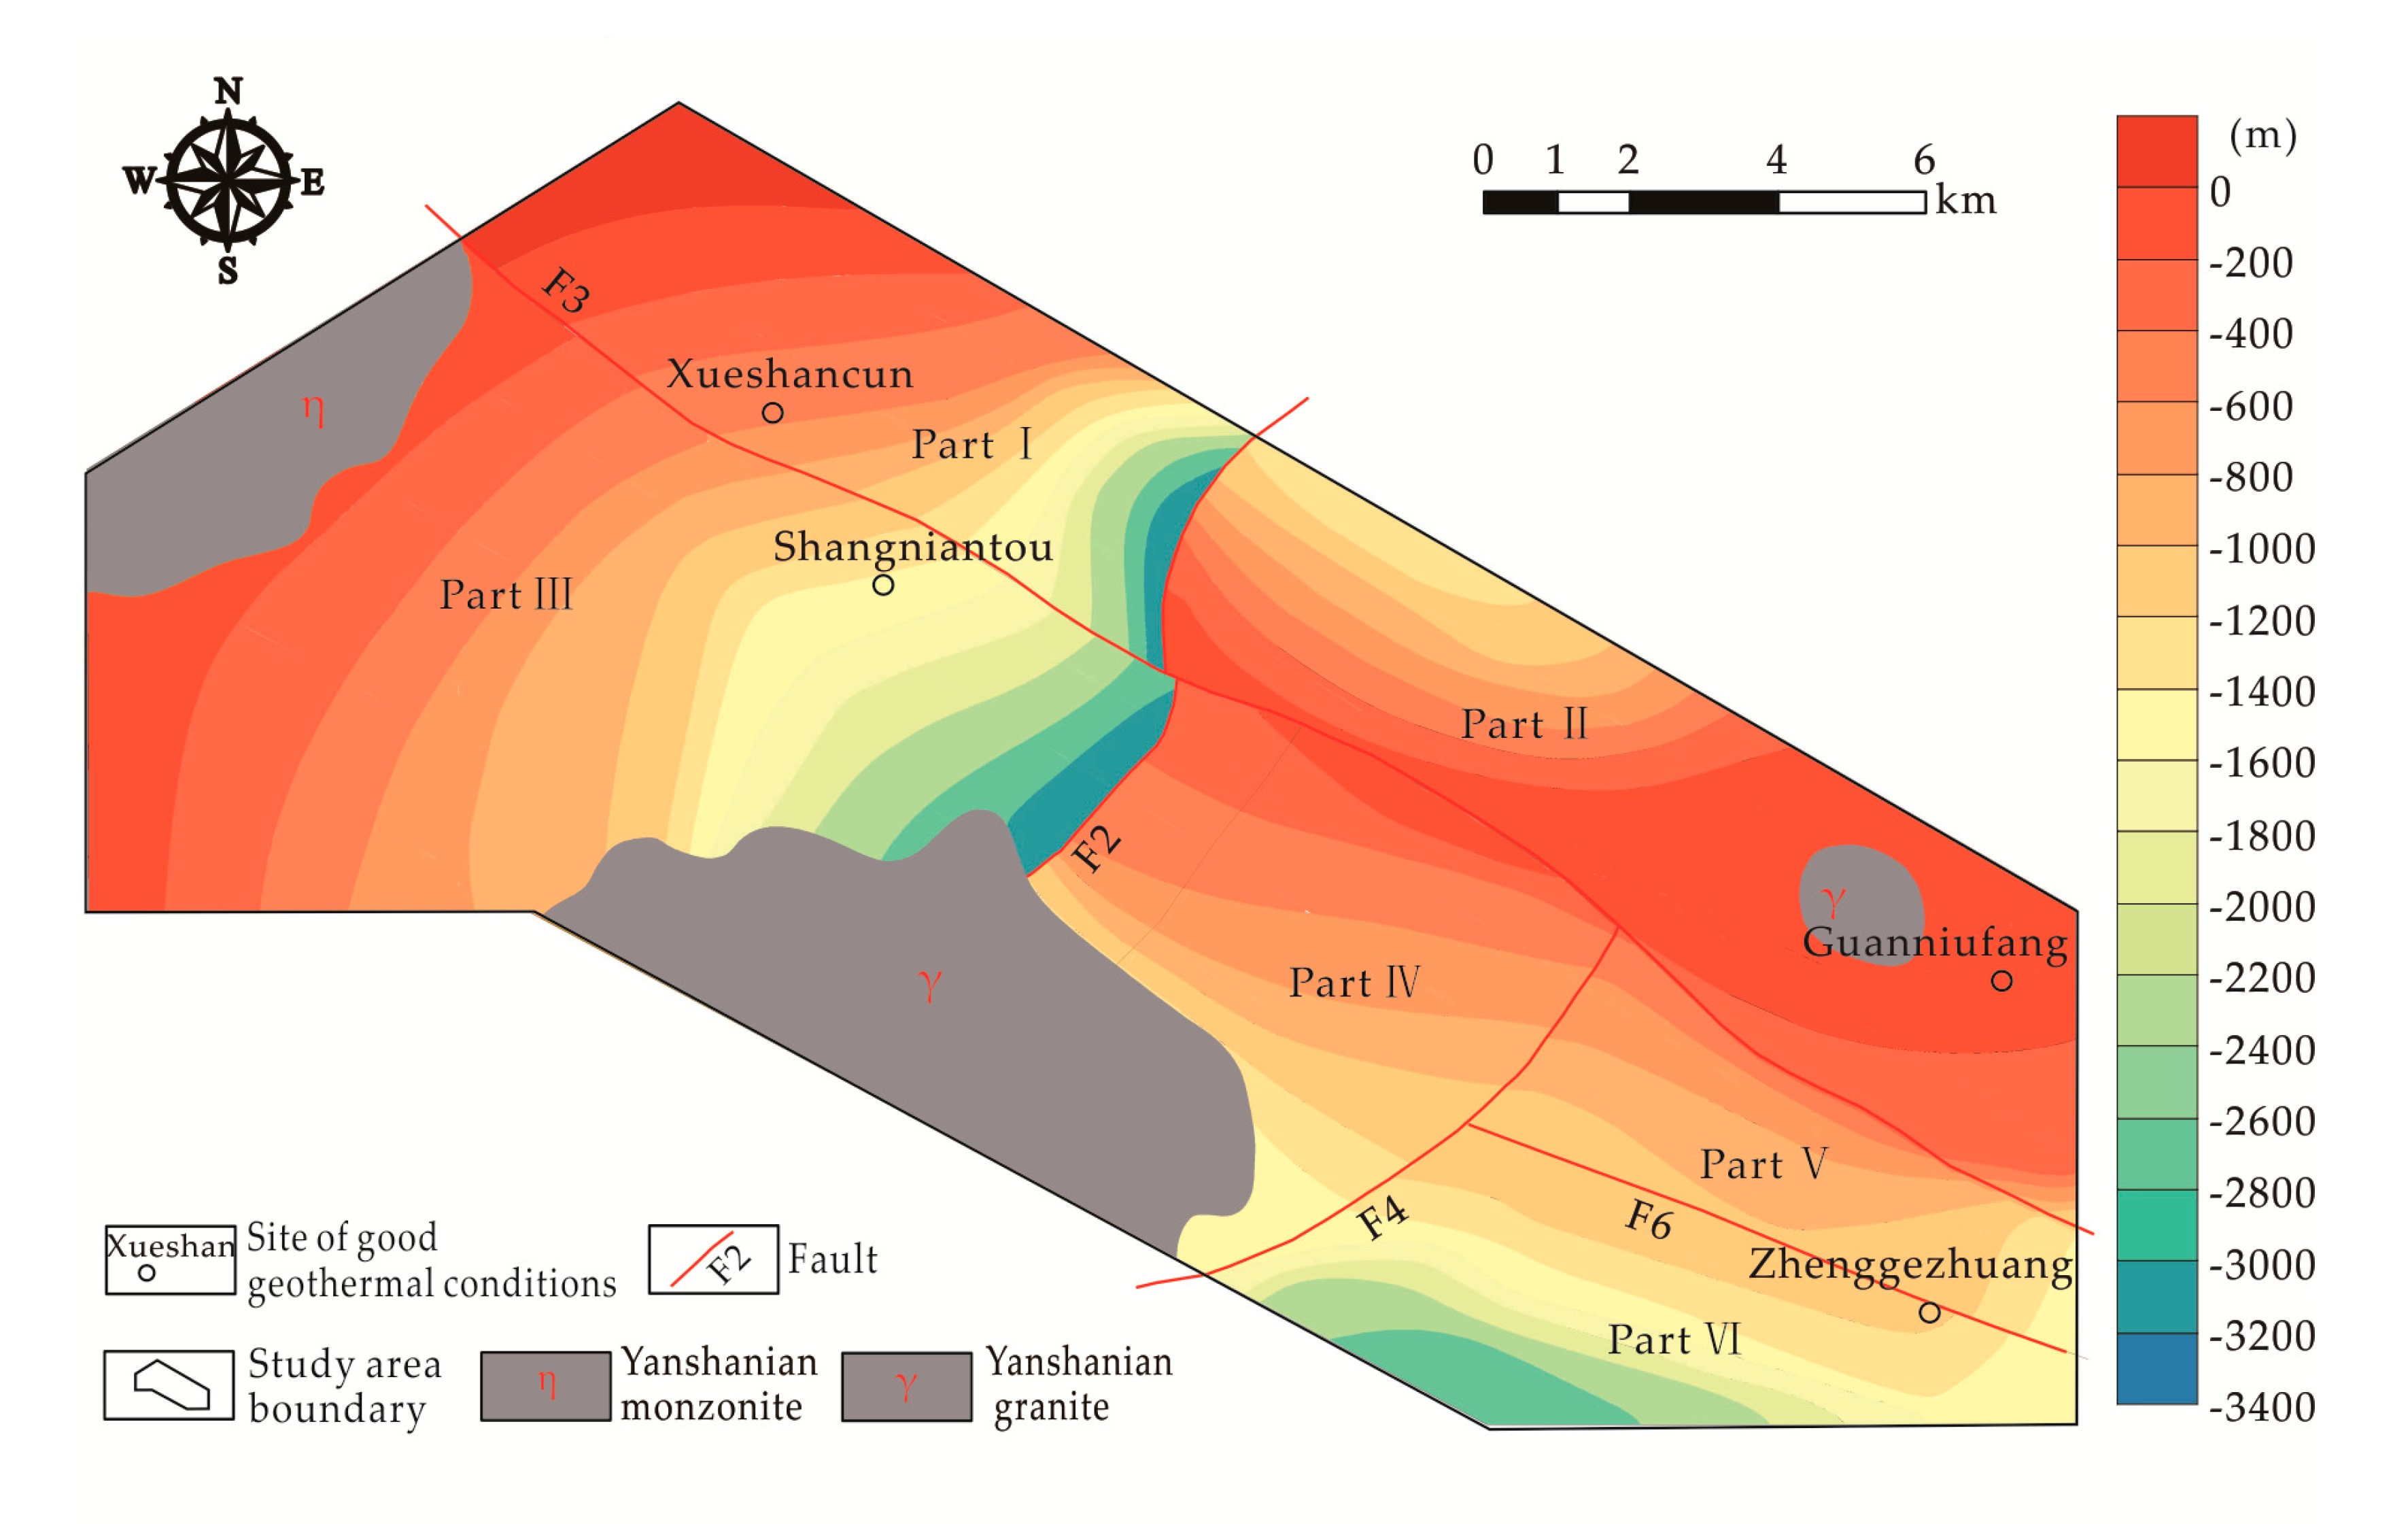
4.4. Geothermal Resources Distribution

In the study area, the distribution of geothermal resources was related to many factors such as the geothermal reservoir, water abundance, faults, intrusive bodies, caprock, and characteristics of the geothermal field. The thermal convection activity of the Fault F3 was intense. Between the hanging wall and the footwall of the Fault F3, the vertical drop of the thickness of the Quaternary sediment was greater than 500 m, which was the most important capping layer in the study area. Between the two walls of Fault F2, the fault displacements of the heat reservoir and caprock are large, and the burial depths of heat reservoirs had a big gap (Figure 9). The intrusive bodies affected the space of the heat reservoir. The following is a detailed and comprehensive analysis for the sites whose geothermal conditions are relatively good in the different parts, and the sites are marked on Figure 9.
In Part Ⅰ, the Quaternary sediment caprock was relatively thin, and the geothermal water abundance was medium. For example, the discharge of ZK6 was 1226 m3 d−1. The burial depth of the heat reservoir gradually increased from northwest to southeast, which affected the difficulty of development and utilization. For a large proportion of Part Ⅰ, the value of terrestrial heat flow was less than 60 mW·m−2. However, in the Xueshancun, close to Fault F3, the value of terrestrial heat flow was up to 70 mW·m−2, and the burial depth of heat reservoir was about 500 m. In this part, the geothermal conditions of Xueshancun were relatively good.
In Part Ⅱ, the Quaternary sediment was relatively thin, and the heat flow gradually increased from northwest to southeast. The intrusive body in Baishandong affected the geothermal geological conditions in this part. In the other regions of Part Ⅱ, the burial depth of the geothermal reservoir was mostly less than 1500 m, with a thickness of about 2000 m. In the east, the zone near Guanniufang exhibited a high heat flow, with values up to 90 mW·m−2.
Part Ⅲ was greatly affected by the intrusive bodies. Compared with the other parts, it was relatively small in terms of the volume proportion of the heat reservoir. The water abundance of the geothermal reservoir was ordinary. For example, the discharge of ZK4 in this part was 1503.68 m3 d−1. In the Shangniantou area of the Machikou sag, the geothermal resources were relatively good. The heat flow values of Shangniantou were generally greater than 60 mW·m−2. This zone was close to Fault F3, and the burial depth of the geothermal reservoir was less than 2000 m. In the zone, the thickness of Quaternary sediment was about 800 m, which had a good effect of heat insulation.
In the other parts, the geothermal heat flow gradually increased from northwest to southeast. In the Zhenggezhuang zone, the geothermal conditions were relatively good. There were some geothermal wells those burials depths reached 2000–2500 m and temperatures were about 70 °C in the zone. In addition, the discharges of those geothermal wells were close to 2000 m3·d−1·m−1. The geothermal reservoir in the zone had a strong water supply capacity: the specific discharge was more than 100 m3·d−1·m−1. The heat flow value was generally greater than 80 mW·m−2. The burial depth of the geothermal reservoir was about 1500 m, and its thickness approximately 2000 m.

5. Conclusions

By the integration of 3D geological modeling and geothermal field analysis, this study not only visualized the local geological structures and isothermal surfaces but also calculated the volumes of different temperature intervals of heat reservoir accurately and automatically. Then, the geothermal reserves were calculated by the improved volumetric method, and the distributions of resources were analyzed comprehensively. In this study, the following conclusions could be made.
  • The average elevations of 25 °C, 40 °C, and 60 °C isothermal surfaces were −415 m, −1282 m, and −2613 m, respectively. The total heat reservoir volume in the study area was 4.88 × 10¹¹ m³. The temperature intervals of 25–40 °C, 40–60 °C, above 60 °C accounted for about 17.6%, 37.9%, and 41.7% of the total heat reservoir volume. The study area mainly belonged to the low-temperature geothermal resources, and the resources of about 60 °C were relatively abundant and easy to be developed and utilized.
  • In the study area, the heat flow values ranged from 49 to 99 mW m−2, which increased from northwest to southeast overall. By the comprehensive analysis, in Parts Ⅰ, Ⅱ, Ⅲ, and other parts, the sites whose geothermal conditions were relatively good were Xueshancun, Guanniufang, Shangniantou, and Zhenggezhuang, respectively.
  • The total volume of geothermal fluid was 2.42 × 10⁹ m³, and the volume of exploitable fluid was 6.04 × 10⁶ m³. The total reserves of the geothermal resources were 5.42 × 10¹⁹ J. The recoverable geothermal reserves were 8.14 × 10¹⁸ J, which was equivalent to the thermal value of standard coal of 2.78 × 10⁸ t. The geothermal resources in the study area had good potential, which could provide support for the green development of Changping New Town by rational exploitation and utilization.

Author Contributions

Conceptualization, Z.Z. and X.W.; Data curation, Z.Z., X.L. and X.W.; Formal analysis, Z.Z., X.L. and D.S.; Funding acquisition, X.L. and X.W.; Investigation, Z.Z., X.L. and D.S.; Methodology, Z.Z., N.X. and X.W.; Project administration, X.L. and X.W.; Resources, Z.Z.; Software, Z.Z., N.X. and X.J.; Supervision, Z.Z. and X.W.; Validation, Z.Z. and N.X.; Visualization, Z.Z. and N.X.; Writing—original draft, Z.Z.; Writing—review and editing, Z.Z. and D.S. All authors have read and agreed to the published version of the manuscript.

Funding

This research was supported by the National Natural Science Foundation of China (41972259), National Key R&D Program of China (No. 2018YFC0406400), Natural Science Foundation of Beijing Municipality (8181002), and China Geological Survey (12120114033901).

Conflicts of Interest

The authors declare no conflict of interest.

Appendix A

Table A1. Geothermal gradients of strata (°C·hm−1).
Borehole
Number
Borehole Depth
(m)
Hole Bottom Temperature
(°C)
QK-JO-ЄQnJxCh
ZK11001.728.51.21-----
ZK22208.648.52.71---1.06-
ZK31354.735.33.01-----
ZK4150135.11.95-----
ZK5150228.2----0.92-
ZK61966.844.81.73---0.952.67
ZK7331549.7----1.051.28
ZK9380064.4-1.230.91.071.45-
ZK103801.156.7-1.010.781.091.34-
ZK11377954.5-1.331.061.471.06-
ZK123650.457.5-0.90.521.491.42-
ZK133616.156-1.10.670.731.43-
ZK142538.446----1-
ZK152850582.45--1.441.27-
ZK163001.563.32.791.52-1.571.4-
ZK172839.861.63.19-1.131.230.98-
ZK231618.945.53.02---1.94-
ZK252480.2605-2.082.261.29-
ZK261603.856.86.812.531.62-1.38-
ZK29250073.85.2-2.262.91.89-
ZK30254074.45.18-2.0221.68-
ZK312495.1713.014.2-2.580.87-
Average
Value
3.381.731.301.651.281.98
Note: “-” means no measurement data.

References

  1. Rybach, L. Geothermal energy: Sustainability and the environment. Geothermics 2003, 32, 463–470. [Google Scholar] [CrossRef]
  2. Xu, Z.; Zhou, X.; Chen, R.; Shen, Y.; Shang, Z.; Hai, K. Numerical simulation of deep thermal groundwater exploitation in the Beijing plain area. Water 2019, 11, 1494. [Google Scholar] [CrossRef] [Green Version]
  3. Zhang, X. Development of geothermal resources in China: A review. Earth Sci. 2018, 29, 452–467. [Google Scholar] [CrossRef]
  4. Jiang, Y.; Lei, Y.; Liu, J. Economic impacts of the geothermal industry in Beijing, China: An input-output approach. Math. Geosci. 2019, 51, 353–372. [Google Scholar] [CrossRef]
  5. Lei, H.; Zhu, J. Numerical modeling of exploitation and reinjection of the Guantao geothermal reservoir in Tanggu District, Tianjin, China. Geothermics 2013, 48, 60–68. [Google Scholar] [CrossRef]
  6. Tian, B.; Kong, Y.; Gong, Y.; Ye, C.; Pang, Z.; Wang, J.; Zhang, D. An improved volumetric method of geothermal resources assessment for shallow ground combining geophysical data. Renew. Energy 2020, 145, 2306–2315. [Google Scholar] [CrossRef]
  7. Pocasangre, C.; Fujimitsu, Y. A Python-based stochastic library for assessing geothermal power potential using the volumetric method in a liquid-dominated reservoir. Geothermics 2018, 76, 164–176. [Google Scholar] [CrossRef]
  8. Li, Q.; Zhang, H.; Cao, D.; Dong, Q.; Cui, Y.; Chen, C. Usage, status, problems, trends and suggestions of 3D geological modeling. Geol. Explor. 2016, 52, 759–767. [Google Scholar]
  9. Guglielmetti, L.; Comina, C.; Abdelfettah, Y.; Schill, E.; Mandrone, G. Integration of 3D geological modeling and gravity surveys for geothermal prospection in an Alpine region. Tectonophysics 2013, 608, 1025–1036. [Google Scholar] [CrossRef]
  10. Fuchs, S.; Balling, N.; Mathiesen, A. Deep basin temperature and heat-flow field in Denmark-New insights from borehole analysis and 3D geothermal modelling. Geothermics 2020, 83, 101722. [Google Scholar] [CrossRef]
  11. Fulignati, P.; Marianelli, P.; Sbrana, A.; Ciani, V. 3D geothermal modelling of the Mount Amiata hydrothermal System in Italy. Energies 2014, 7, 7434–7453. [Google Scholar] [CrossRef] [Green Version]
  12. Xu, N.; Tian, H. Development of 3D seamless engineering geological modeling system. Rock Soil Mech. 2009, 30, 2385–2391. [Google Scholar]
  13. Standardization Administration of the People’s Republic of China. GB/T 11615-2010; Geologic Exploration Standard of Geothermal Resources; Standards Press of China: Beijing, China, 2010. [Google Scholar]
  14. Lei, X.; Hu, S.; Yang, Q.; Zheng, J.; Juan, L.; Chen, L.; Chao, Z.; Peng, G. Characteristics of hydrothermal system and its origin of Nankon-Sunhe fault in Beijing. Chin. J. Geophys. 2017, 60, 1838–1850. [Google Scholar]
  15. Lei, X.; Guan, W.; Guo, T.; Yang, Q.; Hu, S.; Guo, G. Some new ideas on tectonics of karst aquifer system of Gaoyakou-Nankou in Changping, Beijing. Chin. J. Geol. 2016, 51, 116–127. [Google Scholar]
  16. Cheng, S.; Wang, Y. Element geochemistry, petrogenesis and tectonic setting of the Yangfang pluton in Beijing. Geol. Rev. 2010, 56, 205–214. [Google Scholar]
  17. Sun, Z.; Wang, Y.; Deng, J.; Ji, G.; Xia, X.; Su, S. Temporal sequence of Mesozoic intrusive bodies in the Beijing area and its geological significance. Bull. Mineral. Petrol. Geochem. 2007, 26, 258–262. [Google Scholar]
  18. Guo, T.; Xue, H.; Fu, C.; Niu, S. The preliminary understanding on hydrogeological investigation of Gaoyakou-Nankou karst region in Changping of Beijing. Urban Geol. 2015, 10, 31–35. [Google Scholar]
  19. Li, H.; Guo, S.; Cui, L.; Yan, J.; Liu, J.; Wang, B. Review of renewable energy industry in Beijing: Development status, obstacles and proposals. Renew. Sustain. Energy Rev. 2015, 43, 711–725. [Google Scholar] [CrossRef]
  20. Duan, Z.; Pang, Z.; Wang, X. Sustainability evaluation of limestone geothermal reservoirs with extended production histories in Beijing and Tianjin, China. Geothermics 2011, 40, 125–135. [Google Scholar] [CrossRef]
  21. Sun, J.; Lei, X.; Li, C.; Zhang, Z.; Meng, M. Geothermal fluid quality evaluation in Changping New Town, Beijing. Urban Geol. 2018, 13, 34–40. [Google Scholar]
  22. Pang, Z.; Huang, S.; Hu, S.; Zhao, P.; He, L. Geothermal studies in China: Progress and prospects (1995–2014). Chin. J. Geol. 2014, 49, 719–727. [Google Scholar]
  23. Wang, G.; Zhang, W.; Lin, W.; Liu, F.; Zhu, X.; Liu, Y.; Li, J. Research on formation mode and development potential of geothermal resources in Beijing-Tianjin-Hebei region. Geol. China 2017, 44, 1074–1085. [Google Scholar]
  24. Guo, G.; Liu, W.; Xin, B. Current situations and discussions on karst groundwater resources exploration in Beijing. South-to-North Water Divers. Water Sci. Technol. 2011, 9, 33–36. [Google Scholar]
  25. Wang, D.; Zhang, S.; Liu, X.; Zhang, Y.; Wang, R. A study on the character of late Quaternary activity of the Nankou-Sunhe fault. China Acad. J. Electron. Publ. House Rights Reserved 2006, 19, 50–59. [Google Scholar]
  26. The Beijing Municipal Bureau of Geology and Mineral Resources. The Rock Formation of Beijing; China University of Geosciences Press: Wuhan, China, 1996; pp. 39–48. [Google Scholar]
  27. Wang, S.; Pang, Z.; He, T.; Lin, P.; Liu, K.; Liu, J. Study on the permeability of carbonate rock geothermal reservoir in Beijing. J. Eng. Geol. 2014, 22, 647–654. [Google Scholar]
  28. Mao, X.; Wang, X.; Li, K.; Guo, S. Sources of heat and control factors in geothermal field. Earth Sci. 2018, 43, 4256–4266. [Google Scholar]
  29. Shi, X.; Qiu, X.; Xia, K.; Zhou, D. Characteristics of surface heat flow in the south China sea. J. Asian Earth Sci. 2003, 22, 265–277. [Google Scholar] [CrossRef]
  30. Lei, X.; Hu, M.; Li, J.; Jiang, G.; Yang, Q.; Li, Q. Characteristics of heat flow and geothermal distribution in the northwest Beijing plain. Chin. J. Geophys. 2018, 61, 3735–3748. [Google Scholar]
  31. LV, J. Characteristics of the Geothermal Field in Northern Beijing and the Influence of its Exploitation on Seismic Ground Fluid Behavior. Ph.D. Thesis, Institute of Geology, China Earthquake Administration, Beijing, China, 2004. [Google Scholar]
  32. Xu, N. 3D engineering geological modeling method suitable for numerical simulation. Chin. J. Geotech. Eng. 2009, 31, 1711–1716. [Google Scholar]
  33. Muffler, P.; Cataldi, R. Methods for regional assessment of geothermal resources. Geothermics 1978, 7, 53–89. [Google Scholar] [CrossRef]
  34. Garg, S.K.; Combs, J. A reformulation of USGS volumetric “heat in place” resource estimation method. Geothermics 2015, 55, 150–158. [Google Scholar] [CrossRef]
Figure 1. Bedrock and tectonic map of the study area (modified after Lei [14], 2017). Red lines indicate faults; F1: Nankou piedmont fault; F2: Yingbishan fault; F3: Nankou fault; F4: Shahe fault; F5: Xiaotangshan fault; and F6: Zhenggezhuang fault.
Water 12 00638 g001
Figure 2. Layout plan of 3D geological modeling data.
Water 12 00638 g002
Figure 3. The frame of the ROCKModel software (after Xu [12], 2009).
Water 12 00638 g003
Figure 4. Screenshot of the upper interface of the intrusive body in the southwest of the study area.
Water 12 00638 g004
Figure 5. Three-dimensional geological model of the study area.
Water 12 00638 g005
Figure 6. Model map of isothermal surfaces and heat reservoir in. (a) Parts Ⅰ and Ⅱ and (b) Part Ⅲ and the other parts.
Water 12 00638 g006
Figure 7. The elevation map of the 25 °C, 40 °C, and 60 °C isothermal surfaces: (a) 25 °C isothermal surfaces; (b) 40 °C isothermal surfaces; and (c) 60 °C isothermal surfaces.
Water 12 00638 g007aWater 12 00638 g007b
Figure 8. Contour map of heat flow and burial depth of bedrock. The unit of heat flow values is mW m2.
Water 12 00638 g008
Figure 9. Map of the burial depth of the heat reservoir roof.
Water 12 00638 g009
Table 1. Volume proportions of different temperature intervals of heat reservoir in the different parts.
Temperature
Interval
Part ⅠPart ⅡPart ⅢThe Other
Parts
Whole
Total volume
(1010 m³)
8.659.2815.0815.7548.76
15–25 °C9.0%6.4%0.0%0.0%2.8%
25–40 °C26.2%34.4%7.0%13.0%17.6%
40–60 °C33.3%39.3%34.9%42.6%37.9%
≥ 60 °C31.4%19.9%58.2%44.4%41.7%
Table 2. Calculations of geothermal reserves in the different parts.
RegionVolume of Geothermal Fluid
(108 m3)
Volume of Exploitable Fluid
(106 m3)
Exploitable Reserves of Fluid
(1014 J)
Reserves of Geothermal Resources
(1018 J)
Recoverable Geothermal Reserves
(1018 J)
Whole24.186.0410.6554.238.14
Part Ⅰ4.731.181.315.540.83
Part Ⅱ4.781.191.697.751.16
Part Ⅲ6.791.704.1323.183.48
The others7.881.973.5217.762.66

