Improving Princeton Forcing Dataset over Iran Using the Delta-Ratio Method
by
 , , , and
Qinghuan Zhang
1 ,
,
Qiuhong Tang
1,2,*,
Xingcai Liu
1,
Seyed-Mohammad Hosseini-Moghari
1 and
Pedram Attarod
3 1
Key Laboratory of Water Cycle and Related Land Surface Processes, Institute of Geographic Sciences and Natural Resources Research, Chinese Academy of Sciences, Beijing 100101, China
2
University of Chinese Academy of Sciences, Beijing 100101, China
3
Forestry and Forest Economics Department, Faculty of Natural Resources, College of Agriculture and Natural Resources, University of Tehran, Karaj 77871-31587, Iran
*
Author to whom correspondence should be addressed.
Water 2020, 12(3), 630; https://doi.org/10.3390/w12030630
Submission received: 27 January 2020
/
Revised: 19 February 2020
/
Accepted: 22 February 2020
/
Published: 26 February 2020
(This article belongs to the Section Hydrology)
Abstract
:In this study, we corrected the bias in the Princeton forcing dataset, i.e., precipitation, maximum and minimum temperatures, and wind speed, by adjusting its long-term mean monthly climatology to match observations for the period 1988–2012 using the delta-ratio method. To this end, we collected meteorological data from 97 stations covering the domain of Iran. We divided Iran into three climatic zones based on the De Martonne classification, i.e., Arid, Humid, and Per-Humid zones, and then applied the delta-ratio method for each climatic zone separately to adjust the bias. After adjustment, the new datasets were compared to the observations in 1958–1987. Results based on four skill scores, including the Nash Sutcliffe efficiency (NSE), percent bias (PBIAS), root-mean-square error (RMSE), and R2, indicate that the adjustment greatly improved the quality of the gridded dataset, specifically, precipitation, maximum temperature, and wind speed. For example, NSE for annual precipitation during the validation time period increased from −0.03 to 0.72, PBIAS reduced from 29.2% to 6.6%, RMSE decreased by 182.44 mm, and R2 increased from 0.06 to 0.75. Assessing the results in different climatic zones of Iran reveals that precipitation improved more significantly in the Per-Humid zone followed by the Humid zone, while maximum temperature improved better in the Arid areas. For wind speed, the values improved comparably in the three climate zones. However, the delta values for monthly minimum temperature calculated during the adjustment time period cannot be applied in the validation time period, due to the fact that the Princeton climate data cannot follow the behavior of minimum temperature during the validation phase. In short, we showed that a simple bias adjustment approach, along with minimum observed station data, can significantly improve the performance of global gridded datasets.
1. Introduction
Climate data takes an increasingly important role in assessing the impacts of climate change on local hydrologic components and hydrologic modeling [1]. Several high-resolution climate datasets have been developed to address the increasing need for climatic data at the regional and global scale [2]. The Climatic Research Unit (CRU; [3]), Asian Precipitation Highly Resolved Observational Data Integration towards Evaluation (APHRODITE; [4]), and Modern-Era Retrospective Analysis for Research and Application (MERRA; [5]) are examples of these gridded climate datasets. However, despite all advancements in developing climate datasets, they may not be appropriate for operational applications [6].
Generally, differences between gridded and observed point datasets can be substantial on a daily basis but small enough over the long-term [7]. Gridded climate data products depend highly on the observation stations that are being used [8]. Moreover, observation stations that are used for generating or adjusting the gridded datasets also carry errors, such as the types of instruments, observer training, station maintenance, and climate types [9]. Hence, assessing their performance and possible adjustment are needed before using this type of data. To this end, many kinds of research have been carried out to reveal the error characteristics of the global climate dataset over different regions, e.g., for the globe [10], North America [11], Europe [12,13], Asia [14,15], and Middle East [16]. Nevertheless, gridded datasets are valuable information because they provide uniform spatial coverage for studies in climatology, ecology, and hydrology [7,13]. Most of the gridded datasets only provide precipitation data, while other variables like temperature and wind speed are also needed for hydroclimatic studies. Therefore, the Princeton Global Forcing (PGF; [17]) dataset provides more climatic variables including precipitation, maximum and minimum temperatures, and wind speed for attempts to respond to this need. This dataset was used for many applications, e.g., drought monitoring [18], spatial analysis of climate extremes [19], streamflow simulation [20], estimation of the terrestrial water budget [21], and development of a regional dataset [22].
Given the variety of variables in the PGF dataset, it would be a promising alternative for gauge observations in poorly gauged areas such as Iran. However, the performance of global datasets should be evaluated before operational application in a given area [6]. To date, however, assessment of the PGF climate data including the four variables precipitation, maximum and minimum temperatures, and wind speed, in Iran has been lacking. Due to the non-uniform spatiotemporal distribution of climate variables over Iran, the assessment of PGF over Iran reveals the error characteristics of this dataset in different climatic conditions. On the other hand, gauge adjustment increases the validity of global datasets for a specific region [23]. Therefore, this study seeks to assess and adjust the PGF dataset over Iran. In other words, this study investigated the following two objectives: (1) To compare the PGF dataset with observations and then to adjust the gridded dataset; and (2) to assess the validity of the adjustment for precipitation, maximum and minimum temperatures, and wind speed. To achieve these objectives, we used observed data from 97 climate stations over Iran for evaluating the PGF dataset and adjusted the PGF dataset by using the delta-ratio method [24]. In the following, the study area and used data are presented. Section 4 and Section 5 represent the results and discussions of the study, respectively. Finally, conclusions are drawn in Section 6.
2. Study Area
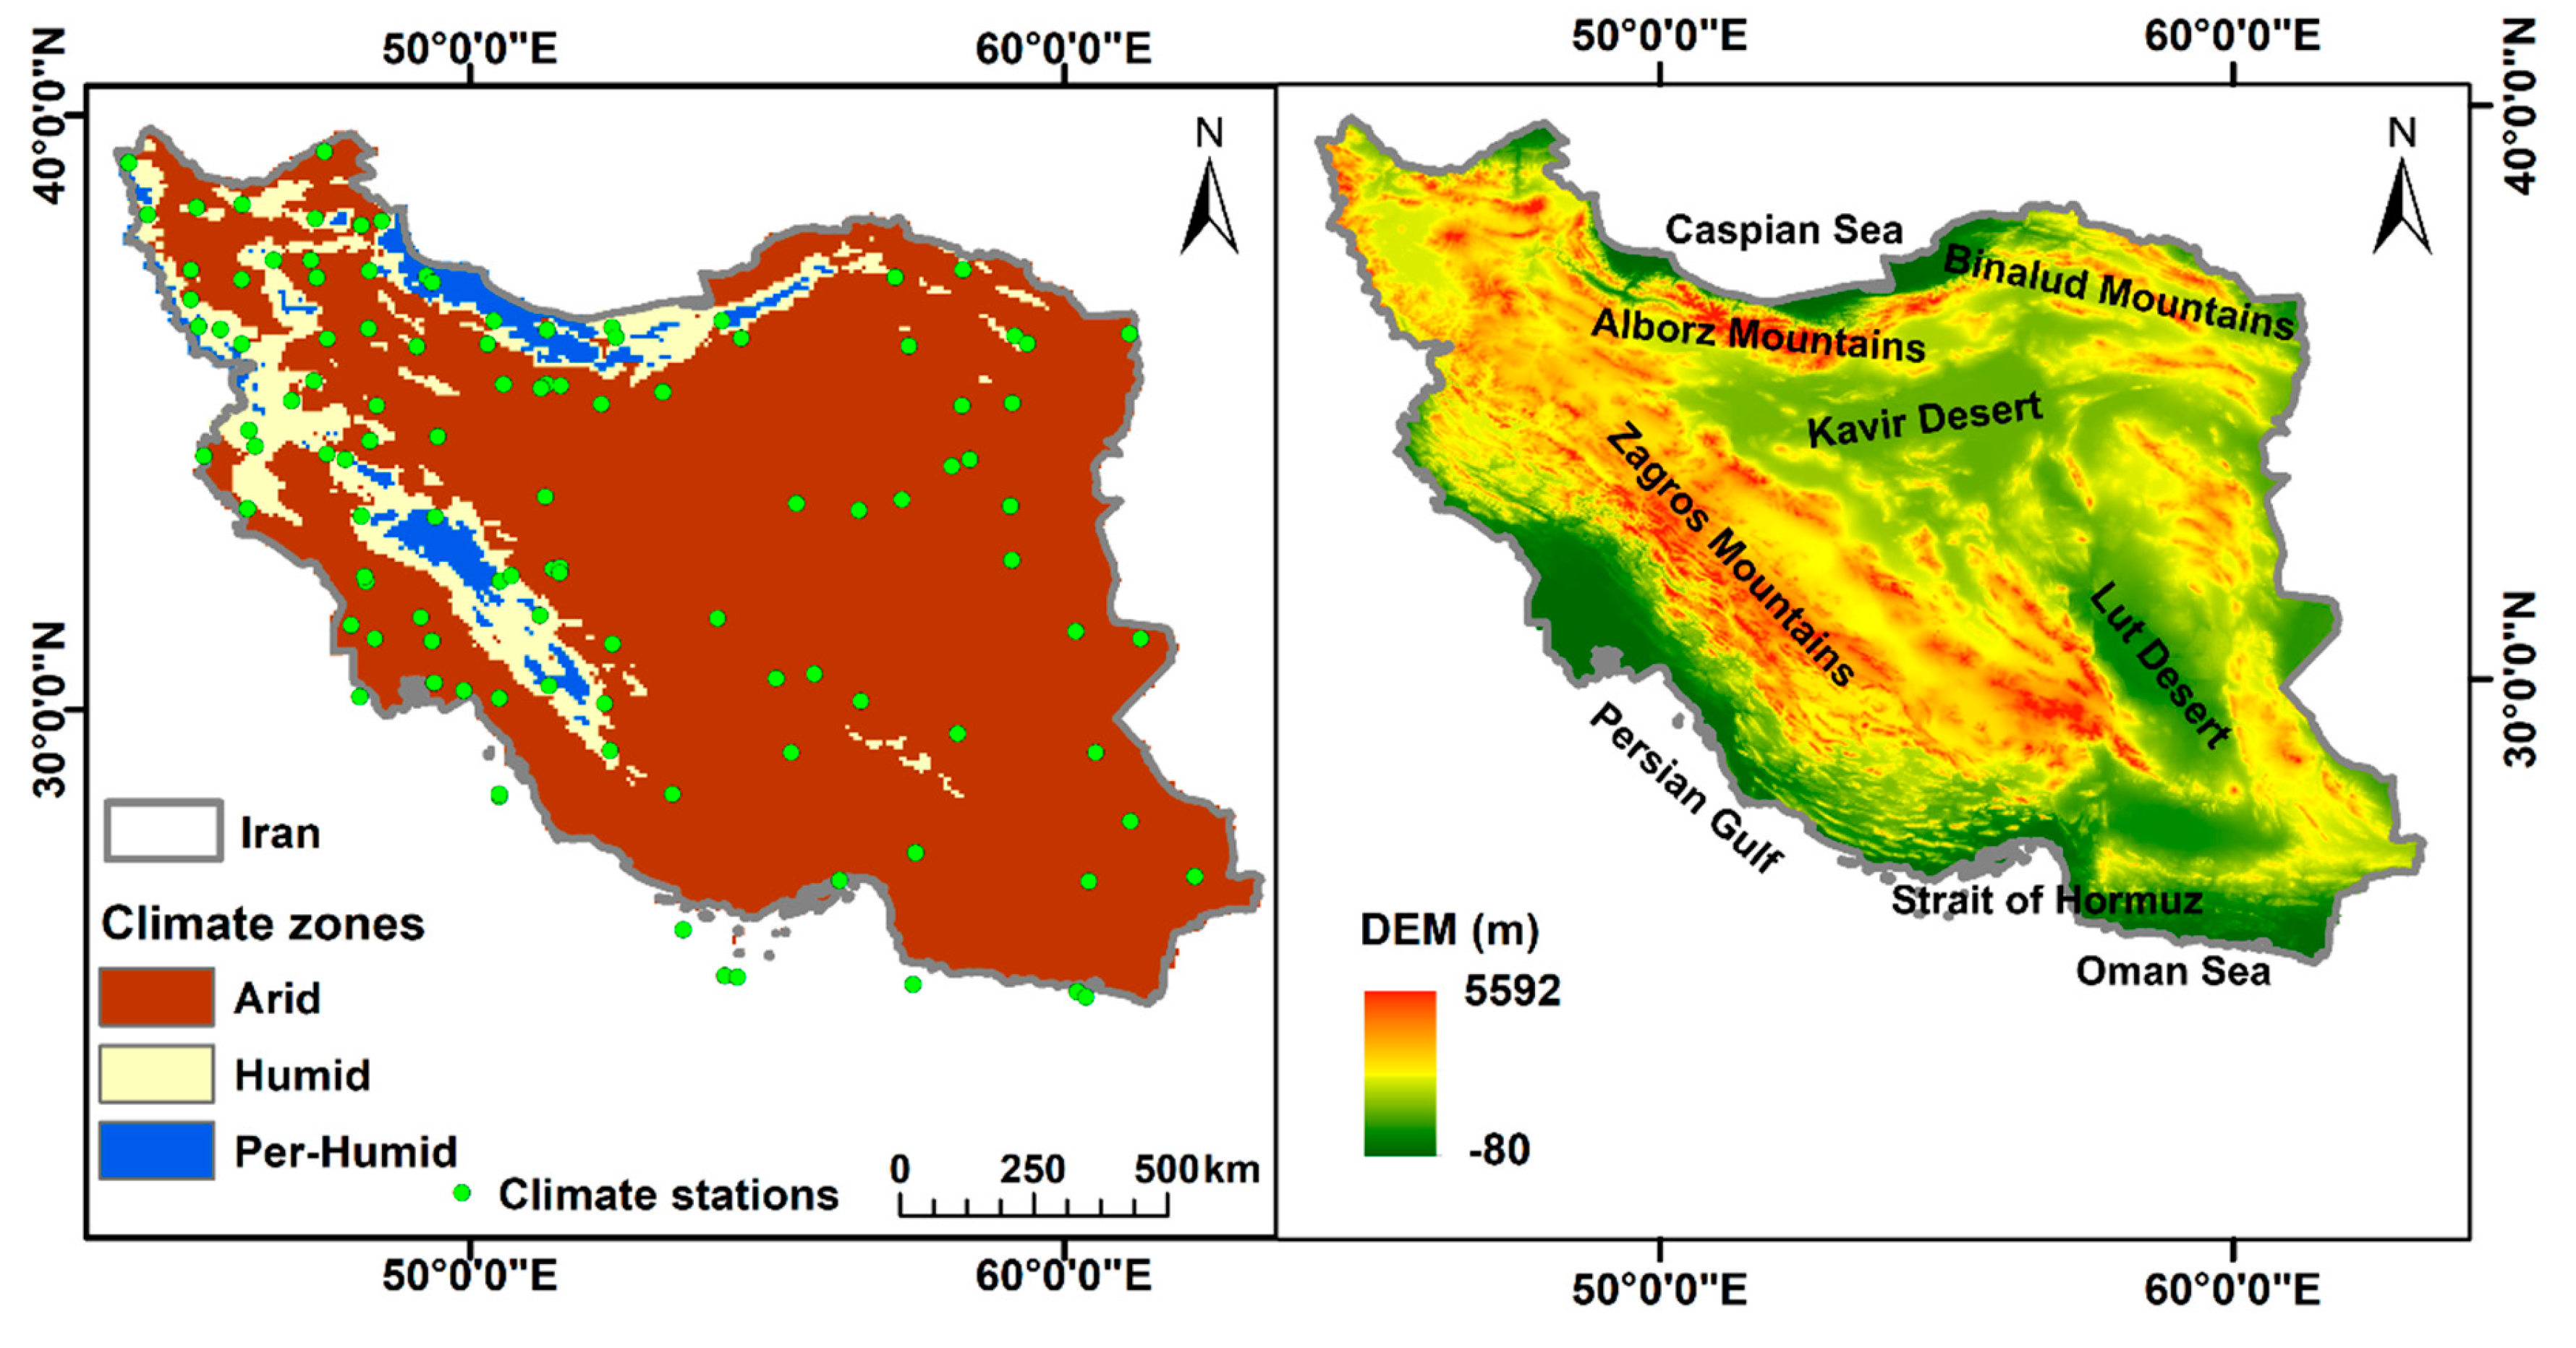
Iran has diverse topographic types, with its landscape dominated by rugged mountain ranges. The west of the country has the Zagros mountain range. The north is covered by dense broad-leaved deciduous forests, while the east and north-central parts of the country consist mostly of desert basins. Large plains are located along the coast of the Caspian Sea and at the northern end of the Persian Gulf. The other smaller plains are located along the Strait of Hormuz and the Oman Sea [25]. The climate conditions in Iran are variable, with an average annual precipitation of 241 mm [26]. However, in the higher mountainous areas of Zagros and Alborz, as well as the Caspian coastal plain, average annual precipitation can exceed 500 mm [27]. The mean annual temperature is about 15 °C [28]. The elevation ranges from less than −80 m at the Caspian Sea to 5592 m in the Alborz Mountain chain (Figure 1). The Alborz and Zagros Mountains dissect the country into diverse climatic zones, block moisture reaching the central part of the country, and cause the formation of the hottest desert in the world—the Lut Desert [29]. We adapted the De Martonne classification for Iran [30] and reclassified the climate zones into three groups, i.e., Arid, Humid, and Per-Humid. The Arid zone has a dryness index of less than 20, the Humid zone has a dryness index of between 20 and 35, while the Per-Humid zone has a dryness index of higher than 35.
3. Data and Methods
3.1. Observed Dataset
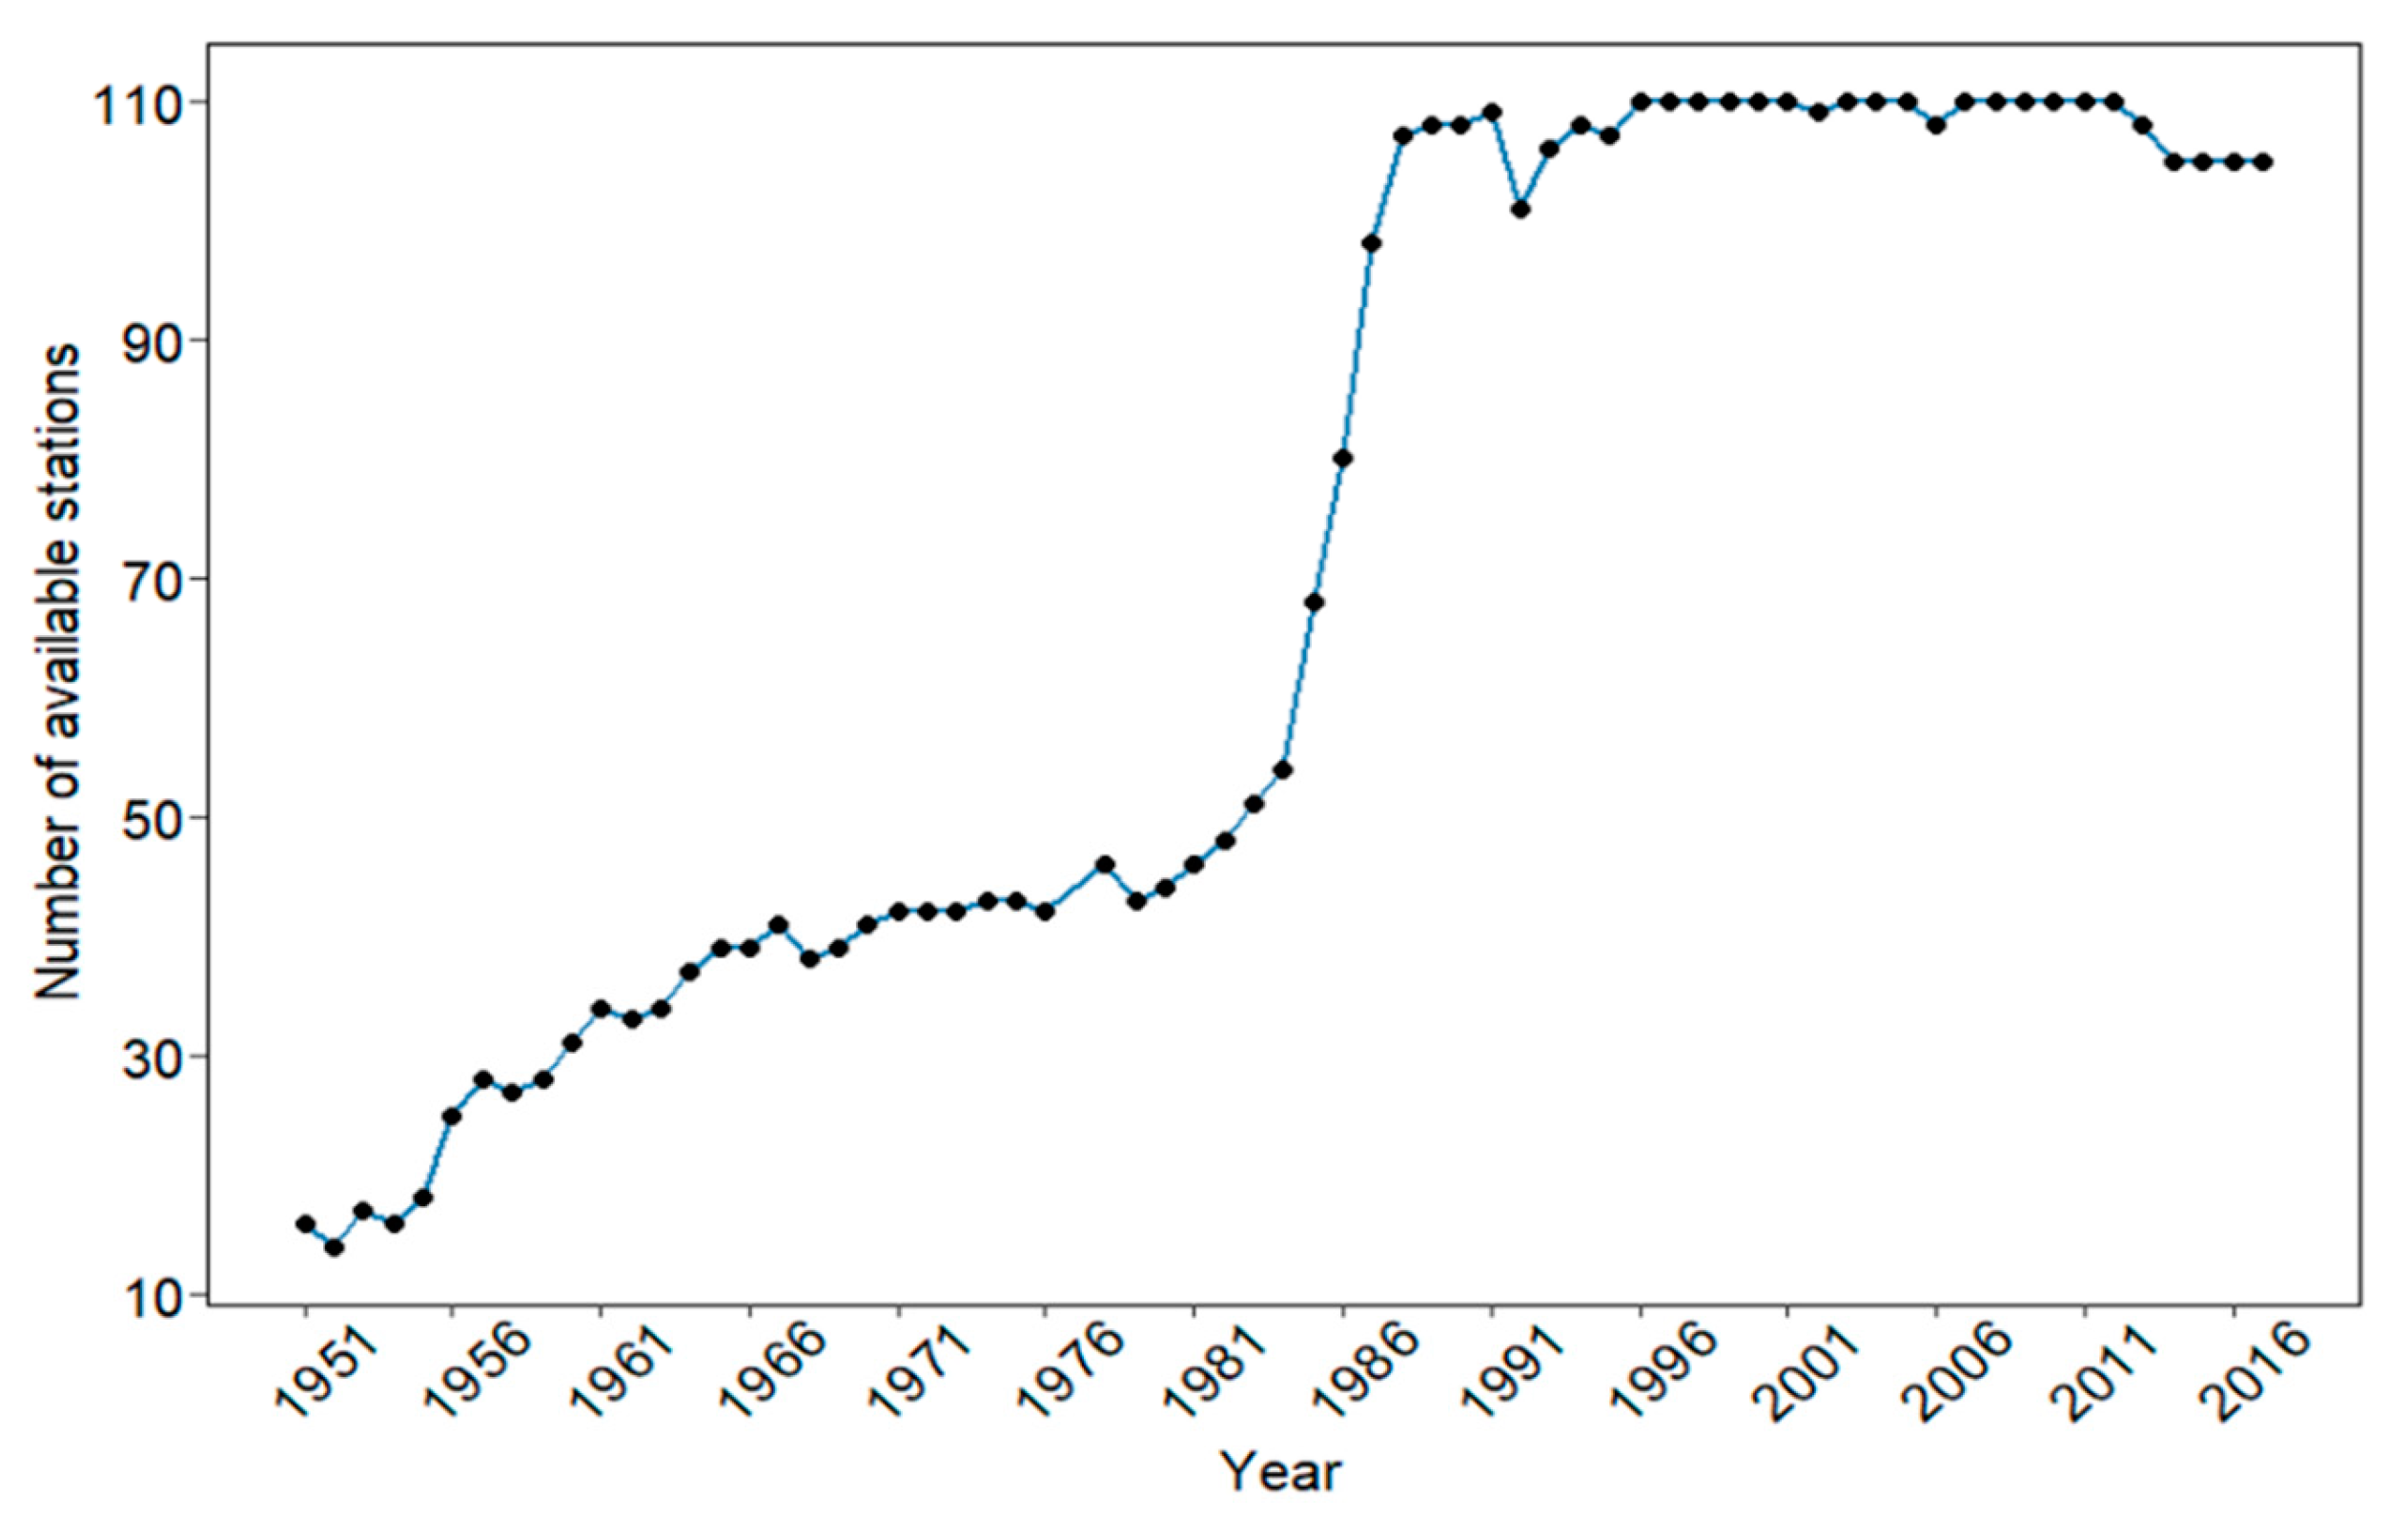
There are 110 climate stations in total with observed data, and most of the stations have continuous monthly data since 1988 (Figure 2). In order to use as many stations as possible, all of which have continuous monthly data, we chose 97 stations. Among them, 94 stations are used for adjustment and 37 are used for validation. Data adjustment is performed for the years from 1988 to 2012 for PGF, and validation is performed for the years from 1958 to 1987. Information of the climate stations is shown in Table S1.
3.2. Princeton Global Forcing (PGF) Dataset
The Princeton Global Forcing (PGF) dataset used here is 0.25°, daily dataset of precipitation, maximum and minimum temperatures, and wind speed covering Iran for the period from 1948 to 2016. The PGF dataset is available from the land surface modeling group at Princeton University (http://hydrology.princeton.edu/data.pgf.php). The dataset is constructed by merging the National Centers for Environmental Prediction-National Center for Atmospheric Research (NCEP-NCAR) reanalysis and a group of global observation-based datasets [31].
The digital elevation model (DEM) data were obtained from the Consortium for Spatial Information database at 90 m spatial resolution (http://srtm.csi.cgiar.org/srtmdata). The fine-resolution DEM was then resampled to 0.25° using ArcGIS software and was used as input to interpolate the station observations to a gridded dataset.
3.3. Bias-Correction of Gridded Datasets
The station data, including monthly precipitation and wind speed, were interpolated to 0.25° gridded surfaces using the thin-plate smoothing splines (ANUSPLIN) software [32,33]. The precipitation and wind speed ratios were calculated. As the reason the monthly maximum and minimum temperatures from the observations were located on specific days rather than monthly averages, we applied the monthly delta values in monthly maximum and minimum temperatures from station points instead of a gridded surface to PGF daily maximum and minimum temperatures.
The adjustment of Princeton precipitation and wind speed follows these steps (ratio method): (1) The average monthly precipitation and wind speed from interpolated observations (OBS) were calculated using data from 1988 to 2012, resulting in 12 OBS values for each climate variable at each 0.25° grid cell; (2) the average monthly precipitation and wind speed from Princeton were calculated using data from 1988 to 2012, resulting in 12 values for each climate variable at each grid cell; (3) we calculated the ratios for 12 monthly precipitation and wind speed values from OBS to Princeton (Ratio = OBS/Princeton); (4) the precipitation and wind speed ratios at the grid cells covering Iran were multiplied by the original Princeton daily precipitation and wind speed from 1948 to 2016, respectively. The precipitation ratios were defined as 1 for grid cells with an average monthly precipitation of 0 mm.
The adjustment of Princeton maximum and minimum temperatures follows the different steps (delta method): (1) The average monthly maximum and minimum temperatures from observed stations (OBS) were calculated using data from 1988 to 2012, resulting in 12 OBS values for the two climate variables at each station point; (2) the average monthly maximum and minimum temperatures from Princeton at the grid cells with station points were calculated using data from 1988 to 2012, resulting in 12 Princeton values for each climate variable at each station point; (3) the delta values for 12 monthly maximum and minimum temperatures from OBS to Princeton (Delta = OBS − Princeton) were calculated; (4) the maximum and minimum temperature delta values at the station points were interpolated to the 0.25° gridded surface using the thin-plate smoothing spline method; (5) the gridded delta values of maximum and minimum temperatures were added to the original Princeton daily maximum and minimum temperatures, respectively.
Climate data in the period 1958–1987 before and after adjustment at the 37 station points were compared using four skill scores (Table 1). The Nash–Sutcliffe efficiency (NSE) is commonly used in hydrologic simulations for comparing simulated and observed values. It was applied for evaluating the performance of climate data adjustment. Percent bias (PBIAS) measures the average of the two datasets. Root-mean-square error (RMSE) emphasizes high errors and is sensitive to large outliers [8]. The correlation coefficient (R2) depicts the correlation between two datasets.
4. Results
4.1. Evaluation of Average Monthly Climate Data
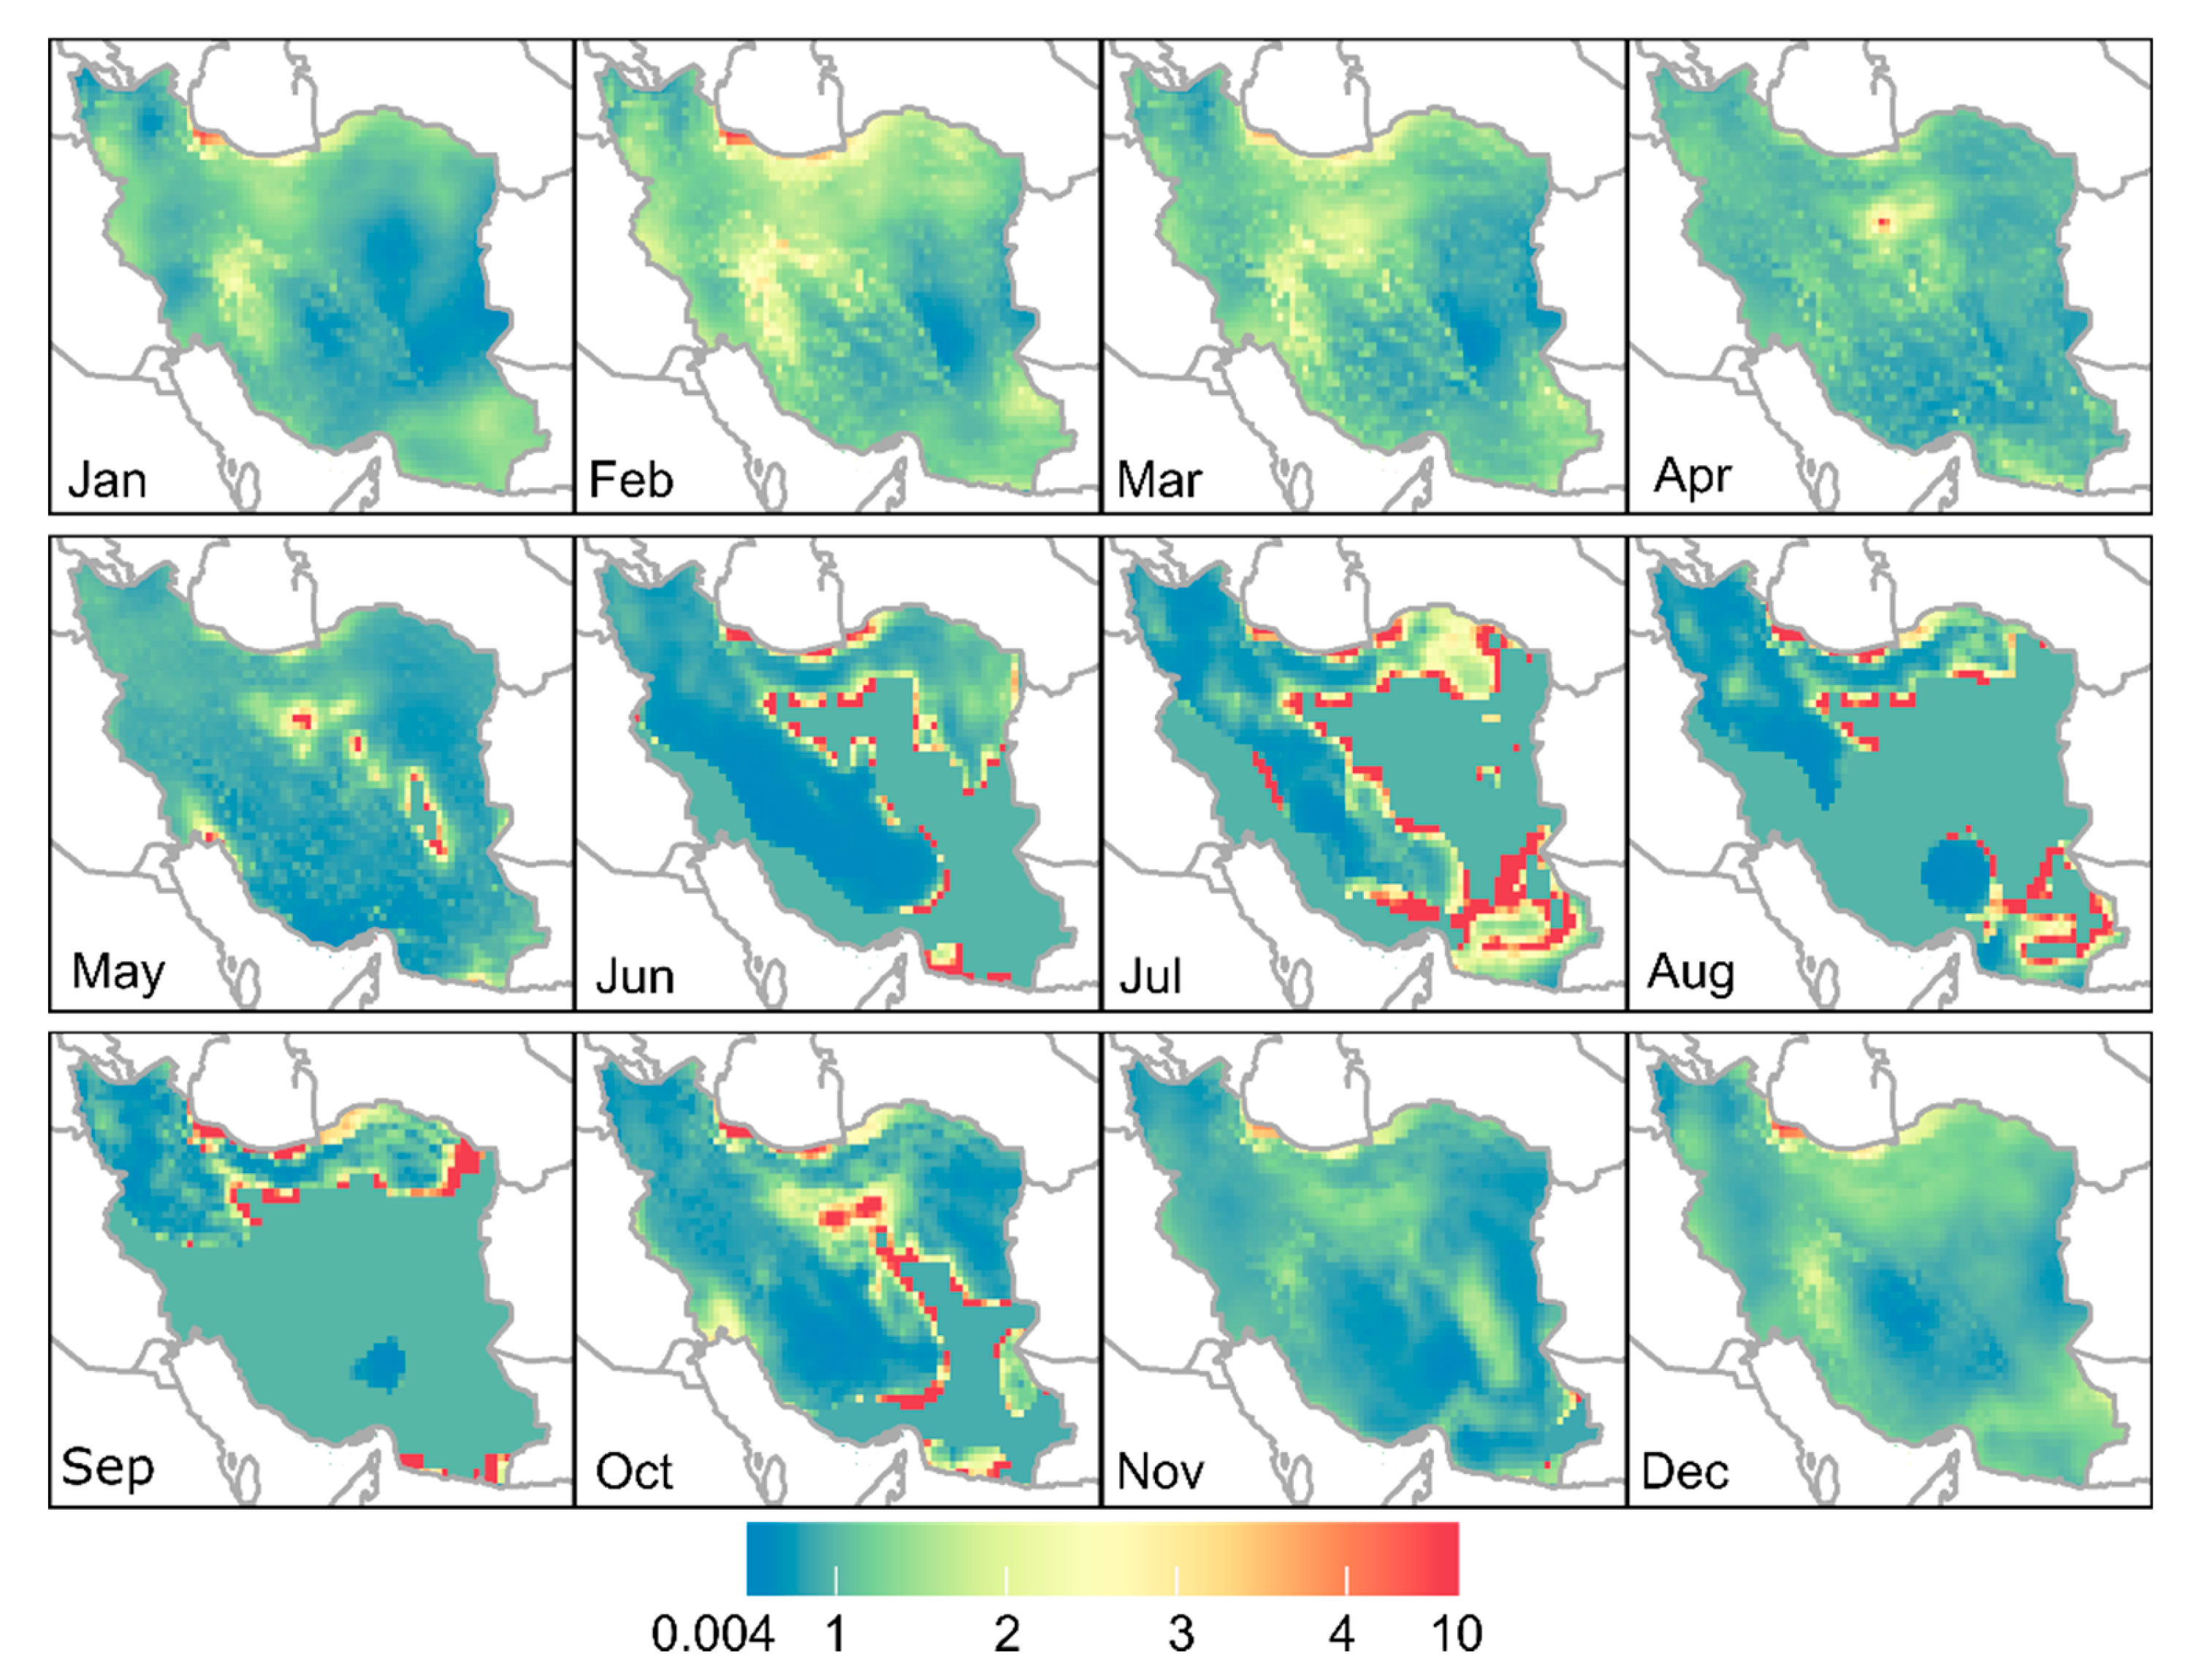
The average monthly precipitation ratios of OBS to Princeton from 1988 to 2012 are presented in Figure 3. Ratios around 10 in monthly precipitation can be seen from May to October, when Iran receives just a non-significant portion of its precipitation. Therefore, the large ratio values in these months do not indicate a large difference between the volume of precipitation in the observed dataset and the PGF precipitation data. As such, the ratio maps in rainy months i.e., from November to April, are smooth. However, in rainy months, the ratio value in the southwest of the Caspian Sea seems large. This region receives a lot of precipitation (about 1800 mm/yr) that is unique in Iran. Hence, if the global datasets do not use any observation data in this region, the precipitation is underestimated in this area. It should be noted that the mean monthly maximum and minimum temperatures of OBS and Princeton datasets at the observed station points are shown in the supplement (Figures S1–S4). The ratio values for the wind speed are also presented in the supplement (Figure S5).
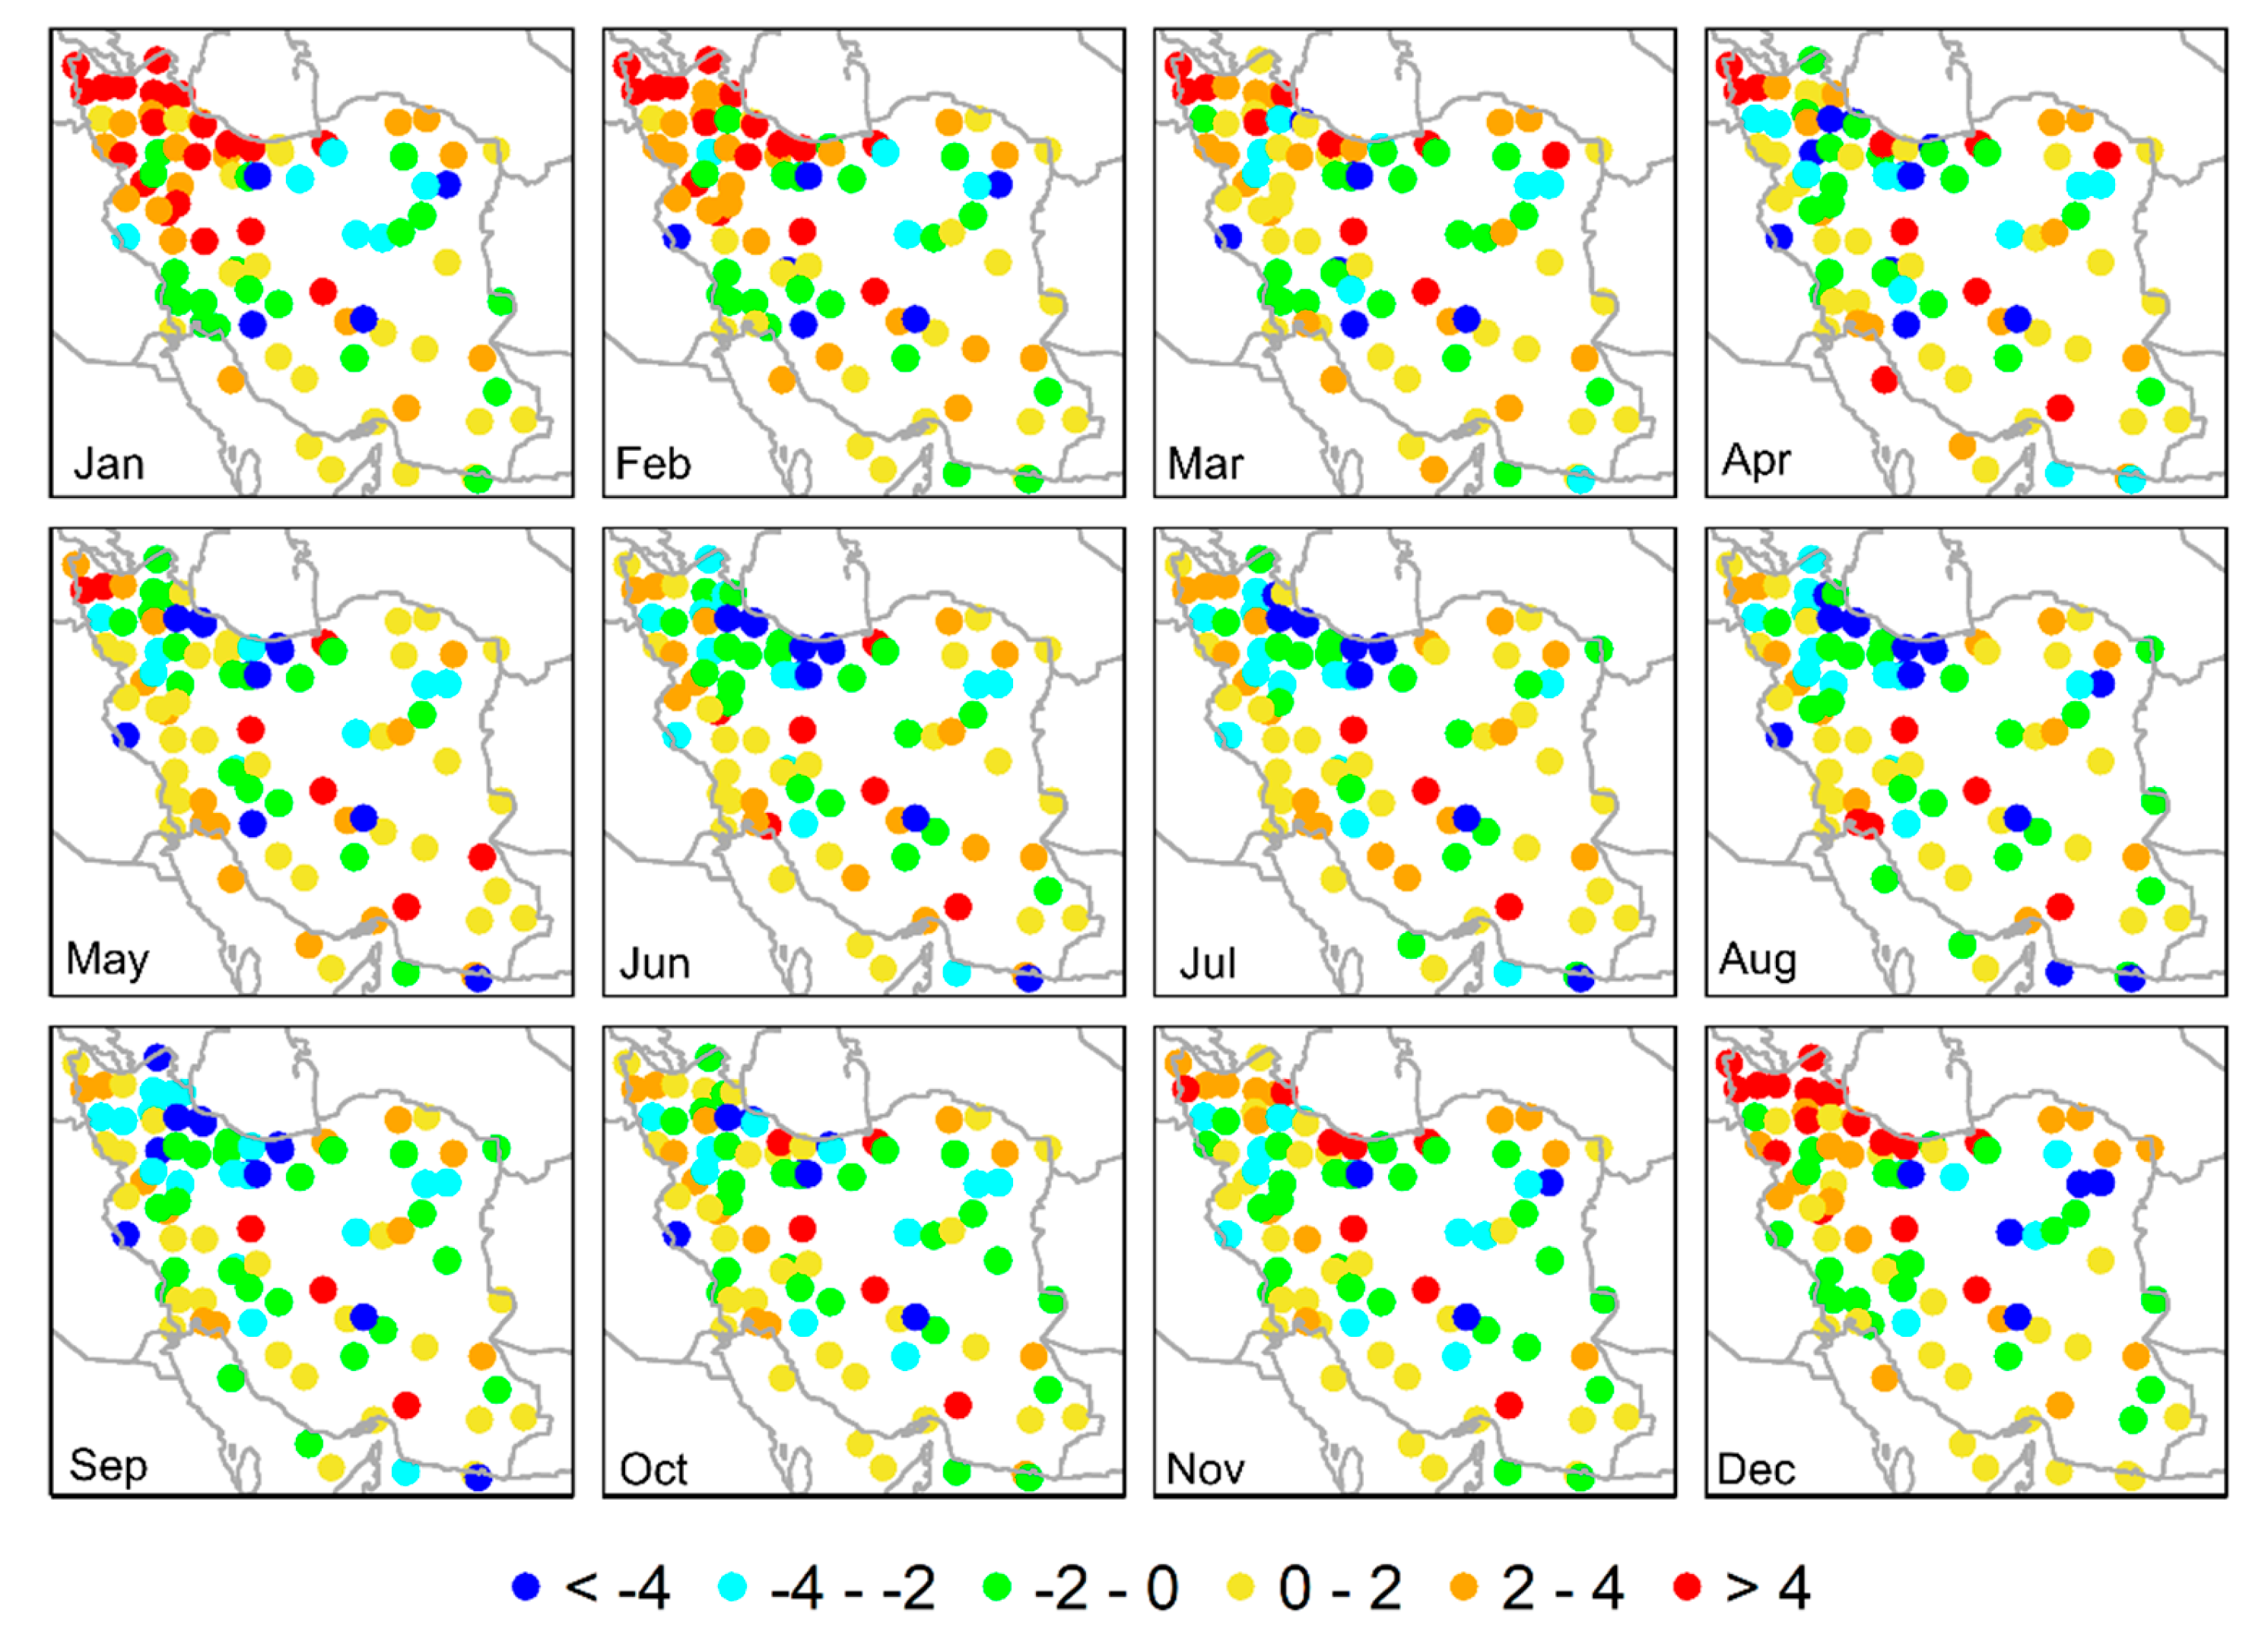
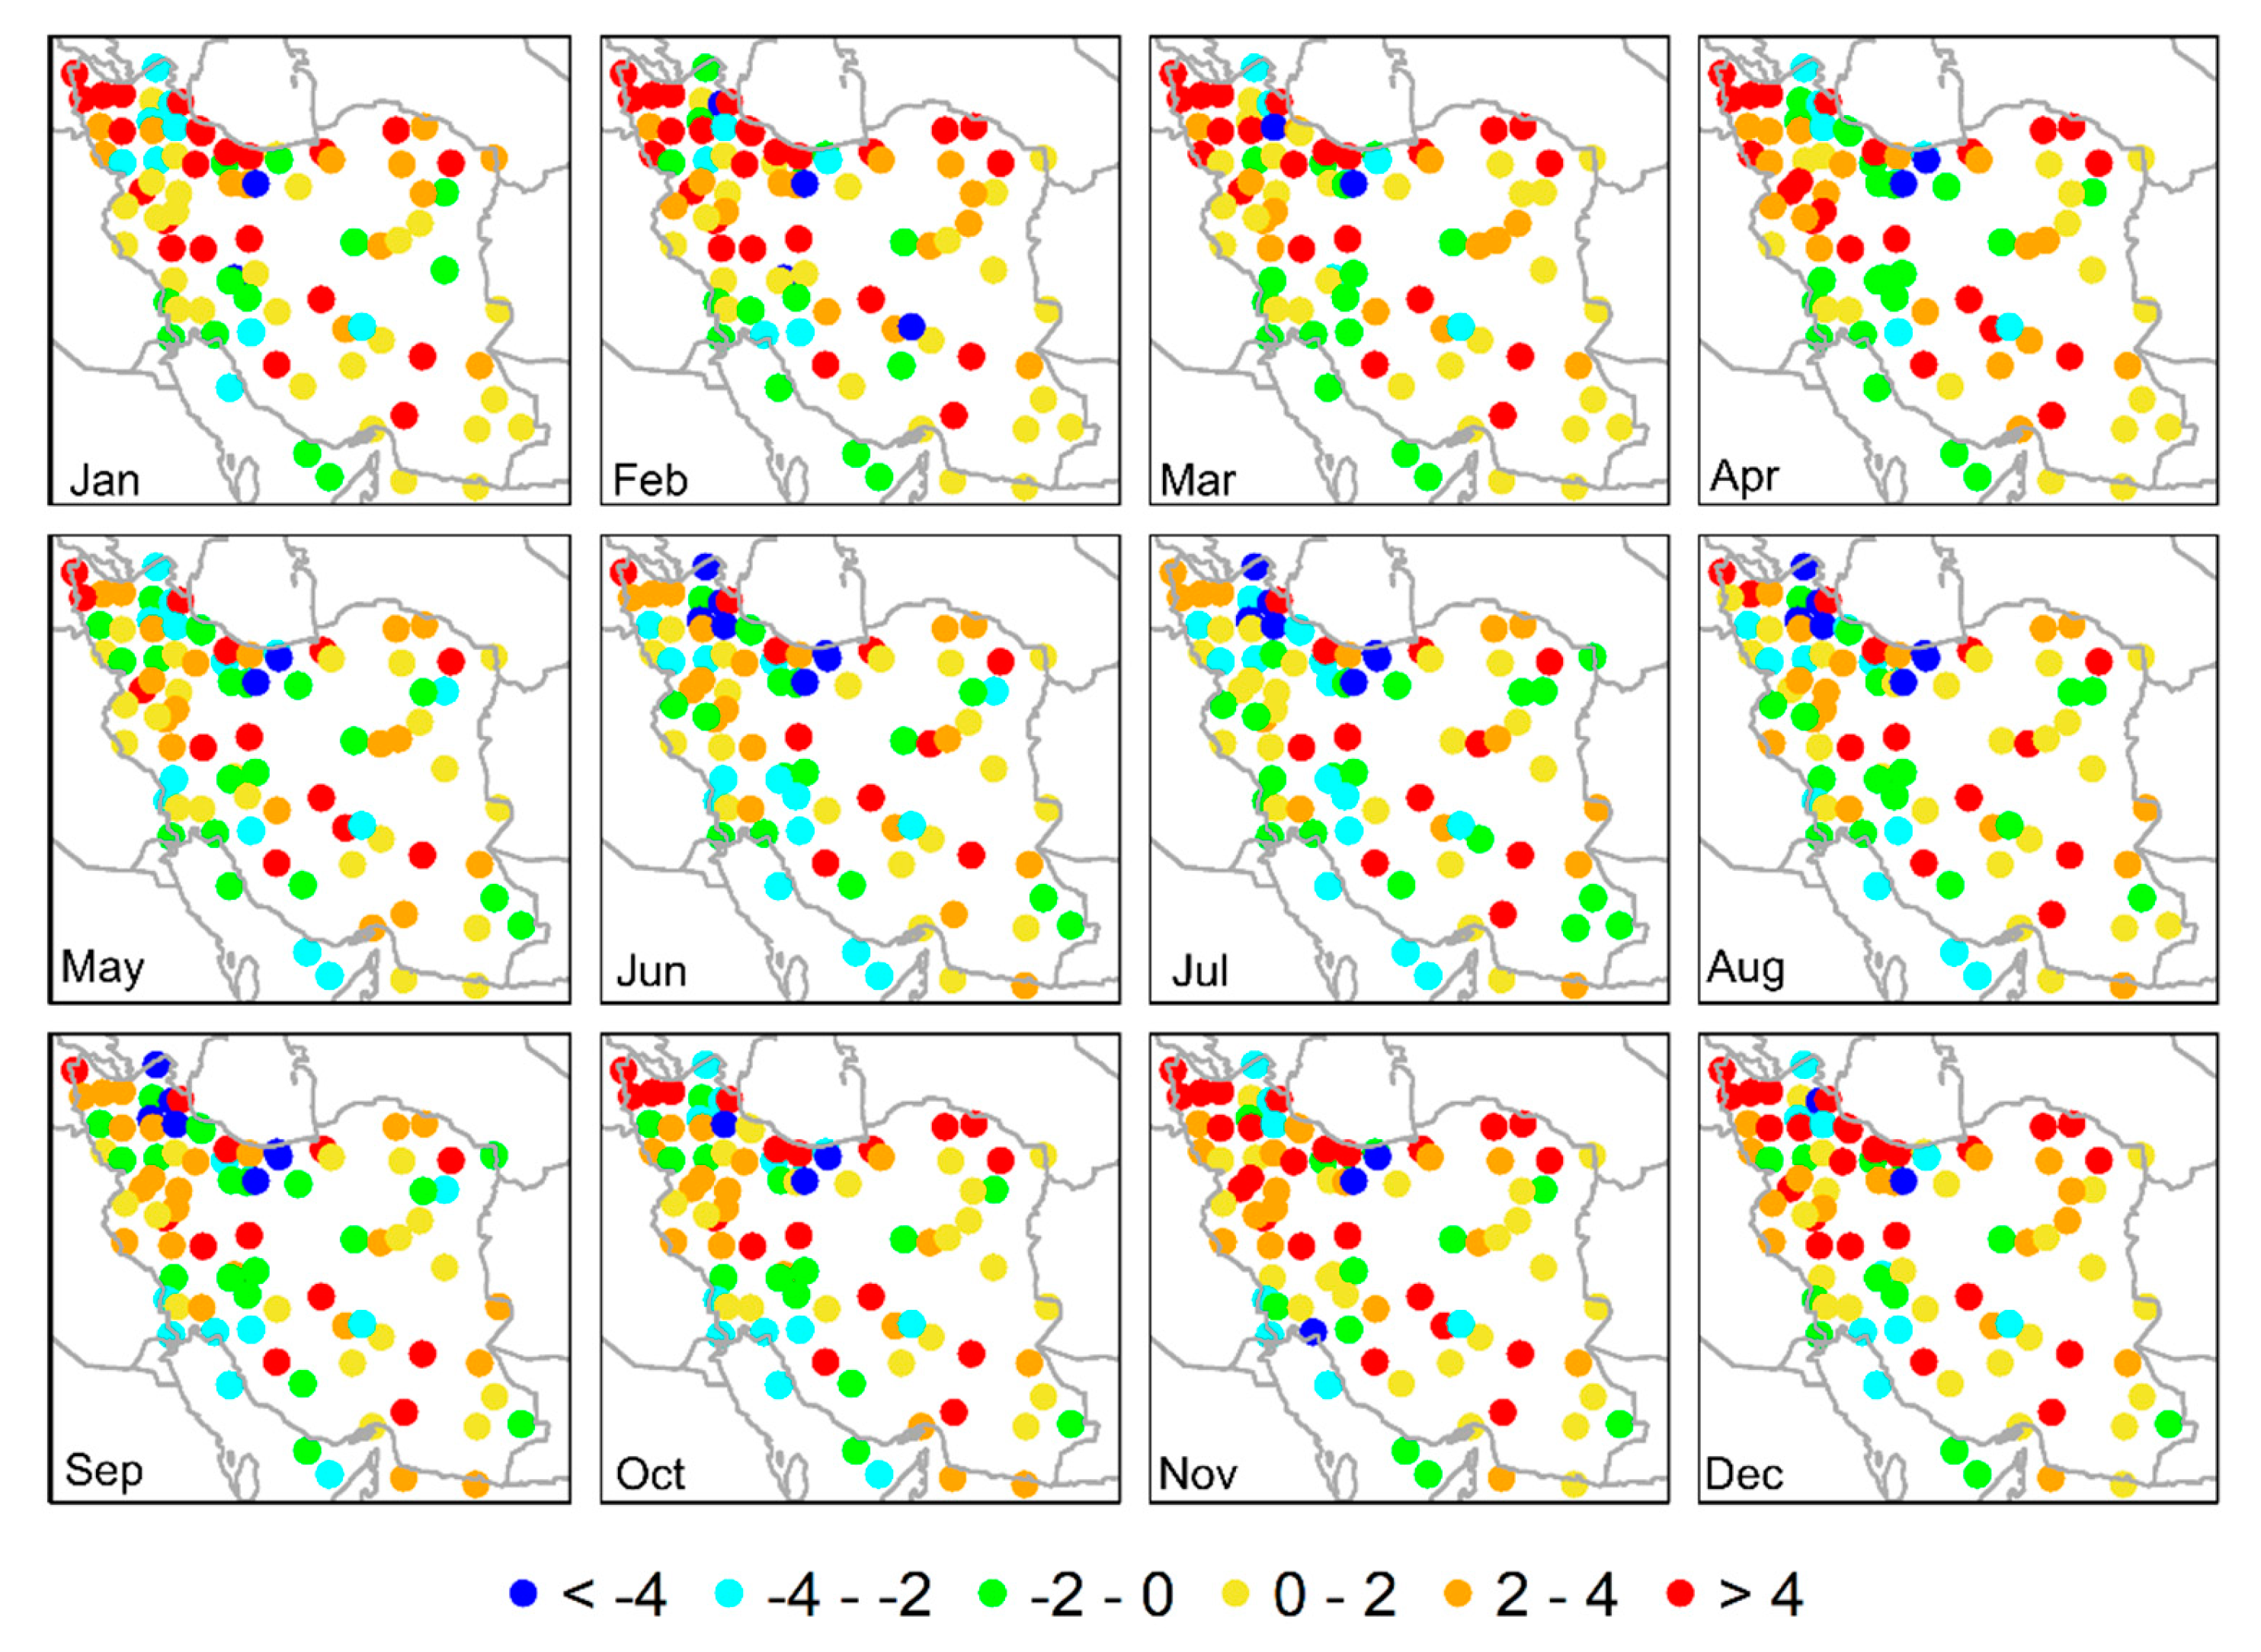
The delta values of monthly maximum and minimum temperatures from Princeton to OBS at station points from 1988 to 2012 are presented in Figure 4 and Figure 5, respectively. For monthly maximum temperature, the delta values ranged from −14 °C to 13 °C, with an average of 0.2 °C. The coastal areas near the Caspian Sea and northwestern part have higher absolute delta values than the other areas, in general. The delta values for monthly minimum temperatures ranged from −10 °C to 15 °C, with an average value of 1.4 °C. From October to April, most station points in the northwestern part of Iran showed delta values of higher than 4 °C, meaning that the PGF datasets have underestimated minimum temperatures in these months. We then applied the monthly delta values to the daily maximum and minimum temperatures of the PGF dataset.
4.2. Time Series of Adjusted Climate Variables in Different Climatic Zones
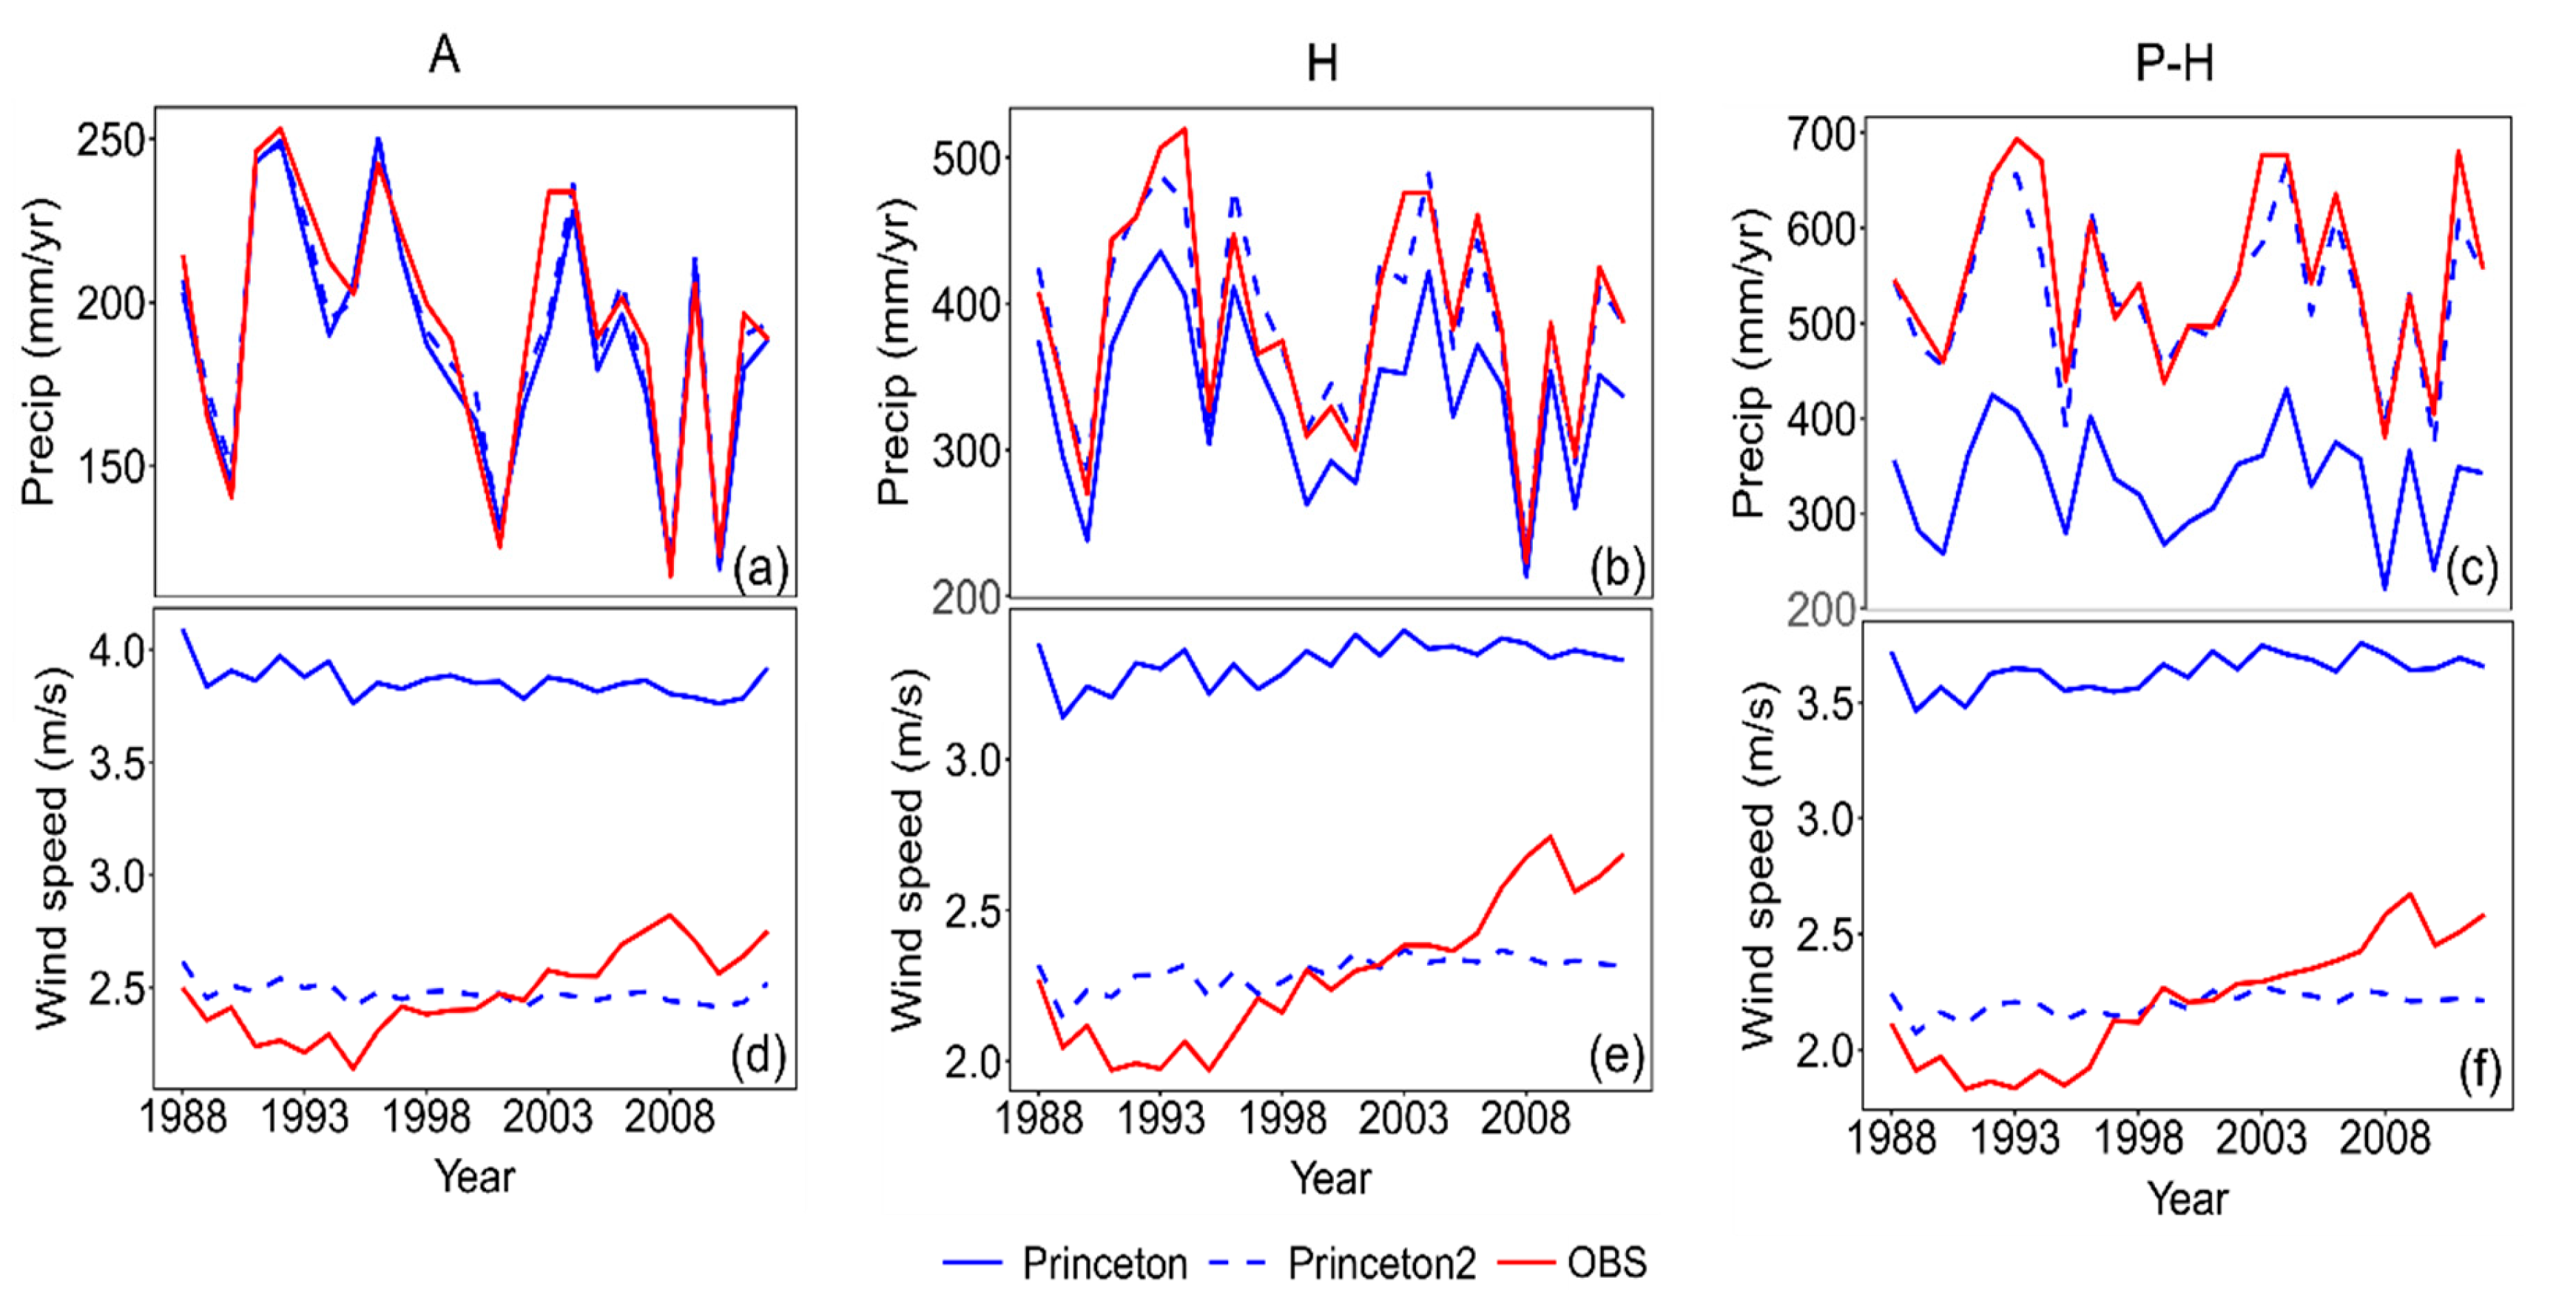
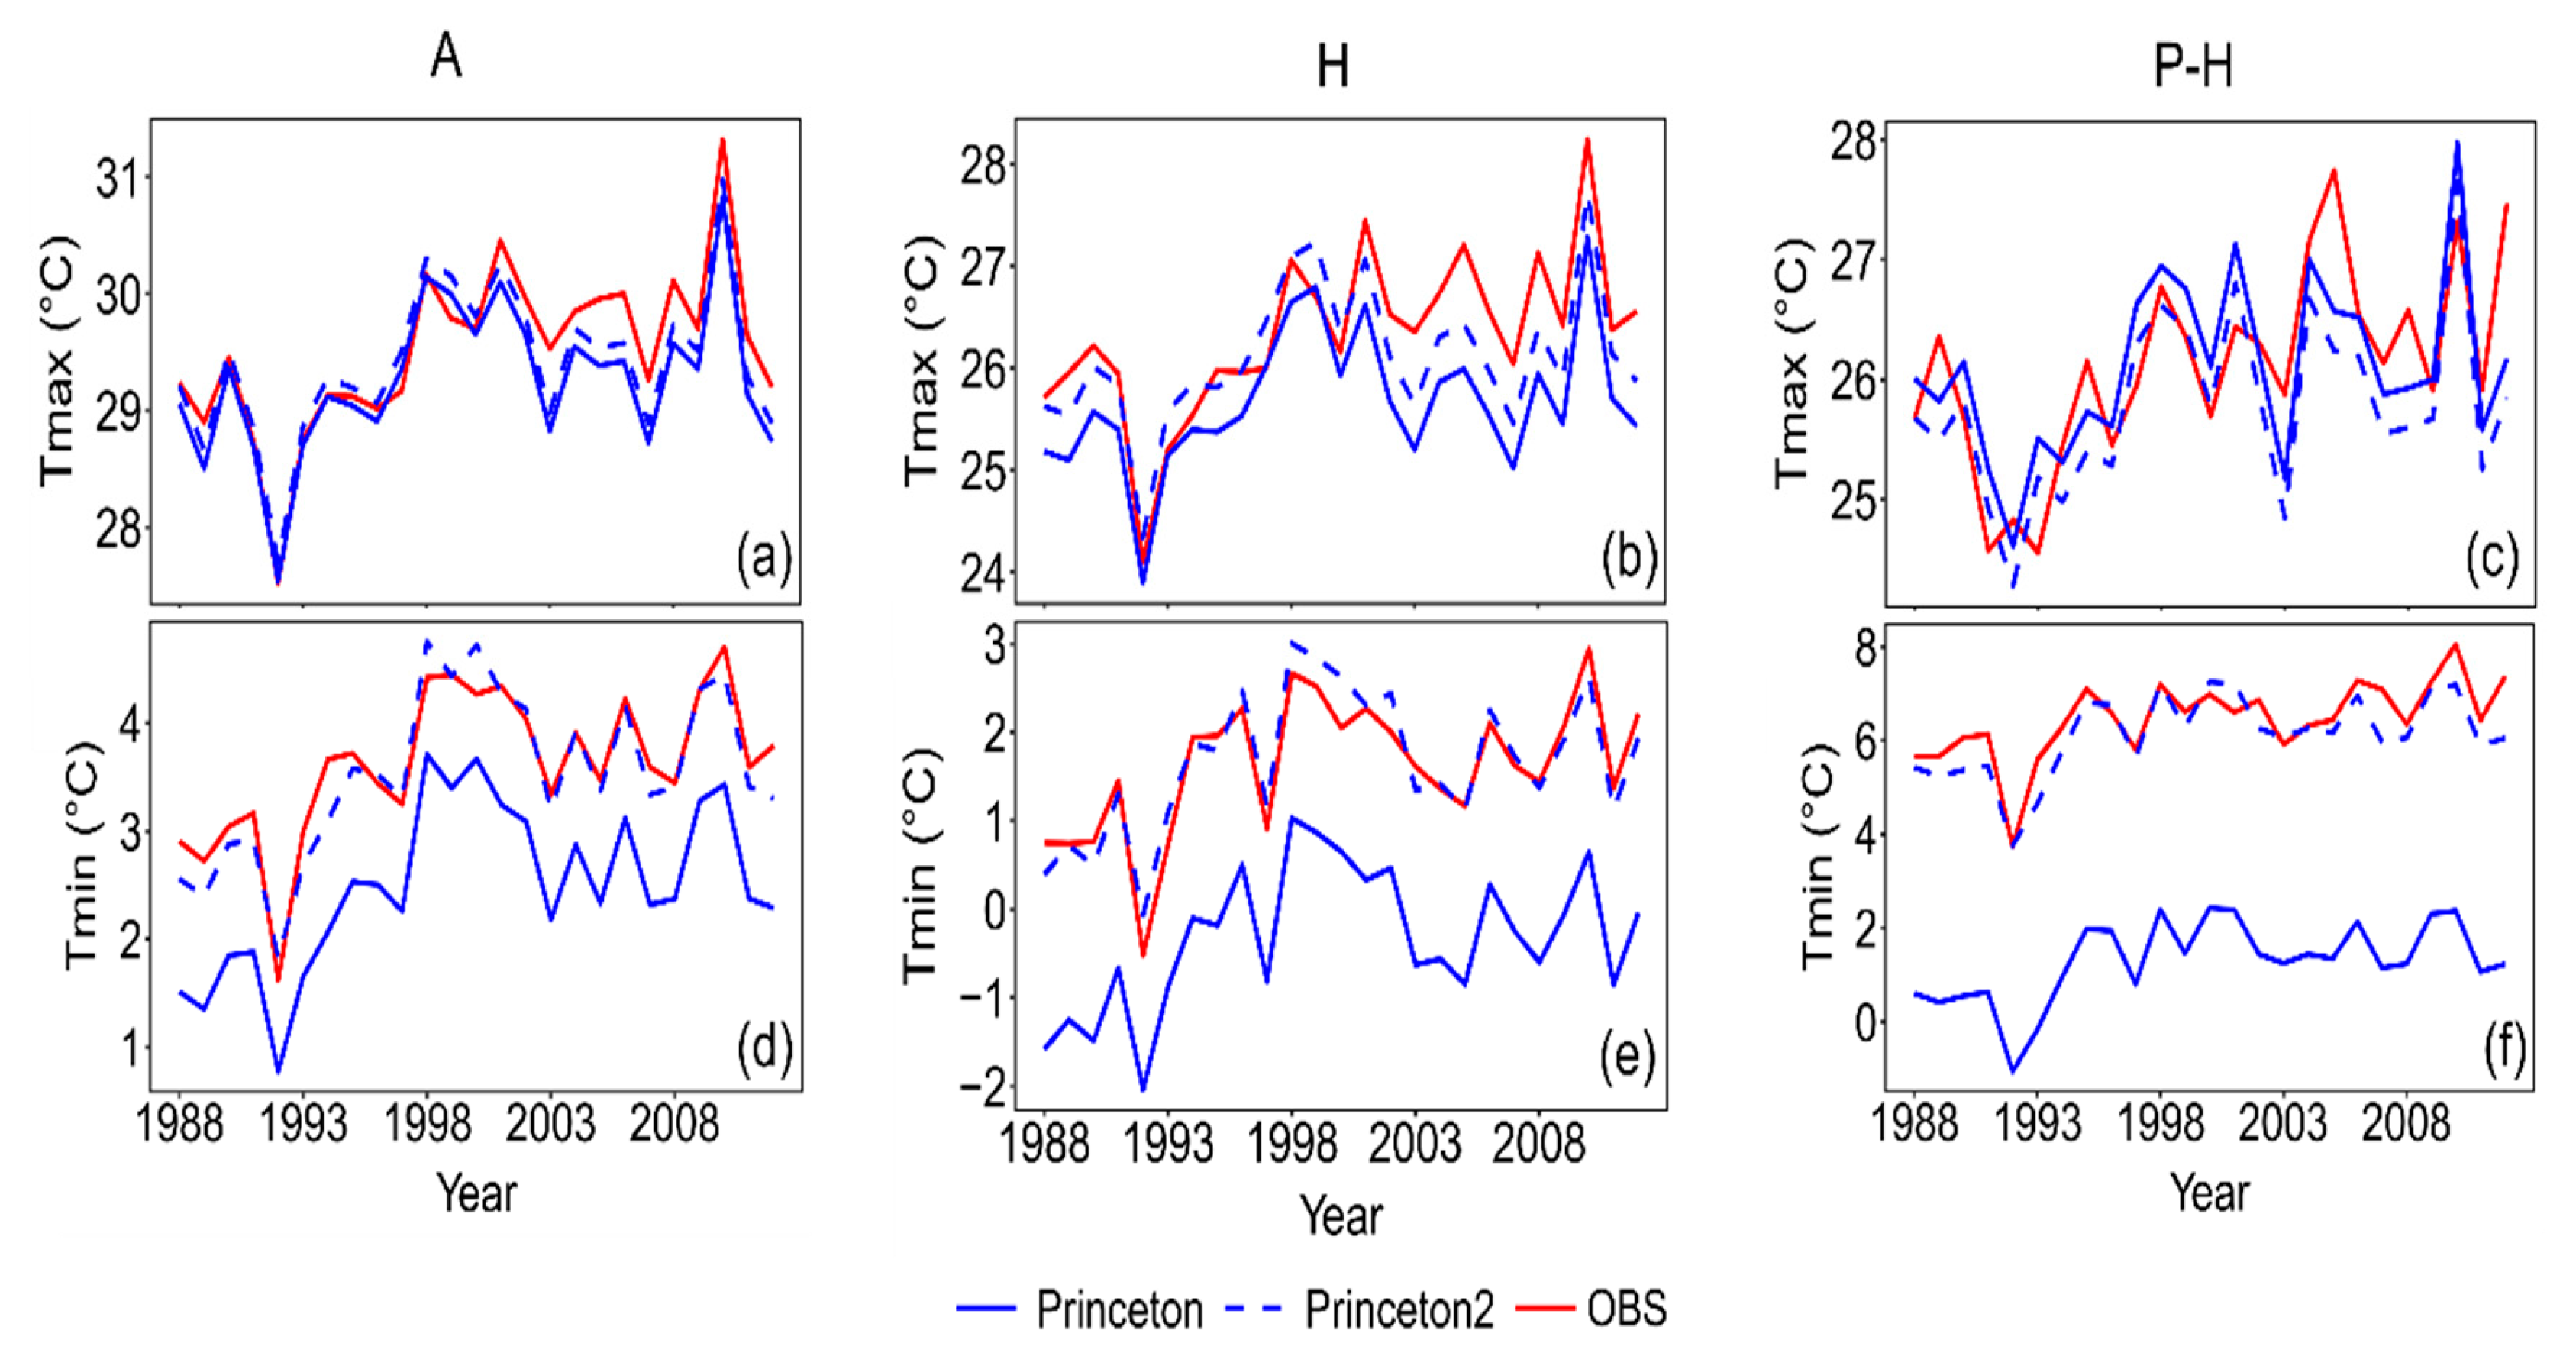
The average monthly ratios for precipitation and wind speed and average monthly delta values for maximum and minimum temperatures were applied to adjust the original gridded climate data. Time series of the areal average annual precipitation and wind speed and the maximum and minimum temperatures from station points in each of the three climate zones before and after adjustment are shown in Figure 6 and Figure 7, respectively. After adjustment, the gridded dataset moved closer to the interpolated observation. In trend analysis, a positive Sen’s slope represents an increasing trend, whereas a negative Sen’s slope represents a decreasing trend. The observed station data showed that from 1988 to 2012, annual precipitation decreased in the three climate zones, maximum temperature showed a significant increasing trend in the three climate zones, minimum temperature increased significantly in the Arid and Per-Humid zones, and wind speed increased significantly in the three climate zones (Table 2).
4.3. Validation of the Adjusted Datasets at 37 Station Points
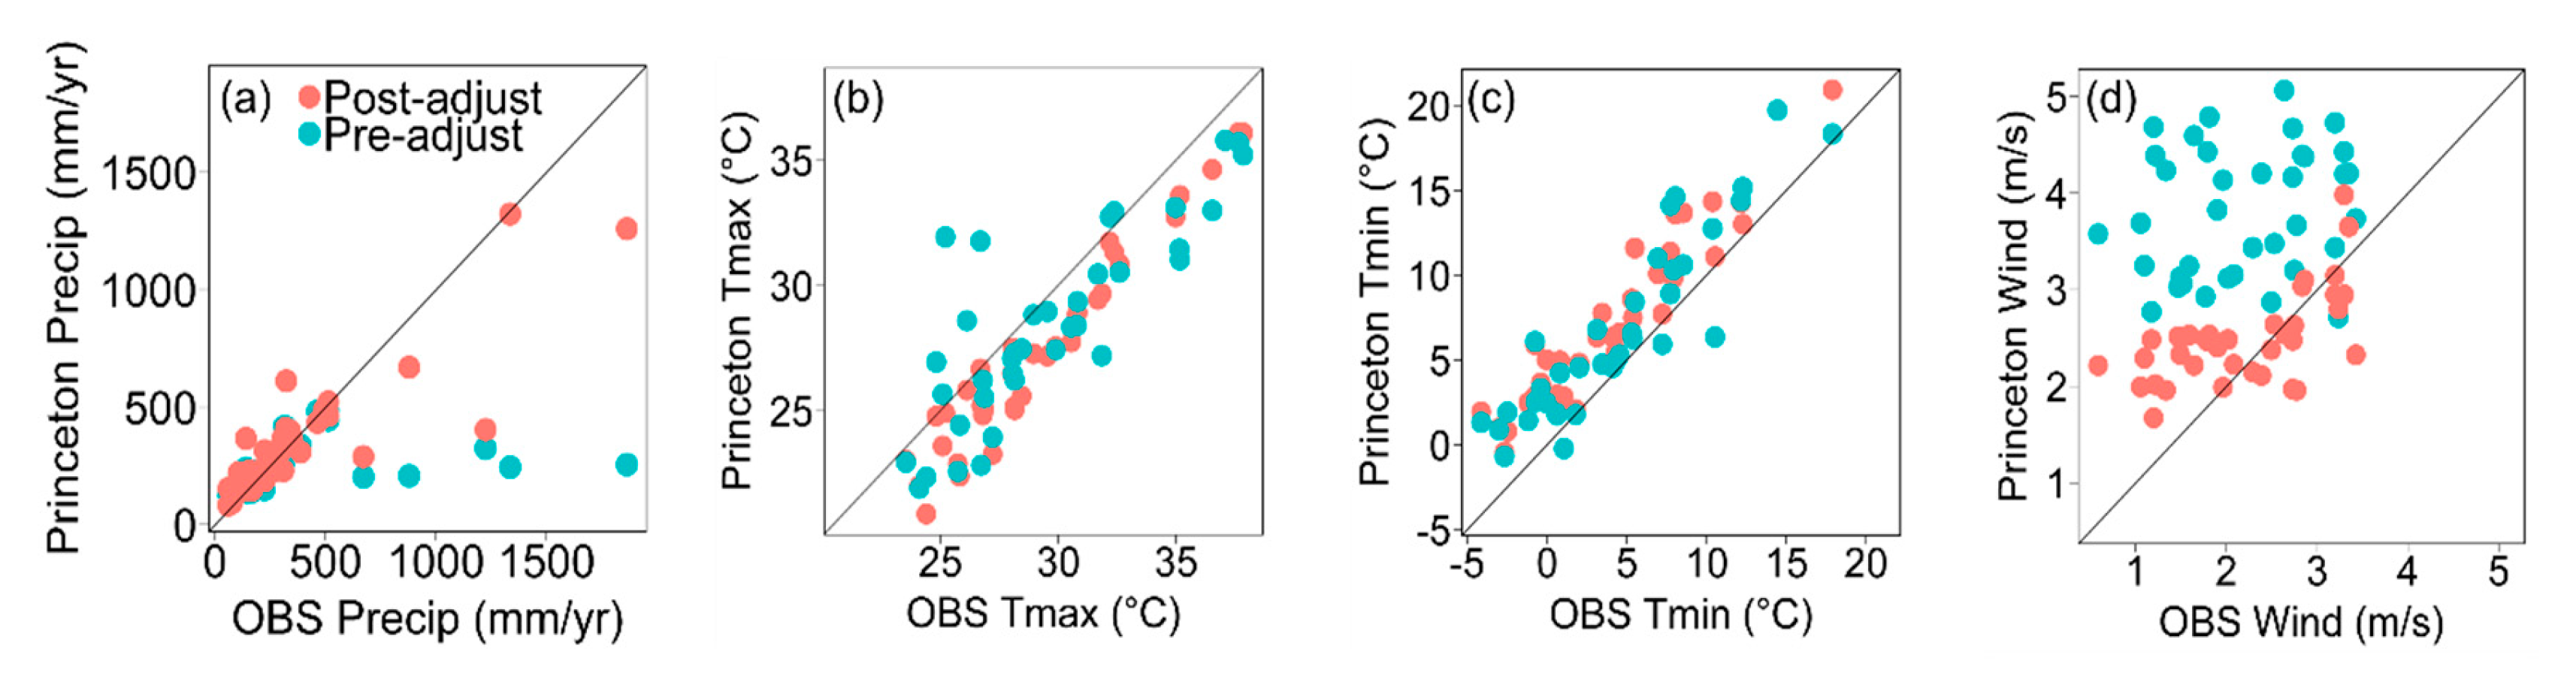
The observations in 1958–1987 were used to validate the adjusted PGF datasets. As there are not enough observation stations during this time period, we bilinearly interpolated precipitation and wind speed of the adjusted datasets to the 37 station points and then directly compared to observed station data. The grid cells with the station points were chosen for validating daily maximum and minimum temperatures. The elevation lapse rate of −6.5 °C/1 km [14] was applied for the maximum and minimum temperatures. The adjusted PGF dataset was used to estimate monthly precipitation, maximum and minimum temperatures, and wind speed at the 37 station points. Then, these climate stations were used for data validation. Figure 8 shows scatter plots of average annual climate variables between calibrated and observed values. After adjustment, the points moved closer to the 1:1 line, specifically for annual precipitation and wind speed.
All climate variables derived from the gridded datasets were compared to the observed data using four skills scores NSE, PBIAS, RMSE, and R2 (Table 3). According to Table 3, in the validation phase, the NSE for annual precipitation increased from −0.03 (for original data) to 0.72 (for adjusted data), PBIAS reduced from 29.2% to 6.6%, RMSE decreased by 182.44 mm, and R2 increased from 0.06 to 0.75. For maximum temperature, NSE increased from 0.49 to 0.73, RMSE has no big change, and R2 increased from 0.69 to 0.94. However, PBIAS for maximum temperature increased by 2.1% in the validation phase. For minimum temperature, NSE decreased by 0.16, relative PBIAS increased by 18.5%, RMSE increased by 0.64 °C, and R2 increased from 0.81 to 0.9. For wind speed, NSE increased from −4.74 to 0.22, PBIAS decreased from 74.6% to 14.1%, RMSE decreased by 1.18, and R2 increased from 0.04 to 0.37. The large discrepancies for precipitation at some points could be attributed to the fact that precipitation ratios were set to below 10 during the adjustment, while these same stations were used for the validation. The spatial interpolation from gridded datasets to station points did not consider the elevation difference for precipitation and may cause the discrepancies. Overall, skill scores for precipitation, wind speed, and maximum temperature have improved, while skill scores for minimum temperatures have not improved.
4.4. The Distribution of Average Annual Precipitation
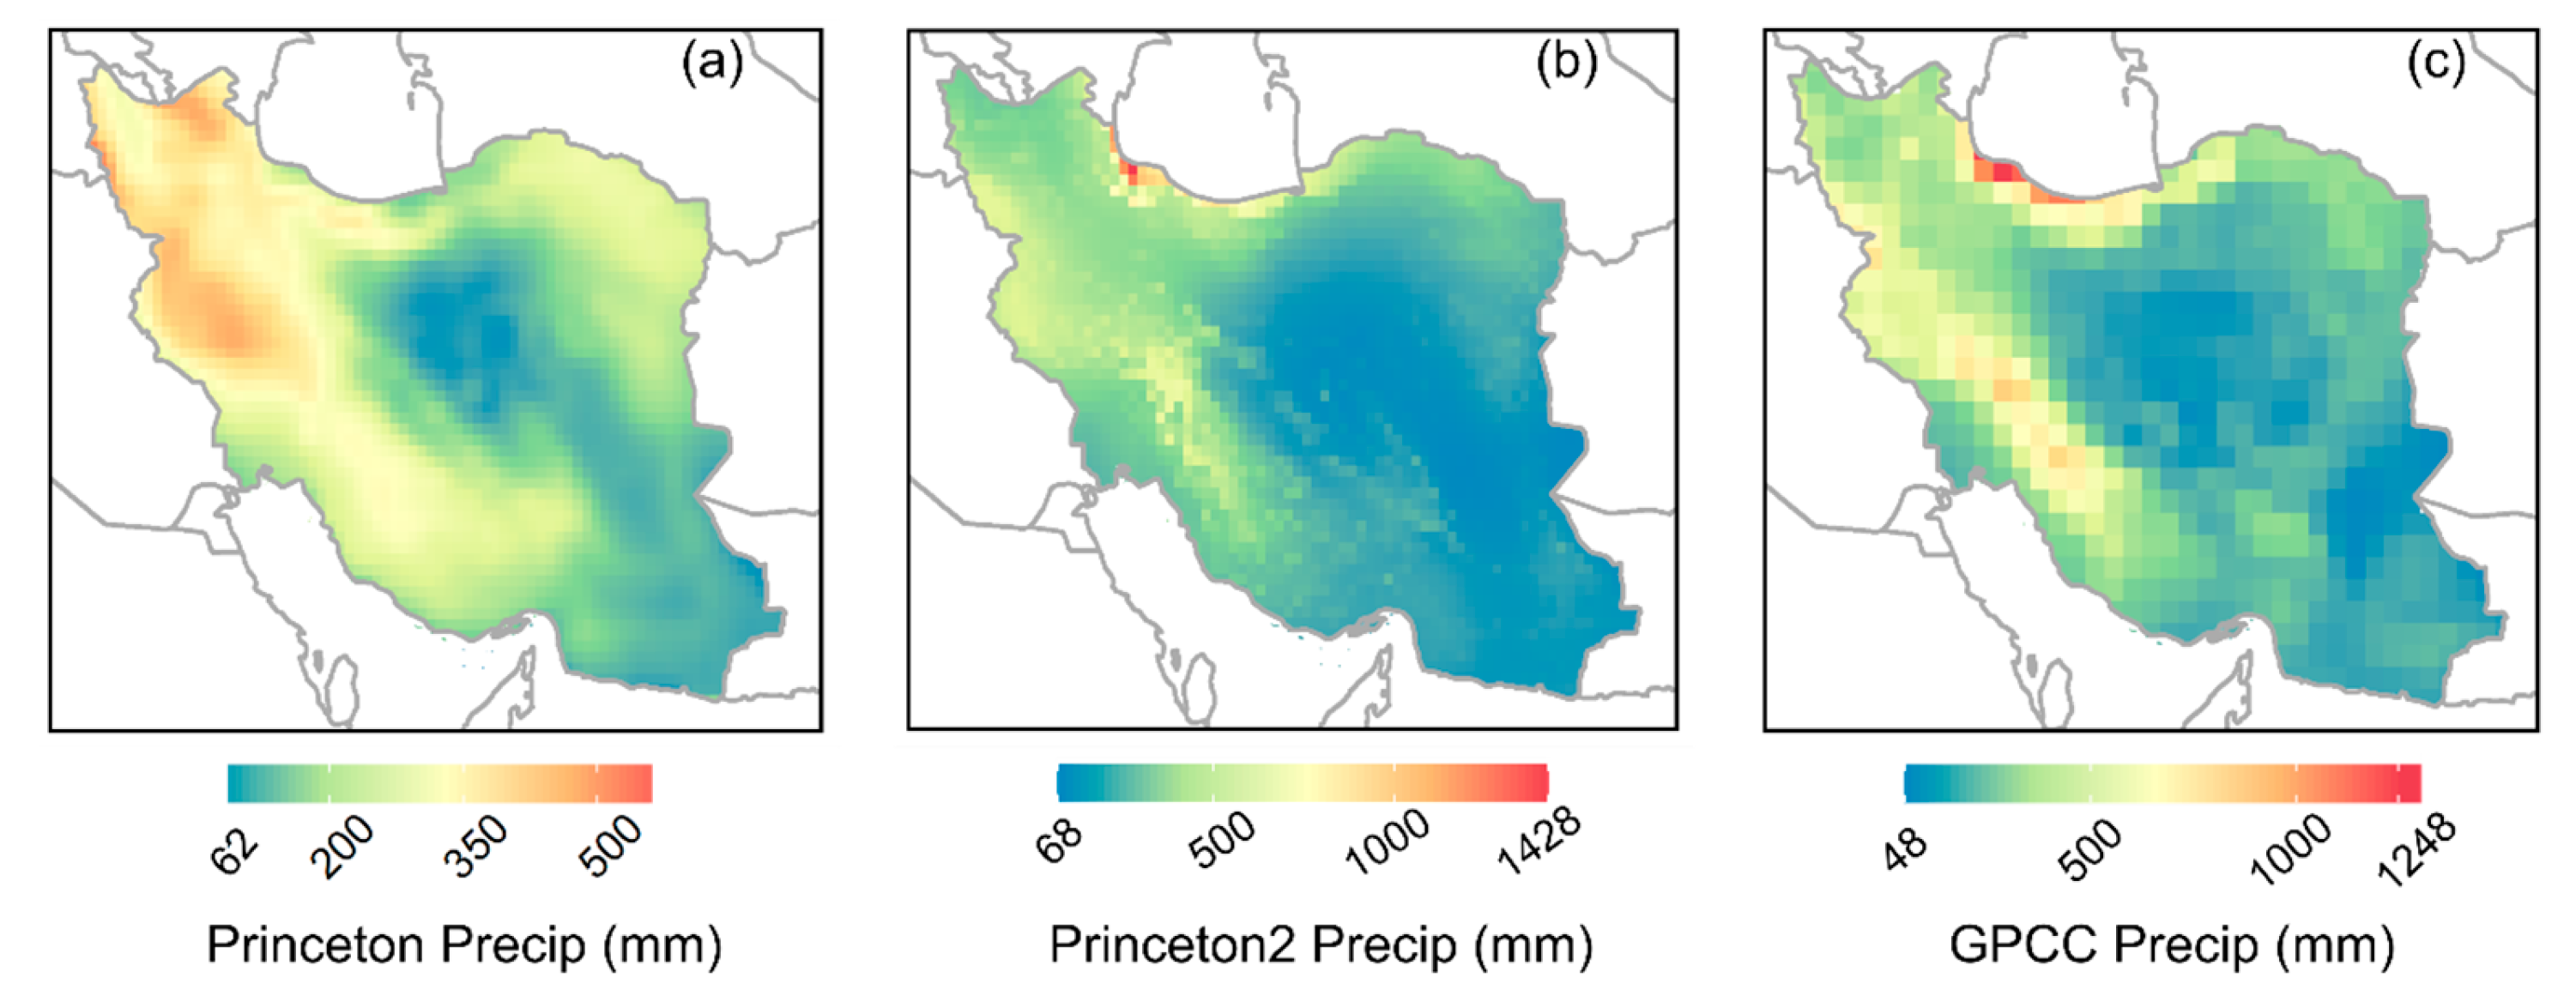
As the reason that the skill scores for precipitation have improved after the adjustment, we assessed the adjusted precipitation dataset by comparing it to GPCC gridded precipitation [34]. Spatial distributions of the Princeton average annual precipitation before and after the adjustment and the GPCC average annual precipitation from 1948 to 2016 are shown in Figure 9. Before the adjustment, average annual precipitation is 217 mm, varying from 62 to 530 mm. After the adjustment, average annual precipitation is 248 mm, varying from 68 to 1428 mm, while the GPCC dataset shows that the average annual precipitation is 259 mm, varying from 48 to 1248 mm. GPCC is a reliable source for comparing the adjusted precipitation dataset [6]. It shows that the adjusted dataset is closer to the GPCC dataset than the original PGF dataset. Precipitation is the highest near the Caspian Sea, north of Iran. Precipitation in the west and north of the country is higher than in the other areas, while precipitation in the central and southeast is very low. The high elevation areas stretching from northwest to southwest receive higher precipitation amounts than the adjacent areas.
4.5. Climate Characteristics in Each Climate Zone over Iran
We compared the three datasets OBS, PGF, and adjusted PGF to show climate characteristics in each climate zone from 1988 to 2012 over Iran (Table 4). According to Table 4, the adjusted dataset represents climate characteristics in three climatic zones significantly better than the original dataset, particularly for precipitation and wind speed. For example, the annual average precipitation in the Humid zone is equal to 388 mm, while the original PGF is estimated at about 338 mm. However, after adjustment, the performance of PGF significantly improved to some extent and the adjusted PGF estimated the annual precipitation very close to the observation, i.e., 386 mm. The adjusted dataset showed that, annually, the average precipitation increased from 192 mm in the Arid zone to 386 mm in the Humid zone and 531 mm in the Per-Humid zone. The average annual maximum temperature decreased from 29.41 °C in the Arid zone to 26.11 °C in the Humid zone and 25.77 °C in the Per-Humid zone. The average annual wind speed decreased from the Arid zone to the Per-Humid zone, in general. The average annual precipitation improved more significantly in the Per-Humid zone than in the Humid and Arid zones, while maximum temperature improved better in the Arid and Humid zones than in the Per-Humid zone. For wind speed, the values improved comparably in the three climate zones. The adjusted PGF for average annual minimum temperature did not improve, so the adjusted values are not shown here.
5. Discussion
This study evaluated precipitation, maximum and minimum temperatures, and wind speed obtained from the PGF datasets over Iran using a set of observed station data. Discrepancies between observations and interpolations in 1988–2012 for Princeton from the gridded datasets were applied to adjust the original gridded datasets. Stations with continuous monthly data from 1958 to 1987 were used for validation.
5.1. Evaluation of the Gridded Dataset
The results showed that high ratios of precipitation occurred from June to November. A few points with high discrepancies are located near high-elevation areas such as the Zagros Mountains, where elevations are high and precipitation mostly occurs in the form of snow. Thus, it is possible that the gridded datasets were not able to estimate precipitation values accurately at these points. Some points are located near the Kavir Desert. The underestimation of precipitation and the higher discrepancies of precipitation between gridded datasets in mountainous regions than in flat topography have been acknowledged in other studies as well [10,11]. Mean ratios were the highest in July and the lowest in April, meaning that precipitation discrepancies between observations and the gridded dataset were highest in July. [27] compared annual precipitation from observations to modeled data in Iran and found that maximum errors occurred from June to September when there were convective and local rainfalls. The contrasting difference of local instabilities and temperature between the land surface and sea surface temperatures may result in large errors in summer months. The Caspian Sea in the north and the Baluchi and Hormozi regions in the southeast of Iran are important regions of convective and local rainfalls [27]. Similarly, the results in this study showed that the minimum discrepancies between observed and gridded precipitation occurred during the rainy season from December to May. Precipitation differences are more pronounced in the mountainous areas and lowland deserts, while temperature differences are more consistent except near the Caspian Sea in summer. The use of different numbers of observation stations to generate the original gridded datasets can also cause the underestimation problem.
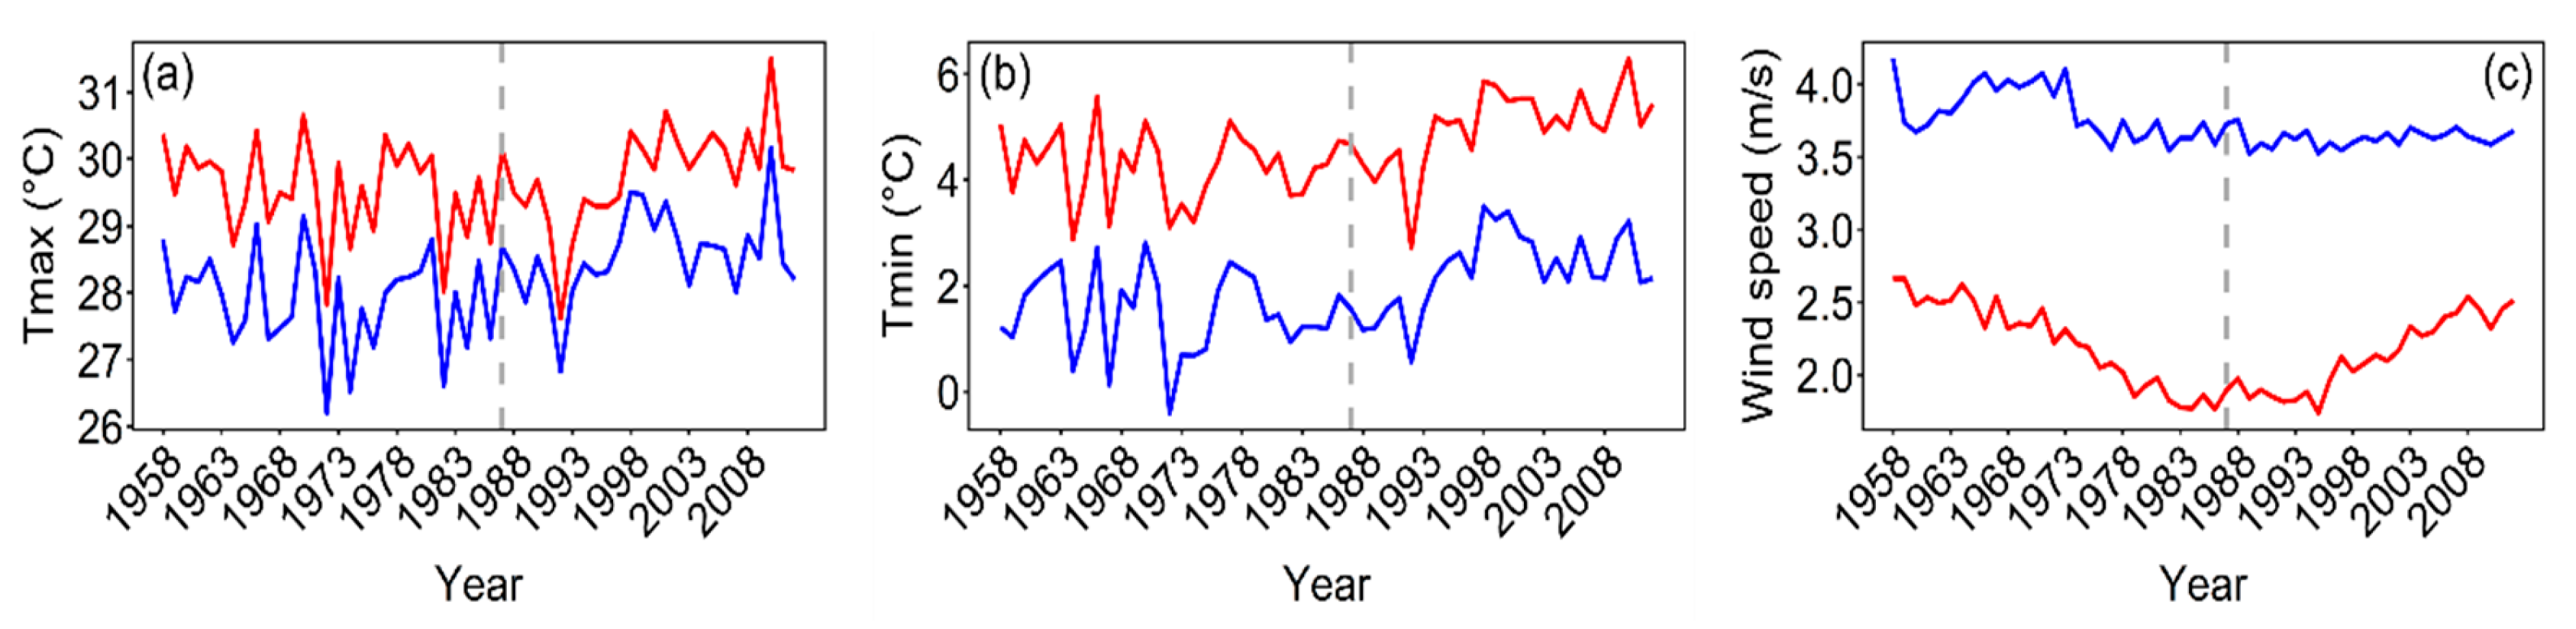
We compared the skill scores before and after the adjustment for annual precipitation, maximum and minimum temperatures, and wind speed from 1958 to 1987 between the gridded dataset and observed station data. The best performance of the adjusting method can be seen for the wind speed. For wind speed, PBIAS decreased from 74.6% to 14.1%, RMSE decreased by 1.18 mm/year, and R2 increased from 0.04 to 0.37. The lower skill scores of the original Princeton climate data may be due to the use of a sparsely distributed station network, especially in topographically complex regions such as near mountains and coastal areas. Here, we show that a simple bias correction method can significantly improve the performance of the PGF. However, the adjustment did not improve skill scores for minimum temperatures, suggesting that the same delta values in the calibration time period cannot be applied in the validation time period. Figure 10 shows that annual minimum temperature increased after 1987, indicating that the climate patterns become non-stationary under the climate warming background; thus, the delta method is not applicable for adjusting temperature values. However, although a non-stationary pattern can be seen in maximum temperatures and wind speed from observed station data, they show that the difference between the two-time series (observed and original PGF) is almost constant, while for minimum temperature, the difference between the observed and PGF for the calibration and validation phase is not the same. The gridded Princeton dataset cannot exhibit the annual trends in wind speed. However, after adjustment, the average wind speed values were close to the observed values.
5.2. Time Series of Climate Data
The time series of areal average annual precipitation, maximum and minimum temperatures, and wind speed showed that the four climate variables were well-predicted in the three climate zones in the calibration time period (Figure 6 and Figure 7). Trend analyses using observed station data showed that annual precipitation decreased in the three climate zones. If the decreasing trend of annual precipitation continues in the future or becomes significant, it would cause severe water stress in all sectors, and specifically, an increase in agricultural water withdrawals [27]. Flooding in the north and west areas of the country has occurred historically [35]. A decrease in precipitation, especially in the Arid zone, may result in an increase in the frequency and intensity of droughts. Average maximum temperature increased significantly in all three climate zones, while average minimum temperature increased significantly in the Arid and Per-Humid zones and insignificantly in the Humid zone.
5.3. Spatial and Temporal Distributions of the Climate Variables
The highest precipitation amount occurs near the Caspian Sea, north of Iran. Precipitation amounts along the Zagros and Alborz Mountains are higher than in the other regions [36]. Not surprisingly, the lowest precipitation amount occurs in the desert areas. Maximum and minimum temperatures are the lowest in the northwest and along the mountainous areas, including the Zagros, the Alborz, and the Binalud Mountains. Temperature is higher in the southeast and the desert areas inland compared to the other regions. In general, the majority of precipitation occurs in winter. The mountains act as barriers and block the movement of inland moisture, thus causing the spatial patterns of climatic variables. On the contrary, maximum and minimum temperatures are the lowest in winter and highest in summer. The average temperature ranges from −6 °C to 21 °C in January, and from 19 °C to 39 °C in July [37]. Wind speed showed no apparent seasonal patterns but showed a yearly trend. After adjustment, the gridded dataset was applied to analyze climate characteristics over Iran (Table 4). On average, the annual precipitation increased from 192 mm in the Arid zone to 386 mm in the Humid zone and 531 mm in the Per-Humid zone. The average annual maximum temperature decreased from 29.41 °C in the Arid zone to 26.11 °C in the Humid zone and 25.77 °C in the Per-Humid zone. Average annual wind speed decreased from the Arid zone to the Per-Humid zone, in general. The average annual precipitation improved more significantly in the Per-Humid zone than in the Humid and Arid zones, whereas maximum temperature improved better in the Arid and Humid zones than in the Per-Humid zone. For wind speed, the values improved comparably in the three climate zones.
5.4. The Application of Delta-Ratio Approach for Adjusting Gridded Global Climate Datasets
Although the delta-ratio approach is not appropriate for adjusting bias of extreme values, due to its simplicity and low data requirements, it is very popular. As a result, the delta change method has been widely used in climate change studies [38]. All studies show that, despite the limitations of this method, it is a useful approach in climate studies. For example, [39] applied the delta change method to bias-correct precipitation and temperature in future climate model data as compared to observed data in the historical period. In this case, the change in climate variables between the future scenario and the historical control period is used, and the bias is assumed to be equal for both the control and future simulations. The delta change method uses monthly mean precipitation values rather than extreme values and is considered to be appropriate for groundwater systems because groundwater systems are more sensitive to changes in mean precipitation values. By focusing on two drainage basins in Northern Europe and one basin in Central Europe, [40] addressed that the use of the delta change method to transfer climate change to hydrological models offers a robust method to compare average outcome from different regional climate models. The delta approach-induced climate data may improve changes in simulated runoff volumes, but it has limitations regarding seasonal dynamics and extreme runoff values [41]. After adjusting for the precipitation data from a regional climate model, the simulated runoff approximates the mean annual cycle, and daily runoff is similar to the observed runoff in timing and amplitude of runoff events for lowland gauges in the Rhine basin [42]. In short, the results of previous research regarding the application of the delta-ratio method are in line with our results.
6. Conclusions
We compared the PGF dataset at 0.25° spatial resolution with observed station data over Iran, including precipitation, maximum and minimum temperatures, and wind speed. The station observations were interpolated to the gridded surfaces using the thin-plate smoothing spline method. Then, precipitation and wind speed ratios from the interpolated observations to a gridded dataset, and delta values of maximum and minimum temperatures from the station points to the PGF dataset, were applied to adjust the original gridded dataset. The four skill scores comparing the adjusted gridded datasets and observations showed that the adjustment increased the quality of the gridded datasets, specifically, precipitation, wind speed, and maximum temperature. Precipitation ratios were highest on mountain ridges. The increasing precipitation amount with increased elevation reflects the orographic effect. On the contrary, the delta values were not applicable for minimum temperatures, suggesting that temporal patterns of minimum temperature are not stationary over time. The adjusted dataset can be used as a climate forcing for hydrologic modeling. In data-sparse regions, the improved gridded dataset can be used as an alternative to station observations for long-term streamflow simulations. The bias-corrected climate forcing datasets as inputs for hydrologic models can thus improve the calculation of hydropower potential [41]. As we considered average annual climate characteristics, we applied the simple linear scaling adjustment for precipitation amount in this study. A more sophisticated adjustment method such as a nonlinear transformation for precipitation amount may improve the subsequent model simulations of extreme river flows [43]. A better understanding of climate patterns and trends is important for water resources management.
Supplementary Materials
The following are available online at https://www.mdpi.com/2073-4441/12/3/630/s1, Figure S1: Mean monthly maximum temperature (°C) of OBS at observed station points during 1988 to 2012, Figure S2: Mean monthly maximum temperature (°C) of Princeton dataset at observed station points during 1988 to 2012, Figure S3: Mean monthly minimum temperature (°C) of OBS at observed station points during 1988 to 2012, Figure S4: Mean monthly minimum temperature (°C) of Princeton dataset at observed station points during 1988 to 2012, Figure S5: Ratios of monthly observed wind speed to Princeton during 1988 to 2012 over Iran, Table S1: Information about the climate stations.
Author Contributions
Q.Z., Q.T. and S-M.H.-M. conceived and designed the experiments. Q.Z. analyzed the data and wrote the initial draft paper. S.-M.H.-M. analyzed the data and revised the paper. Q.Z., Q.T., X.L., S.-M.H.-M. and P.A. commented and contributed to the final manuscript version. All authors have read and agreed to the published version of the manuscript.
Funding
This research was funded by the National Natural Science Foundation of China, grant numbers 41790424, 41730645, and 41425002, the Strategic Priority Research Program of Chinese Academy of Sciences, grant number XDA20060402, and CAS-VPST Silk Road Science Fund 2018, grant number 131A11KYSB20170113. This research was also supported by funding from Iran National Science Foundation (INSF) (Grant number: 96001633). Q.T. is supported by the Newton Advanced Fellowships.
Acknowledgments
The authors would like to thank the Associate Editor and anonymous reviewers for their helpful suggestions.
Conflicts of Interest
The authors declare no conflict of interest.
References
- Ledesma, J.L.J.; Futter, M.N. Gridded climate data products are an alternative to instrumental measurements as inputs to rainfall-runoff models. Hydrol. Process. 2017, 31, 3283–3293. [Google Scholar] [CrossRef] [Green Version]
- Dezfooli, D.; Abdollahi, B.; Hosseini-Moghari, S.M.; Ebrahimi, K. A comparison between high-resolution satellite precipitation estimates and gauge measured data: Case study of Gorganrood basin, Iran. J. Water Supply Res. T. 2018, 67, 236–251. [Google Scholar] [CrossRef]
- Harris, I.; Jones, P.D.; Osborn, T.J.; Lister, D.H. Updated high-resolution grids of monthly climatic observations–the CRU TS3. 10 Dataset. Int. J. Climatol. 2014, 34, 623–642. [Google Scholar] [CrossRef] [Green Version]
- Yatagai, A.; Kamiguchi, K.; Arakawa, O.; Hamada, A.; Yasutomi, N.; Kitoh, A. APHRODITE: Constructing a long-term daily gridded precipitation dataset for Asia based on a dense network of rain gauges. Bull. Am. Meteorol. Soc. 2012, 93, 1401–1415. [Google Scholar] [CrossRef]
- Rienecker, M.M.; Suarez, M.J.; Gelero, R.; Todling, R.; Bacmeister, J.; Liu, E.; Bosilovich, M.G.; Schubert, S.D.; Takacs, L.; Kim, G.K.; et al. NASA’s modern-era retrospective analysis for research and applications. J. Clim. 2011, 24, 3624–3648. [Google Scholar] [CrossRef]
- Hosseini-Moghari, S.M.; Araghinejad, S.; Ebrahimi, K. Spatio-temporal evaluation of global gridded precipitation datasets across Iran. Hydrolog. Sci. J. 2018, 63, 1669–1688. [Google Scholar] [CrossRef]
- Ensor, L.A.; Robeson, S.M. Statistical Characteristics of Daily Precipitation: Comparison of Gridded and Point Datasets. J. Appl. Meteorol. Climatol. 2008, 47, 2468–2476. [Google Scholar] [CrossRef]
- Hofstra, N.; Haylock, M.; New, M.; Jones, P.; Frei, C. Comparison of six methods for the interpolation of daily, European climate data. J. Geophys. Res. 2008, 113, D21110. [Google Scholar] [CrossRef] [Green Version]
- Hunziker, S.; Gubler, S.; Calle, J.; Moreno, I.; Andrade, M.; Velarde, F.; Ticona, L.; Carrasco, G.; Castellón, Y.; Oria, C.; et al. Identifying, attributing, and overcoming common data quality issues of manned station observations. Int. J. Climatol. 2017, 37, 4131–4145. [Google Scholar] [CrossRef]
- Abatzoglou, J.T.; Dobrowski, S.Z.; Parks, S.A.; Hegewisch, K.C. TerraClimate, a high-resolution global dataset of monthly climate and climatic water balance from 1958–2015. Sci. Data 2017, 5, 170191. [Google Scholar] [CrossRef] [Green Version]
- Werner, A.T.; Schnorbus, M.A.; Shrestha, R.R.; Cannon, A.J.; Zwiers, F.W.; Dayon, G.; Anslow, F. A long-term, temporally consistent, gridded daily meteorological dataset for northwestern North America. Sci. Data 2018, 6, 1–16. [Google Scholar] [CrossRef]
- Brinckmann, S.; Krähenmann, S.; Bissolli, P. High-resolution daily gridded data sets of air temperature and wind speed for Europe. Earth Syst. Sci. Data 2016, 8, 491–516. [Google Scholar] [CrossRef] [Green Version]
- Gampe, D.; Ludwig, R. Evaluation of Gridded Precipitation Data Products for Hydrological Applications in Complex Topography. Hydrology 2017, 4, 53. [Google Scholar] [CrossRef] [Green Version]
- Zhang, X.; Tang, Q.; Pan, M.; Tang, Y. A Long-Term Land Surface Hydrologic Fluxes and States Dataset for China. J. Hydrometeorol. 2014, 15, 2067–2084. [Google Scholar] [CrossRef]
- Yanto; Livneh, B.; Rajagopalan, B. Development of a gridded meteorological dataset over Java island, Indonesia 1985–2014. Sci. Data 2017, 4, 1–10. [Google Scholar] [CrossRef] [Green Version]
- Ahmed, K.; Shahid, S.; Wang, X.; Nawaz, N.; Khan, N. Evaluation of Gridded Precipitation Datasets over Arid Regions of Pakistan. Water 2019, 11, 210. [Google Scholar] [CrossRef] [Green Version]
- Sheffield, J.; Goteti, G.; Wood, E.F. Development of a 50-year high-resolution global dataset of meteorological forcings for land surface modeling. J. Clim. 2006, 19, 3088–3111. [Google Scholar] [CrossRef] [Green Version]
- Zhan, W.; Guan, K.; Sheffield, J.; Wood, E.F.J. Depiction of drought over sub-Saharan Africa using reanalyses precipitation data sets. J. Geophys. Res. Atmos 2016, 121, 10–555. [Google Scholar] [CrossRef]
- Chaney, N.W.; Sheffield, J.; Villarini, G.; Wood, E.F. Development of a High-Resolution Gridded Daily Meteorological Dataset over Sub-Saharan Africa: Spatial Analysis of Trends in Climate Extremes. J. Clim. 2014, 27, 5815–5835. [Google Scholar] [CrossRef]
- Zhang, Y.; Zheng, H.; Chiew, F.H.; Arancibia, J.P.; Zhou, X. Evaluating regional and global hydrological models against streamflow and evapotranspiration measurements. J. Hydrometeorol. 2016, 17, 995–1010. [Google Scholar] [CrossRef]
- Pan, M.; Sahoo, A.K.; Troy, T.J.; Vinukollu, R.K.; Sheffield, J.; Wood, E.F. Multisource estimation of long-term terrestrial water budget for major global river basins. J. Clim. 2012, 25, 3191–3206. [Google Scholar] [CrossRef]
- Nashwan, M.S.; Shahid, S.; Chung, E.S. Development of high-resolution daily gridded temperature datasets for the central north region of Egypt. Sci. Data 2019, 6, 1–13. [Google Scholar] [CrossRef] [Green Version]
- Maggioni, V.; Meyers, P.C.; Robinson, M.D. A Review of Merged High-Resolution Satellite Precipitation Product Accuracy during the Tropical Rainfall Measuring Mission (TRMM) Era. J. Hydrometeorol. 2016, 17, 1101–1117. [Google Scholar] [CrossRef]
- Poulin, A.; Brissette, F.; Leconte, R.; Arsenault, R.; Malo, J.S. Uncertainty of hydrological modelling in climate change impact studies in a Canadian, snow-dominated river basin. J. Hydrol. 2011, 409, 626–636. [Google Scholar] [CrossRef]
- Rahimzadeh, F.; Noorian, A.M.; Pedram, M.; Kruk, M.C. Wind speed variability over Iran and its impact on wind power potential: A case study for Esfehan Province. Meteorol. Appl. 2011, 18, 198–210. [Google Scholar] [CrossRef]
- Tabari, H.; Talaee, P.H. Temporal variability of precipitation over Iran: 1966–2005. J. Hydrol. 2011, 396, 313–320. [Google Scholar] [CrossRef]
- Babaeian, I.; Modirian, R.; Karimian, M.; Zarghami, M. Simulation of climate change in Iran during 2071-2100 using PRECIS regional climate modelling system. Desert 2015, 20, 123–134. [Google Scholar] [CrossRef]
- Ghasemi, A.R. Changes and trends in maximum, minimum and mean temperature series in Iran. Atmos. Sci. Lett. 2015, 16, 366–372. [Google Scholar] [CrossRef]
- Ashraf Vaghefi, S.; Keykhai, M.; Jahanbakhshi, F.; Sheikholeslami, J.; Ahmadi, A.; Yang, H.; Abbaspour, K.C. The future of extreme climate in Iran. Sci. Rep. 2019, 9, 1464. [Google Scholar] [CrossRef] [Green Version]
- Khalili, A.; Rahimi, J. The Soils of Iran; Springer: Cham, Germany, 2018; pp. 19–33. [Google Scholar] [CrossRef]
- Duan, Z.; Liu, J.; Tuo, Y.; Chiogna, G.; Disse, M. Evaluation of eight high spatial resolution gridded precipitation products in Adige Basin (Italy) at multiple temporal and spatial scales. Sci. Total Environ. 2016, 573, 1536–1553. [Google Scholar] [CrossRef] [Green Version]
- Hutchinson, M.F. Interpolation of Rainfall Data with Thin Plate Smoothing Splines—Part I: Two Dimensional Smoothing of Data with Short Range Correlation. GIDA 1998, 2, 139–151. [Google Scholar]
- Hutchinson, M.F. Interpolation of Rainfall Data with Thin Plate Smoothing Splines—Part II: Analysis of Topographic Dependence. GIDA 1998, 2, 152–167. [Google Scholar]
- Schneider, U.; Becker, A.; Finger, P.; Meyer-Christoffer, A.; Ziese, M.; Rudolf, B. GPCC’s new land surface precipitation climatology based on quality-controlled in situ data and its role in quantifying the global water cycle. Theor. Appl. Climatol. 2014, 115, 15–40. [Google Scholar] [CrossRef] [Green Version]
- Abbaspour, K.C.; Faramarzi, M.; Ghasemi, S.S.; Yang, H. Assessing the impact of climate change on water resources in Iran. Water Resour. Res. 2009, 45, W10434. [Google Scholar] [CrossRef] [Green Version]
- Mansouri Daneshvar, M.R.; Ebrahimi, M.; Nejadsoleymani, H. An overview of climate change in Iran: Facts and statistics. Environ. Syst. Res. 2019, 8, 7. [Google Scholar] [CrossRef] [Green Version]
- Madani, K. Water management in Iran: What is causing the looming crisis? J. Environ. Stud. Sci. 2014, 4, 315–328. [Google Scholar] [CrossRef]
- Berg, P.; Feldmann, H.; Panitz, H.J. Bias correction of high resolution regional climate model data. J. Hydrol. 2012, 448–449, 80–92. [Google Scholar] [CrossRef]
- Van Roosmalen, L.; Christensen, J.H.; Butts, M.B.; Jensen, K.H.; Refsgaard, J.C. An intercomparison of regional climate model data for hydrological impact studies in Denmark. J. Hydrol. 2010, 380, 406–419. [Google Scholar] [CrossRef]
- Graham, L.P.; Hagemann, S.; Jaun, S.; Beniston, M. On interpreting hydrological change from regional climate models. Clim. Chang. 2007, 81, 97–122. [Google Scholar] [CrossRef]
- Graham, L.P.; Andréasson, J.; Carlsson, B. Assessing climate change impacts on hydrology from an ensemble of regional climate models, model scales and linking methods—a case study on the Lule River basin. Clim. Chang. 2007, 81, 293–307. [Google Scholar] [CrossRef]
- Kleinn, J.; Frei, C.; Gurtz, J.; Lüthi, D.; Vidale, P.L.; Schär, C. Hydrologic simulations in the Rhine basin driven by a regional climate model. J. Geophys. Res. Atmos 2005, 110, D04102. [Google Scholar] [CrossRef]
- Leander, R.; Buishand, T.A. Resampling of regional climate model output for the simulation of extreme river flows. J. Hydrol. 2007, 332, 487–496. [Google Scholar] [CrossRef]
Figure 1.
Geographical location of the study area and the climate stations. In the left panel, the climate types in Iran are classified into three groups (Arid, Humid, and Per-Humid) according to [30]. The right panel shows the elevation range and locations of the typical landforms.
Figure 1.
Geographical location of the study area and the climate stations. In the left panel, the climate types in Iran are classified into three groups (Arid, Humid, and Per-Humid) according to [30]. The right panel shows the elevation range and locations of the typical landforms.

Figure 2.
The number of available stations each year.

Figure 3.
Ratios of monthly observed precipitation to Princeton from 1988 to 2012. (Three grid cells have ratios higher than 10 from June to October and they are not marked in the legend in the figure.).
Figure 3.
Ratios of monthly observed precipitation to Princeton from 1988 to 2012. (Three grid cells have ratios higher than 10 from June to October and they are not marked in the legend in the figure.).

Figure 4.
Deltas (°C) between monthly Princeton and observed monthly maximum temperature from 1988 to 2012.
Figure 4.
Deltas (°C) between monthly Princeton and observed monthly maximum temperature from 1988 to 2012.

Figure 5.
Deltas (°C) between monthly Princeton and observed monthly minimum temperature from 1988 to 2012.
Figure 5.
Deltas (°C) between monthly Princeton and observed monthly minimum temperature from 1988 to 2012.

Figure 6.
Pre- and post-adjusted time series of (a–c) areal average annual precipitation and (d–f) wind speed for the three climate zones Arid (A), Humid (H), and Per-Humid (P-H) from 1988 to 2012 for Princeton. The solid blue line represents the original gridded data, the dashed blue line represents the adjusted gridded data, while the solid red line represents interpolated station data (OBS).

Figure 7.
Pre- and post-adjusted time series of (a–c) annual maximum temperature and (d–f) minimum temperature at station points in the three climate zones Arid (A), Humid (H), and Per-Humid (P-H) zones from 1988 to 2012 for Princeton. The solid blue line represents the original gridded data, the dashed blue line represents the adjusted gridded data, while the solid red line represents station data (OBS).

Figure 8.
Validation of the adjusted Princeton (a) average annual precipitation, (b) average monthly maximum and (c) minimum temperatures, and (d) wind speed against observations. The x-axis represents average annual observed values, and the y-axis represents average annual adjusted values at each of the 37 stations in 1958–1987.

Figure 9.
Average annual precipitation in mm/year (a) before adjustment and (b) after adjustment at 0.25° spatial resolution and GPCC precipitation at 0.5° spatial resolution from 1948 to 2016.
Figure 9.
Average annual precipitation in mm/year (a) before adjustment and (b) after adjustment at 0.25° spatial resolution and GPCC precipitation at 0.5° spatial resolution from 1948 to 2016.

Figure 10.
Time series of (a) annual average maximum, (b) minimum temperatures, and (c) wind speed using 37 station data from 1958 to 2012 (legend refers to Figure 6, red line represents observed data at station points, blue line represents original Princeton data at grid cells, and grey dashed line denotes year 1987).


Table 1.
Skill scores that are used in this study.
| Skill Score | Equation | Perfect Value |
|---|---|---|
| Nash–Sutcliffe efficiency (NSE) | 1 | |
| Percent bias (PBIAS) | 0 | |
| Root-mean-square error (RMSE) | 0 | |
| Correlation coefficient (R2) | 1 |
is the observed climate variable in month i; is the interpolated data from Princeton climate data at station points in month i; is the mean monthly climate variable from observed data; is the mean monthly climate variable from interpolated Princeton climate data.
Table 2.
The Sen’s slope in trend analysis for annual precipitation (mm/year) and maximum and minimum temperatures (°C /year) in each climate zone from 1988 to 2012.
Table 2.
The Sen’s slope in trend analysis for annual precipitation (mm/year) and maximum and minimum temperatures (°C /year) in each climate zone from 1988 to 2012.
| Arid | Humid | Per-Humid | |
|---|---|---|---|
| Precipitation | −1.69 * | −1.36 | −0.40 |
| Maximum temp | 0.05 ** | 0.05 ** | 0.05 ** |
| Minimum temp | 0.05 ** | 0.04 | 0.05 ** |
| Wind speed | 0.02 ** | 0.03 ** | 0.03 ** |
* p-value < 0.1, ** p-value < 0.05.
Table 3.
Statistical comparisons of Nash–Sutcliffe efficiency (NSE), percent bias (PBIAS), root-mean-square error (RMSE), and correlation coefficient (R2) for average annual precipitation, maximum and minimum temperatures, and wind speed between gridded data and observations at the 37 station points before (original) and after the adjustment (adjusted).
| Climate Variables | Princeton | ||||
|---|---|---|---|---|---|
| NSE | PBIAS (%) | RMSE | R2 | ||
| Original data | Precipitation | −0.03 | −29.20 | 380.21 | 0.06 |
| Tmax | 0.49 | 4.7 | 2.7 | 0.69 | |
| Tmin | 0.68 | −24.3 | 2.95 | 0.81 | |
| Wind | −4.74 | 74.60 | 1.87 | 0.04 | |
| Adjusted data | Precipitation | 0.72 | −6.6 | 197.77 | 0.75 |
| Tmax | 0.73 | 6.8 | 2.13 | 0.94 | |
| Tmin | 0.52 | −42.8 | 3.59 | 0.90 | |
| Wind | 0.22 | 14.10 | 0.69 | 0.37 | |
RMSE is in mm/year for precipitation, °C for Tmax and Tmin, and m/s for wind speed.
Table 4.
Climate characteristics in the three climate zones from 1988 to 2012.
| Arid | Humid | Per-Humid | ||||||||||
|---|---|---|---|---|---|---|---|---|---|---|---|---|
| Pr | Tmax | Tmin | Wd | Pr | Tmax | Tmin | Wd | Pr | Tmax | Tmin | Wd | |
| OBS | 194 | 29.56 | 3.62 | 2.47 | 388 | 26.39 | 1.62 | 2.3 | 551 | 26.15 | 6.45 | 2.2 |
| PGF | 188 | 29.25 | 3.33 | 3.86 | 338 | 25.67 | −0.07 | 3.32 | 335 | 26.1 | 2.42 | 3.64 |
| Adj_PGF | 192 | 29.41 | − | 2.47 | 386 | 26.11 | − | 2.3 | 531 | 25.77 | − | 2.2 |
Pr is precipitation (mm), Tmax is maximum temperature (°C), Tmin is minimum temperature (°C), and Wd is wind speed (m/s).
© 2020 by the authors. Licensee MDPI, Basel, Switzerland. This article is an open access article distributed under the terms and conditions of the Creative Commons Attribution (CC BY) license (http://creativecommons.org/licenses/by/4.0/).
Share and Cite
MDPI and ACS Style
Zhang, Q.; Tang, Q.; Liu, X.; Hosseini-Moghari, S.-M.; Attarod, P. Improving Princeton Forcing Dataset over Iran Using the Delta-Ratio Method. Water 2020, 12, 630. https://doi.org/10.3390/w12030630
AMA Style
Zhang Q, Tang Q, Liu X, Hosseini-Moghari S-M, Attarod P. Improving Princeton Forcing Dataset over Iran Using the Delta-Ratio Method. Water. 2020; 12(3):630. https://doi.org/10.3390/w12030630
Chicago/Turabian StyleZhang, Qinghuan, Qiuhong Tang, Xingcai Liu, Seyed-Mohammad Hosseini-Moghari, and Pedram Attarod. 2020. "Improving Princeton Forcing Dataset over Iran Using the Delta-Ratio Method" Water 12, no. 3: 630. https://doi.org/10.3390/w12030630
Note that from the first issue of 2016, this journal uses article numbers instead of page numbers. See further details here.