Article

Catchment-Scale Analysis Reveals High Cost-Effectiveness of Wetland Buffer Zones as a Remedy to Non-Point Nutrient Pollution in North-Eastern Poland

1
Department of Plant Ecology and Environmental Conservation, Faculty of Biology, Biological and Chemical Research Centre, University of Warsaw, ul. Żwirki i Wigury 101, 02-089 Warsaw, Poland
2
Department of Hydrology, Meteorology and Water Management, Institute of Environmental Engineering, Warsaw University of Life Sciences—SGGW, ul. Nowoursynowska 166, 02-787 Warsaw, Poland
3
Chemical Analytics and Biogeochemistry, Leibniz-Institute of Freshwater Ecology and Inland Fisheries Berlin (IGB), Müggelseedamm 301, 12587 Berlin, Germany
4
Department of Bioscience, Aarhus University, Vejlsøvej 25, 8600 Silkeborg, Denmark
5
Institute for Ecosystem Research, Christian Albrechts Universität Kiel, Olshausenstrasse 75, 24118 Kiel, Germany
*
Author to whom correspondence should be addressed.
Water 2020, 12(3), 629; https://doi.org/10.3390/w12030629
Submission received: 24 January 2020 / Revised: 15 February 2020 / Accepted: 21 February 2020 / Published: 26 February 2020

Abstract

:
Large-scale re-establishment of wetland buffer zones (WBZ) along rivers is regarded as an effective measure in order to reduce non-point source nitrogen (N) and phosphorus (P) pollution in agricultural catchments. We estimated efficiency and costs of a hypothetical establishment of WBZs along all watercourses in an agricultural landscape of the lower Narew River catchment (north-eastern Poland, 16,444 km2, amounting to 5% of Poland) by upscaling results obtained in five sub-catchments (1087 km2). Two scenarios were analysed, with either rewetting selected wetland polygons that collect water from larger areas (polygonal WBZs) or reshaping and rewetting banks of rivers (linear WBZs), both considered in all ecologically suitable locations along rivers. Cost calculation included engineering works necessary in order to establish WBZs, costs of land purchase where relevant, and compensation costs of income forgone to farmers (needed only for polygonal WBZs). Polygonal WBZs were estimated in order to remove 11%–30% N and 14%–42% P load from the catchment, whereas linear WBZs were even higher with 33%–82% N and 41%–87% P. Upscaled costs of WBZ establishment for the study area were found to be 8.9 M EUR plus 26.4 M EUR per year (polygonal WBZ scenario) or 170.8 M EUR (linear WBZ scenario). The latter value compares to costs of building about 20 km of an express road. Implementation of buffer zones on a larger scale is thus a question of setting policy priorities rather than financial impossibility.

1. Introduction

Human impact has significantly altered every major biogeochemical cycle [1]. In this paper we focus on nitrogen (N) and phosphorus (P) as main triggers of accelerating eutrophication of water ecosystems. The disruption of their global cycles was considered among crossed planetary boundaries [2] as the second most serious global problem after the loss of biosphere integrity due to species extinction. After Haber’s discovery [3], the use of nitrogen fertilizers in agriculture increased worldwide from nearly zero to 100 Tg year−1 during the past century. Simultaneously, the global N use efficiency in agriculture has decreased, leading to a large amount of N escaping into the environment [4]. The ability of streams to remove N from the biogeochemical cycle has been hindered due river training and drainage of riparian wetlands, adding another factor to the deterioration of quality of surface waters. The proportion of non-point source (NPS) pollution from all pollution sources can be relatively high, but it can vary among catchments, for instance, more than half of the N in the examined USA catchments [5], 64% of nitrate load in Ebro River in Spain [6], and 83% of total P in Hanjiang River in China [7]. The necessity of finding a systemic solution for this problem is acknowledged by both researchers and legislators.
The large-scale (re-)establishment of wetland buffer zones (WBZs) is one of the effective solutions in mitigating NPS pollution of water bodies. In some cases, re-establishing WBZs bring the immediate effects of improving water quality, whilst under other environmental conditions, WBZs remain a crucial element of larger strategies tailored to decreasing the risk of eutrophication and pollution [8,9,10]. WBZs represent a variety of ecosystems (for examples please refer to Supplementary S1) that develop in conditions of permanent and high level of soil saturation and remain habitats for phreatophytic vegetation that is capable of interacting with groundwater and surface water. A wetland buffer zone might be less space-efficient than certain types of constructed wetlands [11] but the latter are usually unsuitable for treating NPS pollution. This function as nutrient sinks is based on several different but not exclusive mechanisms. These include microbial processes (nitrification and denitrification), chemical reactions (precipitation of insoluble phosphorous compounds), physical adsorption, sedimentation, and incorporation in plant biomass and food webs, though the quantitative importance of each of these processes needs further detailed consideration (for details see Supplementary S1). Despite numerous legal and practical attempts to reduce nutrient loads reaching rivers in agriculture-dominated catchments, influencing farmers to limit or optimize the use of fertilizers has not been as efficient as expected and time is required to change stakeholders’ perceptions [12].
Hence, without having WBZs restored on a large scale, the goal of the Water Framework Directive (WFD) of the EU achieving “good ecological status” of rivers will likely not be reached [13]. Yet despite the well-established knowledge about their efficiency, nonetheless very few examples exist regarding the systemic implementation of WBZs on the landscape scale. This problem exemplifies the wide-spread tragedy of the commons [14]—individual economic gains from extending (and maintaining) farmland to the very edge of (usually canalised) watercourses normally outweigh societal gains from purifying catchment’s waters by preserved or restored riverine wetlands. In addition to this, implementation of WBZs as a catchment-scale solution is constrained by the problem of spatial mismatch between cause and effect, whereby the consequences of managing riverine buffers in multiple small rivers and streams are perceived downstream in large rivers, reservoirs, and estuaries [15].
Two possible solutions to overcome these problems are (1) regional (catchment) management, such as the use of fiscal instruments and redistribution of resources, possibly combining societal gains from nutrient mitigation with benefits for flood prevention and biodiversity protection, and (2) innovative economies benefiting from wetland restoration programs and providing leverages for upscaling their implementation. One such concept, developed to reduce carbon dioxide emissions from drained peatlands is paludiculture, that is, agricultural production on wet (and particularly rewetted) peatlands, offering high yields of wetland plants that can be harvested as raw materials for energy production and also as fodder [16,17]. The same approach can also be applied to non-peat riparian wetlands, where carbon benefits might be of lesser importance, whereas clear synergies between biomass harvesting and nutrient removal exist [18]. Regardless of whether the large scale application of WBZs is driven by policymakers or local innovators, studies demonstrating the potential for upscaling are urgently needed to facilitate the decision making process regarding WBZ systems.
Several meta-analyses and reviews show high efficiency of riparian buffers [19,20,21,22] but they derive this information from case studies constrained to particular locations (individual buffer zones) and cannot be simply upscaled to whole landscapes. There are several reasons underlying this. Firstly, WBZs cannot always be established along the entire length of a river and a varying amount of agricultural runoff waters will enter the river, bypassing the wetlands. Secondly, the effectiveness of nutrient capture and removal depends on the load, and thus different regions may need different approaches. Thirdly, rewetting of drained peatlands that were formerly under agricultural usage, aside from increasing methane (CH4) emissions, can remobilise N or P, which affects initial and long-term nutrient targets [23]. In general, the need for optimal land use changes for nutrient abatement by introducing natural buffers remains continuously claimed [8,9,10].
The calculation of costs for the establishment and maintenance of WBZs is a further factor that will affect the process of regional analysis. However, the scale of WBZ application is not yet adequate for providing realistic cost–benefit calculations, meaning that we need to rely, at least partly, on hypothetical studies and estimations.
Much effort to extrapolate the results of individual WBZs to a catchment scale were completed for the Mississippi River basin [24,25,26]. Mitsch et al. [24] conducted a regional analysis for the whole catchment comprising around 40% of conterminous area of the USA and concluded that the N load entering the Gulf of Mexico could be reduced by 40% through joint implementation of wetland restoration, regulation of in-farm practices, and improved control of domestic wastewater. Marshal et al. [25] demonstrated two scenarios achieving a 45% reduction of nutrients load to the Gulf of Mexico. They concluded that if the load to the gulf is not the only goal but local/regional water quality targets are also addressed, the localisation of nutrient mitigation efforts must be spread quite evenly in the whole catchment. Regional analyses were also made in Scandinavia. Arheimer [27] showed that creation of 40 wetlands on topographically realistic siting, covering altogether 0.4% of a catchment in Sweden, could potentially reduce N transport to the coast by approximately 6%. Weisner et al. [28] showed how optimisation of WBZ placement and design (around 1000 wetlands of 5300 ha implemented in Sweden in 2007–2013) could improve the effectiveness of nutrient removal and enhance biodiversity of agricultural landscapes. Collentine at al. [29] showed that allocating WBZs in areas defined by the lowest cost of P reduction allowed for the achievement of the largest and most cost-effective P reduction on the whole catchment in Sweden, thus arguing that economic settings should be included in planning WBZ locations. Unique examples of catchment-scale implementation and monitoring of WBZs’ effectiveness come from Denmark, for instance, Windolf et al. [30] calculated 39% N reduction by WBZs in an agricultural Odense River catchment.
The aforementioned regional studies are certainly not sufficient in drawing general conclusions, especially given their different approaches and regional specificity. Moreover, few of them tried to assess the maximum possible nutrient removal without being constrained by politically or economically defined targets or by availability of land. However, these constraints can be removed by administrative, financial, or legal instruments as soon as society/policy demands it. Therefore, we see an urgent need for more studies demonstrating the total, uncompromised potential of purifying waters with WBZs on the catchment scale, as well as the need to assess costs of such scenarios from various parts of the world, as the implementation of WBZs should be undertaken globally on a large scale and fast, if we want to combat the galloping threat of eutrophication.
In our study, we modelled environmental gains arising from catchment-wide implementation of WBZs and calculated costs and benefits of their creation in all ecologically suitable locations. This was completed within the large catchment of the Narew River in north-eastern Poland, which is dominantly cultivated for agricultural usage. Poland provides an interesting landscape for exercising WBZ scenarios, given its large share of agricultural area, small scale land ownership structure, and membership in the European Union (EU). The main areas of legislation relevant for WBZ planning and establishment are Common Agricultural Policy (CAP) and WFD, which can both facilitate and constraint WBZ creation. Polish riverine landscapes have a shorter history of intensive agricultural pressure than the West European equivalents, notably due to the lack of 18–19th century land amalgamation processes, which resulted in low-intensity agriculture persisting in Poland until the late 1990s. Nevertheless, the majority of small rivers have been trained and channelized, along with the drainage of 86% of peatlands [31] and an even higher percentage of other wetlands. Larger rivers, such as Narew, have maintained a more natural hydromorphology along most of their courses, which allows us to hypothesize that part of the natural nutrient removal processes have also been preserved to a large extent. Recent years have witnessed a come-back of river training and dredging works [32], further handicapping their ecological status [33] and nutrient removal capabilities. The present study is also an attempt to argue for diverting these destructive trends.

2. Materials and Methods

2.1. Study Area—Studied Sub-Catchments and Narew Catchment for Upscaling

The River Narew is the most prominent among the right-bank tributaries of the Vistula River. Its length is 484 km (in Poland 448 km), and the basin area is 75,175 km2 (in Poland 53,873 km2). Narew flows out at an altitude of 159 m above sea level in the peatlands at the southeast edge of the Białowieża Forest in Belarus. In Poland, the Narew catchment covers heights (Białostocka, Wysokomazowiecka, Kolneńska, Ciechanowska) and lowlands (Kotlina Biebrzańska, Równina Kurpiowska, Pojezierze Mazurskie) in the north-eastern part of the country. Average annual air temperature in the Narew catchment reaches 7.1 °C, and average annual rainfall is approximately 600 mm [34].
For the upscaling process, we chose one third of the Polish part of the Narew catchment in order to keep a uniform character of the analysed area—the lowland agricultural area. We excluded the Kotlina Biebrzańska and Pojezierze Mazurskie, due to their differing characteristics in comparison to the rest of the catchment—higher naturalness of the landscape, a large number of lakes, high cover by forests and mires, and a lower percentage of agricultural land. We also excluded part of the catchment downstream of Zambski Kościelne because of the presence of a measurement station in Zambski Kościelne closing the modelled catchment hydrologically. The total area of the analysed part of the Narew catchment is 16,444 km2 (Figure 1), that is, around 5% of the area of Poland.
To fully represent the variability of the selected part of Narew catchment, we designated five sub-catchments within its boundaries—catchments of Narew tributaries: Skroda, Łojewek, Ruż, Róż, and Różanica. In the sub-catchments of Skroda, Ruż, and Róż there are relatively large areas of drained fens (Figure 1c). Along the Różanica and Skroda Rivers, some small areas of undrained fen woodlands occur. Łojewek flows from the Kolneńska Height and has a fast-flowing character with mostly mineral river banks. All sub-catchments are covered mostly by agricultural area (Figure 1d). Peatlands were found on the basis of a Polish peatland database [35] and aerial images (Google Earth, CNS/Airbus), whereas agricultural areas were found on the basis of CORINE Land Cover database [36].

2.2. Classification of WBZs

We analysed landscape settings and potential nutrient removal mechanisms in various WBZs in order to prepare the classification of WBZs that can be used further in our work.

2.3. Nitrogen Load Modelling

For each of the test sites, N loads (Nl) were modelled using the following empirical equation [37]:
Nl = 1.124 × exp(−3.080 + 0.758 × lnH − 0.0030 × S + 0.0249 × D)
where H stands for average annual runoff (mm), S stands for the percentage of sandy soils in the catchment, and D stands for the percentage of agricultural areas within the river catchment. The given algorithm has been successfully applied in European lowland catchments of similar hydrogeological setup and agricultural use [38]. Nitrogen loads were calculated for each individual watershed of each particular WBZ. Boundaries of catchments of particular WBZs were assessed on the basis of digital elevation models. The value of the parameter S was calculated on the basis of the geological map of Poland in the scale of 1:500,000. The value of the parameter D was derived from the land cover map performed on the basis of aerial pictures of the research area. Values of H for each of the test catchments were calculated on the basis of river discharge data available in the public domain for particular rivers studied in our approach from Institute of Meteorology and Water Management—National Research Institute, Poland. Empirical Equation (1), used in this study for nitrogen load calculation, was validated against the measured data for the Narew catchment (at Zambski Kościelne gauging station and water quality monitoring point Narew—Pułtusk, covering 27,800 km2 of the catchment area). Total nitrogen (TN) concentrations and discharge data spanning from 2000 to 2018 was used to calculate the average loadings at the catchment scale and was compared to estimations on the basis of empirical equation. TN load based on measurements was equal to 3.68 kg N/ha, whereas TN load based on empirical equation was equal to 3.98 kg N/ha, which gave the relative difference at a level of 8%, a value we considered acceptable for the purpose of our study.

2.4. Nitrogen Removal Assessment

The assessment of N removal efficiency followed a world-wide meta-analysis of 93 studies by Land et al. [22] with a median removal efficiency of 37% and a maximal efficiency of 93%. Taking into account that the width of the majority of linear WBZs in our analysis was around 2 m, Mayer et al. [16] showed that the average N removal efficiency for a 2 m wide WBZ was 48%. As this value is still not lower than the median value given for a WBZ by Land et al. [22], we continued using the values given in the latter study. It was assumed that from the nutrients that were removed from waters entering a WBZ, the majority would be removed within the first zone [20], which enabled us to refer to the length of a watercourse bordering the WBZ rather than taking the specific WBZ area into account. In the case of floodplain WBZs, we used other methods of calculating N removal. The size of the flooded area of a floodplain is an important factor for calculating the amount of N removed [39]. Following the results of Venterink et al. [39], we assumed that 8 kg N ha−1 year−1 would be removed in floodplains in the “median” variant, and 100 kg N ha−1 year−1 would be removed in floodplains in “maximum” variant.
After summarizing N removal efficiency for all of the WBZs in a sub-catchment (according to scenario 1 or 2), we divided the removed volume of N by the total yearly N load from whole sub-catchment, obtaining the N removal efficiency of WBZs according to the scenario 1 (polygonal WBZs) or 2 (linear WBZs).

2.5. Phosphorus Load, Removal Efficiency, and Risk of Remobilisation from Rewetted Peatlands

Maximal potential P load was estimated as 30% of the N load on the basis of 2018 Polish statistical yearbook data [40] from the proportion of N and P in fertilizer usage in Mazowieckie and Podlaskie voivodeships.
P removal efficiency was calculated similarly to N on the basis of median (46%) and maximal (99%) total P removal efficiency reported by Land et al. [22]. In case of floodplains, we used data obtained by Walling and Blake [41], summarizing P sedimentation in floodplains, a process that is dependent on the size of the floodplain—we used 13 kg P ha−1 year−1 removed in the “median” variant and 116 kg P ha−1 year−1 removed in the “maximum” variant.
Additionally, we assessed the risk of P mobilisation from rewetted fens proposed as WBZs in scenario 1. It was proven elsewhere that a risk of P loss exists if molar iron (Fe) to phosphorus (P) ratios are lower than 10 in upper heavily decomposed soil layers [23,42,43]. To estimate Fe:P ratio, we sampled peat from the large drained fens proposed as being rewetted as a WBZ (Figure 2). A total of 48 sampling points were distributed evenly in 12 sampling transects perpendicular to the river (four transects in the Skroda sub-catchment, three transects in each of the Róż and Ruż sub-catchments, two transects in the Różanica sub-catchment). At each sampling point, peat was sampled from two depths (10–30 cm and 40–60 cm if peat was present until such a depth). Altogether, 91 peat samples were taken for further analyses. Samples were transported cooled (ca. 4 °C) to the laboratory of Leibniz-Institute of Freshwater Ecology and Inland Fisheries in Berlin (Germany) and proceeded for soil analysis within 1 week.
To determine the amount of P and Fe, which can be mobilized under anoxic conditions by biotic or abiotic redox processes, 10 g of fresh (i.e., wet) peat was extracted with a 0.11 mol L−1 bicarbonate dithionite (BD) solution (subsequent to an ammonium chloride extraction step) in accordance with [44]. Because of probable analytical interferences with humic substances in the BD extracts, the dissolved P was measured after acid digestion as soluble reactive phosphorus (SRP). For that purpose, the BD extract was filtered through Sartorius Minisart syringe filters (cellulose acetate membrane; 0.45 µm pore size). To 1 mL aliquot of the filtered extract 2 mL 10 M H2SO4, 2 mL 30% H2O2 and 20 mL deionized water were added and digested at 160 °C for 6 h. Accordingly, inorganic P and organic P were not distinguishable. SRP concentrations were analysed by using the molybdenum blue method (Cary IE; Varian, Darmstadt, Germany) according to [45], and Fe by flame atomic emission spectrometry (Perkin Elmer 3300).
The resulting values from a WBZ were averaged to give a mean Fe:P ratio for the entire WBZ. For WBZs where peat samples were not taken, the Fe:P ratio value was extrapolated on the basis of the average value of all the sampled peat sites in a sub-catchment. For sites with a Fe:P ratio ≤11, we calculated the amount of total P (TP) that could be released after rewetting of the whole area proposed as WBZ type rewetted fen, using the equation modified after [43]:
TPrelease = 0.1313 × (FeBD:PBD)−0.955 [kg ha−1 mm−1] × D [mm year−1]
where FeBD:PBD is the molar ratio of bicarbonate-dithionite-extractable iron and phosphorus of peat, and D is discharge calculated as 25% of the yearly precipitation in the WBZ catchment.

2.6. Scenarios of WBZ Implementation

Two WBZ implementation scenarios were applied: (1) polygonal WBZs in all ecologically suitable sites, and (2) linear WBZs along all the rivers in all ecologically suitable locations.

2.7. Costs and Benefits Analysis of Potential WBZ Creation

The total costs of interventions necessary for the establishment of each WBZ were calculated using catalogues of engineering works used for investment budgeting [46]. They included unit costs of work per cubic metre (e.g., excavation works), per metre (e.g., stabilization of the sides of newly developed channel), per hectare (e.g., bushes removal), as well as costs of materials, fuel, transport of machines, and labour. Where necessary, land purchase costs were added with the land area appropriate for a given WBZ, assuming unit costs (per hectare) of land purchase representative for a given region of the country. Average costs of arable land of medium quality class were used here following statistic for Poland actual as for June 2019 [47], with accuracy of calculations relevant for the concept phase.
For polygonal wetland buffer zones, we also included indirect cost of their development, connected with their exploitation phase and impacting the WBZ area, for example, changes in the ground water level or changes in frequency of over-bank flows. All of them imply a decrease of intensity of agriculture and changes in types of most profitable crops, resulting in a decreased income of farmers that should be compensated in WBZ development programs. To calculate the required compensation, we compared the income possible after WBZ creation, that is, re-established flooding on mineral soil or rewetting fens (wet grasslands) against the income generated by various kinds of conventional high or medium intensity of farming (maize, canola, fodder, hay, hay silage). The average difference between these two categories of income was taken as a compensation cost. Polish agricultural advisory centres calculate budgets for different kinds of agricultural production [48], which were used as a reference in our calculations of compensation values per hectare per year.
The costs of creation were dependent on the WBZ type selected according to the classification developed in this study. Costs of WBZs that already exist were assumed as being zero. Costs are given in EUR, value added tax (VAT) included.

2.8. Upscaling

Upscaling was carried out in order to extrapolate results obtained in the five sub-catchments to the whole analysed section of the lower Narew catchment. Firstly, the Narew River with its valley was excluded in order to be treated separately, because the studied sub-catchments of small tributaries of the Narew should be extrapolated to catchments of similar size, not to a large river with extensive floodplains such as the Narew. The analysis for the Narew River valley consisted of the designation of natural floodplains on the basis of aerial images (Google Earth, CNS/Airbus) in order to complement the results obtained from the upscaling with potential N and P removal in natural Narew floodplains.
Afterwards, we calculated the potential length of linear WBZs. We manually inspected all the rivers in the Narew catchment from aerial images (Google Earth, CNS/Airbus) in order to identify the shape of their riverbed and meandering rivers. We decided to keep the same percentage of all “meandering rivers” (existing and to be created) as well as WBZ types “two stage channel” and “wetland bank” in all linear WBZ types in studied sub-catchments and in the Narew catchment. After field inspection of the Narew catchment, we found that the straight riverbeds generally do not have wetland banks and two stage channels. Thus, we generalized that all WBZ types of “two stage channel” and “wetland bank” should be created de novo.
Finally, we calculated the area of polygonal WBZs. The percentage of peatlands in the five sub-catchments as well as in the Narew catchment were found to be similar (around 7%; [35]) and both the sub-catchments and the whole Narew catchment consist primarily of agricultural land. Thus, we assumed that the percentage of land covered by WBZs as well as share of different types of potential polygonal WBZs in the Narew catchment are the same as in the sub-catchments.
In our upscaling, we estimated the total N load from the whole analysed part of the Narew catchment following the same methods as those for sub-catchments and WBZs.
Total WBZ establishment costs calculated for each sub-catchment were averaged per kilometre of watercourse (for linear WBZs) or per unit area (for polygonal WBZs), enabling extrapolation over the lower Narew catchment. In the same way, costs of income forgone (per hectare) were calculated for selected polygonal WBZs that were planned for floodplain restoration and also for fen rewetting.

3. Results and Discussion

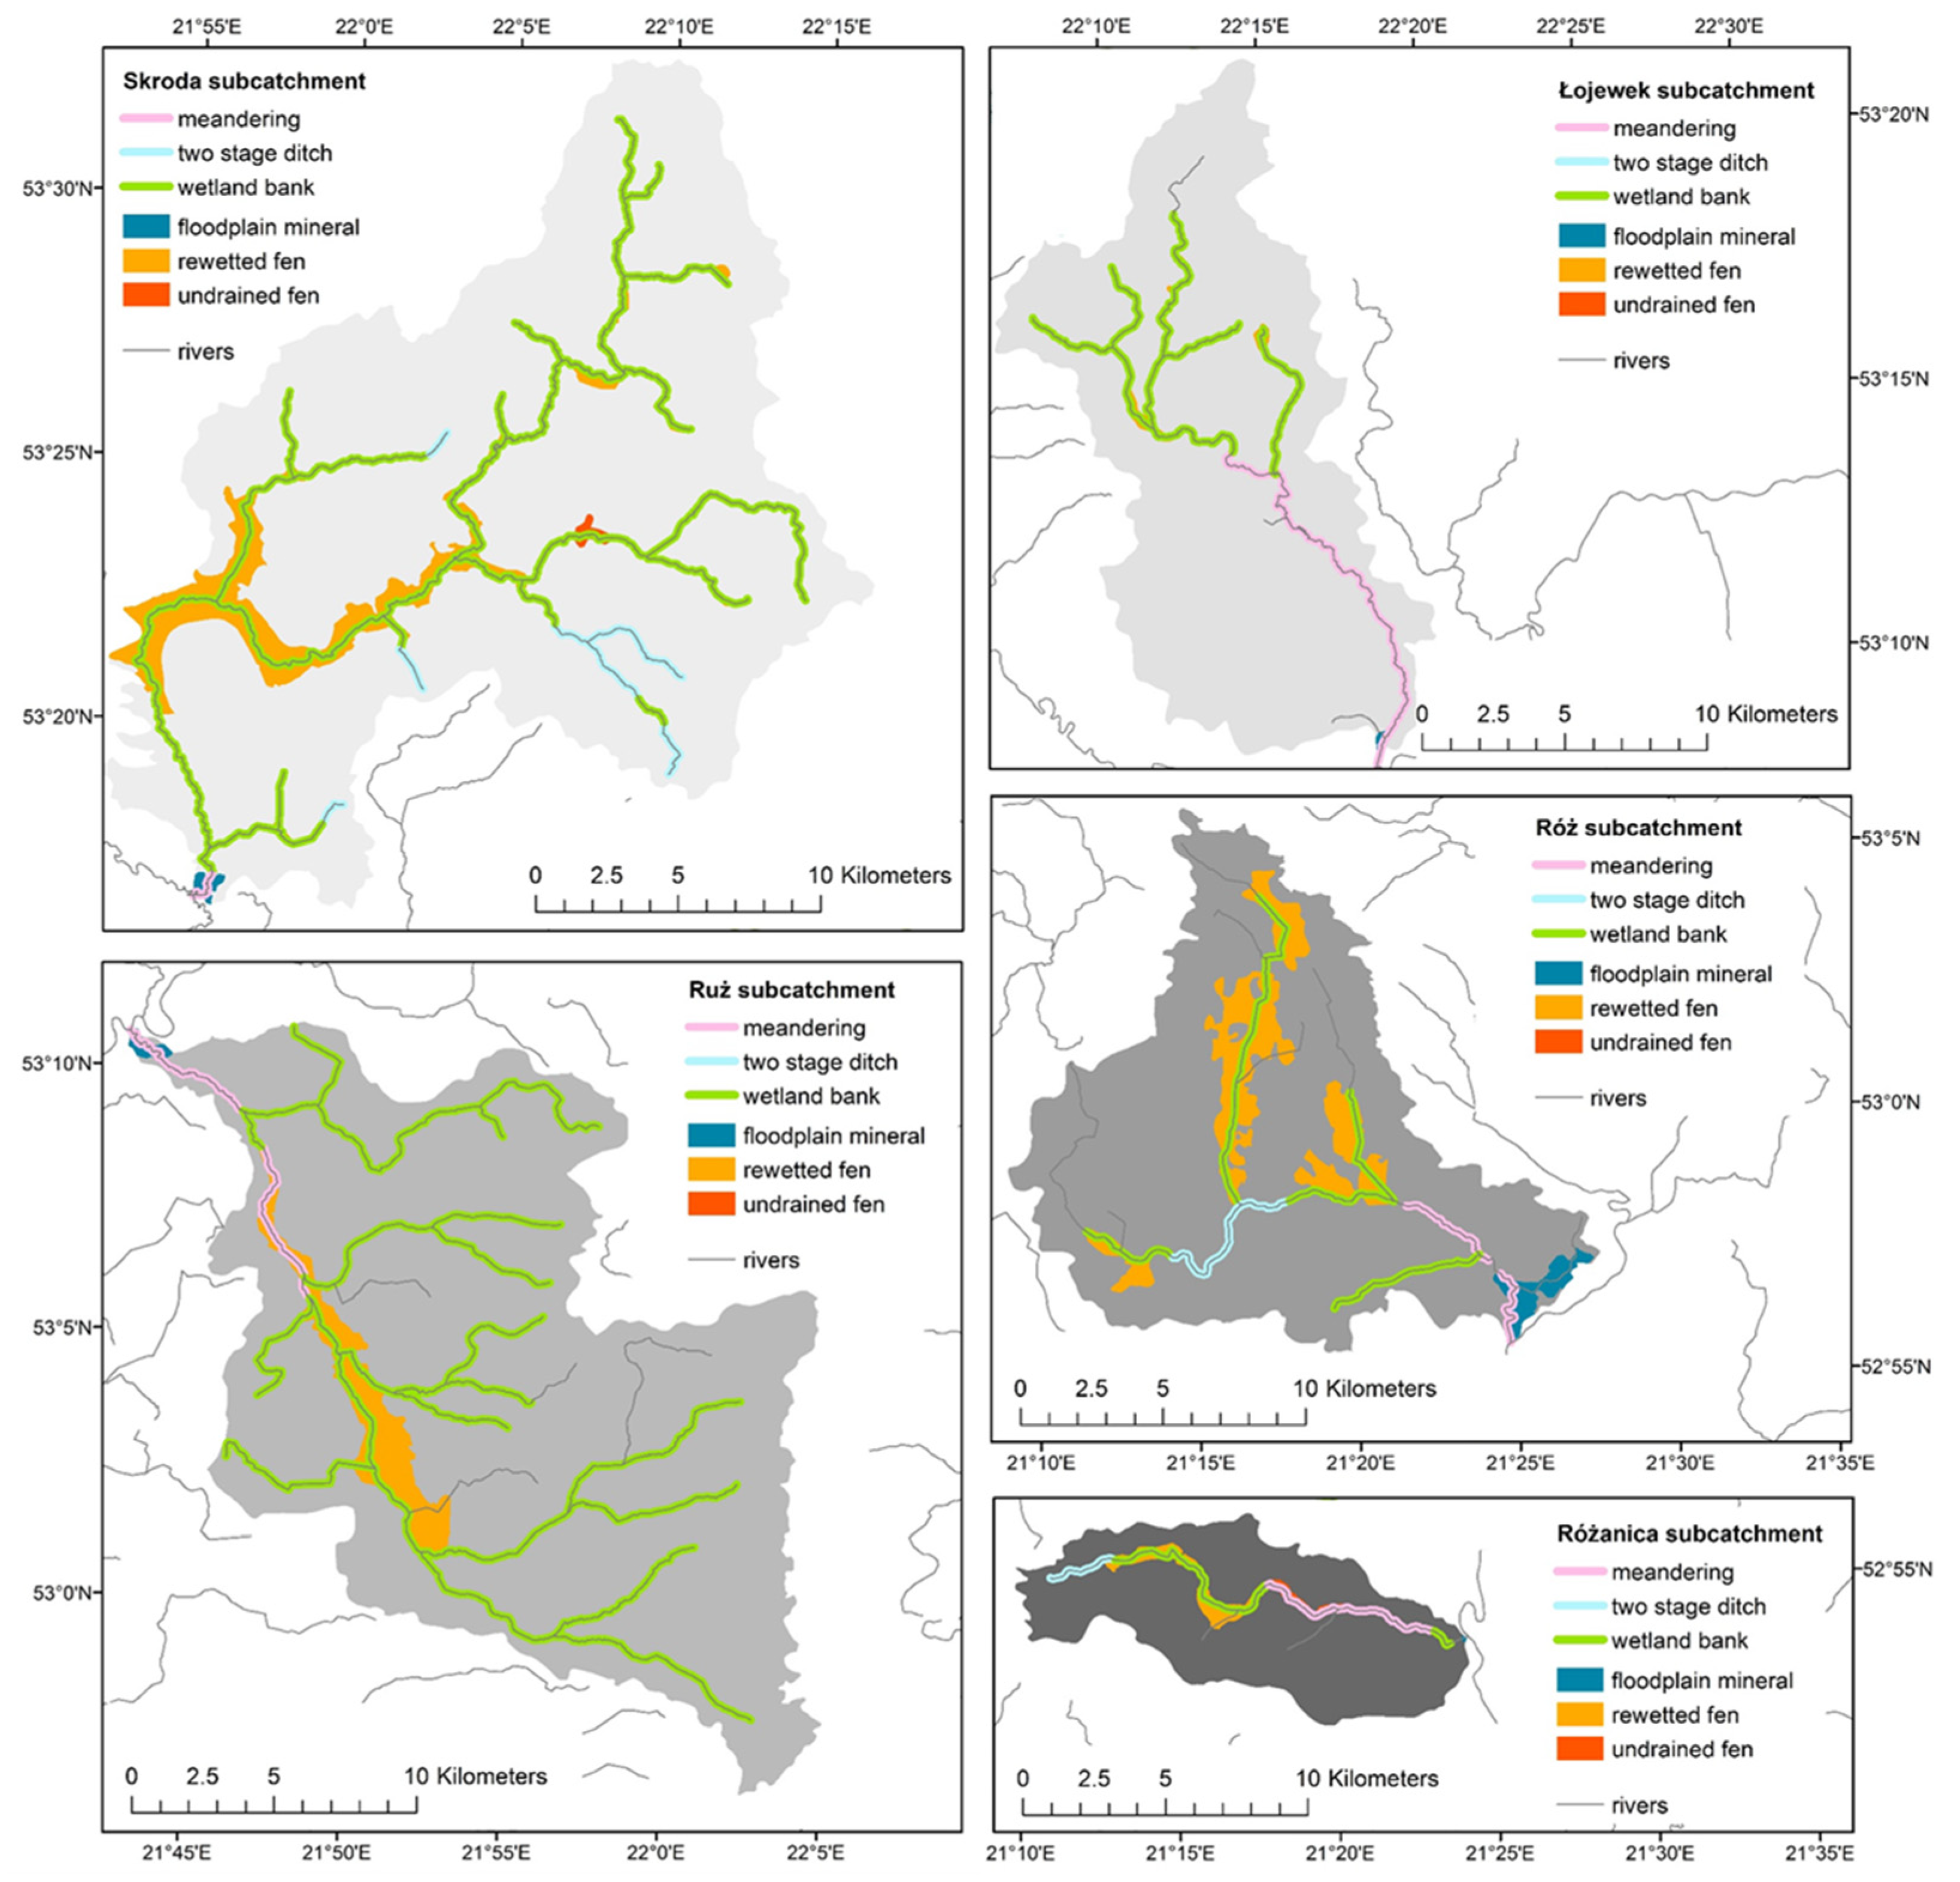
3.1. Classification of WBZs and Their Delineation in the Sub-Catchments

We classified WBZs into the following seven types—three linear and four polygonal, varying in functionalities and landscape settings promoting each type (Table 1). For the more detailed description of each type, see Supplementary S1. Polygonal and linear WBZs of the appropriate type were then delineated in the five studied sub-catchments in all ecologically suitable locations (Figure 2).

3.2. Nitrogen Load and Removal

In scenario 1, the average N removal in the sub-catchments was 11% of the N load from the whole sub-catchment (maximally 30%) (Table 2). The area of polygonal WBZs in scenario 1 was on average 7% of the sub-catchment area (Table 2). The length of watercourses bordering the designated polygonal WBZs was on average around 30% of the total river length in the sub-catchments. In scenario 2, N removal was higher with an average of 33% (maximally 82%), due to a much higher share of the length of linear WBZs to the total river length (on average 86%) than for polygonal WBZs (Table 2).
In our upscaling, the total yearly N load to the river from the analysed part of the Narew catchment was 12,746 tonnes. It is estimated that Polish rivers deliver annually around 140,000 tonnes of TN and 13,000 tonnes of TP to the Baltic Sea (24% TN and 43% TP of the overall riverine load to the Baltic Sea), including around 98,000 tonnes TN and around 7000 tonnes TP from non-point sources [49]. Given that the analysed part of the lower Narew catchment covers around 5% of the area of Poland, its proportional share in yearly N load to the Baltic Sea is 4900 tonnes TN. This is 39% of the N load calculated in our study from the same area. This is consistent with the estimations that N retention within the surface waters in the Vistula basin reaches around 45%–60% [49]. However, it must be remembered that the data reported by HELCOM [49] are averaged for the whole Vistula basin, which has regionally differentiated agricultural intensity, and thus the TN load from the analysed part of the Narew catchment may be lower than the around 5% of the total riverine TN load from non-point sources to the Baltic Sea from Poland. It is not higher than 13% (12,746 tonnes TN year−1).
We estimated that creation of polygonal WBZs in all suitable locations (scenario 1) would allow for the decrease of N load to the rivers by 11% (or in a maximum variant 30%), whereas creation of linear WBZs in all ecologically suitable sections of the Narew tributaries (scenario 2) would allow for 33% (or in a maximum variant 82%) reduction (Table 2). When the N removal potential of the natural Narew River is also included in the calculations, N loads may be even further reduced, because around 265 tonnes N year−1 may be removed in the Narew floodplains in the “median” variant and around 3315 tonnes N year−1 in the “maximum” variant. However this opportunity to include the Narew floodplains in the calculations would require additional field research in order to reveal the role of a large floodplain in nutrient removal from (mainly flood) waters reaching a particular river stretch of a well-developed and near-natural riparian zone.
According to the HELCOM Baltic Sea Action Plan [50], Poland has to reduce its annual TN load to the Baltic Sea by around 43,000 tonnes TN, which is nearly 50% of TN load from riverine non-point sources in Poland. This goal could be considered feasible if WBZs were established along the majority of small watercourses.

3.3. Phosphorus Load, Removal, and Remobilisation
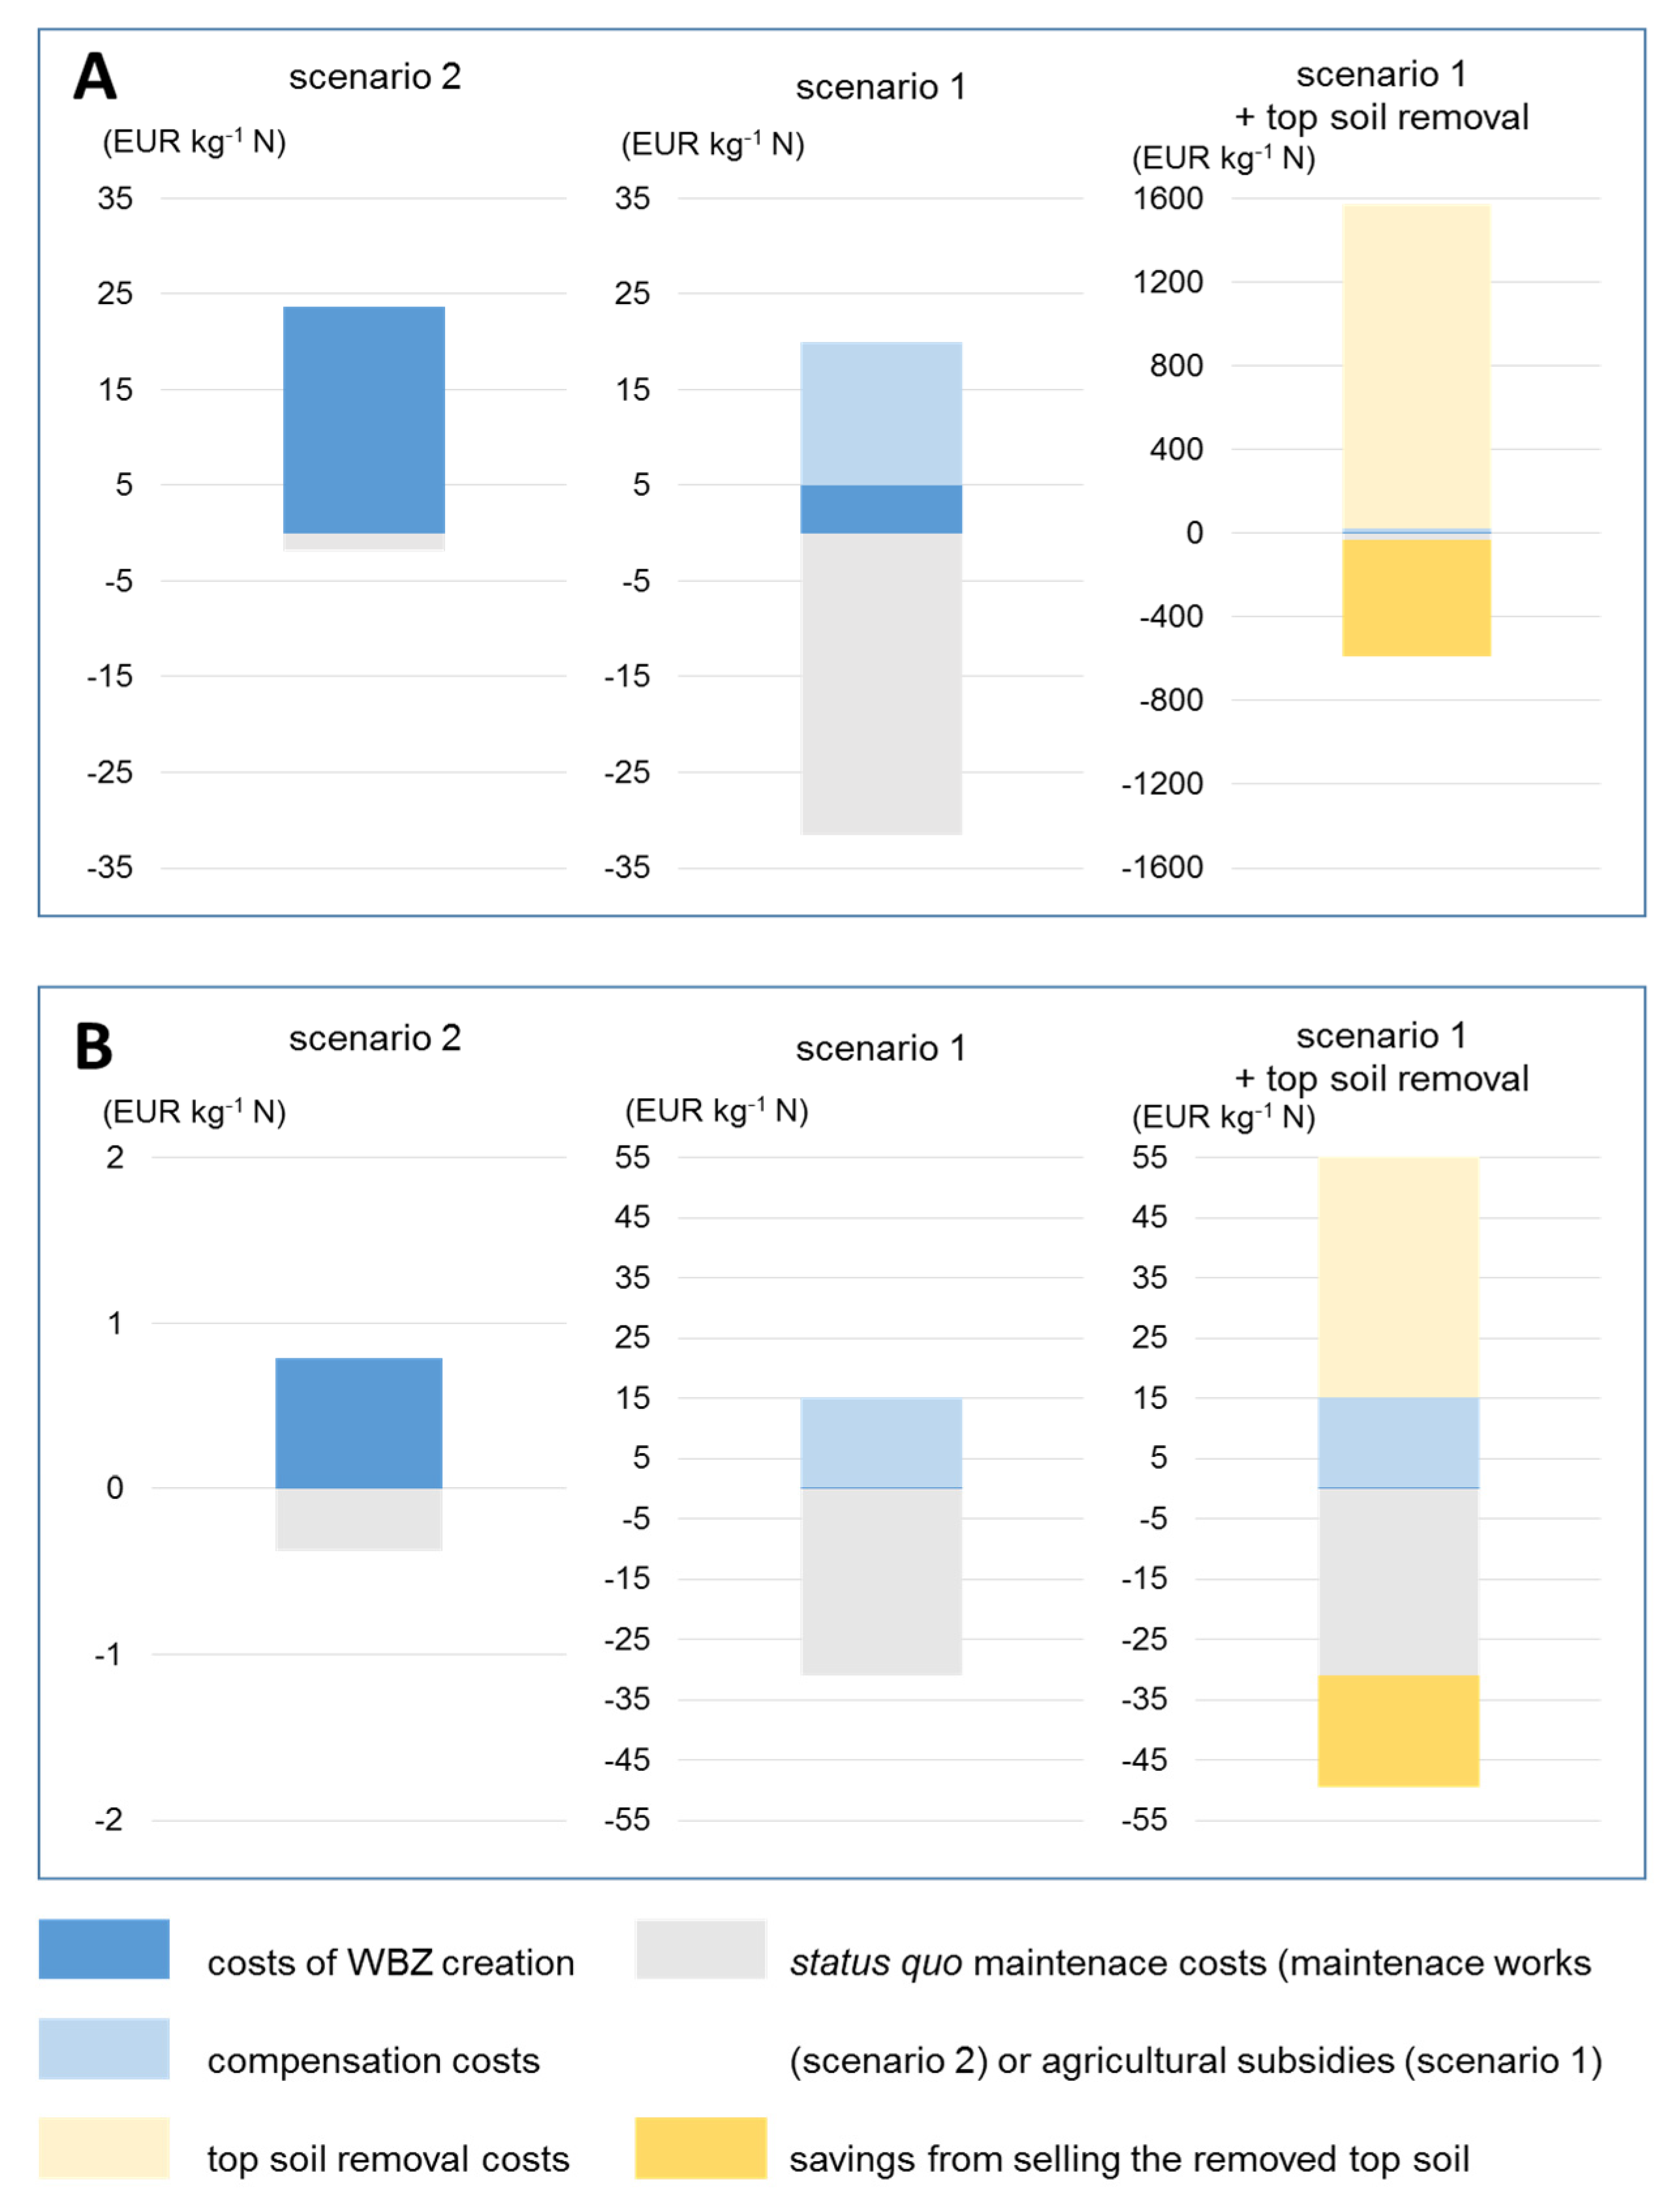
Soil chemistry varied between analysed peatlands in different sub-catchments, in particular the iron to phosphorous ratio, which acted as a suitable proxy for P risk assessment (Figure 3).
The average, estimated P removal in the sub-catchments was 14% of the P load from the entire sub-catchment (maximally 42%) for scenario 1, with scenario 2 returning an average of 41% (maximally 87%) (Table 3). Our estimates regarding P were more uncertain than our calculations for N. The amount of riverine, non-point source TP load coming to the Baltic Sea from the analysed part of the Narew catchment (5% area of Poland), may be estimated on the basis of HELCOM reports [49] as being around 350 tonnes TP, whereas we assumed it to be around 3800 tonnes on the basis of the proportion of N to P fertilizer use.
The risk of P load to downstream systems is increased if the rewetted, degraded fen has low molar Fe:P ratios (<10). Among WBZs in target sub-catchments, we identified three polygonal WBZs with potential for P mobilization (one in Róż, one in Ruż, and one in Skroda sub-catchment; Figure 3, Table 3). Excessive P loss from rewetted fens can be mitigated downstream by floodplain-type WBZs or prevented in situ by removing the top layer of degraded peat [51].
The creation of floodplain-type WBZs downstream in each sub-catchment (which was included in scenario 1) and protection of the natural, vast Narew floodplains allows for the capturing of phosphate, which will adsorb to mineral particles suspended in water. Soil particles may be deposited on river floodplains during flooding events, building up new sediment layers in low energy parts of the river course. The phosphate can eventually become partly incorporated into local biological cycles and subsequently removed through biomass harvesting. Our estimations show that the amount of P remobilized from rewetted fens in Narew sub-catchments may be around 2–3 kg ha−1 year−1. The potential for P removal in floodplains can be from 13 to 116 kg P ha−1 year−1 [41], and thus the area of floodplain downstream required to compensate for the additional P loading from rewetting of drained fens could be several times smaller than the actual area of rewetted fen itself. In the case of the Róż catchment, we calculated the polygonal WBZs as being able to remove up to 100% of the agricultural P load (Table 3), but their potential of P removal may be even higher, in total, up to 53,720 kg P year−1. Thus, after removing 100% of the agricultural P load, they still have the potential to remove around 9725 kg P year−1, which is more than double of that which would be required to remove the P that is potentially remobilized from rewetted fens in the Róż catchment (4171 kg P year−1, Table 3). This could be possible due to the relatively large floodplain WBZ proposed in the downstream area of this sub-catchment. Additionally, the large P removal could also be achieved in the Narew’s vast, natural floodplains.
Top soil removal from the drained fens prior to rewetting can be a suitable method to re-establish low-nutrient conditions and facilitate the recolonization by peat-forming plants [52]. However, it is a very expensive measure. Costs of such activity were estimated for WBZs using three different case-by-case approaches, considering different transport distances [46]. Costs of topsoil removal would be 200–1500 times higher (when the top soil is transported for a distance of just 10 km) than the cost of rewetted fen WBZ establishment. However, the market for excavated topsoil from degraded peatland exists [53,54], and these costs might be reduced by 10%–36% through sale of the extracted peat, depending on transport distance (50 km and 10 km respectively) (Table 4).

3.4. Overall Costs

In the assumed scenarios, implementing WBZs on 5% of the area of Poland seems very expensive (Table 5). Direct cost estimated for polygonal WBZs (scenario 1) approached 8.9 million EUR, with indirect compensation costs at the level of 26.4 million EUR per year. For linear WBZs (scenario 2), the estimated costs reached the level of 170.8 million EUR.
Analysis of the expenses for projects within the Polish Operational Program “Infrastructure and Environment” for the years 2014–2020 allowed for the comparison of WBZ development scenarios to some expenditures performed under this program. It is co-financed by EU funds, mainly from the Cohesion Fund and the European Regional Development Fund. Analysing financial support aimed at water and wastewater management in agglomerations [55], one can reveal that the value of WBZ development under scenario 1 in the Narew catchment corresponds to 0.2% of the total value of the 357 supported projects. Under scenario 2, it corresponds to 4.6% of the total value. Another valuable comparison for the financial viability of WBZ scenario implementation is to a randomly selected transport project financed under the Operational Program. This shows that the redirection of funds from only 1 out of the 53 projects in the Trans-European Transport Network (e.g., a 42 km long expressway in south-eastern Poland) [55] could make “wetland utopia” in the scale of Narew catchment happen, even at twice the currently planned costs. One can conclude that implementing WBZs therefore remains a matter of choosing appropriate priorities, rather than budgeting problems, as frequently claimed by stakeholders as the primary reason for their indifference towards restoration of valley wetlands. Being ambitious on the subject of WBZs, we believe that budget is not a hindrance, and that wetland restoration for nutrient retention and water quality improvement is possible.
Through analysing expenses on construction works and necessary land purchase, a two channel is the most expensive solution per unit length among linear types of WBZs. Wetland bank construction is cheaper with regard to unit costs—the total expenditure defined in scenario 2 for establishment of this type of WBZ represents 27% of total scenario 2 costs, whereas wetland banks cover almost 90% of the linear WBZ length. Creation of linear WBZs may limit the need for maintenance works (dredging) for small, regulated streams in agricultural landscapes. The broadened riverbed of two stage channel would contain potential floodwater. Furthermore, functional WBZs of this type will allow for spontaneous meandering of the water channel, including vegetation overgrowth and encroachment, augmented with changes in morphology of base flow channel. Thus, costs of annual maintenance works may be reduced. For proposed two stage channels, avoiding the cost of deposited sediment removal yields annual benefits at the level of 90,000 EUR at the sub-catchments’ scale and as much as 1.28 million EUR in Narew catchment scale. Significant savings might also be noted for wetland bank type of designated WBZ—661,000 and 9.31 million EUR, respectively. If summed up, the avoided costs for maintenance works only in one year correspond with 9% of funds needed for scenario 2 implementation.
In this context, the required compensation for farmers’ income decrease driven by changes in the ground water level or changes in the frequency of overbank flows must be also calculated. For this purpose, we compared the income that is possible with water conditions changed by establishment of floodplains on mineral soil or rewetting fens against the income possible with various kinds of conventional production at high or medium intensity of farming. The average difference between these two incomes (291 EUR ha−1 year−1) was taken as a compensation cost (summarized for all WBZ in each sub-catchment and the analysed part of Narew catchment in Table 5). This means, the total cost of compensation might be perceived as high, especially compared to costs of polygonal WBZ construction. However, its level per unit area is comparable to payments dedicated to protection of habitats—semi-natural wet grasslands (214 EUR/ha) and fens (283 EUR/ha) under agri-environment-climate schemes in Poland in the years 2014–2020 [56,57,58].
Costs of creating polygonal WBZs reach 97 EUR ha−1 and additionally 291 EUR ha−1 year−1 of compensation, whereas costs of creation of linear WBZ reach around 27,000 EUR ha−1. If we recalculate it per length of a watercourse bordering the WBZ, the costs of polygonal WBZ creation are around 5000 EUR km−1 plus 15,000 EUR km−1 year−1, whereas linear WBZs would cost around 24,000 EUR km−1. The differences result from the fact that it is technically easier and financially more effective to implement a large rewetted fen than to restore degraded regulated watercourses into rivers with more or less natural wetland banks. Polygonal WBZs are cheaper but they do not capture the whole water reaching rivers, and thus they remove only a part of the total N agricultural load, even if implemented in all available locations. However, polygonal WBZs have an additional carbon storage function and may foster local economies through paludiculture due to the large areas covered. Thus, the most cost-effective solution is to make polygonal WBZs wherever possible and supplement them with the linear forms along the remaining available parts of watercourses.
We combined the one-off costs of establishing WBZs with yearly costs of compensation for landowners and compared them with current status quo maintenance costs (dredging and existing CAP subsidies) using 30 year scenarios (Figure 4; costs re-calculated for the amount of N). The 30 year period was chosen in order to set the end of the scenario for 2050, an important deadline for reaching climate neutrality within the European Green Deal, which also stated the plans of implementing a “zero pollution action plan for air, water and soil” [59]. Distributed over 30 years, high costs of establishing WBZs and even the high costs of topsoil removal applied to mitigate P remobilization from rewetted peats are almost completely counterbalanced by avoided costs of the current status quo maintenance. In the case of linear WBZs, their establishment and management turn out to be far more economical long term, when compared with analysis over shorter time periods.

3.5. Synergies and Co-Benefits

Drained organic soils are a source of substantial emissions of carbon dioxide (CO2) and nitrous oxide to the atmosphere [61]. Rewetting these soils may not only reduce greenhouse gas emissions, but also create a favourable environment for return of the C sink function, which is characteristic of well-functioning organic soils [62,63]. Rewetting increases CH4 emissions [64], which shortly after rewetting tend to rise. However, a meta-analysis of available data shows that CH4 emissions from rewetted peatlands do not differ significantly from undrained ones [65] and are order of magnitude smaller (in CO2 equivalents) than CO2 emissions from drained peat.
Rewetting of fens is a very cost-effective climate change mitigation method. The costs of reducing CO2 emissions by polygonal WBZs on organic soils are lower than the costs of its reduction through implementing biogas or wind power generation [17]. Our calculation follows the German case from Mecklenburg-Western Pomerania region, where 980,000 ha of degraded peatlands under agricultural use release 20 million tonnes of CO2 equivalents per year [62]. Applying these data, rewetting fens in the five analysed sub-catchments of Narew equates to an estimated 142,000 tonnes of avoided emissions of CO2 equivalents. Protection of existing undrained fens and restoration of degraded fens (around 90,000 ha in total) could guarantee avoiding emissions of 1.93 million tonnes of CO2 equivalents per year in Narew catchment. This amounts to 85% of the emissions from Ostrołęka B power plant [66], located in the region and being ranked as 12th among the largest plants in Poland.
The synergy between climate protection and nutrient removal is further enhanced by paludiculture, that is, the productive agricultural use of rewetted peatlands. Paludiculture or, more generally, wetland agriculture, can assist in the process of establishing WBZs in at least two ways. Firstly, this concept allows for the maintenance of agricultural land use after rewetting, thereby removing the need to purchase land from farmers for WBZs, or conversely negating the loss of arable land available to the farmers. Secondly, harvesting plants adds an extra mechanism of nutrient removal, which is important, particularly in the case of P removal in P-polluted areas, such as drained fens with legacies of long agricultural use. However, the idea of paludiculture is still in its early development stage and market niches for paludiculture products are not developed yet. In the shift from dryland agriculture to growing and harvesting wetland plants, much has to change at the farm level—from machinery, through processing technologies, to the new networks of customers. Therefore, stimulation of the change from drainage-based agriculture to wet agriculture needs to be stimulated, for instance, by targeted subsidies within CAP or other financial instruments.
In this study, we did not attempt to quantify other ecosystem services that also come as synergies in riverine wetland restoration programs. Water retention for mitigating droughts and floods is clearly enlarged by WBZ restoration and thus the avoided flood or drought losses should be added on the benefits side. This function of riverine wetlands is especially important as an adaptation to climate change. Widespread (re-)establishment of WBZs along rivers can also help to protect biodiversity, both as habitats of wetland plants and animals, as well as temporary refuges of certain species, for example, sites for fish spawning and rearing of fry, habitats for the larval stage of many insect species, or migration corridors for multiple animals and plants. Last but not least, restoration of wetland buffers changes the outlook of a river and provides new experience-values to people, classified as cultural ecosystem services. According to recent estimates [67], these services are highly valued in Poland, as well as in Germany and Denmark, pointing to a potentially high societal support for riverine restoration programs.

3.6. Implementation Challenges

The majority of European peatlands are currently used for agriculture and forestry purposes [68]. Land use type and land use intensity differ in a wide range, and both are controlled by site-specific factors, as well as regional socio-economic conditions. There is a clear need to strengthen links between the restoration of ecological and biogeochemical functioning of peatlands and their wider benefits to society. Despite the high demand for N retention, there are no examples of a functioning N market so far. First attempts are currently made in Germany, in order to examine to what extent nitrogen trading can be linked to carbon certificates of the MoorFutures project [69]. However, large scale WBZ creation projects are most viable if a farmer owns large, contiguous lands in river valleys or peatland areas. This is hard to find in many European countries, such as Poland, due to the fragmentation of ownership of the landscape. Cooperative agreements between all farmers of a river section would be conceivable, so that a cohesive floodplain area can be rewetted. Thus, the N value could be measured at the inlet and outlet of the rewetted area. Farmers would then be paid according to the size of their land share. In addition, the problem is that if farmers in Europe comply with existing fertilizer ordinances and reduce their livestock down to maximal two units per hectare, there is no reason for them to buy certificates in many areas. Therefore, each farmer could be given an emission value adjusted to his farm, which is limited to, for instance, 80% of the actual output. In order to meet legal requirements, they would need to reduce their N output or mandate someone to withhold N for them to compensate. This is how a market could arise. Furthermore, farmers can be held accountable at the regional level through the “polluter pays” principle. Either farmers give land for the creation of wetlands, or they pay for the creation of a wetland. Moreover, buyers and sellers will not participate in a trading program if the program has no tradable commodity. Pollution caps must be set below key ecological thresholds in order to achieve environmental goals, and market caps must be set at a point that will drive demand for credits to achieve active market trading.
Enabling support for restoration of fens and floodplains in the new EU financial perspective under the reformed CAP would help to implement these solutions aimed at improving surface water quality. Additionally, this would contribute towards climate change mitigation by reducing CO2 emissions from degraded peatlands and aid adaptation to climate change by buffering extreme water flows on floodplains and replenishing soil water.

3.7. Ignorance as a Barrier

Last but not least, an important barrier that should be overcome on the way to implementing WBZs on a large scale is the lack of awareness in society. To overcome this, education on the importance of wild river banks should be introduced at each level of society: all levels of schools (from kindergartens to universities), in mass media (trade as well as popular media), in agricultural adviser’s offices, and in nature protection offices, among others. However, we do believe that an important part of education can also be implemented at the direct stakeholder level. One way to achieve this is through demonstration studies highlighting the high cost-effectiveness of restoring multifunctional wetland buffers.

4. Conclusions

Wetland drainage becomes progressively costlier and simultaneously the negative ecological consequences increase over time. The integration of WBZs in the agricultural landscape is an effective tool for achieving good ecological status of water bodies as required by the European WFD. Specifically, space must be regained for rivers—not those confined to a regulated channel with steep banks, but those whose banks are wet and overgrown by wetland vegetation; rivers that are functionally connected to wetlands in their valleys. Intensification of agriculture has led to the conversion of almost the entire riverine area into fields and intensively used meadows. However, this has led to avalanche eutrophication in aquatic environments. In Poland, N rafting from agriculture constitutes about 70% of the N supplied each year by rivers to the Baltic Sea. Conserving the existing status quo (maintenance work on rivers, EU subsidies for riverside agricultural fields and meadows) is costly and unsuitable. In our work, we showed that the transfer of funds from the maintenance of the currently functioning, flawed system to a large-scale restoration programme of rivers and riverside wetlands is cost-effective and could significantly reduce the loss of N and P from agriculture to surface waters.

Supplementary Materials

The following is available online at https://www.mdpi.com/2073-4441/12/3/629/s1, Supplementary S1: Processes Driving Water Purification, Characteristics of Designated Types of Wetland Buffer Zones (WBZs), and the Scope of Work Needed to Create Each WBZ Type. References [23,70,71,72,73,74,75,76,77,78,79,80,81] are cited in the supplementary materials.

Author Contributions

Conceptualization, E.J., M.W., M.G., and W.K.; methodology, E.J., M.W., M.G., D.Z., C.C.H., and S.E.L.; field investigation, E.J., C.R.W., M.W., and W.K.; formal analysis, E.J., P.M., and M.W.; software, P.M., M.G., S.E.L., and E.J.; writing—original draft preparation, E.J., M.W., and W.K.; writing—review and editing, D.Z., M.G., and C.R.W.; visualization, E.J.; supervision, W.K.; project administration, M.W.; funding acquisition, W.K., E.J., M.G., D.Z., C.C.H., and M.T. All authors have read and agreed to the published version of the manuscript.

Funding

Authors would like to thank the EU and the Innovation Fund Denmark (Denmark), the Federal Ministry of Food and Agriculture (Germany), and the National Centre for Research and Development (Poland) for funding, in the frame of the collaborative international consortium CLEARANCE financed under the ERA-NET Cofund WaterWorks2015 Call. This ERA-NET is an integral part of the 2016 Joint Activities developed by the Water Challenges for a Changing World Joint Programme Initiative (Water JPI).

Conflicts of Interest

The authors declare no conflict of interest.

References

  1. Falkowski, P.; Scholes, R.J.; Boyle, E.; Canadell, J.; Canfield, D.; Elser, J.; Gruber, N.; Hibbard, K.; Högberg, P.; Linder, S.; et al. The global carbon cycle: A test of our knowledge of Earth as a system. Science 2000, 290, 291–296. [Google Scholar]
  2. Steffen, W.; Richardson, K.; Rockström, J.; Cornell, S.E.; Fetzer, I.; Bennett, E.M.; Biggs, R.; Carpenter, S.R.; De Vries, W.; De Wit, C.A.; et al. Planetary boundaries: Guiding human development on a changing planet. Science 2015, 347, 1259855. [Google Scholar] [CrossRef] [PubMed] [Green Version]
  3. Haber, F.; Le Rossignol, R. Production of Ammonia. U.S. Patent 1,202,995A, 31 October 1916. [Google Scholar]
  4. Erisman, J.; Galloway, S.M.; Klimont, Z.; Winiwarter, W. How a century of ammonia synthesis changed the world. Nat. Geosci. 2018, 1, 636–639. [Google Scholar] [CrossRef]
  5. Puckett, L.J. Nonpoint and point sources of nitrogen in major watersheds of the United States. USGS Water-Resour. Investig. Rep. 1994, 94–4001, 1–9. [Google Scholar]
  6. Torrecilla, N.J.; Galve, J.P.; Zaera, L.G.; Retamar, J.F.; Álvarez, A.N.A. Nutrient sources and dynamics in a Mediterranean fluvial regime (Ebro river, NE Spain) and their implications for water management. J. Hydrol. 2005, 304, 166–182. [Google Scholar] [CrossRef]
  7. Xin, X.; Yin, W.; Li, K. Estimation of non-point source pollution loads with flux method in Danjiangkou Reservoir area, China. Water Sci. Eng. 2017, 10, 134–142. [Google Scholar] [CrossRef]
  8. Kalcic, M.K.; Frankenberger, J.; Chaubey, I. Spatial Optimization of Six Conservation Practices Using Swat in Tile-Drained Agricultural Watersheds. J. Am. Water Resour. Assoc. 2015, 51, 956–972. [Google Scholar] [CrossRef]
  9. Rabotyagov, S.S.; Campbell, T.D.; White, M.; Arnold, J.G.; Atwood, J.; Norfleet, M.L.; Kling, C.L.; Gassman, P.W.; Valcu, A.; Richardson, J.; et al. Targeting efforts to reduce Gulf of Mexico hypoxia. Proc. Natl. Acad. Sci. USA 2014, 111, 18530–18535. [Google Scholar] [CrossRef] [Green Version]
  10. Xu, H.; Brown, D.G.; Moore, M.R.; Currie, W.S. Optimizing Spatial Land Management to Balance Water Quality and Economic Returns in a Lake Erie Watershed. Ecol. Econom. 2018, 145, 104–114. [Google Scholar] [CrossRef]
  11. Zak, D.; Kronvang, B.; Carstensen, M.V.; Hoffmann, C.C.; Kjeldgaard, A.; Larsen, S.E.; Audet, J.; Egemose, S.; Jorgensen, A.; Feuerbach, P.; et al. Nitrogen and phosphorus removal from agricultural runoff in integrated buffer zones. Environ. Sci. Technol. 2018, 52, 6508–6517. [Google Scholar] [CrossRef] [Green Version]
  12. Daxini, A.; O’Donoghue, C.; Ryan, M.; Buckley, C.; Barnes, A.P.; Daly, K. Which factors influence farmers’ intentions to adopt nutrient management planning? J. Environ. Manag. 2018, 224, 350–360. [Google Scholar] [CrossRef]
  13. Verhoeven, J.T.A.; Arheimer, B.; Yin, C.Q.; Hefting, M.M. Regional and global concerns over wetlands and water quality. Trends Ecol. Evol. 2006, 21, 96–103. [Google Scholar] [CrossRef] [PubMed]
  14. Hardin, G. Extensions of “The Tragedy of the Commons”. Science 1998, 280, 682–683. [Google Scholar] [CrossRef] [Green Version]
  15. Fritz, K.M.; Schofield, K.A.; Alexander, L.C.; McManus, M.C.; Golden, H.E.; Lane, C.R.; Kepner, W.G.; LeDuc, S.D.; DeMeester, J.E.; Pollard, A.I. Physical and chemical connectivity of streams and riparian wetlands to downstream waters: A synthesis. J. Am. Water Resour. Assoc. 2018, 54, 323–345. [Google Scholar] [CrossRef] [PubMed]
  16. Schröder, C.; Dahms, T.; Paulitz, J.; Wichtmann, W.; Wichmann, S. Towards large-scale paludiculture: Addressing the challenges of biomass harvesting in wet and rewetted peatlands. Mires Peat 2015, 16, 1–18. [Google Scholar]
  17. Wichtmann, W.; Schröder, C.; Joosten, H. Paludiculture—Productive Use of Wet Peatlands; Schweizerbart Science Publishers: Stuttgart, Germany, 2016; p. 272. [Google Scholar]
  18. Jabłońska, E.; Winkowska, M.; Wiśniewska, M.; Geurts, J.; Zak, D.; Kotowski, W. Impact of mowing on nutrient removal and plant litter quality of wetland buffer zones. (article submitted to Hydrobiologia).
  19. Fisher, J.; Acreman, M.C. Wetland nutrient removal: A review of the evidence. Hydrol. Earth Syst. Sci. 2004, 8, 673–685. [Google Scholar] [CrossRef] [Green Version]
  20. Mayer, P.M.; Reynolds, S.K.; McCutchen, M.D.; Canfield, T.J. Meta-analysis of nitrogen removal in riparian buffers. J. Environ. Qual. 2007, 36, 1172–1180. [Google Scholar] [CrossRef]
  21. Weissteiner, C.J.; Bouraoui, F.; Aloe, A. Reduction of nitrogen and phosphorus loads to European rivers by riparian buffer zones. Knowl. Manag. Aquat. Ecosyst. 2013, 408, 08. [Google Scholar] [CrossRef]
  22. Land, M.; Granéli, W.; Grimvall, A.; Hoffmann, C.C.; Mitsch, W.J.; Tonderski, K.S.; Verhoeven, J.T.A. How effective are created or restored freshwater wetlands for nitrogen and phosphorus removal? A systematic review. Environ. Evid. 2016, 5, 9. [Google Scholar] [CrossRef] [Green Version]
  23. Zak, D.; Wagner, C.; Payer, B.; Augustin, J.; Gelbrecht, J. Phosphorus mobilization in rewetted fens: The effect of altered peat properties and implications for their restoration. Ecol. Appl. 2010, 20, 1336–1349. [Google Scholar] [CrossRef]
  24. Mitsch, W.J.; Day, J.W.; Gilliam, J.W.; Groffman, P.M.; Hey, D.L.; Randall, G.W.; Wang, N. Reducing nitrogen loading to the Gulf of Mexico from the Mississippi River Basin: Strategies to counter a persistent ecological problem. BioScience 2001, 51, 373–388. [Google Scholar] [CrossRef]
  25. Marshall, E.; Aillery, M.; Ribaudo, M.; Key, N.; Sneeringer, S.; Hansen, L.; Malcolm, S.; Riddle, A. Reducing nutrient losses from cropland in the Mississippi/Atchafalaya River Basin: Cost efficiency and regional distribution. Econ. Res. Rep. 2018, 258, 1–75. [Google Scholar]
  26. Xu, H.; Wu, M.; Ha, M. Recognizing economic value in multifunctional buffers in the lower Mississippi river basin. Biofuels Bioprod. Biorefining 2019, 13, 55–73. [Google Scholar] [CrossRef] [Green Version]
  27. Arheimer, B.; Wittgren, H.B. Modelling nitrogen removal in potential wetlands at the catchment scale. Ecol. Eng. 2002, 19, 63–80. [Google Scholar] [CrossRef]
  28. Weisner, S.E.B.; Johannesson, K.; Thiere, G.; Svengren, H.; Ehde, P.M.; Tonderski, K.S. National large-scale wetland creation in agricultural areas—Potential versus realized effects on nutrient transports. Water 2006, 8, 544. [Google Scholar] [CrossRef]
  29. Collentine, D.; Johnsson, H.; Larsson, P.; Markensten, H.; Persson, K. Designing cost efficient buffer zone programs: An application of the FyrisSKZ tool in a Swedish catchment. Ambio 2015, 44, 311–318. [Google Scholar] [CrossRef] [Green Version]
  30. Windolf, J.; Tornbjerg, H.; Hoffmann, C.C.; Poulsen, J.R.; Blicher-Mathiesen, G.; Kronvang, B. Successful reduction of diffuse nitrogen emissions at catchment scale: Example from the pilot River Odense, Denmark. Water Sci. Technol. 2016, 73, 2583–2589. [Google Scholar] [CrossRef]
  31. Kotowski, W.; Dembek, W.; Pawlikowski, P. Poland. In Mires and Peatlands of Europe; Joosten, H., Tanneberger, F., Moen, A., Eds.; Schweizerbart Science Publishers: Stuttgart, Germany, 2017; pp. 549–571. [Google Scholar]
  32. Jabłońska, E.; Kotkowicz, M.; Manewicz, M. Podsumowanie i interpretacja wyników raportu ‘Inwentaryzacja oraz ocena skutków przyrodniczych ingerujących w hydromorfologię rzek prac ‘utrzymaniowych’ wykonanych na ciekach województw łódzkiego, podkarpackiego, podlaskiego, małopolskiego, mazowieckiego, opolskiego, świętokrzyskiego, warmińsko-mazurskiego, wielkopolskiego, zachodniopomorskiego w latach 2010-2012—opracowanie w oparciu o ogłoszenia o przetargach zamieszczone na stronach internetowych WZMiUW oraz wyniki ankiet wysłanych do tych instytucji oraz uzupełnienia tego raportu o dane z roku 2013. (unpublished). Available online: https://www.wwf.pl/sites/default/files/2017-07/Prace%20utrzymaniowe%20na%20rzekach-%20podsumowanie%20raportu%20WWF%202014.02.28_0.pdf (accessed on 20 December 2019).
  33. Grygoruk, M.; Frąk, M.; Chmielewski, A. Agricultural rivers at risk: Dredging results in a loss of macroinvertebrates. Preliminary observations from the Narew catchment, Poland. Water 2015, 7, 4511–4522. [Google Scholar] [CrossRef] [Green Version]
  34. Marcinkowski, M.; Grygoruk, M. Long-term downstream effects of a dam on a lowland river flow regime: Case study of the Upper Narew. Water 2017, 9, 783. [Google Scholar] [CrossRef] [Green Version]
  35. GIS Mokradła 2006. System Informacji Przestrzennej o Mokradłach Polski. Available online: http://www.gis-mokradla.info (accessed on 15 May 2019).
  36. Corine Land Cover (CLC) 2018, Version 20. Available online: https://land.copernicus.eu/pan-european/corine-land-cover/clc2018 (accessed on 15 May 2019).
  37. Naturstyrelsen 2014. Naturstyrelsens Vejledning til Kvælstofberegninger. Miljøministeriet. Available online: https://naturstyrelsen.dk/media/133160/kvaelstofberegvejledningmaj2014.pdf (accessed on 10 October 2018).
  38. Lewandowska, M. Potential for Wetland Restoration in Odense River Catchment and Nitrogen Removal. Master’s Thesis, Aarhus University, Silkeborg, Denmark, 2018. [Google Scholar]
  39. Venterink, H.O.; Hummelink, E.; Van Den Hoorn, M.W. Denitrification potential of a river floodplain during flooding with nitrate-rich water: Grasslands versus reedbeds. Biogeochemistry 2003, 65, 233–244. [Google Scholar] [CrossRef]
  40. Główny Urząd Statystyczny. Środki Produkcji w Rolnictwie w Roku Gospodarczym 2017/2018. Available online: https://stat.gov.pl/obszary-tematyczne/rolnictwo-lesnictwo/rolnictwo/srodki-produkcji-w-rolnictwie-w-roku-gospodarczym-20172018,6,15.html (accessed on 15 December 2019).
  41. Walling, D.E.; He, A.Q.; Blake, W.H. River Flood Plains as Phosphorus Sinks. In The Role of Erosion and Sediment Transport in Nutrient and Contaminant Transfer; Stone, M., Ed.; International Association of Hydrological Sciences: Wallingford, UK, 2000; pp. 211–218. [Google Scholar]
  42. Geurts, J.J.M.; Smolders, A.J.P.; Verhoeven, J.T.A.; Roelofs, J.G.M.; Lamers, L.P.M. Sediment Fe: PO4 ratio as a diagnostic and prognostic tool for the restoration of macrophyte biodiversity in fen waters. Freshw. Biol. 2008, 53, 2101–2116. [Google Scholar] [CrossRef]
  43. Forsmann, D.M.; Kjærgaard, C. Phosphorus release from anaerobic peat soils during convective discharge—Effect of soil Fe:P molar ratio and preferential flow. Geoderma 2014, 223, 21–32. [Google Scholar] [CrossRef]
  44. Zak, D.; Gelbrecht, J.; Wagner, C.; Steinberg, C.E.W. Evaluation of phosphorus mobilisation potential in rewetted fens by an improved sequential chemical extraction procedure. Eur. J. Soil Sci. 2008, 59, 1191–1201. [Google Scholar] [CrossRef]
  45. Murphy, J.; Riley, J.P. A modified single solution method for determination of phosphate in natural waters. Anal. Chim. Acta 1962, 27, 31–36. [Google Scholar] [CrossRef]
  46. Gala-de Vacqueret, M.; Górnicki, A.; Kaczmarski, P.; Płaneta, M.; Sikorska-Ożgo, W.; Sierakowski, T.; Wypych, A. Biuletyn Cen Robót Ziemnych i Inżynieryjnych; Ośrodek Wdrożeń Ekonomiczno-Organizacyjnych Budownictwa: Warszawa, Poland, 2019; p. 104. [Google Scholar]
  47. Agencja Restrukturyzacji i Modernizacji Rolnictwa (ARMR). Średnie Ceny Gruntów wg GUS. Available online: https://www.arimr.gov.pl/pomoc-krajowa/srednie-ceny-gruntow-wg-gus.html (accessed on 10 December 2019).
  48. Pomorski Ośrodek Doradztwa Rolniczego w Lubaniu. Kalkulacje Rolnicze—Produkcja Roślinna. Available online: http://podr.pl/doradztwo/kalkulacje-rolnicze-produkcja-roslinna (accessed on 10 December 2019).
  49. HELCOM. Sources and pathways of nutrients to the Baltic Sea. Baltic Sea Environ. Proc. 2018, 153, 1–47. [Google Scholar]
  50. HELCOM. Nutrient Reduction Scheme. Available online: https://helcom.fi/baltic-sea-action-plan/nutrient-reduction-scheme (accessed on 12 December 2019).
  51. Zak, D.; Meyer, N.; Cabezas, A.; Gelbrecht, J.; Mauersberger, R.; Tiemeyer, B.; Wagner, C.; McInnes, R. Topsoil removal to minimize internal eutrophication in rewetted peatlands and to protect downstream systems against phosphorus pollution: A case study from NE Germany. Ecol. Eng. 2017, 103, 488–496. [Google Scholar] [CrossRef]
  52. Zak, D.; Goldhammer, T.; Cabezas, A.; Gelbrecht, J.; Gurke, R.; Wagner, C.; Reuter, H.; Augustin, J.; Klimkowska, A.; McInnes, R. Top soil removal reduces water pollution from phosphorus and dissolved organic matter and lowers methane emissions from rewetted peatlands. J. Appl. Ecol. 2018, 55, 311–320. [Google Scholar] [CrossRef] [Green Version]
  53. Klimkowska, A.; Dzierża, P.; Brzezińska, K.; Kotowski, W.; Mędrzycki, P. Can we balance the high costs of nature restoration with the method of topsoil removal? Case study from Poland. J. Nat. Conserv. 2010, 18, 202–205. [Google Scholar] [CrossRef]
  54. Grootjans, A.; Wołejko, L. Conservation of Wetlands in Polish Agricultural Landscapes; Klub Przyrodników: Szczecin, Poland, 2007; p. 111. [Google Scholar]
  55. Ministerstwo Funduszy i Polityki Regionalnej (MFPR). Lista Projektów Realizowanych w Programie Infrastruktura i Środowisko 2014–2020. Available online: https://www.pois.gov.pl/strony/o-programie/projekty/lista-beneficjentow (accessed on 19 December 2019).
  56. Agencja Restrukturyzacji i Modernizacji Rolnictwa (ARMR). Działanie Rolno-Środowiskowo-Klimatyczne. Available online: https://www.arimr.gov.pl/pomoc-unijna/prow-2014-2020/dzialanie-10-dzialanie-rolno-srodowiskowo-klimatyczne-oraz-rolnictwo-ekologiczne-w-2015-roku-prow-2014-2020.html (accessed on 19 December 2019).
  57. Agencja Restrukturyzacji i Modernizacji Rolnictwa (ARMR). Pakiet 4—Cenne Siedliska i Zagrożone Gatunki Ptaków na Obszarach Natura 2000. Available online: https://www.arimr.gov.pl/fileadmin/pliki/PROW_2014_2020/Rolno_srodowiskowo_klimatyczny/a/prsk_pakiet4.pdf (accessed on 19 December 2019).
  58. Agencja Restrukturyzacji i Modernizacji Rolnictwa (ARMR). Pakiet 5—Cenne Siedliska Poza Obszarami Natura 2000. Available online: https://www.arimr.gov.pl/fileadmin/pliki/PROW_2014_2020/Rolno_srodowiskowo_klimatyczny/b/prsk_pakiet5.pdf (accessed on 19 December 2019).
  59. The European Green Deal. Available online: https://ec.europa.eu/info/sites/info/files/european-green-deal-communication_en.pdf (accessed on 23 December 2019).
  60. Agencja Restrukturyzacji i Modernizacji Rolnictwa (ARMR). Płatności Bezpośrednie w Roku 2019. Available online: https://www.arimr.gov.pl/pomoc-unijna/platnosci-bezposrednie/platnosci-bezposrednie-w-roku-2019.html (accessed on 23 December 2019).
  61. Joosten, H. The Global Peatland CO2 Picture; Wetlands International: Wageningen, The Netherlands, 2010; p. 36. [Google Scholar]
  62. Bonn, A.; Allott, T.; Evans, M.; Joosten, H.; Stoneman, R. Peatland Restoration and Ecosystem Services. Science, Policy and Practice; Cambridge University Press: Cambridge, UK, 2016; p. 516. [Google Scholar]
  63. Wilson, D.; Blain, D.; Couwenberg, J.; Evans, C.D.; Murdiyarso, D.; Page, S.E.; Renou-Wilson, F.; Rieley, J.O.; Sirin, A.; Strack, M.E.-S.; et al. Greenhouse gas emission factors associated with rewetting of organic soils. Mires Peat 2016, 17, 04. [Google Scholar]
  64. Cui, L.; Kang, X.; Li, W.; Hao, Y.; Zhang, Y.; Wang, J.; Yan, L.; Zhang, X.; Zhang, M.; Zhou, J.; et al. Rewetting decreases carbon emissions from the Zoige alpine peatland on the Tibetan Plateau. Sustainability 2017, 9, 948. [Google Scholar] [CrossRef] [Green Version]
  65. Hiraishi, T.; Krug, T.; Tanabe, K.; Srivastava, N.; Jamsranjav, B.; Fukuda, M.; Troxler, T. 2013 Supplement to the 2006 IPCC Guidelines for National Greenhouse Gas Inventories: Wetlands; IPCC: Geneva, Switzerland, 2014; p. 354. [Google Scholar]
  66. EU Climate Action. Union Registry: Verified Emissions for 2018. Available online: https://ec.europa.eu/clima/policies/ets/registry_en#tab-0-1 (accessed on 22 December 2019).
  67. Giergiczny, M.; Valasiuk, S.; Kotowski, W.; Galera, H.; Jacobsen, J.B.; Sagebiel, J.; Wichtmann, W.; Jabłońska, E. Re-meander, rewet, rewild! An overwhelming support for restoring cultural Ecosystem services of small rivers in three Baltic Sea basin countries. (article submitted).
  68. Joosten, H.; Couwenberg, J.; Von Unger, M. International Carbon Policies as a New Driver for Peatland Restoration. In Peatland Restoration and Ecosystem Services: Science, Policy and Practice; Bonn, A., Allott, T., Evans, M., Joosten, H., Stoneman, R., Eds.; Cambridge University Press: Cambridge, UK, 2016; pp. 291–313. [Google Scholar]
  69. MoorFutures. Available online: www.moorfutures.de (accessed on 10 December 2019).
  70. Arora, K.; Mickelson, S.K.; Helmers, M.J.; Baker, J.L. Review of Pesticide Retention Processes Occurring in Buffer Strips Receiving Agricultural Runoff. JAWRA J. Am. Water Resour. Assoc. 2010, 46, 618–647. [Google Scholar] [CrossRef]
  71. Collins, A.L.; Hughes, G.O.; Zhang, Y.; Whitehaed, J. Review: Mitigating diffuse water pollution from agriculture: Riparian buffer strip performance with width. CAB Rev. 2009, 4, 1–15. [Google Scholar] [CrossRef]
  72. Dorioz, J.M.; Wang, D.; Poulenard, J.; Trevisan, D. The effect of grass buffer strips on phosphorus dynamics—A critical review and synthesis as a basis for application in agricultural landscapes in France. Agric. Ecosyst. Environ. 2006, 117, 4–21. [Google Scholar] [CrossRef]
  73. Syversen, N.; Borch, H. Retention of soil particle fractions and phosphorus in cold-climate buffer zones. Ecol. Eng. 2005, 25, 382–394. [Google Scholar] [CrossRef]
  74. Alldred, M.; Baines, S.B. Effects of wetland plants on denitrification rates: A meta-analysis. Ecol. Appl. 2016, 26, 676–685. [Google Scholar] [CrossRef] [PubMed]
  75. Zhou, M.; Butterbach-Bahl, K.; Vereecken, H.; Brueggemann, N. A meta-analysis of soil salinization effects on nitrogen pools, cycles and fluxes in coastal ecosystems. Glob. Chang. Biol. 2017, 23, 1338–1352. [Google Scholar] [CrossRef]
  76. Hill, A.R. Nitrate removal in stream riparian zones. J. Environ. Qual. 1996, 25, 743. [Google Scholar] [CrossRef]
  77. Van de Riet, B.; Barendregt, A.; Brouns, K.; Hefting, M.; Verhoeven, J. Nutrient limitation in species-rich Calthion grasslands in relation to opportunities for restoration in a peat meadow landscape. Appl. Veg. Sci. 2010, 13, 315–325. [Google Scholar] [CrossRef]
  78. Vroom, R.J.E.; Xie, F.; Geurts, J.J.M.; Chojnowska, A.; Smolders, A.J.P.; Lamers, L.P.M.; Fritz, C. Typha latifolia paludiculture effectively improves water quality and reduces greenhouse gas emissions in rewetted peatlands. Ecol. Eng. 2018, 124, 88–98. [Google Scholar] [CrossRef]
  79. Rothe, M.; Kleeberg, A.; Hupfer, M. The occurrence, identification and environmental relevance of vivianite in waterlogged soils and aquatic sediments. Earth Sci. Rev. 2016, 158, 51–64. [Google Scholar] [CrossRef] [Green Version]
  80. Hoffmann, C.C.; Kjaergaard, C.; Uusi-Kämppä, J.; Hansen, H.C.B.; Kronvang, B. Phosphorus Retention in Riparian Buffers: Review of Their Efficiency. J. Environ. Qual. 2009, 38, 1942–1955. [Google Scholar] [CrossRef] [PubMed]
  81. Cabezas, A.; Pallasch, M.; Schoenfelder, I.; Gelbrecht, J.; Zak, D. Carbon, nitrogen, and phosphorus accumulation in novel ecosystems: Shallow lakes in degraded fen areas. Ecol. Eng. 2014, 66, 63–71. [Google Scholar] [CrossRef]
Figure 1. Location of study area: (a) part of the Narew catchment where upscaling was applied in relation to the territory of Poland (please note that the whole catchment of Biebrza was excluded from the analyses); (b) studied sub-catchments in the Narew catchment; (c) peat deposits in sub-catchments [35]; (d) agricultural area in sub-catchments [36].
Water 12 00629 g001
Figure 2. Wetland buffer zone (WBZ) types delineated in sub-catchments.
Water 12 00629 g002
Figure 3. Extrapolated average molar ratio FeBD:PBD in peatlands in sub-catchments.
Water 12 00629 g003
Figure 4. Costs of creation and functioning of WBZs in scenario 1 (with or without the top soil removal option) and scenario 2; averaged for five sub-catchments; N removal assessed in a “median” variant. (A) Costs re-calculated for the amount of N removed in one year, compensation costs and current status quo maintenance costs spent in one year. (B) Costs re-calculated for the amount of N removed in 30 years, compensation costs and status quo maintenance costs spent in 30 years (assuming maintenance works performed every five years). Agricultural subsidies include current direct payment (319 EUR ha−1 year−1—in a farm of 3–30 ha, with one cow per hectare [60] and agri-environment-climate schemes payment (on average 248 EUR ha−1 year−1).
Water 12 00629 g004
Table 1. WBZ types and their functionalities and landscape settings.
FunctionalityPotential for wet agriculturePurification of NP-polluted groundwaterNitrification and denitrificationP-eutrophication and remobilisationPrecipitation of P, low P loss, conservation of plant diversityPhysical sorption of P to mineral particles, deposition by flooding
FeatureLarge areaGroundwater exfiltrationWater flow through oxic/anoxic soilRewetting of degraded peatLow decomposition of peatSufficient flooding potential (water, space)
Landscape SettingsExtensive fen or floodplainGroundwater seepage siteOrganic soilDegraded peatUndrained fenMedium and larger rivers in flat valleys
WBZ TypeLinearWetland banks/shoresNOn.s.YESn.s.n.s.n.s.
Two stage channelNOYESn.s.n.s.NOn.s.
Meandering channelNOn.s.n.s.n.s.NOYES
PolygonalUndrained fenYESYESYESNOYESn.s.
Rewetted fenYESYESYESYESNOn.s.
Floodplain with organic soilYESNOYESYESNOYES
Floodplain with mineral soilYESNONONONOYES
Table 2. Nitrogen load and removal.
Sub-Catchment Size (ha)Total N Load (kg year−1) from Whole Sub-CatchmentShare of Polygonal WBZs Area in the Sub-Catchment Area (%)Scenario 1 N Removal in WBZs (% of Total N Load in the Whole Sub-Catchment) Median Efficiency */Maximum Efficiency **Share of Length of Linear WBZs to the Total River Length (%)Scenario 2 N Removal in WBZs (% of Total N Load in the Whole Sub-Catchment) Median Efficiency */Maximum Efficiency **
Różanica643250,35855/137934/86
Róż17,879146,6811316/576024/61
Ruż32,531362,60857/198731/78
Łojewek14,431148,20827/208930/76
Skroda37,457490,061713/3410037/93
Together108,7311,197,916711/308633/82
* median 37% N removal efficiency for groundwater fed polygonal WBZs and for all linear WBZs [22], and 8 kg N ha−1 year−1 removal in floodplain polygonal WBZs [39]; ** maximum 93% N removal efficiency for groundwater fed polygonal WBZs, and for all linear WBZs [22], and 100 kg N ha−1 year−1 removal in floodplain polygonal WBZs [39].
Table 3. Phosphorus load and removal.
Estimated Total P Load (kg year−1) from Whole Sub-CatchmentScenario 1 Estimated P Removal in WBZs (% of Total P Load in the Whole Sub-Catchment) Median Efficiency */Maximum Efficiency **Scenario 2 Estimated P Removal in WBZs (% of Total P Load in the Whole Sub-Catchment) Median Efficiency */Maximum Efficiency **Area of ‘Rewetted Fen’ Type WBZ with Fe:P < 11 (ha)P Mobilisation after Fen Rewetting (kg year−1)Share of Mobilised P to the Total P Load from Whole Sub-Catchment (%)
Różanica15,1077/1643/920around 0around 0
Róż44,00427/10030/65131041719.5
Ruż108,7829/2639/83150932113.0
Łojewek44,46210/2737/810around 0around 0
Skroda147,01817/4046/99842350.2
Together359,37514/4241/87290376172.1
* median 46% P removal efficiency for groundwater fed polygonal WBZs and for all linear WBZs [22] and 13 kg P ha−1 year−1 sedimented in floodplain polygonal WBZs [41]; ** maximum 99% P removal efficiency for groundwater fed polygonal WBZs, and for all linear WBZs [22], and 116 kg P ha−1 year−1 sedimented in floodplain polygonal WBZs [41].
Table 4. Costs of top soil removal in rewetted fen WBZs with high P loss risk after rewetting.
Surface of WBZ (ha)Costs of Rewetted Fen WBZ Creation without Removing Topsoil (EUR)Depth of Topsoil Layer to be Removed (m)Volume of Removed Top Soil (m3)Costs of Excavation Works and 10 km Transportation of Topsoil (EUR)Costs of Excavation Works and 50 km Transportation of Topsoil (EUR)Possible Reduction of Costs if Topsoil Sold (EUR)
Róż1320102,8730.67,859,32468,923,379246,608,66724,900,465
Ruż150989,017115,087,781132,314,280473,422,06247,802,169
Skroda8413,8560.4337,1902,957,03210,580,2961,068,309
Sum2913205,746-23,284,295204,194,691730,611,02573,770,943
Table 5. Cost of implementation WBZs in scenario 1 (polygonal WBZs) and in scenario 2 (linear WBZ) in five sub-catchments and upscaled for the whole analysed part of Narew catchment.
Type of WBZTotal Area/Length of WBZ Type in Five Sub-CatchmentsTotal Area/Length of WBZ Type in Narew CatchmentTotal Cost of Creation of WBZs in All Sub-Catchments + Compensation Costs [EUR]Total Cost of Creation of WBZs in Narew Catchment [EUR]
Undrained fenExisting: 78 haExisting: 1045 ha--
Rewetted fenTo be done: 6609 haTo be done: 88,506 ha600,740 + 1,923,219 year−18,044,660 + 25,755,246 year−1
Floodplain with mineral soilExisting: 323 ha
To be done: 176 ha
Existing: 4320 ha
To be done: 2354 ha
63,506 + 51,216 year−1850,601 + 685,014 year−1
Scenario 17186 ha96,225 ha664,246 + 1,974,435 year−18,895,261 + 26,440,260 year−1
Two-stage channelExisting: 0 km
To be done: 41 km
Existing: 0 km
To be done: 574 km
5,481,44277,507,705
Wetland banksExisting: 0 km
To be done: 297 km
Existing: 0 km
To be done: 4190 km
3,324,40446,850,629
Meandering channelExisting: 5 km
To be done: 41 km
Existing: 206 km
To be done: 443 km
541,59146,470,017
Scenario 2384 km (around 340 ha)5413 km9,347,437170,828,351
No WBZ type “floodplain with organic soil” was delineated in sub-catchments.

