Article

Application of Set Pair Analysis in a Comprehensive Evaluation of Water Resource Assets: A Case Study of Wuhan City, China

1
Research Center for Environment and Health, Zhongnan University of Economics and Law, Wuhan 430073, China
2
School of Information and Safety Engineering, Zhongnan University of Economics and Law, Wuhan 430073, China
*
Author to whom correspondence should be addressed.
Water 2019, 11(8), 1718; https://doi.org/10.3390/w11081718
Submission received: 16 July 2019 / Revised: 12 August 2019 / Accepted: 13 August 2019 / Published: 18 August 2019
(This article belongs to the Section Urban Water Management)

Abstract

:
With the rapid development of the social economy, China is suffering from severe water scarcity due to improper management. Evaluation of water resource value is a crucial issue for innovative management in regional water resources. In this paper, in consideration of the complexity and uncertainty of water resources, 15 indicators were selected to establish the assessment system for its value in Wuhan City from the following three aspects, namely the environment, resources, and society. The analytic hierarchy process (AHP) and Entropy Weight Method were combined to calculate the comprehensive weight. An improved set pair analysis (SPA) model was applied to evaluate water resource assets in the period of 2013–2017. For the sake of the dependability of these results, the James Pollution Loss model was utilized to compute loss of water resource value caused by the decline of water quality in the water pollution environment. The results show that the amount of water resource through physical quantitative accounting in Wuhan City fluctuates greatly. The initial change is relatively stable, then surges in 2015 and 2016, but slumps in 2017. The total water resource assets for Wuhan City from 2013 to 2017 are 14.221, 14.833, 28.375, 75.558, and 21.315 billion RMB, respectively. Therefore, water resource value accounting plays an indispensable role in the environmental protection and sustainable development of water, as well as provides a support for comprehensive calculation and management of various valuable natural resources.

1. Introduction

In recent years, China has adopted a series of measures to accelerate the construction of an ecological civilization, as the Third Plenary Session of the 18th Central Committee of the Communist Party of China (CPC) clearly stated in 2013 “to explore the preparation of natural resource balance sheets” [1], which marks the construction of the country’s strategic goal of putting the physical accounting and asset evaluation of natural resources into effect, improving resource conservation and utilization, and building a “beautiful China” [2,3]. Water is the basic natural resource for human beings and all living things to survive and develop [4]. With the rapid development of the social economy, water resources are over-committed [5,6,7], as well as the massive discharge of industrial, agriculture, and domestic sewage, due to the poor management of water resources, leading to a reduction in water quantity and the decline in water quality [8,9,10]. Great attention should be paid to the problem of water resource supply could not meeting water demand, resulting in water scarcity. Almost one-third of the world’s population is experiencing a severe water scarcity crisis [11,12]. Therefore, it is indispensable to promote the innovative management of natural resources by grasping the quantity and quality of water resource assets in the region to lessen the contradictions between economic development and environment resources.
Water scarcity occurs when the supply of fresh water cannot meet the demand [13]. It could result from two mechanisms: physical water scarcity, which is due to insufficient natural water resources to meet the needs of a region; and economic water scarcity, caused by poor management [14,15]. It is found that the latter more often leads to water scarcity according to United Nations Development Programme [7]. People tend to turn their attention to water scarcity caused by natural forces rather than to human-induced scarcity, or any other factors [16,17]; the real reasons for water scarcity could be covered up. In fact, water scarcity, linked to water security, is a complex phenomenon that could be solved from social, political, meteorological, economic, and environmental perspectives [18,19,20,21]. Most of the research studies have mainly been done with engineering measures, which implies that using economic valuation techniques provides a new perspective for water resource management [22]. Water resources, used for free or at a low price, have been exploited and utilized for a long time without any compensation, leading to increasingly scarce water resources [23,24]. Thus, it is urgent to evaluate the water resource value, establish a balance sheet for water resources, promote the construction of an ecological civilization, and ultimately achieve sustainable development of water resources.
At present, the method to evaluate the value of water resources is mainly carried out through certainty or uncertainty methods. The former is a group of traditional deterministic evaluation methods, including the shadow price method, supply and demand pricing model, income reduction method, marginal opportunity cost method, and computable general equilibrium (CGE) model [25,26,27,28,29,30]. However, the water resource value system is a complex system. Traditional classical algorithms reflect the economic value of water resources to a certain extent, but they cannot solve the complicacy and fuzziness of water resource value systems [31]. The uncertainty evaluation method, which is mainly based on fuzzy theory, might also result in information loss [32,33]. Set pair analysis (SPA), dealing with the interaction between certainty and uncertainty, is suitable for cases with two or more groups from two or more perspectives [34]. To evaluate water resources objectively and truly, we need to recognize the internal structure and take social, economic, and environmental factors into consideration [35]. For this reason, SPA is a systematic method to deal with the uncertainty of complex problems [36,37] and has been gradually utilized for comprehensive evaluation of water quality and water safety [38,39]. In this study, the comprehensive weight, resolved with the combination of AHP and entropy weight, is applied to the set pair analysis model of water resource evaluation. This will be a more practical study and provide a positive reference for the establishment of a water resource asset evaluation system.
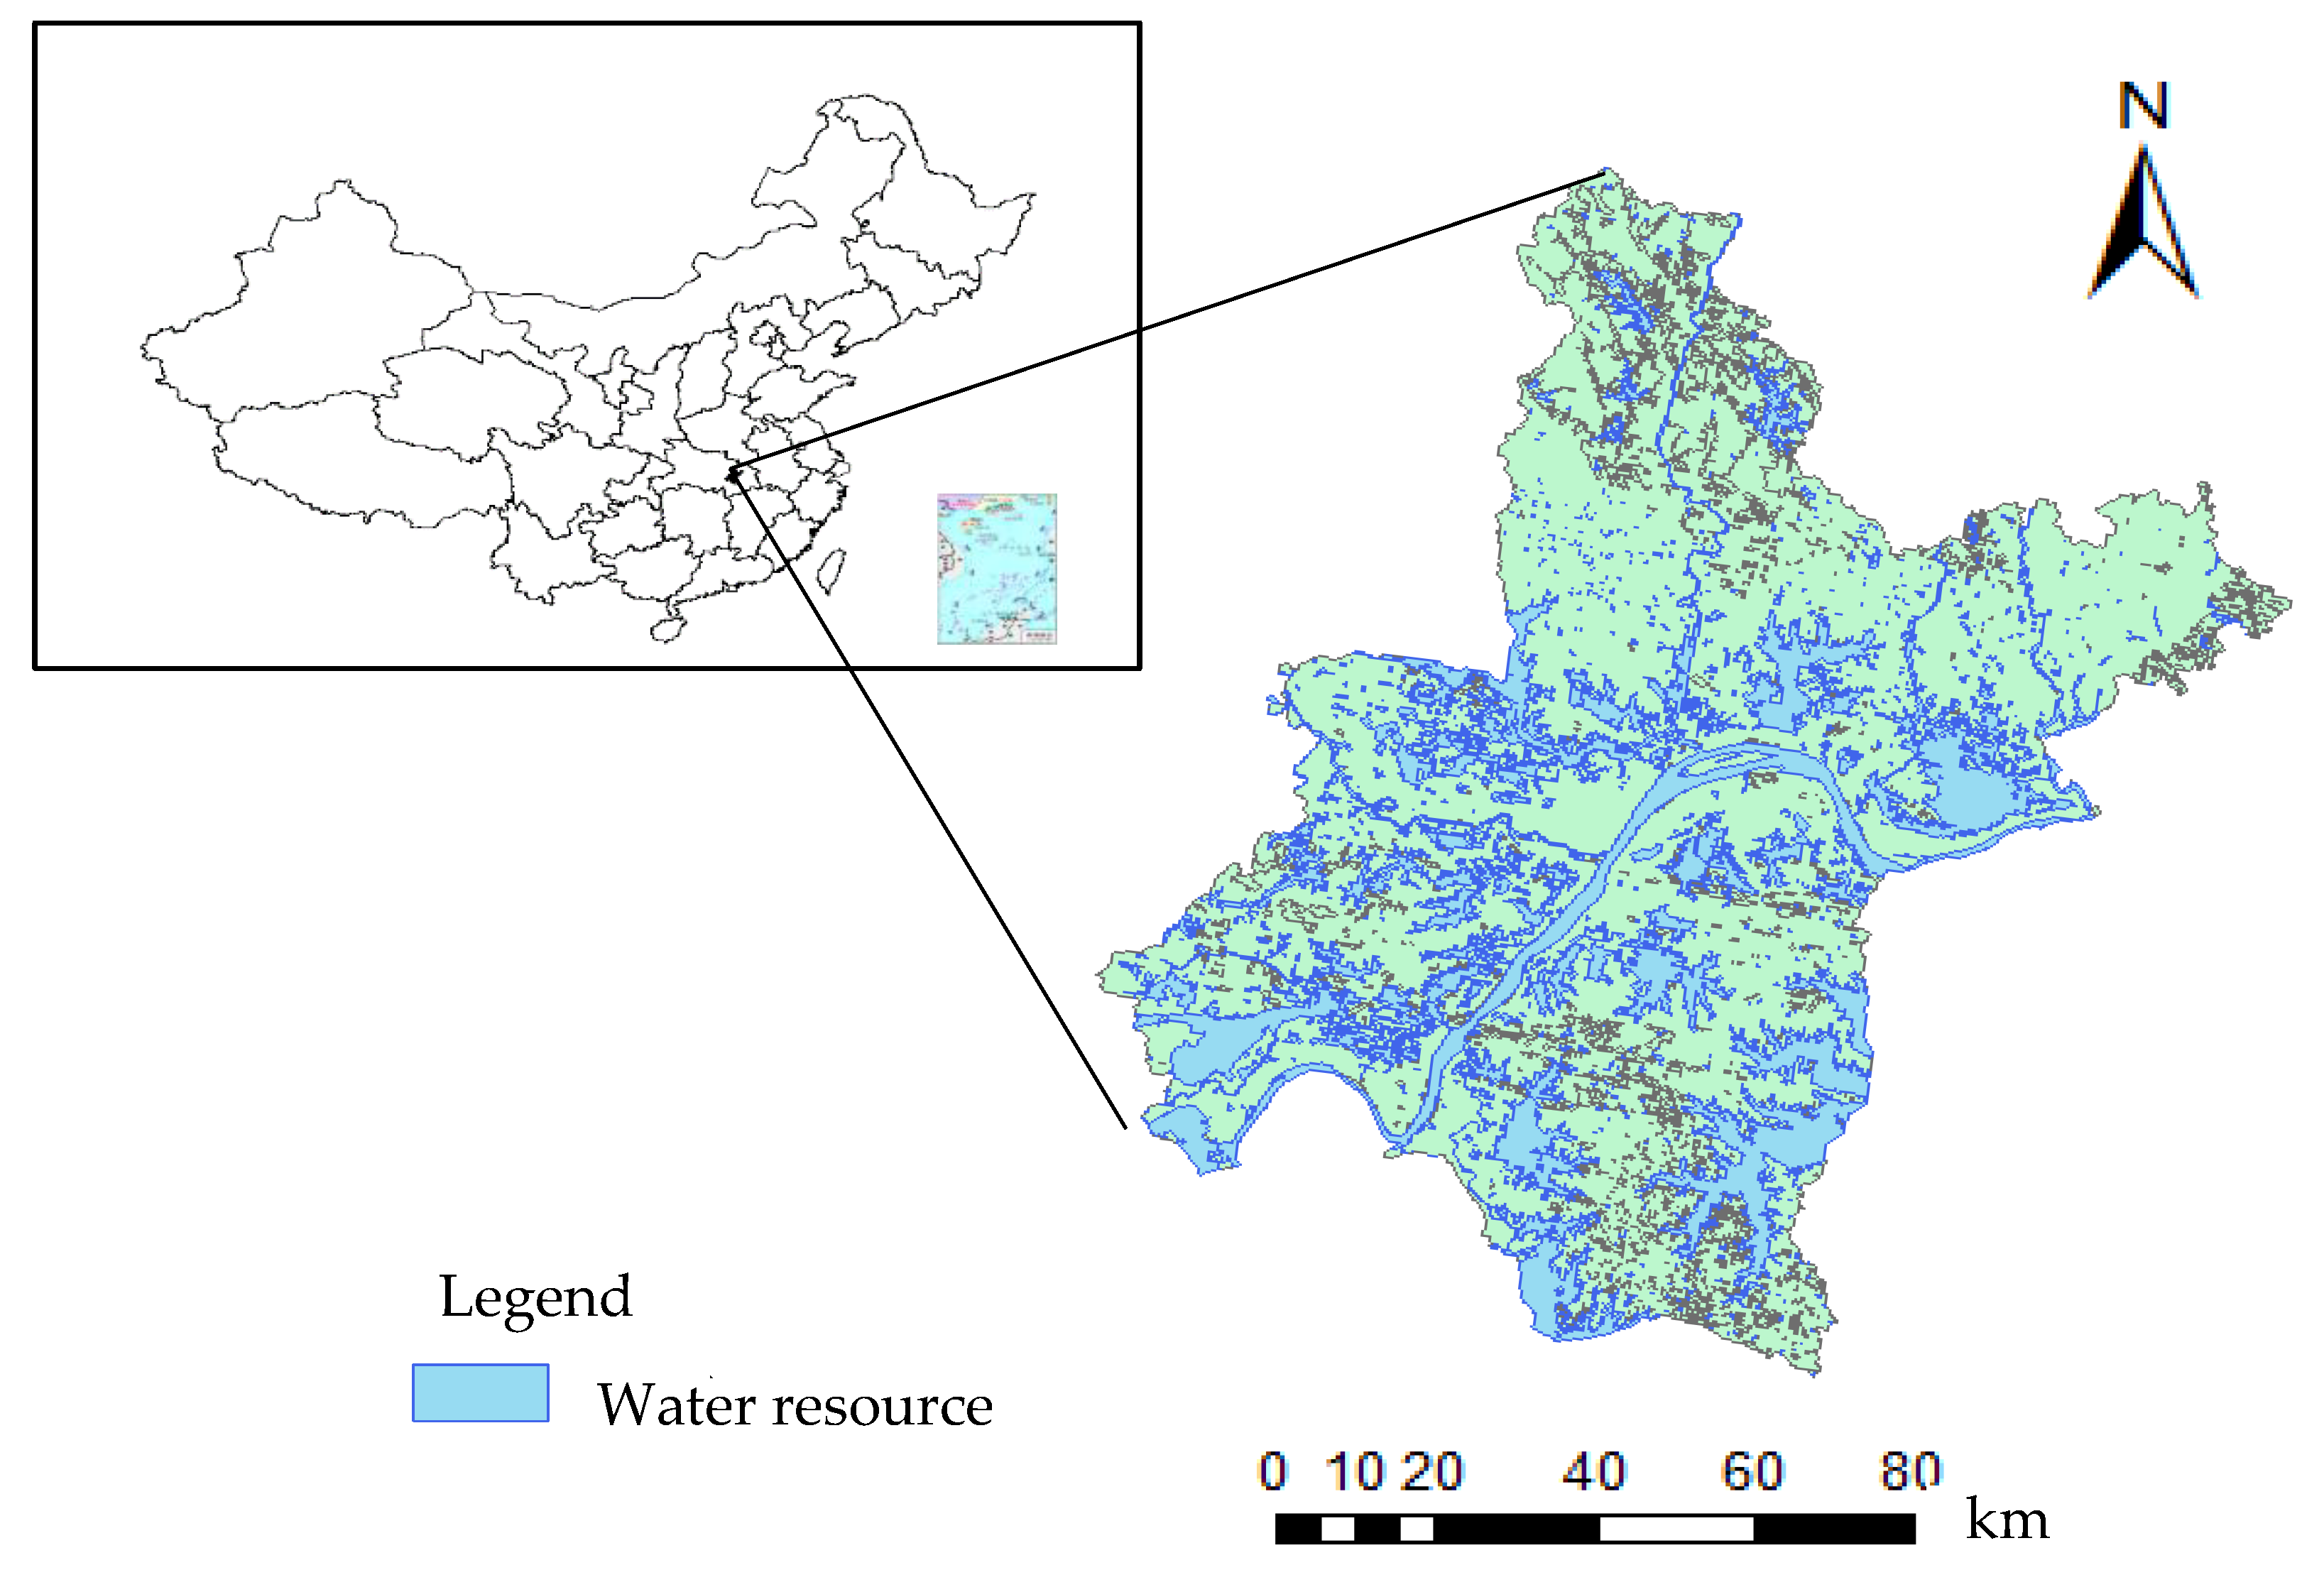
Accurate value accounting is a critical part of water resources research. It is of great significance in the rational allocation of water resources, improvement of water environments, and alleviation of water crises. This research focuses on the water resource assets of Wuhan City from 2013 to 2017, covering hundreds of lakes in central China, with the following aims: (1) to establish a balance sheet for physical quantities of water resources; (2) to determine an integrated index of water resource value using a combination of SPA and Triangular Fuzzy Number (TFN) methods; (3) to determine the water resource unit price by applying comprehensive weight to the improved SPA model; (4) to calculate the total value of water resources.

2. Methods and Data

2.1. Study Area

Wuhan City is the political and economic center of Hubei Province, the transportation junction of central China, as well as an important industrial, science, and education base [40]. Wuhan City is located in the east of Hubei Province, from 29°58′ N to 31°22′ N, 113°41′ E to 115°05′ E. The maximum distance from east to west is 132.1 km, and the maximum distance from north to south is 154.0 km. The elevation of Wuhan City ranges from 19.2 m to 873.7 m, but is mostly below 50 m. Elevation is low and terrain is flat in the middle, surrounded by hills and ridges in the north and south, and low mountains in the north, with the Yangtze and Han rivers winding through the city [41]. Wuhan City has a subtropical monsoon climate, with abundant annual rainfall, ranging from 1150 mm to 1450 mm [42]. The precipitation is concentrated from June to August, accounting for about 40% of the annual rainfall [43,44]. Rivers, lakes, and harbors are interwoven, with a total water area of 2217.6 square kilometers, accounting for 26.1% of the city’s land area, constituting the water ecological environment of the riversides and lakes (Figure 1). There are 166 lakes in Wuhan City, called “the City of Lakes”, and the total surface area of the lakes ranks first in Chinese cities. Wuhan City, also called “River City”, has abundant freshwater resources. The per capita water resource occupancy reaches more than 40 times the national average level and 10 times the global average level [45].

2.2. Principle and Application of Set Pair Analysis

SPA is a scientific theory dealing with the interaction between certainty and uncertainty [46]. The core idea is to construct pairs of related sets of uncertain systems, and then analyze characteristics such as similarity, difference, and opposition of set pairs, and finally to establish the connection degree of similarity, difference, and opposition of a set pair [33]. The application of connection degree transforms the dialectical understanding of uncertainty into a specific mathematical problem, enhancing the reliability and objectivity [47]. First of all, SPA qualitatively analyzes samples according to a certainty and uncertainty analysis between the water resource asset evaluation system and related factors, and then quantitatively calculates the value of water resource assets, so as to better realize the water resource asset evaluation.

2.2.1. The Principle SPA Mathematic Model

The basic unit is composed of two sets with certain connections. Here, we define the connection sets A and B, which then form the set pair H (A, B). The ternary connection is usually used as Equation (1).
μ A ~ B = a + b i + c j
where a, b, and c are the degrees of similarity, difference, and opposition under a certain characteristic; i refers to the difference coefficient; j means the opposite coefficient [48]. In this study, A represents the water resource evaluation standard, and B represents the actual index value. The criteria for assessment of value for the water resource value involve comparing the similarity of two sets (A, B). Previous studies regarding fuzzy theory have resulted in excessive information loss to some extent [49,50], making the evaluation results less accurate. In order to assess water resource accounting more accurately, this paper introduces the five-member connection degree [33], as shown in Equation (2).
μ A ~ B = a + b 1 i 1 + b 2 i 2 + b 3 i 3 + c j
where a, b1, b2, b3, and c are the connection degrees of the identical component, partial identical component, critical component, partial inverse component, and inverse component of the five-member linkage number, respectively. In the same way, a + b1 + b2 + b3 + c = 1, j = −1, i ∈ (−1, 1). The expressions of Equations (1) and (2) are simple, but they reflect the overall structure of the relationship between A and B. Meanwhile, a, b (or b1, b2, b3), c reflect the internal structure of the relationship between A and B in detail [51]. The degree of connection breaks through the traditional frame of the relationship between the correlation coefficient, membership degree, and gray correlation degree, offering unique advantages [52].

2.2.2. Factor Data and Weights

The system of water resource value, in fact, is a complex system in which the natural system, social system, and economic system interact with each other [53]. According to China’s “13th Five Year Plan of Water Conservancy Reform and Development” [54], “Surface Water Environmental Quality Standards” (GB 3838-2002) [55], as well as some relevant research studies [49,56,57], the water resource value system is formed from a total of 15 indicators from three aspects, namely environment, resources, and society, based on the principle of representative, targeted, and easy to quantify divisions. The environment category include 4 indices (N1–N4) as follows: ammonia nitrogen, chemical oxygen demand (COD), sewage treatment rate, and water functional area compliance rate. The resource indices contain per capita water resources (N5), water resources per unit area (N6), and the amount of water supply (N7). Finally, the society indices include population density (N8), per capita water consumption (N9), per capita gross domestic product (N10), water consumption (N11), water resource development and utilization rate (N12), industrial added value of water consumption (N13), industrial water reuse rate (N14), and agricultural irrigation water utilization factor (N15).
Weight is the representation of the importance of the indicator, and its rationality affects the accuracy of the evaluation results directly [58]. The water resource evaluation system is a multi-level, multi-factor system with uncertainty, randomness, and complexity [56,59]. Therefore, the AHP was selected to calculate the subjective weight with high credibility and accuracy [60,61]. The entropy method was used to consider the objective weight. The entropy weight method can take full advantage of the actual data, and consider the connection between multiple samples comprehensively, which effectively reduces the subjectivity in the calculation process [62]; this means the evaluation results will be more objective and reasonable [35,63]. Finally, a linear weighting method was applied to determine the comprehensive weight. This method of weight calculation avoided the deviation caused by the subjective weighting method and the absolutization caused by the objective weighting method, meaning it would be more general and exact in assessing the value of water resources.

2.2.3. The Comprehensive Assessment Vector of SPA

The connection degree is a map μ (A, B) from the actual value of the evaluation index B to the evaluation standard A. Equation (3) can be used to calculate the membership degree of each index to the standard value. We can get the combined weight of the evaluation samples by Equation (4).
μ m k = { 1 + 0 i 1 + 0 i 2 + 0 i 3 + 0 j x < s 1 x s 2 s 1 s 2 + s 1 x s 1 s 2 i 1 + 0 i 2 + 0 i 3 + 0 j s 1 < x s 2 0 + x s 3 s 2 s 3 i 1 + s 2 x s 2 s 3 i 2 + 0 i 3 + 0 j s 2 < x s 3 0 + 0 i 1 + x s 4 s 3 s 4 i 2 + s 3 x s 3 s 4 i 3 + 0 j s 3 < x s 4 0 + 0 i 1 + 0 i 2 + x s 5 s 4 s 5 i 3 + s 4 x s 4 s 5 j s 4 < x s 5 0 + 0 i 1 + 0 i 2 + 0 i 3 + 1 j x s 5
R i = ω × μ
In Equation (3), m represents the evaluation index, k represents the evaluation sample; S1, S2, S3, S4, and S5 represent the evaluation standard values of levels I–V, respectively, μ is the membership degree matrix of each evaluation index, and ω represents the comprehensive weight of each evaluation indicator. R is a comprehensive assessment vector, and x is the actual value of each indicator. Obviously, the degree of connection is the key point of the set pair analysis. It not only reflects the relationship between the set pairs as a whole, but also clearly represents the randomness and ambiguity of the system [64]. Actually, the evaluation of water resource value is a process combining a deterministic evaluation index and evaluation criteria with uncertain evaluation factors and their content changes [47,65]. Set pairs and their connections describe the relationship between these deterministic and uncertain systems extensively and profoundly.

2.2.4. The Comprehensive Evaluation Model of SPA and Triangular Fuzzy Numbers

Triangular fuzzy numbers, dealing with the comprehensive evaluation problem with ambiguity and randomness, contain certain and uncertain information [66]. Set pair analysis can describe the certainty and uncertainty in the process of water resource value assessment, but the difference coefficient i, one of connection numbers, processes the ambiguity between the adjacent standard levels [37]. It is hard to obtain the specific evaluation level of this evaluation system. However, the value of the difference coefficient i is essential to determine the connection degree. In this study, a triangular fuzzy number was used to handle the ambiguity of the difference coefficient. Combining the weights of each indicator, a coupling model with a combination of TFN and SPA was established [67,68,69], as shown in Equations (5) and (6).
μ m k = { 1 x < s 1 x s 2 s 1 s 2 + ( s 1 x ) 2 2 ( s 1 s 2 ) 2 s 1 < x s 2 ( x s 3 ) 2 2 ( s 2 s 3 ) 2 + ( x s 3 ) ( s 2 x ) 2 ( s 2 s 3 ) 2 s 2 < x s 3 ( x s 4 ) ( s 3 x ) 2 ( s 3 s 4 ) 2 ( s 3 x ) 2 2 ( s 3 s 4 ) 2 s 3 < x s 4 ( x s 5 ) 2 2 ( s 4 s 5 ) 2 s 4 x s 4 s 5 s 4 < x s 5 1 x s 5
Y = 3 2 μ
where μ is the comprehensive connection degree and Y is the calculation level eigenvalue. The larger the value of Y is, the lower the water resource value is.

2.3. Price Calculation Model of Water Resource

The comprehensive evaluation vector of water resources is a dimensionless vector. Here, we used the transformation model proposed by Jiang [70] (Equation (7)). The price vector S is related to the water price upper limit P, determined by the equal interval method [35,49], as shown in Equation (8). The water resources price upper limitation represents the water price when the maximum water fee tolerance index is reached, as shown in Equation (9).
W L J = R × S
S = ( P ,   0.75 P ,   0.5 P ,   0.25 P , 0 ) T
P = E A / C D
where WLJ represents the unit price; R represents the comprehensive assessment vector; S is the price vector. P represents the upper limitation of the water price, RMB; E represents the per capita disposable income of residents, RMB; A represents the maximum tolerance index of water price. According to international standards for developing countries’ affordability [71], the water fee for residential use accounts for a maximum of 3% of household income; C refers to annual household water consumption, m3, derived from [72]; D is the water supply cost and the normal profit, RMB, referred to in the “China Water Network” [73].
Integrated accounting refers to the comprehensive calculation of water resource value through a certain model. Many existing studies have concluded that water resource value is only related to the unit price and quantity [74], ignoring the impact of water quality. In fact, water resource value is the unification of quality and quantity [35,47]. Therefore, this paper comprehensively takes the loss value caused by water quality damage into consideration and establishes a water resource value accounting model according to the relationship between water quantity, price, and quality, as shown in Equation (10).
V = D × W L J Q
where V represents the total value (million RMB); D is the quantity of water resources, million m3; WLJ represents the unit price, RMB; Q is the water loss value, in million RMB.

2.4. Model of Pollution Loss for Water Resources

The original water structure is damaged by water pollutants, such as Chemical Oxygen Demand (COD) and NH3-N caused by human life or industrial and agricultural production. When the discharge of sewage exceeds the self-purification capacity of water, the water quality deteriorates severely and the water environmental carrying capacity decreases, resulting in a huge economic loss [75]. According to the James Pollution Loss model [76], the economic loss caused by pollutants in water is not linear with the concentration of pollution [56]. When the concentration of pollutants is low, the damage to the water body will be not obvious. As the concentration increases, the damage to the water body rises sharply. When the concentration of the pollutants rapidly increase, to a certain extent, the damage to the water environment increases slowly until reaching the limitation of loss. This study introduces the water resource economic loss accounting model, as shown in Equations (11)–(13).
Q = r q p
r i = 1 / ( 1 + A × e x p ( B × C ) )
r i n = r i n 1 + ( 1 r i n 1 ) r i n
where Q is water resources loss caused by water pollution, in million RMB; q represents the discharge of wastewater, 108 m3, p for water price, RMB. A, B represent the pollution loss parameters of each pollutant; C means the concentration of each pollutant; ri is the pollution loss rate of each pollutant, and r refers to the comprehensive water resource loss rate.

3. Results

3.1. Physical Accounting for Water Resources in Wuhan City

Physical accounting is a basis for water resource accounting. Table 1 demonstrates the water resource stock as well as its changes in Wuhan City from 2013 to 2017, the data for which came from “Wuhan City Water Resources Bulletin 2013–2017” [72]. Factors influencing water resource increases are water resources from precipitation, inflows, and water return of society. Factors influencing the decrease of water resources are water intake, evaporation, outflows, and ecological consumption for water resources, such as lakes and rivers.
The main factors resulting in the water stock changes in Wuhan City are inflows and outflows. The Yangtze River and Hanshui River run through the city with large transit flows. In 2013, water resources from precipitation were more than evaporation, while from 2014 to 2017, water resources from precipitation were less than evaporation. In the past five years, the evaporation of water resources increased annually to almost twice the amount of precipitation until 2017. The largest stock of water resources appeared in 2016, mainly owing to the largest inflows and precipitation during that year. Interestingly, the stock of water resources declined sharply in 2017, even lower than the year-beginning stock in 2013.

3.2. SPA and Calculation of the Comprehensive Evaluation Vector

Table 2 reflects the assessment system of water resource value and its comprehensive weight. According to GB3838-2002 and some related researches [49,55,56,57], the water resource value evaluation standard system was established, as shown in Table 3, namely set A. The corresponding actual values for the indicators of the water resource value evaluation index system of Wuhan City from 2013 to 2017 are shown in Table 4, namely set B. All data sources were derived from official statistics, such as “Wuhan Statistical Yearbook 2013–2017”, “Wuhan City Water Resources Bulletin 2013–2017”, and “Wuhan Environmental Quality Bulletin 2013–2017” [72,73,77,78].
According to the water resource value accounting index system, the AHP and entropy weight were used to calculate their subjective and objective weights, respectively. Finally, the comprehensive weight was obtained, as shown in Table 2. Then, combined with Table 3 and Table 4, through Equations (3) and (4) the comprehensive evaluation matrix of water resources for Wuhan City in 2017 was calculated. Likewise, the evaluation matrix in the period of 2013–2016 was calculated. The specific comprehensive evaluation results of set pair analyses (SPA) are shown in Table 5.
According to the results in Table 5, the fifth level has a large proportion of the water resource value assessment levels, at about 34.27% in 2016, and even over 50% in other years.

3.3. Evaluation of Water Resource Quality

According to the comprehensive evaluation results, the specific integrated fuzzy index was evaluated by the coupling evaluation model with triangular fuzzy number method and set pair analysis. According to Equations (2)–(6), the specific integrated fuzzy index of the water resources for 2013–2017 were calculated, with values of about 3.48, 3.59, 3.49, 3.33 and 3.55, which belonged to III, IV, III, III, and IV, respectively. The water quality evaluation grades were level IV both in 2014 and 2017, although the water quality in 2017 was better than that in 2014 according to the evaluation index. It could be seen that the coupling model based on set pair analysis and triangular fuzzy numbers had high sensitivity, meaning it could reflect the degree of water pollution more comprehensively and accurately. The lowest value in 2016, 3.33, indicated that the water quality was relatively better than in other years. It could be seen that the water resource value level fluctuated less, with all values between III and IV, which means that the value evaluation grades of water resources in Wuhan City are at a level of medium to relatively low.
As seen from the results above, in general, the water quality of Wuhan City was relatively low. Although there was a significant quantity of water resources, the water quality outlook was not as optimistic. This needs to be taken seriously by relevant departments to promote sustainable water management.

3.4. Calculation of Unit Price for Stock Value of Water Resources

According to Equation (9), for 2017, the per person disposable income for inhabitants E was 38,642 RMB [78], the yearly household water consumption C was 51.1073 m3 [72], the max-value for A was 3% [35,71], and D, the costs and normal profits for water resources, was 3.285 RMB. Thus, the upper limit for water price in 2017 was obtained, at 19.3979 RMB. According to the principle of isometric intervals, the water resource price vector results for S in 2017 were 19.3979, 14.5484, 9.6989, 4.8495, and 0. The unit price of water resources (WLJ) in Wuhan City in 2017 was 5.9293 RMB/m3 according to the results of Table 5 and Equation (7). In a similar way, the unit price for water resources was 3.9405, 4.2865, 5.3049, and 7.7587 RMB/m3 for 2013, 2014, 2015, and 2016, respectively. The results indicated that the unit water price in Wuhan City fluctuated to some extent, with a stable growth from 2013 to 2016, at almost the highest level in 2016, probably owing to the relatively high quality of water resources in that year, but declined in 2017. It could be seen that the unit price of water resources largely depends on the unity of quantity and quality.

3.5. Pollution Loss of Water Resource Assets

On the basis of previous investigations, the factors seriously impacting the quality of water resources in Wuhan City were Chemical Oxygen Demand (COD) and NH3-N [72]. As we can see, the actual contents of these two pollutants are shown in Table 4, namely N1 and N2. The pollution loss parameters A and B for COD are 2799.02 and 0.83548, respectively, while they are 2118.65 and 6.1268 for NH3-N, respectively [79]. Thus, the pollution loss rates r1 and r2 of COD and NH3-N in 2017 could be calculated as 0.99997923 and 0.064318681, respectively. According to Equation (13), the comprehensive loss rate r of water pollution was 0.9999778. The discharge of wastewater in Wuhan city in 2017 was 915 million m3 [77]. The water price in that year was 2.05 RMB/m3 [73]. Finally, the actual pollution loss could be calculated as 1.875 billion RMB for Wuhan City in 2017 according to Equation (11). In the same way, the amounts of pollution loss from 2013 to 2016 were 1.947, 2.009, 2.107, and 1.866 billion RMB, respectively.

3.6. Calculation of Value of Water Resource Assets

In 2017, based on the physical accounting presented in Table 1, the stock of water assets D was obtained, calculated as 3911 million m3. The unit price for the stock value of water resource WLJ was 5.9293 RMB/m3. The pollution loss of water resource assets was 1.875 billion RMB. Thus, according to Equation (10), the total value of water resource assets was calculated, which was 21.315 billion RMB. Similarly, we could also calculate the total asset values for the years 2013–2016 at 14.221, 14.833, 28.375, and 75.558 billion RMB, respectively; details are shown in Table 6. The annual assets of water resources in Wuhan City fluctuate greatly. The initial change is relatively stable, and then surges in 2015 and 2016, reaching the maximum in 2016, mainly due to the large amount of rainfall, at about 75.558 billion RMB, but it slumps in 2017. The water resources assets in Wuhan were 14.221 billion RMB at the beginning of 2013, rising nearly 50% to 21.315 billion RMB at the end of 2017; the assets increased by 7.094 billion RMB.

4. Discussion

This study established the balance sheet of the stock and changes of water resource assets in Wuhan City from 2013 to 2017. Year-end stock was between 3911 and 9979 million m3. Interestingly, the stock of water resources in Jinan ranged from 61 to 128 million m3 from 2011 to 2015 [56], and that of Nanjing was between 2372 and 4615 million m3 from 2011 to 2015 [35], which suggested that Wuhan had more abundant water resources.
From a global perspective, in order to alleviate the scarcity of water, Sustainable Development Goal 6 (SDG 6), set by the United Nations in 2015, focuses on water security and sanitation for all people [80,81]. The goal contains eight targets, with one or more indicators for each of them, to be achieved by 2030 [82]. It provides support for the implementation of integrated water resource management [83], however there is still a need for improvement [84], for example, the gap between targets in SDG 6 and corresponding indicators [80], as well as inequitable water agreements [85]. Utilizing economic valuation techniques could provide a new perspective for water resource management [22]. As there is an absence of a reasonable water price mechanism, the utilization of water resources has been seriously wasted and improperly exploited for a long time, inhibiting the sustainable development of water. Accordingly, it is necessary to study the value accounting of water resources in Wuhan City.
Fifteen indicators were selected from the three aspects, namely environment, resource, and society aspects, to establish the water resource evaluation index system. Then, we combined AHP with entropy weight to compute the integrated weight for each index, effectively solving the problem of the traditional weighting evaluation bring too subjective or absolute, which improved the stability and reliability of evaluation results and provided a reference for a water resource value accounting system. A water resource value assessment system is a complex and blurry system with integrated certainty and uncertainty. Set pair analysis, a new uncertainty theory, is different from traditional probability and fuzzy set theories. This method take full advantage of the information of the water resource evaluation system so that we can calculate the price of water resources more objectively and comprehensively. Meanwhile, the coupling model with set pair analysis and triangular fuzzy number method was used to obtain the fuzzy comprehensive index of water resources value. The results showed that the overall level of water resource value in Wuhan City was medium to low. Differing from previous studies [35,47], this paper demonstrates that the value of water resources is not only related to water price and water volume, but also to the water quality, leading the final total value of water resources obtained being more reliable.
Obviously, in the process of water resource accounting, the lack of uniform standards become the main obstruction. That is why the results obtained by different methods are quite different. Thus, on the basis of a deep understanding of the value connotation for water resources, as well as various value theories, the issue of how to establish a resource value theory that adapts to the requirements of modernization in order to make it suitable for environmentally sustainable management is the next crucial issue to be solved. Additionally, the total amount of water resources and related factors that are chosen to evaluate the value of water resources should be improved. A previous study has shown that groundwater is seriously polluted in the densely populated industrial and commercial areas of Wuhan City [86]. In the future, it is of great significance to conduct more detailed and accurate research studies in order to provide practical support to decision-makers and regional managers, for example, taking groundwater as an independent and significant factor in the model, or even conducting more detailed and in-depth research studies with more agriculture information regarding kind of crops that are cultivated, the weight of surface water, and groundwater consumption as well.

5. Conclusions

To compute the total value for water resources, this research focuses on the water resource assets of Wuhan City, and the results can be outlined as follows. Firstly, this study has created a balance sheet of the stock and changes of water resources in Wuhan from 2013 to 2017. The results indicate that the water resource amounts in Wuhan fluctuated greatly, from 3911 to 9979 million m3. While the initial change was relatively stable, it rose rapidly in 2015–2016 and then fell sharply in 2017. Then, according to the results of the coupling model based on set pair analysis and triangular fuzzy method values, the water quality was optimal, at a level of medium to relatively low. An improved set pair analysis was applied which obtained unit prices from 2013 to 2017 of about 3.94, 4.29, 5.30, 7.76, and 5.93 RMB/m3, respectively, based on the index system with 15 indicators and the comprehensive weight of each index. Lastly, considering the impact of water quality on the value of water resources, the James Pollution Loss model was introduced to compute the water resource loss value, which improved the reliability of accounting results. Based on the relationship between water price, quantity, and quality, the total values of water resources in Wuhan City from 2013 to 2017 were 14.221, 14.833, 28.375, 75.558, and 21.315 billion RMB, respectively. Water resource value accounting is an innovative water resources management method, which is also conducive to the comprehensive evaluation and management of water resources, as well as the sustainable development of water.

Author Contributions

C.L. organized this study, conducted the study design, performed the statistical analysis, and revised the manuscript. J.Z. organized the study, prepared datasets, performed the statistical analysis, and drafted the manuscript. Y.L. prepared the datasets, performed the statistical analysis, and drafted the manuscript. Z.Q. and F.L. contributed to the study design, interpretation of analysis, and revision of the manuscript. Z.Y. contributed to the study design and dataset preparation. L.J. and J.F. contributed to dataset preparation and revision of the manuscript. All authors read and approved the final manuscript.

Funding

This research was funded by the National Natural Science Foundation of China (51,578,222, 61,602,518 and 71,503,268), Humanities and Social Sciences Foundation of Ministry of Education of China (17YJCZH081), Social Science Foundation of Hubei Province (2017161), Hubei special technology innovation (Soft Science Research) (2018ADC074, 2018ADC144), and Social Science Foundation of Hubei Education Department (17Z017).

Conflicts of Interest

The authors declare no conflict of interest.

References

  1. Party, C.C. Decision of the Central Committee of the Communist Party of China on Some Major Issues Concerning Comprehensively Deepening the Reform. The Third Plenary Session of the 18th Central Committee of the Communist Party of China. Available online: http://www.china.org.cn/china/third$_-$ plenary$_-$session/2014-01/16/content$_-$31212602.htm (accessed on 12 November 2013).
  2. Party, C.C. Guiding Opinions of the State Council on the Reform of the System of Paid Use of All Natural Resources Assets for people. The State Council of China. Available online: http://www.gov.cn/zhengce/content/2017-01/16/content_5160287.htm (accessed on 16 January 2017).
  3. Party, C.C. Accelerate the Reform of the Ecological Civilization System and Build a Beautiful China. The 19th National Congress of the Communist Party of China. Available online: http://cpc.people.com.cn/19th/n1/2017/1018/c414305-29594512.html (accessed on 18 October 2017).
  4. Liu, C.Y.; Zhang, J.D.; Li, F.; Yang, J.; Qiu, Z.; Cai, Y.; Zhu, L.; Xiao, M.; Wu, Z. Trace elements spatial distribution characteristics, risk assessment and potential source identification in surface water from Honghu Lake, China. J. Cent. South Univ. 2018, 25, 1598–1611. [Google Scholar] [CrossRef]
  5. Li, F.; Qiu, Z.Z.; Zhang, J.D.; Liu, C.; Cai, Y.; Xiao, M.; Zhu, L. Temporal variation of major nutrients and probabilistic eutrophication evaluation based on stochastic-fuzzy method in Honghu Lake, Middle China. Sci. China Tech. Sci. 2019, 62, 417–426. [Google Scholar] [CrossRef]
  6. Zhang, J.; Li, Y.; Liu, C.; Li, F.; Zhu, L.; Qiu, Z.; Xiao, M.; Yang, Z.; Cai, Y. Concentration Levels, Biological Enrichment Capacities and Potential Health Risk Assessment of Trace Elements in Eichhornia crassipes from Honghu Lake, China. Sci. Rep. 2019, 9, 2431. [Google Scholar] [CrossRef] [PubMed]
  7. Watkins, K. Human Development Report 2006-Beyond Scarcity: Power, Poverty and the Global Water Crisis. UNDP Human Development Reports, 1 December 2006. [Google Scholar]
  8. Hambira, W.L. Natural resources accounting: A tool for water resources management in Botswana. Phys. Chem. Earth 2007, 32, 1310–1314. [Google Scholar] [CrossRef]
  9. Feng, Z.M.; Yang, Y.; Li, P. From Natural Resources Accounting to Balance-sheet of Natural Resources Asset Compilation. J. Chin. Acad. Sci. 2014, 29, 449–456. (In Chinese) [Google Scholar]
  10. Gain, A.K.; Giupponi, C. A dynamic assessment of water scarcity risk in the Lower Brahmaputra River Basin: An integrated approach. Ecol. Indic. 2015, 48, 120–131. [Google Scholar] [CrossRef]
  11. Mekonnen, M.M.; Hoekstra, A.Y. Four billion people facing severe water scarcity. Sci. Adv. 2016, 2, e1500323. [Google Scholar] [CrossRef]
  12. Pahl-Wostl, C.; Craps, M.; Dewulf, A.; Mostert, E.; Tabara, D.; Taillieu, T. Social learning and water resources management. Ecol. Soc. 2007, 12, 5. [Google Scholar] [CrossRef]
  13. Jordan, S.J.; Hayes, S.E.; Yoskowitz, D.; Smith, L.M.; Summers, J.K.; Russell, M.; Benson, W.H. Accounting for Natural Resources and Environmental Sustainability: Linking Ecosystem Services to Human Well-Being. Environ. Sci. Technol. 2010, 44, 1530–1536. [Google Scholar] [CrossRef]
  14. Hussein, H. Lifting the veil: Unpacking the discourse of water scarcity in Jordan. Environ. Sci. Policy 2018, 89, 385–392. [Google Scholar] [CrossRef]
  15. Edwards, G.A.S. Shifting Constructions of Scarcity and the Neoliberalization of Australian Water Governance. Environ. Plan. A Econ. Space 2013, 45, 1873–1890. [Google Scholar] [CrossRef]
  16. Falkenmark, M. Middle East Hydropolitics: Water Scarcity and Conflicts in the Middle East. AMBIO A J. Hum. Environ. 1989, 18, 350–352. [Google Scholar]
  17. Mehta, L. The Manufacture of Popular Perceptions of Scarcity: Dams and Water-Related Narratives in Gujarat, India. World Dev. 2001, 29, 2025–2041. [Google Scholar] [CrossRef]
  18. Hussein, H. Whose ‘reality’? Discourses and hydropolitics along the Yarmouk River. Contemp. Levant 2017, 2, 103–115. [Google Scholar] [CrossRef]
  19. Hussein, H. Politics of the Dead Sea Canal: A historical review of the evolving discourses, interests, and plans. Water Int. 2017, 42, 527–542. [Google Scholar] [CrossRef]
  20. Falkenmark, M.; Lundqvist, J.; Widstrand, C. Implications of biomass strategy for communities and policies. Int. J. Water Resour. Dev. 1990, 6, 29–43. [Google Scholar] [CrossRef]
  21. Hussein, H. An analysis of the framings of water scarcity in the Jordanian national water strategy. Water Int. 2019, 44, 6–13. [Google Scholar] [CrossRef]
  22. Kanakoudis, V.; Tsitsifli, S.; Papadopoulou, A. Integrating the Carbon and Water Footprints’ Costs in the Water Framework Directive 2000/60/EC Full Water Cost Recovery Concept: Basic Principles Towards Their Reliable Calculation and Socially Just Allocation. Water 2012, 4, 45–62. [Google Scholar] [CrossRef]
  23. Pahl-Wostl, C.; Mostert, E.; Tabara, D. The Growing Importance of Social Learning in Water Resources Management and Sustainability Science. Ecol. Soc. 2008, 13, 24. [Google Scholar] [CrossRef]
  24. Cai, Z.F.; Yang, Q.; Zhang, B.; Chen, H.; Chen, B.; Chen, G.Q. Water resources in unified accounting for natural resources. Commun. Nonlinear Sci. Numer. Simul. 2009, 14, 3693–3704. [Google Scholar] [CrossRef]
  25. Zhou, Q.; Hanasaki, N.; Fujimori, S. Economic Consequences of Cooling Water Insufficiency in the Thermal Power Sector under Climate Change Scenarios. Energies 2018, 11, 2686. [Google Scholar] [CrossRef]
  26. Liu, Y.; Hu, X.H.; Zhang, Q.; Zheng, M.B. Improving Agricultural Water Use Efficiency: A Quantitative Study of Zhangye City Using the Static CGE Model with a CES Water-Land Resources Account. Sustainability 2017, 9, 308. [Google Scholar] [CrossRef]
  27. Li, F.; Zhang, J.D.; Liu, W.; Liu, J.; Huang, J.; Zeng, G. An exploration of an integrated stochastic-fuzzy pollution assessment for heavy metals in urban topsoil based on metal enrichment and bioaccessibility. Sci. Total Environ. 2018, 644, 649–660. [Google Scholar] [CrossRef]
  28. Zhang, N.; Li, Y.P.; Huang, W.W.; Liu, J. An Inexact Two-Stage Water Quality Management Model for Supporting Sustainable Development in a Rural System. J. Environ. Inform. 2014, 24, 52–64. [Google Scholar] [CrossRef]
  29. Weinzettel, J.; Pfister, S. International trade of global scarce water use in agriculture: Modeling on watershed level with monthly resolution. Ecol. Econ. 2019, 159, 301–311. [Google Scholar] [CrossRef]
  30. Foster, T.; Brozovic, N. Simulating Crop-Water Production Functions Using Crop Growth Models to Support Water Policy Assessments. Ecol. Econ. 2018, 152, 9–21. [Google Scholar] [CrossRef] [Green Version]
  31. Li, Z.Q.; Zhou, B.H.; Teng, D.B.; Yang, W.M.; Qiu, D.H. Comprehensive evaluation method of groundwater environment in a mining area based on fuzzy set theory. Geosyst. Eng. 2018, 21, 103–112. [Google Scholar] [CrossRef]
  32. Zhao, K.Q. Set Pair Analysis and its Preliminary. J. Nat. Exploration 1994, 1, 67–72. (In Chinese) [Google Scholar]
  33. Yu, F.R.; Qu, J.H.; Li, Z.P.; Gao, Z.P. Application of set pair analysis based on the improved five-element connectivity in the evaluation of groundwater quality in XuChang, Henan Province, China. Water Sci. Technol.-Water Supply 2017, 17, 632–642. [Google Scholar] [CrossRef]
  34. Jing, J.; Qian, H.; Chen, Y.F.; Xi, W.J. Assessment of Groundwater Quality Based on Matter Element Extension Model. J. Chem. 2013, 7, 715647. [Google Scholar] [CrossRef]
  35. Jia, Y.Z.; Shen, J.Q.; Wang, H. Calculation of Water Resource Value in Nanjing Based on a Fuzzy Mathematical Model. Water 2018, 10, 920. [Google Scholar] [CrossRef]
  36. Zhao, K.Q. The application of SPA-based identical-discrepancy-contrary system theory in artificial intelligence research. Trans. Intell. Syst. 2007, 2, 20–35. (In Chinese) [Google Scholar]
  37. Feng, L.H.; Sang, G.S.; Hong, W.H. Statistical Prediction of Changes in Water Resources Trends Based on Set Pair Analysis. Water Resour. Manag. 2014, 28, 1703–1711. [Google Scholar] [CrossRef]
  38. Gao, S.D.; Fang, D.X.; Pan, Z.W. Research on comprehensive index assessment model of river water quality based on set pair analysis theory. J. Hefei Univ. Technol. 2015, 5, 654–658. (In Chinese) [Google Scholar]
  39. Wang, H.Z.; Duan, Y.Y.; Fu, C. Water Security Evaluation of Anhui Province Based on Analytic Hierarchy Process. South-North Water Transf. Water Sci. Technol. 2014, 12, 37–41. (In Chinese) [Google Scholar]
  40. Li, F.; Zhang, J.D.; Jiang, W.; Liu, C.Y.; Zhang, Z.M.; Zhang, C.D.; Zeng, G.M. Spatial health risk assessment and hierarchical risk management for mercury in soils from a typical contaminated site, China. Environ. Geochem. Health 2017, 39, 923–934. [Google Scholar] [CrossRef]
  41. Wuhan Municipal People’s Government. Available online: http://www.wuhan.gov.cn/ (accessed on 30 July 2019).
  42. Qin, J.; Mbululo, Y.; Yang, M.Y.; Yuan, Z.X.; Nyihirani, F.; Zheng, X. Chemical Composition and Deposition Fluxes of Water-Soluble Inorganic Ions on Dry and Wet Deposition Samples in Wuhan, China. Int. J. Environ. Res. Public Health 2019, 16, 132. [Google Scholar] [CrossRef]
  43. Zhang, Z.; Lu, X.H.; Zhou, M.; Song, Y.; Luo, X.; Kuang, B. Complex Spatial Morphology of Urban Housing Price Based on Digital Elevation Model: A Case Study of Wuhan City, China. Sustainability 2019, 11, 348. [Google Scholar] [CrossRef]
  44. Ke, X.L.; Wang, L.Y.; Ma, Y.C.; Pu, K.P.; Zhou, T.; Xiao, B.Y.; Wang, J.H. Impacts of Strict Cropland Protection on Water Yield: A Case Study of Wuhan, China. Sustainability 2019, 11, 184. [Google Scholar] [CrossRef]
  45. Wang, Y.T.; Cheng, H.X.; Huang, L. Water resources carrying capacity evaluation of a dense city group: A comprehensive water resources carrying capacity evaluation model of Wuhan urban agglomeration. Urban Water J. 2018, 15, 615–625. [Google Scholar] [CrossRef]
  46. Zhao, K.Q. Study on set pair analysis and entropy. J. Zhejiang Univ. Soc. Sci. Ed. 1992, 2, 68–75. (In Chinese) [Google Scholar]
  47. Dong, G.H.; Shen, J.Q.; Jia, Y.Z.; Sun, F.H. Comprehensive Evaluation of Water Resource Security: Case Study from Luoyang City, China. Water 2018, 10, 1106. [Google Scholar] [CrossRef]
  48. Chou, C.M. Application of Set Pair Analysis-Based Similarity Forecast Model and Wavelet Denoising for Runoff Forecasting. Water 2014, 6, 912–928. [Google Scholar] [CrossRef] [Green Version]
  49. Li, J.; Min, Q.W.; Li, W.H.; Bai, Y.Y.; Yang, L.; Bijaya, G.C.D. Evaluation of water resources conserved by forests in the Hani rice terraces system of Honghe County, Yunnan, China: An application of the fuzzy comprehensive evaluation model. J. Mt. Sci. 2016, 13, 744–753. [Google Scholar] [CrossRef]
  50. Guo, E.L.; Zhang, J.Q.; Ren, X.H.; Zhang, Q.; Sun, Z.Y. Integrated risk assessment of flood disaster based on improved set pair analysis and the variable fuzzy set theory in central Liaoning Province, China. Nat. Hazards 2014, 74, 947–965. [Google Scholar] [CrossRef]
  51. Pan, Z.W.; Jin, J.L.; Li, C.H.; Ning, S.W.; Zhou, R.X. A Connection Entropy Approach to Water Resources Vulnerability Analysis in a Changing Environment. Entropy 2017, 19, 591. [Google Scholar] [CrossRef]
  52. Du, C.Y.; Yu, J.J.; Zhong, H.P.; Wang, D.D. Operating mechanism and set pair analysis model of a sustainable water resources system. Front. Env. Sci. Eng. 2015, 9, 288–297. [Google Scholar] [CrossRef]
  53. Ward, J.; Kaczan, D. Challenging Hydrological Panaceas: Water poverty governance accounting for spatial scale in the Niger River Basin. J. Hydrol. 2014, 519, 2501–2514. [Google Scholar] [CrossRef]
  54. The Ministry of Water Resources the People’s Republic of China. 13th Five-Year Plan of Water Conservancy Reform and Development. Available online: http://www.mwr.gov.cn/ztpd/2016ztbd/qgslsswgh/ (accessed on 10 October 2018).
  55. Ministry of Environmental Protection, PRC CB3838-2002. Environmental Quality Standards for Surface Water; Ministry of Environmental Protection, PRC: Beijing, China, 2002.
  56. Yang, Y.H.; Liu, Y.; Cao, S.L.; Cheng, Y.F. A Method of Evaluating Water Resource Assets and Liabilities: A Case Study of Jinan City, Shandong Province. Water 2017, 9, 575. [Google Scholar] [CrossRef]
  57. Jian, F.H.; Song, X.Y.; Yu, W.B. Construction of the evaluation system of water asset price with fuzzy comprehensive assessment indexes: Taking Zhangye Prefecture in Heihe River basin as an example. J. Glaciol. Geocryol. 2016, 38, 567–572. (In Chinese) [Google Scholar]
  58. Sun, S.K.; Liu, J.; Wu, P.; Wang, Y.B.; Zhao, X.N.; Zhang, X.H. Comprehensive evaluation of water use in agricultural production: A case study in Hetao Irrigation District, China. J. Clean. Prod. 2016, 112, 4569–4575. [Google Scholar] [CrossRef]
  59. Johannsen, I.M.; Hengst, J.C.; Goll, A.; Hollermann, B.; Diekkruger, B. Future of Water Supply and Demand in the Middle Draa Valley, Morocco, under Climate and Land Use Change. Water 2016, 8, 313. [Google Scholar] [CrossRef]
  60. Mano, T.B.; Guillen-Gosalbez, G.; Jimenez, L.; Ravagnani, M. Synthesis of heat exchanger networks with economic and environmental assessment using fuzzy-Analytic Hierarchy Process. Chem. Eng. Sci. 2019, 195, 185–200. [Google Scholar] [CrossRef]
  61. Leong, Y.T.; Tan, R.R.; Aviso, K.B.; Chew, I.M.L. Fuzzy analytic hierarchy process and targeting for inter-plant chilled and cooling water network synthesis. J. Clean. Prod. 2016, 110, 40–53. [Google Scholar] [CrossRef]
  62. Li, L.; Liu, F.; Li, C.B. Customer satisfaction evaluation method for customized product development using Entropy weight and Analytic Hierarchy Process. Comput. Ind. Eng. 2014, 77, 80–87. [Google Scholar] [CrossRef]
  63. Liu, H.H.; Sang, S.X.; Wang, G.G.X.; Li, Y.M.; Li, M.X.; Liu, S.Q. Evaluation of the synergetic gas-enrichment and higher-permeability regions for coalbed methane recovery with a fuzzy model. Energy 2012, 39, 426–439. [Google Scholar] [CrossRef]
  64. Cui, Y.; Feng, P.; Jin, J.L.; Liu, L. Water Resources Carrying Capacity Evaluation and Diagnosis Based on Set Pair Analysis and Improved the Entropy Weight Method. Entropy 2018, 20, 359. [Google Scholar] [CrossRef]
  65. Men, B.H.; Liu, H.L.; Tian, W.; Liu, H.Y. Evaluation of Sustainable Use of Water Resources in Beijing Based on Rough Set and Fuzzy Theory. Water 2017, 9, 852. [Google Scholar] [CrossRef]
  66. Li, F.; Qiu, Z.Z.; Zhang, J.D.; Liu, C.Y.; Cai, Y.; Xiao, M.S. Spatial Distribution and Fuzzy Health Risk Assessment of Trace Elements in Surface Water from Honghu Lake. Int. J. Environ. Res. Public Health 2017, 14, 1011. [Google Scholar] [CrossRef]
  67. Peng, T.; Chen, X.H.; Wang, G.X.; Li, Y.H.; Liu, J. Assessment of coastal wetland ecosystem health based on set pair analysis and triangular fuzzy numbers. Ecol. Environ. Sci. 2014, 23, 917–922. (In Chinese) [Google Scholar]
  68. Gao, X.X.; Nie, Y.; Dong, D.W. Evaluation of coal mine groundwater quality with coupling model based on SPA-ITFN. Ming Saf. Environ. Prot. 2015, 42, 68–71. (In Chinese) [Google Scholar]
  69. Zhu, J.Y.; Wang, D.; Wang, Y.K. Comprehensive ecological risk classification of polycyclic aromatic hydrocarbons in sediments by S-T model. China Environ. Sci. 2018, 38, 2283–2288. (In Chinese) [Google Scholar]
  70. Jiang, W.L. Value Theory of Water Resources; Science Press: Beijing, China, 1998. [Google Scholar]
  71. Garcia-Valinas, M.A.; Martinez-Espineira, R.; Gonzalez-Gomez, F. Affordability of residential water tariffs: Alternative measurement and explanatory factors in southern Spain. J. Environ. Manag. 2010, 91, 2696–2706. [Google Scholar] [CrossRef]
  72. Wuhan Water Affairs Bureau. Available online: http://swj.wuhan.gov.cn/szy/index.jhtml (accessed on 12 November 2018).
  73. Party, C.C. Water Price. Available online: http://www.h2o-china.com/price/view?townid=254 (accessed on 12 November 2018).
  74. Gan, H.; Wang, L.; Cao, Y.B.; You, J.J.; Gan, Z.G.; Qin, C.H.; He, S.; Xu, K. Multi-dimensional overall regulatory modes and threshold values for water cycle of the Haihe River Basin. Chin. Sci. Bull. 2013, 58, 3320–3339. [Google Scholar] [CrossRef]
  75. Yang, X.H.; He, J.; Di, C.L.; Li, J.Q. Vulnerability of Assessing Water Resources by the Improved Set Pair Analysis. Therm. Sci. 2014, 18, 1531–1535. [Google Scholar] [CrossRef]
  76. James, D.L.; Robert, R.L. Economics of Water Resources Planning. 1971. Available online: http://xueshu.baidu.com/usercenter/paper/show?paperid=687c0db4ad732ea5fcd7fff2fed75094&site=xueshu_se&hitarticle=1 (accessed on 16 November 2018).
  77. Wuhan Environmental Protection Bureau. Available online: http://hbj.wuhan.gov.cn/hbHjjc/index.jhtml?typename=548 (accessed on 22 November 2018).
  78. Hubei Province Bureau of Statistics. Available online: http://www.stats-hb.gov.cn/info/iList.jsp? cat_id=10436 (accessed on 22 November 2018).
  79. Rao, Q.H.; Qiu, Y.; Xu, L.Z. Estimating Model of Economic Loss for Minjiang River Caused by Water Pollution. Water Resour. Power. 2014, 3, 47–49. (In Chinese) [Google Scholar]
  80. Guppy, L.; Mehta, P.; Qadir, M. Sustainable development goal 6: Two gaps in the race for indicators. Sustain. Sci. 2019, 14, 501–513. [Google Scholar] [CrossRef]
  81. Vanham, D.; Hoekstra, A.Y.; Wada, Y.; Bouraoui, F.; de Roo, A.; Mekonnen, M.M.; van de Bund, W.J.; Batelaan, O.; Pavelic, P.; Bastiaanssen, W.G.M.; et al. Physical water scarcity metrics for monitoring progress towards SDG target 6.4: An evaluation of indicator 6.4.2 “Level of water stress”. Sci. Total Environ. 2018, 613–614, 218–232. [Google Scholar] [CrossRef]
  82. Nhamo, G.; Nhemachena, C.; Nhamo, S. Is 2030 too soon for Africa to achieve the water and sanitation sustainable development goal? Sci. Total Environ. 2019, 669, 129–139. [Google Scholar] [CrossRef]
  83. Bertule, M.; Glennie, P.; Bjørnsen, P.K.; Lloyd, G.J.; Kjellen, M.; Dalton, J.; Rieu-Clarke, A.; Romano, O.; Tropp, H.; Newton, J.; et al. Monitoring Water Resources Governance Progress Globally: Experiences from Monitoring SDG Indicator 6.5.1 on Integrated Water Resources Management Implementation. Water 2018, 10, 1744. [Google Scholar] [CrossRef]
  84. Hering, J.G. Managing the ‘Monitoring Imperative’ in the Context of SDG Target 6.3 on Water Quality and Wastewater. Sustainability 2017, 9, 1572. [Google Scholar] [CrossRef]
  85. Hussein, H.; Menga, F.; Greco, F. Monitoring Transboundary Water Cooperation in SDG 6.5.2: How a Critical Hydropolitics Approach Can Spot Inequitable Outcomes. Sustainability 2018, 10, 3640. [Google Scholar] [CrossRef]
  86. Wang, Y.; Merkel, B.J.; Li, Y.; Ye, H.; Fu, S.; Ihm, D. Vulnerability of groundwater in Quaternary aquifers to organic contaminants: A case study in Wuhan City, China. Environ. Geol. 2007, 53, 479–484. [Google Scholar] [CrossRef]
Figure 1. Water resource distribution map of Wuhan City.
Water 11 01718 g001
Table 1. Water resource stock for Wuhan in the period of 2013–2017 (108 m3).
ItemYear
20132014201520162017
Year-beginning stock47.9241.0339.2957.4699.79
Increase in stockWater resources from precipitation100.2598.27119.02154.0398.32
Inflows63877237681175987437
Water return of society0.621.20.680.440.36
Decrease in stockWater intake40.1339.5237.5934.0234.61
Evaporation96.4698.51122.69188.71188.36
Outflows63587200675274877373
Ecological water consumption of rivers and lakes0.170.180.250.410.39
Year-end stock41.0339.2957.4699.7939.11
Table 2. The assessment system for water resource assets and the corresponding weights.
Criterion AbbreviationIndex LayerSubjective WeightObjective WeightComprehensive Weight
M1: EnvironmentN1Ammonia nitrogen (mg/L)0.0690.034220.0516
N2Chemical oxygen demand (COD; mg/L)0.0710.000450.0357
N3Sewage treatment rate (%)0.0690.000350.0347
N4Water functional area compliance rate (%)0.0740.603440.3385
M2: ResourcesN5Per capita water resources (m3/people)0.0810.102910.0919
N6Water resources per unit area (10,000 m3/km2)0.0680.108860.0884
N7The amount of water supply(108 m3)0.0620.003130.0325
M3: SocietyN8Population density (people/hm2)0.0590.000310.0296
N9Per capita water consumption(m3/person)0.0790.005650.0423
N10Per capita gross domestic product (GDP; 104 RMB/person)0.050.008510.0292
N11GDP water consumption (m3/104 RMB)0.0610.025080.0430
N12Water resource development and utilization rate (%)0.0680.082330.0751
N13Industrial added value of water consumption (m3/104 RMB)0.0630.024440.0437
N14Industrial water reuse rate (%)0.0580.000030.0290
N15Agricultural irrigation water utilization factor0.0690.00030.0346
Table 3. The standards for the water resource value assessment system.
IndexStandards for Water Resource Assessment
I HighII Relatively HighIII MediumIV Relatively LowV Low
N11015203040
N29080706040
N39080706050
N4300020001200800400
N5200100755025
N66050403020
N751050150300
N8300500600700800
N95000300020001000500
N105010050010003000
N111020304050
N121020100200500
N138570604030
N140.780.710.640.570.5
N150.150.511.52
Table 4. The indicators of the water resource value assessment system.
Index20132014201520162017
N12625252425
N29191929596
N351.145.448.150.946.3
N4401.47380.05542.08926.88359.04
N548.345.8567.05116.4545.51
N640.1339.5237.5934.0234.61
N712.0312.0612.3812.5612.67
N8393382354316318
N989,000105,900120,600110,700122,000
N104439342926
N1197.810165.4134.0988.49
N125149433730
N1388.5188.688.789.290
N140.490.480.490.490.51
N151.3241.0310.7510.7910.813
Table 5. Comprehensive evaluation vector of water resources.
YearComprehensive Evaluation Vector (R)
2013(0.1585, 0.0750, 0.0830, 0.1745, 0.5090)
2014(0.1609, 0.0733, 0.1146, 0.0963, 0.5845)
2015(0.1668, 0.0961, 0.1430, 0.0865, 0.5499)
2016(0.1894, 0.1609, 0.1493, 0.1353, 0.3427)
2017(0.1744, 0.0890, 0.0726, 0.1129, 0.5511)
Table 6. Annual water resources value in Wuhan City from 2013 to 2017.
Item20132014201520162017
Unit price (RMB/m3)3.94054.28655.30487.75935.929
Year-end stock (100 million m3)41.0339.2957.4699.7939.11
Pollution loss Q (billion RMB)1.9472.0092.1071.8661.875
Assets of water resource stocks (billion RMB)14.22114.83328.37575.55821.315

