Article

Water Quality and Hydromorphological Variability in Greek Rivers: A Nationwide Assessment with Implications for Management

by
Konstantinos Stefanidis
*,
George Papaioannou
,
Vassiliki Markogianni
and
Elias Dimitriou
Hellenic Centre for Marine Research, Institute of Marine Biological Resources and Inland Waters, 46.7 km of Athens—Sounio Ave., 19013 Anavyssos, Attiki, Greece
*
Author to whom correspondence should be addressed.
Water 2019, 11(8), 1680; https://doi.org/10.3390/w11081680
Submission received: 27 June 2019 / Revised: 30 July 2019 / Accepted: 11 August 2019 / Published: 13 August 2019
(This article belongs to the Special Issue Assessing Surface and Ground- Water Vulnerability and Pollution Risk)

Abstract

:
European rivers are under ecological threat by a variety of stressors. Nutrient pollution, soil erosion, and alteration in hydrology are considered the most common problems that riverine ecosystems are facing today. Not surprisingly, river monitoring activities in Europe have been intensified during the last few years to fulfil the Water Framework Directive (WFD) requirements. With this article, we present a nationwide assessment of the water quality and hydromorphological variability in Greek Rivers based on the results of the national monitoring program under the WFD. Water quality and hydromorphological data from 352 sites belonging to 221 rivers were explored with principal component analysis (PCA) to identify main environmental gradients and the variables that contribute the most to the total variance. Nitrate, phosphate, ammonium and electrical conductivity were identified as the most important water chemistry parameters, and typical vector-based spatial data analysis was applied to map their spatial distribution at sub-basin scale. In addition, we conducted simple linear models between the aforementioned parameters and the share of land uses within the basin of each sampling site in order to identify significant relationships. Agriculture was the most important land use affecting the nitrate and electrical conductivity, while artificial surfaces were the best predictor for phosphate and ammonium. Concerning the hydromorphological variability, fine types of substrate and discharge were the variables with the highest contribution to the total variance. Overall, the results of this article can be used for the preliminary assessment of susceptible areas/rivers to high levels of nutrient pollution that can aid water managers to formulate recommendations for improvement of further monitoring activities. Furthermore, our findings implicate the need for enhancement of agri-environmental measures and reduction of point-source pollution in disturbed areas to avert the risk of further environmental degradation under the anticipated global change.

1. Introduction

The Directive 2000/60/EC established a framework for Community action in the field of water policy and set the objectives to prevent further status deterioration of all Community waters—rivers, lakes, coastal waters, and groundwaters—in order to achieve and maintain their good status by 2015 [1,2], which was extended from 2015 to 2021 and from 2021 to 2027 [3]. Some of the main objectives of the Water Framework Directive (WFD), except for the achievement of good status, include the provision of an integrated water management system based on hydrological catchments, bringing together economic and ecological perspectives (Art. 3) [3], the involvement of active stakeholders and the public (Art. 14), and the introduction of a combined approach to pollution control (Art. 10) [2].
The implementation of the WFD relies on the measures proposed by the River Basin Management Plans (RBMPs) and the Programmes of Measures (PoMs) of river reconstruction, rehabilitation or restoration [4]. Quality elements for assessment are divided into biological, hydromorphological, and physicochemical, and for each one, a descriptive definition of high, good, moderate, poor, and bad status is given. Each National authority should set standards for those elements most relevant to the pressures faced by the water body under its responsibility and classify waters accordingly [2]. Across EU Member States discussions are on-going as to how to integrate climate change into the process of RBMPs for the next management cycles (2015–2027) of the WFD [1]. A key challenge in this context is the adaptation to climate change impacts through the design and implementation of PoMs at the river basin scale [5,6,7].
Since the second WFD implementation cycle had ended in 2015 [8,9], several problems concerning the implementation of the WFD have been recorded and summed up in the reports of all EU27 Member States (MSs). Those problems mainly concern the failure of some MSs to comply with certain WFD Articles, the deficient validation of surface waters’ typology, undeveloped financial analysis, little progress in transparent pricing policies implementation, generalized measures proposed in the RBMPs, and the absence of a schedule for the measures implementation. Furthermore, the most important issue in the WFD implementation among EU Northern and Southern countries was the water quality problems in contrast to water quantity problems that the latter usually face. Another striking difference in the WFD implementation among MSs concerns the effectiveness in the utilization of water resources management tools, as certain MSs have greater experience than others [8,9,10].
At the national level, Institute of Marine Biological Resources and Inland Waters (IMBRIW) of Hellenic Centre for Marine Research (HCMR) has been assigned by the Special Water Secretariat, which belongs to the Greek Ministry of the Environment, Energy, and Climate Change to implement the WFD in Greek rivers. Reference conditions were defined for each Intercalibration Type (ICT) of rivers according to the available information for the Biological Quality Elements (BQEs), the physicochemical and hydromorphological conditions. ICTs refer to the river typology that is used by each geographic intercalibration group in order to identify river systems with common characteristics. BQEs comprise four biological elements that are used for the assessment of ecological quality of rivers according to the WFD. These four elements are the benthic invertebrates, benthic diatoms, fish, and aquatic macrophytes. During the First Cycle of Management, all RBMPs had identifed the significant pressures from point sources, diffuse sources, water abstraction sources, groundwater abstractions, flow regulation and morphological alterations, saline intrusion, artificial recharge, land cover and population density, and other pressures [8,9]. Since then, numerous research approaches [11,12,13,14,15] have tried to promote the River Basin Management Plans (RBMPs) of the WFD implementation process by developing methods for the monitoring and assessment of rivers’ ecological status, by taking into account objective indicators demonstrative for hydromorphological, water physicochemical, and biological elements [16,17]. Seasonal or more frequent water sampling, hydromorphological analysis, identification of pollution patterns and sources (mainly through land cover/use analysis) and advanced statistical elaborations are some of the available tools that have been extensively used in order to determine the most water quality-relevant and significant environmental variables.
In Greece, water quality and hydromorphological monitoring of all river and catchment sizes is systematically implemented on the last decades compared to other countries [18]. Based on Reference [18], till the early 2000s, approximately 35% of the total Greek runoff that enters the sea from river basins had unknown hydrological and hydrochemical regimes. Unfortunately, due to a lack of data, especially for small and medium catchments, the majority of the studies that deals with the water quality and the hydromorphological variability are only focused at catchment scale [15,19,20,21,22,23,24,25]. Until recently, there was no large-scale water quality and hydromorphological data assemblage for all river and catchment sizes, highlighting a knowledge gap and the importance of the Greek rivers monitoring program that is based on the WFD implementation.
Therefore, in the context of this paper, hydromorphological and water quality results of the national monitoring program 2012–2015 have been utilized. The present study is the first that focuses on the variability of water quality and hydromorpholy at the national scale. Those results incorporate, among others, the concentrations of certain nutrients, values of physicochemical variables, types of substrate, water discharge, and land cover/use analysis at sub-basin and/or basin scale of each sampling site. The main scope of this research is the determination of the dominant environmental factors affecting the total quality variance by using strong statistical tools (PCA, linear modelling and network modularity) in order to constitute a strong background in future river monitoring management plans. In contrast to most of the other works that attempt to assess water quality and hydromorphology in individual catchments and/or water bodies, our study is set on a national scale and utilizes a vast dataset that was compiled during a standardized sampling effort under the scope of the national monitoring program. Thus, our methodological approach ensures homogeneous results that cover the whole national territory and can be assessed for extracting useful conclusions with implications for future river management.

2. Materials and Methods

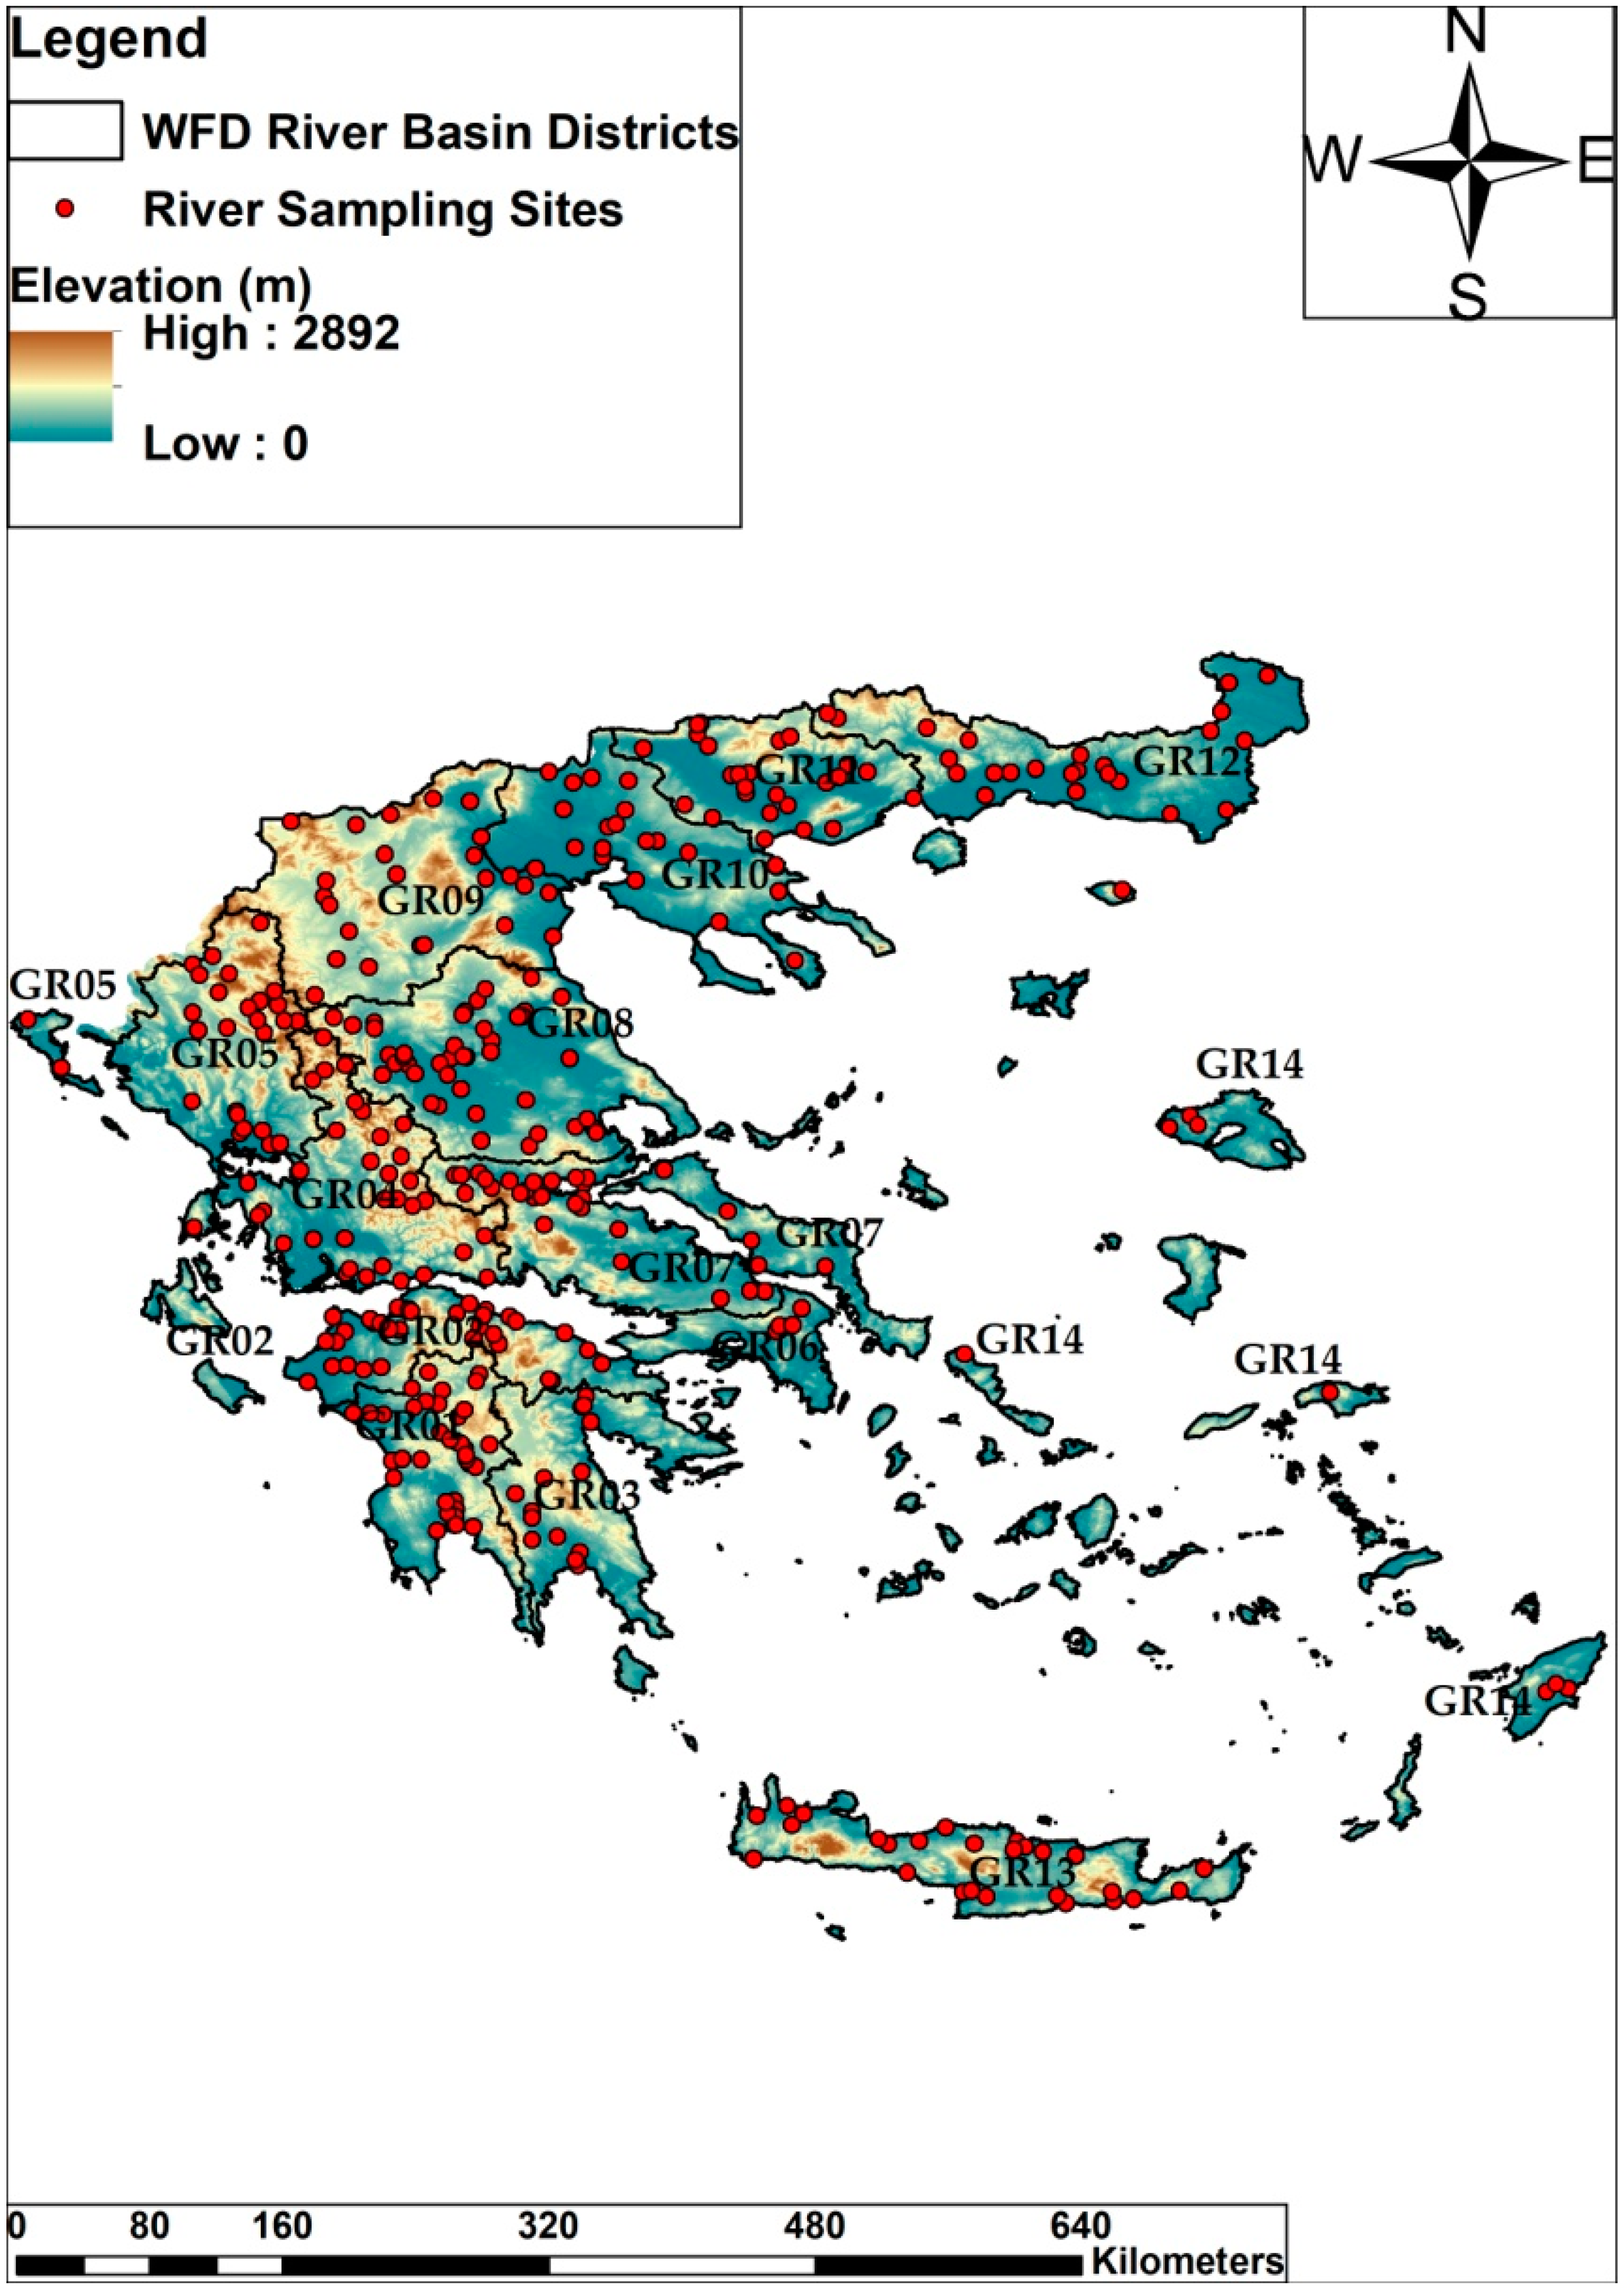
2.1. Description of Data

Physicochemical and hydromorphological data for 352 sampling sites (Table 1, Figure 1) were obtained by the results of the national monitoring programme in Greek rivers for the period 2012–2015. The coverage of the sampling network extends to the whole national territory and is distributed among fourteen WFD River Basin Districts (RBDs) (Table 1, Figure 1). Multi-annual seasonal field samplings were carried out in the operational sites of the network, while surveillance sites were sampled once for the duration of the monitoring. Thus, our dataset consisted of 1002 records containing information on nine physicochemical and fifteen hydromorphological variables (Table 2). In addition, the nutrient quality classification score (NCS) for each site was calculated according to the Nutrient-quality Classification System [18]. NCS was developed to fill the gap of chemical classification of small and intermediate Greek rivers influenced by nutrient pollution. The system was based on the average values of nutrients for the five ecological quality classes defined by the benthic invertebrates. For more details please see [18].
Collection of water samples, field measurements, and laboratory analyses were conducted by the Department of Inland Waters of the Hellenic Centre for Marine Research (HCMR) for the requirements of the WFD implementation. Technical details about field protocols and water chemistry analyses can be found in the Greek Government Gazette II 1635 of 9 June 2016 [26]. Land use data for each basin of the sampling site were obtained from the CORINE (Coordination of Information on the Environment) 2012 maps. The land cover database includes information on 44 land cover classes and is available for download from the European Environment Agency website (www.eea.europa.eu). For the purposes of this work, the shares of land uses were calculated at the 1st level of CORINE classification and were used in further analyses.

2.2. Statistical Analysis

The relationships between the environmental variables were evaluated with correlation analysis and estimating the Pearson r coefficient. Highly correlated variables (r > 0.8) were considered redundant and omitted from further analysis. Next, we conducted a principal component analysis (PCA) separately for water quality and hydromorphological data to explore for hidden patterns and environmental gradients and identify the variables that explain the most variation in our data. Additionally, we produced a series of boxplots to visually assess the spatial distribution of the most significant parameters among river intercalibration types (ICTs) and RBDs.
A network analysis was conducted with the Gephi software v.0.9.2 (https://gephi.org/users/download/) [27], and its modularity feature was used to detect commonalities among rivers and sampling sites with regard to their physicochemical status.
In order to explore for significant relationships among land uses within the basin of each sampling site and for the most important water chemistry parameters, we ran simple linear models where the water chemistry parameter of interest was the response variable, and the shares of agricultures, artificial surfaces, and forests with semi-natural cover were the model predictors. A linear model with NCS as response variable was also employed to show the effects of land uses on the overall water quality.
Correlation analysis was conducted with the "corrplot” package [28] and PCA with the “FactoMineR” package [29] in R environment [30]. Linear models were fitted in R environment with the “lm” function [30].

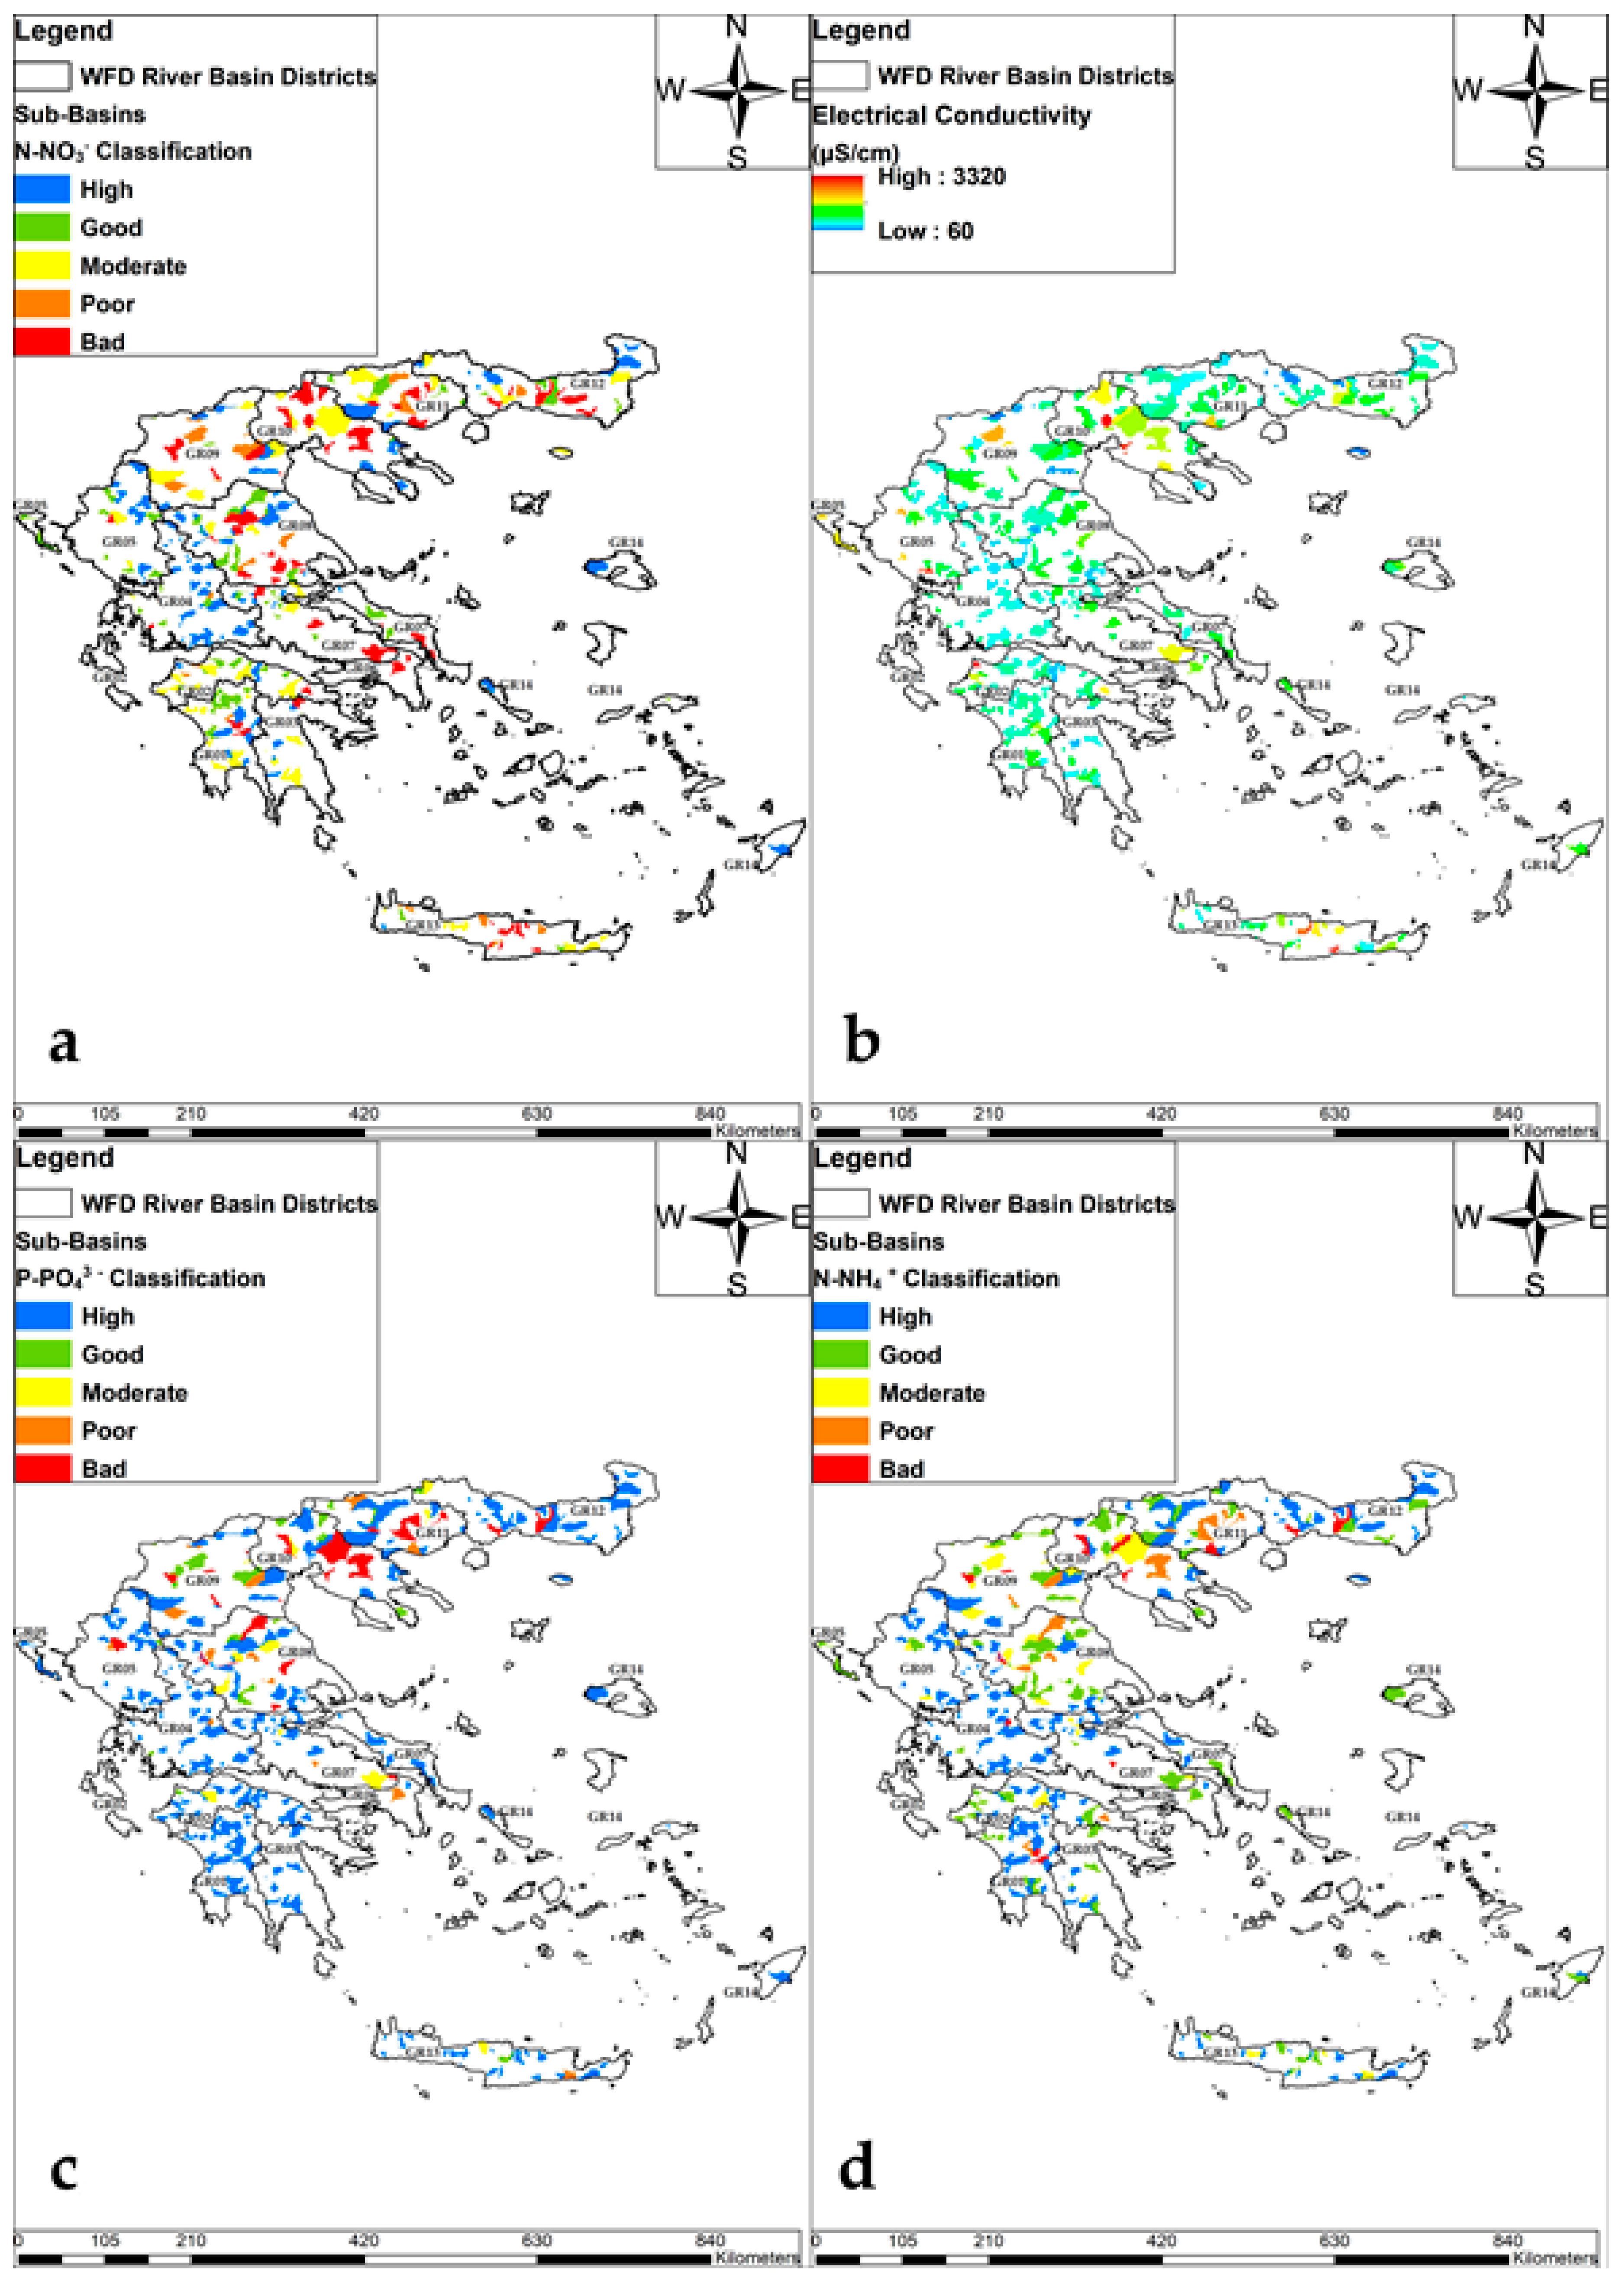
2.3. Physicochemical Variables Analysis at the Sub-Basin Scale

The physicochemical variables with the highest contribution in the first two principal components were used for the vector-based spatial data analysis at sub-basin scale. The data used in this analysis is the dataset of 1002 records and the sub-basins vector files retrieved from the European Environment Agency (EEA) Catchments and the Rivers Network System ECRINS v1.1 [31]. The spatial data analysis involves several spatial and attributes query operations. Thus, the medians of the examined parameters were calculated based on the sampling site location in agreement with the location of the corresponding sub-basin.

3. Results

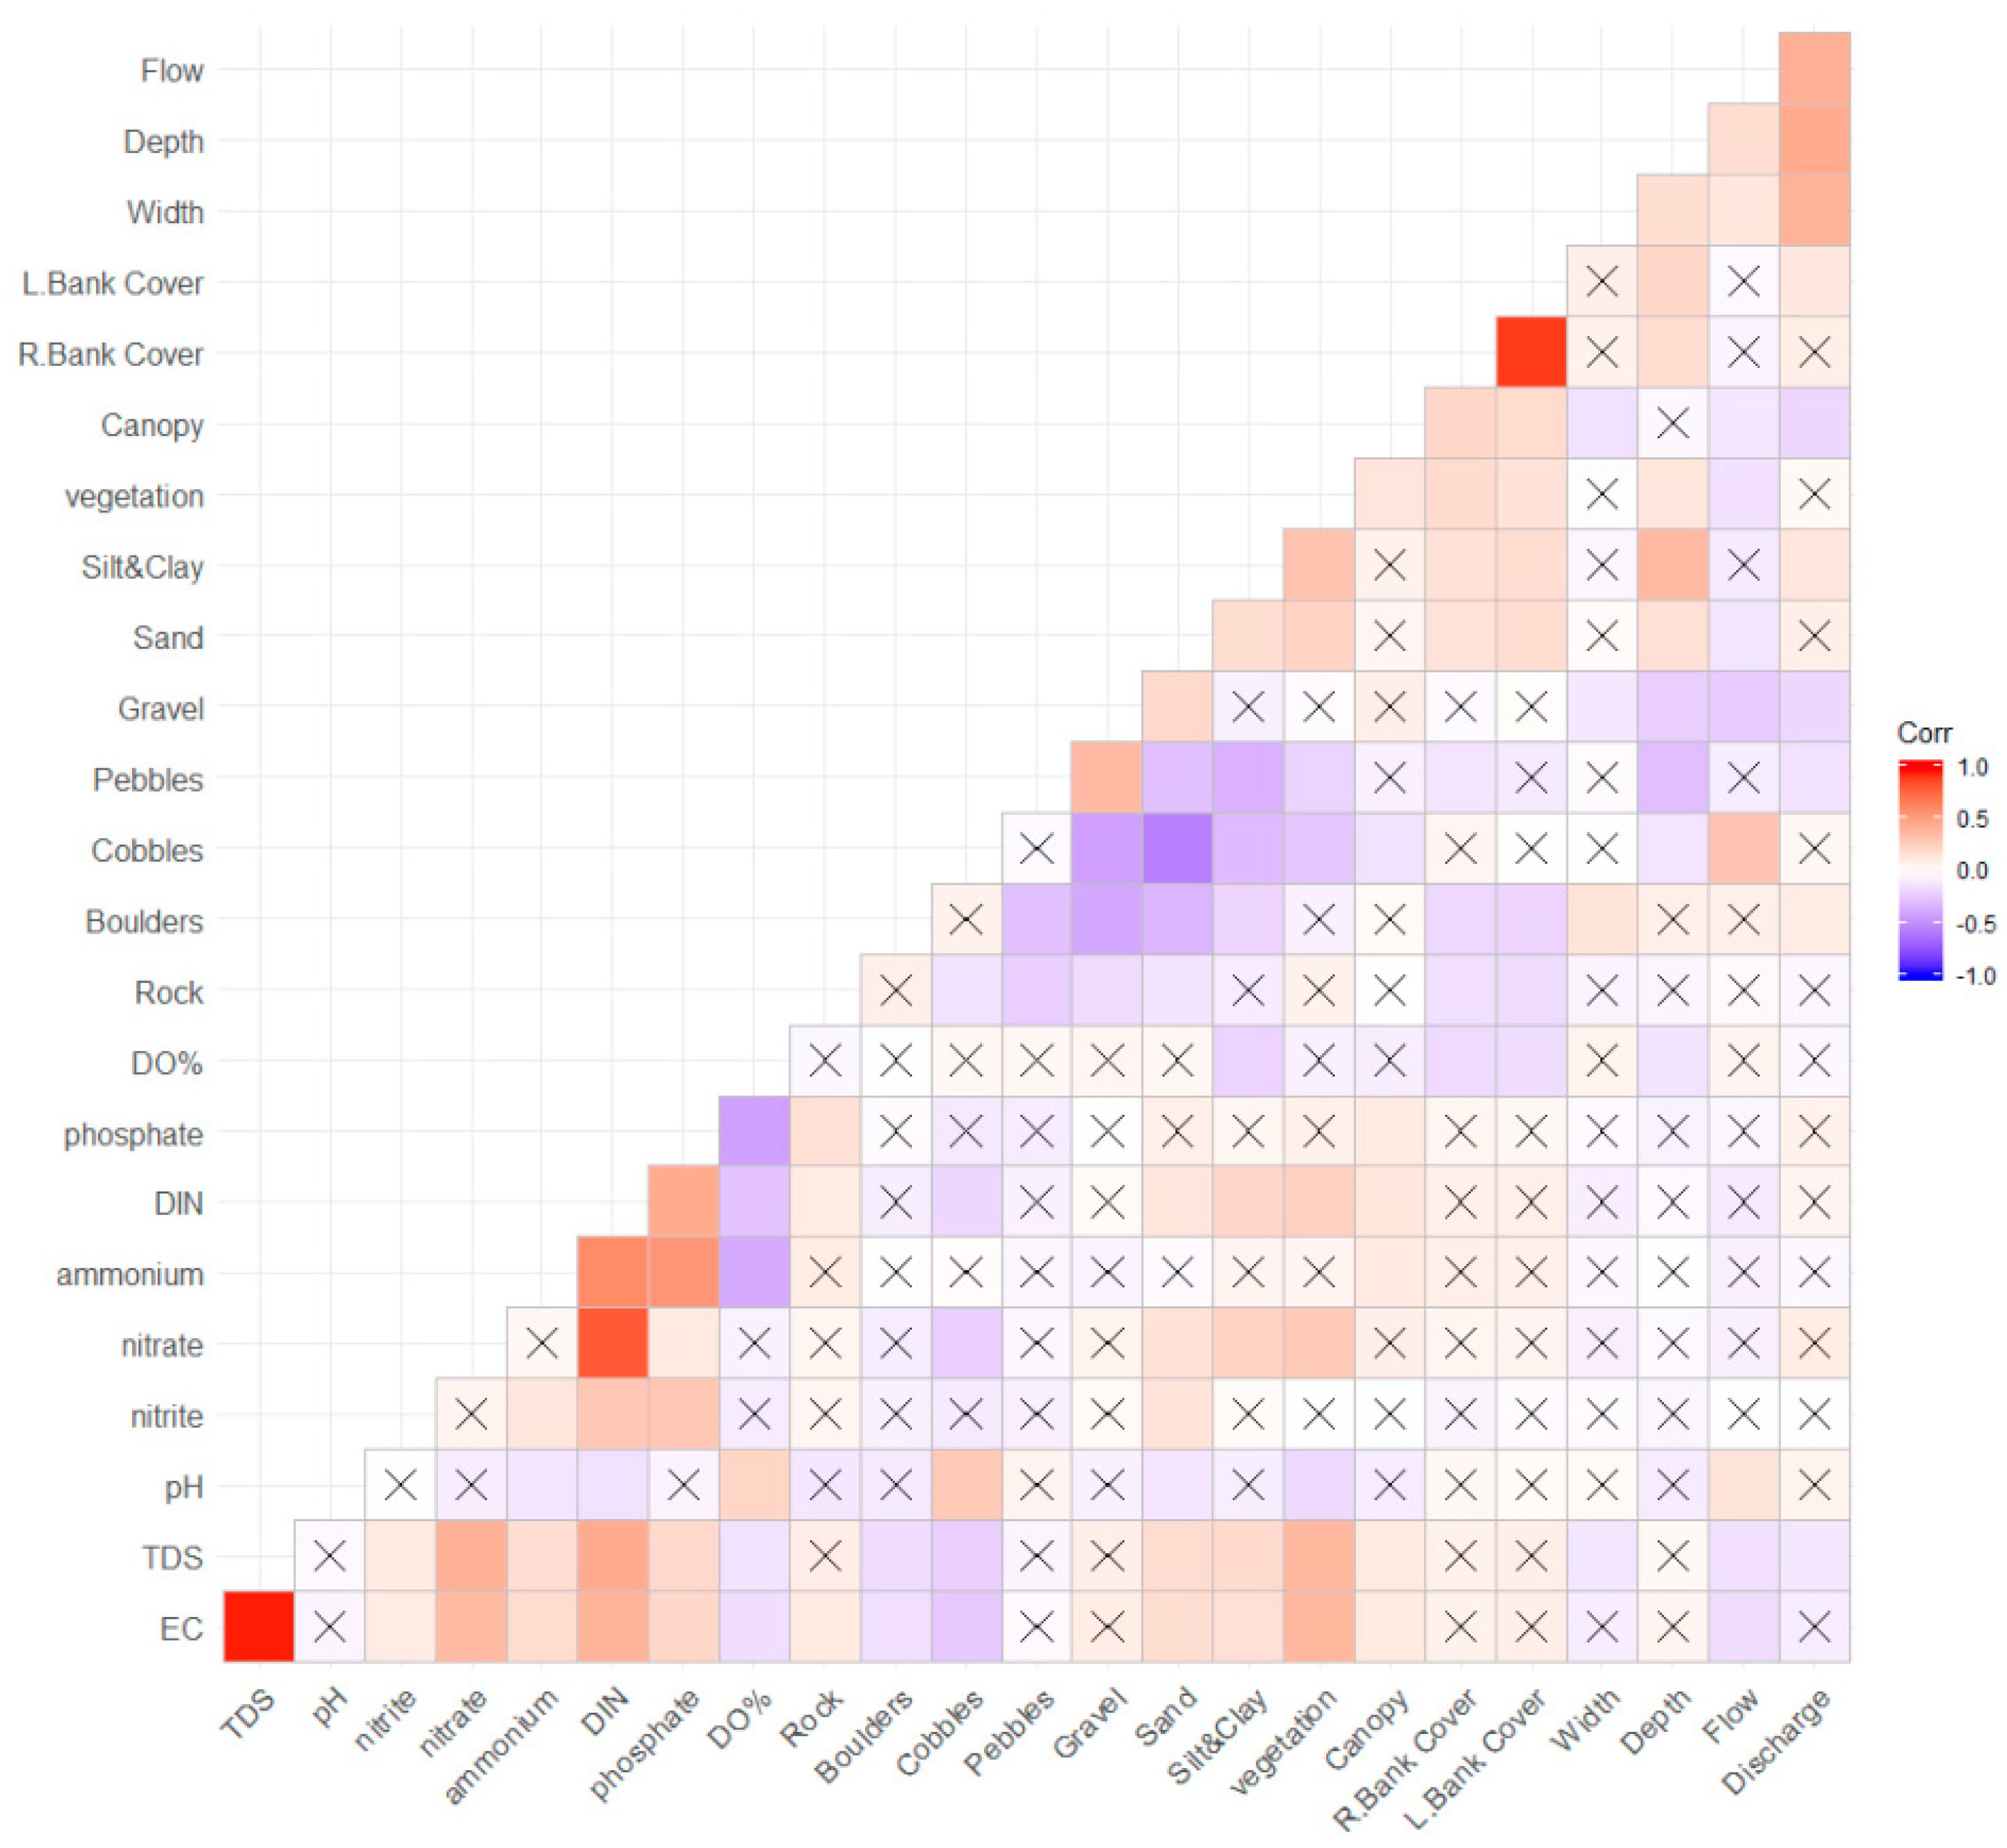
3.1. Relationships Among Environmental Parameters

Figure 2 illustrates the results of the correlation analysis. Multiple associations among the variables were identified. Total dissolved solids, right bank vegetation, and dissolved inorganic nitrogen correlated highly with electrical conductivity, left bank vegetation, and nitrate, respectively (r > 0.8), and were omitted from further analysis. Among the remainder relationships, we can distinguish the strong positive correlations between discharge, flow velocity, and channel dimensions (width and depth) and among electrical conductivity, nitrate, and channel vegetation cover. Conversely, the most significant negative correlations were noted for oxygen saturation with ammonium and phosphate concentration.

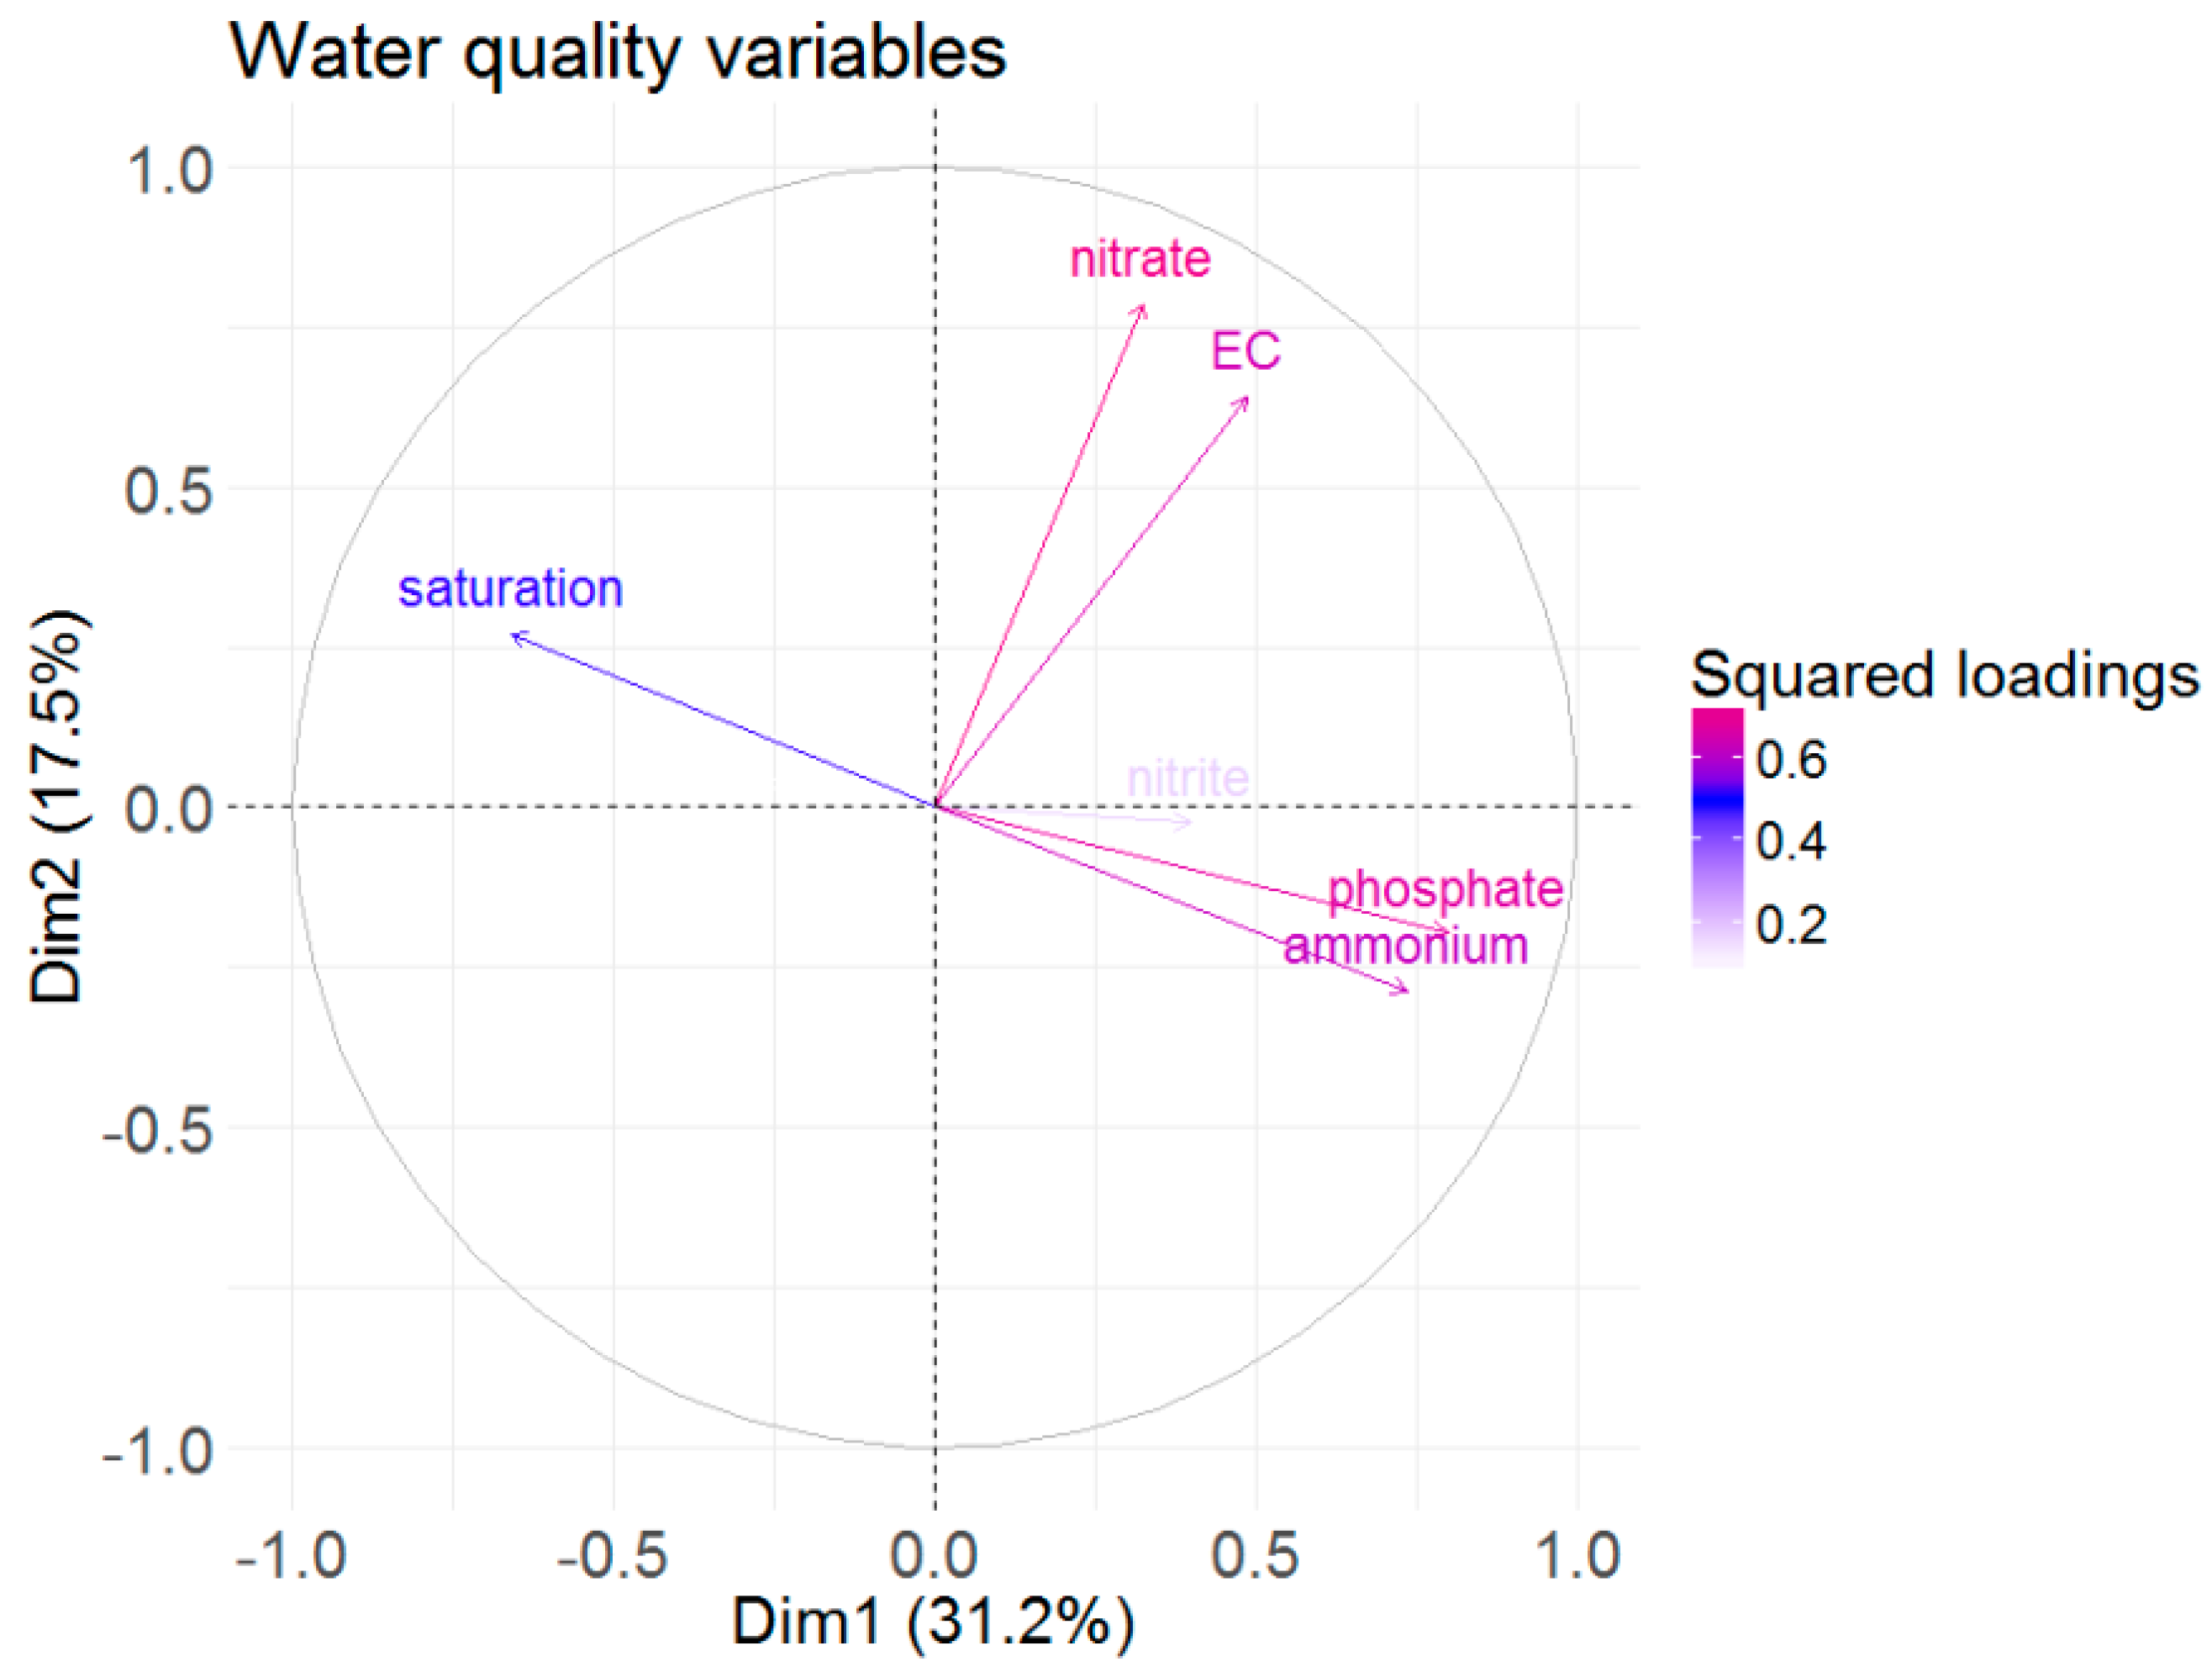
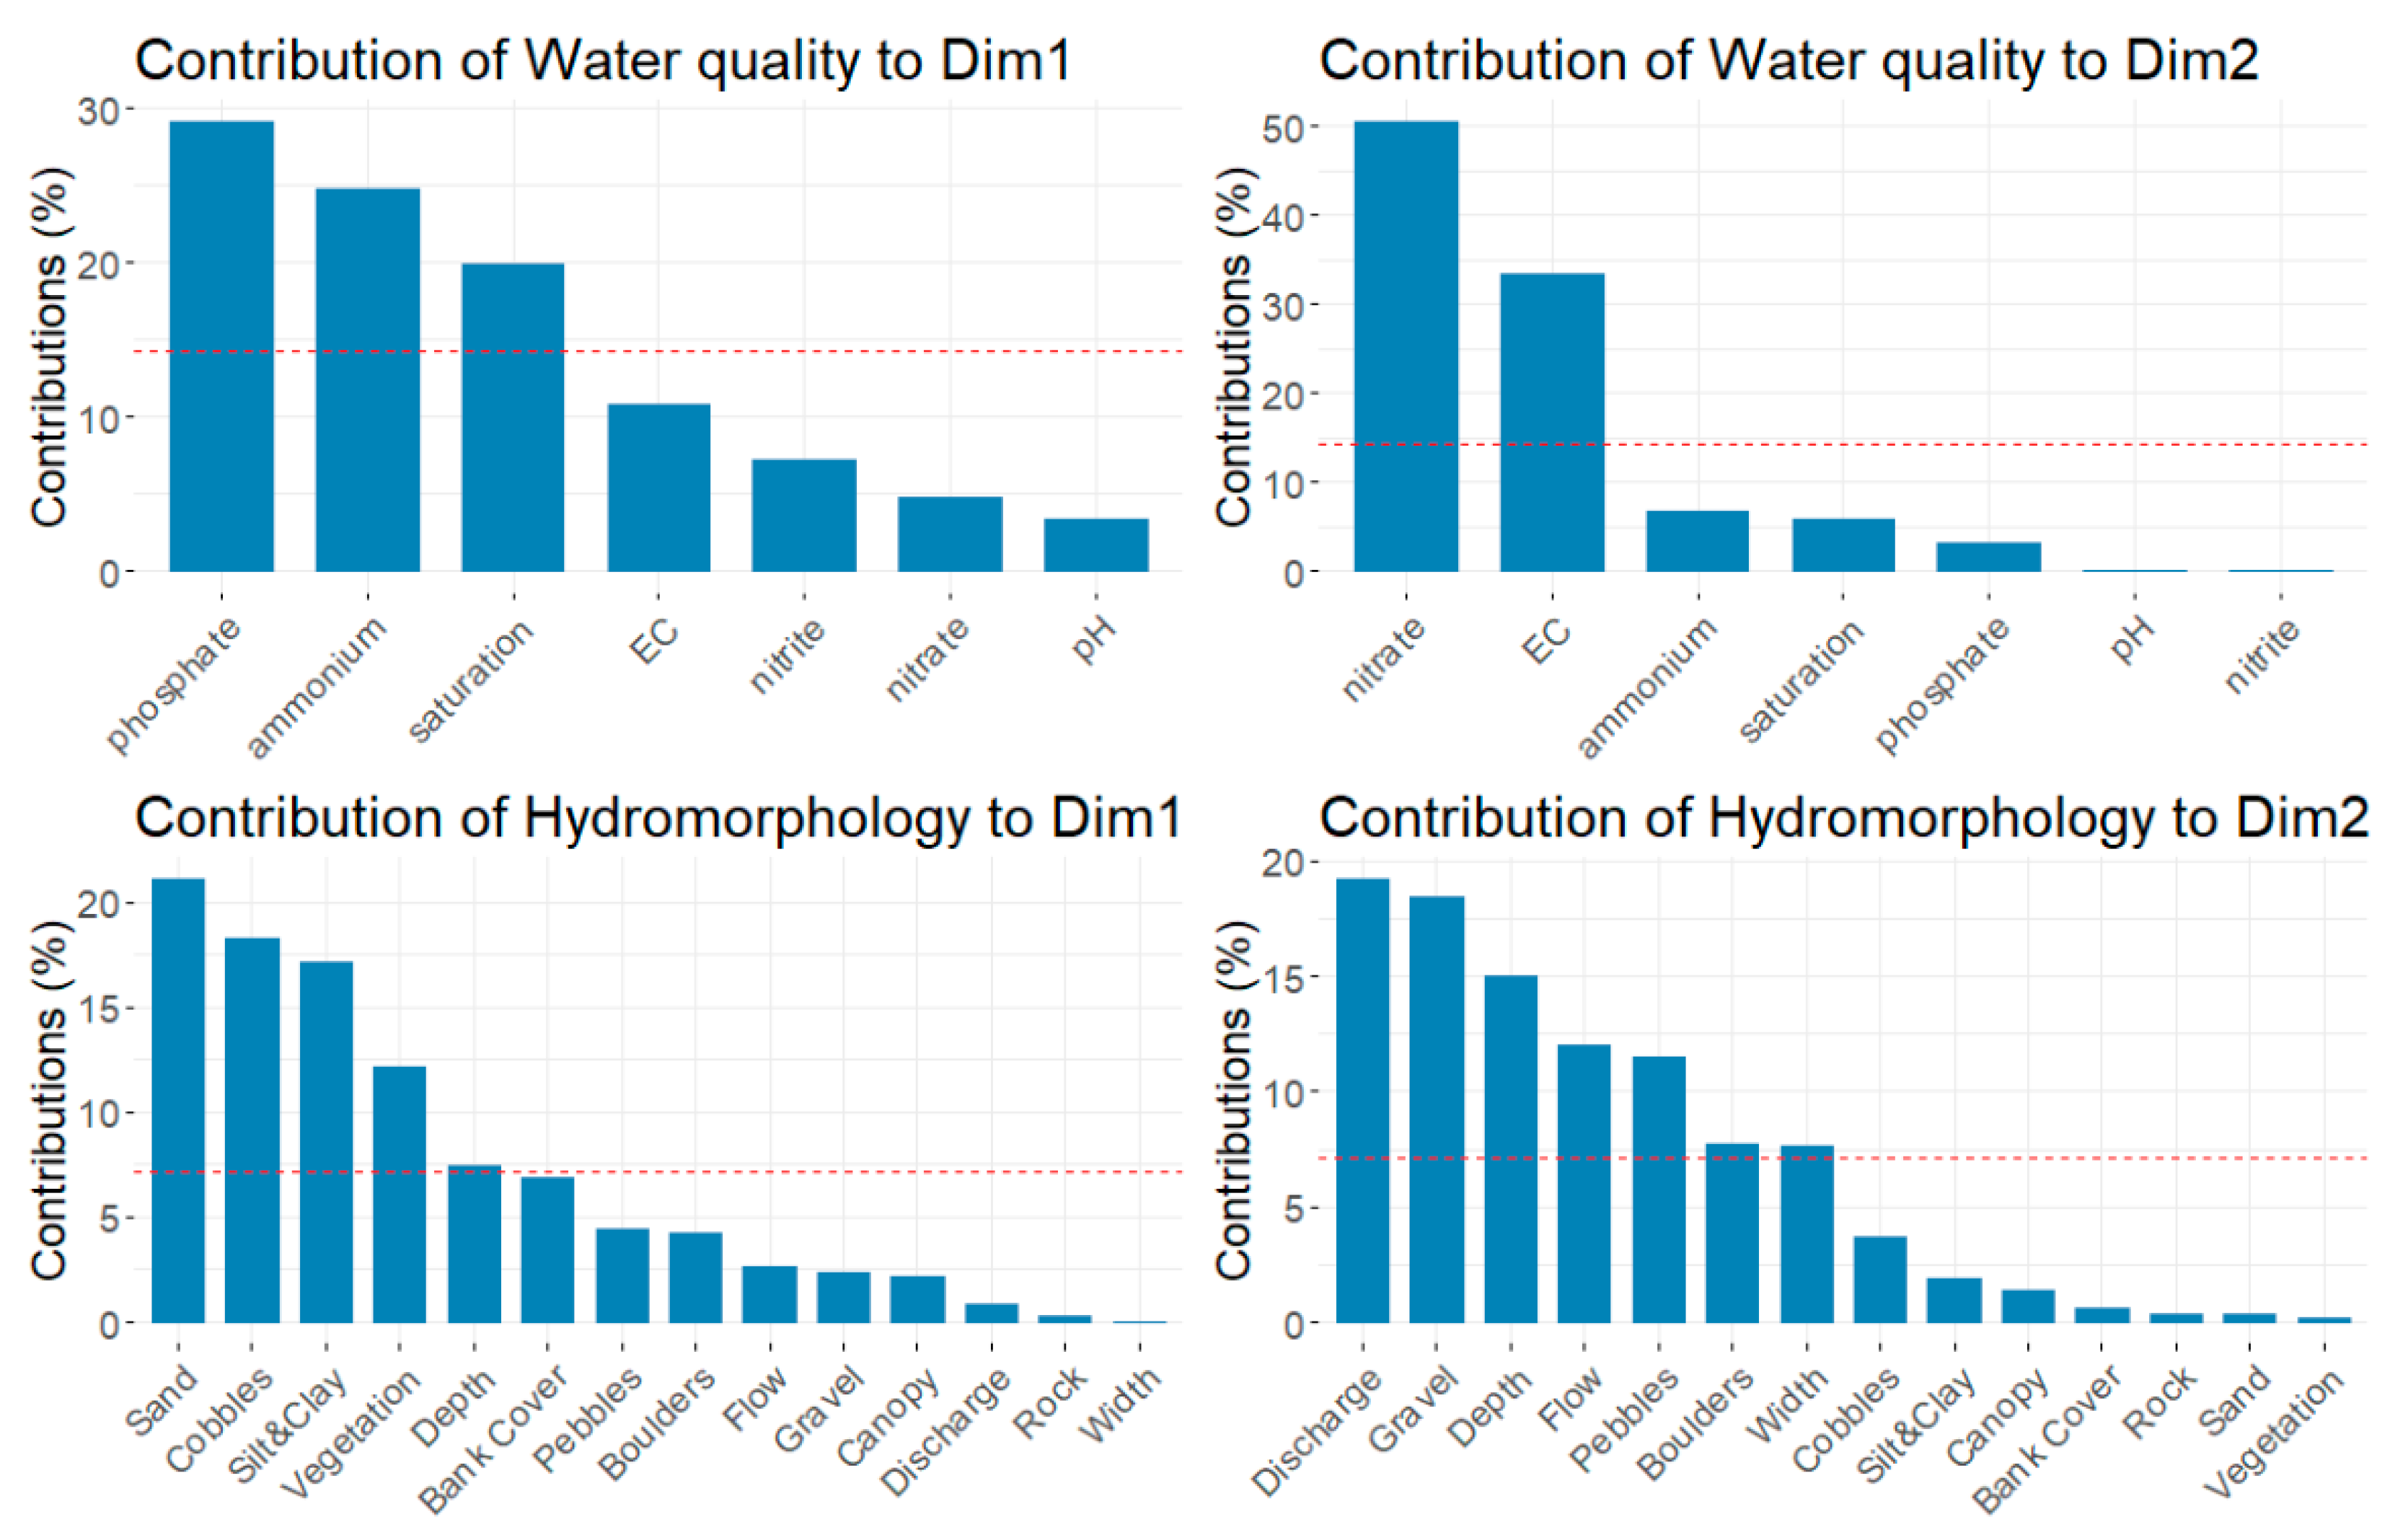
3.2. Environmental Gradients of Water Quality and Hydromorphology

Concerning the PCA that was conducted with the water quality variables, the results showed that the first two components accounted for a substantial share of the total variance (48.7%). The description of the dimensions (Figure 3) showed that phosphate was highly correlated with component 1, followed by ammonium. In contrast, nitrate presented the highest correlation with component 2, followed by electrical conductivity. Oxygen saturation correlated negatively with component 1, while pH and nitrite displayed the weakest relationships with both components. Thus, phosphate and ammonium contributed the most to PC1 (54%), and nitrate with electrical conductivity had the largest contribution to the second PC (83%) (Figure 4). These results may indicate a gradient of organic pollution (high concentration of ammonium and phosphate coincides with low oxygen saturation) along the PC1, whereas PC2 may hint at an environmental gradient of agricultural pollution indicated by the high nitrate concentration.
Conversely, the first two components of the PCA based on the hydromorphological variables, explained a smaller fraction of the total variance (35.1%) compared to the first PCA. As shown in Figure 5, the first component correlated with the substrate types of sand, cobbles, and silt followed by the vegetation cover in the channel. The second component showed the highest correlation with discharge, followed by the gravel substrate, water depth, and flow. Here, PC1 implies a gradient from coarse to fine substrates that promote higher cover of channel vegetation, while PC2 is suggesting a gradient from small to larger river reaches (deeper and wider) with a larger quantity of water (higher discharge).
Regarding the network analysis (Figure 6), Gephi software identified four (4) distinct river groups that also incorporate the high, good, moderate, and poor physicochemical status. Network analysis used the rivers that have been sampled more than nine (9) times, and the colour of edges vary depending on the node they are attached at and by the additional connection that may have with another community. The short or long length of each edge indicates the strong or weak, respectively, connection not only among the stations but also among the physicochemical status. Some sites are connected with more than one physicochemical status and present a colour gradation depending on how many times have presented those respective classifications. Network analysis has also managed to spatially distinguish the sites according to their physicochemical status, which is not absolute for all the sampling campaigns. Sampling sites clustered as of mostly poor physicochemical status are mainly located in Western and Eastern Macedonia (GR09 and GR11) RBDs, stations with predominantly moderate status are detected in Attica, Thessaly, and Central Macedonia (GR06, GR08, GR10) RBDs, whereas grouped sites with good and high status are largely situated in North and Eastern Peloponesse, West Central Greece, and Epirus (GR02, GR03, GR04, and GR05) RBDs.

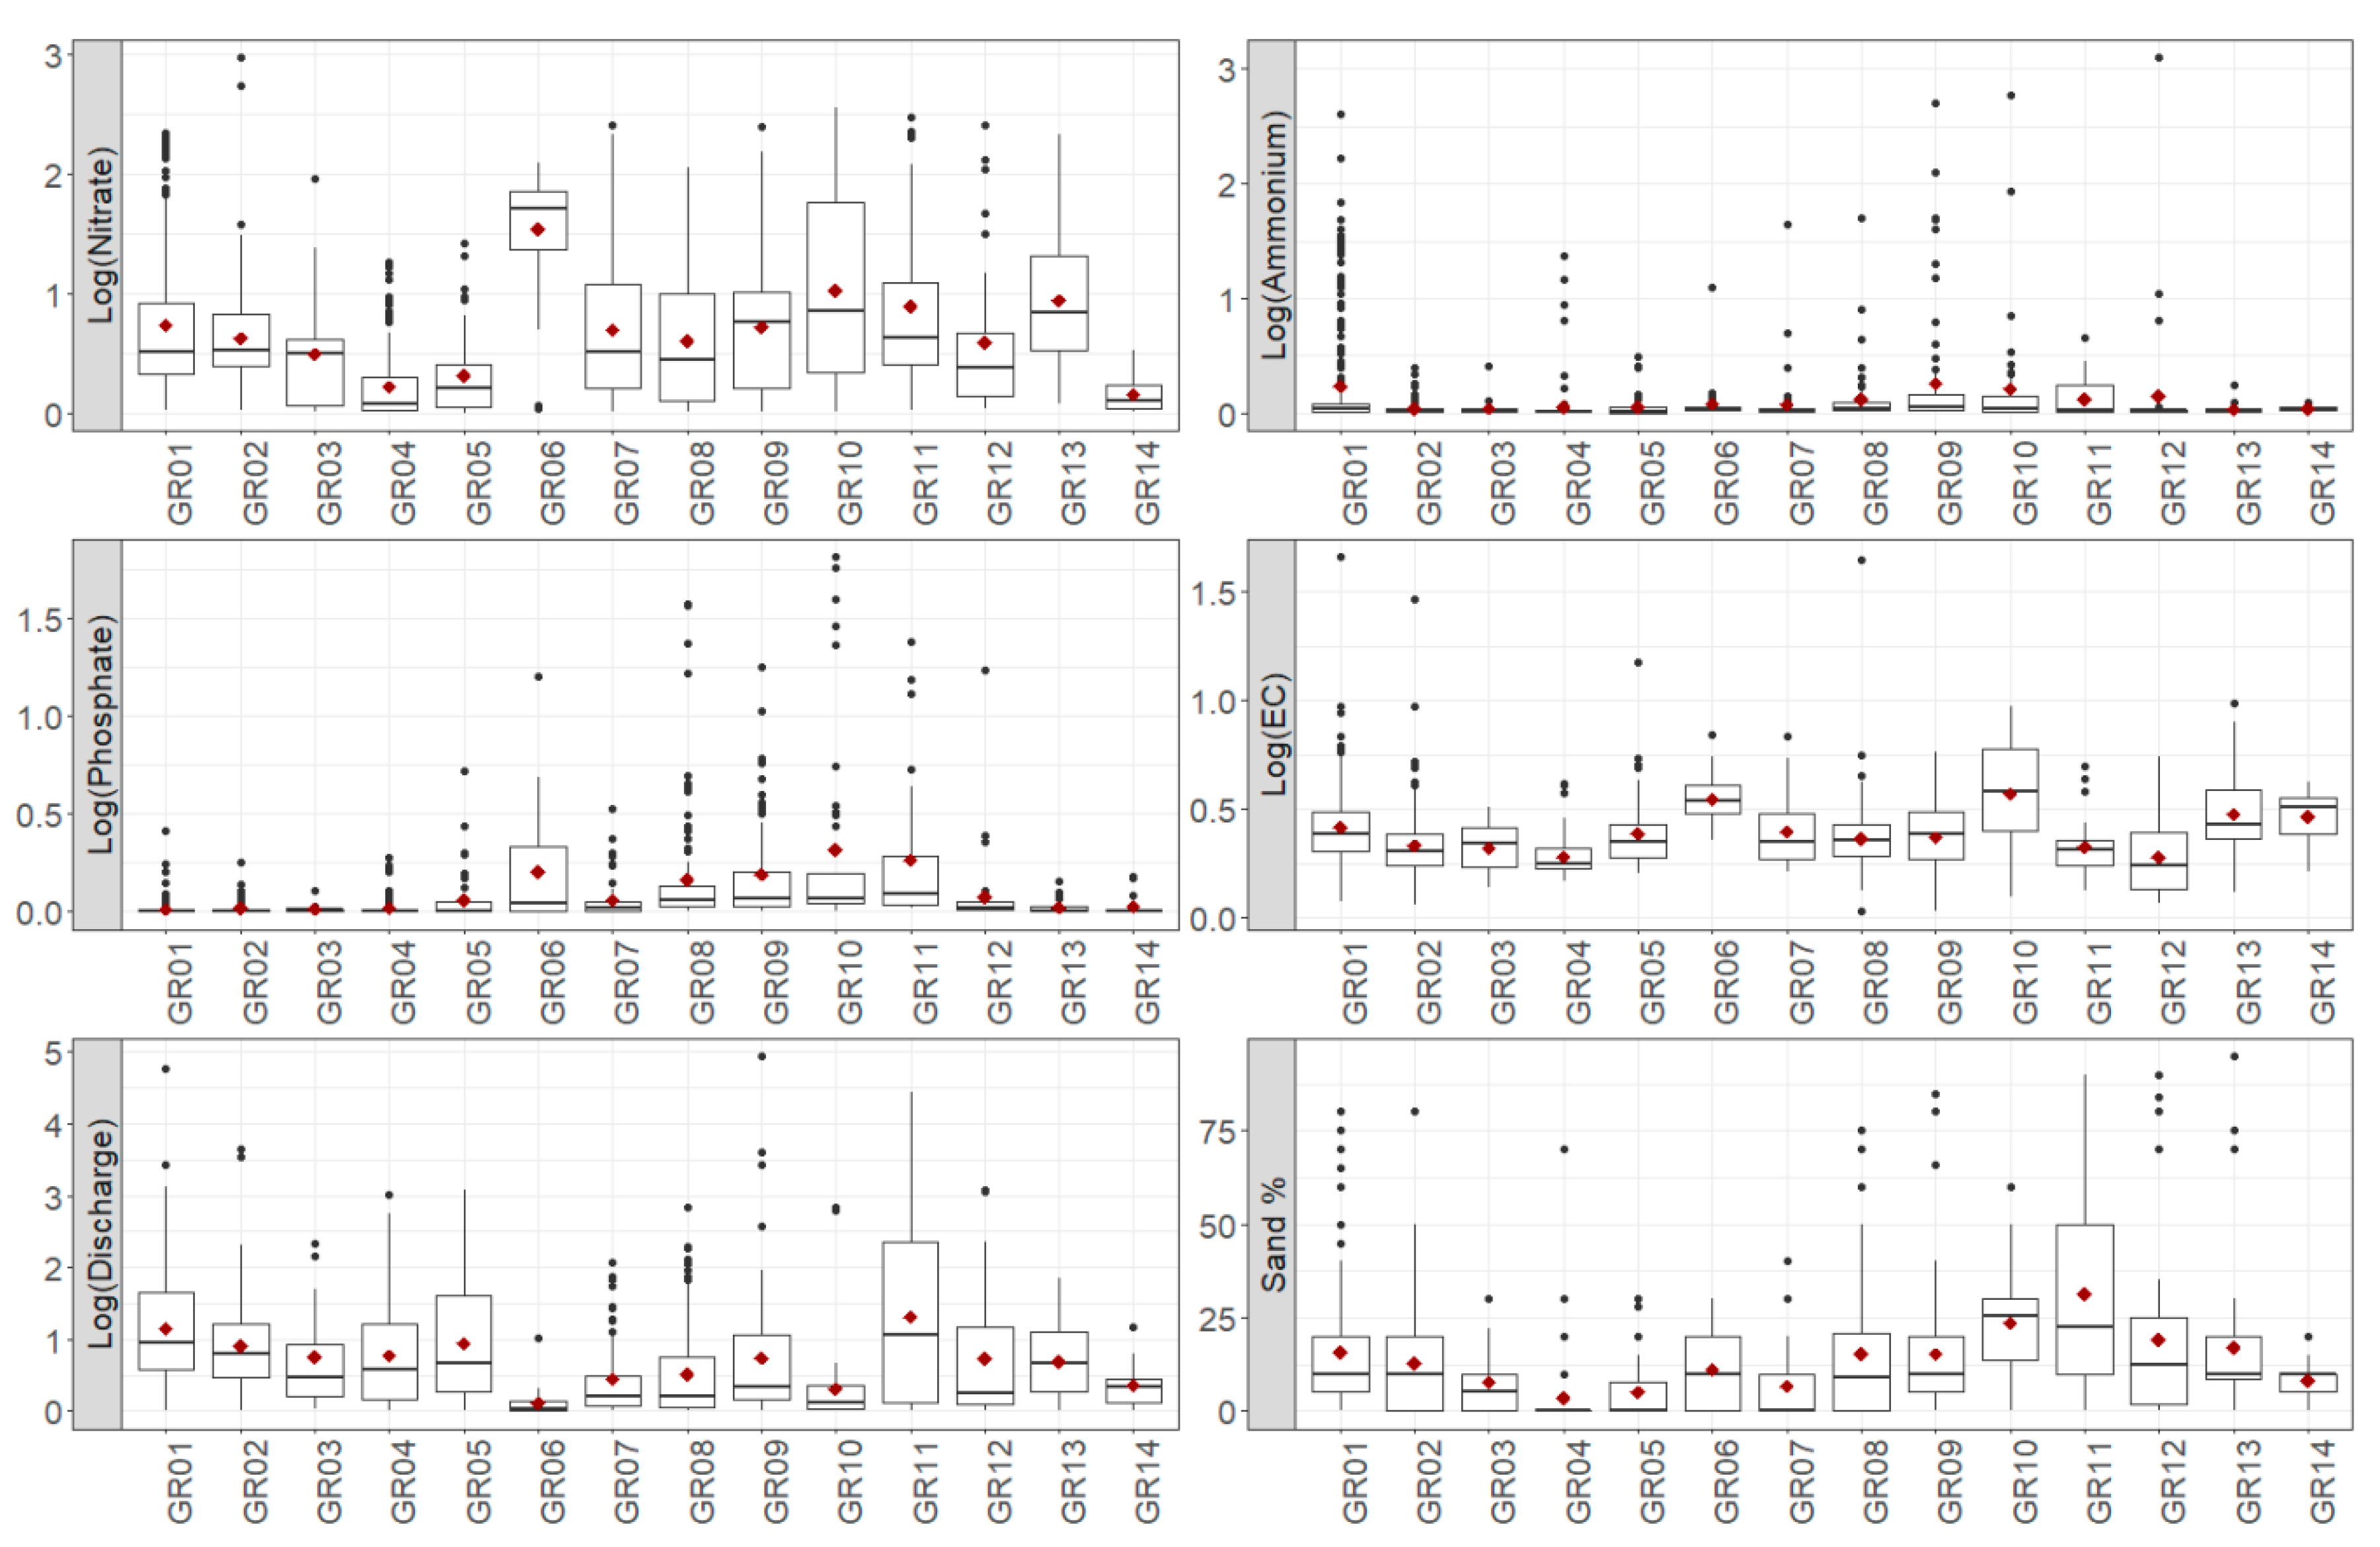
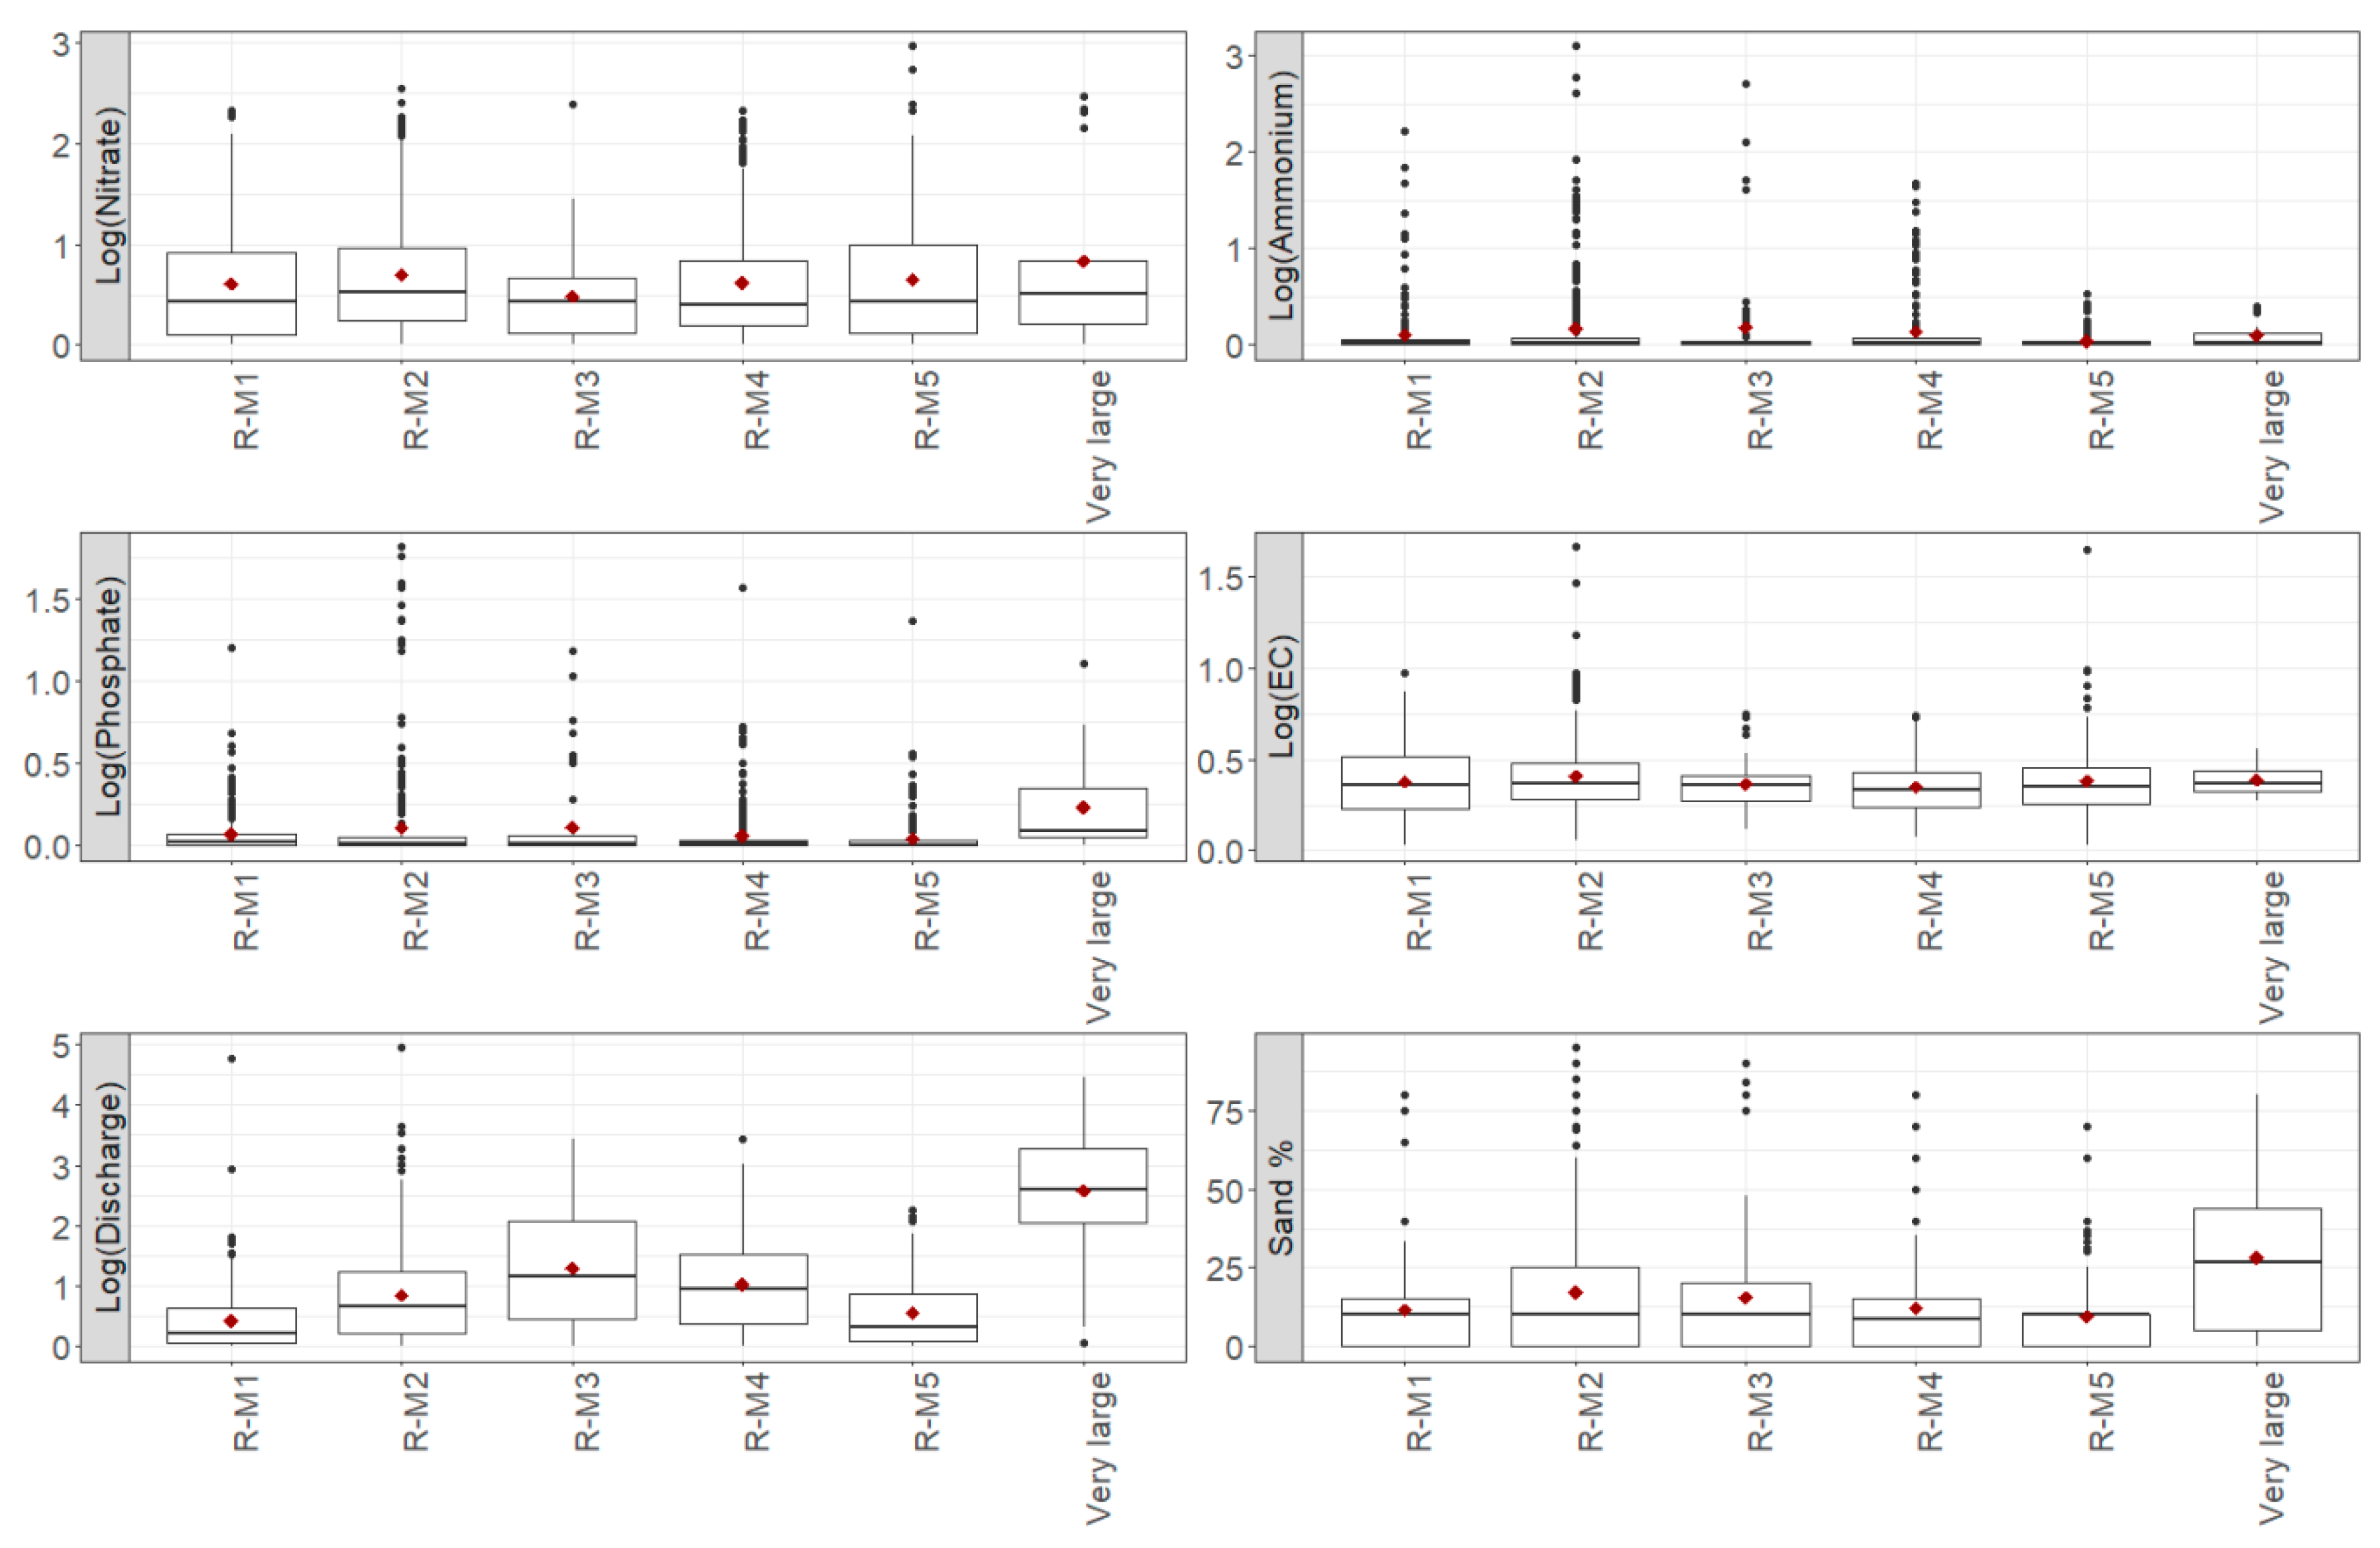
3.3. Variability among ICTs and RBDs

Boxplots in Figure 7 and Figure 8 illustrate the variability of the most influential parameters according to the results of PCA among the six intercalibration classification types and the 14 RBDs. In addition, maps in Figure 9 depict the spatial variability of nitrate, phosphate, ammonium, and EC at the sub-basin scale. In general, water quality parameters displayed large variation among the six intercalibration types and the RBDs. For instance, nitrate and phosphate showed the highest variation in sites of RBDs of Central and Eastern Macedonia and Attica (GR10, GR11, and GR06, Figure 3, Figure 9). In addition, highest mean concentrations of nitrate and phosphate were observed in RBDs of Attica followed by Central Macedonia, the most urbanized regions of Greece. In contrast, conductivity displayed lower variation, but with higher mean values estimated again for Attica and Central Macedonia RBDs. Sand substrate appeared to prevail in sites of Eastern and Central Macedonia, while cobbles were observed more in the RBDs of Eastern Peloponnese and Western Greece. Small differences were observed among the intercalibration types, and those occurred mostly between very large rivers and the other five ICTs. For instance, higher discharge and finer substrates were characteristic for very large rivers.

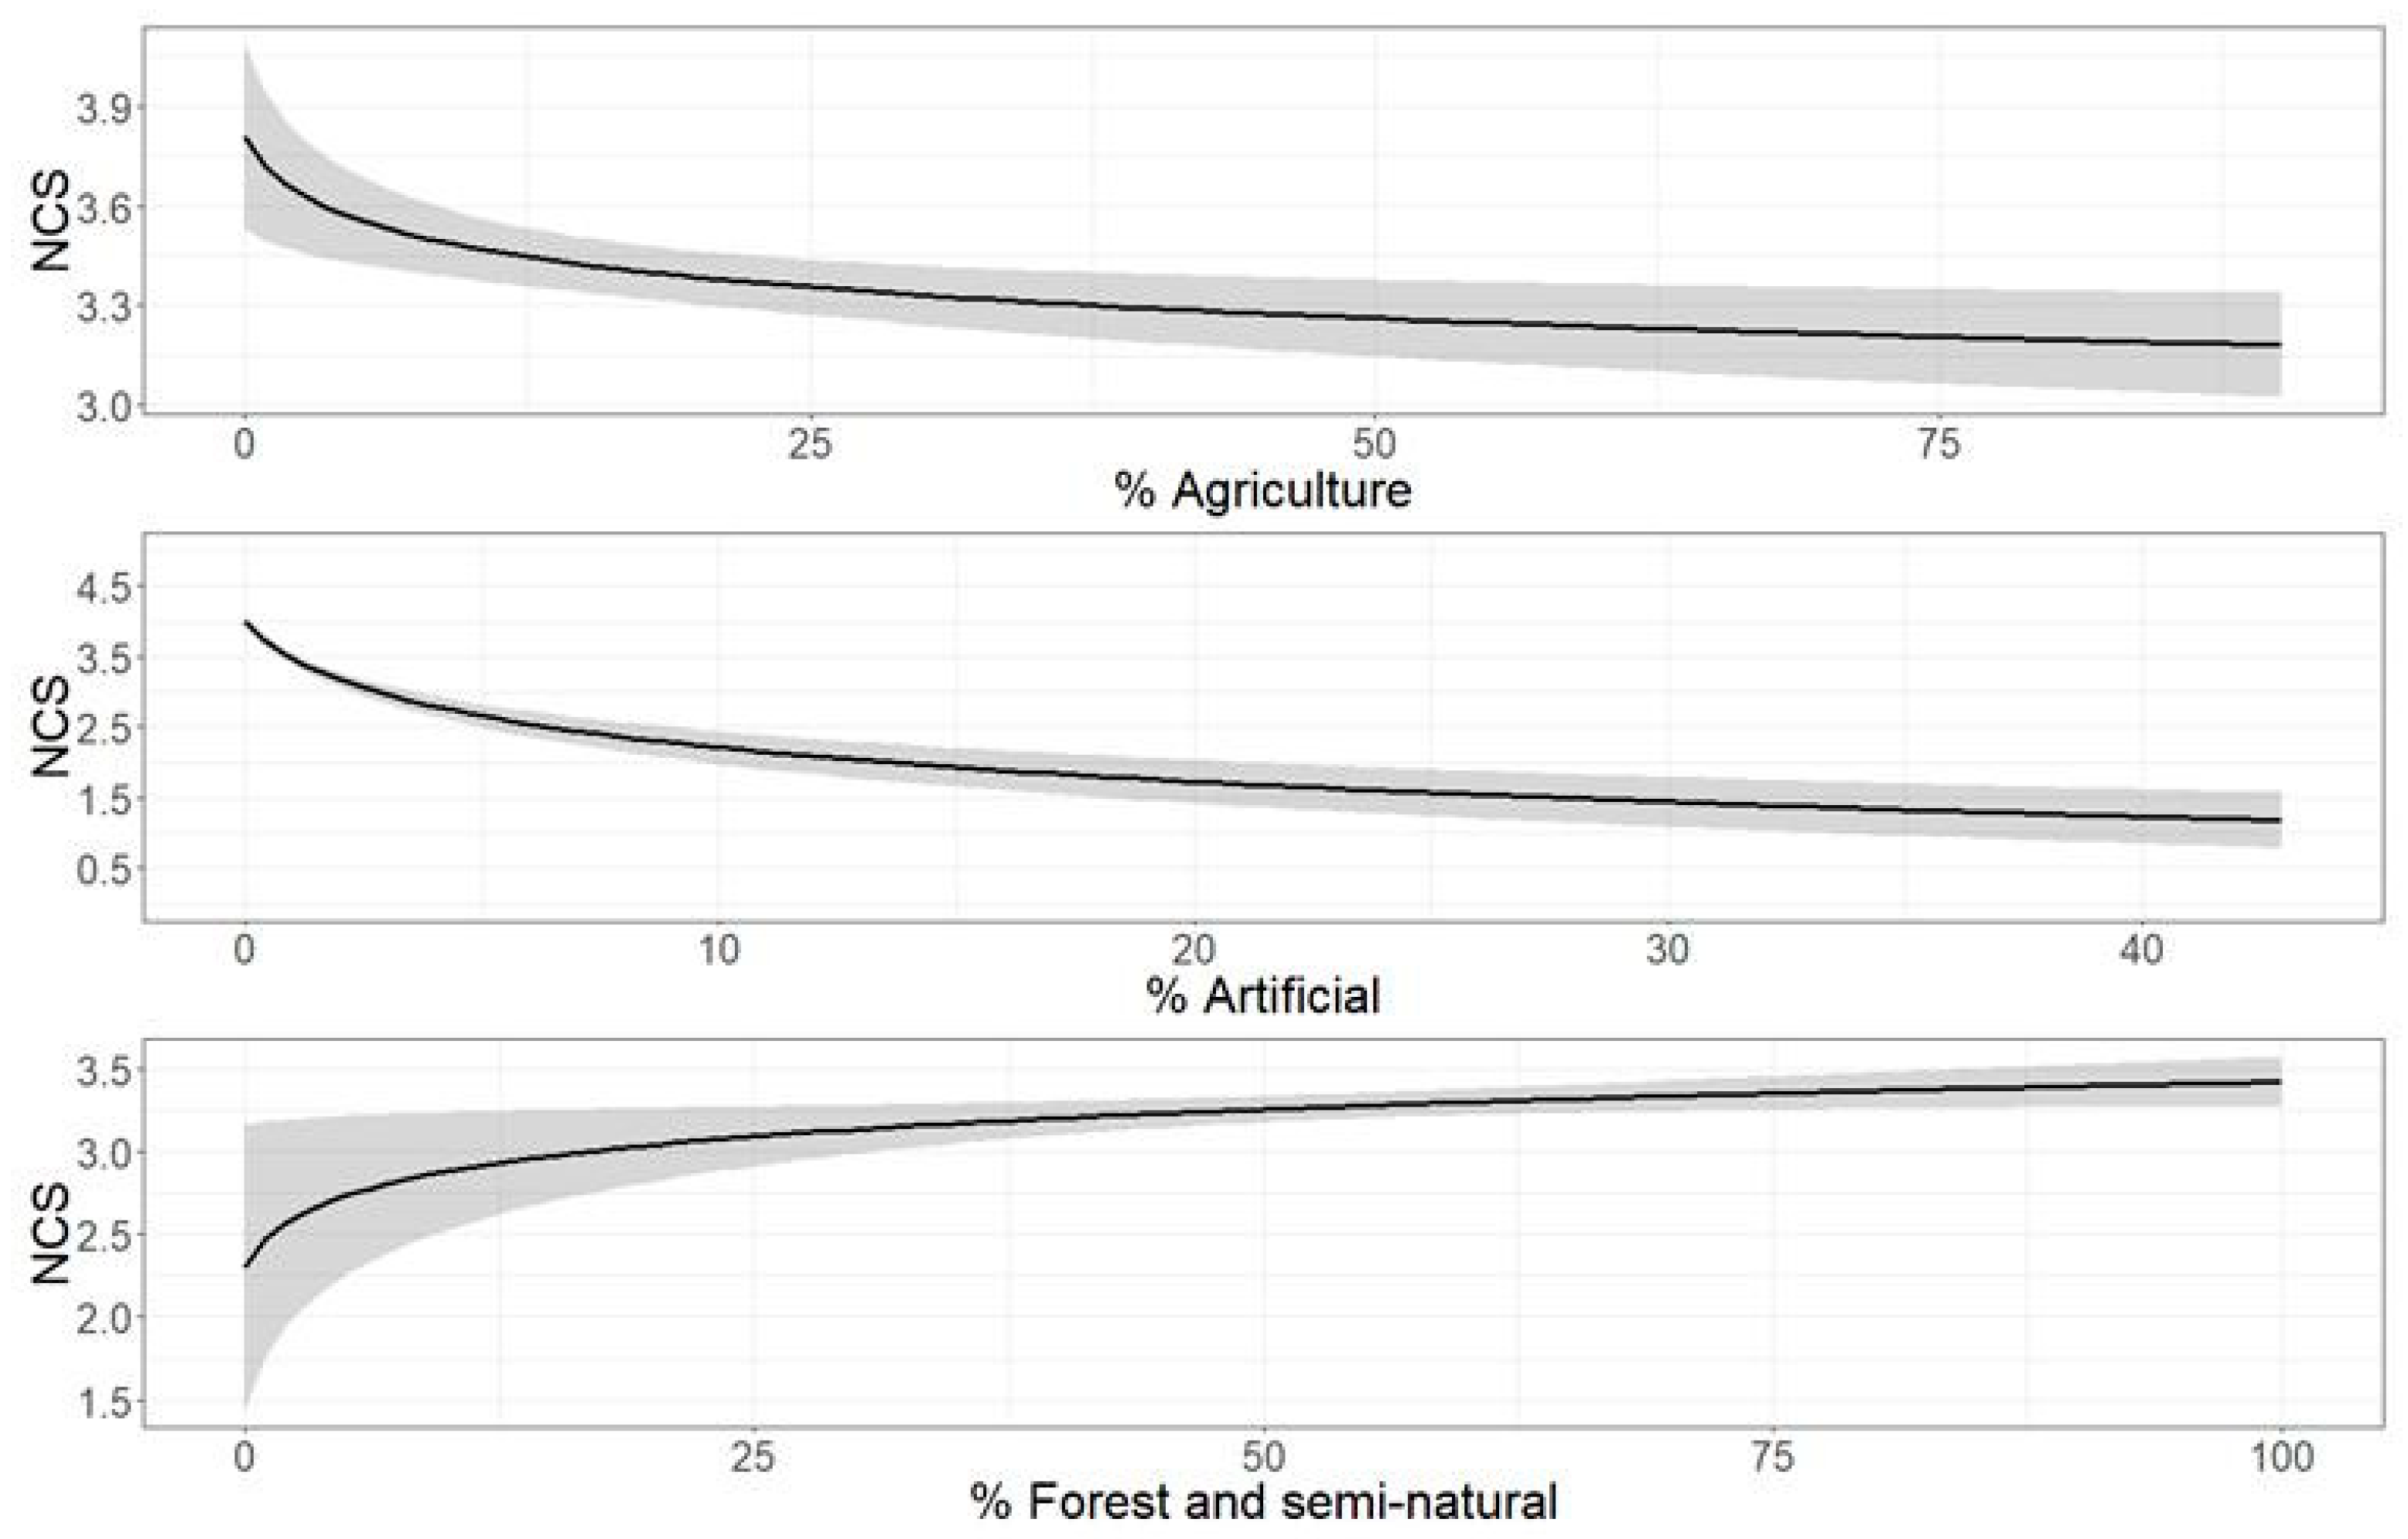
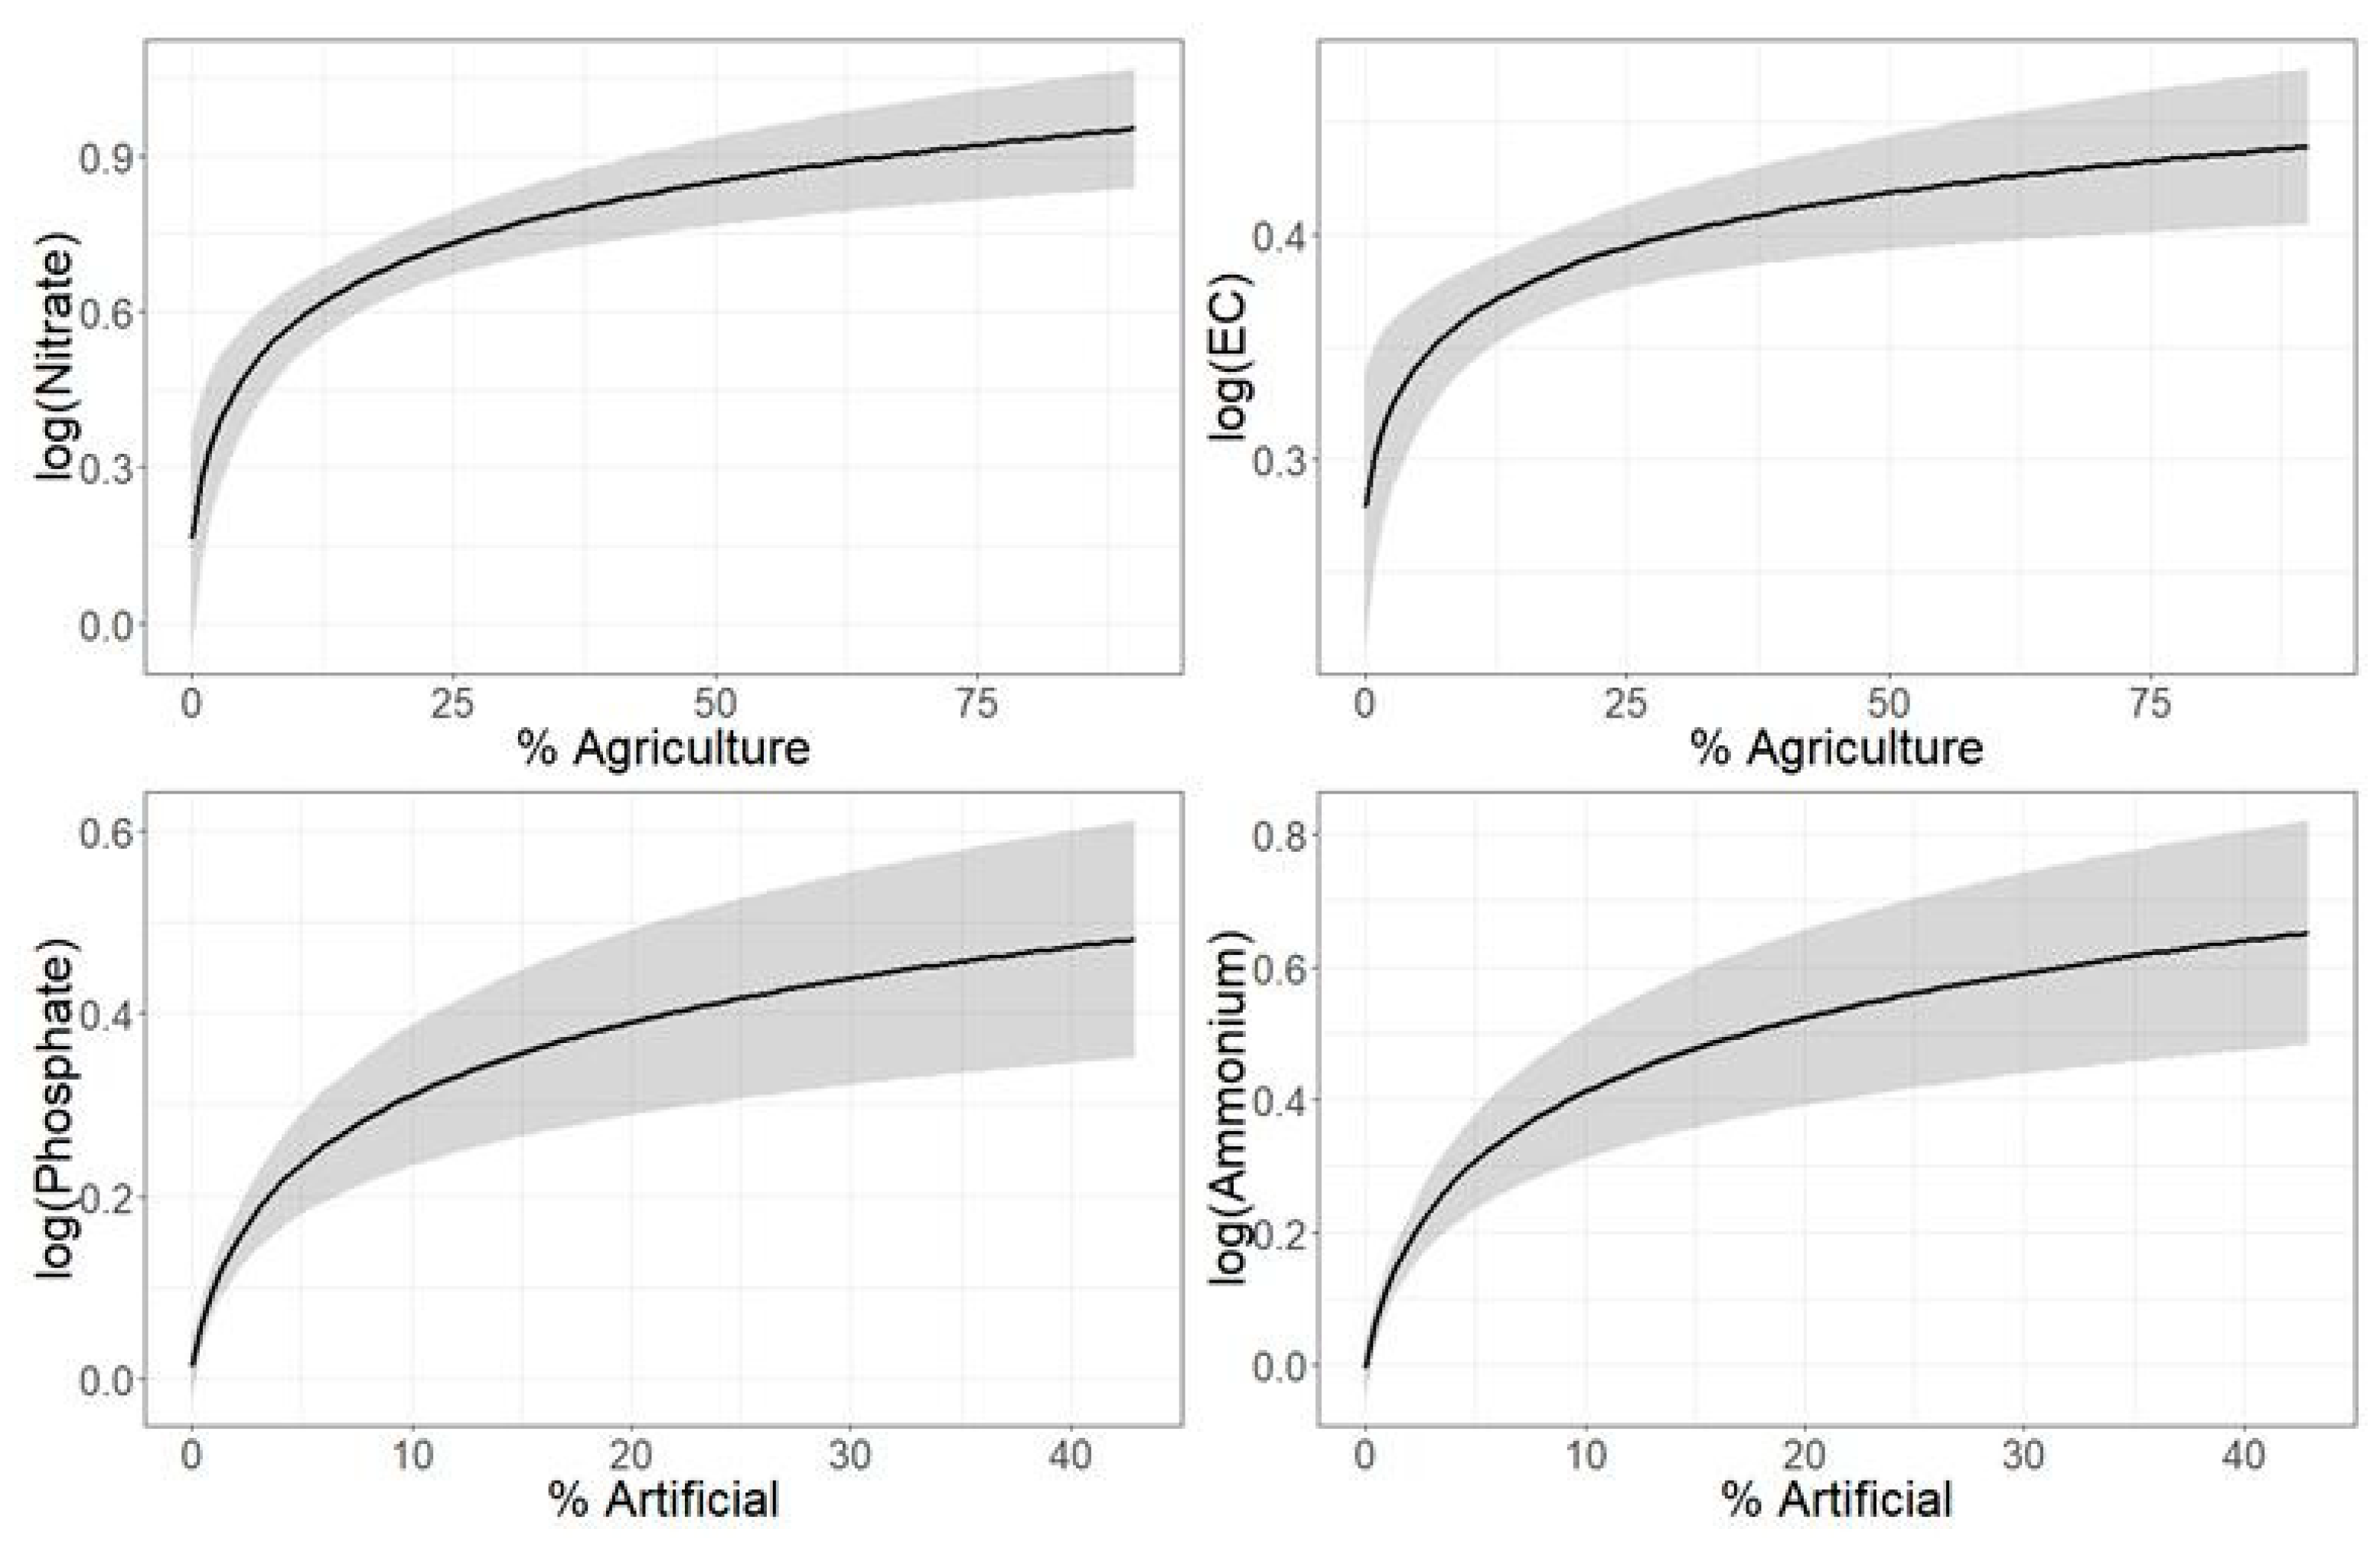
3.4. Relationships Between Water Chemistry and Land Uses

Table 3 presents the linear model fitting results for the NCS and the four water chemistry variables that contributed the most to the PCA, to the share (%) of Agriculture, Artificial and Forest and semi-natural land uses. The model for the NCS had the highest R2 implying that the land uses explained approximately 46% of the observed variance. Artificial surfaces were the most important predictor, followed by agricultures and forests. The models for nitrate and EC were characterized by substantially higher R2 than those for phosphate and ammonium, with artificial land uses and agricultures being both highly significant predictors for nitrate and ammonium, whereas artificial surfaces was the only significant predictor for phosphate and ammonium.
The relationships between each response variable and their significant predictors are shown in Figure 10 and Figure 11. Specifically, Figure 10 presents the predicted values of NCS to Agriculture, Artificial and Forest and semi-natural land uses, where it can be seen the negative effect of agriculture and the positive effect of Forests and semi-natural areas. It is worth noting that a remarkable decrease of NCS occurs for changes in agricultural cover from 0 to 25%, where above that threshold the effect is smaller. The same conclusions can be made from the partial responses of nitrate and EC to agriculture cover (Figure 10). On the other hand, artificial surfaces appear to have a notable effect on phosphate, ammonium, and NCS for changes in their cover between 0% and 10%.

4. Discussion

4.1. Water Quality and Hydromorphological Status in GREEK Rivers

With this work, we assessed a large dataset of physicochemical and hydromorphological descriptors of riverine systems at the national scale belonging to six intercalibration types and covering a wide range of variability. Our results indicated that water quality explained a larger fraction of variance than hydromorphology and that nitrogen and phosphorous accounted for the most variation in our data. In addition to phosphate concentration, ammonium, and oxygen saturation were also significant contributors to the first component of the PCA based on physicochemical variables. Oxygen saturation was negatively associated with the first component and also correlated negatively with ammonium concentration. These findings support the notion that the first component of the PCA represents a gradient of organic pollution. Low oxygen content in water is often attributed to microbial decomposition of excess organic matter resulting in hypoxic or even anoxic conditions [32]. Furthermore, high levels of ammonium could reflect increased dissimilatory nitrate reduction to ammonium process (DNRA), which usually occurs under anaerobic conditions with high carbon and nitrate availability [33]. On the other hand, nitrate, which is a more mobile form of nitrogen than ammonium, was found to have the largest contribution to the second component suggesting a possible gradient of agricultural driven pollution characterized by low levels of organic pollutants. Thus, water quality variability in Greek rivers can be attributed to two distinct drivers of pollution, non-point source agricultural pollution vs point-source organic pollution. The low correlation between nitrate and phosphate partially confirms this notion suggesting the existence of different pollution pathways for these pollutants. Agricultural, industrial and urban effluents are considered the main sources of river pollution worldwide [34,35]. Particularly for Greece, there is a significant amount of research that has underpinned the impacts of agriculture in the water chemistry of running waters [21,23], as many anthropogenic pressures are linked with the agricultural activity. Catchment model simulations have demonstrated that the use of fertilizers in heavily agricultural catchments results in increased concentrations of nitrates and phosphates under various scenarios of future climate and management [36]. In addition to agricultural driven diffuse pollution, industrial point sources of organic pollution in the form of small agro-industries (e.g. olive mills) are scattered throughout the country causing various implications for aquatic life [37]. Their impacts on the water quality include, among others, the increase of phosphates and ammonium and the decrease of oxygen content in water [37]. This kind of agro-industrial waste pollution could explain the observed downgraded water properties in small catchments that are not typically agricultural, as opposed to the catchments in the regions of Thessaly or Thrace (e.g., Pinios and Evros).
Furthermore, our results highlighted electrical conductivity along with nitrates as top contributors to the second component of the PCA. While rivers of Greece are characterized by higher major ion concentrations than the European average [38] due to the predominance of a carbonate geological background, high values of electrical conductivity (e.g., >900 μS/cm) are usually indicative of polluted environments [38]. However, other works have linked the high conductivity with the increased potential for more productive soils in the calcareous catchments that can support more intensive agriculture and farming [39]. This practically implies that electrical conductivity is not a result of water quality degradation, but rather a consequence of the fact that agriculture driven pollution is likely to occur in more productive catchments.
The results of the linear models agree with the aforementioned findings since it was shown that nitrate and EC were mostly influenced by the share of agriculture in the catchment, whereas phosphate and ammonium were influenced by the artificial land cover. On top of that, the linear models for phosphate and ammonium had substantially lower R2 than those for nitrate and EC (0.14 and 0.15 vs. 0.31 and 0.32) meaning that land uses explained a smaller fraction of the variance. Thus land uses had a more significant effect on nitrate and EC than phosphate and ammonium, implying a direct linkage between diffuse agricultural driven pollution and the levels of nitrate and EC in the studied rivers. Other studies have also highlighted the significance of agricultural land uses on the ecological status in contrast to forest and/or artificial land cover. For instance, Reference [40] did not find any significant effect of forest cover on the likelihood of maintaining high ecological status of Irish rivers, whereas they showed that grassland agricultures impacted ecological status regardless the examined spatial scale. This finding is important for the prioritization of nutrient mitigation measures as it confirms that reducing diffuse inputs would mostly affect nitrates and therefore in rivers with high concentrations of phosphorus and ammonium, measures of mitigation of point sources are recommended. Examples from the literature have reported an immediate effect of point source removal or urban waste treatment on the levels of phosphorus [41] in contrast to diffuse pollution mitigation where high nitrogen levels may persist.
Concerning the hydromorphological variability, our results showed that the first component represents a gradient of substrates that are related with higher cover of channel vegetation, while PC2 indicates a gradient of deeper, larger river reaches with larger quantity of water. The sand substrate was the main contributor to the PC1 and together with Silt and Clay contributed more than 35%. In addition, taking into account the positive correlations between nitrate, conductivity and total dissolved solids with Sand and Silt and Clay substrates we can possibly attribute these findings to the role of agriculture in enhancing fine sediment deposition in river systems. Lately, excessive fine sedimentation due to the intensification of agriculture has emerged as a serious threat to river ecosystems all around the world [42]. While there are multiple factors associated with the processes of sediment accumulation in rivers [43], there is growing evidence that agricultural practices increase sediment erosion resulting in increased sediment loads [42,44].
Furthermore, aquatic vegetation is known to interact with the sedimentation process in rivers affecting the sedimentation rates [45]. More specifically, densely vegetated reaches alter river flow, reduce water velocity, and ultimately facilitate the accumulation of sediments on the riverbed. Here, we found that channel vegetation correlated with Sand and Silt and Clay substrates and contributed significantly to the second principal component, which agrees with findings from previous works.
Overall, the analysis of this large spatial dataset suggests that agriculture is a main driver of water quality and hydromorphological variability, since it influences nitrogen loads, but it may also affect the substrate types. In addition, there are signs that organic pollution may play another significant role in shaping water quality variability as it affects the oxygen levels and the ammonium concentration.

4.2. Spatial Patterns of Variability Among Rivers

Our results highlighted that rivers of water districts with large cities and industrial areas, such as Attica and Central Macedonia, were characterized by high concentrations of nutrients reflecting the impact of point-source pollution in heavily urbanized catchments [22,46]. Furthermore, agriculture in Greece is a major driver of environmental change with multiple effects in aquatic ecosystems and resources. Thus, we expected to observe obvious signs of water quality degradation in water districts with agricultural catchments (e.g., Thessaly and Thrace). Conversely, mountainous systems in Western Greece (GR04 and GR05) RBDs were mostly classified in Good and High nutrient quality status based on the nitrate concentrations, which makes sense given the low agricultural activity in the area. Phosphate levels were problematic in several sub-basins in Northern Greece and in urbanized areas, which clearly emphasizes the impact of urban wastes on the water quality. Network analysis after having identified four (4) distinct river groups, managed subsequently to distinguish and connect the groups of sites with similar physicochemical status by also combining their location. Thus, sites with more degraded water quality were detected at Attica and Central Macedonia while West Central Greece and Epirus (GR04 and GR05) RBDs presented the grouped sites with better water quality (high and good).

5. Conclusions and Implications for Further Management

The reports from Europe’s first River Basin Management Plans (RBMPs) report that 56% of European rivers have failed to achieve the good status targets of the Water Framework Directive (WFD) [47,48,49]. Diffuse pollution and hydromorphological degradation are still considered the most common combination of pressures in rivers. Clearly, there is a great need for adopting effective mitigation measures that can avert the risk of further environmental degradation.
Specifically for Greece, this work showed that nitrate and phosphorus are the most important water chemistry parameters in rivers and that diffuse and source point pollution still dominate in many of these systems. Apparently, further actions are needed in order to achieve significant improvements in water quality status. With this article, a preliminary assessment of the spatial distribution of nutrients can provide a rapid overview of the sub-basins that require a prioritization in the application of mitigation measures of diffuse or source point pollution. For instance, in areas where high concentrations of phosphate and ammonium dominate it would be more cost-effective to focus on measures that reduce phosphorus and organic load inputs, such as urban waste water treatment, than diffuse pollution mitigation measures (e.g., riparian buffer zones).
Identifying priorities for nutrient mitigation in rivers has become an attractive research topic for river scientists all over the world since it becomes obvious that there are cases where achieving the WFD target is very difficult and unrealistic [50,51,52]. For these cases, it might be optimal to apply measures that sustain the current situation rather try to reduce nutrients below thresholds that cannot be reached. For instance, Reference [50] proposed that phosphorus mitigation measures should be applied in rivers of the UK that are already below a threshold of 100 μg L−1 where the chances of ecological recovery are higher.
Nevertheless, there are other overlooked factors that should also be taken into account before formulating a proper mitigation strategy. Thus, in catchments with polluted groundwater that act as a source of nitrogen, diffuse pollution mitigation actions will not have the desirable outcome. Reducing the nitrogen levels in these rivers will be extremely difficult considering that residence time of groundwater may span several decades [53,54,55]. Thus, an integrated management that considers the status of both surface and groundwaters will likely have higher chances of success. Concerning the hydromorphological alteration of rivers, one issue of interest that emerges as a potential threat for the ecology and is often overlooked by water managers is the increased rates of fine sedimentation that have been observed the last few years as a result of global change [56,57]. Future trends in land use changes, such as abandonment of farmlands in mountainous and semi-arid areas, may increase the soil erodibility as the natural vegetation recovers at very slow rates in water scarce environments. Thus, future changes in precipitation variability, land use management [58], and land cover will likely increase soil erosion in Mediterranean systems, enhancing fine sedimentation in rivers. However, current monitoring programs cannot provide evidence for direct linkages between the dominance of fine substrates and agricultural driven pressures since Sand and Silt substrates are usually the predominant substrates in lowland rivers where agricultural activity is more intense. This means that river monitoring should encompass methods that can detect temporal changes in sedimentation that can be linked to anthropogenic pressures. For instance, such methods are the use of Unmanned Aerial Vehicles that can monitor the sedimentation regime, among many other hydromorphological features in rivers [59].
Overall, this study provides an overview of the current status of water chemistry and hydromorphological variability in Greek rivers that sets the basis for further assessments under the scope of improving the cost-effectiveness of the national monitoring program and ultimately making recommendations on adopting appropriate management measures.

Author Contributions

Conceptualization, K.S., G.P., V.M. and E.D.; methodology, K.S., G.P. and E.D.; formal analysis, K.S., G.P. and E.D.; visualization, K.S., G.P. and E.D.; writing—original draft, K.S., G.P. and V.M.; writing—review and editing, K.S., G.P., V.M. and E.D.

Funding

This research received no external funding.

Conflicts of Interest

The authors declare no conflict of interest.

References

  1. Europea Comunidad. Directive of the European Parliament and of the Council 2000/60/EC Establishing a Framework for Community Action in the Field of Water Policy. Available online: https://www.eea.europa.eu/policy-documents/directive-2000-60-ec-of (accessed on 27 June 2019).
  2. Nikolaou, A.D.; Meric, S.; Lekkas, D.F.; Naddeo, V.; Belgiorno, V.; Groudev, S.; Tanik, A. Multi-parametric water quality monitoring approach according to the WFD application in Evros trans-boundary river basin: Priority pollutants. Desalination 2008, 226, 3–320. [Google Scholar] [CrossRef]
  3. European Commission. Commission Staff Working Document European Overview (1/2) Accompanying the document Report From the Commission to the European Parliament and the Council on the Implementation of the Water Framework Directive (2000/60/EC) River Basin Management Plans. Available online: https://publications.europa.eu/en/publication-detail/-/publication/85d9694d-d1d7-48bb-9402-d6da989eb9df/language-en (accessed on 27 June 2019).
  4. Muhar, S.; Januschke, K.; Kail, J.; Poppe, M.; Schmutz, S.; Hering, D.; Buijse, A.D. Evaluating good-practice cases for river restoration across Europe: Context, methodological framework, selected results and recommendations. Hydrobiologia 2016, 769, 3–19. [Google Scholar] [CrossRef]
  5. European Commission. Common Implementation Strategy for the Water Framework Directive (2000/60/Ec). River Basin Management in a Changing Climate. 2009, Volume 24. Available online: https://circabc.europa.eu/sd/a/a88369ef-df4d-43b1-8c8c-306ac7c2d6e1/Guidance%20document%20n%2024%20-%20River%20Basin%20Management%20in%20a%20Changing%20Climate_FINAL.pdf (accessed on 27 June 2019).
  6. Quevauviller, P. Adapting to climate change: Reducing water-related risks in Europe—EU policy and research considerations. Environ. Sci. Policy 2011, 14, 722–729. [Google Scholar] [CrossRef]
  7. Wilby, R.L.; Orr, H.G.; Hedger, M.; Forrow, D.; Blackmore, M. Risks posed by climate change to the delivery of Water Framework Directive objectives in the UK. Environ. Int. 2006, 32, 1043–1055. [Google Scholar] [CrossRef] [PubMed]
  8. Voulvoulis, N.; Arpon, K.D.; Giakoumis, T. The EU Water Framework Directive: From great expectations to problems with implementation. Sci. Total Environ. 2017, 575, 358–366. [Google Scholar] [CrossRef] [PubMed] [Green Version]
  9. Giakoumis, T.; Voulvoulis, N. The transition of EU water policy towards the water framework directive’s integrated river basin management paradigm. Environ. Manag. 2018, 62, 819–831. [Google Scholar] [CrossRef] [PubMed]
  10. Carvalho, L.; Mackay, E.B.; Cardoso, A.C.; Baattrup-Pedersen, A.; Birk, S.; Blackstock, K.L.; Borics, G.; Borja, A.; Feld, C.K.; Ferreira, M.T.; et al. Protecting and restoring Europe’s waters: An analysis of the future development needs of the Water Framework Directive. Sci. Total Environ. 2019, 658, 1228–1238. [Google Scholar] [CrossRef]
  11. Lekka, E.; Kagalou, I.; Lazaridou-Dimitriadou, M.; Albanis, T.; Dakos, V.; Lambropoulou, D.; Sakkas, V. Assessment of the water and habitat quality of a Mediterranean river (Kalamas, Epirus, Hellas), in accordance with the EU water framework directive. Acta Hydrochim. Hydrobiol. 2004, 32, 175–188. [Google Scholar] [CrossRef]
  12. Theodoropoulos, C.; Iliopoulou-Georgudaki, J. Response of biota to land use changes and water quality degradation in two medium-sized river basins in southwestern Greece. Ecol. Indic. 2010, 10, 1231–1238. [Google Scholar] [CrossRef]
  13. Lazaridou, M.; Ntislidou, C.; Karaouzas, I.; Skoulikidis, N. Harmonisation of a new assessment method for estimating the ecological quality status of Greek running waters. Ecol. Indic. 2018, 84, 683–694. [Google Scholar] [CrossRef]
  14. Lazaridou, M.; Ntislidou, C.; Karaouzas, I.; Skoulikidis, N.; Birk, S. Harmonization of the assessment method for classifying the ecological quality status of very large Greek rivers. Knowl. Manag. Aquat. Ecosyst. 2018, 419, 50. [Google Scholar] [CrossRef]
  15. Dimitriou, E.; Markogianni, V.; Mentzafou, A.; Karaouzas, I.; Zogaris, S. Ecological status assessment of Pikrodafni stream (Attica, Greece), restoration and management measures. Desalin. Water Treat. 2015, 56, 1248–1255. [Google Scholar] [CrossRef]
  16. Feio, M.J.; Calapez, A.R.; Elias, C.L.; Cortes, R.M.V.; Graça, M.A.S.; Pinto, P.; Almeida, S.F.P. The paradox of expert judgment in rivers ecological monitoring. J. Environ. Manag. 2016, 184, 609–616. [Google Scholar] [CrossRef]
  17. Carré, C.; Meybeck, M.; Esculier, F. The Water Framework Directive’s “percentage of surface water bodies at good status”: Unveiling the hidden side of a “hyperindicator”. Ecol. Indic. 2017, 78, 371–380. [Google Scholar] [CrossRef]
  18. Skoulikidis, N.T.; Amaxidis, Y.; Bertahas, I.; Laschou, S.; Gritzalis, K. Analysis of factors driving stream water composition and synthesis of management tools—A case study on small/medium Greek catchments. Sci. Total Environ. 2006, 362, 205–241. [Google Scholar] [CrossRef]
  19. Dimitriou, E.; Mentzafou, A.; Zogaris, S.; Tzortziou, M.; Gritzalis, K.; Karaouzas, I.; Nikolaidis, C. Assessing the environmental status and identifying the dominant pressures of a trans-boundary river catchment, to facilitate efficient management and mitigation practices. Environ. Earth Sci. 2012, 66, 1839–1852. [Google Scholar] [CrossRef]
  20. Markogianni, V.; Varkitzi, I.; Pagou, K.; Dimitriou, E. Nutrient flows and related impacts between a Mediterranean river and the associated coastal area. Cont. Shelf Res. 2017, 134, 1–14. [Google Scholar] [CrossRef]
  21. Stefanidis, K.; Panagopoulos, Y.; Mimikou, M. Impact assessment of agricultural driven stressors on benthic macroinvertebrates using simulated data. Sci. Total Environ. 2016, 540, 32–42. [Google Scholar] [CrossRef]
  22. Simeonov, V.; Stratis, J.A.; Samara, C.; Zachariadis, G.; Voutsa, D.; Anthemidis, A.; Sofoniou, M.; Kouimtzis, T. Assessment of the surface water quality in Northern Greece. Water Res. 2003, 37, 4119–4124. [Google Scholar] [CrossRef]
  23. Skoulikidis, N.T. The environmental state of rivers in the Balkans-A review within the DPSIR framework. Sci. Total Environ. 2009, 407, 2501–2516. [Google Scholar] [CrossRef]
  24. Kotti, M.E.; Vlessidis, A.G.; Thanasoulias, N.C.; Evmiridis, N.P. Assessment of river water quality in Northwestern Greece. Water Resour. Manag. 2005, 19, 77–94. [Google Scholar] [CrossRef]
  25. Antonopoulos, V.Z.; Papamichail, D.M.; Mitsiou, K.A. Statistical and trend analysis of water quality and quantity data for the Strymon River in Greece. Hydrol. Earth Syst. Sci. 2010, 5, 679–692. [Google Scholar] [CrossRef]
  26. Greek Government Gazette II 1635 of 9 June 2016. Modification of Article 19 of Annex 19 to Presidential Decree 51/2007 (A’54), as modified by Article 5 of Law 4117/2013 (A29), in Compliance with Directive 2014/101/EU of the European Council of 30 October 2014. Available online: www.et.gr (accessed on 27 June 2019).
  27. Bastian, M.; Heymann, S. Gephi: An open source software for exploring and manipulating networks. In Proceedings of the Third International AAAI Conference on Weblogs and Social Media, San Jose, CA, USA, 17–20 May 2009. [Google Scholar]
  28. Wei, T.; Simko, V. R package “corrplot”: Visualization of a Correlation Matrix. Available online: https://github.com/taiyun/corrplot (accessed on 2 April 2019).
  29. Lê, S.; Josse, J.; Husson, F. {FactoMineR}: A package for multivariate analysis. J. Stat. Softw. 2008, 25, 1–18. [Google Scholar] [CrossRef]
  30. R Core Team. R: A Language and Environment for Statistical Computing. Available online: https://www.r-project.org/ (accessed on 2 April 2019).
  31. Crouzet, P.; le Gall, G.; Gomez, O. EEA Catchments and Rivers Network System ECRINS v1.1. Available online: https://www.eea.europa.eu/publications/eea-catchments-and-rivers-network (accessed on 27 June 2019).
  32. Fennel, K.; Testa, J.M. Biogeochemical controls on coastal hypoxia. Ann. Rev. Mar. Sci. 2018, 11, 105–130. [Google Scholar] [CrossRef]
  33. Bu, C.; Wang, Y.; Ge, C.; Ahmad, H.A.; Gao, B.; Ni, S.Q. dissimilatory nitrate reduction to ammonium in the yellow river estuary: Rates, abundance, and community diversity. Sci. Rep. 2017, 7, 1–11. [Google Scholar] [CrossRef]
  34. Bouraoui, F.; Grizzetti, B. Modelling mitigation options to reduce diffuse nitrogen water pollution from agriculture. Sci. Total Environ. 2014, 468–469, 1267–1277. [Google Scholar] [CrossRef]
  35. Grizzetti, B.; Pistocchi, A.; Liquete, C.; Udias, A.; Bouraoui, F.; van de Bund, W. Erratum: Human pressures and ecological status of European rivers. Sci. Rep. 2017, 7, 6941. [Google Scholar] [CrossRef]
  36. Stefanidis, K.; Panagopoulos, Y.; Mimikou, M. Response of a multi-stressed Mediterranean river to future climate and socio-economic scenarios. Sci. Total Environ. 2018, 627, 756–769. [Google Scholar] [CrossRef]
  37. Karaouzas, I. Agro-industrial wastewater pollution in Greek river ecosystems. In The Rivers of Greece. Evolution, Current Status and Perspectives; Skoulikidis, N., Dimitriou, E., Karaouzas, I., Eds.; Springer: Berlin/Heidelberg, Germany, 2016; pp. 169–204. ISBN 978-3-662-55369-5. [Google Scholar]
  38. Skoulikidis, N. The state and origin of river water composition in Greece. In The Rivers of Greece. Evolution, Current Status and Perspectives; Skoulikidis, N., Dimitriou, E., Karaouzas, I., Eds.; Springer: Berlin/Heidelberg, Germany, 2016; pp. 97–127. ISBN 978-3-662-55369-5. [Google Scholar]
  39. Donohue, I.; McGarrigle, M.L.; Mills, P. Linking catchment characteristics and water chemistry with the ecological status of Irish rivers. Water Res. 2006, 40, 91–98. [Google Scholar] [CrossRef]
  40. Roberts, W.M.; Fealy, R.M.; Doody, D.G.; Jordan, P.; Daly, K. Estimating the effects of land use at different scales on high ecological status in Irish rivers. Sci. Total Environ. 2016, 572, 618–625. [Google Scholar] [CrossRef]
  41. Bowes, M.J.; Smith, J.T.; Neal, C.; Leach, D.V.; Scarlett, P.M.; Wickham, H.D.; Harman, S.A.; Armstrong, L.K.; Davy-Bowker, J.; Haft, M.; et al. Changes in water quality of the River Frome (UK) from 1965 to 2009: Is phosphorus mitigation finally working? Sci. Total Environ. 2011, 409, 3418–3430. [Google Scholar] [CrossRef]
  42. Naden, P.S.; Murphy, J.F.; Old, G.H.; Newman, J.; Scarlett, P.; Harman, M.; Duerdoth, C.P.; Hawczak, A.; Pretty, J.L.; Arnold, A.; et al. Understanding the controls on deposited fine sediment in the streams of agricultural catchments. Sci. Total Environ. 2016, 547, 366–381. [Google Scholar] [CrossRef] [Green Version]
  43. Mathers, K.L.; Rice, S.P.; Wood, P.J. Discharge and suspended sediment time series as controls on fine sediment ingress into gravel river beds. Catena 2019, 173, 253–263. [Google Scholar] [CrossRef]
  44. Florsheim, J.L.; Pellerin, B.A.; Oh, N.H.; Ohara, N.; Bachand, P.A.M.; Bachand, S.M.; Bergamaschi, B.A.; Hernes, P.J.; Kavvas, M.L. From deposition to erosion: Spatial and temporal variability of sediment sources, storage, and transport in a small agricultural watershed. Geomorphology 2011, 132, 272–286. [Google Scholar] [CrossRef]
  45. Jones, J.I.; Collins, A.L.; Naden, P.S.; Sear, D.A. The relationship between fine sediment and macrophytes in rivers. River Res. Appl. 2012, 28, 1006–1018. [Google Scholar] [CrossRef]
  46. Voutsa, D.; Manoli, E.; Samara, C.; Sofoniou, M.; Stratis, I. A study of surface water quality in Macedonia, Greece: Speciation of nitrogen and phosphorus. Water Air Soil Pollut. 2001, 129, 13–32. [Google Scholar] [CrossRef]
  47. European Environment Agency. European Waters—Assessment of Status and Pressures; No 8/2012.; European Environment Agency: Copenhagen, Denmark, 2012. [Google Scholar]
  48. Solheim, A.L.; Austnes, K.; Kristensen, P.; Peterlin, M.; Kodeš, V.; Collins, R.; Semerádová, S.; Künitzer, A.; Filippi, R.; Prchalová, H.; et al. Ecological and Chemical Status and Pressures in European Waters. Thematic Assessment for EEA Water 2012 Report; ETC/ICM: Prague, Czech Republic, 2012. [Google Scholar]
  49. Spänhoff, B.; Dimmer, R.; Friese, H.; Harnapp, S.; Herbst, F.; Jenemann, K.; Mickel, A.; Rohde, S.; Schönherr, M.; Ziegler, K.; et al. Ecological status of rivers and streams in Saxony (Germany) according to the water framework directive and prospects of improvement. Water 2012, 4, 887–904. [Google Scholar] [CrossRef]
  50. Bowes, M.J.; Jarvie, H.P.; Naden, P.S.; Old, G.H.; Scarlett, P.M.; Roberts, C.; Armstrong, L.K.; Harman, S.A.; Wickham, H.D.; Collins, A.L. Identifying priorities for nutrient mitigation using river concentration-flow relationships: The Thames basin, UK. J. Hydrol. 2014, 517, 1–12. [Google Scholar] [CrossRef]
  51. Halliday, S.J.; Skeffington, R.A.; Wade, A.J.; Bowes, M.J.; Gozzard, E.; Newman, J.R.; Loewenthal, M.; Palmer-Felgate, E.J.; Jarvie, H.P. High-frequency water quality monitoring in an urban catchment: Hydrochemical dynamics, primary production and implications for the Water Framework Directive. Hydrol. Process. 2015, 29, 3388–3407. [Google Scholar] [CrossRef]
  52. Trepel, M. Towards ecohydrological nutrient management for river basin districts. Ecohydrol. Hydrobiol. 2016, 16, 92–98. [Google Scholar] [CrossRef]
  53. Follett, R. (Ed.) Nitrogen Management and Ground Water Protection. Developments in Agricultural and Managed Forest Ecology, Volume 21; Elsevier Science Publishers B.V.: Amsterdam, The Netherlands, 1989; ISBN 9780444599391. [Google Scholar]
  54. Hansen, B.; Thorling, L.; Schullehner, J.; Termansen, M.; Dalgaard, T. Groundwater nitrate response to sustainable nitrogen management. Sci. Rep. 2017, 7, 1–12. [Google Scholar] [CrossRef]
  55. Wild, L.M.; Mayer, B.; Einsiedl, F. Decadal delays in groundwater recovery from nitrate contamination caused by Low O2 reduction rates. Water Resour. Res. 2018, 54, 9996–10012. [Google Scholar] [CrossRef]
  56. Scheurer, K.; Alewell, C.; Bänninger, D.; Burkhardt-Holm, P. Climate and land-use changes affecting river sediment and brown trout in alpine countries—A review. Environ. Sci. Pollut. Res. 2009, 16, 232–242. [Google Scholar] [CrossRef]
  57. Samaras, A.G.; Koutitas, C.G. Modeling the impact of climate change on sediment transport and morphology in coupled watershed-coast systems: A case study using an integrated approach. Int. J. Sediment. Res. 2014, 29, 304–315. [Google Scholar] [CrossRef]
  58. Luo, P.; Zhou, M.; Deng, H.; Lyu, J.; Cao, W.; Takara, K.; Nover, D.; Geoffrey Schladow, S. Impact of forest maintenance on water shortages: Hydrologic modeling and effects of climate change. Sci. Total Environ. 2018, 615, 1355–1363. [Google Scholar] [CrossRef]
  59. Dimitriou, E.; Stavroulaki, E. Assessment of riverine morphology and habitat regime using unmanned aerial vehicles in a Mediterranean environment. Pure Appl. Geophys. 2018, 175, 3247–3261. [Google Scholar] [CrossRef]
Figure 1. Location of the river sampling sites.
Water 11 01680 g001
Figure 2. Correlogram showing the correlations between environmental variables. Positive correlations are displayed in red and negative correlations in blue color. Color intensity is proportional to the correlation coefficient. The X mark means insignificant correlations.
Water 11 01680 g002
Figure 3. PCA factor map of the water quality variables. Arrows represent the squared loadings of the variables. Color intensity is proportional to the value of the loading. Variables that are closer to the correlation circle contribute more to the principal components.
Water 11 01680 g003
Figure 4. Bars show the % contribution of each variable to principal components 1 and 2 of the PCA for water quality variables (top two graphs) and the hydromorphological variables (bottom two graphs). The red dashed line in each graph indicates the expected average contribution.
Water 11 01680 g004
Figure 5. PCA factor map of the hydromorphological variables. Arrows represent the squared loadings of the variables. Color intensity is proportional to the value of the loading. Variables that are closer to the correlation circle contribute more to the principal components.
Water 11 01680 g005
Figure 6. Network analysis of the main Greek rivers based on the physicochemical quality classification–Only rivers with more than nine (9) sampling efforts are included.
Water 11 01680 g006
Figure 7. Boxplots for key variables per River Basin District (RBD). The red dot represents mean values.
Water 11 01680 g007
Figure 8. Boxplots for key variables per intercalibration river type (ICT). The red dot represents mean values.
Water 11 01680 g008
Figure 9. Physicochemical status of the selected parameters at sub-basin scale: (a) Nitrate, (b) Electrical conductivity (μS/cm), (c) Phosphate, and (d) Ammonium. Classification of nitrate, phosphate and ammonium into the five classes of nutrient quality follows the Nutrient-quality Classification System (NCS) [18].
Water 11 01680 g009
Figure 10. Predicted values of NCS to Agriculture, Artificial and Forest and semi-natural land uses.
Water 11 01680 g010
Figure 11. Predicted values of the nitrate (top left) and EC (top right) to Agricultural land use, and phosphate (bottom left) and ammonium (bottom right) to Artificial land use.
Water 11 01680 g011
Table 1. Distribution of sampling sites per River Basin Districts (RBD).
RBD CodeRBD NameNo Sites
GR01Western Peloponnese36
GR02Northern Peloponnese33
GR03Eastern Peloponnese13
GR04West Central Greece35
GR05Epirus27
GR06Attica6
GR07East Central Greece30
GR08Thessaly43
GR09Western Macedonia25
GR10Central Macedonia20
GR11Eastern Macedonia25
GR12Thrace25
GR13Crete26
GR14Aegean Islands8
Total352
Table 2. Descriptive statistics of water quality and hydromorphological variables aggregated at river site. (sd means standard deviation and se means standard error of mean).
VariableMeanMedianMin.Max.sdse
Physicochemical variables
Electrical conductivity (μS/cm)490420603320320320
Total dissolved solids (mg/L)29525328215519210
pH8.028.056.659.430.460.02
Nitrate (mg/L)1.260.600.0116.461.890.10
Nitrite (mg/L)0.060.0040.007.750.430.02
Ammonium (mg/L)0.220.020.0021.241.330.07
Dissolved inorganic nitrogen (mg/L)1.540.690.0121.342.440.13
Phosphate (mg/L)0.140.020.004.980.470.03
Oxygen saturation (%)99.62101.0520.30169.3017.030.91
Hydromorphological variables
Rock (%)2.520.000.0085.009.320.50
Boulders (%)11.008.010.0070.0013.120.70
Cobbles (%)28.9928.510.0090.0018.650.99
Pebbles (%)21.4720.000.0070.0011.600.62
Gravel (%)13.6813.000.0060.008.530.45
Sand (%)13.8410.000.0095.0015.560.83
Silt and Clay (%)8.623.930.00100.0015.950.85
Channel vegetation (%)11.785.000.00100.0018.000.96
Canopy shade (%)20.9820.000.0095.0023.661.26
Right bank vegetation (%)46.4345.520.00100.0032.031.71
Left bank vegetation (%)47.0346.310.00100.0031.761.69
Channel width (m)12.957.501.05380.0024.391.30
Channel depth (cm)41.9837.750.00245.0030.051.60
Flow (m/s)0.340.280.002.260.280.01
Discharge (m3/s)1.950.630.0153.534.290.23
Table 3. Linear model fitting results for nitrate, phosphate, ammonium, and EC to Agriculture, Artificial and Forest and semi-natural land uses.
VariableNitratePhosphateAmmoniumECNCS
(Intercept)1.02 **0.35 *0.260.80 ***3.59 ***
Artificial LUs0.19 ***0.08 ***0.11 ***0.04 ***−0.46 ***
Agricultures0.18 ***−0.01−0.010.04 ***−0.14 **
Forests and Semi-natural areas−0.10−0.06−0.04−0.10 ***0.11 *
R20.320.150.140.310.46
*** p < 0.001; ** p < 0.01; * p < 0.05.

