Gradual Exposure to Salinity Improves Tolerance to Salt Stress in Rapeseed (Brassica napus L.)
by
 and
and
Michael Santangeli
1,2, 
Concetta Capo
1,
Simone Beninati
1,
Fabrizio Pietrini
3 and
Cinzia Forni
1,* 1
Dipartmento di Biologia, Università di Roma Tor Vergata, Via della Ricerca Scientifica, 00133 Rome, Italy
2
Department of Forest and Soil Sciences, University of Natural Resources and Life Sciences, Institute of Soil Research (IBF), BOKU Vienna, Konrad-Lorenz Straße 24, 3034 Tulln, Austria
3
Istituto di Ricerca sugli Ecosistemi Terrestri, Consiglio Nazionale delle Ricerche (IRET-CNR), Area della Ricerca di Roma 1, Via Salaria Km 29.300, 00015 Monterotondo Stazione (Roma), Italia
*
Author to whom correspondence should be addressed.
Water 2019, 11(8), 1667; https://doi.org/10.3390/w11081667
Submission received: 4 June 2019
/
Revised: 17 July 2019
/
Accepted: 7 August 2019
/
Published: 12 August 2019
(This article belongs to the Special Issue Technological Eco-Innovations for the Quality Control and the Decontamination of Polluted Waters and Soils)
Abstract
:Soil salinity is considered one of the most severe abiotic stresses in plants; plant acclimation to salinity could be a tool to improve salt tolerance even in a sensitive genotype. In this work we investigated the physiological mechanisms underneath the response to gradual and prolonged exposure to sodium chloride in cultivars of Brassica napus L. Fifteen days old seedlings of the cultivars Dynastie (salt tolerant) and SY Saveo (salt sensitive) were progressively exposed to increasing soil salinity conditions for 60 days. Salt exposed plants of both cultivars showed reductions of biomass, size and number of leaves. However, after 60 days the relative reduction in biomass was lower in sensitive cultivar as compared to tolerant ones. An increase of chlorophylls content was detected in both cultivars; the values of the quantum efficiency of PSII photochemistry (ΦPSII) and those of the electron transport rate (ETR) indicated that the photochemical activity was only partially reduced by NaCl treatments in both cultivars. Ascorbate peroxidase (APX) activity was higher in treated samples with respect to the controls, indicating its activation following salt exposure, and confirming its involvement in salt stress response. A gradual exposure to salt could elicit different salt stress responses, thus preserving plant vitality and conferring a certain degree of tolerance, even though the genotype was salt sensitive at the seed germination stage. An improvement of salt tolerance in B. napus could be obtained by acclimation to saline conditions.
1. Introduction
Soil salinity affects at least 20% of irrigated land worldwide, with a prevision of an increasing trend of arable lands loss up to 50% by the middle of the twenty-first century. Therefore, a devastating scenario is foreseen in the global scale both for the environmental resources and human health due to reduction of soil fertility and crop yield [1]. Italy is one of the salt-affected countries in Europe, and in the Mediterranean area this country is considered a hotspot for both land degradation and desertification, and salinization can be considered an important cause of soil degradation [2].
Salt stress is one of the most adverse abiotic stress impairing productivity of several important crops. The major consequences of plant exposure to saline conditions are cell dehydration and toxicity caused by salt, due to the inhibition of water uptake by the root hairs. Generally, soil salinity affects many aspects of plant development, such as seed germination, vegetative growth (through the reduction of the leaf area, the content of chlorophylls and the conductance of the stomata), and the reproduction by inducing the abortion of the ovules and senescence of fertilized embryos [3,4]. Sodium and chlorine are considered the ions mainly responsible for the salinization, reaching concentration that can inhibit or decrease the development of plants [1,2,3,4]. Leaves accumulate most of the excess of Na+ and Cl− absorbed at the roots level, and this accumulation causes an early senescence, associated with more or less marked chlorosis and/or necrosis phenomena, depending on the accumulation rate of these ions and the capacity to compartmentalize them. The effect of salinity on leaves can be either direct, due to the closure of the stomata and the consequent reduction in the rate of assimilation of CO2 [5], or secondary; due to oxidative stress, which can seriously affect leaf photosynthetic machinery. Besides this, the intracellular accumulation of Na+ changes the ratio of K+/Na+ and may lead to an osmotic imbalance and the production of Reactive Oxygen Species (ROS), which seems to affect the function of some enzymes, and the amounts of photosynthetic pigments [6]. Oxidative stress, caused by ROS overproduction, is the main cause of loss in productivity of the cultivated species [7].
The salt tolerance mechanism is a multigenic trait involving different biochemical pathways: i.e., control of ion uptake by roots and transport into leaves, synthesis of compatible solutes, change in photosynthetic pathway, induction of antioxidant enzymes as well as the synthesis of hormones. The stress response depends to a different extent on both genotypes and developmental stages of the plants; furthermore, the genetic plasticity is fundamental for conferring different degrees of tolerance, by depending on the effectiveness of stress response mechanisms. In non-tolerant species a gradual adaptation to saline conditions can ameliorate the plant response to stress, leading to a better performance [8].
The aim of this work was to reveal the role and relative contribution of plant acclimation to the amelioration of tolerance to salt stress in rapeseed (Brassica napus L.). This crop is mainly utilized for edible oil production, its use has been also considered for the production of renewable energy, in fact the large amount of oil present in the seeds makes them suitable as oilseed and fodder crop, and for the production of biodiesel [9]. Even though many cultivars of this species were described as ‘salt-tolerant’, yield and growth of this crop can decline with increasing soil salinity [10].
To assess the possibility to induce the tolerance to salt in cultivars of rapeseed, the effects of NaCl on plants were determined by a whole-plant assessment of agronomic parameters, used for salinity tolerance selection [11], and of physiological mechanisms underneath the response to gradual and prolonged exposure to sodium chloride.
2. Materials and Methods
2.1. Chemicals and Reagents
All reagents, analytical grade or equivalent, were purchased from Merck or Sigma-Aldrich, unless otherwise stated. In each set of experiments all working solutions were prepared immediately before use from stock reagents.
2.2. Plant Growth Conditions and Saline Treatments
The seeds of Italian cultivars of B. napus were kindly supplied by Dr. Montanari of the CREA-CIN (Centro di Ricerca per le Colture Industriali) Bologna, Italy. The cultivars were selected based on high-yield in oil production and low glucosinolates and erucic acid content. The seeds were stored at 4 °C until sowing.
Preliminary seed germination test in presence of salt were performed on seven cultivars cultivated in Italy (data not shown). Basing on the germination rates, we selected the most susceptible cultivar (SY Saveo 16% seed germinated at 72 h at 320 mM NaCl) and the most tolerant ones (Dynastie 82% seed germinated at 72 h at 320 mM NaCl) for the following experiments.
The seeds of these cultivars were first washed with running water and then soaked for 1 h in tap water. The seeds were then placed in Petri dishes (50 seeds each) containing two layers of filter paper soaked with 1:10 strength Hoagland solution [12]. The Petri dishes were incubated in the dark for 24 h at 10 °C, then they were placed at 24 °C for 48 h. Then, the germinated seeds were carefully sown in plastic pots (20 cm diameter), 8 seeds per pots. Each pot contained about 1.6 kg of water saturated soil material (total volume of 2.5 L) with the following chemical-physical characteristics: pH 6.2, EC 0.25 dS m−1, dry bulk density 135 kg m3, total porosity 91% v/v, components (neutral sphagnum peat, perlite (<5%), mineral compound fertilizer).
The experimental groups consisted of 3 plastic pots (24 cm diameter, 20 cm height) for each treatment, containing 8 germinated seeds. Seedlings were grown for 15 days before the beginning of salt treatments at 23 °C ± 2 °C (constant temperature) and 48% ± 2% of relative humidity, moved randomly every 4 days, with a photoperiod of 16 h, PAR between 20 (min.) and 30 (max.) μmoles photons m−2 s−1 (lamp: 2 × OSRAM, FLUORA t8 36.00 W and 2 × OSRAM, LUMILUX Cool Daylight t 8 36.00 W). During the first growing period of 15 days, each pot was irrigated once a week with 50 mL of 1/10 strength Hoagland solution each pot, ~20% GWC. Fifteen-days old seedlings were randomly assigned to three (different treatment groups and irrigated every 4 days with: 100 mL Hoagland (control) or 100 mL Hoagland containing 160 mM NaCl or 320 mM NaCl (saline treatments). Pots without plants irrigated and maintained in the same conditions were added and considered as blank. The experimental period was 60 days.
2.3. Growth and Morphological Parameters
Morphological parameters were monitored every 15 days starting from the beginning of the treatments to progressively evaluate the effects of NaCl on plant growth. Parameters taken in account were as follows: length of the stem, leaf area, number of leaves, and length of the longest root (for plants sampled at 30th and 60th day). The biomass was determined by evaluating the total weight of the plants (g fresh weight). The biomass of the control and of the treated plants was related to the number of plants that composed each group obtaining the average value of biomass per plant.
For subsequent determinations, samples (200 mg fresh weight) were frozen by dipping in liquid nitrogen and stored at −80 °C until further analyses.
2.4. Water Content of the Plants
The percentage of water content was determined by bringing the plants to dryness in a stove at a temperature of 70 °C for 48 h [13]. The average % of water was estimated as:
where: f.w. = Plant’s fresh weight; d.w. = Plant’s dry weight.
2.5. Membrane Injury Index (MII)
At the 60th day, the membrane injury index was calculated on fresh samples of shoots and roots by measuring the electrical conductivity according to the method of Blum and Ebercon [14]. Immediately after sampling, the samples were analysed by immersing in milli-Q water in a volume equal to 0.1 mL water mg f.w.−1 The conductivity was measured at room temperature with the electrical conductivity (EC) meter (Hanna instrument 8333) after 30 min incubation at 40 °C and 10 min at 100 °C in a water bath (Gesellschaft für Labortechnik, GFL). The membrane injury index was calculated according to the formula:
where: C40 °C = electrical conductivity measured after 30 min at 40 °C; C100 °C = electrical conductivity measured after 10 min at 100 °C.
2.6. Soil Analysis
The chemical-physical parameters of the soils were determined in pots containing plants and in pots without plants (blank) in order to evaluate the absorption of minerals by the roots.
The gravimetric water content of soil was determined, at the end of the experiments. The percentage of water content was determined by oven-drying soils samples at a temperature of 70 °C for 48 h. The average % of water was estimated as:
where: f.w. = Soil fresh weight; d.w. = Soil dry weight.
The osmolality of the soil was determined according to Merchant et al. [15] with the cryogenic osmometer OSMOMAT 030 (Gonotec, Berlin, Germany).
Forty milligrams (dry weight) of soil samples, lacking of perlite, were homogenized and were crushed with pestles adding 1 mL of distilled water at 80 °C and incubated for 30 min at 80 °C in a water bath. The samples, were centrifuged for 5 min at 15,000× g at room temperature, and the supernatant was analysed for the osmolality.
The determination of the electrical conductivity (EC) was carried out according to Sairam et al. [16]. Soil samples (200 mg dry weight) were dipped in water milli-Q (0.1 mL H2O mg d.w.−1). They were subsequently incubated in a water bath at 100 °C for 10 min and then filtered with paper funnels. Electrical conductivity was measured on the filtrate at room temperature with an EC meter (HANNA Instrument 8333).
2.7. Imaging of Chlorophyll Fluorescence and Leaf Total Chlorophyll Content
At the end of the experiment (60th day), to assess the efficiency of the photosynthetic apparatus in plants of B. napus exposed to salt stress, imaging of chlorophyll fluorescence parameters were performed. In particular, the maximal quantum efficiency of PSII photochemistry (Fv/Fm), the quantum efficiency of PSII photochemistry (ΦPSII) and the non-photochemical quenching (NPQ) were measured on the last fully expanded leaf using a chlorophyll fluorescence imaging (MINI-Imaging-PAM, Walz, Germany). Leaves were dark adapted for at least 30 min before determining F0 and Fm (minimum and maximum fluorescence, respectively). The Fv/Fm value was calculated as (Fm − F0)/Fm. Subsequently, leaves were adapted to a photosynthetic photon flux density (PPFD) of 55 μmoles m−2 s−1 for at least 10 min to reach a steady-state condition. A saturation light pulse was then applied to determine the maximum fluorescence (Fm′) and steady-state fluorescence (Fs) during the actinic illumination. Saturation pulse images and values of the chlorophyll fluorescence parameters were captured. The ΦPSII value was calculated according to Genty et al. [17] using the formula (Fm’ − Fs)/Fm’. Calculation of NPQ was determined as (Fm − Fm’)/Fm’ [18]. Data of NPQ were divided by four to display values < 1.00. The apparent photosynthetic electron transport rate (ETR) was calculated as follows: ETR = ΦPSII × PPFD × 0.5 × Abs, where Abs is the apparent absorptivity of the leaf surface and 0.5 is the fraction of light absorbed by PSII antennae [19]. The Abs value was automatically calculated pixel by pixel from the R (red) and NI (near infrared) images using the formula: Abs = 1 − (R/NI). Furthermore, measurements of total chlorophyll content were performed by the chlorophyll meter readings (SPAD-502, Minolta Camera Co., Osaka, Japan) on the same leaves previously used for chlorophyll fluorescence determinations. The measure was taken from one fully developed leaf per plant. Four SPAD readings were taken from the widest portion of the leaf lamina, while avoiding major veins. The four SPAD readings were averaged to represent the SPAD value of each leaf. SPAD values were converted to chlorophyll content (µg cm−2) using the following equation [20]:
Chlorophyll content = (99 × SPAD)/(144 − SPAD)
2.8. Phenolic Compounds
The phenolic compounds were extracted from frozen samples according to Orzali et al. [21] with some modification. Briefly, samples were ground to fine powder in ceramic mortars with pestles at 4 °C, suspended in 3 mL of 0.1 M HCL (Scharlau), and incubated for 3 h at 4 °C. Extracts were centrifuged for 15 min at 8000× g. The supernatants were collected, and the pellets rinsed with an additional 2 mL of 0.1 M HCl to complete the extraction, and centrifuged again for 15 min at 8000× g. The supernatants were pooled and total phenolic amount was determined as described by Orzali et al. [21]. The concentration of the phenolic compounds was determined by a calibration curve of chlorogenic acid (CA) (Alfa Aesar) as standard (y = 0.0015x; R2 = 0.9997). Results are expressed as micrograms of CA equivalents per g of plant fresh weight.
2.9. Determination of Enzymatic Activities
Enzymatic activities were determined in extracts of frozen samples (200 mg f.w.) homogenized with ceramics mortars and pestles. In each assay, the protein content of the extracts was estimated by the dye-binding method of Bradford [22] using bovine serum albumin (BSA) as a standard, calibration curve (y = 0.0315x; R2 = 0.9913).
Polyphenol oxidase (PPO) (EC 1.14.18.1) activity was determined according to the method of Orzali et al. [21]. The kinetics of the enzymes were followed by spectrophotometer (VARIAN Cary 50 Bio) at the wavelength of 420 nm for 300 s. The activity was detected as enzymatic activity units (1 unit was defined as 1 µM of product produced minute−1 mL−1 reaction solution). The enzymatic activity of PPO was expressed as E.U. ∗ mg protein−1.
Superoxide dismutase (SOD) (EC 1.15.1.1) and ascorbate peroxidase (APX) (EC 1.11.1.11) activities were determined by NPAGE (native polyacrylamide gel electrophoresis). Two hundred milligrams (fresh weight) of frozen leaves were homogenized in liquid nitrogen and polyvinylpolypyrrolidone (PVPP). Homogenates were re-suspended in 1 mL of 0.2 M sodium phosphate buffer (pH 7.0) containing protease inhibitor cocktail for plant cell (Sigma). The extracts were centrifuged at 15,000× g at 4 °C for 30 min, the supernatants were recovered. Samples containing 40 µg proteins was added and separated on native polyacrilamide gel electrophoresis, and SOD activity was visualized of gel staining through the conversion of nitroblue tetrazolium to formazane, the gel was exposed to light to allow the development of the colour [23].
APX activity was detected according to the procedure by Mittler and Zilinskas [24]. PAGE was carried out under native conditions.
2.10. Polyamines
Polyamines (PA) were extracted from frozen leaves (200 mg f.w.) homogenized in liquid nitrogen using ceramic mortars and pestle. The homogenates were suspended in 1 mL of Dulbecco’s Phosphate Buffered Saline (D-PBS, Biowest) and then centrifuged for 10 min at 17,000× g. After a second centrifugation the supernatants were collected, quantified and brought to 1200 μL volume with saline phosphate buffer (PBS). To precipitate the proteins, perchloric acid (PCA) (final concentration 5%) was added to the sample. The samples were kept on ice bath for 30 min. and then centrifuged at 17,000× g for 15 min.; 50 μL of 1 mM Diaminooctane, (DAO) was added as internal standard to quantify any losses during sample preparation. Free polyamines content of the supernatant was determined by HPLC according to the method of Beninati et al. [25]. The correspondence between the areas of the PA peaks and their concentration was obtained by comparison with the areas of the standards of the Spermine (SPM), Spermidine (SPD) and Putrescine (PUT). The concentration of PA was expressed in:
nmoles ∗ mg f.w.−1
2.11. Proline
Proline and total amino acids were extracted from homogenized samples (50 mg f.w.) using a cold extraction procedure according to Carillo and Gibon [26]. The homogenate was collected and resuspended in 10 mg/0.2 mL (w/v) of ethanol: Milli-Q water (40:60 v/v). The resulting mixture was left overnight at 4 °C, and then centrifuged for 5 min at 14,000× g. To 500 μL of ethanolic extract was added 1 mL of reaction mixture composed by 1% (w/v) Ninhydrin (2,2-dihydroxyindane-1,3-dione) dissolved in a mixture of 60% (v/v) acetic acid (Fluka) and 20% (v/v) ethanol (Fluka). The sample mixture was heated at 95 °C in a block heater for 20 min and then centrifuged for 1 min to 6000× g. Proline concentration was evaluated by detecting the absorbance at 520 nm wavelength at the spectrophotometer (VARIAN Cary 50 Bio). Proline concentration was determined from a standard curve made with standard solutions of L-Proline (y = 0.0135 x; R2 = 0.9946). The proline content is expressed in nmoles * mg f.w.−1
2.12. Statistical Analysis
The experiment was set up in a completely randomized design with at least three replicates for each treatment and physiological determinations. Data are expressed as mean ± standard error (SE). The relationship between the measured morphological parameters and the saline treatment was assessed at 60th day, through the Kruskal Wallis test and the Mann–Whitney pairwise comparison test. Results of physiological analyses were evaluated by one-way analysis of variance (ANOVA). Tukey–Kramer method was used to evaluate the significance of the differences between the means of the parameters taken into consideration. Data regarding chlorophyll fluorescence parameters and leaf total chlorophyll were evaluated by two-way ANOVA, with cultivar and NaCl treatment as the main effects, using the Past3 software. All analyses were considered significant at p ≤ 0.05. In the graphs, different letters are considered significantly different from each other according to the probabilistic value p ≤ 0.05.
3. Results
In this work, we have focused the attention on the response of B. napus cultivars with different salt sensitivity exposed to a gradual increasing of salinity levels of soil medium, in order to verify if they can develop the ability to acclimatize to saline conditions. During the experiments, the irrigation with saline solution led to a gradually increasing salinity of the soil media with a significant enhancement of the electric conductivity (EC) at the end of the experiments (Figure 1). Moreover, in saline media, the water content was significantly higher respect to their control (p ≤ 0.05) (Figure 2), suggesting that salinity hindered water absorption by the plants.
3.1. Effects of Soil Salinization On Plants
Under the conditions reported above, the growth and consequently the production of biomass were reduced significantly with the increasing of soil salinity (Table 1; Figure 3) (In Supplementary Materials, photographs of the plants and statistical analysis of the height values are shown respectively in Figures S1 and S2, and Table S1). The relative reduction in biomass was lower after 60 days in sensitive cultivar as compared to tolerant. At the end of the experiments, significant differences in dry/fresh weight ratio of the treated plants compared to the controls were observed in both cultivars (Table 2). This was related to a decrease in water content of the plants exposed to NaCl (Table 3), which was caused by the reduced osmotic potential of the soil. The quantity of soluble proteins detected was generally higher in the treated plants than the controls, with the exception of Dynastie at 160 mM NaCl after 60 days (Table 2).
Leaf premature sensing of salt were observed in manner depending on NaCl concentration. Due to the small size, leaf area was measured after 15 days of treatments. The leaves were gradually affected by salt exposure (Figure 4); after 45 and 60 days both number of leaves per plants and leaf area were significantly reduced in the treated plants respect to the control (Figure 4). The length of the roots was not significantly affected by salt (Figure 5).
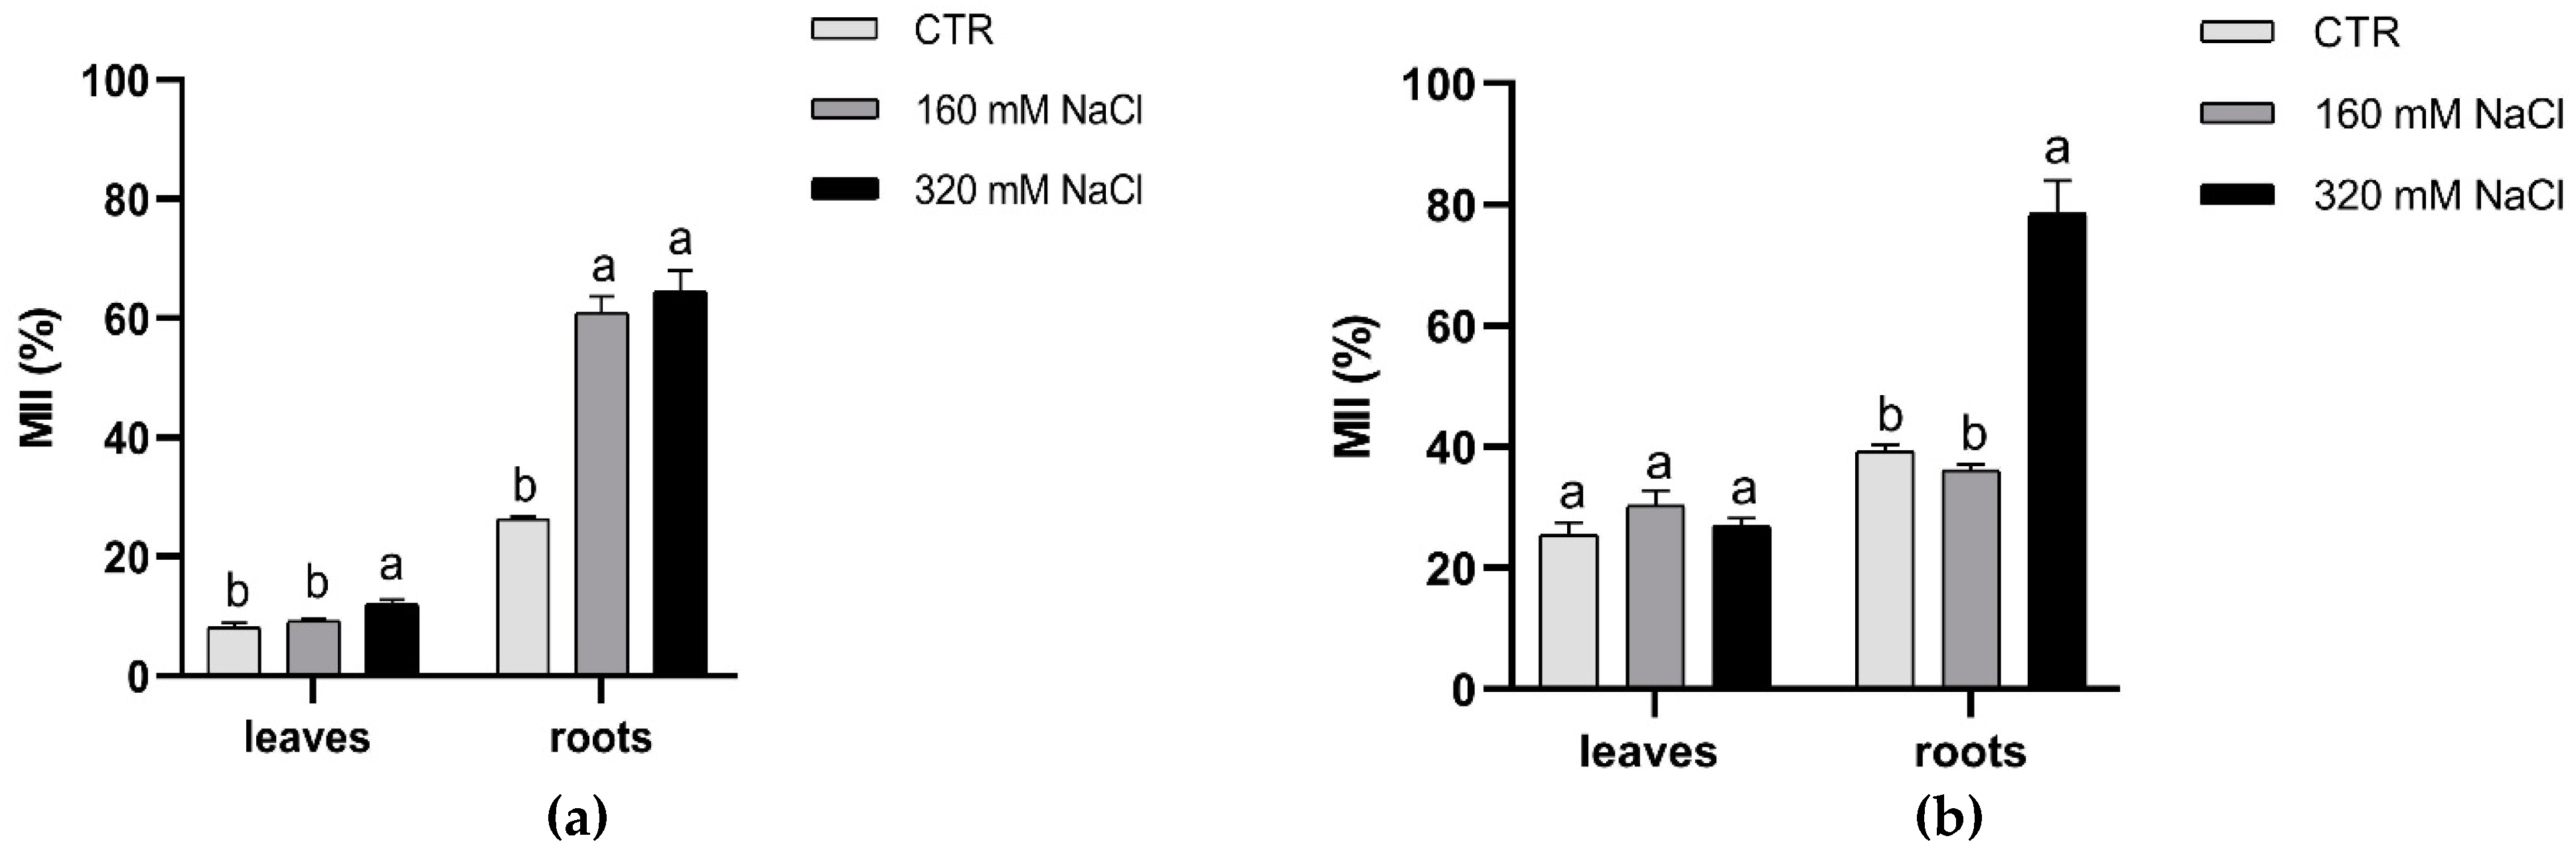
Membrane injury index (MII) increased significantly (p ≤ 0.05) only in roots, while MII of leaves was similar in control and treated plants, with a little increase at higher salt concentration in Dynastie (Figure 6).
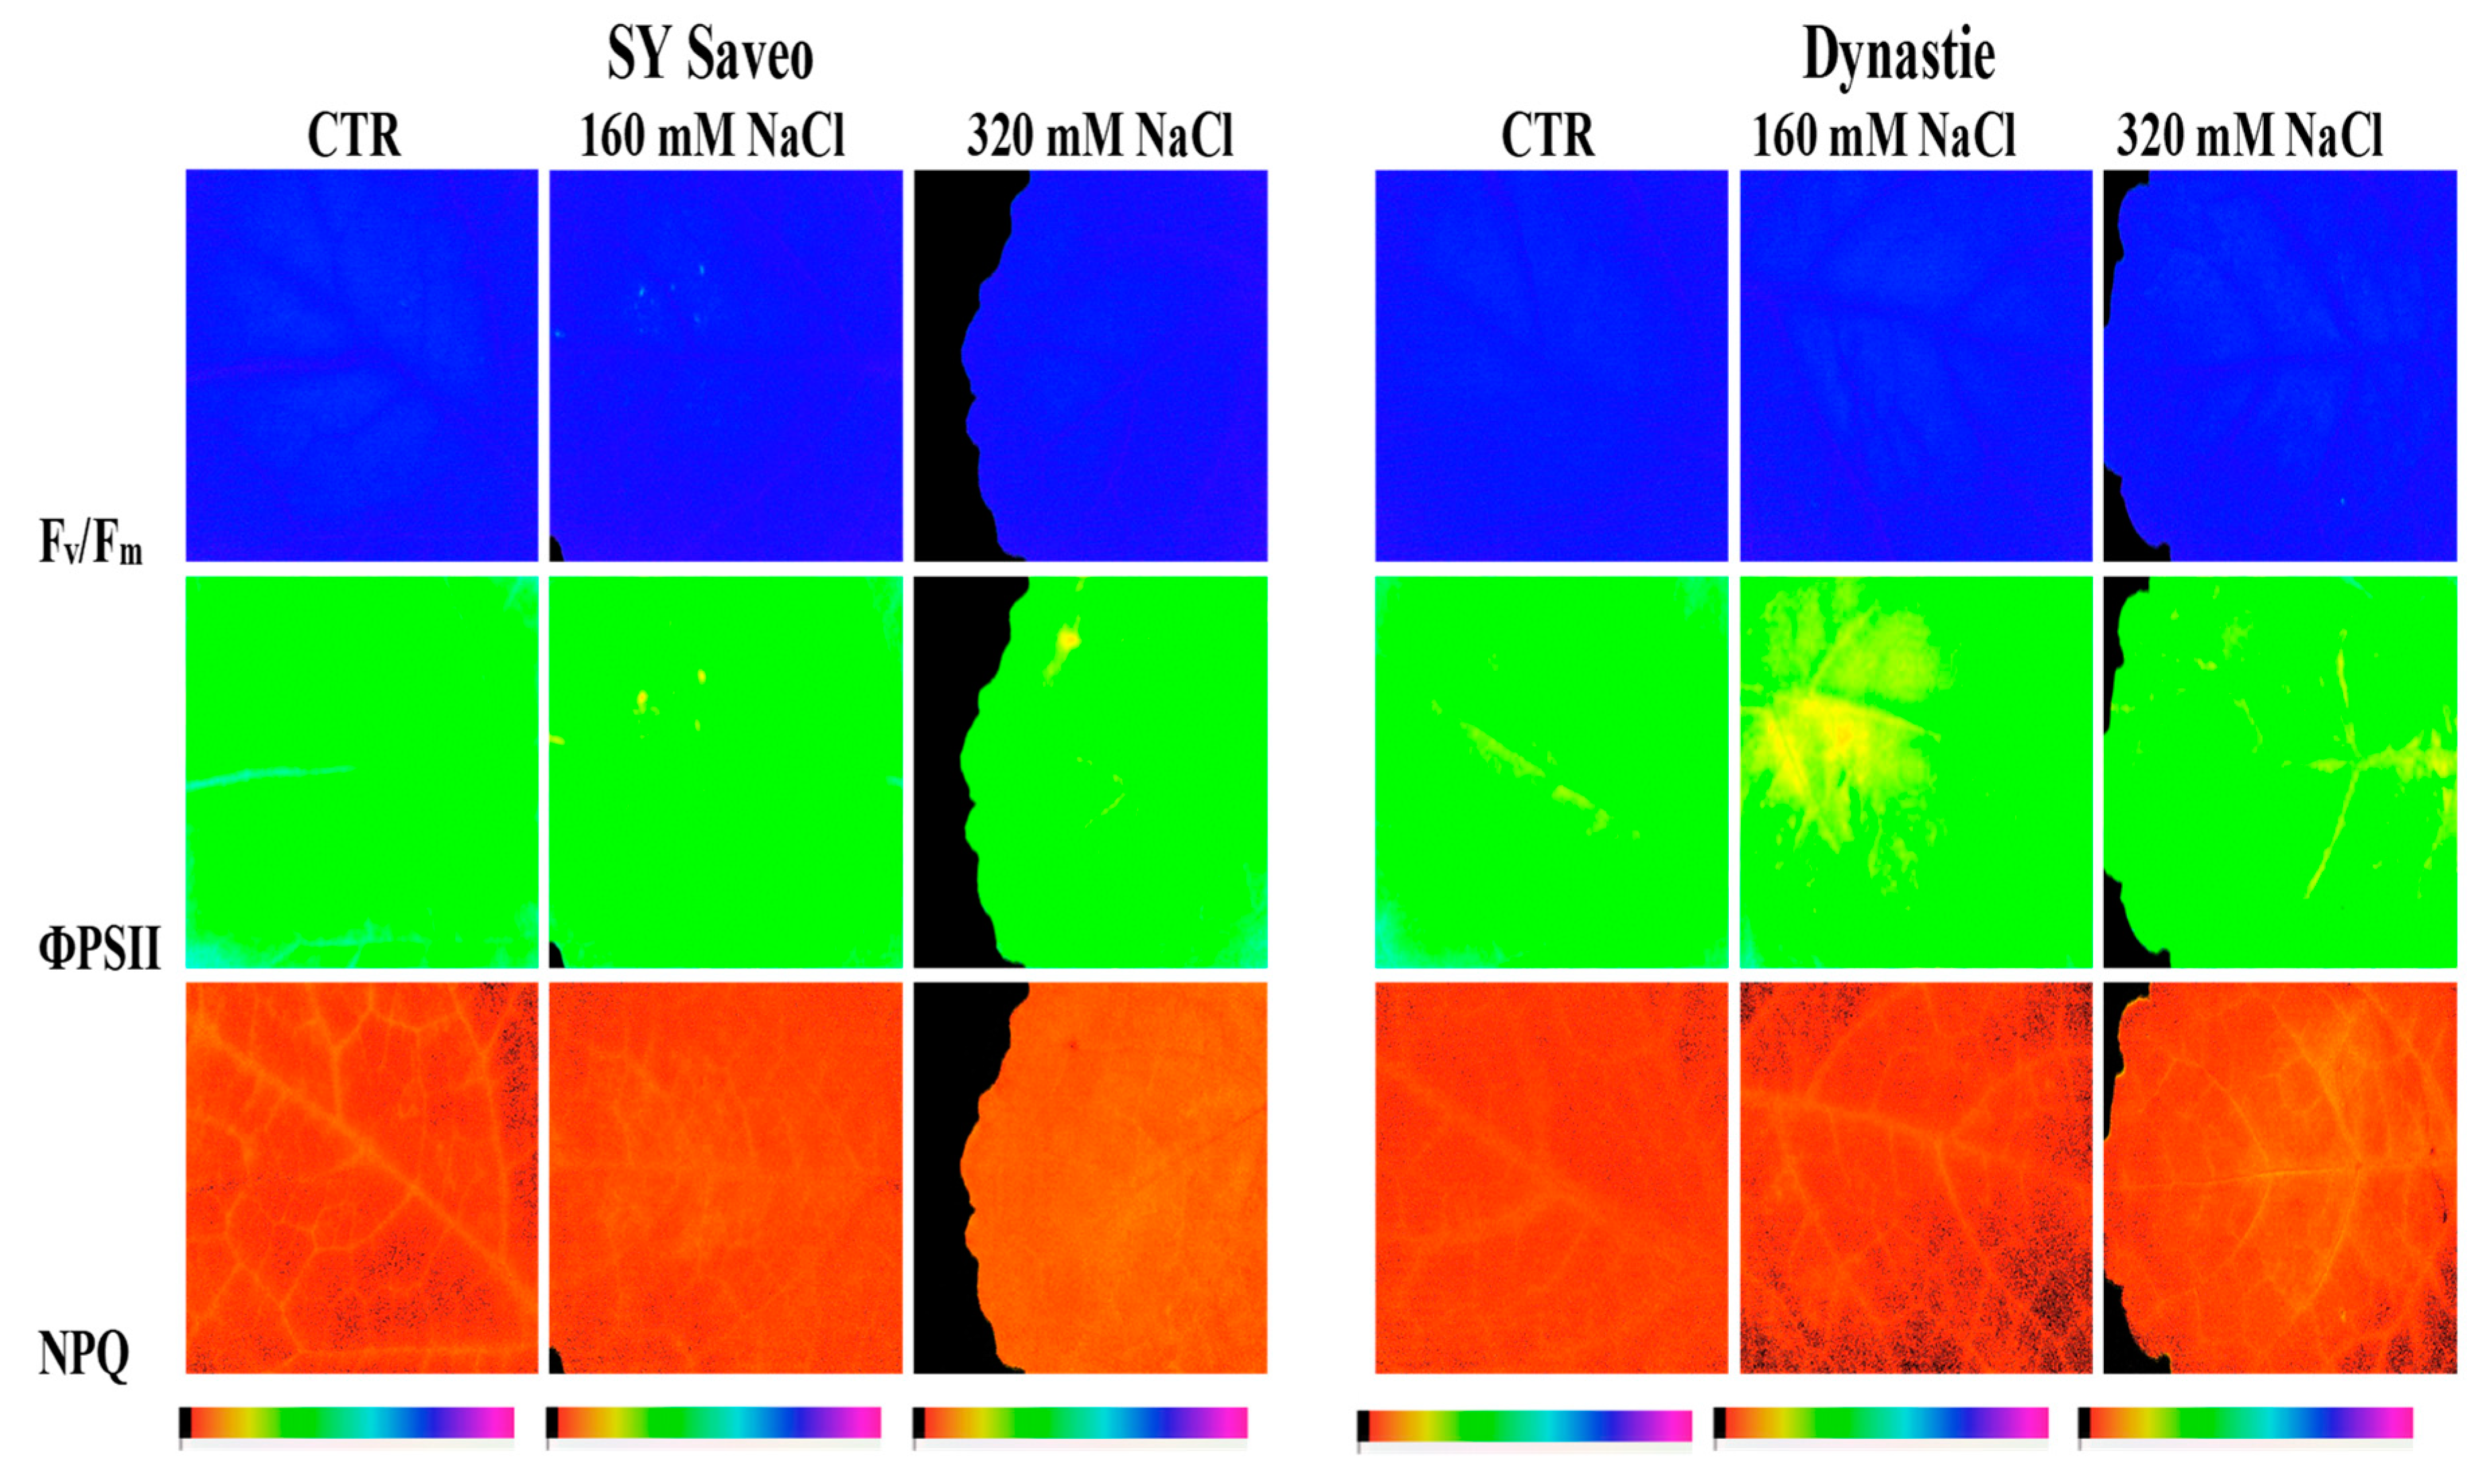
To assess the capacity of B. napus to withstand NaCl treatments and to study the spatial heterogeneity of photosynthesis, measurements of chlorophyll fluorescence imaging and leaf chlorophyll content were performed (Table 4). A representative image of chlorophyll fluorescence parameters (Fv/Fm, ΦPSII and NPQ) in a single leaf of the two cultivars of B. napus treated and untreated is reported in Figure 7. At the end of the experimental period, our results showed that with respect to control, the maximal quantum efficiency of PSII (Fv/Fm) was unaffected by the treatment at both NaCl concentrations in the two cultivars (Table 4). Moreover, the data revealed that the response of the quantum efficiency of PSII photochemistry (ΦPSII) in the two treated cultivars, measured at the light intensity close to that experienced by plants during the growth conditions, was quite similar (Table 4). In this study, plant exposure to both NaCl concentrations caused a decrease of the ΦPSII, compared to the control, nevertheless the reduction of this parameter was just more evident in cv Dynastie. A quite similar trend was also observed in the electron transport rate (ETR) values (Table 4). The response of the non-photochemical quenching (NPQ) to NaCl exposure evidenced that the NPQ values were practically unchanged, compared to control, in plant exposed to higher NaCl concentration, and showed a reduction at lower salt concentration in Dynastie, whereas exhibited an increase in SY Saveo (Table 4). Finally, in both cultivars the leaf total chlorophyll content and the apparent absorptivity of the leaf surface (Abs) values were generally higher in salt treated plants respect to control (Table 4).
3.2. Plant Response to Salt Stress
3.2.1. Antioxidant Defence
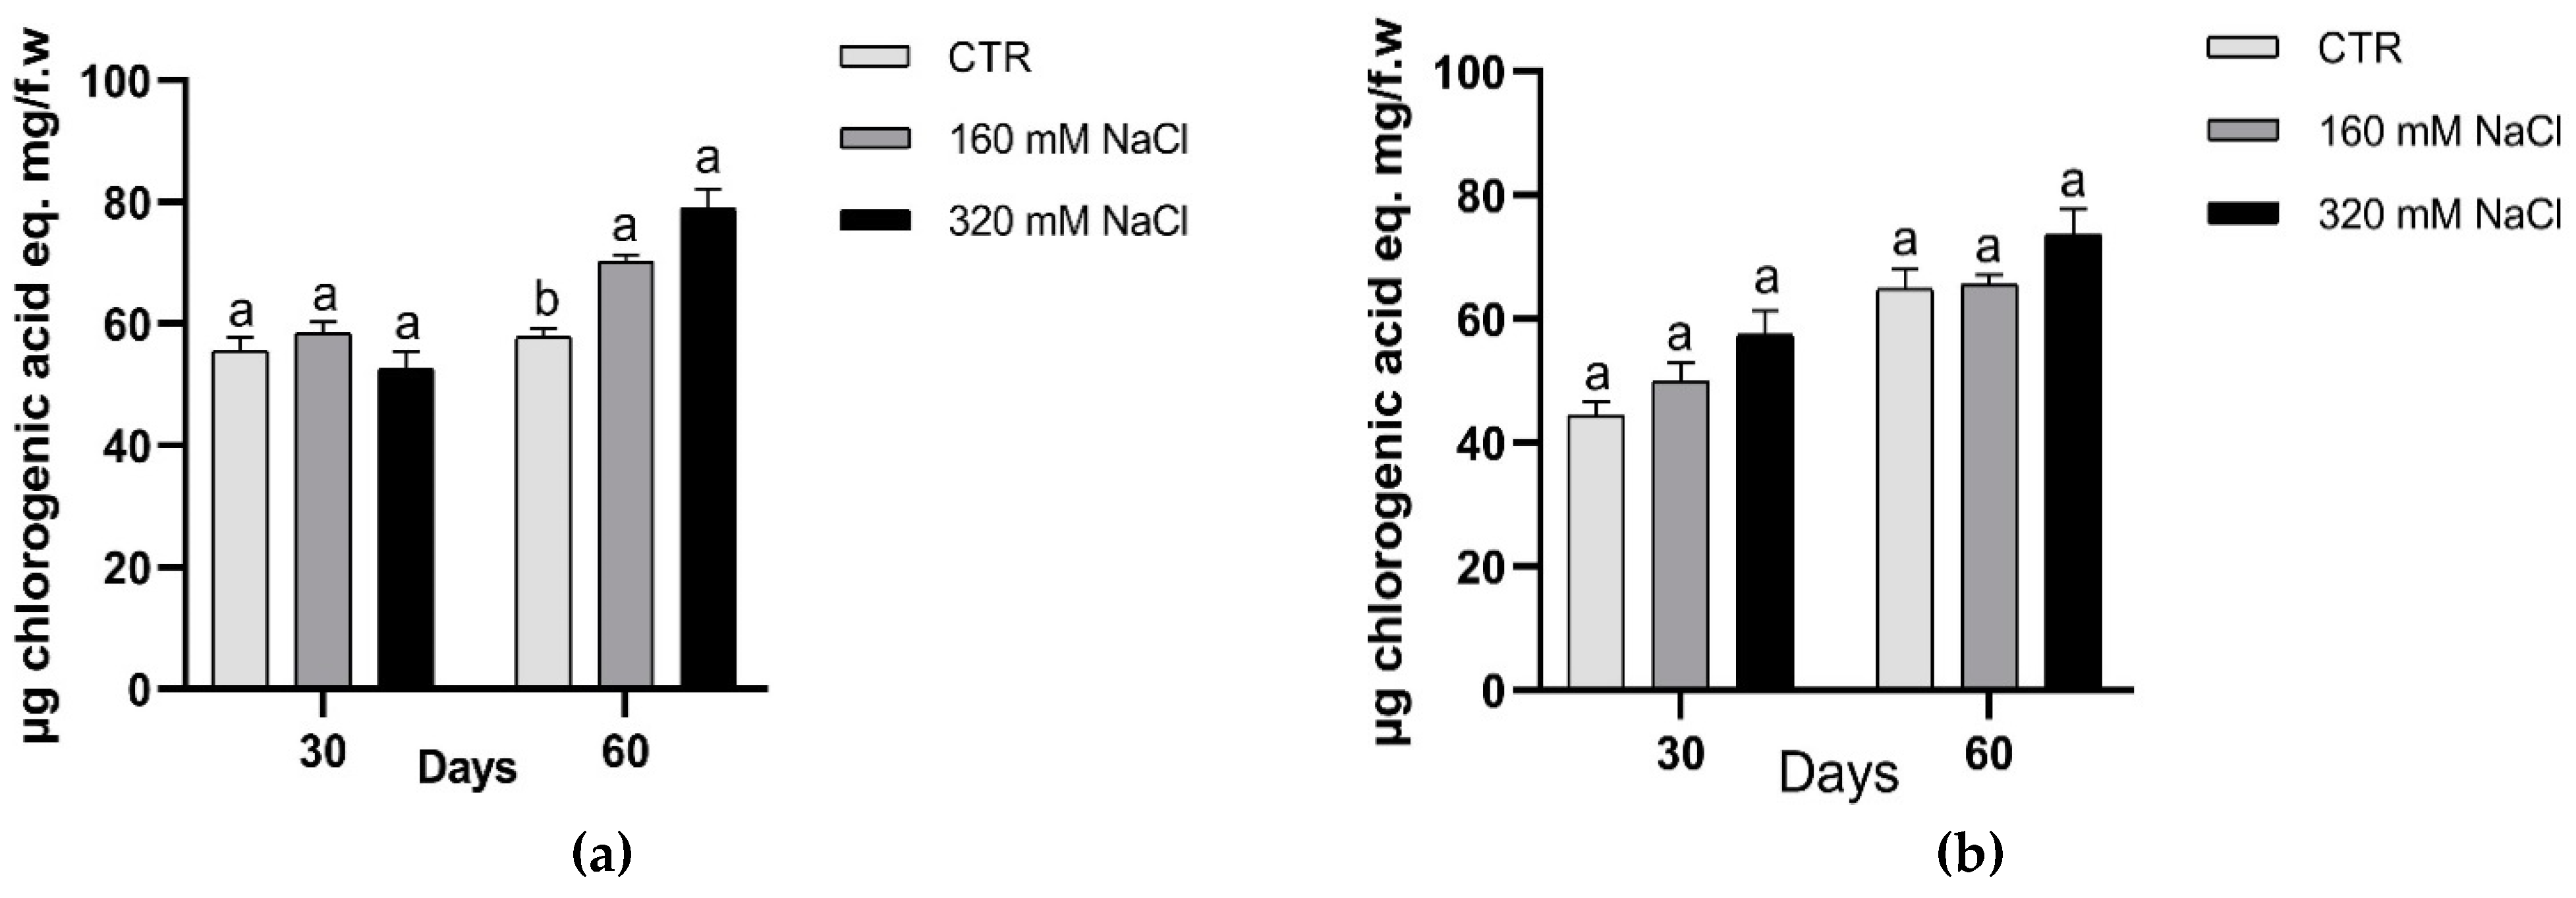
In plants, the antioxidant activity depends on either an effective non-enzymatic antioxidant defence system or on the enzymatic antioxidant response or on both of them. In agreement with the literature, we observed a general increase in the amounts of phenolics, with significant changes in the production in treated plants of Dynastie at the end of the experiments (Figure 8).
Higher APX activity was detected in the treated samples respect to the controls (Figure 9), indicating the activation of this enzyme following salt exposure.
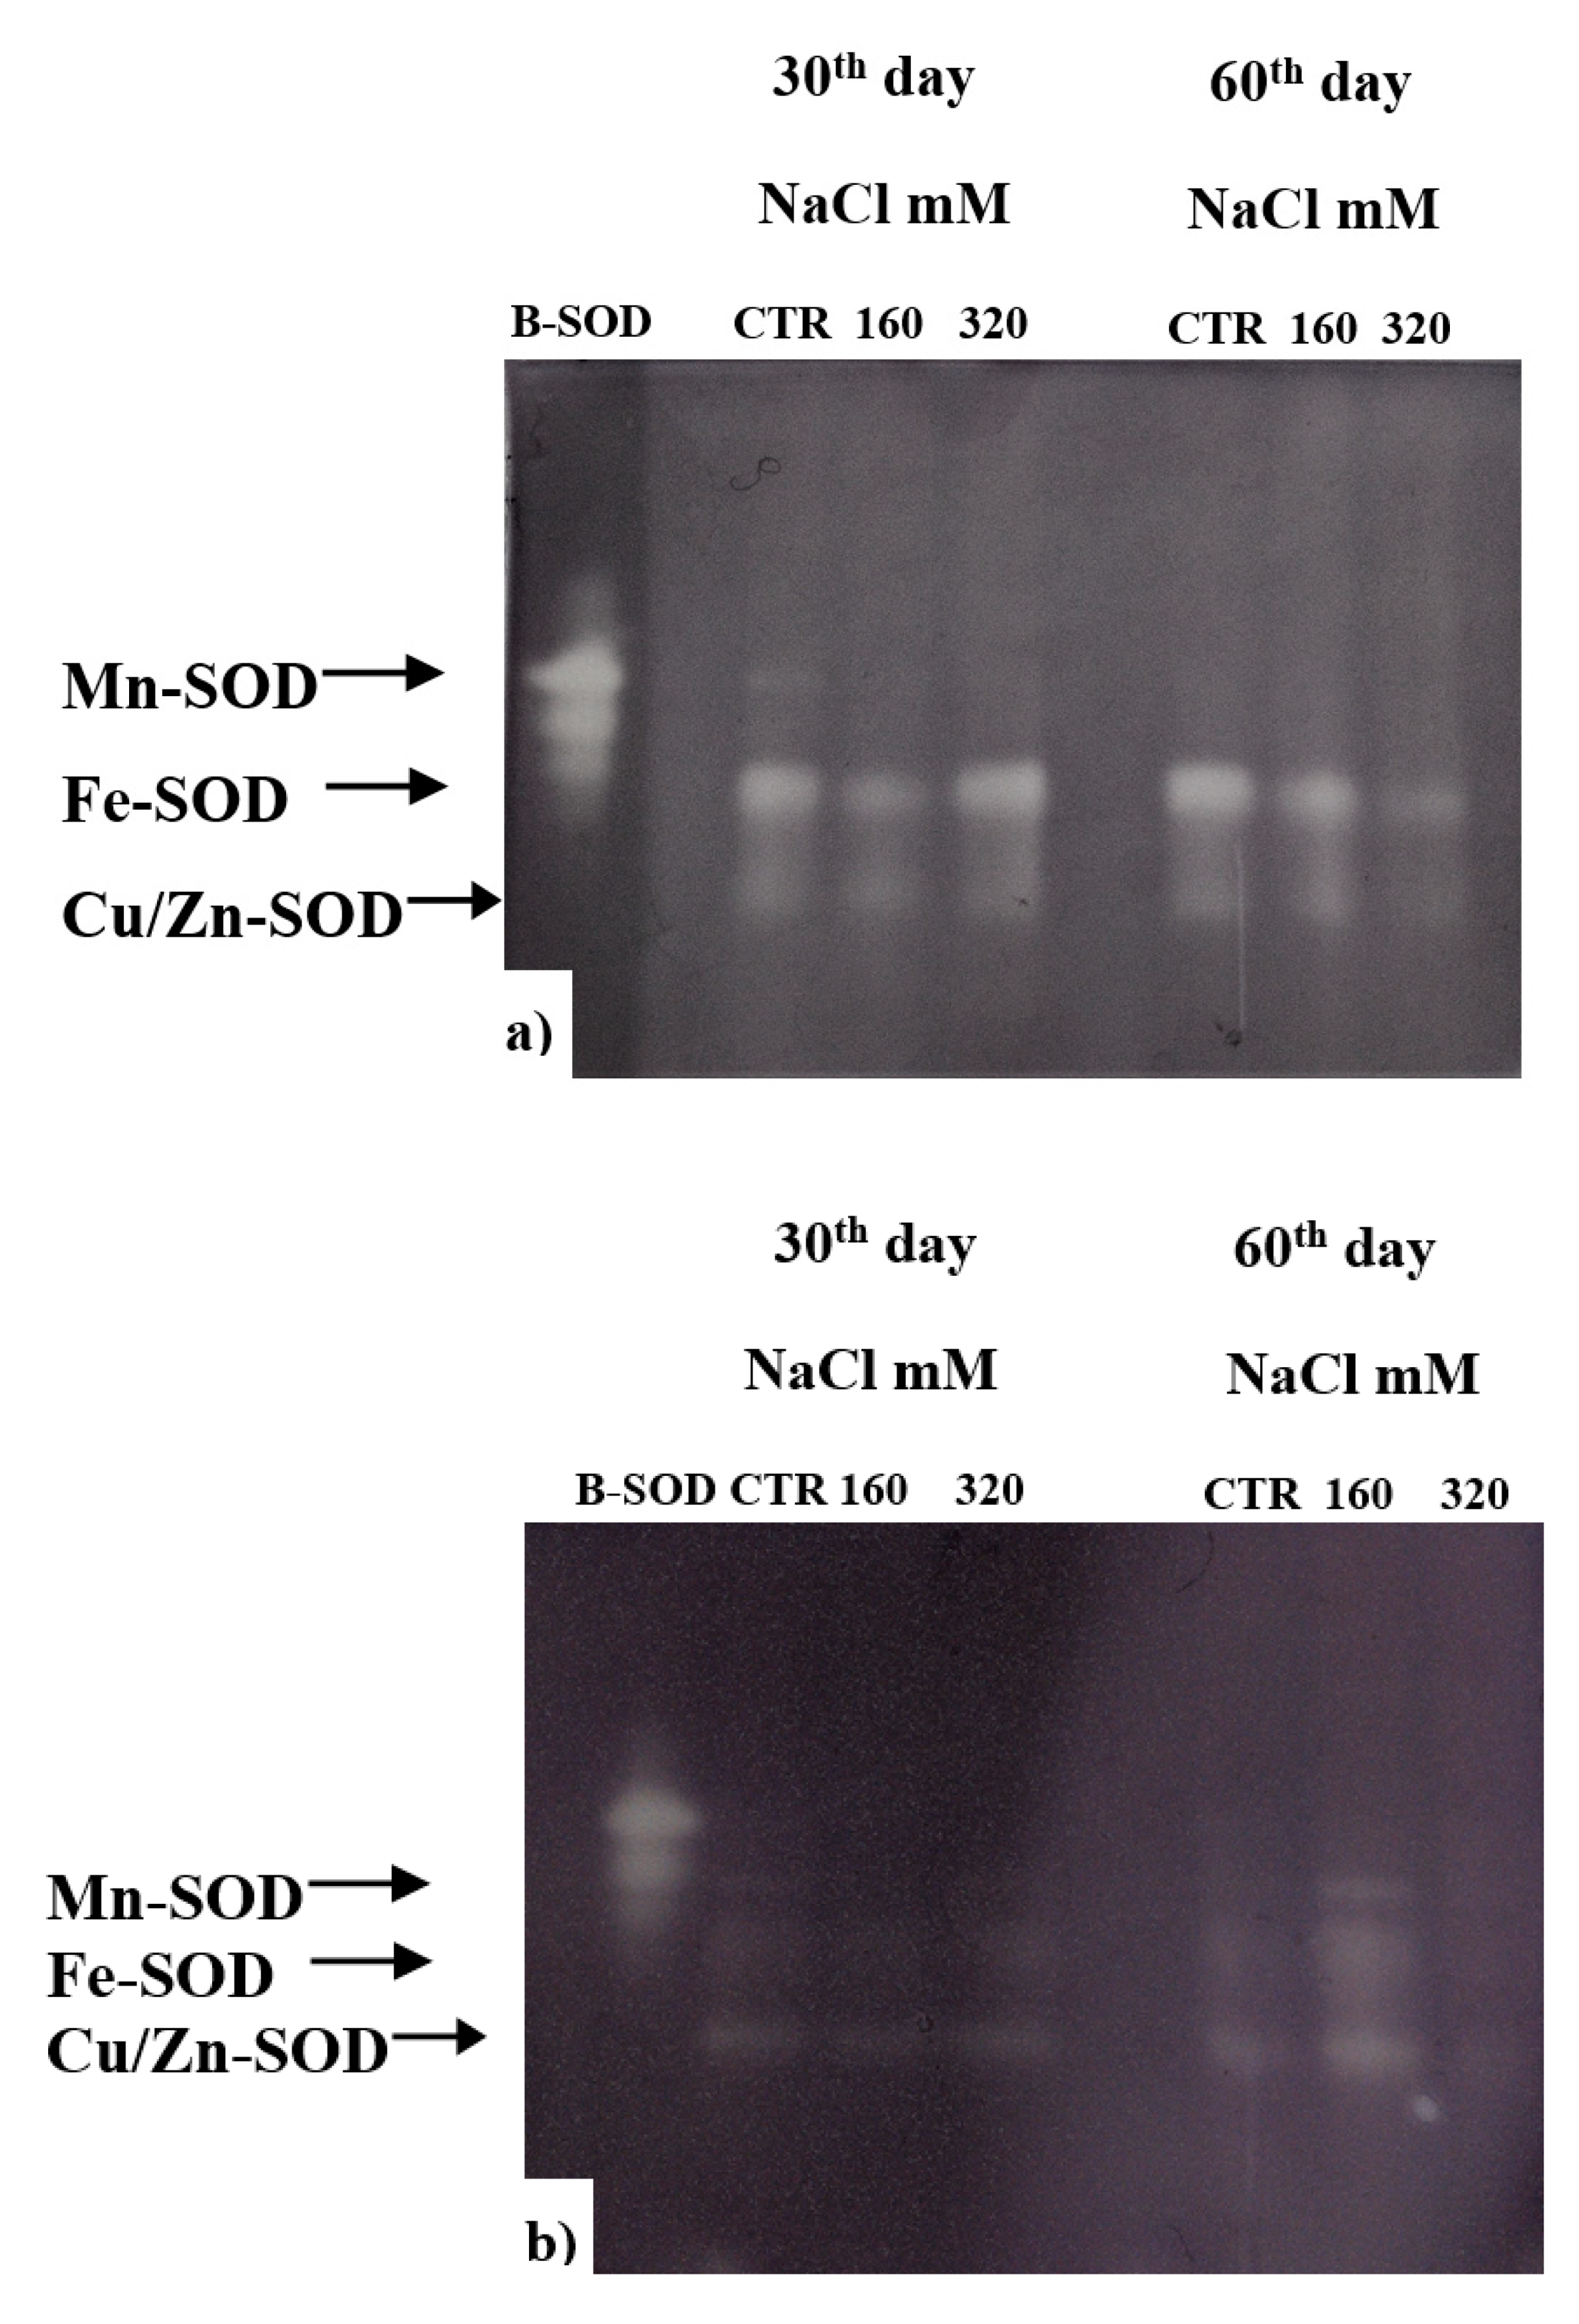
A critical role in the survival of plants under stressful environment has been ascribed to the activity of SOD, which upregulation can counteract the oxidative stress. In our experiment, after 60 days of treatment, SOD of both cultivars resulted to be less active in the plants treated with 320 mM NaCl compared to control and to 160 mM NaCl; while at 30 days the activity in SY Saveo was lower than that observed in Dynastie for both treated and control plants (Figure 10). These data suggest a different behaviour of SOD in the two genotypes.
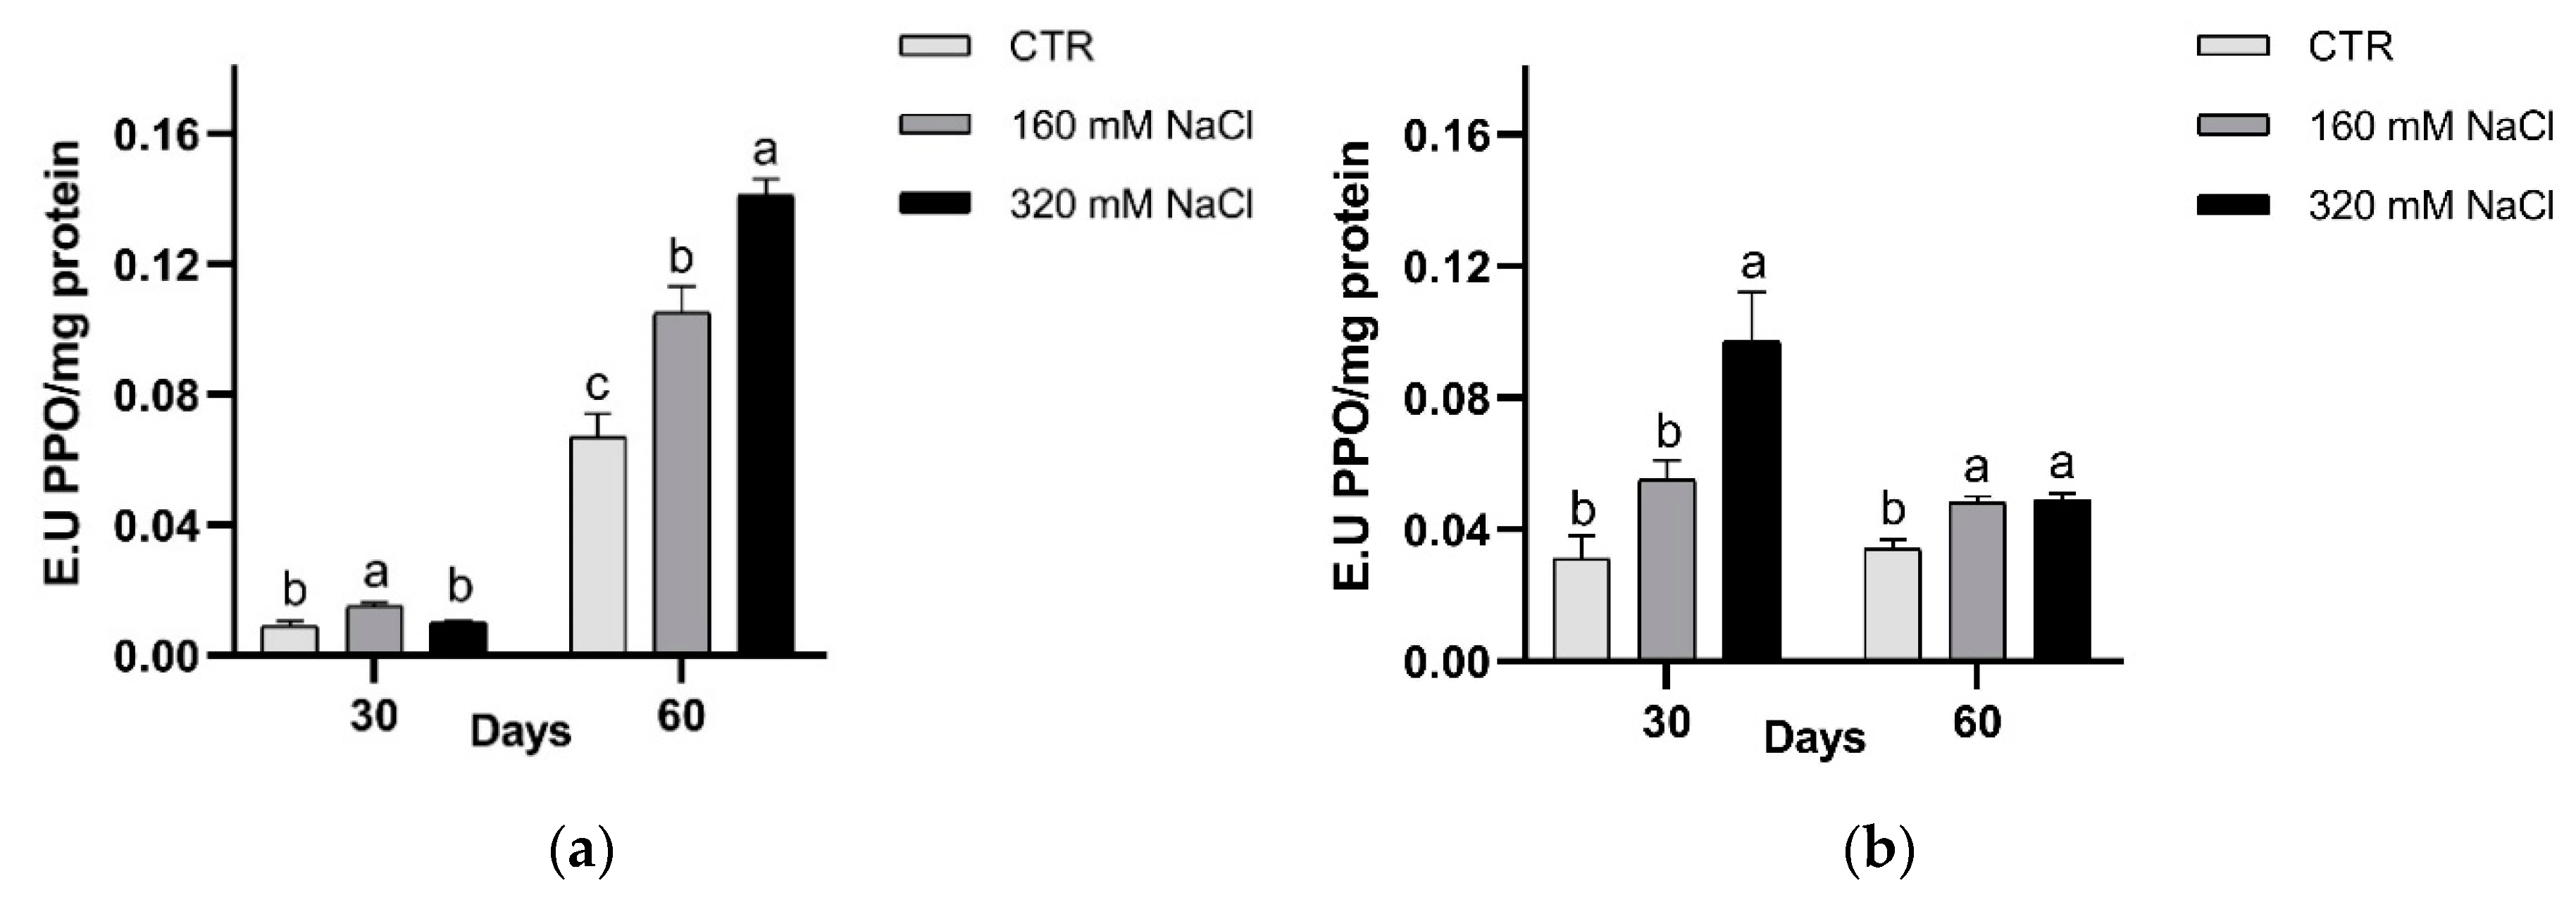
In both cultivars, PPO activity was significantly higher in treated plants respect to the controls (Figure 11). A different timing in PPO response was detected, i.e., in Dynastie significantly enhanced activity was measured after longer exposure, while an opposite trend was observed in SY Saveo (Figure 11).
3.2.2. Osmotic Balancing
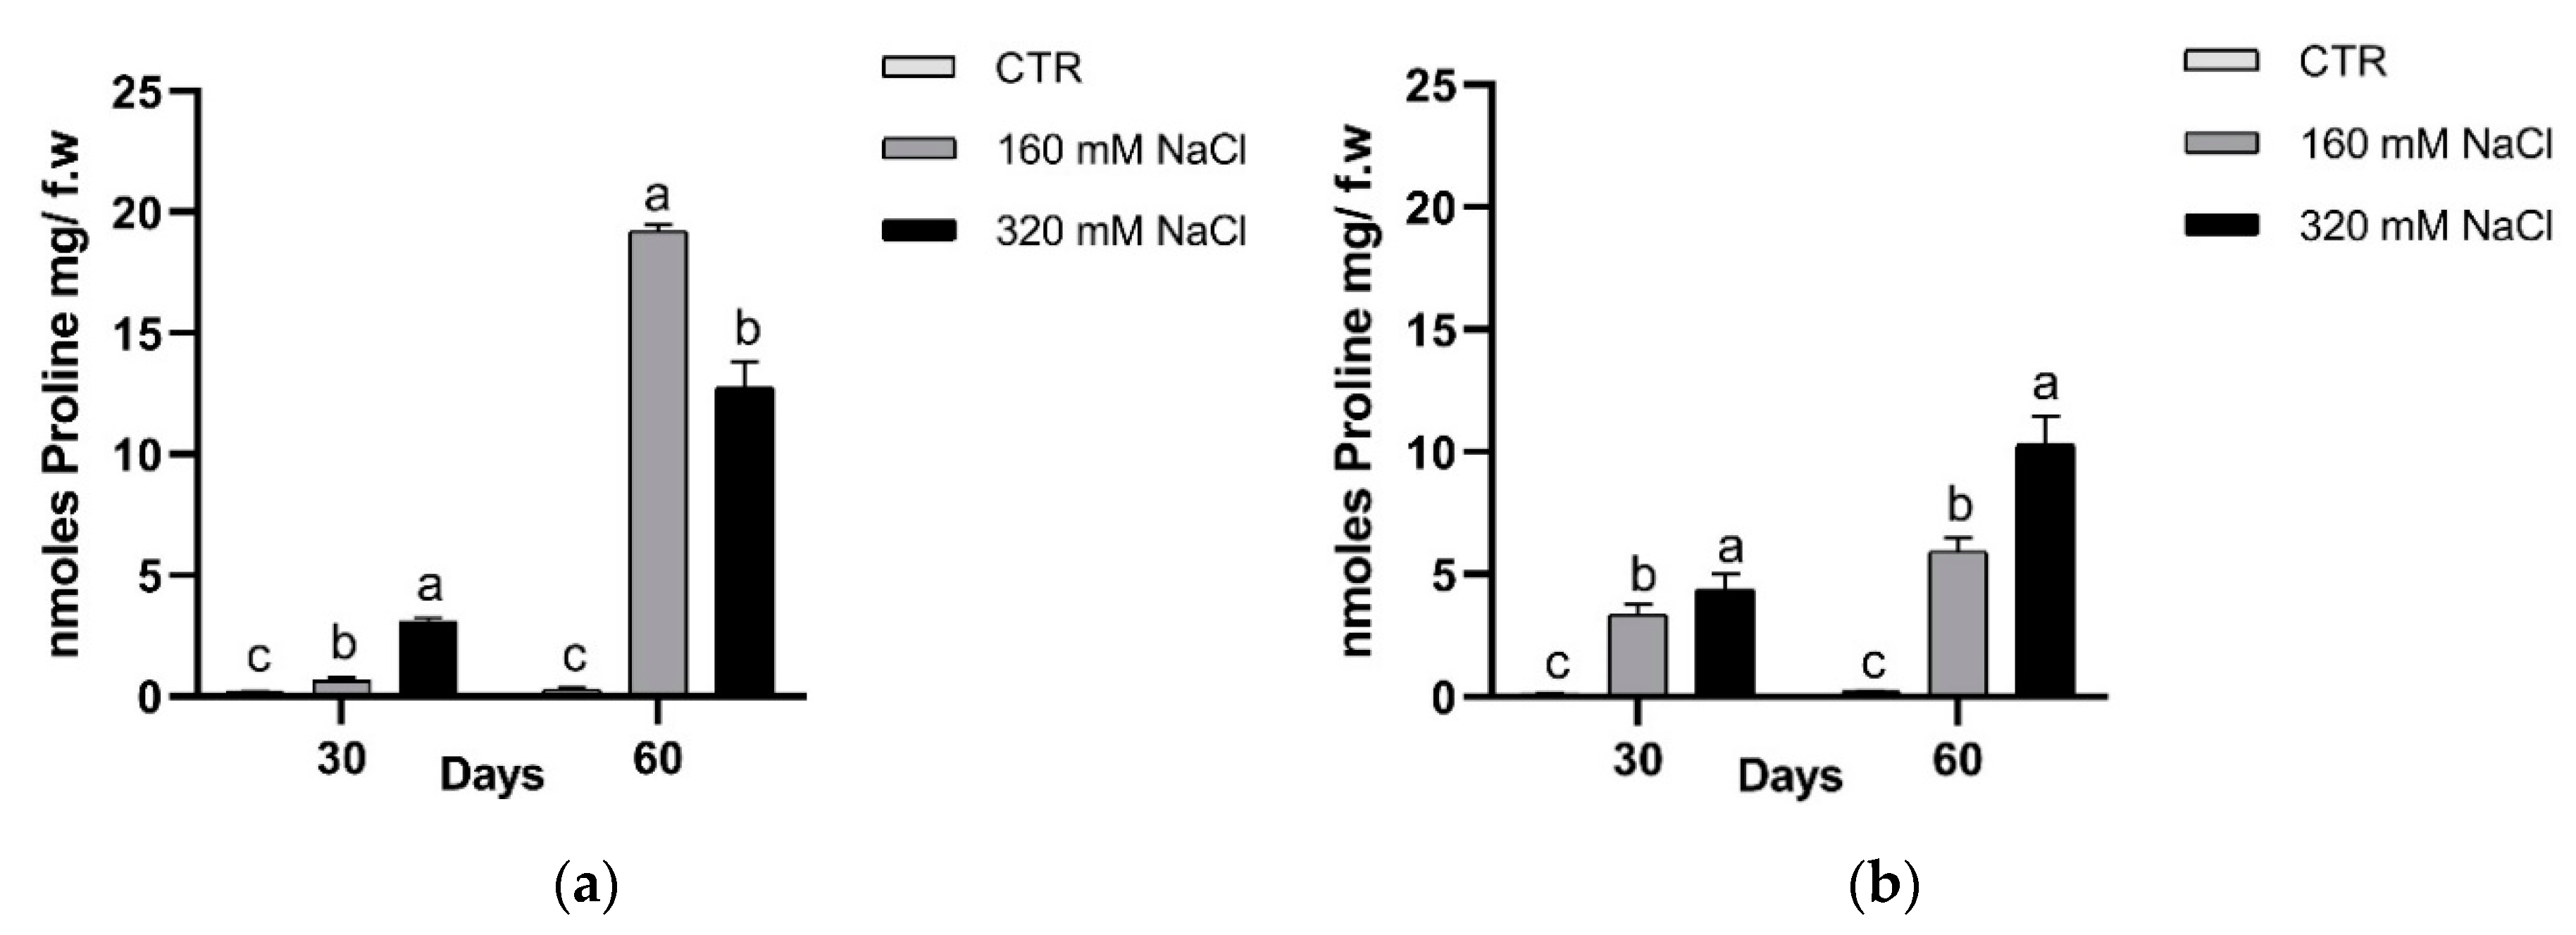
The accumulation of osmolytes, such as proline, glycine-betaine and polyamines, can help the plants to overcome osmotic unbalance. In this study we detected the concentrations of proline and PAs. The proline concentration increased significantly in both treatments and detection times (Figure 12). At the 60th day, Dynastie had the highest amount in the samples treated with 160 mM NaCl.
The presence of SPM, SPD and PUT was detected by HPLC (Table 5 and Table 6). In SY Saveo, the amounts of PA changed within time, being higher at the end of exposure in the treated plants respect to the control (Table 5), especially the level of SPD. In Dynastie, significant changes respect to the control were detected in SPD and SPM content (Table 6).
4. Discussion
The deep changes in climate and soil conditions have led to a global warming with probable devastating effects on crops, such as phenology and/or yield. In the coming decades, the improvement of the crops ability to cope with both biotic and abiotic stresses, caused by the above reported changes, will likely play a fundamental role for adapting agriculture to the new environment.
Changes of soil conditions include the increase of soil salinity, which effects on plants are the results of complex interactions of different physiological processes depending on plant phenological stage.
For what salt stress is concern, the existence of salt-tolerant plants (halophytes) and the presence of different degree of tolerance within genotypes in the sensitive ones (glycophytes) indicate the presence of a genetic basis to salt tolerance [27]. Under this perspective, it is probable that a progressive acclimation to saline soil may be obtained, even in sensitive genotypes, by gradually exposing the plants to salt.
We have selected two cultivars that at seed germination stage were salt sensitive (Sy Saveo) and salt tolerant (Dynastie). To determine the possibility to obtain acclimation to saline conditions, we gradually exposed plants to increasing salt concentration and we detected the response in the sensitive cultivar and compared the data with those of tolerant ones, grown in the same conditions. At the end of the experiments, significant differences in dry/fresh weight ratio of the treated plants compared to the controls were observed in both cultivars. This was related to a lower water content in the plants exposed to NaCl, which was caused by the reduced osmotic potential of the soil, confirming the literature data [28]. Moreover, the detected differences in EC and osmolality (data not shown) between the soils where the plants were grown and the blank suggest that Na+, present in the soil, was taken up and probably compartmentalized at root level to prevent toxic ionic effects, as proposed by Munns and Tester [29]. For what biomass production is concerned, we may say that in Sy Saveo some acclimation could be seen, since the relative reduction in its biomass was lower after 60 days as compared to tolerant cultivar. The quantity of soluble proteins detected was generally higher in the salt treated plants than controls. Several studies reported positive variations in the content of soluble proteins synthesized in response to the increase of NaCl in soil, suggesting a relation with salt stress tolerance [30].
Salinity effects were evident in the leaves that were the most affected organ. Generally, salt stress can cause leaf premature sensing together with reductions in photosynthesis, respiration and protein synthesis in sensitive species [3,29,31,32,33]. While, in comparison with the control, the length of the roots were not significantly affected by salt, even though this organ showed a significant increase of membrane injury index in the treated plants.
In this study, analyses of chlorophyll fluorescence parameters and images were used to investigate the effects of NaCl treatments on plants after the gradual exposure to saline conditions. Fluorescence image analysis has been already used to investigate the effects of salt stress on plants, providing information on the performance of the photosynthetic apparatus [34]. As previously described, our data showed that, with respect to control, Fv/Fm was unaffected by the treatment at both NaCl concentrations in the two cultivars, in agreement to the results reported by other authors [35,36]. Moreover, according to Maxwell and Johnson [19], the Fv/Fm ratio in the range of 0.79 to 0.84 is the approximate optimal value for many plant species, confirming that our cultivars were not affected by NaCl treatments. Lower values of this parameter, in fact, indicate that a proportion of the PSII reaction centres is damaged or inactivated, a phenomenon commonly observed in plants under stress [37]. Finally, some authors [38] suggested that Fv/Fm can be also considered an early indicator of salt stress. In order to study the possible changes in PSII photochemistry, the chlorophyll fluorescence characteristics under the steady-state of photosynthesis were investigated. Results showed that NaCl treatments caused a reduction of the ΦPSII values, with respect to control, in the two cultivars in both salt concentrations, nevertheless highlighting a just more pronounced decrease in cv Dynastie. As previously reported, a quite similar trend was also detectable for the electron transport rate (ETR) data. However, the slight reduction of ΦPSII and ETR values, with respect to control, measured at higher NaCl concentrations in plants of cv SY Saveo and cv Dynastie (less than 10 and 17% respectively), put in evidence the ability of the two cultivars to maintain a good photosynthetic activity even under NaCl treatments. In fact, ΦPSII and ETR are two widely used chlorophyll fluorescence parameters, which are employed to measure photochemistry and the overall photosynthetic capacity of plants [17,19]. Our data confirm, thus, that a relationship exists between the maintenance of photosynthesis (i.e., ΦPSII and ETR) as closer as possible to control rates and the effectiveness of protection or tolerance mechanisms towards different stress factors, as already reported by several authors [39,40,41]. As concerns the NPQ values, they showed, if compared to the control, a reduction in plants of cv Dynastie exposed to 160 mM NaCl, whereas highlighted an increase in plants of SY Saveo exposed to 320 mM NaCl. High values of NPQ in plants exposed to NaCl indicate the presence of a non-radiative energy dissipation mechanism [42], in which a higher proportion of absorbed photons is lost as thermal energy, instead of being used to drive photosynthesis [43]. Such thermal deactivation of the excess energy represents a protective mechanism, which maintains a high oxidative state of the primary electron acceptors of PSII and reduces the probability of photodamage [44]. On the other hand, Stepien and Johnson [45], in a study on Arabidopsis and Thellungiella under salt stress, concluded that increasing salinity resulted in a substantial increase in NPQ in salt-sensitive plant (Arabidopsis), while in salt-tolerant plant (Thellungiella) this parameter remained close to control levels at all salt concentrations. As shown by images of chlorophyll fluorescence, it is noteworthy that parameters measured in dark adapted leaves (Fv/Fm) for both cultivars revealed a homogeneous pattern of distribution of chlorophyll fluorescence, whereas showed an appreciable heterogeneous pattern of light utilization and photosynthetic activity in light adapted leaves (ΦPSII, and NPQ), especially in cultivar Dynastie. Regarding the response of the leaf chlorophyll content in controls in comparison to salt treated plants, this parameter showed higher values in the latter in both cultivars. Leaf chlorophyll content is considered one of the most important factors in determining photosynthetic potential and primary production [46]. In the literature, opposite plant behaviours have been reported [31,32]: i.e., some authors suggest that salinity reduces the chlorophyll content in salt susceptible plants and increases it in tolerant ones [47,48]. In our experiments, the analysis of apparent absorptivity of the leaf surface (Abs) showed a trend similar to chlorophyll content, in fact a strong correlation between the leaf absorbance and the total chlorophyll content has been described in the literature [49]. Therefore, basing on our results, we may hypothesize that in Sy Saveo a gradual exposure to salt enhanced the level of tolerance to saline growth conditions.
To counteract oxidative damage caused by the unbalance between ROS production and quenching, plant cell elicits antioxidant activity, which can depend on an effective non-enzymatic antioxidant defence system as well as on simultaneous antioxidant enzymatic response. In Brassica species the phenolic compounds have shown a higher antioxidant action compared to vitamins and carotenoids; as reported by Cartea et al. [50] the winter B. napus cultivars are rich in phenolic compounds. The biosynthesis of the phenolic compounds depends on both genetic and environmental factors. In Brassica many studies have shown that the intra-interspecific variation of these molecules is genotype dependent. In agreement with the literature, we observed a general increase in the amounts of phenolics, with significant changes in the production in treated plants of Dynastie at the end of the experiments.
SOD and APX constitute first line of enzymatic defence against ROS, thus protecting cells against superoxide radicals. A dual role has been ascribed to H2O2, which depends on the concentration. In fact, a lower amount of H2O2 has a beneficial role in both signalling pathways and cellular responses to stress, including the synthesis of stress related proteins, upregulation of antioxidant molecules and enzymes and in the accumulation of compatible solutes [51]. Vice versa, the effects of higher concentration of H2O2 can be deleterious, because it oxidizes cellular components like lipids, proteins and nucleic acids, cause inhibition of photosynthetic apparatus and can initiate chain reactions triggering cellular apoptosis. Therefore, the overexpression of SOD and APX and other peroxidases, and their coordinated action allows the maintenance of the balance between production and removal of ROS [29,52]. The observed higher APX activity of the treated samples respect to the controls confirmed the involvement of this enzyme in the response to salt stress, thus conferring tolerance to salinity [52]. In fact, several studies demonstrated that plant species with APX deficiency are more susceptible to oxidative damage with respect to those that over-express this enzyme, such as Nicotiana tabacum, where a higher expression of APX confers an increase in salinity tolerance [7].
The upregulation of SODs can counteract the oxidative stress, and plays a critical role in the plant survival under stressful environment [7]. Significant increase in the activities of Cu/Zn-SOD and Mn-SOD isozymes under salt stress was observed by Eyidogan and Oz [53]. In our experiment, we observed a lower SOD activity after a prolonged exposure to NaCl; this may be compensated by the activation of other antioxidant enzymes or by the production of antioxidant molecules, suggesting that in rapeseed SOD has a role in the first phases of the exposure to salt stress rather than during the acclimation phase. For what the latter is concern, a possible role might be ascribed to PPO activity, but in a manner that could be genotype dependent; in fact, in Dynastie a significant enhancement of the activity was measured after longer exposure, while an opposite trend was observed in SY Saveo.
Besides antioxidant response, plants possess mechanisms by which they re-establish osmotic and ionic homeostasis after salt stress imposition, and then a maintain steady state that is fundamental for their growth in the saline environment. To counteract the osmotic stress, plants accumulate osmolytes, such as proline, glycine-betaine and polyamines, allowing an intracellular osmotic balance [4], especially in the halophytes. Many studies on genes controlling the synthesis or metabolism of these compounds have indicated their essential role in tolerance to abiotic stress. However, a compatible solute can lead to potential growth reduction due to the high energy cost of their synthesis [29]. The protective role of osmolytes is species specific and depends on factors, such as growth conditions and phenological status of the plant [4]. An important role in stress response has been attributed to proline, being involved in redox balance, osmoprotection, and stress signalling. In this study, the proline concentration increased significantly in both treatments and detection times. Even though controversy exists about the role of this amino acid in counteracting stress in different species, in rapeseed, proline may be involved in the response and tolerance to salt stress [10].
The increase of proline levels in response to salt stress has been related to PA catabolism [54]; this can be due to the sharing of ornithine as common precursor. Polyamines have been reported to have regulatory functions in plant abiotic stress tolerance [4]. Changes in PA content and catabolism can occur in the interaction between plants and stressful environments. In plants, PUT is required for stress tolerance; SPD is essential for the maintenance of plant growth, while SPM has a crucial role in signal transduction [55]. Moreover, there is an increasing evidence that the stress-induced accumulation of PAs in several plant species can be related to the response to salinity [56]. However, the amount of PAs in plants can change depending on different factors, such as concentration of NaCl, time of exposure, or plant tolerance to salinity [56,57]. In SY Saveo, the amounts of PA changed within time, being higher at the end of exposure in the treated plants respect to the control, especially the level of SPD. In Dynastie, significant changes respect to the control were detected in SPD and SPM content. In rice, a higher level of cellular SPD was reported in salt-resistant cultivars, but not in salt sensitive ones [58]. Osmotic stress induced an increase in the level of PUT with a decrease in the level of SPM in B. napus plants [54]. Moreover, the increasing of spermidine + spermine/putrescine ratio has been reported in different plant species, such as spinach, lettuce, melon, pepper, broccoli, beetroot and tomato, and related to the enhancement of salinity tolerance [57].
5. Conclusions
Our study has shown that in B. napus a gradual exposure to salt can elicit several mechanisms of response to stress that preserve plant vitality and then maintain it, even though the genotype can be salt sensitive at the seed germination stage. Acclimation to saline conditions may represent a metabolic imprint in the struggle against soil salinization, where the adoption of different defense mechanisms can improve plant performance, leading to a more efficient stress response even in the more sensitive genotypes. Further exploitation of acclimation to salt conditions can open new alternative for both basic and applied research.
Supplementary Materials
The following are available online at https://www.mdpi.com/2073-4441/11/8/1667/s1, Figures S1 and S2: plants of Dynastie and SY Saveo after 60 days of treatments; Table S1: statistical analysis of plant height data, Table S2: statistical analysis of leaf area data.
Author Contributions
M.S. performed the experiments and data analyses; C.F. conceived and designed the experiments; F.P. performed photosynthesis experiments and analysed the data; C.C. and S.B. contributed to biochemical data analysis and interpretation; M.S., F.P., S.B., C.F. wrote the original draft of the paper; C.F. reviewed, edited and supervised the manuscript. All authors read and approved the final manuscript.
Funding
This research received no external funding.
Acknowledgments
This research did not receive any specific grant from funding agencies in the public, commercial, or not-for-profit sectors. We thank Montanari (CREA-CIN) for providing seeds and the personnels of Micropropagation Laboratories of the CREA-OFA (Centro di Ricerca per l’Olivicoltura, Frutticoltura, Agrumicoltura, Ciampino, Rome) for allowing the use of some equipment.
Conflicts of Interest
The authors declare no conflicts of interest.
Abbreviations
| APX | ascorbate peroxidase |
| PA | polyamines |
| SOD | superoxide dismutase |
| ROS | reactive oxygen species |
| SPM | spermine |
| SPD | spermidine |
| PUT | putrescine |
References
- Mahajan, S.; Tuteja, N. Cold, salinity and drought stresses: An overview. Arch. Biochem. Biophys. 2005, 444, 139–158. [Google Scholar] [CrossRef]
- Canfora, L.; Salvati, L.; Benedetti, A.; Dazzi, C.; Lo Papa, G. Saline soils in Italy: Distribution, ecological processes and socioeconomic issues. Riv. Econ. Agrar. 2017, 1, 63–77. [Google Scholar]
- Shrivastava, P.; Kumar, R. Soil salinity: A serious environmental issue and plant growth promoting bacteria as one of the tools for its alleviation. Saudi J. Biol. Sci. 2015, 22, 123–131. [Google Scholar] [CrossRef]
- Forni, C.; Duca, D.; Glick, B.R. Mechanisms of plant response to salt and drought stress and their alteration by rhizobacteria. Plant Soil 2017, 410, 335–356. [Google Scholar] [CrossRef]
- Flexas, J.; Diaz-Espejo, A.; Galmés, J.; Kaldenhoff, R.; Medrano, H.; Ribas-Carbo, M. Rapid variations of mesophyll conductance in response to changes in CO2 concentration around leaves. Plant Cell Environ. 2007, 30, 1284–1298. [Google Scholar] [CrossRef]
- Chaves, M.M.; Flexas, J.; Pinheiro, C. Photosynthesis under drought and salt stress: Regulation mechanisms from whole plant to cell. Ann. Bot. 2009, 103, 551–560. [Google Scholar] [CrossRef]
- Gill, S.S.; Tuteja, N. Reactive oxygen species and antioxidant machinery in abiotic stress tolerance in crop plants. Plant Physiol. Biochem. 2010, 48, 909–930. [Google Scholar] [CrossRef]
- Bartels, D.; Sunkar, R. Drought and salt tolerance in plants. Crit. Rev. Plant Sci. 2005, 24, 23–28. [Google Scholar] [CrossRef]
- Wanasundara, J.P.D. Proteins of Brassicaceae oilseeds and their potential as a plant protein source. Crit. Rev. Food Sci. Nutr. 2011, 51, 635–677. [Google Scholar] [CrossRef]
- Shokri-Gharelo, R.; Noparvar, P.M. Molecular response of canola to salt stress: Insights on tolerance mechanisms. Peer J. 2018, 6, e4822. [Google Scholar] [CrossRef]
- Ashraf, M.; Harris, P.J.C. Potential biochemical indicators of salinity tolerance in plants. Plant Sci. 2004, 166, 3–16. [Google Scholar] [CrossRef]
- Hoagland, D.R.; Arnon, D.I. The water-culture method for growing plants without soil. Calif. Agric. Exp. Stn. Circ. 1950, 347, 1–32. [Google Scholar]
- Zeng, F.; Shabala, L.; Zhou, M.; Zhang, G.; Shabala, S. Barley responses to combined waterlogging and salinity stress: Separating effects of oxygen deprivation and elemental toxicity. Front. Plant Sci. 2013, 4, 313. [Google Scholar] [CrossRef]
- Blum, A.; Ebercon, A. Cell membrane stability as a measure of drought and heat tolerance in wheat. Crop Sci. 1981, 21, 43–47. [Google Scholar] [CrossRef]
- Merchant, A.; Tausz, M.; Arndt, S.K.; Adams, M.A. Cyclitols and carbohydrates in leaves and roots of 13 Eucalyptus species suggest contrasting physiological responses to water deficit. Plant Cell Environ. 2006, 29, 2017–2029. [Google Scholar] [CrossRef]
- Sairam, R.K.; Deshmukh, P.S.; Shukla, D.S. Tolerance of drought and temperature stress in relation to increased antioxidant enzyme activity in wheat. J. Agron. Crop Sci. 1997, 178, 171–178. [Google Scholar] [CrossRef]
- Genty, B.; Briantais, J.M.; Baker, N.R. The relationship between the quantum yield of photosynthetic electron transport and quenching of chlorophyll fluorescence. Biochim. Biophys. Acta 1989, 990, 87–92. [Google Scholar] [CrossRef]
- Bilger, W.; Björkman, O. Temperature dependence of violaxanthin de-epoxidation and non-photochemical fluorescence quenching in intact leaves of Gossypium hirsutum L. and Malva parviflora L. Planta 1991, 184, 226–234. [Google Scholar] [CrossRef]
- Maxwell, K.; Johnson, G.N. Chlorophyll fluorescence-a practical guide. J. Exp. Bot. 2000, 51, 659–668. [Google Scholar] [CrossRef]
- Cerovic, Z.G.; Masdoumier, G.; Ghozlen, N.B.; Latouche, G. A new optical leaf-clip meter for simultaneous non-destructive assessment of leaf chlorophyll and epidermal flavonoids. Physiol. Plant 2012, 146, 251–260. [Google Scholar] [CrossRef]
- Orzali, L.; Forni, C.; Riccioni, L. Effect of chitosan seed treatment as elicitor of resistance to Fusarium graminearum in wheat. Seed Sci. Technol. 2014, 42, 132–149. [Google Scholar] [CrossRef]
- Bradford, M.M. A rapid and sensitive method for the quantitation of microgram quantities of protein utilizing the principle of protein-dye binding. Anal. Biochem. 1976, 72, 248–254. [Google Scholar] [CrossRef]
- Beauchamp, C.; Fridovich, I. Superoxide dismutase: Improved assays and an assay applicable to acrylamide gels. Anal. Biochem. 1971, 44, 276–287. [Google Scholar] [CrossRef]
- Mittler, R.; Zilinskas, B.A. Detection of ascorbate peroxidase activity in Native Gels by inhibition of the ascorbate-dependent reduction of nitroblue tetrazolium. Anal. Biochem. 1993, 212, 540–546. [Google Scholar] [CrossRef]
- Beninati, S.; Martinet, N.; Folk, J.E. High-performance liquid chromatographic method for the determination of ε-(γ-glutamyl) lysine and mono- and bis-γ-glutamyl derivatives of putrescine and spermidine. J. Chromatogr. A 1988, 443, 329–335. [Google Scholar] [CrossRef]
- Carillo, P.; Gibon, Y. PROTOCOL: Extraction and Determination of Proline. PrometheusWiki 2011. Available online: http://prometheuswiki.publish.csiro.au/tiki (accessed on 10 January 2018).
- Yamaguchi, T.; Blumwald, E. Developing salt-tolerant crop plants: Challenges and opportunities. Trends Plant Sci. 2005, 10, 615–620. [Google Scholar] [CrossRef]
- Khan, M.H.; Panda, S.K. Alterations in root lipid peroxidation and antioxidative responses in two rice cultivars under NaCl-salinity stress. Acta Physiol. Plant. 2008, 30, 81–89. [Google Scholar] [CrossRef]
- Munns, R.; Tester, M. Mechanisms of salinity tolerance. Ann. Rev. Plant Biol. 2008, 59, 651–681. [Google Scholar] [CrossRef]
- Kapoor, K.; Srivastava, A. Assessment of salinity tolerance of Vinga mungo var. Pu-19 using ex vitro and in vitro methods. Asian J. Biotechnol. 2010, 2, 73–85. [Google Scholar]
- Ashraf, M.Y.; Akhtar, K.; Sarwar, G.; Ashraf, M. Role of rooting system in salt tolerance potential of different guar accessions. Agron. Sustain. Dev. 2005, 25, 243–249. [Google Scholar] [CrossRef]
- Khan, M.A.; Shirazi, M.U.; Khan, M.A.; Mujtaba, S.M.; Islam, E.; Mumtaz, S.; Shereen, A.; Ansari, R.U.; Ashraf, M.Y. Role of proline, K+/Na+ ratio and chlorophyll content in salt tolerance of wheat (Triticum aestivum L.). Pak. J. Bot. 2009, 41, 633–638. [Google Scholar]
- Panda, D.; Dash, P.K.; Dhal, N.K.; Rout, N.C. Chlorophyll fluorescence parameters and chlorophyll content in mangrove species grown in different salinity. Gen. Appl. Plant Physiol. 2006, 32, 175–180. [Google Scholar]
- Guidi, L.; Landi, M.; Penella, C.; Calatayud, A. Application of modulated chlorophyll fluorescence and modulated chlorophyll fluorescence imaging to study the environmental stresses effect. Ann. Bot. 2016, 6, 39–56. [Google Scholar]
- Kalaji, H.M.; Bosa, K.; Kościelniak, J.; Żuk-Gołaszewska, K. Effects of salt stress on photosystem II efficiency and CO2 assimilation of two Syrian barley landraces. Environ. Exp. Bot. 2011, 73, 64–72. [Google Scholar] [CrossRef]
- Singh, D.P.; Sarkar, R.K. Distinction and characterisation of salinity tolerant and sensitive rice cultivars as probed by the chlorophyll fluorescence characteristics and growth parameters. Funct. Plant Biol. 2014, 41, 727–736. [Google Scholar] [CrossRef]
- Baker, N.R.; Rosenqvist, E. Applications of chlorophyll fluorescence can improve crop production strategies: An examination of future possibilities. J. Exp. Bot. 2004, 55, 1607–1621. [Google Scholar] [CrossRef]
- Bongi, G.; Loreto, F. Gas-exchange properties of salt-stressed olive (Olea europea L.) leaves. Plant Physiol. 1989, 90, 1408–1416. [Google Scholar] [CrossRef]
- Pietrini, F.; Zacchini, M.; Iori, V.; Pietrosanti, L.; Bianconi, D.; Massacci, A. Screening of poplar clones for cadmium phytoremediation using photosynthesis, biomass and cadmium content analyses. Int. J. Phytorem. 2010, 12, 105–120. [Google Scholar] [CrossRef]
- Mahlooji, M.; Sharifi, R.S.; Razmjoo, J.; Sabzalian, M.R.; Sedghi, M. Effect of salt stress on photosynthesis and physiological parameters of three contrasting barley genotypes. Photosynthetica 2018, 56, 549–556. [Google Scholar] [CrossRef]
- Acosta-Motos, J.; Ortuño, M.; Bernal-Vicente, A.; Diaz-Vivancos, P.; Sanchez-Blanco, M.; Hernandez, J. Plant responses to salt stress: Adaptive mechanisms. Agronomy 2017, 7, 18. [Google Scholar] [CrossRef]
- Schreiber, U.; Bilger, W.; Neubauer, C. Chlorophyll fluorescence as a nonintrusive indicator for rapid assessment of in vivo photosynthesis. In Ecophysiology of Photosynthesis; Schulze, E.D., Caldwell, M.M., Eds.; Springer: Berlin, Germany, 1994; pp. 49–70. [Google Scholar]
- Shangguan, Z.; Shao, M.; Dyckmans, J. Effects of nitrogen nutrition and water deficit on net photosynthetic rate and chlorophyll fluorescence in winter wheat. J. Plant Physiol. 2000, 156, 46–51. [Google Scholar] [CrossRef]
- Epron, D.; Dreyer, E.; Bréda, N. Photosynthesis of oak trees [Quercus petraea (Matt.) Liebl.] during drought under field conditions: Diurnal courses of net CO2 assimilation and photochemical efficiency of photosystem II. Plant Cell Environ. 1992, 15, 809–820. [Google Scholar] [CrossRef]
- Stepien, P.; Johnson, G.N. Contrasting responses of photosynthesis to salt stress in the glycophyte Arabidopsis and the halophyte Thellungiella: Role of the plastid terminal oxidase as an alternative electron sink. Plant Physiol. 2009, 149, 1154–1165. [Google Scholar] [CrossRef]
- Dai, Y.J.; Shen, Z.G.; Liu, Y.; Wang, L.L.; Hannaway, D.; Lu, H.F. Effects of shade treatments on the photosynthetic capacity, chlorophyll fluorescence, and chlorophyll content of Tetrastigma hemsleyanum Diels et Gilg. Environ. Exp. Bot. 2009, 65, 177–182. [Google Scholar] [CrossRef]
- Jamil, M.; Lee, K.J.; Kim, J.M.; Kim, H.S.; Rha, E.S. Salinity reduced growth PS2 photochemistry and chlorophyll content in radish. Sci. Agric. 2007, 64, 111–118. [Google Scholar] [CrossRef] [Green Version]
- Ayyub, C.; Rashid Shaheen, M.; Raza, S.; Sarwar Yaqoob, M.; Khan Qadri, R.; Azam, M.; Ghani, M.; Khan, I.; Akhtar, N. Evaluation of different radish (Raphanus sativus) genotypes under different saline regimes. Am. J. Plant Sci. 2016, 7, 894–898. [Google Scholar] [CrossRef]
- Lin, Z.F.; Ehleringer, J.R. Effects of leaf age on photosynthesis and water use efficiency of papaya. Photosynthetica 1982, 16, 514–519. [Google Scholar]
- Cartea, M.E.; Francisco, M.; Soengas, P.; Velasco, P. Phenolic compounds in Brassica vegetables. Molecules 2011, 16, 251–280. [Google Scholar] [CrossRef]
- Miller, G.; Suzuki, N.; Ciftci-Yilmaz, S.; Mittler, R. Reactive oxygen species homeostasis and signalling during drought and salinity stresses. Plant Cell Environ. 2010, 33, 453–467. [Google Scholar] [CrossRef]
- Sofo, A.; Scopa, A.; Nuzzaci, M.; Vitti, A. Ascorbate peroxidase and catalase activities and their genetic regulation in plants subjected to drought and salinity stresses. Int. J. Mol. Sci. 2015, 16, 13561–13578. [Google Scholar] [CrossRef]
- Eyidogan, F.; Oz, M.T. Effect of salinity on antioxidant responses of chickpea seedlings. Acta Physiol. Plant. 2005, 29, 485–493. [Google Scholar] [CrossRef]
- Aziz, A.; Martin-Tanguy, J.; Larher, F. Plasticity of polyamine metabolism associated with high osmotic stress in rape leaf discs and with ethylene treatment. Plant Growth Regul. 1997, 21, 153–163. [Google Scholar] [CrossRef]
- Takahashi, T.; Kakehi, J.I. Polyamines: Ubiquitous polycations with unique roles in growth and stress responses. Ann. Bot. 2010, 105, 1–6. [Google Scholar] [CrossRef]
- Janicka-Russak, M.; Kabała, K.; Młodzińska, E.; Kłobus, G. The role of polyamines in the regulation of the plasma membrane and the tonoplast proton pumps under salt stress. J. Plant Physiol. 2010, 167, 261–269. [Google Scholar] [CrossRef]
- Zapata, P.J.; Serrano, M.; Pretel, M.T.; Amoros, A.; Botella, M.A. Polyamines and ethylene changes during germination of different plant species under salinity. Plant Sci. 2004, 167, 781–788. [Google Scholar] [CrossRef]
- Quinet, M.; Ndayiragije, A.; Lefèvre, I.; Lambillotte, B.; Dupont-Gillain, C.C.; Lutts, S. Putrescine differently influences the effect of salt stress on polyamine metabolism and ethylene synthesis in rice cultivars differing in salt resistance. J. Exp. Bot. 2010, 61, 2719–2733. [Google Scholar] [CrossRef]
Figure 1.
Electrical conductivity (EC) of the soils at the end of the experiments. Data are expressed as means ± standard error (SE, n = 3). Post hoc comparisons conducted with the Tukey–Kramer method. Means with different letters are statistically different (p ≤ 0.05) within the same group.
Figure 1.
Electrical conductivity (EC) of the soils at the end of the experiments. Data are expressed as means ± standard error (SE, n = 3). Post hoc comparisons conducted with the Tukey–Kramer method. Means with different letters are statistically different (p ≤ 0.05) within the same group.

Figure 2.
Gravimetric water content (GWC) of the soils at the end of experiments. Data are expressed as means ± SE (n = 3). Post hoc comparisons conducted with the Tukey—Kramer method. Means with different letters are statistically different (p ≤ 0.05) within the same group.
Figure 2.
Gravimetric water content (GWC) of the soils at the end of experiments. Data are expressed as means ± SE (n = 3). Post hoc comparisons conducted with the Tukey—Kramer method. Means with different letters are statistically different (p ≤ 0.05) within the same group.

Figure 3.
Effects of salt on the height of the cultivars. Data are expressed as means ± SE (n ≥ 8). Post hoc comparisons conducted with the Mann–Whitney pairwise comparison test. Means with different letters are statistically different (p ≤ 0.05) within the same cultivar. All values with post hoc comparisons are shown in the Supplementary Materials, Table S1.

Figure 4.
Number of leaves and leaf area in Dynastie (a,b) and SY Saveo (c,d). Post hoc comparisons conducted with the Mann–Whitney pairwise comparison test. Data are expressed as means ± SE (n ≥ 8). Means with different letters are statistically different (p ≤ 0.05) within the same cultivar. All leaf area values with post hoc comparisons are shown in the Supplementary Materials, Table S2.

Figure 5.
Effect of salt on the root growth: Dynastie (a) and SY Saveo (b). Data are expressed as means ± SE (n ≥ 8). Post hoc comparisons conducted with the Tukey–Kramer method. Means with different letters are statistically different (p ≤ 0.05) within the same period and cultivar.
Figure 5.
Effect of salt on the root growth: Dynastie (a) and SY Saveo (b). Data are expressed as means ± SE (n ≥ 8). Post hoc comparisons conducted with the Tukey–Kramer method. Means with different letters are statistically different (p ≤ 0.05) within the same period and cultivar.

Figure 6.
Membrane injury index of leaves and roots of Dynastie (a) and SY Saveo (b), determined at the end of the experiment. Data are expressed as means ± SE (n = 3). Post hoc comparisons conducted with the Tukey–Kramer method. Means with different letters are statistically different (p ≤ 0.05) within the same organ of the cultivar.

Figure 7.
Chlorophyll fluorescence images of photochemistry (Fv/Fm) in a dark-adapted leaf and PSII photochemistry (ΦPSII) and non-photochemical quenching (NPQ) at steady-state with actinic illumination of 55 µmol photons m−2 s−1 measured at the end of the experiment (60th day) in two cultivars of Brassica napus (Saveo and Dynastie) exposed to different NaCl treatments (CTR, 160 mM NaCl, 320 mM NaCl). The false color code depicted at the bottom of the images ranges from 0.00 (black) to 1.00 (pink).

Figure 8.
Amounts of phenolic compounds after 30 and 60 days of treatment: Dynastie (a) and SY Saveo (b). Data are expressed as means ± SE (n = 3). Post hoc comparisons conducted with the Tukey–Kramer method. Means with different letters are statistically different (p ≤ 0.05) within the same period and cultivar.

Figure 9.
Activity of ascorbate peroxidase (APX) enzymes in plant exposed to different NaCl concentration after 60 days of treatment.
Figure 9.
Activity of ascorbate peroxidase (APX) enzymes in plant exposed to different NaCl concentration after 60 days of treatment.

Figure 10.
Activity of SOD enzymes in plant exposed to different NaCl concentration: (a) Dynastie, (b) SY Saveo.
Figure 10.
Activity of SOD enzymes in plant exposed to different NaCl concentration: (a) Dynastie, (b) SY Saveo.

Figure 11.
PPO activity after 30 and 60 days of treatment: Dynastie (a) and SY Saveo (b). Data are expressed as means ± SE (n = 3). Post hoc comparisons conducted with the Tukey–Kramer method. Means with different letters are statistically different (p ≤ 0.05) within the same period and cultivar.
Figure 11.
PPO activity after 30 and 60 days of treatment: Dynastie (a) and SY Saveo (b). Data are expressed as means ± SE (n = 3). Post hoc comparisons conducted with the Tukey–Kramer method. Means with different letters are statistically different (p ≤ 0.05) within the same period and cultivar.

Figure 12.
Proline concentration after 30 and 60 days of treatment: Dynastie (a) and SY Saveo (b). Data are expressed as means ± SE (n = 3). Post hoc comparisons conducted with the Tukey–Kramer method. Means with different letters are statistically different (p ≤ 0.05) within the same period.
Figure 12.
Proline concentration after 30 and 60 days of treatment: Dynastie (a) and SY Saveo (b). Data are expressed as means ± SE (n = 3). Post hoc comparisons conducted with the Tukey–Kramer method. Means with different letters are statistically different (p ≤ 0.05) within the same period.


Table 1.
Biomass production at 30 and 60 days of experiment. Data are expressed as means ± SE (n = 3). Post hoc comparisons conducted with the Tukey–Kramer method. Means with different letters are statistically different (p ≤ 0.05) within the same period and cultivar. Photographs of the plants at the end of the experiments are shown in Supplementary Materials, Figures S1 and S2.
| Plant Biomass | ||||
|---|---|---|---|---|
| Dynastie | SY Saveo | |||
| NaCl | 30 d | 60 d | 30 d | 60 d |
| CTR | 1.02 ± 0.03 a | 4.31 ± 0.03 a | 1.00 ± 0.05 a | 3.27 ± 0.22 a |
| 160 mM | 0.94 ± 0.04 a | 1.94 ± 0.08 b | 0.76 ± 0.03 b | 1.86 ± 0.07 b |
| 320 mM | 0.74 ± 0.04 b | 1.05 ± 0.02 c | 0.66 ± 0.02 c | 0.96 ± 0.05 c |
Table 2.
Dry weight/fresh ratio and protein content. Data are expressed as means ± SE (n = 3). Post hoc comparisons conducted with the Tukey–Kramer method. Means with different letters are statistically different (p ≤ 0.05) within the same cultivar.
Table 2.
Dry weight/fresh ratio and protein content. Data are expressed as means ± SE (n = 3). Post hoc comparisons conducted with the Tukey–Kramer method. Means with different letters are statistically different (p ≤ 0.05) within the same cultivar.
| Dry Weight/Fresh Weight | Soluble Proteins (µg Protein/mg f.w.) | |||||
|---|---|---|---|---|---|---|
| Dynastie | SY Saveo | Dynastie | SY Saveo | |||
| NaCl | 60 d | 60 d | 30 d | 60 d | 30 d | 60 d |
| CTR | 0.018 ± 0.0005 c | 0.069 ± 0.001 b | 4.62 ± 0.06 b | 7.30 ± 0.12 a | 3.21 ± 0.14 c | 4.32 ± 0.14 b |
| 160 mM | 0.053 ± 0.003 b | 0.077 ± 0.008 ab | 4.62 ± 0.06 b | 5.50 ± 0.09 b | 4.40 ± 0.07 a | 4.69 ± 0.07 b |
| 320 mM | 0.083 ± 0.0005 a | 0.086 ± 0.005 a | 7.66 ± 0.08 a | 7.82 ± 0.16 a | 3.75 ± 0.07 b | 8.98 ± 0.15 a |
Table 3.
Water content (%) of the plants after 60 days of treatment. Data are expressed as means ± SE (n = 3). Post hoc comparisons conducted with the Tukey–Kramer method. Means with different letters are statistically different (p ≤ 0.05) within the same cultivar.
Table 3.
Water content (%) of the plants after 60 days of treatment. Data are expressed as means ± SE (n = 3). Post hoc comparisons conducted with the Tukey–Kramer method. Means with different letters are statistically different (p ≤ 0.05) within the same cultivar.
| Plants Water Content (%) | ||
|---|---|---|
| NaCl | Dynastie | SY Saveo |
| CTR | 92.37 ± 0.12 a | 93.10 ± 0.12 a |
| 160 mM | 91.67 ± 0.50 a | 91.39 ± 0.17 b |
| 320 mM | 89.38 ± 0.07 b | 90.82 ± 0.10 c |
Table 4.
Effects of NaCl on total chlorophyll content and chlorophyll fluorescence parameters, maximal quantum efficiency (Fv/Fm) measured in dark adapted leaves and quantum efficiency of PSII photochemistry (Φ PSII), non-photochemical quenching (NPQ), electron transport rate (ETR) and PAR-absorptivity (Abs) measured at steady state with actinic light illumination of 55 μmol photons m−2 s−1 at the end of the experiment (60th day) in two cultivars of B. napus (SY Saveo and Dynastie) exposed to different NaCl treatments (CTR, 160 mM NaCl, 320 mM NaCl). Data are expressed as means ± SE. Means with different letters are statistically different (LSD test, p ≤ 0.05). ns = not significant. * p < 0.05. ** p < 0.01. *** p < 0.001.
| Cvs. | NaCl | Fv/Fm (r.u.) | ΦPSII (r.u.) | NPQ (r.u.) | ETR (μmol Electrons m−2s−1) | Abs (rel. un.) | Tot Chl Content (µg cm−2) |
|---|---|---|---|---|---|---|---|
| SY Saveo | CTR | 0.810 ± 0.001 a | 0.371 ± 0.013 ab | 0.257 ± 0.005 b | 8.10 ± 0.28 ab | 0.804 ±0.003 d | 27.64 ± 0.63 a |
| 160 mM | 0.814 ± 0.001 a | 0.349 ± 0.009 bc | 0.278 ± 0.010 b | 7.98 ± 0.21 ab | 0.846 ± 0.002 c | 37.22 ± 0.06 b | |
| 320 mM | 0.812 ± 0.001 a | 0.334 ± 0.002 cd | 0.333 ± 0.010 a | 7.74 ± 0.05 bc | 0.859 ± 0.002 ab | 41.26 ± 0.75 c | |
| Dynastie | CTR | 0.805 ± 0.001 b | 0.385 ± 0.002 a | 0.241 ± 0.010 b | 8.35 ± 0.04 a | 0.806 ± 0.004 d | 28.15 ± 0.90 a |
| 160 mM | 0.804 ± 0.003 b | 0.316 ± 0.002 d | 0.198 ± 0.019 c | 7.33 ± 0.06 c | 0.848 ± 0.005 bc | 37.93 ± 1.66 b | |
| 320 mM | 0.805 ± 0.001 b | 0.320 ± 0.005 d | 0.277 ± 0.017 b | 7.43 ± 0.12 c | 0.860 ± 0.001 a | 41.38 ± 0.30 c | |
| p-Value (ANOVA) | Cv. | *** | ns | *** | ns | ns | ns |
| Treat. | ns | *** | *** | ** | *** | *** | |
| Cv.x Treat. | ns | * | ns | * | ns | ns |
Table 5.
Polyamines in SY Saveo. Data are expressed as means ± SE. Post hoc comparisons conducted with the Tukey–Kramer method. Means with different letters are statistically different (p ≤ 0.05) within the same period and PA.
Table 5.
Polyamines in SY Saveo. Data are expressed as means ± SE. Post hoc comparisons conducted with the Tukey–Kramer method. Means with different letters are statistically different (p ≤ 0.05) within the same period and PA.
| Polyamines (nmol/mg f.w.) | ||||||
|---|---|---|---|---|---|---|
| 30 days | 60 days | |||||
| NaCl | SPM | SPD | PUT | SPM | SPD | PUT |
| CTR | 18.37± 1.92 b | 100.71 ± 4.34 a | 19.74 ± 1.31 | 27.29 ± 7.60 a | 62.01 ± 4.61 b | 14.08 ± 2.30 b |
| 160 mM | 29.20 ± 1.53 a | 67.04 ± 1.83 b | N.D.* | 24.83 ± 1.93 a | 65.25 ± 3.69 b | 39.66 ± 3.92 a |
| 320 mM | 22.76 ± 2.65 b | 68.33 ± 2.31 b | N.D.* | 30.76 ± 3.54 a | 166.78 ± 12.18 a | 35.78 ± 3.11 a |
* N.D. = Not detected.
Table 6.
Polyamines in Dynastie. Data are expressed as means ± SE. Post hoc comparisons conducted with the Tukey–Kramer method. Means with different letters are statistically different (p ≤ 0.05) within the same period and PA.
Table 6.
Polyamines in Dynastie. Data are expressed as means ± SE. Post hoc comparisons conducted with the Tukey–Kramer method. Means with different letters are statistically different (p ≤ 0.05) within the same period and PA.
| Polyamines (nmol/mg f.w.) | ||||||
|---|---|---|---|---|---|---|
| 30 days | 60 days | |||||
| NaCl | SPM | SPD | PUT | SPM | SPD | PUT |
| CTR | 32.70 ± 1.98 b | 97.83 ± 4.78 b | 18.17 ± 1.54 a | 13.89 ± 0.31 b | 46.65 ± 0.34 c | 12.58 ± 2.27 a |
| 160 mM | 44.70 ± 2.67 a | 92.32 ± 4.76 b | 12.63 ± 1.08 b | 44.31 ± 7.29 a | 99.83 ± 4.90 b | 23.87 ± 4.65 a |
| 320 mM | 37.57 ± 2.71 ab | 150.81 ± 9.97 a | 22.76 ± 2.65 a | 40.55 ± 7.81 a | 151.08 ± 11.10 a | 19.73 ± 5.62 a |
© 2019 by the authors. Licensee MDPI, Basel, Switzerland. This article is an open access article distributed under the terms and conditions of the Creative Commons Attribution (CC BY) license (http://creativecommons.org/licenses/by/4.0/).
Share and Cite
MDPI and ACS Style
Santangeli, M.; Capo, C.; Beninati, S.; Pietrini, F.; Forni, C. Gradual Exposure to Salinity Improves Tolerance to Salt Stress in Rapeseed (Brassica napus L.). Water 2019, 11, 1667. https://doi.org/10.3390/w11081667
AMA Style
Santangeli M, Capo C, Beninati S, Pietrini F, Forni C. Gradual Exposure to Salinity Improves Tolerance to Salt Stress in Rapeseed (Brassica napus L.). Water. 2019; 11(8):1667. https://doi.org/10.3390/w11081667
Chicago/Turabian StyleSantangeli, Michael, Concetta Capo, Simone Beninati, Fabrizio Pietrini, and Cinzia Forni. 2019. "Gradual Exposure to Salinity Improves Tolerance to Salt Stress in Rapeseed (Brassica napus L.)" Water 11, no. 8: 1667. https://doi.org/10.3390/w11081667
Note that from the first issue of 2016, this journal uses article numbers instead of page numbers. See further details here.