Picoplankton Distribution and Activity in the Deep Waters of the Southern Adriatic Sea

 , , , , , and
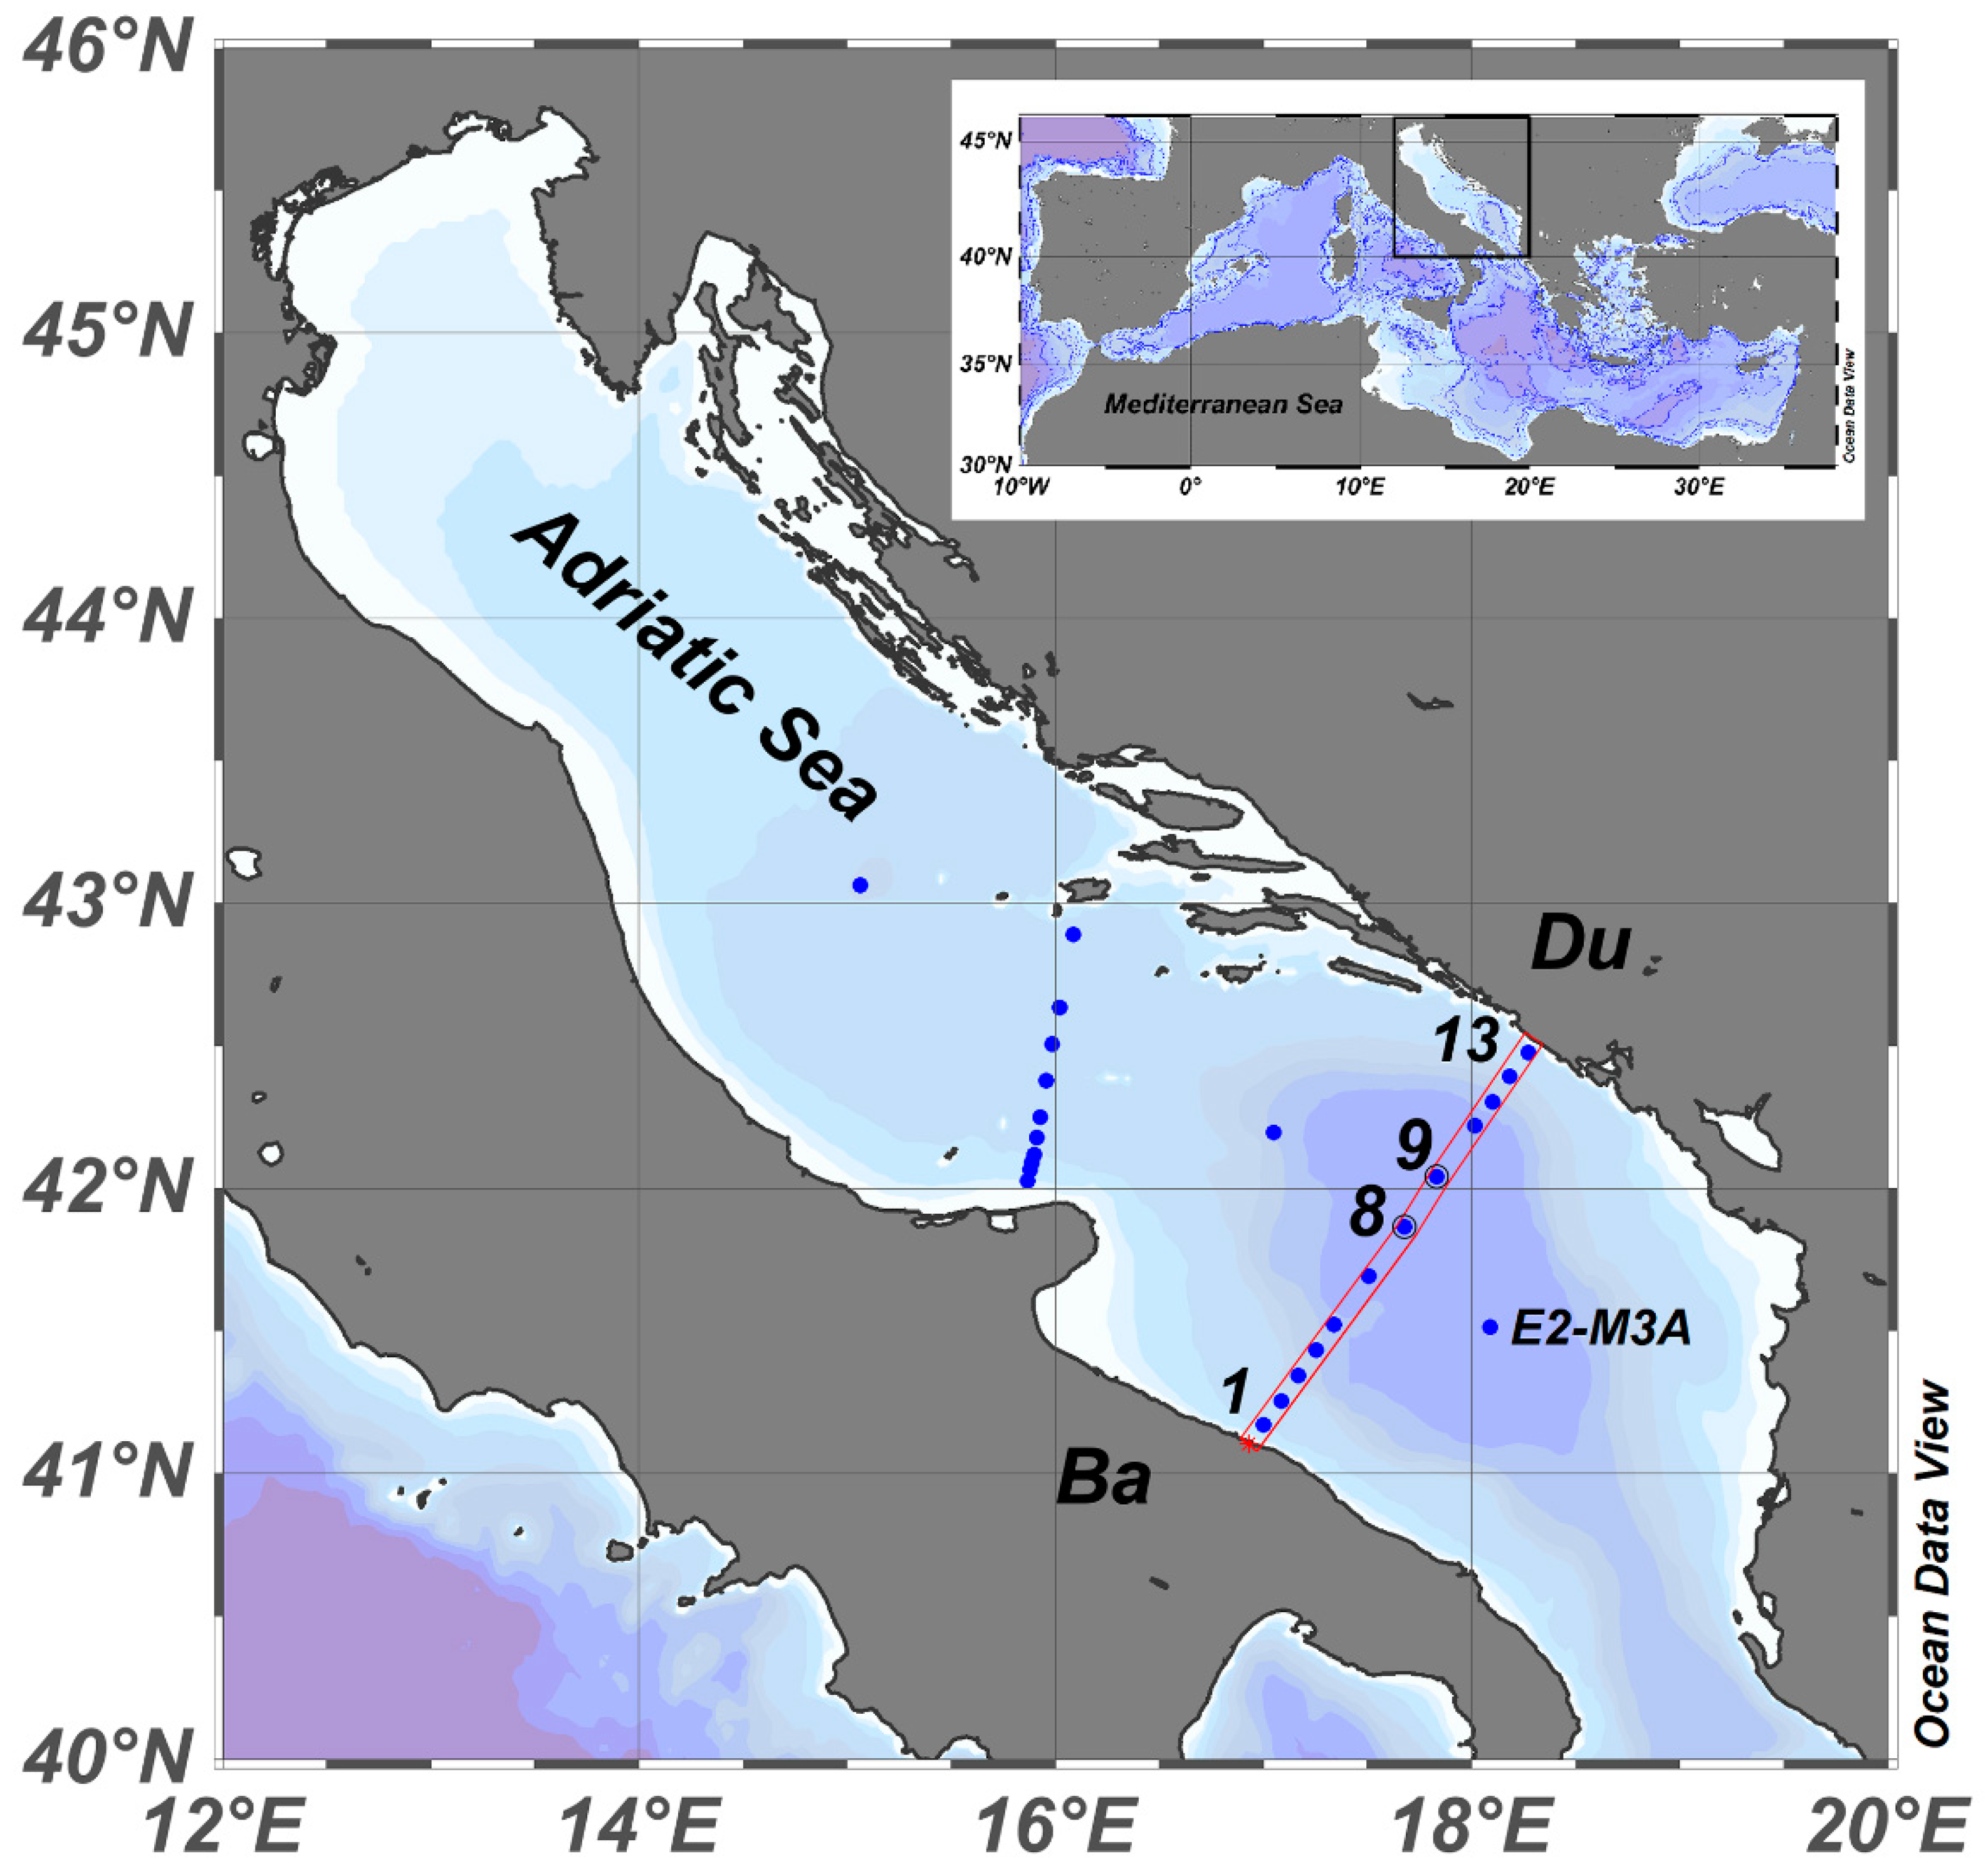
Abstract
:1. Introduction
2. Material and Methods
2.1. Physical and Biochemical Sampling
2.2. Picoplankton Analysis
2.3. Statistical Analysis
3. Results
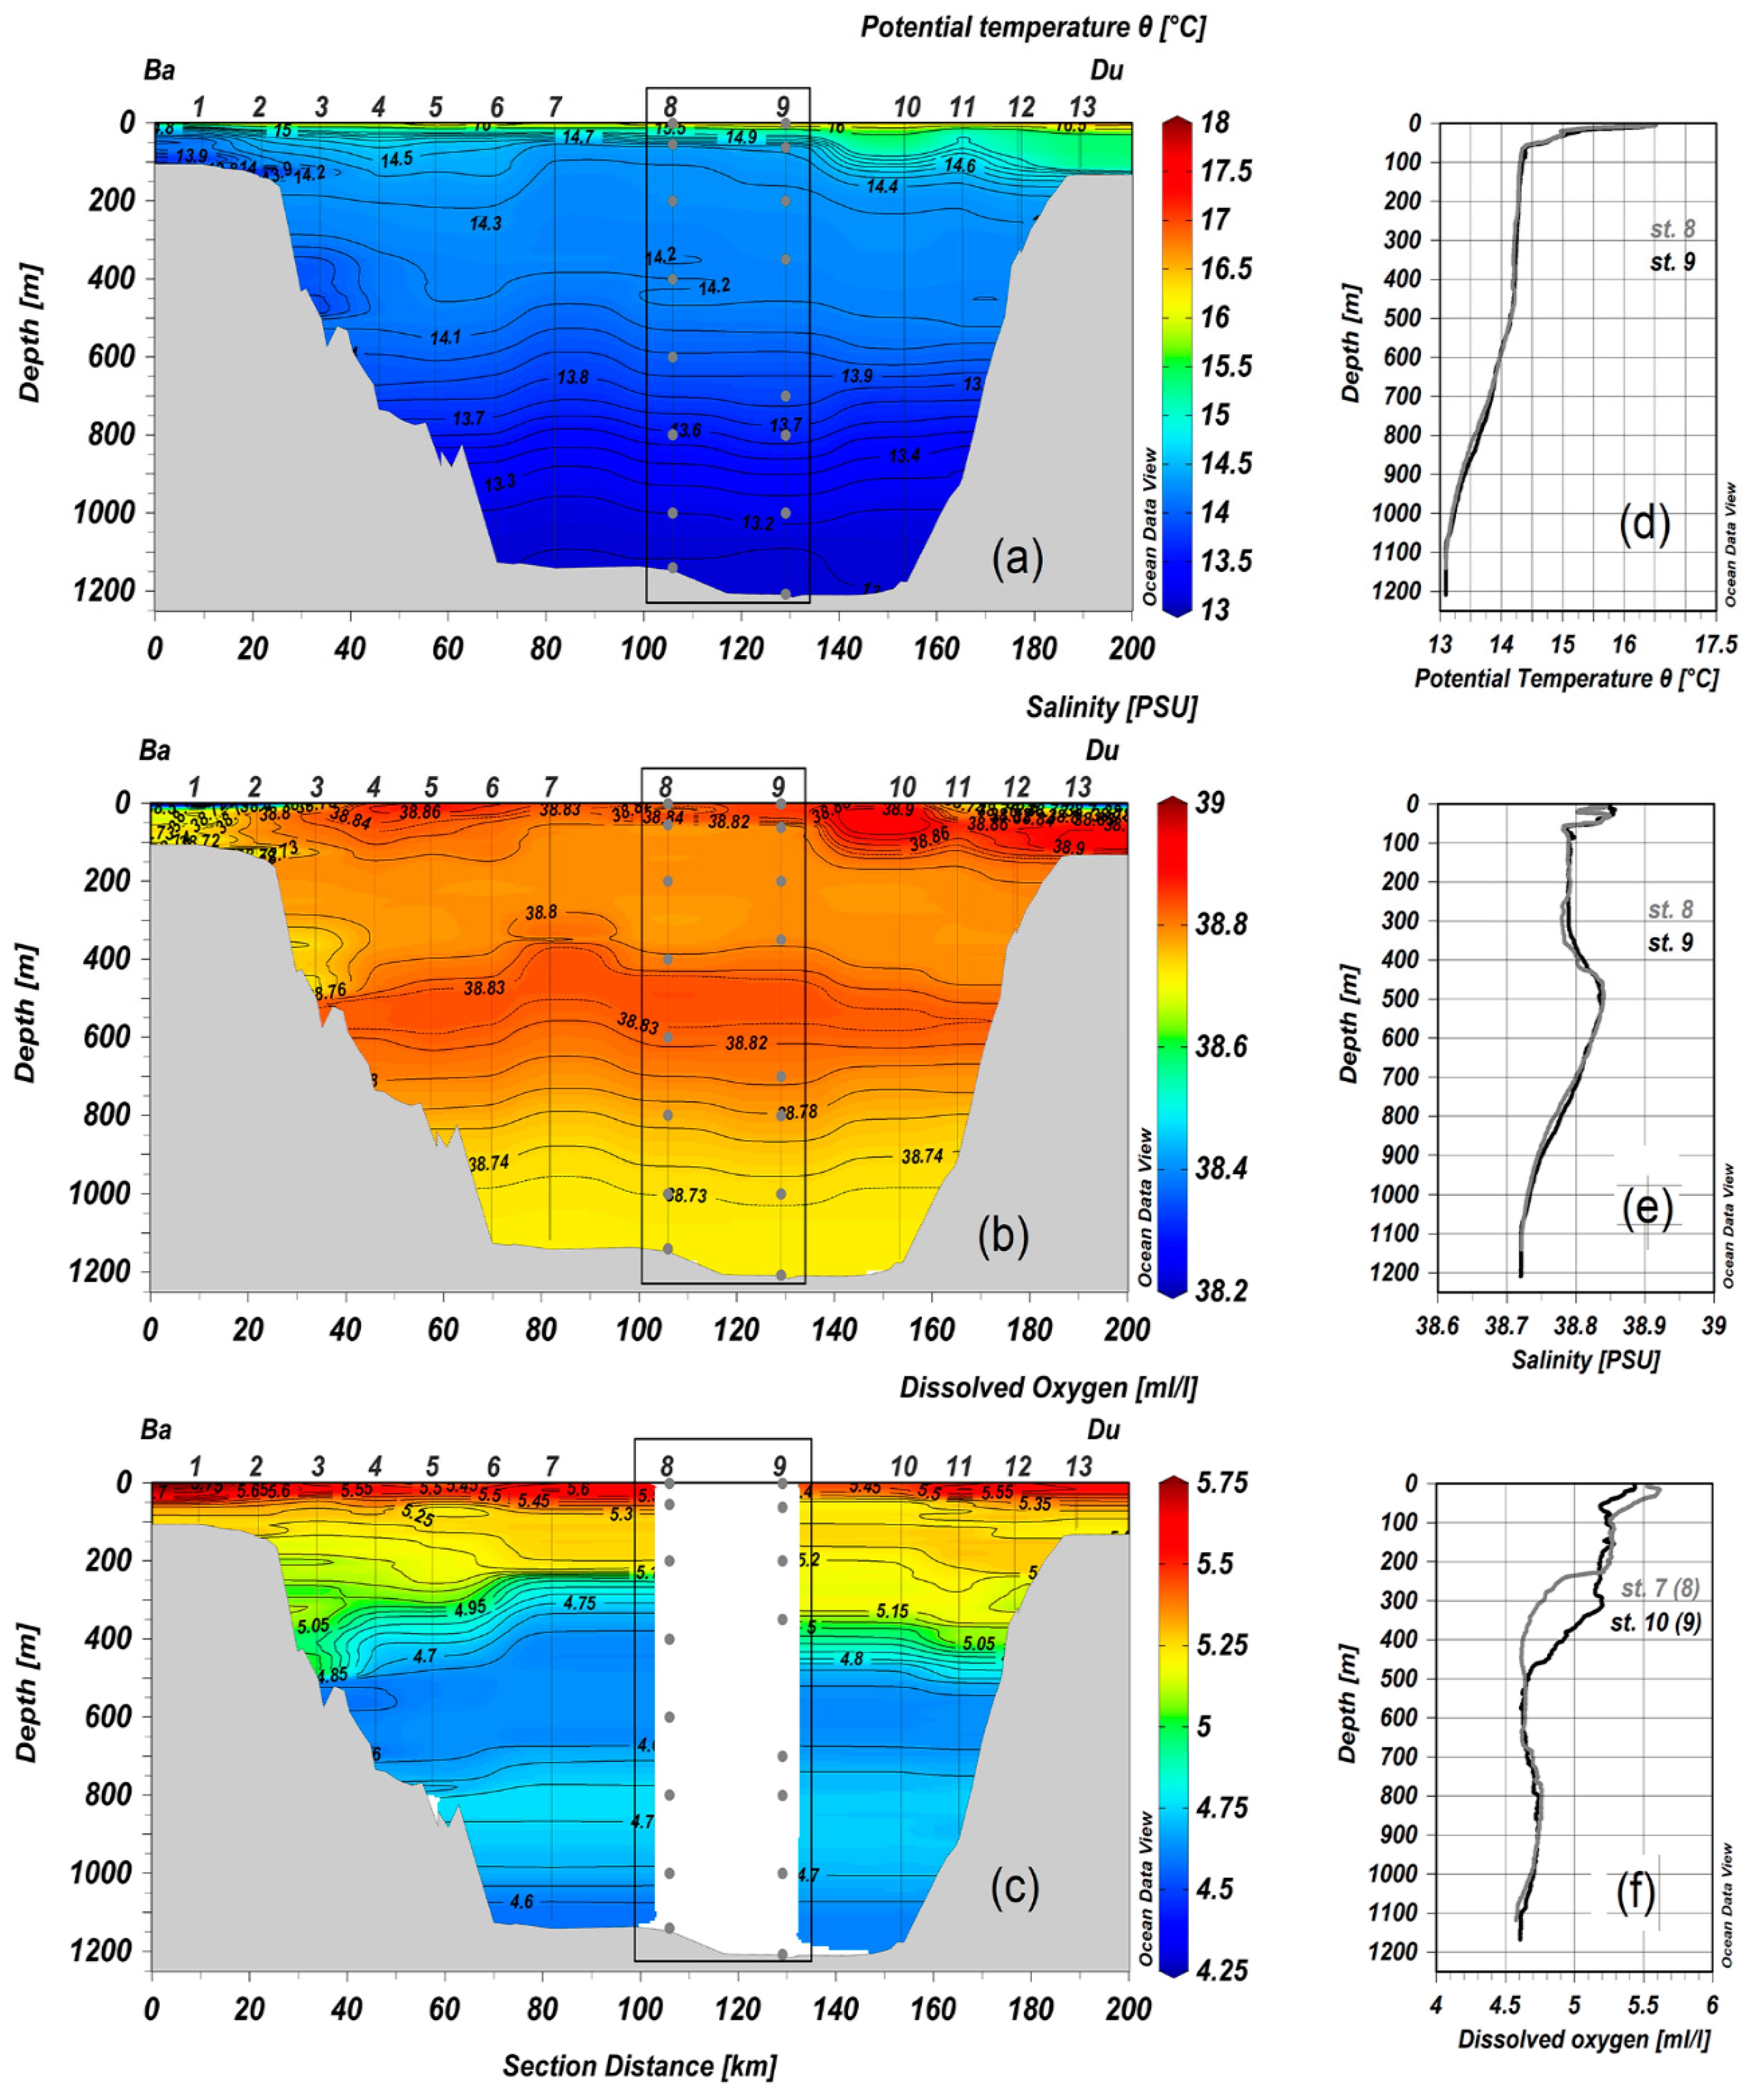
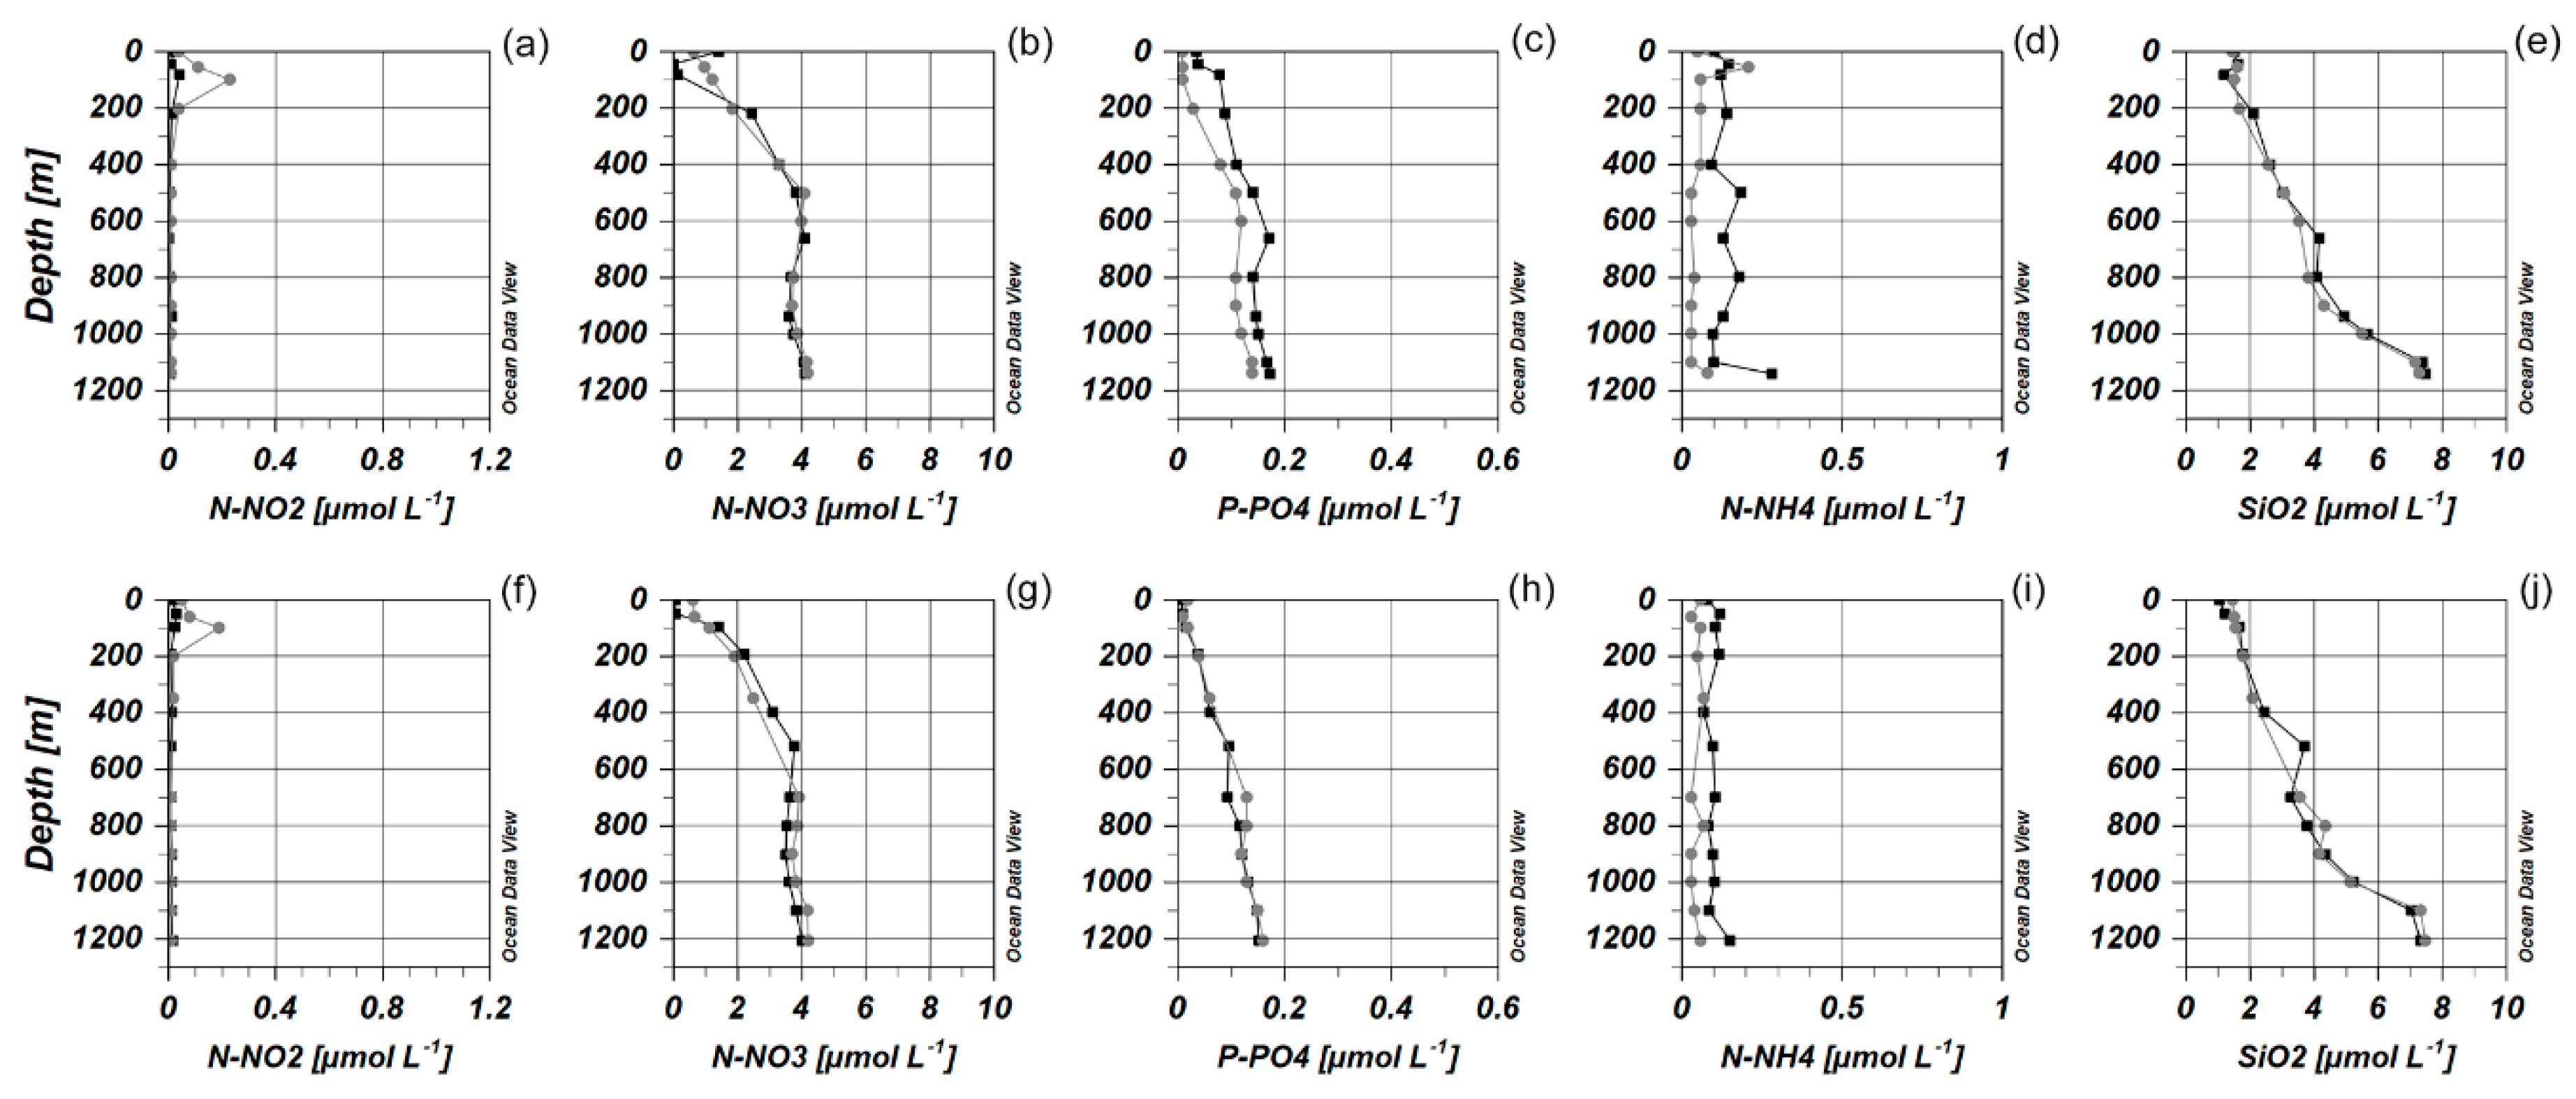
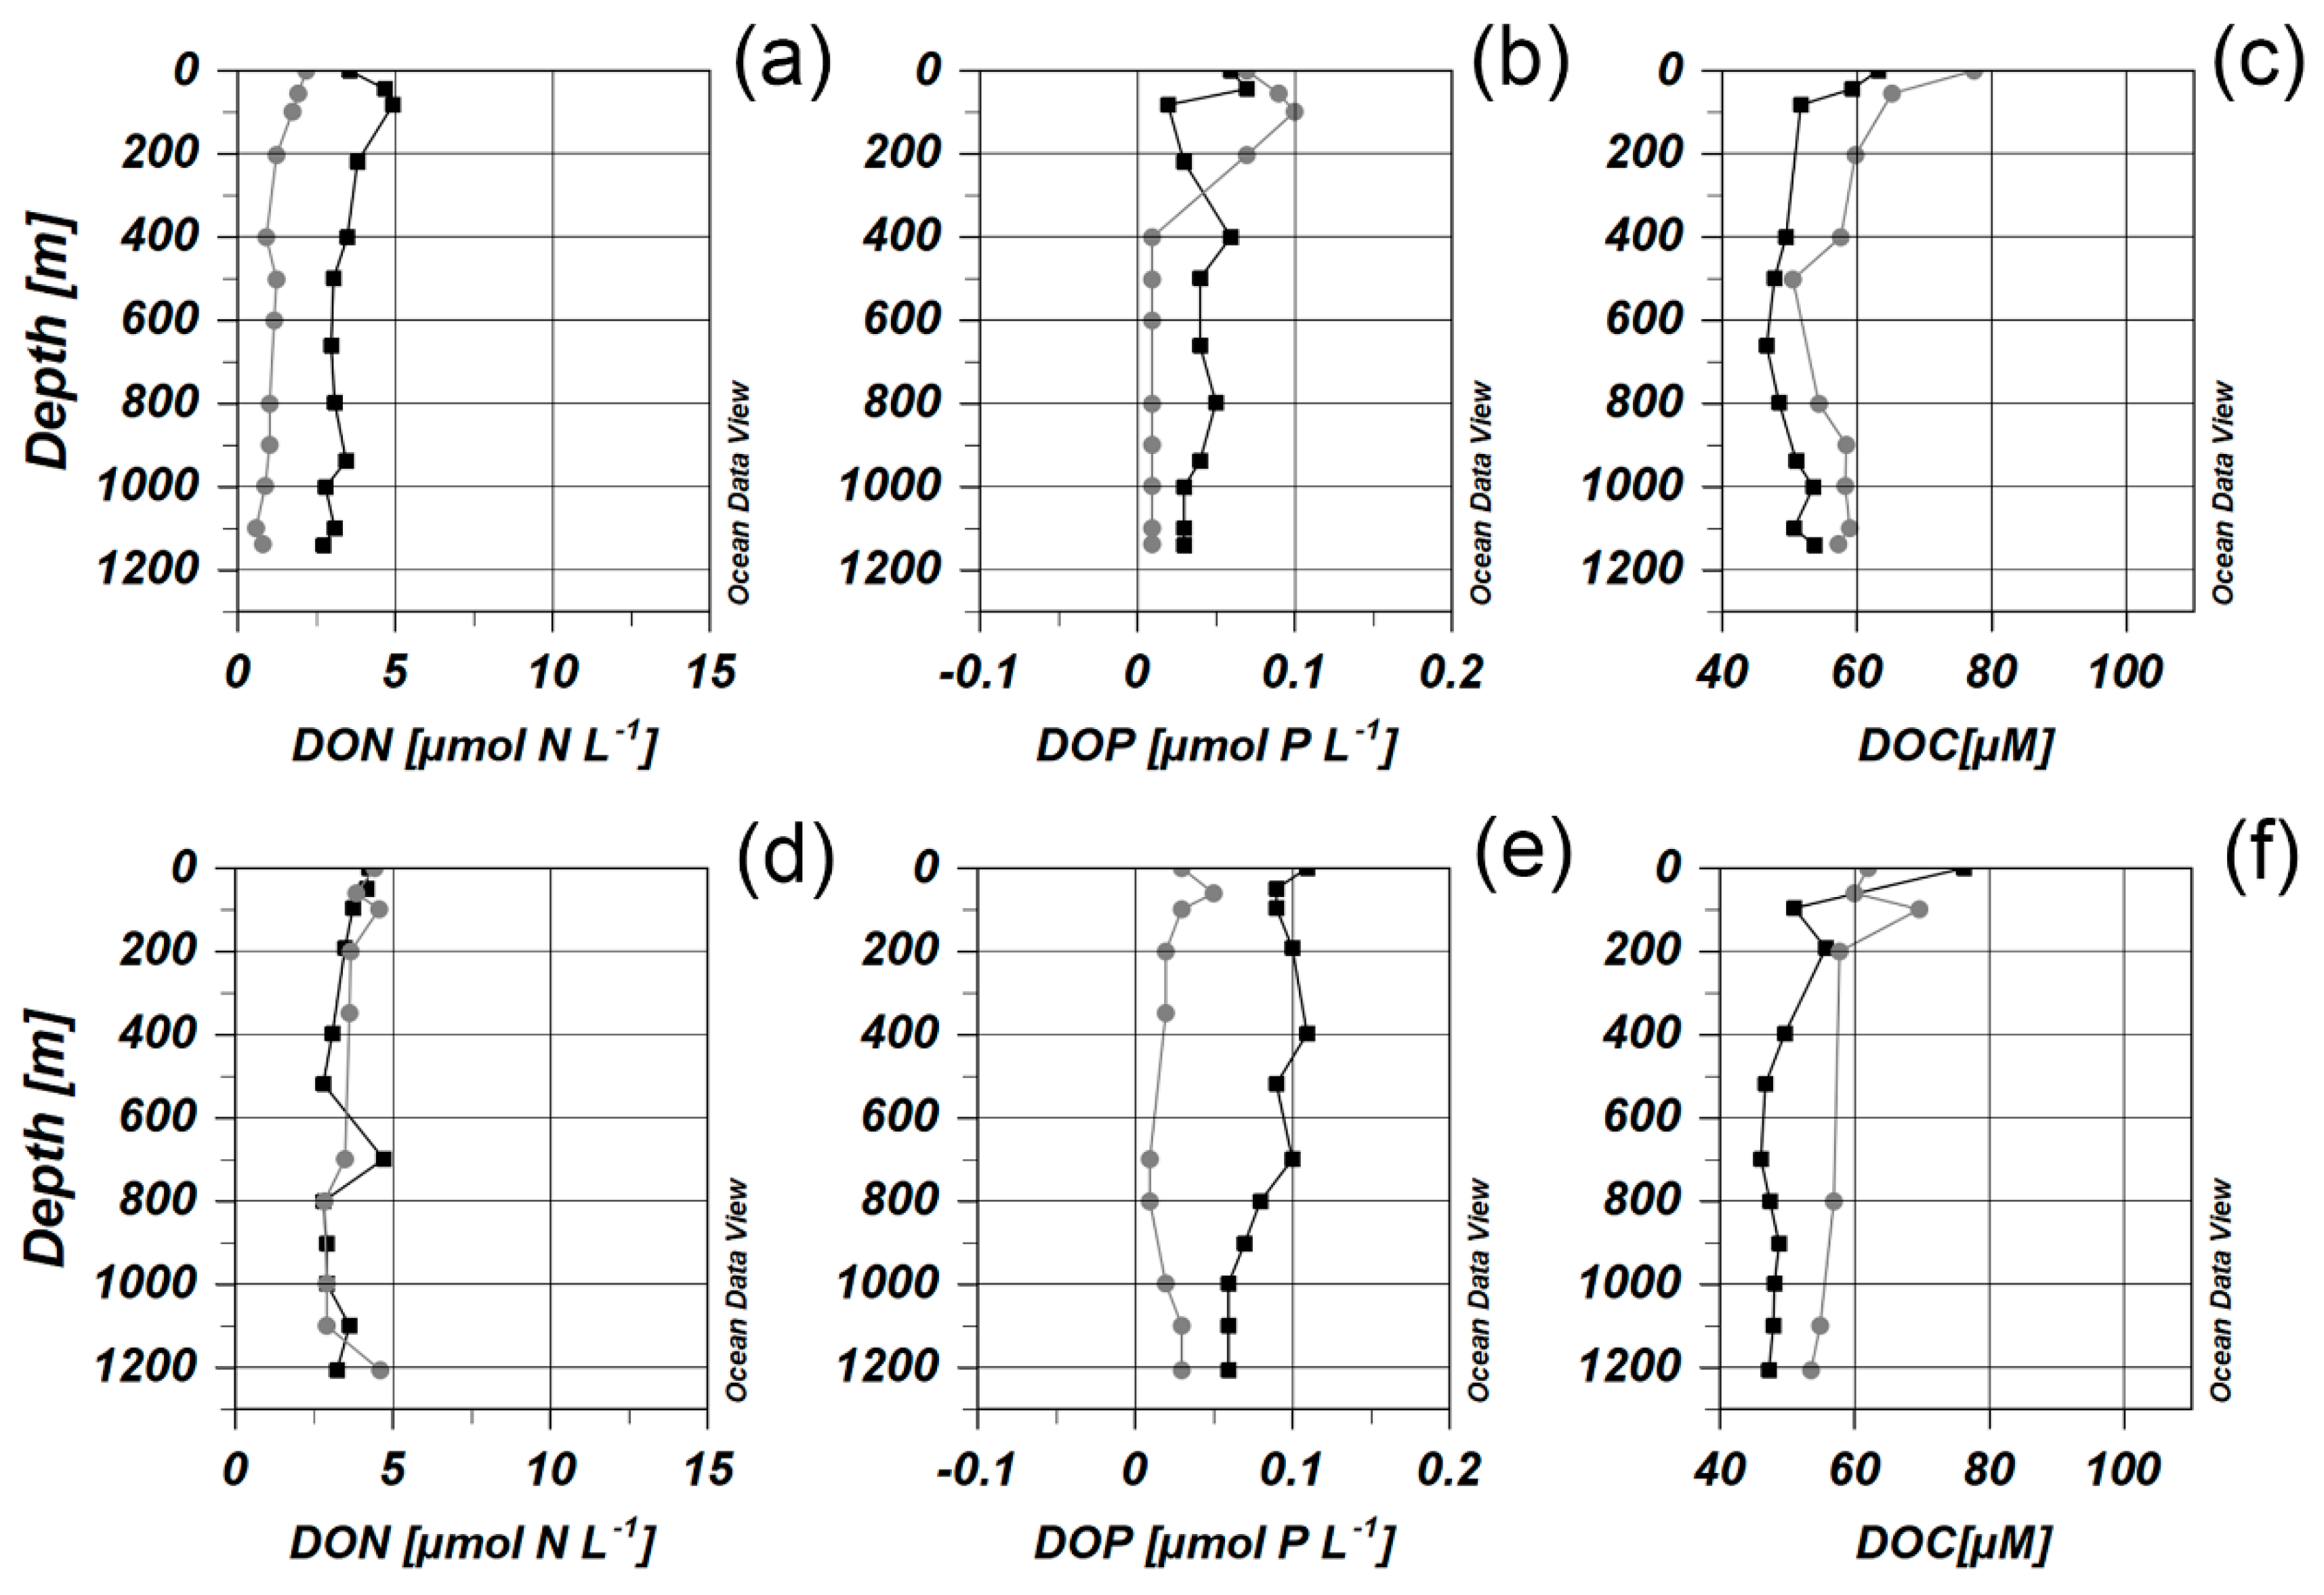
3.1. Environmental Parameters
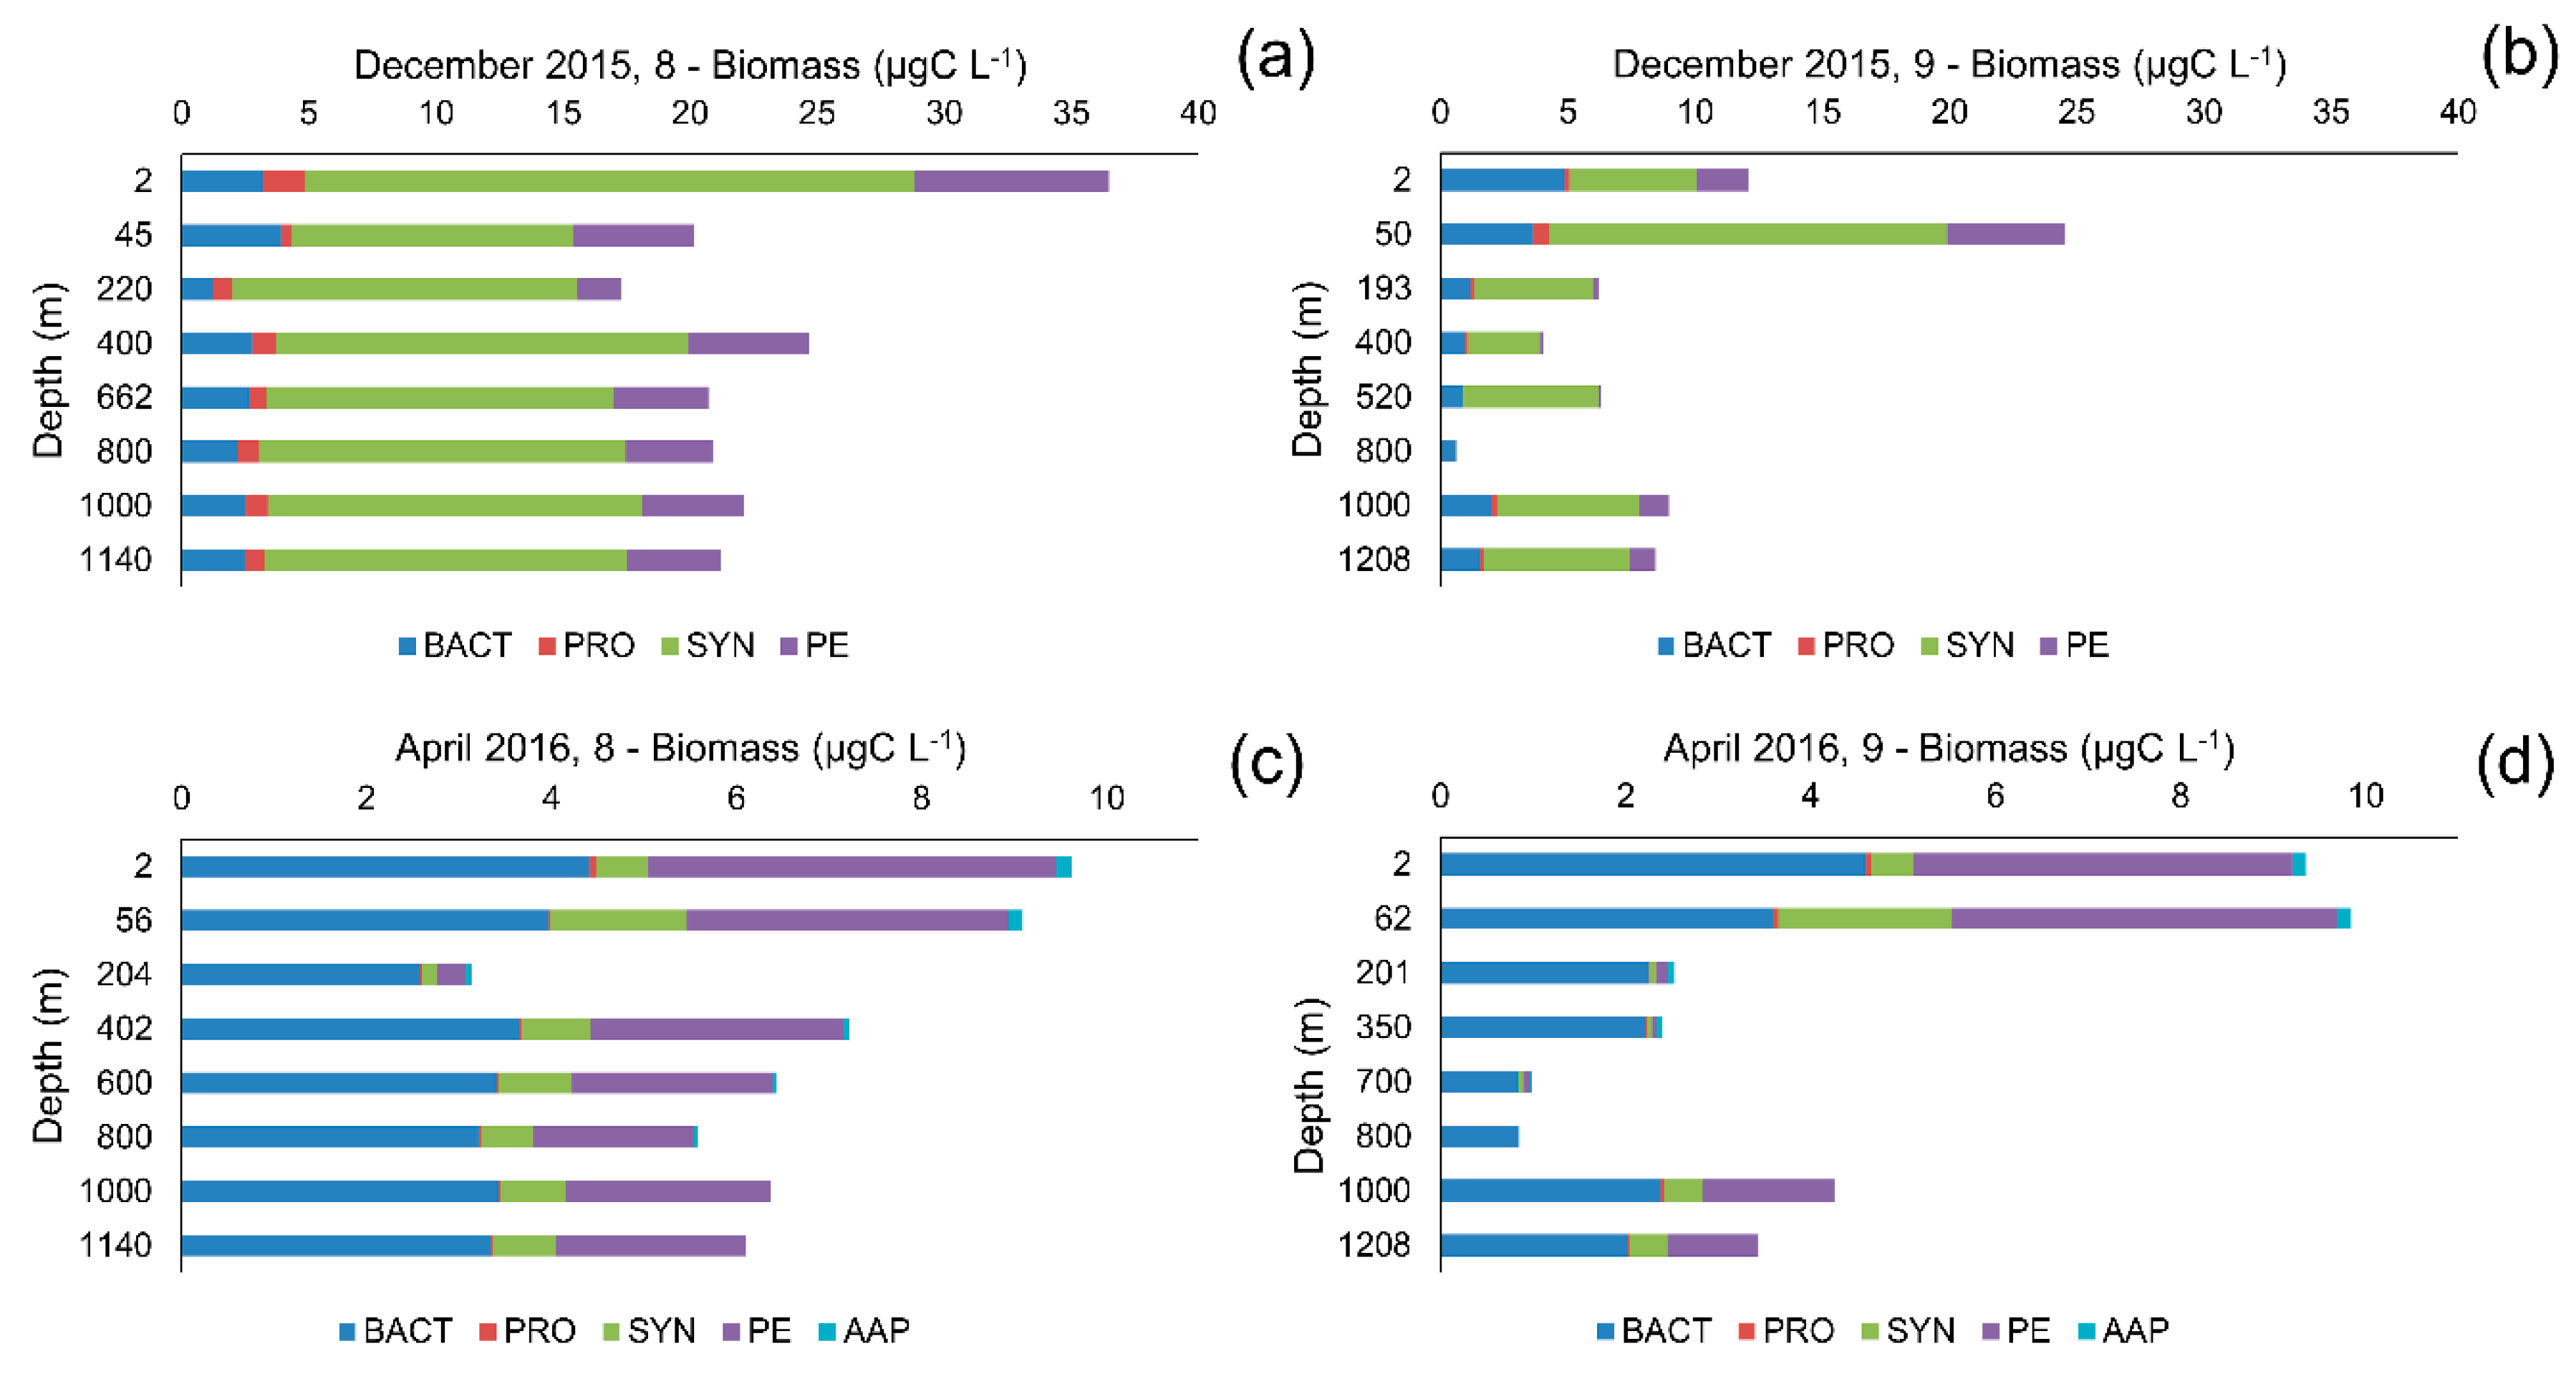
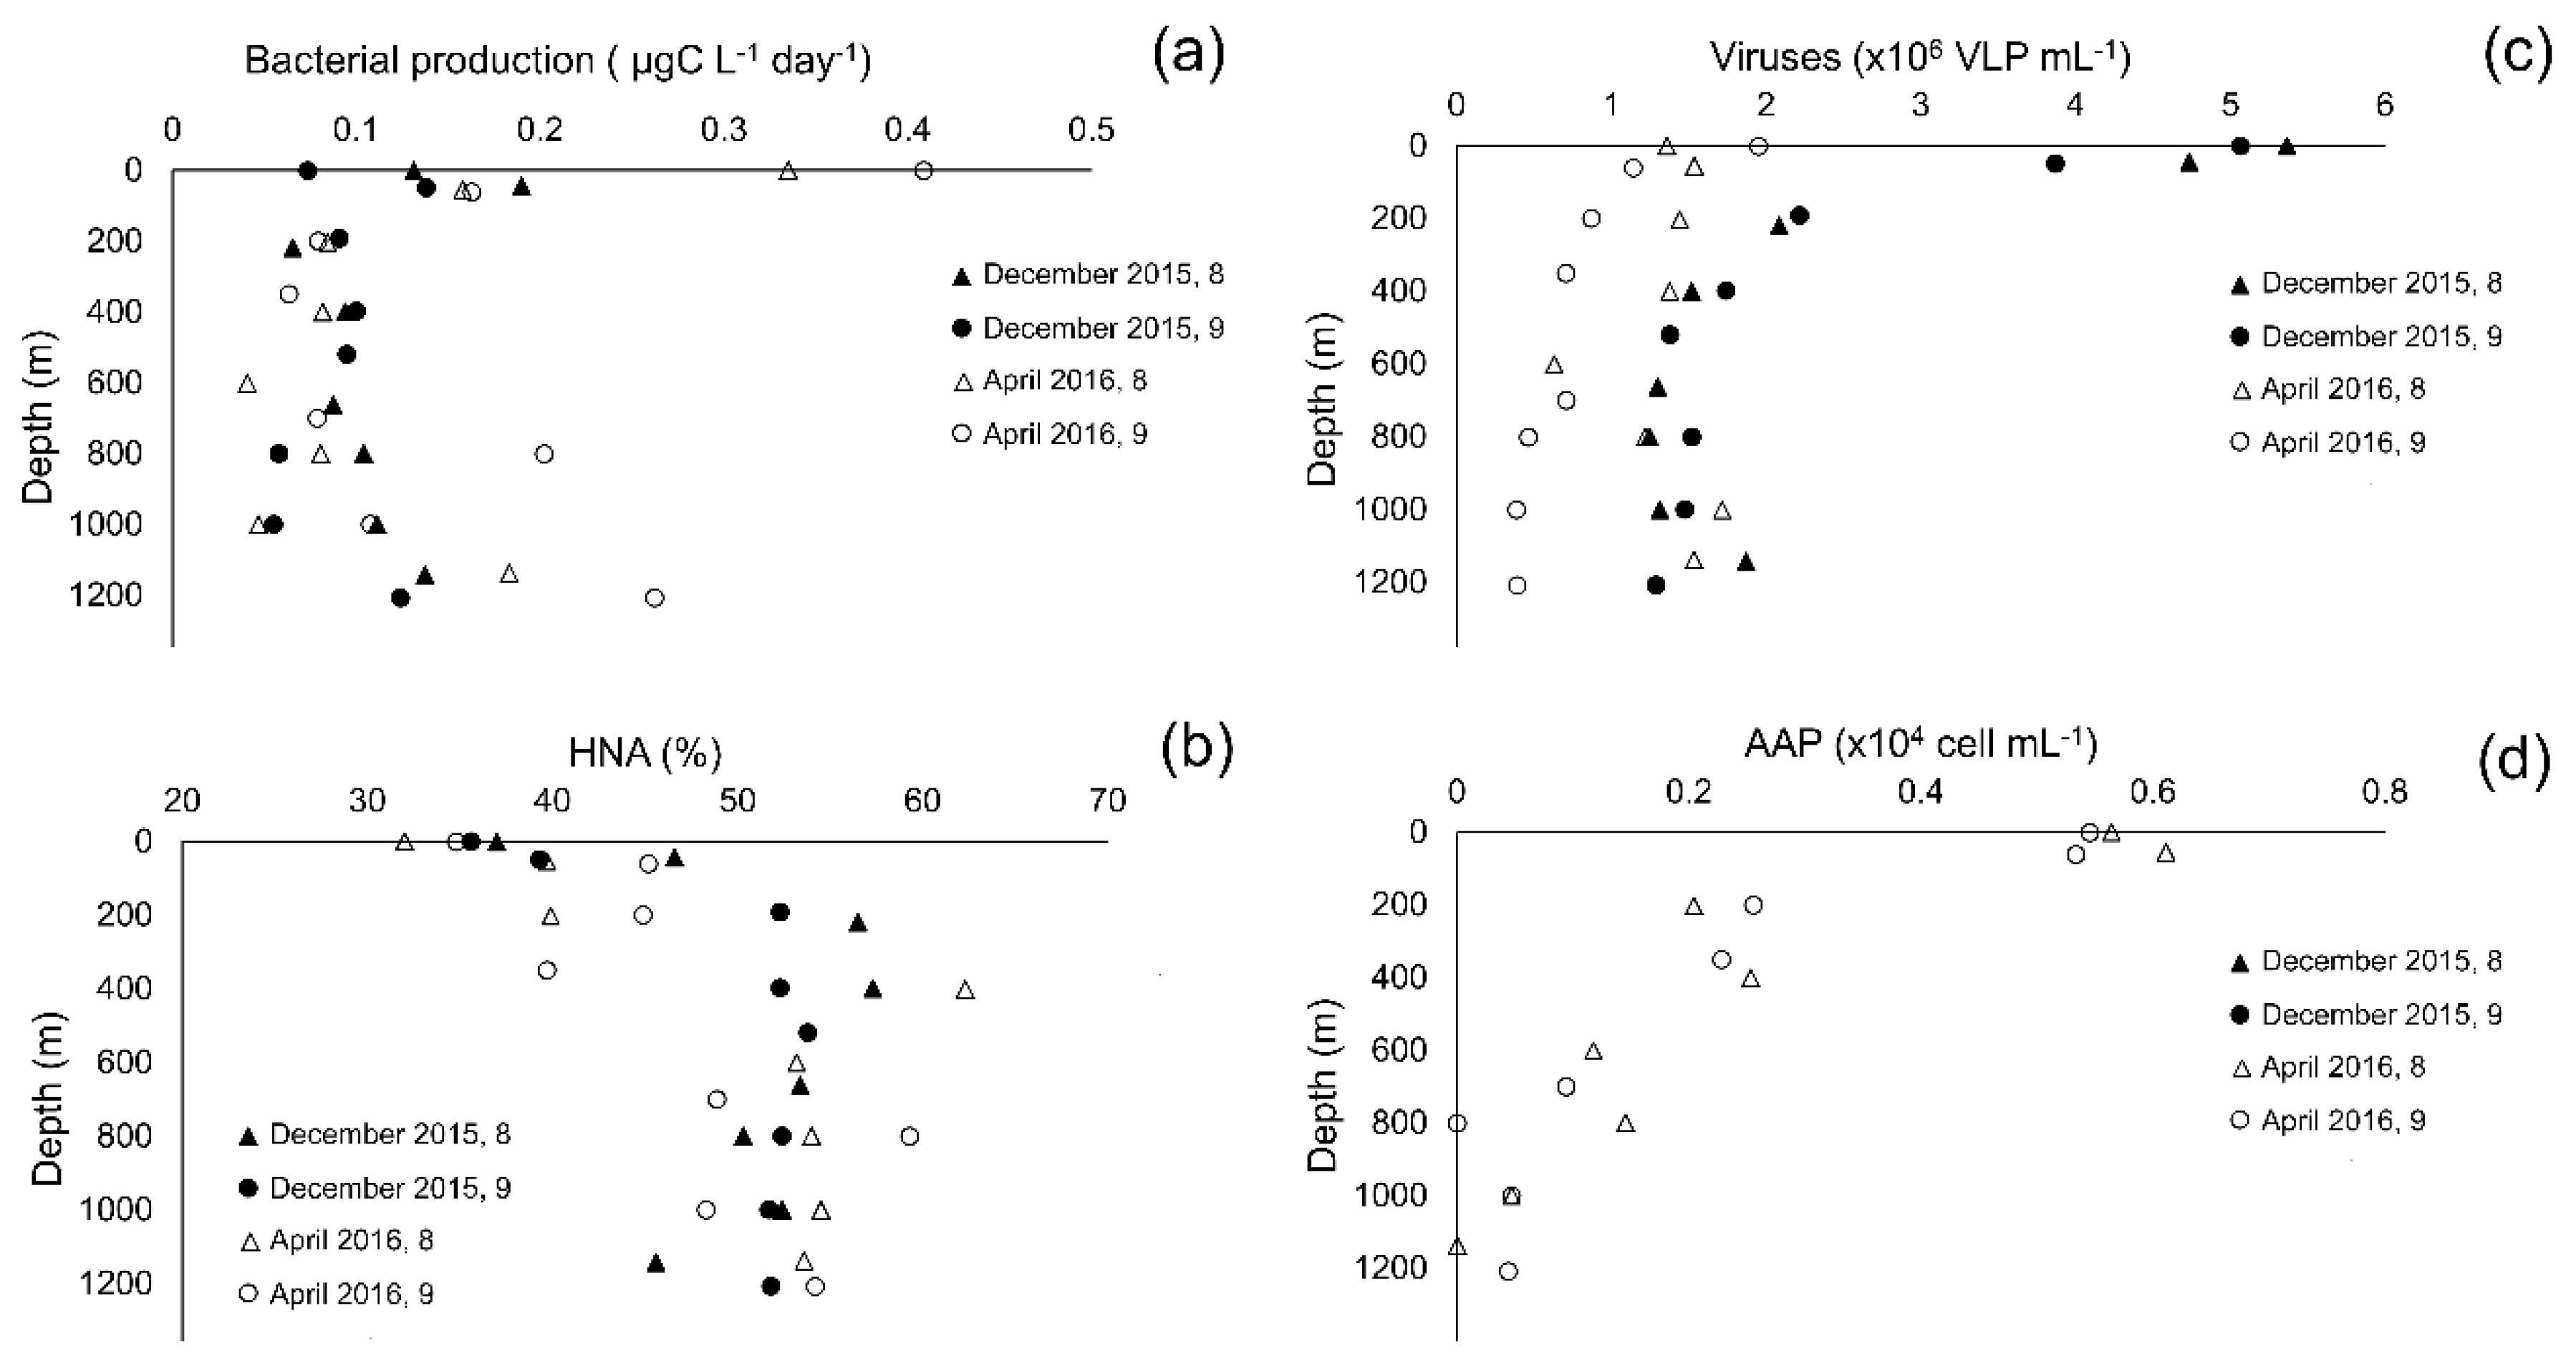
3.2. Picoplankton Community
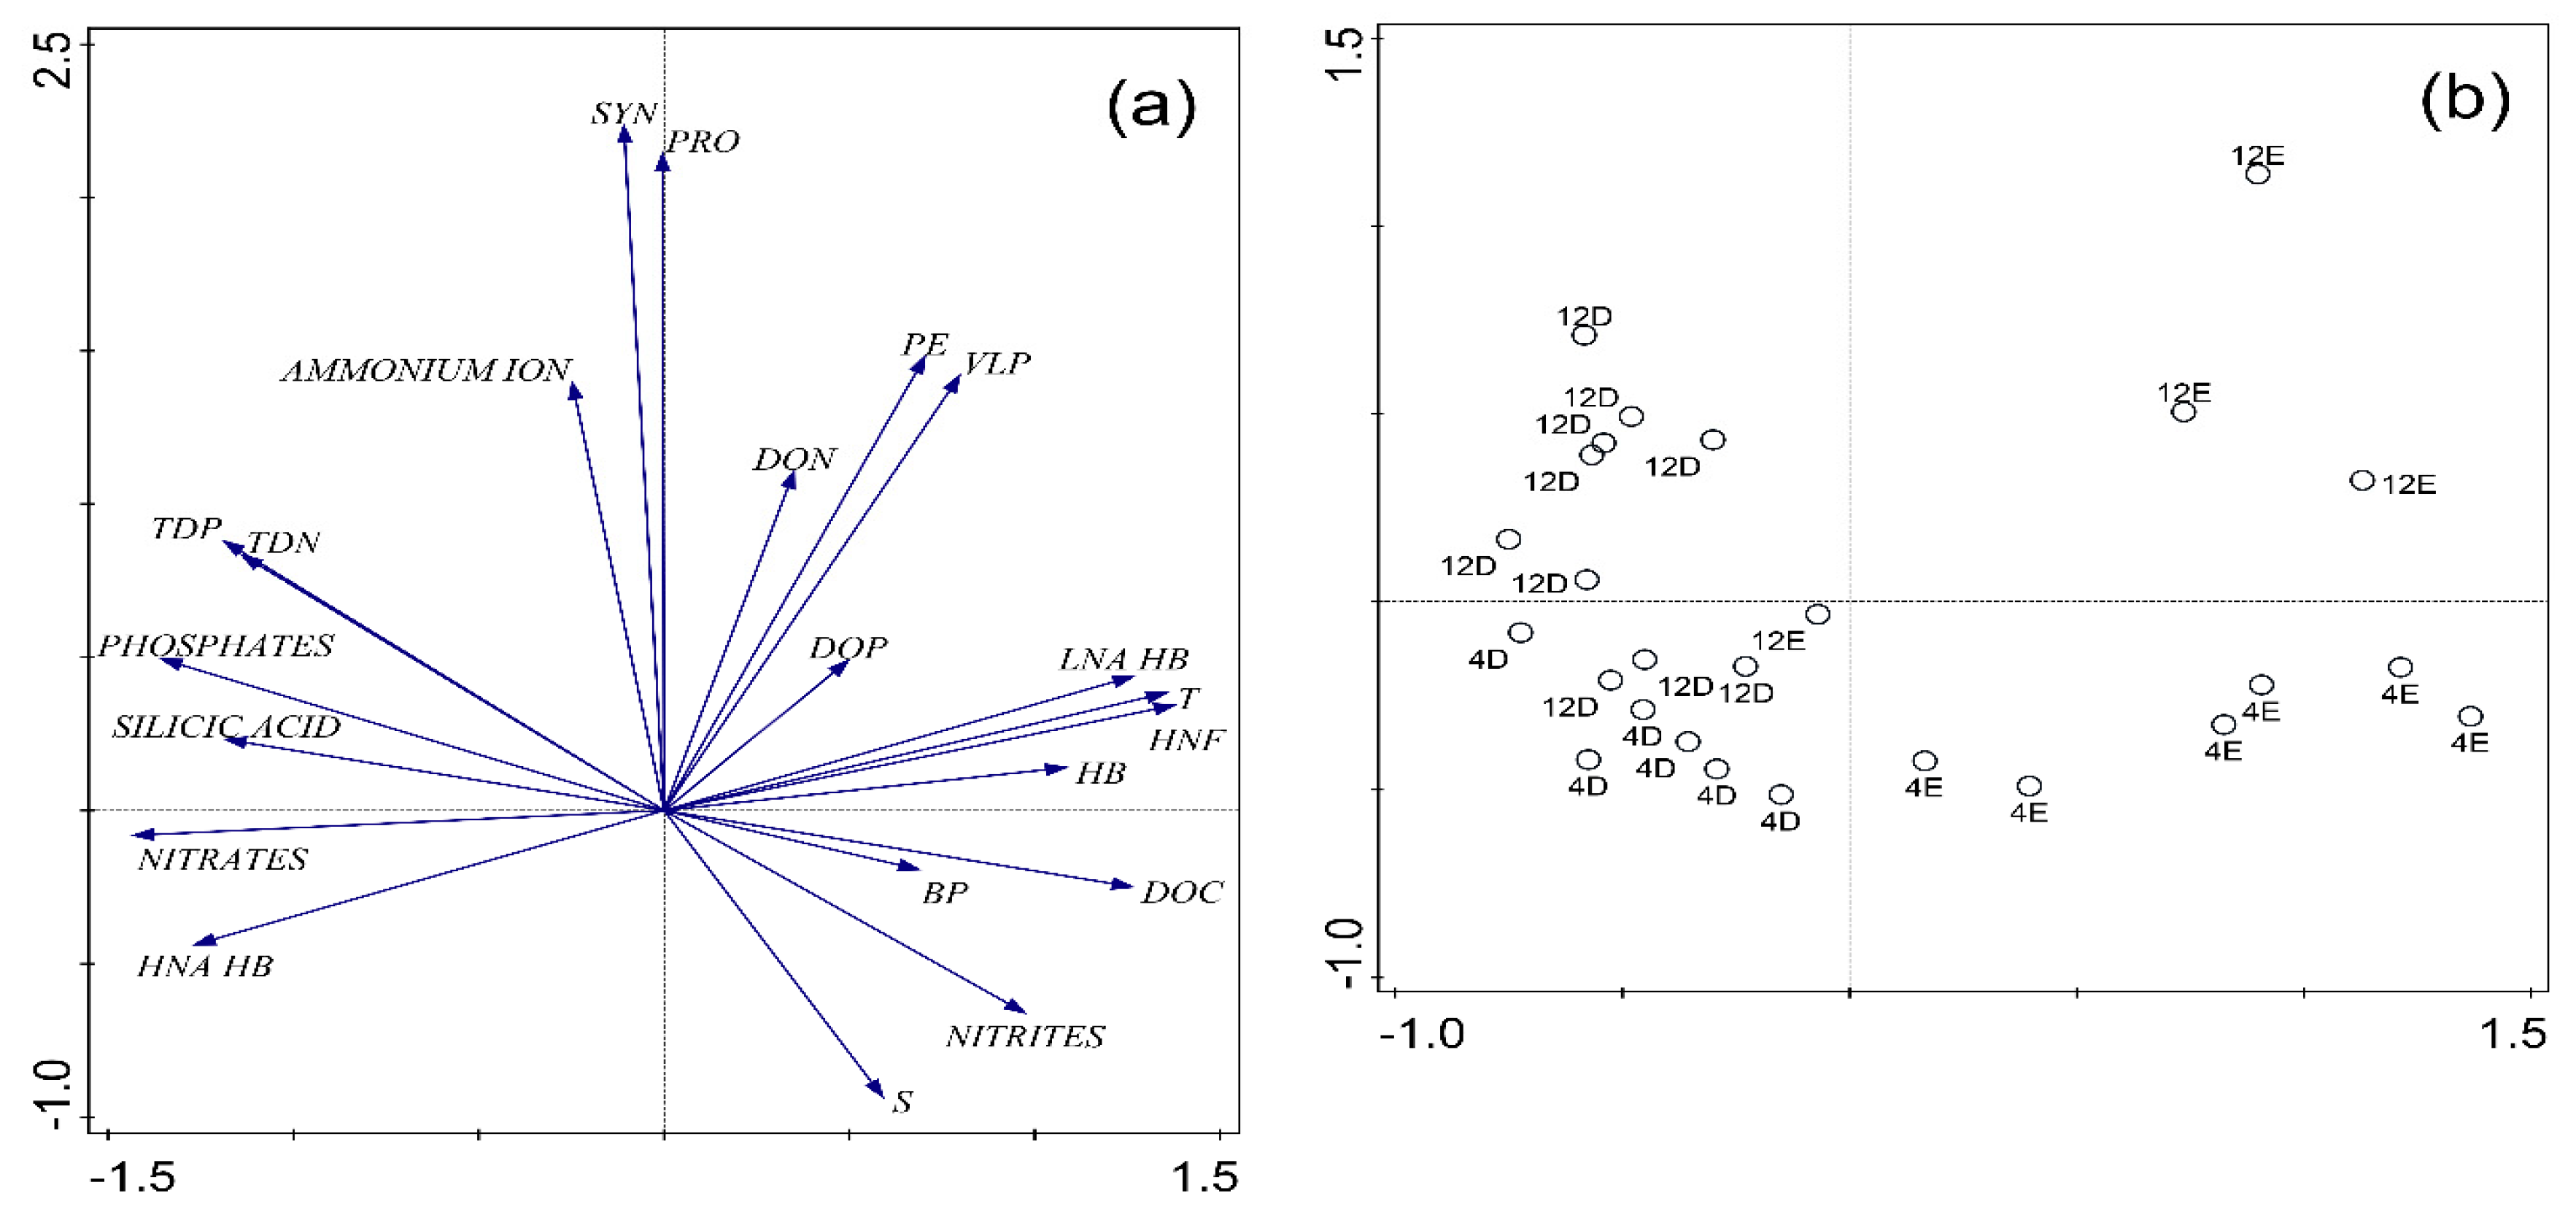
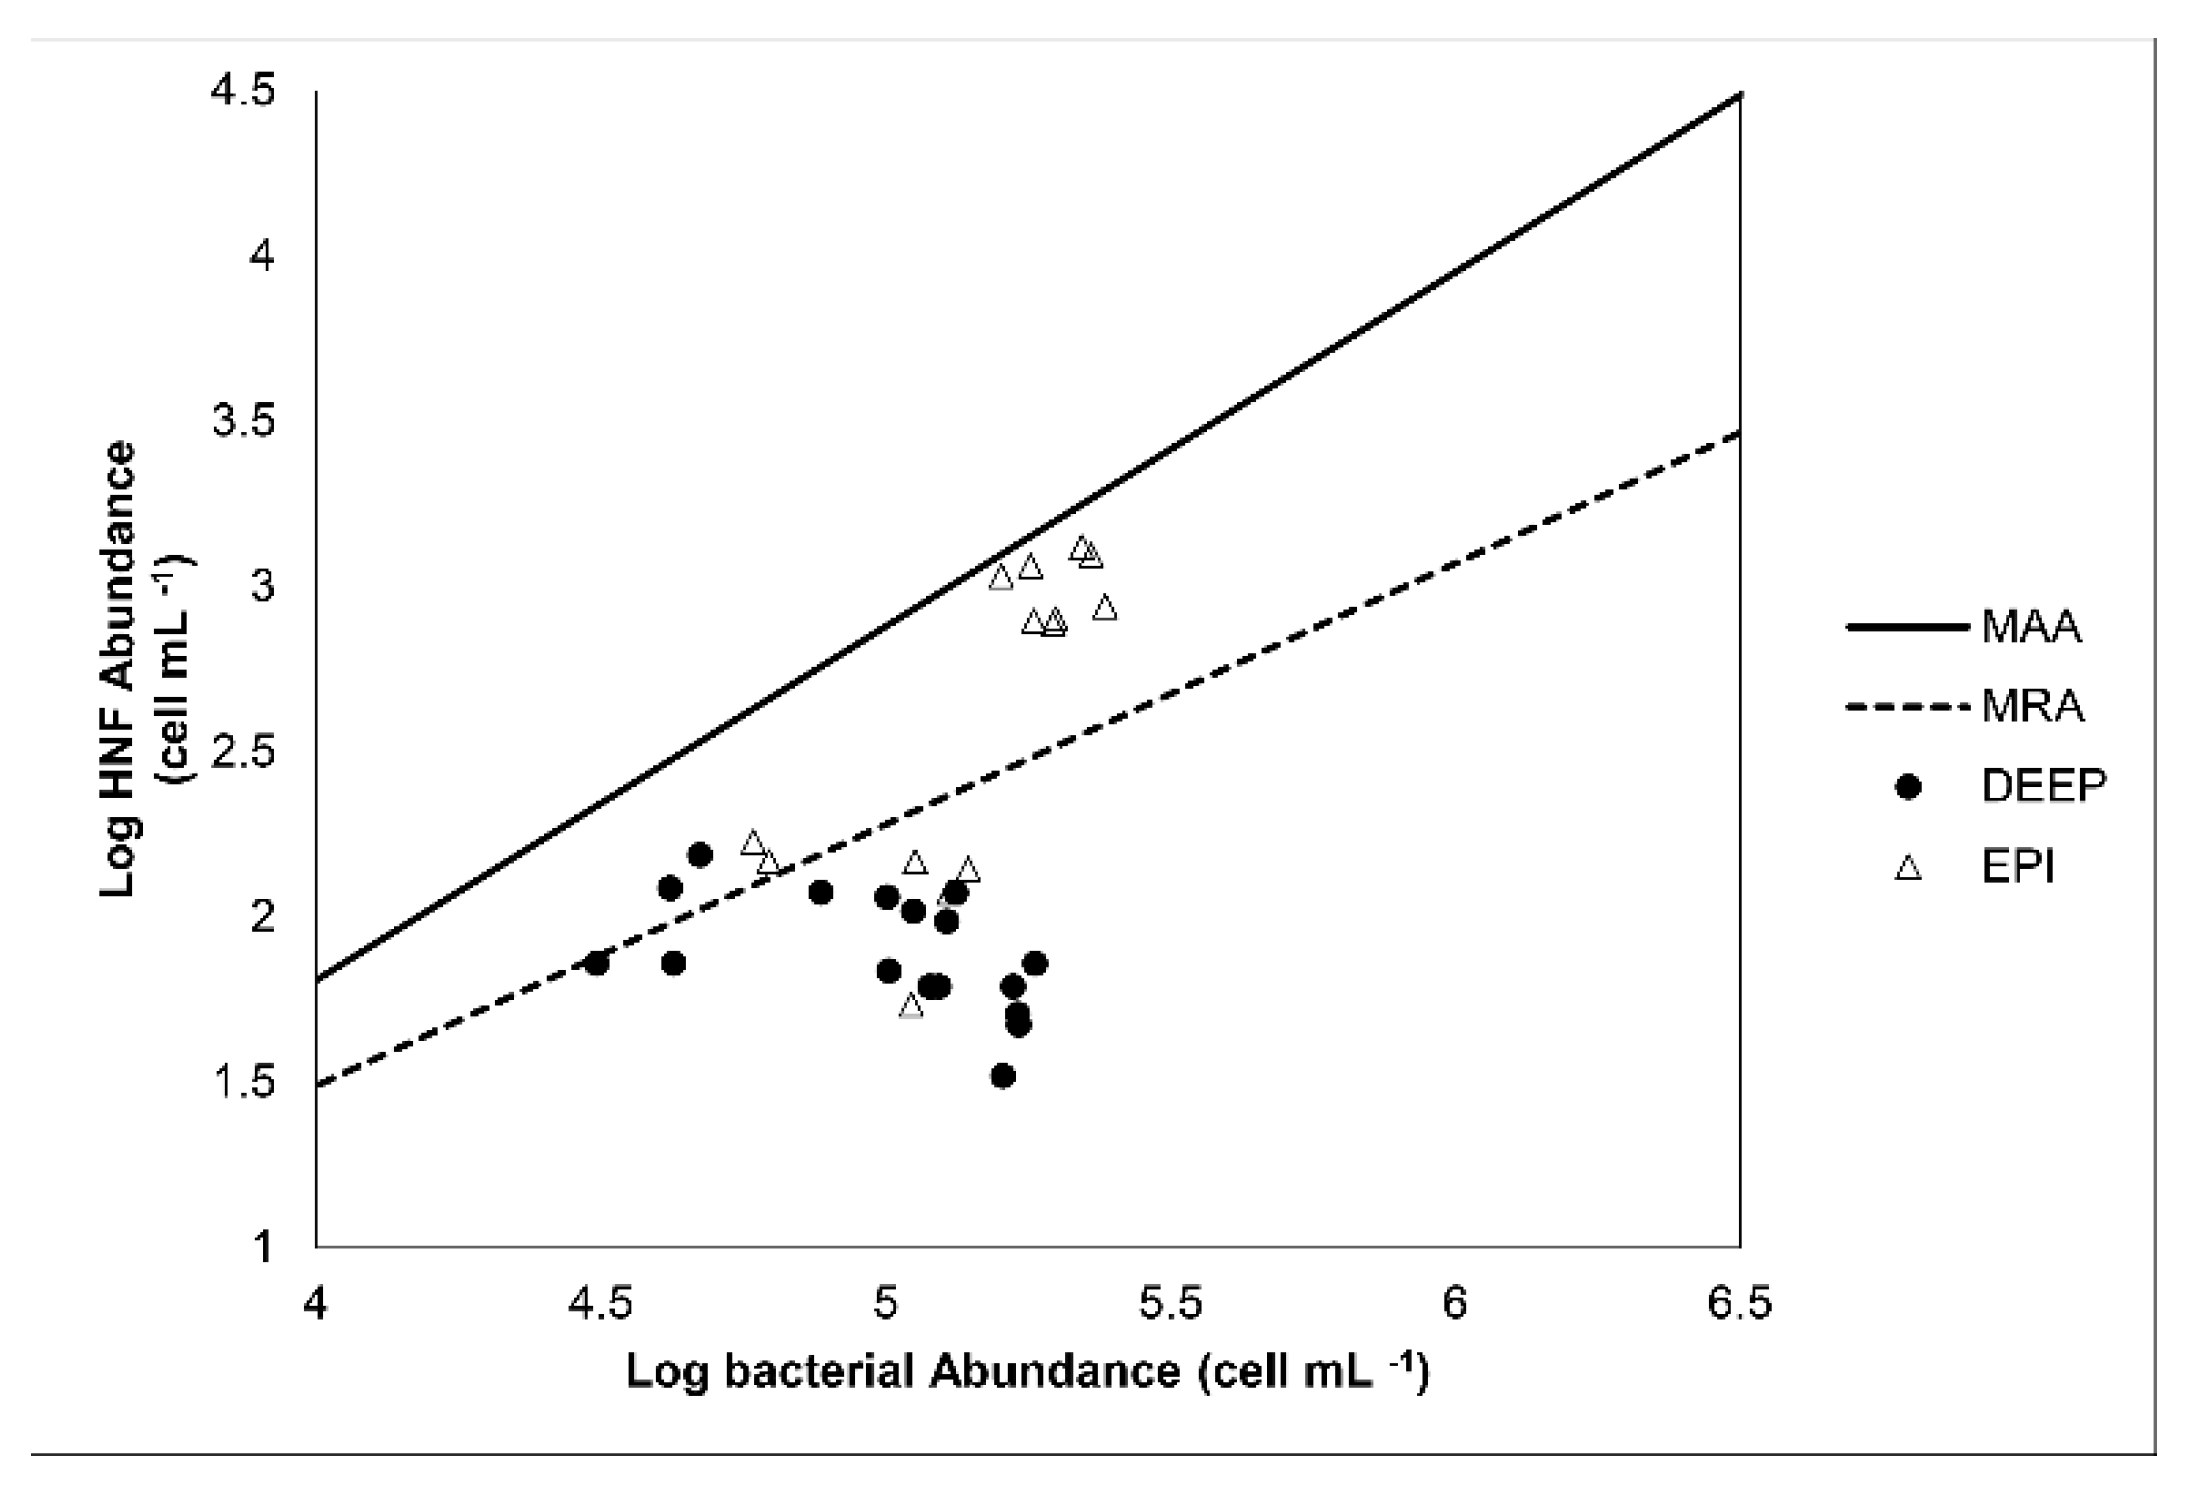
3.3. Distribution of Picoplankton Community Members Concerning Environmental Variables
4. Discussion
5. Conclusions
Supplementary Materials
Author Contributions
Funding
Acknowledgments
Conflicts of Interest
References
- Ninčević Gladan, Ž.; Marasović, I.; Kušpilić, G.; Krstulović, N.; Šolić, M.; Šestanović, S. Abundance and composition of picoplankton in the mid Adriatic Sea. Acta Adriat. 2006, 47, 127–140. [Google Scholar]
- Šolić, M.; Grbec, B.; Matić, F.; Šantić, D.; Šestanović, S.; Gladan, Ž.N.; Bojanić, N.; Ordulj, M.; Jozić, S.; Vrdoljak, A. Spatio-temporal reproducibility of the microbial food web structure associated with the change in temperature: Long-term observations in the Adriatic Sea. Prog. Oceanogr. 2018, 161, 87–101. [Google Scholar] [CrossRef]
- Šantić, D.; Krstulović, N.; Šolić, M.; Ordulj, M.; Kušpilić, G. Dynamics of prokaryotic picoplankton community in the central and southern Adriatic Sea (Croatia). Helgoland Mar. Res. 2013, 67, 471–481. [Google Scholar] [CrossRef]
- Tanaka, T.; Rassoulzadegan, F. Full-depth profile (0–2000m) of bacteria, heterotrophic nanoflagellates and ciliates in the NW Mediterranean Sea: Vertical partitioning of microbial trophic structures. Deep Sea Res. Part II Top. Stud. Oceanogr. 2002, 49, 2093–2107. [Google Scholar] [CrossRef]
- Arístegui, J.; Gasol, J.M.; Duarte, C.M.; Herndl, G.J. Microbial oceanography of the dark ocean’s pelagic realm. Limnol. Oceanogr. 2009, 54, 1501–1529. [Google Scholar] [CrossRef]
- Vilibić, I.; Šantić, D. Deep water ventilation traced by Synechococcus cyanobacteria. Ocean Dyn. 2008, 58, 119–125. [Google Scholar] [CrossRef]
- Azzaro, M.; La Ferla, R.; Maimone, G.; Monticelli, L.S.; Zaccone, R.; Civitarese, G. Prokaryotic dynamics and heterotrophic metabolism in a deep convection site of Eastern Mediterranean Sea (the Southern Adriatic Pit). Cont. Shelf Res. 2012, 44, 106–118. [Google Scholar] [CrossRef]
- Batistić, M.; Jasprica, N.; Carić, M.; Čalić, M.; Kovačević, V.; Garić, R.; Njire, J.; Mikuš, J.; Bobanović-Ćolić, S. Biological evidence of a winter convection event in the South Adriatic: A phytoplankton maximum in the aphotic zone. Cont. Shelf Res. 2012, 44, 57–71. [Google Scholar] [CrossRef]
- Cerino, F.; Aubry, F.B.; Coppola, J.; La Ferla, R.; Maimone, G.; Socal, G.; Totti, C. Spatial and temporal variability of pico-, nano-and microphytoplankton in the offshore waters of the southern Adriatic Sea (Mediterranean Sea). Cont. Shelf Res. 2012, 44, 94–105. [Google Scholar] [CrossRef]
- Šilović, T.; Mihanović, H.; Batistić, M.; Radić, I.D.; Hrustić, E.; Najdek, M. Picoplankton distribution influenced by thermohaline circulation in the southern Adriatic. Cont. Shelf Res. 2018, 155, 21–33. [Google Scholar] [CrossRef]
- Celussi, M.; Gallina, A.A.; Ras, J.; Giani, M.; Del Negro, P. Effect of sunlight on prokaryotic organic carbon uptake and dynamics of photoheterotrophy in the Adriatic Sea. Aquat. Microb. Ecol. 2015, 74, 235–249. [Google Scholar] [CrossRef]
- Šantić, D.; Šestanović, S.; Vrdoljak, A.; Šolić, M.; Kušpilić, G.; Ninčević Gladan, Ž.; Koblížek, M. Distribution of aerobic anoxygenic phototrophs in the Eastern Adriatic Sea. Mar. Environ. Res. 2017, 130, 134–141. [Google Scholar] [CrossRef] [PubMed]
- Sieracki, M.E.; Gilg, I.C.; Thier, E.C.; Poulton, N.J.; Goericke, R. Distribution of planktonic aerobic anoxygenic photoheterotrophic bacteria in the northwest Atlantic. Limnol. Oceanogr. 2006, 51, 38–46. [Google Scholar] [CrossRef]
- Stegman, M.R.; Cottrell, M.T.; Kirchman, D.L. Leucine incorporation by aerobic anoxygenic phototrophic bacteria in the Delaware estuary. ISME J. 2014, 8, 2339–2348. [Google Scholar] [CrossRef] [PubMed]
- Koblížek, M. Ecology of aerobic anoxygenic phototrophs in aquatic environments. FEMS Microbiol. Rev. 2015, 39, 854–870. [Google Scholar] [CrossRef] [Green Version]
- Kovačević, V.; Gačić, M.; Poulain, P.M. Eulerian current measurements in the Strait of Otranto and in the Southern Adriatic. J. Mar. Syst. 1999, 20, 255–278. [Google Scholar] [CrossRef]
- Yari, S.; Kovačević, V.; Cardin, V.; Gačić, M.; Bryden, H.L. Direct estimate of water, heat, and salt transport through the Strait of Otranto. J. Geophys. Res. Oceans 2012, 117. [Google Scholar] [CrossRef] [Green Version]
- Artegiani, A.; Paschini, E.; Russo, A.; Bregant, D.; Raicich, F.; Pinardi, N. The Adriatic Sea General Circulation. Part I: Air-Sea Interactions and Water Mass Structure. J. Phys. Oceanogr. 1997, 27, 1492–1514. [Google Scholar] [CrossRef]
- Buljan, M. Oceanographical properties of the Adriatic Sea. Oceanogr. Mar. Biol. Ann. Rev. 1976, 14, 11–98. [Google Scholar]
- Vukadin, I.; Stojanoski, L. Phosphorus versus nitrogen limitation in the middle Adriatic Sea. In Proceedings of the Rapport du 36e Congrès de la Commission Internationale pour l’Exploration Scientifique de la mer Mediterranee, Monaco, 1 October 2001. [Google Scholar]
- Šolić, M.; Krstulović, N.; Vilibić, I.; Kušpilić, G.; Šestanović, S.; Šantić, D.; Ordulj, M. The role of water mass dynamics in controlling bacterial abundance and production in the middle Adriatic Sea. Mar. Environ. Res. 2008, 65, 388–404. [Google Scholar] [CrossRef] [Green Version]
- Skejić, S.; Arapov, J.; Kovačević, V.; Bužančić, M.; Bensi, M.; Giani, M.; Bakrač, A.; Mihanović, H.; Ninčević Gladan, Ž.; Urbini, L.; et al. Coccolithophore diversity in open waters of the middle Adriatic Sea in pre-and post-winter periods. Mar. Micropaleontol. 2018, 43, 30–45. [Google Scholar] [CrossRef]
- Gačić, M.; Borzelli, G.L.E.; Civitarese, G.; Cardin, V.; Yari, S. Can internal processes sustain reversals of the ocean upper circulation? The Ionian Sea example. Geophys. Res. Lett. 2010, 37, L09608. [Google Scholar] [CrossRef]
- Bensi, M.; Velaoras, D.; Meccia, L.V.; Cardin, V. Effects of the Eastern Mediterranean Sea circulation on the thermohaline properties as recorded by fixed deep-ocean observatories. Deep Sea Res. Part I Oceanogr. Res. Pap. 2016, 112, 1–13. [Google Scholar] [CrossRef]
- Civitarese, G.; Gačić, M.; Lipizer, M.; Eusebi Borzelli, G.L. On the impact of the Bimodal Oscillating System (BiOS) on the biogeochemistry and biology of the Adriatic and Ionian Seas (Eastern Mediterranean). Biogeosciences 2010, 7, 3987–3997. [Google Scholar] [CrossRef] [Green Version]
- Batistić, M.; Garić, R.; Molinero, J.C. Interannual variations in Adriatic Sea zooplankton mirror shifts in circulation regimes in the Ionian Sea. Clim. Res. 2014, 61, 231–240. [Google Scholar] [CrossRef]
- Matić, F.; Kovač, Ž.; Vilibić, I.; Mihanović, H.; Morović, M.; Grbec, B.; Leder, N.; Džoić, T. Oscillating Adriatic temperature and salinity regimes mapped using the Self-Organizing Maps method. Cont. Shelf Res. 2017, 132, 11–18. [Google Scholar] [CrossRef]
- Vilibić, I.; Orlić, M. Adriatic water masses, their rates of formation and transport through the Otranto Strait. Deep Sea Res. Part I Oceanogr. Res. Pap. 2002, 49, 1321–1340. [Google Scholar] [CrossRef]
- Querin, S.; Bensi, M.; Cardin, V.; Solidoro, C.; Bacer, S.; Mariotti, L.; Stel, F.; Malačič, V. Saw-tooth modulation of the deep-water thermohaline properties in the southern Adriatic Sea. J. Geophys. Res. Oceans 2016, 121, 4585–4600. [Google Scholar] [CrossRef]
- Vilibić, I.; Orlić, M. Least-squares tracer analysis of water masses in the South Adriatic (1967–1990). Deep Sea Res. Part I Oceanogr. Res. Pap. 2001, 48, 2297–2330. [Google Scholar] [CrossRef]
- Cardin, V.; Bensi, M.; Pacciaroni, M. Variability of water mass properties in the last two decades in the Southern Adriatic Sea with emphasis on the period 2006–2009. Cont. Shelf Res. 2011, 31, 951–965. [Google Scholar] [CrossRef]
- Bensi, M.; Cardin, V.; Rubino, A.; Notarstefano, G.; Poulain, P.M. Effects of winter convection on the deep layer of the Southern Adriatic Sea in 2012. J. Geophys. Res. Oceans 2013, 118, 6064–6075. [Google Scholar] [CrossRef] [Green Version]
- Schlitzer, R.; Roether, W.; Oster, H.; Junghans, H.; Hausmann, M.; Johannsen, H.; Michelato, A. Chlorofluoromethane and oxygen in the Eastern Mediterranean. Deep Sea Res. Part A Oceanogr. Res. Pap. 1991, 38, 1531–1535. [Google Scholar] [CrossRef]
- Mihanović, H.; Vilibić, I.; Carniel, S.; Tudor, M.; Russo, A.; Bergamasco, A.; Bubić, N.; Ljubešić, Z.; Viličić, D.; Boldrin, A.; et al. Exceptional dense water formation on the Adriatic shelf in the winter of 2012. Ocean Sci. 2013, 9, 561–572. [Google Scholar] [CrossRef] [Green Version]
- Schlitzer, R. Ocean Data View. 2018. Available online: http://odv.awi.de/ (accessed on 1 February 2019).
- Hansen, H.P.; Koroleff, F. Determination of nutrients. Methods Seawater Anal. 1999, 27, 159–228. [Google Scholar]
- Marie, D.; Partensky, F.; Jacquet, S.; Vaulot, D. Enumeration and cell cycle analysis of natural populations of marine picoplankton by flow cytometry using the nucleic acid stain SYBR Green I. Appl. Environ. Microbiol. 1997, 63, 186–193. [Google Scholar] [PubMed]
- Christaki, U.; Courties, C.; Massana, R.; Catala, P.; Lebaron, P.; Gasol, J.M.; Zubkov, M.V. Optimized routine flow cytometric enumeration of heterotrophic flagellates using SYBR Green I. Limnol. Oceanogr. Methods 2011, 9, 329–339. [Google Scholar] [CrossRef] [Green Version]
- Mašín, M.; Zdun, A.; Ston-Egiert, J.; Nausch, M.; Labrenz, M.; Moulisová, V.; Koblížek, M. Seasonal changes and diversity of aerobic anoxygenic phototrophs in the Baltic Sea. Aquat. Microb. Ecol. 2006, 45, 247–254. [Google Scholar] [CrossRef] [Green Version]
- Noble, R.T.; Fuhrman, J.A. Use of SYBR Green I for rapid epifluorescence counts of marine viruses and bacteria. Aquat. Microb. Ecol. 1998, 14, 113–118. [Google Scholar] [CrossRef] [Green Version]
- Fuhrman, J.A.; Azam, F. Thymidine incorporation as a measure of heterotrophic bacterioplankton production in marine surface waters: Evaluation and field results. Mar. Biol. 1982, 66, 109–120. [Google Scholar] [CrossRef]
- Lee, S.; Fuhrman, J.A. Relationships between biovolume and biomass of naturally derived marine bacterioplankton. Appl. Environ. Microbiol. 1987, 53, 1298–1303. [Google Scholar]
- Kirchman, D.L. Handbook of Methods in Aquatic Microbial Ecology; Lewis Publishers: Boca Raton, FL, USA, 1993; pp. 509–512. [Google Scholar]
- Buitenhuis, E.T.; Li, W.K.W.; Vaulot, D.; Lomas, M.W.; Landry, M.R.; Partensky, F.; McManus, G.B. Picophytoplankton biomass distribution in the global ocean. Earth Syst. Sci. Data 2012, 4, 37–46. [Google Scholar] [CrossRef] [Green Version]
- Vrdoljak Tomaš, A.; Šantić, D.; Šolić, M.; Ordulj, M.; Jozić, S.; Šestanović, S.; Matić, F.; Kušpilić, G.; Ninčević Gladan, Ž. Dynamics of Aerobic Anoxygenic Phototrophs along the trophic gradient in the central Adriatic Sea. Deep Sea Res. Part II Top. Stud. Oceanogr. 2019. [Google Scholar] [CrossRef]
- Gasol, J.M. A framework for the assessment of top-down vs bottom-up control of heterotrophic nanoflagellate abundance. Mar. Ecol. Prog. Ser. 1994, 113, 291–300. [Google Scholar] [CrossRef]
- ter Braak, C.J.; Šmilauer, P. Canoco Reference Manual and User’s Guide: Software for Ordination, version 5.0; Microcomputer Power: Ithaca, NY, USA, 2012. [Google Scholar]
- Rubino, A.; Romanenkov, D.; Zanchettin, D.; Cardin, V.; Hainbucher, D.; Bensi, M.; Boldrin, A.; Langone, L.; Miserocchi, S.; Turchetto, M. On the descent of dense water on a complex canyon system in the southern Adriatic basin. Cont. Shelf Res. 2012, 44, 20–29. [Google Scholar] [CrossRef]
- Bayindirli, C.; Ulysal, Z. Monthly changes in the abundance and biomass of cyanobacteria Synechococcus in the Cilician Basin. Rapp. Comm. Int. Mer. Médit. 2007, 38, 347. [Google Scholar]
- Li, W.K. Annual average abundance of heterotrophic bacteria and Synechococcus in surface ocean waters. Limnol. Oceanogr. 1998, 43, 1746–1753. [Google Scholar] [CrossRef]
- Zubkov, M.V.; Sleigh, M.A.; Burkill, P.H.; Leakey, R.J. Picoplankton community structure on the Atlantic Meridional Transect: A comparison between seasons. Prog. Oceanogr. 2000, 45, 369–386. [Google Scholar] [CrossRef]
- Li, W.K.W.; Harrison, W.G. Chlorophyll, bacteria and picophytoplankton in ecological provinces of the North Atlantic. Deep Sea Res. Part II Top. Stud. Oceanogr. 2001, 48, 2271–2293. [Google Scholar] [CrossRef]
- Carlucci, A.F.; Craven, D.B.; Robertson, K.J.; Henrichs, S.M. Microheterotrophic utilization of dissolved free amino-acids in depth profiles of southern-California borderland basin waters. Oceanol. Acta 1986, 9, 89–96. [Google Scholar]
- DeLong, E.F.; Yayanos, A.A. Biochemical function and ecological significance of novel bacterial lipids in deep-sea prokaryotes. Appl. Environ. Microbiol. 1986, 51, 730–737. [Google Scholar]
- Li, W.K. Primary production of prochlorophytes, cyanobacteria, and eukaryotic ultraphytoplankton: Measurements from flow cytometric sorting. Limnol. Oceanogr. 1994, 39, 169–175. [Google Scholar] [CrossRef]
- Partensky, F.; Blanchot, J.; Lantoine, F.; Neveux, J.; Marie, D. Vertical structure of picophytoplankton at different trophic sites of the tropical northeastern Atlantic Ocean. Deep Sea Res. Part I Oceanogr. Res. Pap. 1996, 43, 1191–1213. [Google Scholar] [CrossRef]
- Blanchot, J.; André, J.M.; Navarette, C.; Neveux, J.; Radenac, M.H. Picophytoplankton in the equatorial Pacific: Vertical distributions in the warm pool and in the high nutrient low chlorophyll conditions. Deep Sea Res. Part I Oceanogr. Res. Pap. 2001, 48, 297–314. [Google Scholar] [CrossRef]
- Buesseler, K.O.; Lamborg, C.H.; Boyd, P.W.; Lam, P.J.; Trull, T.W.; Bidigare, R.R.; Bishop, J.K.; Casciotti, K.L.; Dehairs, F.; Elskens, M.; et al. Revisiting carbon flux through the ocean’s twilight zone. Science 2007, 316, 567–570. [Google Scholar] [CrossRef] [PubMed]
- Zhang, Y.; Jiao, N.; Hong, N. Comparative study of picoplankton biomass and community structure in different provinces from subarctic to subtropical oceans. Deep Sea Res. Part II Top. Stud. Oceanogr. 2008, 55, 1605–1614. [Google Scholar] [CrossRef]
- Šilović, T.; Balagué, V.; Orlić, S.; Pedrós-Alió, C. Picoplankton seasonal variation and community structure in the northeast Adriatic coastal zone. FEMS Microbiol. Ecol. 2012, 82, 678–691. [Google Scholar] [CrossRef] [PubMed] [Green Version]
- Najdek, M.; Paliaga, P.; Šilović, T.; Batistić, M.; Garić, R.; Supić, N.; Ivančić, I.; Ljubimir, S.; Korlević, M.; Jasprica, N.; et al. Picoplankton community structure before, during and after convection event in the offshore waters of the Southern Adriatic Sea. Biogeosciences 2014, 11, 2645–2659. [Google Scholar] [CrossRef] [Green Version]
- Moutin, T.; Thingstad, T.F.; Van Wambeke, F.; Marie, D.; Slawyk, G.; Raimbault, P.; Claustre, H. Does competition for nanomolar phosphate supply explain the predominance of the cyanobacterium Synechococcus? Limnol. Oceanogr. 2002, 47, 1562–1567. [Google Scholar] [CrossRef]
- Martiny, A.C.; Kathuria, S.; Berube, P.M. Widespread metabolic potential for nitrite and nitrate assimilation among Prochlorococcus ecotypes. Proc. Natl. Acad. Sci. USA 2009, 106, 10787–10792. [Google Scholar] [CrossRef]
- Raven, J.A.; Wollenweber, B.; Handley, L.L. A comparison of ammonium and nitrate as nitrogen sources for photolithotrophs. New Phytol. 1992, 121, 19–32. [Google Scholar] [CrossRef]
- Partensky, F.; Hess, W.R.; Vaulot, D. Prochlorococcus, a marine photosynthetic prokaryote of global significance. Microbiol. Mol. Biol. Rev. 1999, 63, 106–127. [Google Scholar] [PubMed]
- Wyman, M.; Bird, C. Lack of control of nitrite assimilation by ammonium in an oceanic picocyanobacterium, Synechococcus sp. strain WH 8103. Appl. Environ. Microbiol. 2007, 73, 3028–3033. [Google Scholar] [CrossRef] [PubMed]
- La Ferla, R.; Azzaro, M.; Budillon, G.; Caroppo, C.; Decembrini, F.; Maimone, G. Distribution of the prokaryotic biomass and community respiration in the main water masses of the Southern Tyrrhenian Sea (June and December 2005). Adv. Ocean. Limnol. 2010, 1, 235–257. [Google Scholar] [CrossRef]
- Šantić, D.; Krstulović, N.; Šolić, M.; Kušpilić, G. HNA and LNA bacteria in relation to the activity of heterotrophic bacteria. Acta Adriat. 2012, 53, 25–40. [Google Scholar]
- Andrade, L.; Gonzalez, A.M.; Araujo, F.V.; Paranhos, R. Flow cytometry assessment of bacterioplankton in tropical marine environments. J. Microbiol. Methods 2003, 55, 841–850. [Google Scholar] [CrossRef] [PubMed]
- Corzo, A.; Rodríguez-Gálvez, S.; Lubian, L.; Sobrino, C.; Sangrá, P.; Martínez, A. Antarctic marine bacterioplankton subpopulations discriminated by their apparent content of nucleic acids differ in their response to ecological factors. Polar Biol. 2005, 29, 27–39. [Google Scholar] [CrossRef]
- Reinthaler, T.; Van Aken, H.; Veth, C.; Arístegui, J.; Robinson, C.; Williams, P.J.L.B.; Lebaron, P.; Herndl, G.J. Prokaryotic respiration and production in the meso-and bathypelagic realm of the eastern and western North Atlantic basin. Limnol. Oceanogr. 2006, 51, 1262–1273. [Google Scholar] [CrossRef]
- Tanaka, T.; Rassoulzadegan, F. Vertical and seasonal variations of bacterial abundance and production in the mesopelagic layer of the NW Mediterranean Sea: bottom-up and top-down controls. Deep Sea Res. Part I Oceanogr. Res. Pap. 2004, 51, 531–544. [Google Scholar] [CrossRef]
- Herndl, G.J.; Reinthaler, T.; Teira, E.; van Aken, H.; Veth, C.; Pernthaler, A.; Pernthaler, J. Contribution of Archaea to total prokaryotic production in the deep Atlantic Ocean. Appl. Environ. Microb. 2005, 71, 2303–2309. [Google Scholar] [CrossRef]
- Teira, E.; Van Aken, H.; Veth, C.; Herndl, G.J. Archaeal uptake of enantiomeric amino acids in the meso-and bathypelagic waters of the North Atlantic. Limnol. Oceanogr. 2006, 51, 60–69. [Google Scholar] [CrossRef]
- Del Giorgio, P.A.; Gasol, J.M. Physiological structure and single-cell activity in marine bacterioplankton. In Microbial Ecology of the Oceans, 2nd ed.; Kirchman, D.L., Ed.; John Wiley & Sons, Inc.: New York, NY, USA, 2008; pp. 243–285. [Google Scholar]
- Nagata, T.; Fukuda, H.; Fukuda, R.; Koike, I. Bacterioplankton distribution and production in deep Pacific waters: Large-scale geographic variations and possible coupling with sinking particle fluxes. Limnol. Oceanogr. 2000, 45, 426–435. [Google Scholar] [CrossRef]
- Tholosan, O.; Garcin, J.; Bianchi, A. Effects of hydrostatic pressure on microbial activity through a 2000 m deep water column in the NW Mediterranean Sea. Mar. Ecol. Prog. Ser. 1999, 183, 49–57. [Google Scholar] [CrossRef]
- La Ferla, R.; Azzaro, M.; Caruso, G.; Monticelli, L.S.; Maimone, G.; Zaccone, R.; Packard, T.T. Prokaryotic abundance and heterotrophic metabolism in the deep Mediterranean Sea. Adv. Oceanogr. Limnol. 2010, 1, 143–166. [Google Scholar] [CrossRef]
- Yokokawa, T.; De Corte, D.; Sintes, E.; Herndl, G.J. Spatial patterns of bacterial abundance, activity and community composition in relation to water masses in the eastern Mediterranean Sea. Aquat. Microb. Ecol. 2010, 59, 185–195. [Google Scholar] [CrossRef] [Green Version]
- Del Giorgio, P.A.; Gasol, J.M.; Vaqué, D.; Mura, P.; Agustí, S.; Duarte, C.M. Bacterioplankton community structure: Protists control net production and the proportion of active bacteria in a coastal marine community. Limnol. Oceanogr. 1996, 41, 1169–1179. [Google Scholar] [CrossRef]
- Šolić, M.; Krstulović, N.; Kušpilić, G.; Gladan, Ž.N.; Bojanić, N.; Šestanović, S.; Šantić, D.; Ordulj, M. Changes in microbial food web structure in response to changed environmental trophic status: A case study of the Vranjic Basin (Adriatic Sea). Mar. Environ. Res. 2010, 70, 239–249. [Google Scholar] [CrossRef] [PubMed]
- Cottrell, M.T.M.; Mannino, A.; Kirchman, D.L. Aerobic anoxygenic phototrophic bacteria in the Mid-Atlantic Bight and the North Pacific Gyre. Appl. Environ. Microbiol. 2006, 72, 557–564. [Google Scholar] [CrossRef] [PubMed]
- Lami, R.; Cottrell, M.; Ras, J.; Ulloa, O.; Obernosterer, I.; Claustre, H.; Kirchman, D.L.; Lebaron, P. High abundances of aerobic anoxygenic photosynthetic bacteria in the South Pacific Ocean. Appl. Environ. Microbiol. 2007, 73, 4198–4205. [Google Scholar] [CrossRef] [PubMed]
- Lami, R.; Čuperová, Z.; Ras, J.; Lebaron, P.; Koblížek, M. Distribution of free-living and particle-attached aerobic anoxygenic phototrophic bacteria in marine environments. Aquat. Microb. Ecol. 2009, 55, 31–38. [Google Scholar] [CrossRef]
- Hojerová, E.; Mašín, M.; Brunet, C.; Ferrera, I.; Gasol, J.M.; Koblížek, M. Distribution and growth of aerobic anoxygenic phototrophs in the Mediterranean Sea. Environ. Microbiol. 2011, 13, 2717–2725. [Google Scholar] [CrossRef] [PubMed]
- Lamy, D.; Jeanthon, C.; Cottrell, M.T.; Kirchman, D.L.; Wambeke, F.V.; Ras, J.; Dahan, O.; Pujo-Pay, M.; Oriol, L.; Bariat, L.; et al. Ecology of aerobic anoxygenic phototrophic bacteria along an oligotrophic gradient in the Mediterranean Sea. Biogeosciences 2011, 8, 973–985. [Google Scholar] [CrossRef] [Green Version]
- Jiao, N.; Zhang, Y.; Zeng, Y.; Hong, N.; Liu, R.; Chen, F.; Wang, P. Distinct distribution pattern of abundance and diversity of aerobic anoxygenic phototrophic bacteria in the global ocean. Environ. Microbiol. 2007, 9, 3091–3099. [Google Scholar] [CrossRef]
- Ritchie, A.E.; Johnson, Z.I. Abundance and genetic diversity of aerobic anoxygenic phototrophic bacteria of coastal regions of the Pacific Ocean. Appl. Environ. Microbiol. 2012, 78, 2858–2866. [Google Scholar] [CrossRef]
- Ferrera, I.; Borrego, C.M.; Salazar, G.; Gasol, J.M. Marked seasonality of aerobic anoxygenic phototrophic bacteria in the coastal NW Mediterranean Sea as revealed by cell abundance, pigment concentration and pyrosequencing of pufM gene. Environ. Microbiol. 2014, 16, 2953–2965. [Google Scholar] [CrossRef]
- Yutin, N.; Suzuki, M.T.; Teeling, H.; Weber, M.; Venter, J.C.; Rusch, D.B.; Béjà, O. Assessing diversity and biogeography of aerobic anoxygenic phototrophic bacteria in surface waters of the Atlantic and Pacific Oceans using the Global Ocean Sampling expedition metagenomes. Environ. Microbiol. 2007, 9, 1464–1475. [Google Scholar] [CrossRef]
- Ferrera, I.; Gasol, J.M.; Sebastián, M.; Hojerová, E.; Koblížek, M. Growth rates of aerobic anoxygenic phototrophic bacteria as compared to other bacterioplankton groups in coastal Mediterranean waters. Appl. Environ. Microbiol. 2011, 77, 7451–7458. [Google Scholar] [CrossRef]
- Ferrera, I.; Sarmento, H.; Priscu, J.C.; Chiuchiolo, A.; González, J.M.; Grossart, H.P. Diversity and distribution of freshwater aerobic anoxygenic phototrophic bacteria across a wide latitudinal gradient. Front. Microbiol. 2017, 8, 175. [Google Scholar] [CrossRef]
- Kirchman, D.L.; Stegman, M.R.; Nikrad, M.P.; Cottrell, M.T. Abundance, size, and activity of aerobic anoxygenic phototrophic bacteria in coastal waters of the West Antarctic Peninsula. Aquat. Microb. Ecol. 2014, 73, 41–49. [Google Scholar] [CrossRef]
- Andersen, P.; Sorensen, H.M. Population dynamics and trophic coupling in pelagic microorganisms in eutrophic coastal waters. Mar. Ecol. Prog. Ser. 1986, 33, 99–109. [Google Scholar] [CrossRef]
- Gonzalez, J.M.; Sherr, E.B.; Sherr, B.F. Size-selective grazing on bacteria by natural assemblages of estuarine flagellates and ciliates. Appl. Environ. Microb. 1990, 56, 583–589. [Google Scholar] [Green Version]
- Šimek, K.; Chrzanowski, T.H. Direct and indirect evidence of size-selective grazing on pelagic bacteria by freshwater nanoflagellates. Appl. Environ. Microbiol. 1992, 58, 3715–3720. [Google Scholar]
- Corinaldesi, C.; Crevatin, E.; Del Negro, P.; Marini, M.; Russo, A.; Fonda-Umani, S.; Danovaro, R. Large-scale spatial distribution of virioplankton in the Adriatic Sea: Testing the trophic state control hypothesis. Appl. Environ. Microbiol. 2003, 69, 2664–2673. [Google Scholar] [CrossRef]
- Weinbauer, M.G.; Brettar, I.; Höfle, M.G. Lysogeny and virus-induced mortality of bacterioplankton in surface, deep, and anoxic marine waters. Limnol. Oceanogr. 2003, 48, 1457–1465. [Google Scholar] [CrossRef] [Green Version]
- Magagnini, M.; Corinaldesi, C.; Monticelli, L.S.; De Domenico, E.; Danovaro, R. Viral abundance and distribution in mesopelagic and bathypelagic waters of the Mediterranean Sea. Deep Sea Res. Part I Oceanogr. Res. Pap. 2007, 54, 1209–1220. [Google Scholar] [CrossRef]
- Magiopoulos, I.; Pitta, P. Viruses in a deep oligotrophic sea: Seasonal distribution of marine viruses in the epi-, meso-and bathypelagic waters of the Eastern Mediterranean Sea. Deep Sea Res. Part I Oceanogr. Res. Pap. 2012, 66, 1–10. [Google Scholar] [CrossRef]
- Ordulj, M.; Krstulović, N.; Šantić, D.; Jozić, S.; Šolić, Μ. Distribution of marine viruses in the Central and South Adriatic Sea. Mediterr. Mar. Sci. 2015, 16, 65–72. [Google Scholar] [CrossRef]
- Winter, C.; Köstner, N.; Kruspe, C.P.; Urban, D.; Muck, S.; Reinthaler, T.; Herndl, G.J. Mixing alters the lytic activity of viruses in the dark ocean. Ecology 2018, 99, 700–713. [Google Scholar] [CrossRef]
- Baudoux, A.C.; Veldhuis, M.J.; Witte, H.J.; Brussaard, C.P. Viruses as mortality agents of picophytoplankton in the deep chlorophyll maximum layer during IRONAGES III. Limnol. Oceanogr. 2007, 52, 2519–2529. [Google Scholar] [CrossRef]


© 2019 by the authors. Licensee MDPI, Basel, Switzerland. This article is an open access article distributed under the terms and conditions of the Creative Commons Attribution (CC BY) license (http://creativecommons.org/licenses/by/4.0/).
Share and Cite
Šantić, D.; Kovačević, V.; Bensi, M.; Giani, M.; Vrdoljak Tomaš, A.; Ordulj, M.; Santinelli, C.; Šestanović, S.; Šolić, M.; Grbec, B. Picoplankton Distribution and Activity in the Deep Waters of the Southern Adriatic Sea. Water 2019, 11, 1655. https://doi.org/10.3390/w11081655
Šantić D, Kovačević V, Bensi M, Giani M, Vrdoljak Tomaš A, Ordulj M, Santinelli C, Šestanović S, Šolić M, Grbec B. Picoplankton Distribution and Activity in the Deep Waters of the Southern Adriatic Sea. Water. 2019; 11(8):1655. https://doi.org/10.3390/w11081655
Chicago/Turabian StyleŠantić, Danijela, Vedrana Kovačević, Manuel Bensi, Michele Giani, Ana Vrdoljak Tomaš, Marin Ordulj, Chiara Santinelli, Stefanija Šestanović, Mladen Šolić, and Branka Grbec. 2019. "Picoplankton Distribution and Activity in the Deep Waters of the Southern Adriatic Sea" Water 11, no. 8: 1655. https://doi.org/10.3390/w11081655