METRIC and WaPOR Estimates of Evapotranspiration over the Lake Urmia Basin: Comparative Analysis and Composite Assessment


1
Department of Hydrology and Atmospheric Sciences, University of Arizona, Tucson, AZ 210011, USA
2
Remote Sensing Research Center, Sharif University of Technology, Tehran 11155, Iran
3
Department of Civil Engineering, Sharif University of Technology, Tehran 11155, Iran
*
Author to whom correspondence should be addressed.
Water 2019, 11(8), 1647; https://doi.org/10.3390/w11081647
Submission received: 30 June 2019
/
Revised: 5 August 2019
/
Accepted: 7 August 2019
/
Published: 9 August 2019
(This article belongs to the Special Issue Evapotranspiration and Plant Irrigation Strategies)
Abstract
:Evapotranspiration is one of the main components of water and energy balance. In this study, we compare two ET products, suitable for regional analysis at high spatial resolution: The recent WaPOR product developed by FAO and METRIC algorithm. WaPOR is based on ETLook, which is a two-source model and relies on microwave images. WaPOR is unique as it has no limitation under cloudy days, but METRIC is limited by clouds. METRIC and WaPOR are more sensitive to land surface temperature and soil moisture, respectively. Using two years (2010 and 2014) of data over Lake Urmia basin, we show that in most areas, ET from METRIC is higher than WaPOR and the difference has an ascending trend with the elevation. The ET of lysimeter station is fairly consistent with METRIC based on a single observation. Our analysis using NDVI and land use maps suggests that the histogram of ET from WaPOR might be more realistic than METRIC, but not its amount. The fraction of ET to precipitation in rainfed agriculture areas shows that WaPOR is more accurate than METRIC, mainly because in the absence of other water resources such as ground water annual ET cannot exceed annual precipitation. In contrast, METRIC produces a more realistic estimate than WaPOR over irrigated farms. The results suggest that the two products can complement each other.
Keywords:
evapotranspiration; WaPOR; METRIC; ETLook; Lake Urmia; remote sensing; MODIS; lysimeter; water consumption; irrigation1. Introduction
The economic, agricultural and social development of a region is affected by the proper management of its water resources. Planning and management of water consumption in the basin area require knowledge of the hydrological behavior of the system, including the temporal and spatial variation of important components like actual ET in that basin. ET is important in irrigation management [1], drought monitoring [2,3], water storage [4], water balance [5], water productivity [6] and groundwater management [7,8,9]. Therefore, considering methods that estimate actual ET accurately is required.
The estimation of ET is difficult due to its complex nature. There are various methods for estimating this component. Remote sensing-based methods are more popular than classic (in situ) ones because of their wide coverage and comparability with numerical climate models. Jackson et al., through the infrared thermometer in the wheat field in the state of Arizona, discussed the importance of using remote sensing to estimate ET [10]. Different methods have been developed to combine satellite imagery with ground data [11]. Subsequent studies in this field have led to the development of a Surface Energy Balance Algorithms for Land (SEBAL) in the 1990s as one of the new methods for estimating actual ET [12].
The SEBAL algorithm is a model based on the empirical and physical relationships that were first used in Egypt and Spain to estimate the ET of agricultural areas by Landsat, and then used extensively in similar studies [13]. Later, METRIC (Mapping Evapotranspiration at high Resolution with Internalized Calibration) was developed by the University of Idaho as a modified version of SEBAL, that used Landsat satellite data to compute and map ET [1]. In another study by Zwart and Bastiaanssen using METRIC and MODIS images of wheat cultivars in Mexico, an error of about 9% was reported over a period of 110 days [14]. Also, Du et al. estimated ET on Sanjiang plain in China using 12 MODIS images [15]. The difference between the actual daily ET and the measurement performed by Eddy Covariance was reported as an average of 10.5%.
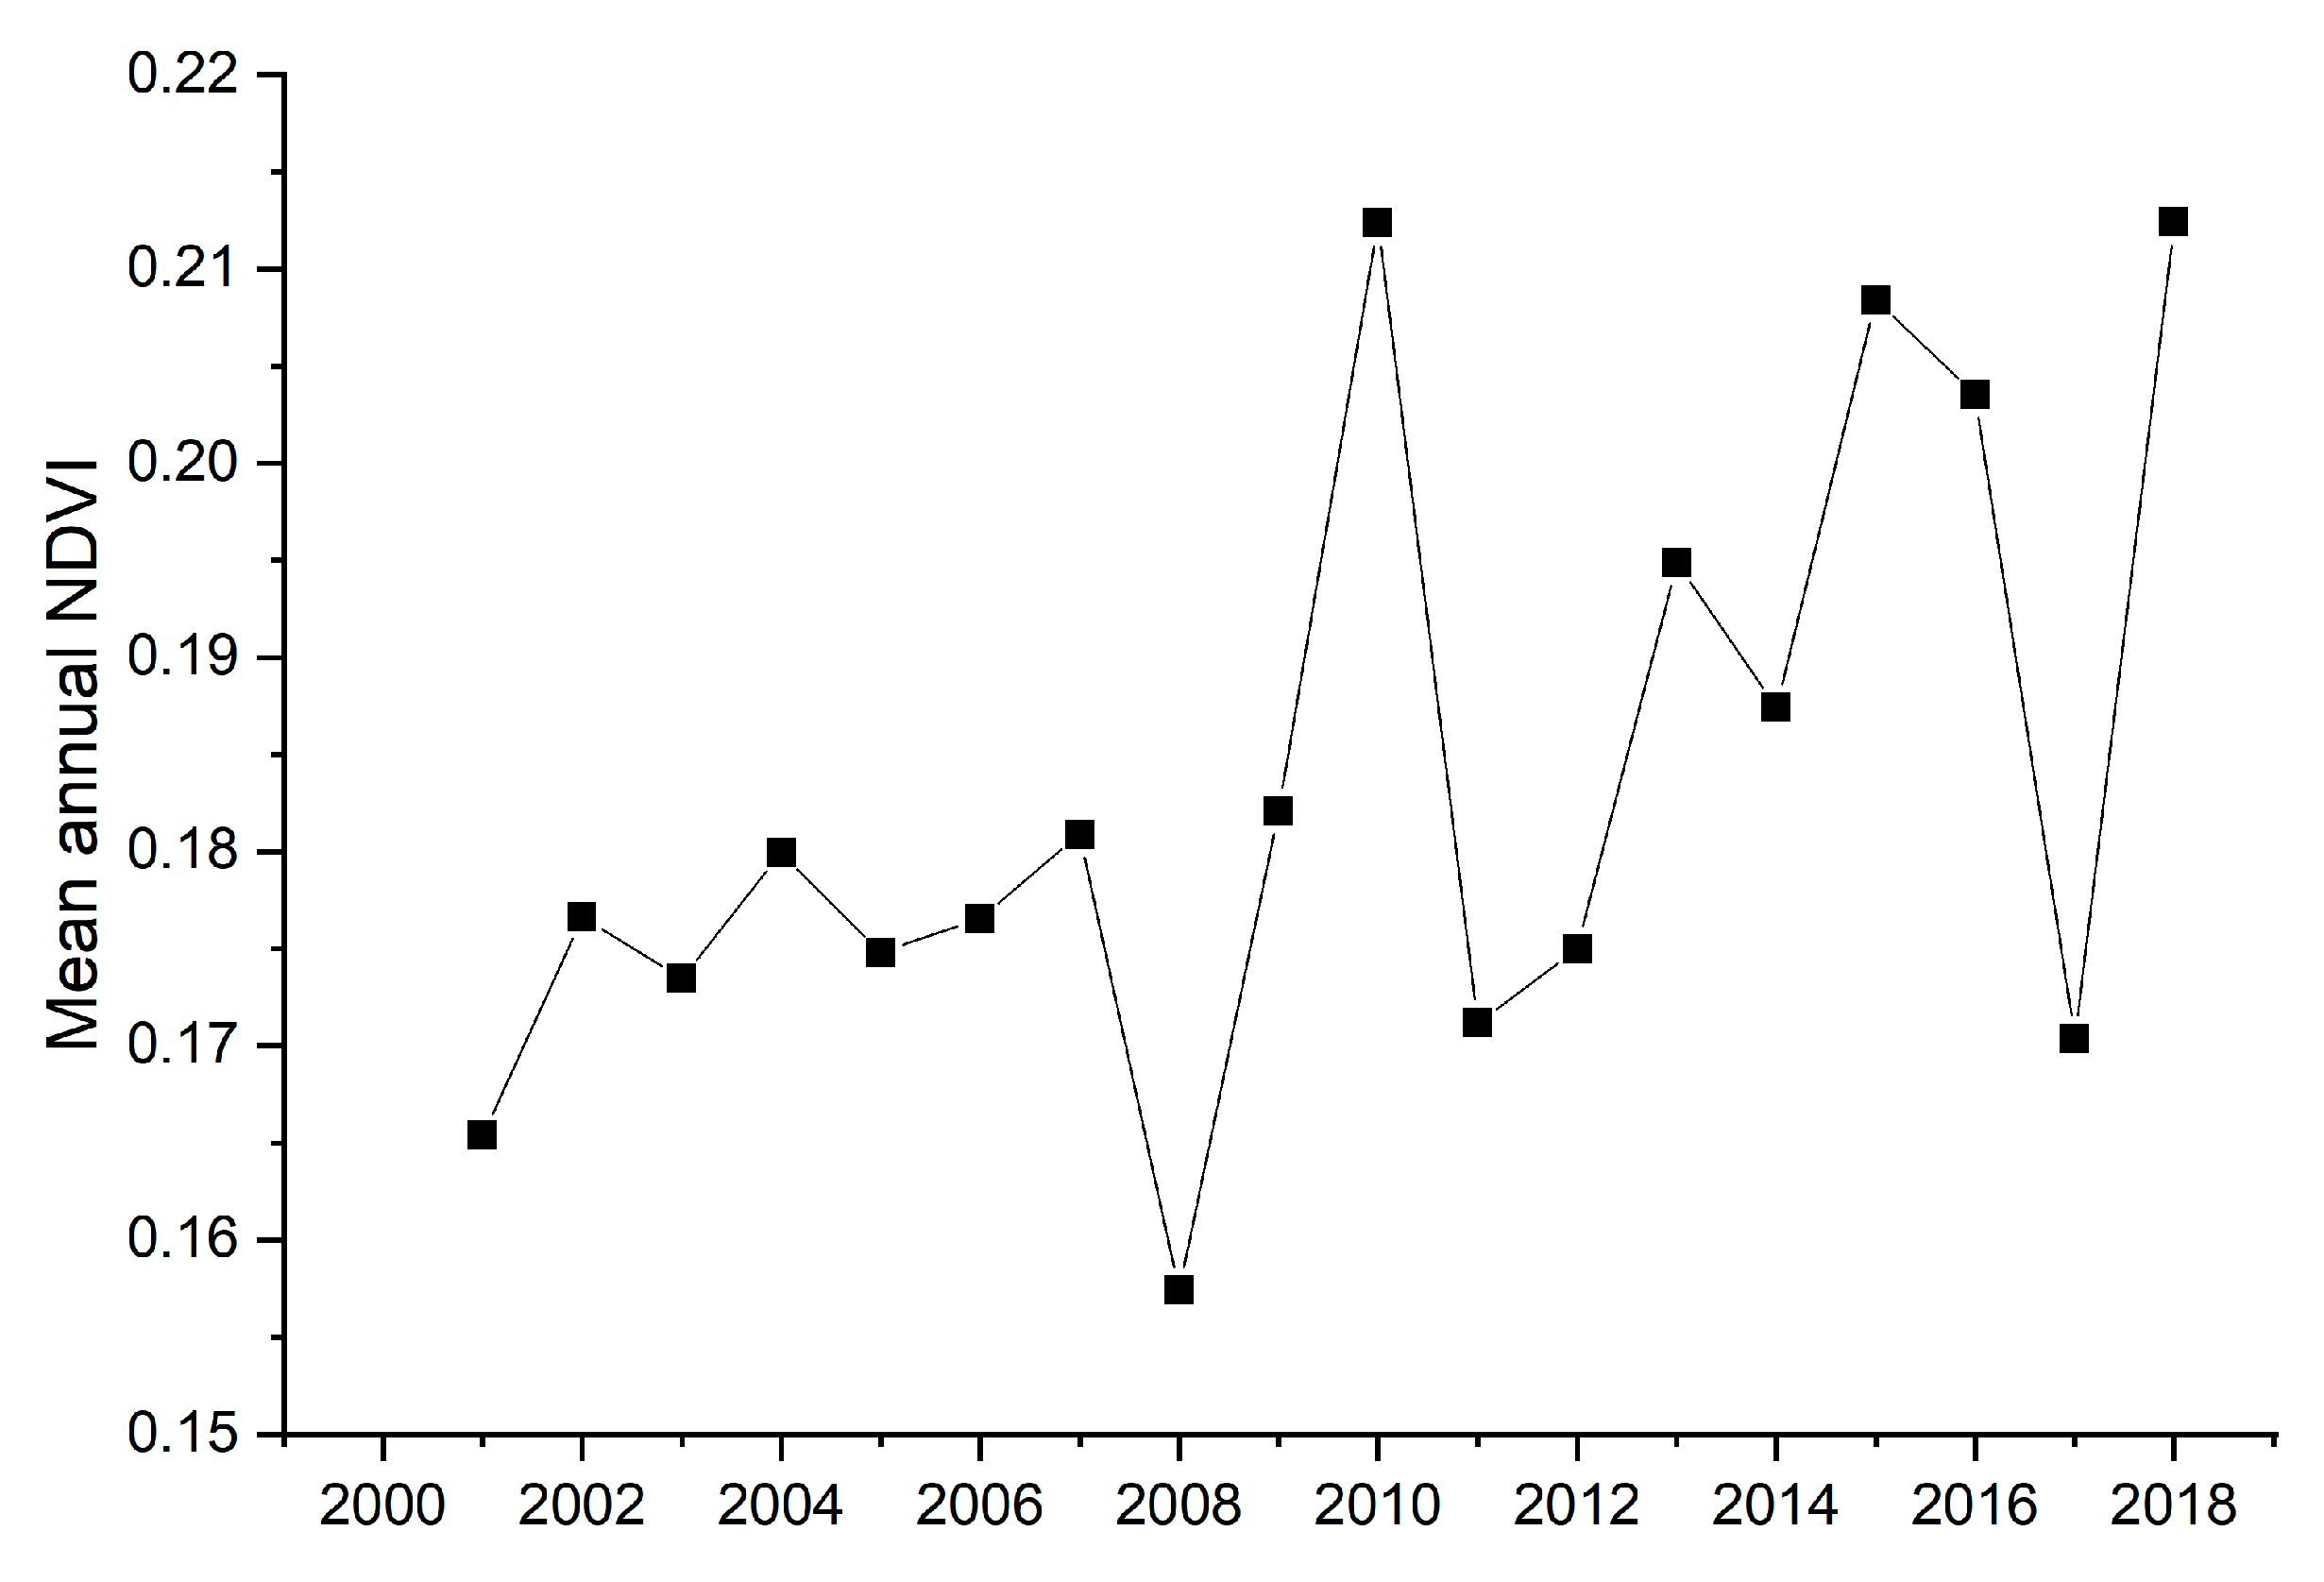
Urmia Lake, largest lake in the Middle East and the sixth-largest saltwater lake on Earth, has shrunk dramatically in the last two decades mainly because of the increasing agricultural water consumption in the basin (Figure A1) [16,17,18]. Hesami and Amini demonstrated that the total irrigated area in the basin increased by 20% between 1989 and 2000 and the water use change in the area was 35%. In arid and semi-arid regions, water used for irrigation is highly correlated with evapotranspiration [19]. Various studies have been conducted on the estimation of actual ET in the Urmia Lake Basin. In a study by Iran Water Research Institute, the actual ET was estimated using the SEBAL algorithm and the NOAA-AVHRR images on an annual scale for a dry and wet periods and it was shown that SEBAL can perform well with different satellites [20]. In another study, the SEBAL algorithm used for estimating water budget in the Lake Urmia basin [21]. The output was that SEBAL algorithm works well for this purpose [21]. Estimating agricultural water consumption in the Lake Urmia basin is an important issue. Taheri et al. estimated actual ET in the Lake Urmia basin from METRIC, in order to estimate the agricultural irrigation water requirement. They found that all climatic factors and human activities in the Lake Urmia basin led to increase in agricultural water consumption [22].
Most of energy balance models such as METRIC require thermal infrared band taken from cloud-free and corrected images to produce land surface temperature maps [23]. As a result, cloudy images reduce the accuracy in the results. The ETLook algorithm uses soil moisture extracted from the passive microwave sensor instead of the land surface temperature. Microwave data provide surface information even in cloudy days, because they are less affected by cloud cover [24]. Few studies have been conducted on this algorithm. Bastiaanssen et al. introduced ETLook in the Indus basin [25]. The results showed that the algorithm has a good accuracy in these areas and even shows up great on cloudy days.
The United Nations World Food and Agriculture Organization (FAO) developed the “Free Access Water Productivity System “, aims to cover countries that are facing water crisis in Africa and the Middle East. Actual ET from WaPOR is one of the most important products of this system, which provides an annual and 10-day spatial mapping with 250 m pixel size for the 2009–2016 period using the ETLook algorithm (http://www.fao.org/in-action/remote-sensing-for-water-productivity/wapor/). Since the public availability of WaPOR product (i.e., 2017), we are not aware of any published evaluation study over the Middle East and Africa, although such studies are urgently needed given the large uncertainties of ET estimates over these regions and the need for alternative estimates.
Given that METRIC approach has been a popular method to estimate actual ET over Urmia Lake basin, comparison of METRIC with WaPOR can shed light onto differences that WaPOR might bring to actual ET analysis over the region. In this study, we first calculate the actual ET values using the METRIC algorithm applied to MODIS images for the Urmia Lake Basin in year 2010 (representing a dry year in the basin) and 2014 (representing a normal year), and then these values are compared with the actual ET of WaPOR product in the Lake Urmia basin and the differences between them are analyzed as a function of elevation, land cover, and sub-basin. We used the only available lysimeter over the study region and water consumption measurements in an irrigation network system to complement our analysis.
2. Materials and Methods
2.1. Study Area
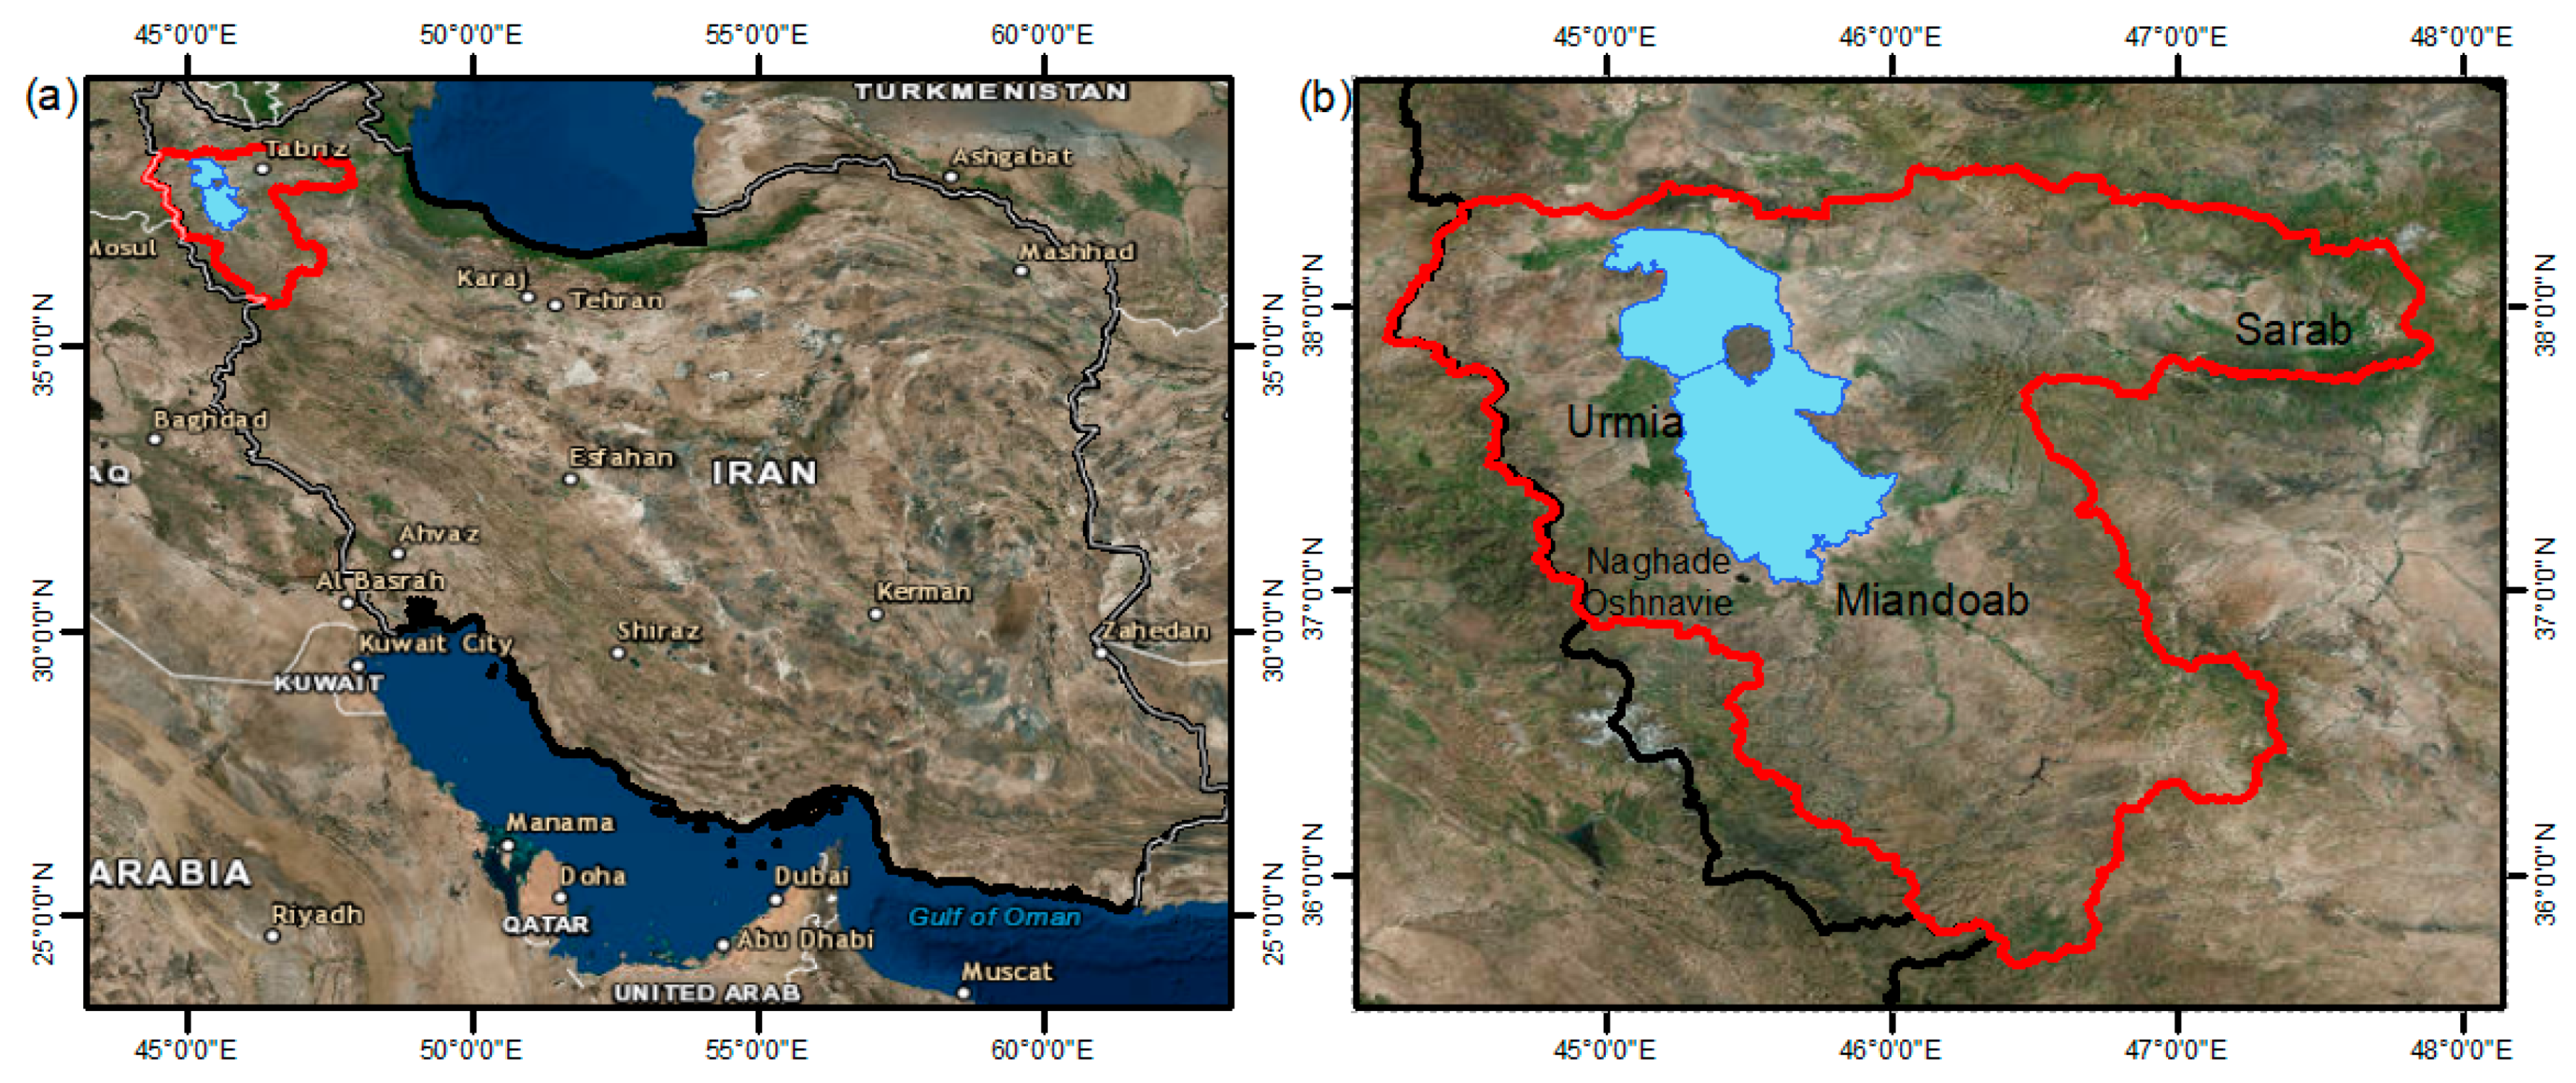
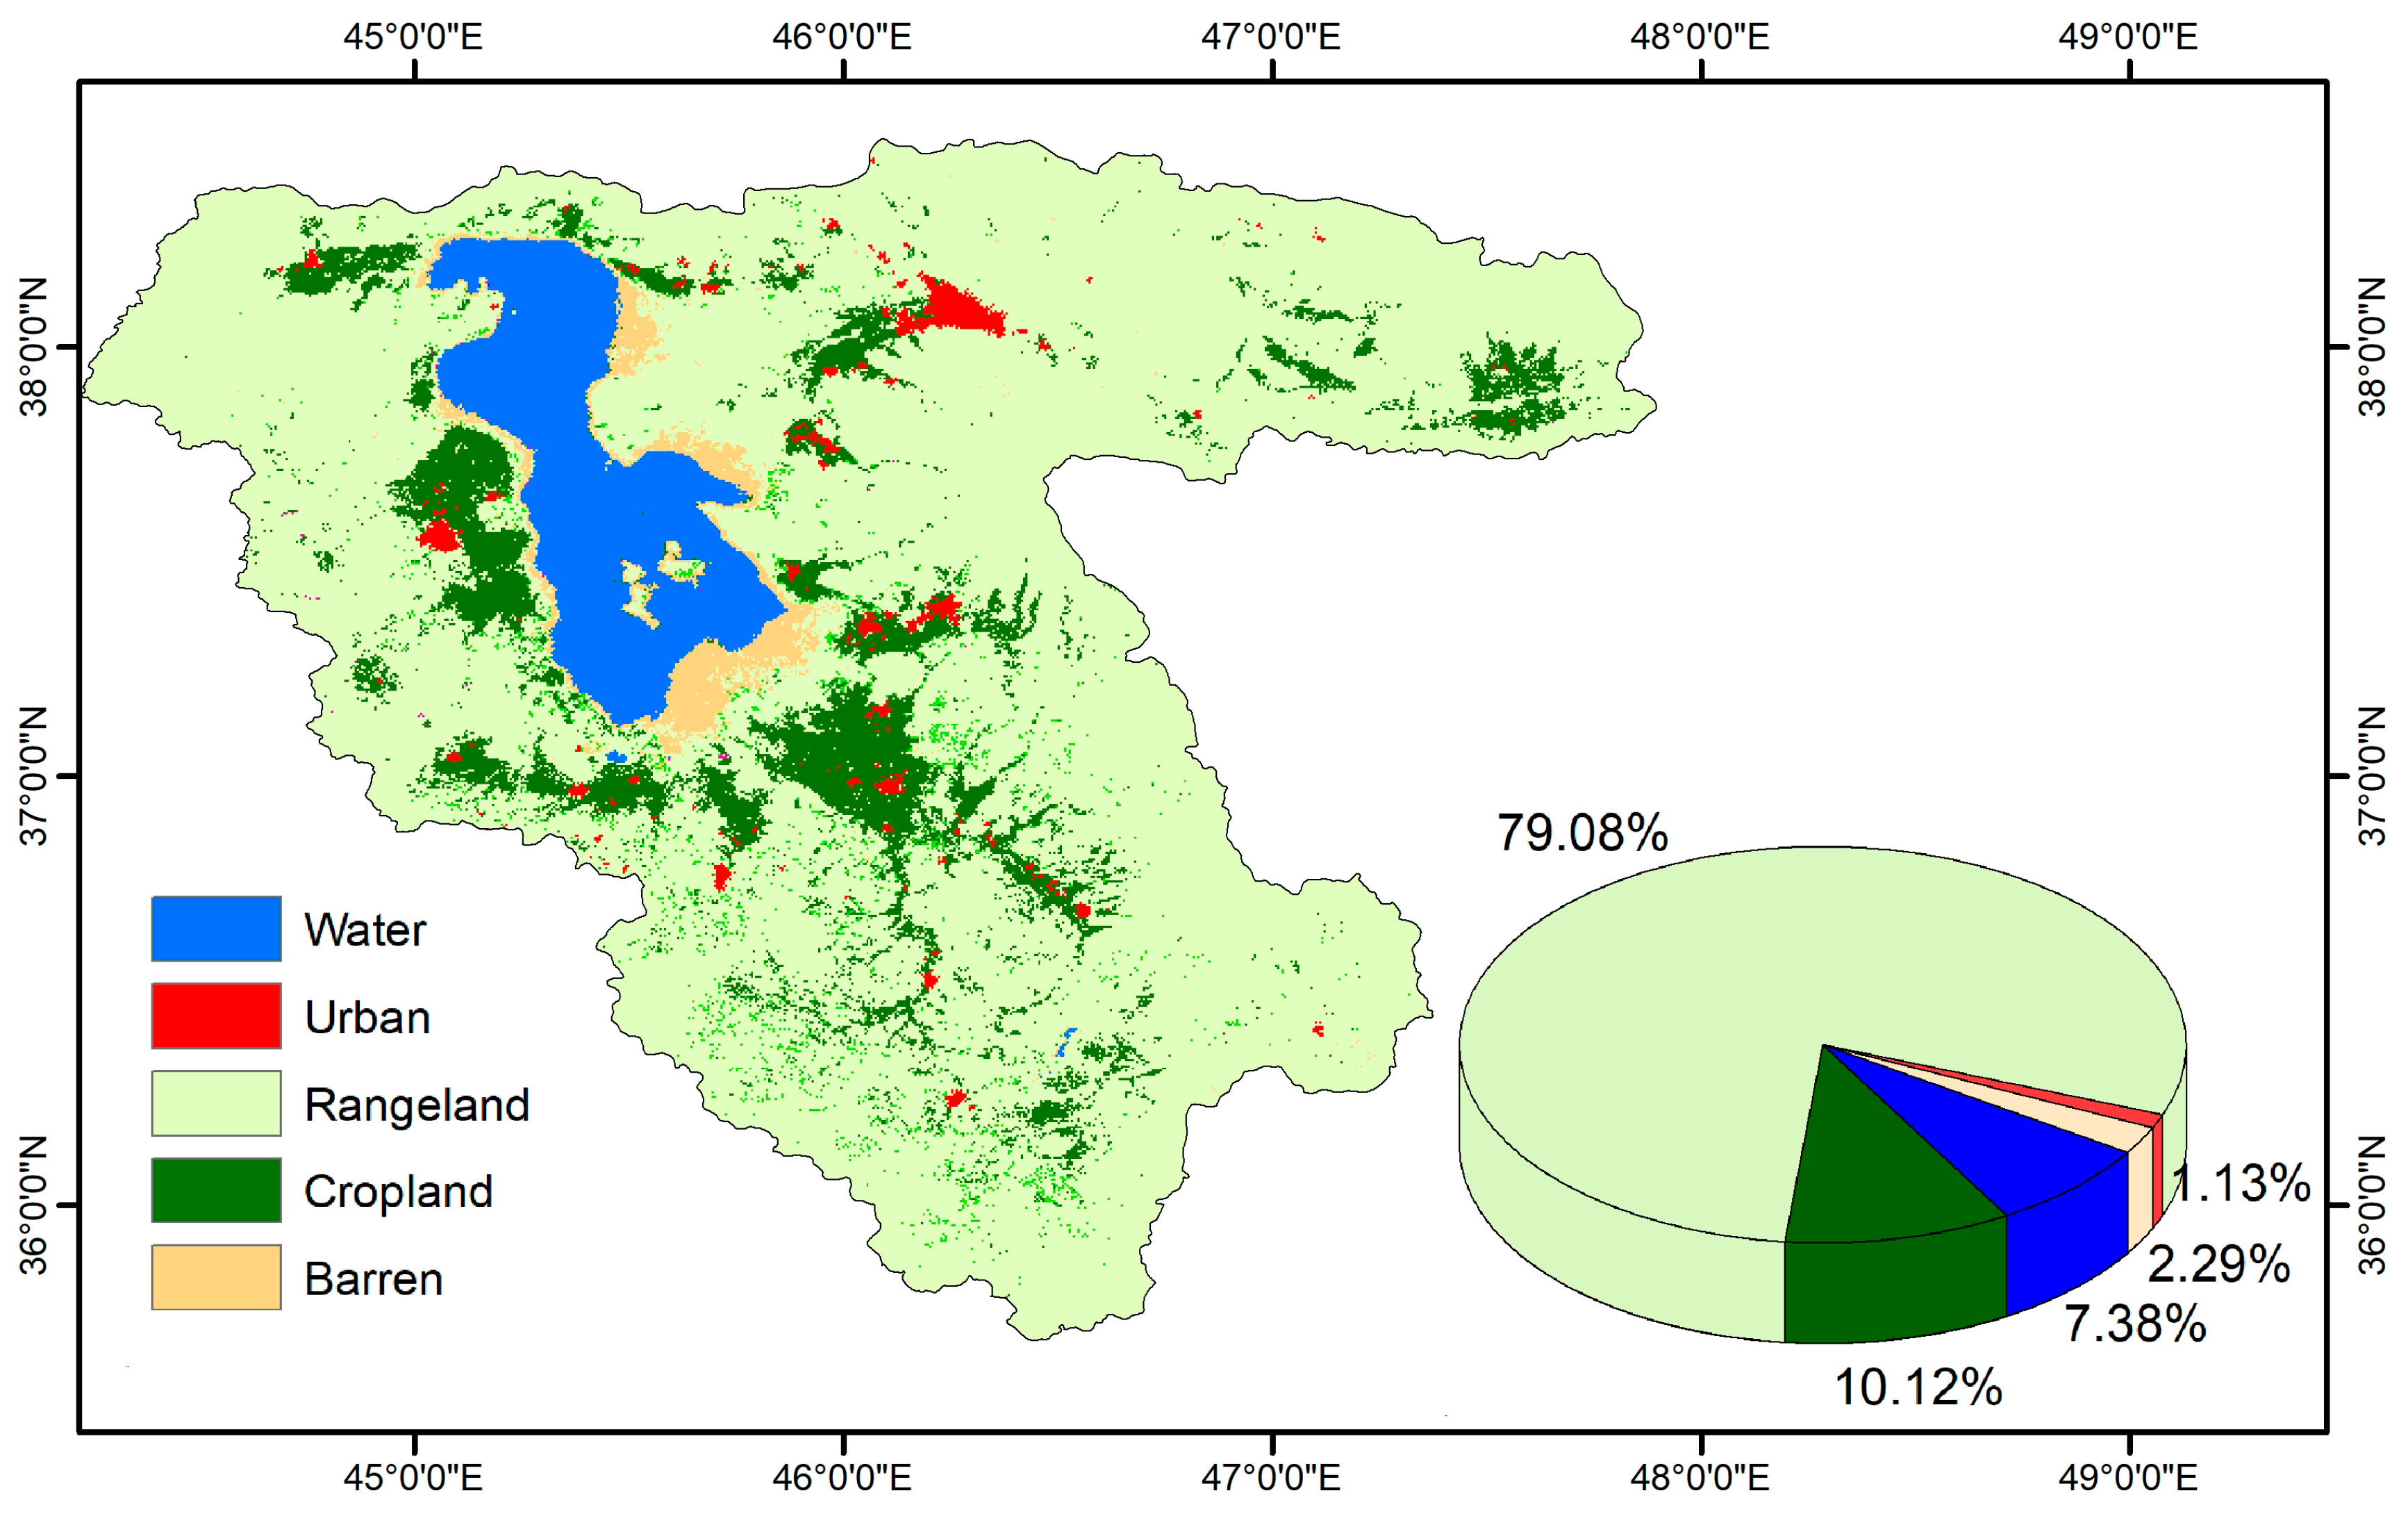
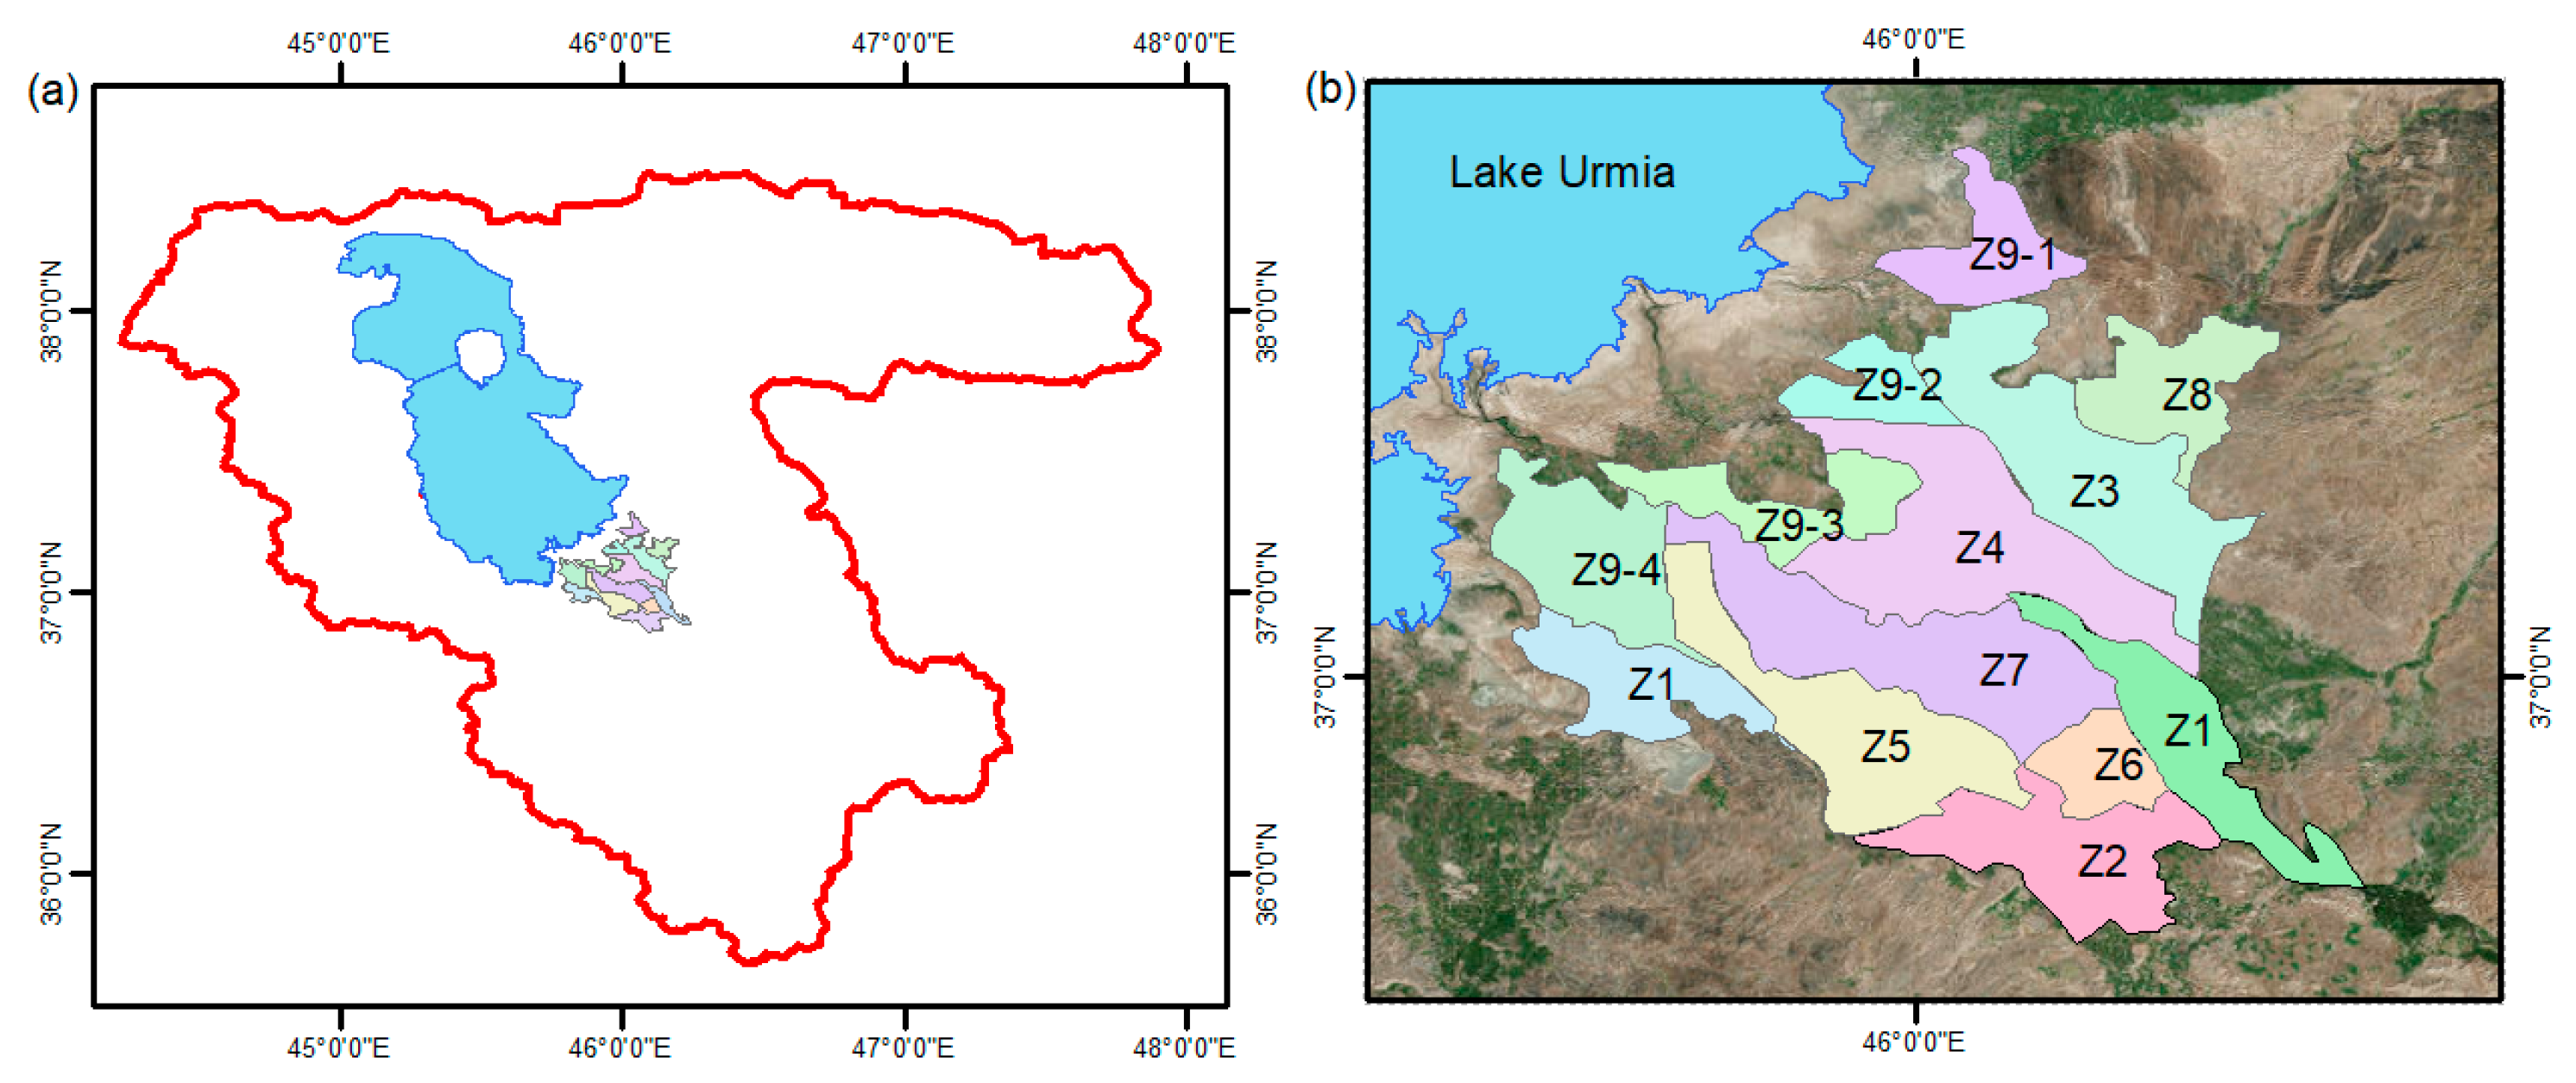
The Urmia Lake basin in the northwest of Iran is located at the coordinates of 44°13′ to 47°53′ E and 41°35′ to 38°30′ N. Based on the division of the country’s basin area, the Urmia Lake basin is one of the six main basin areas of the country. The total area of the basin is 51,758 km2, about half of the province of West Azerbaijan, a large part of the province of East Azerbaijan and part of Kurdistan province (Figure 1). Water, urban, rangeland, cropland and barren include 7, 1, 79, 10 and 2 percent of the entire basin respectively (Figure 2).
The vast part of the Urmia Lake basin is plain and located at an altitude between 1280 and 2000 m. As a result, the climatic conditions of this area, such as the characteristics of mid-latitudes, are relatively moderate with cold winters and mild summers. The average annual precipitation and air temperature in the basin are about 350 mm and 12 °C, respectively (Figure 3).
2.2. Datasets
2.2.1. Ground Data
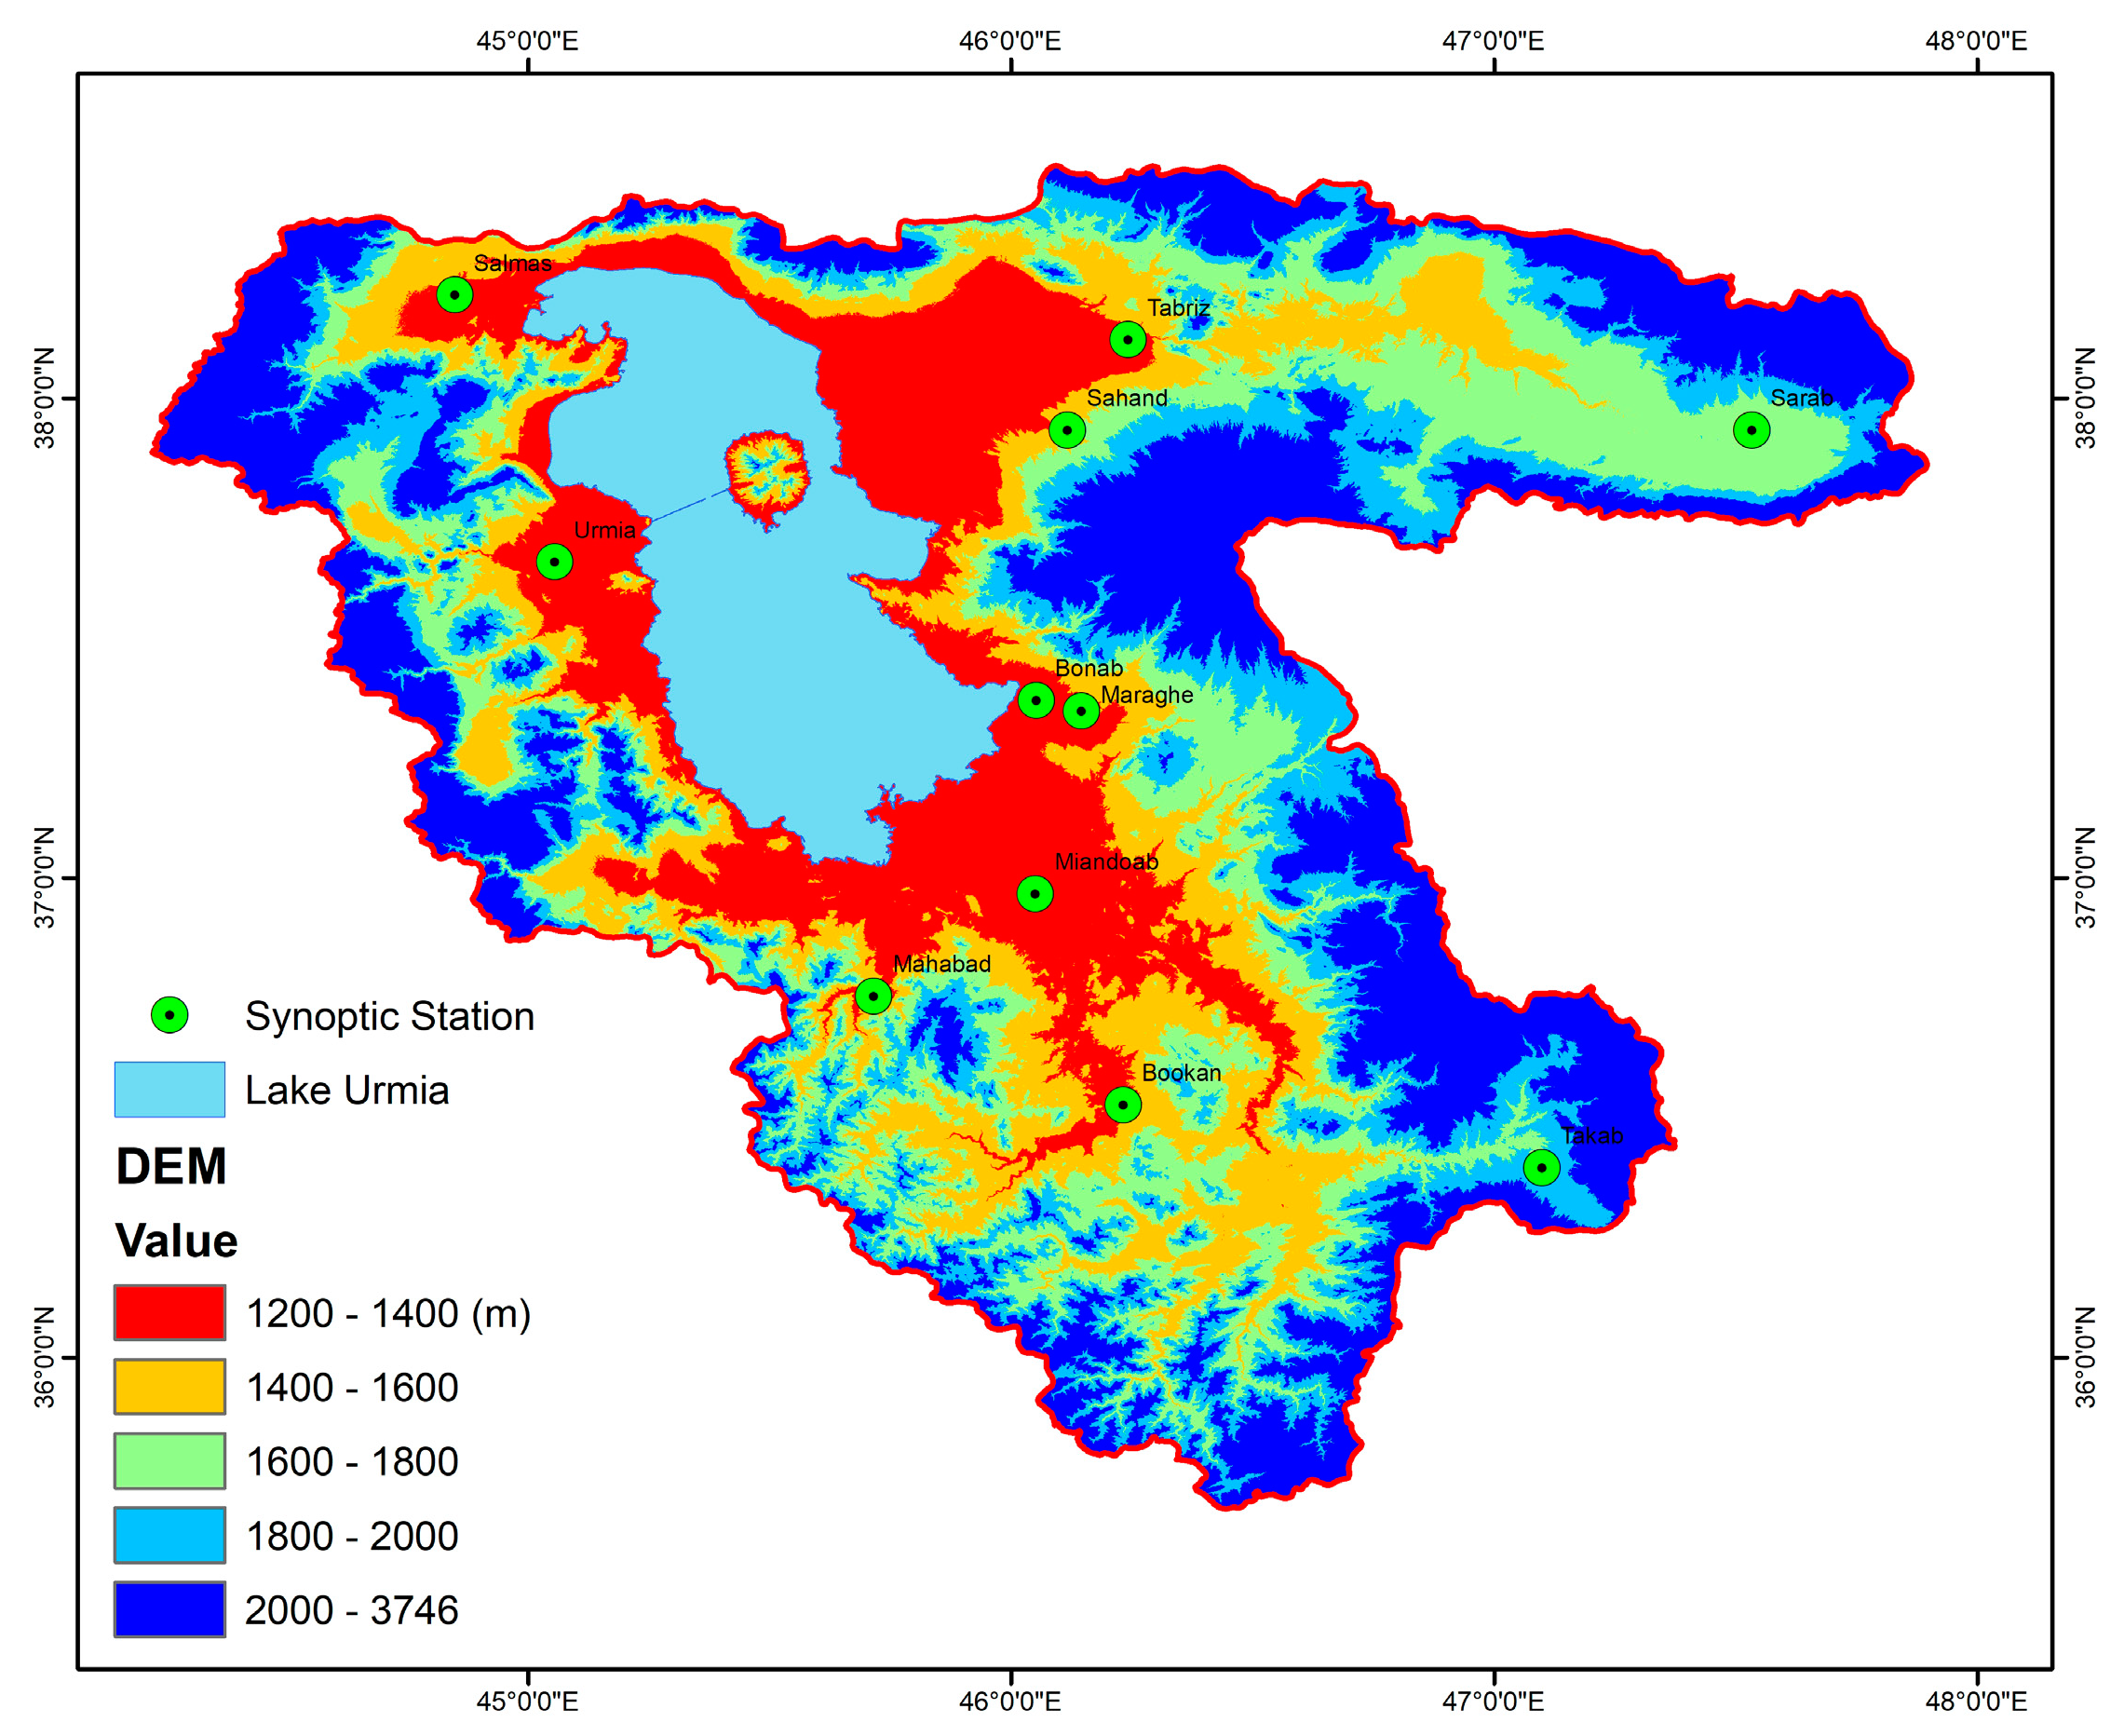
The ground data used in this study are obtained from the Urmia Synoptic Station meteorological data (for 2010 and 2014; Figure 4). The synoptic-station data used in this study include daily minimum, maximum and average air temperature (°C), wind speed (m/s), vapor pressure (bar), air pressure (bar), relative humidity (percent), and the sunshine hours (hour).
2.2.2. Satellite Data
In this study, a number of MODIS products (between two to four images per month), along with land data throughout the year, have been used for retrieving ET using METRIC. Table 1 shows a list of data received from the EARTHDATA portal (https://earthdata.nasa.gov/). Due to the need for cloud-free images in the METRIC algorithm, all images that have more than 5% cloudiness in the entire basin from April to October and 20% cloudiness from November to March were discarded. Larger errors are expected in identifying cloud-free images in the cold months than warm months. Therefore, the threshold for the cold months are further relaxed. The fraction of cloudiness was obtained from MOD10A2 product.
2.2.3. Precipitation Map
Precipitation data is used for comparison of annual ET and annual precipitation in rainfed areas. The annual precipitation map is made by Cokriging method which used to interpolate 154 stations data. We use DEM layer (due to the rugged topography of the basin) and TRMM 3B43 V7 rainfall data (due to inappropriate distribution of ground stations and their accumulation in the foothills and slopes) as supplementary data to improve precipitation maps. The Tropical Rainfall Measuring Mission (TRMM), a joint mission of NASA and the Japan Aerospace Exploration Agency, was launched in 1997 to study rainfall for different purposes like hydrological and weather research [26]. In TRMM 3B43 V7, Global Precipitation Climatology Project (GPCP) monthly rain gauge data are used for bias correction [26]. The temporal and spatial resolution of this product are monthly and 0.25° degree respectively from the latitude 50° N to 50° S [26].
2.2.4. Land Use/Land Cover Map
One of the parameters influencing the ET and hydrological cycle is land use in the basin. In order to compare the ET, knowledge of the land type is essential. In this study, Land type map of Iran Water Research Institute (2013) was used to understand different uses and evaluate ET in different areas.
2.3. METRIC
In the METRIC model, the actual ET rate is calculated using satellite imagery (in this study, MODIS sensor), meteorological data, and surface energy balance equation. The Earth’s energy balance is estimated using Equation (1):
In the above equation, is the latent heat flux of ET (W/m2), is the net radiation flux at the surface (W/m2), is the ground heat flux (W/m2) and is the sensible heat flux to the atmosphere (W/m2). The components of the equation of energy balance are described below.
2.3.1. Net Radiation (Rn)
The net radiation flux at ground level (Rn) is calculated using the following equation [1]:
In which is net radiation, is the shortwave incoming solar radiation, is longwave downward radiation and is upward longwave radiation (all of the above parameters are in W/m2). and ε0 are albedo and surface emissivity respectively which are unitless [1].
2.3.2. Ground Heat Flux (G)
The heat flux of the ground is the rate of heat storage in the soil and crop due to the heat transfer. METRIC first estimates the ratio using the empirical relationship (Equation (3)) presented by Bastiaanssen [27]:
where is the unmodified surface temperature (°K), α surface albedo and vegetation index [1].
2.3.3. Sensible Heat Flux (H)
The sensible heat flux is the transfer of heat caused by the difference in temperature through convection and transmission. The relationship used to compute this term is as follows [1]:
where is the air density (kg/m3), is the specific heat at a given pressure (1004 J. kg−1.K−1), , the air temperature difference (K) between the two heights of 0.1 and 2 m according to the METRIC instruction, is the aerodynamic resistance to heat transfer (Sday.m−1) [1]. The solution of Equation (4) is difficult due to the existence of two unknown parameters and . To facilitate this calculation, two “cold” and “hot” pixels (in which H can be predicted and dT estimated) are used. The “cold” pixel should be irrigated in a humid place, selected with full vegetation on the ground. In this pixel, it is assumed that the land surface temperature and the air temperature are close. The “hot” pixel should be selected in a dry, non-evaporating area. In this research, we tried to select these two pixels by considering statistical techniques, ground observations, NDVI, LAI and LST layers (Table 2) following the method described in Kjaersgaard et al. [28].
2.3.4. Actual ET
The instantaneous actual ET value can be estimated by below equation [1]:
where is the instantaneous actual ET (mm/h), 3600 conversion units of time from seconds to hours, λ latent heat for evaporation of one kilogram of water (J/kg) and is the water density (equivalent to 1000 Kg.m−3). (W/m2) denotes the latent heat flux of evaporation, which according to Equation (1) is obtained from the difference between G and H from Rn.
Steps to convert the amount of ET to the seasonal period are as follows:
- Determine the length of the desired season
- Determine the period which each satellite image (in that season) is representative of that number of days (regarding maximum cloudiness of 5% in the entire basin from April to October and 20% from November to March)
- Calculate cumulative ETr for the period specified in the previous step (equal to the sum of daily ETr values during this time period
- Calculate cumulative actual ET in each period when it is done according to the following equation:where is the daily ETr, the number of days of the time period and represents the ETrF in that period, calculated from the following equation:
2.4. ETLook
In the ETLook algorithm, the leaf area index is considered separately in calculating the radiation flux related to the soil and the flux of the canopy section. Two types of resistance (surface and aerodynamic resistance) in the Penman–Monteith equation for soil and canopy are also considered, and the outputs of the model include soil evaporation, transpiration and interception. This model has a high sensitivity to soil moisture data, while the METRIC one-source algorithm is more sensitive to surface temperature (LST) [25]. The ETLook algorithm is a two-source model and surface soil moisture is used for the estimation of evaporation, and a parameterization is introduced to compute subsoil moisture content for the determination of transpiration which are shown in Figure 5, Equations (8) and (9) [25]. Actual evapotranspiration is calculated by adding evaporation to transpiration [25].
where E and T are evaporation and transpiration, respectively, in W/m−2, (mbar K−1) is the slope of the saturation vapor pressure curve, (mbar) is vapor pressure deficit, which is the difference between the saturation vapor content and the actual vapor content, and (both in W/m−2) are the net radiations at soil and canopy, respectively; and (both in s/m) are aerodynamic resistances for soil and canopy, respectively.
In the WaPOR product, surface soil moisture is obtained from the Advanced Microwave Scanning Radiometer (AMSR-E) on the Aqua satellite.
Detailed methodology of the ETLook algorithm is described in Bastiaanssen et al. [25].
In this study, firstly, the obtained cloud-free MODIS images were used for running METRIC model, and then these values are compared with the actual ET of WaPOR product in the Lake Urmia basin and the differences between them are analyzed as a function of elevation, land cover, and sub-basin. Furthermore, we used the only available lysimeter over the study region and water consumption measurements in an irrigation network system to complement our analysis.
3. Results and Discussion
3.1. Validation of ET with In-Situ Data
3.1.1. Lysimeter
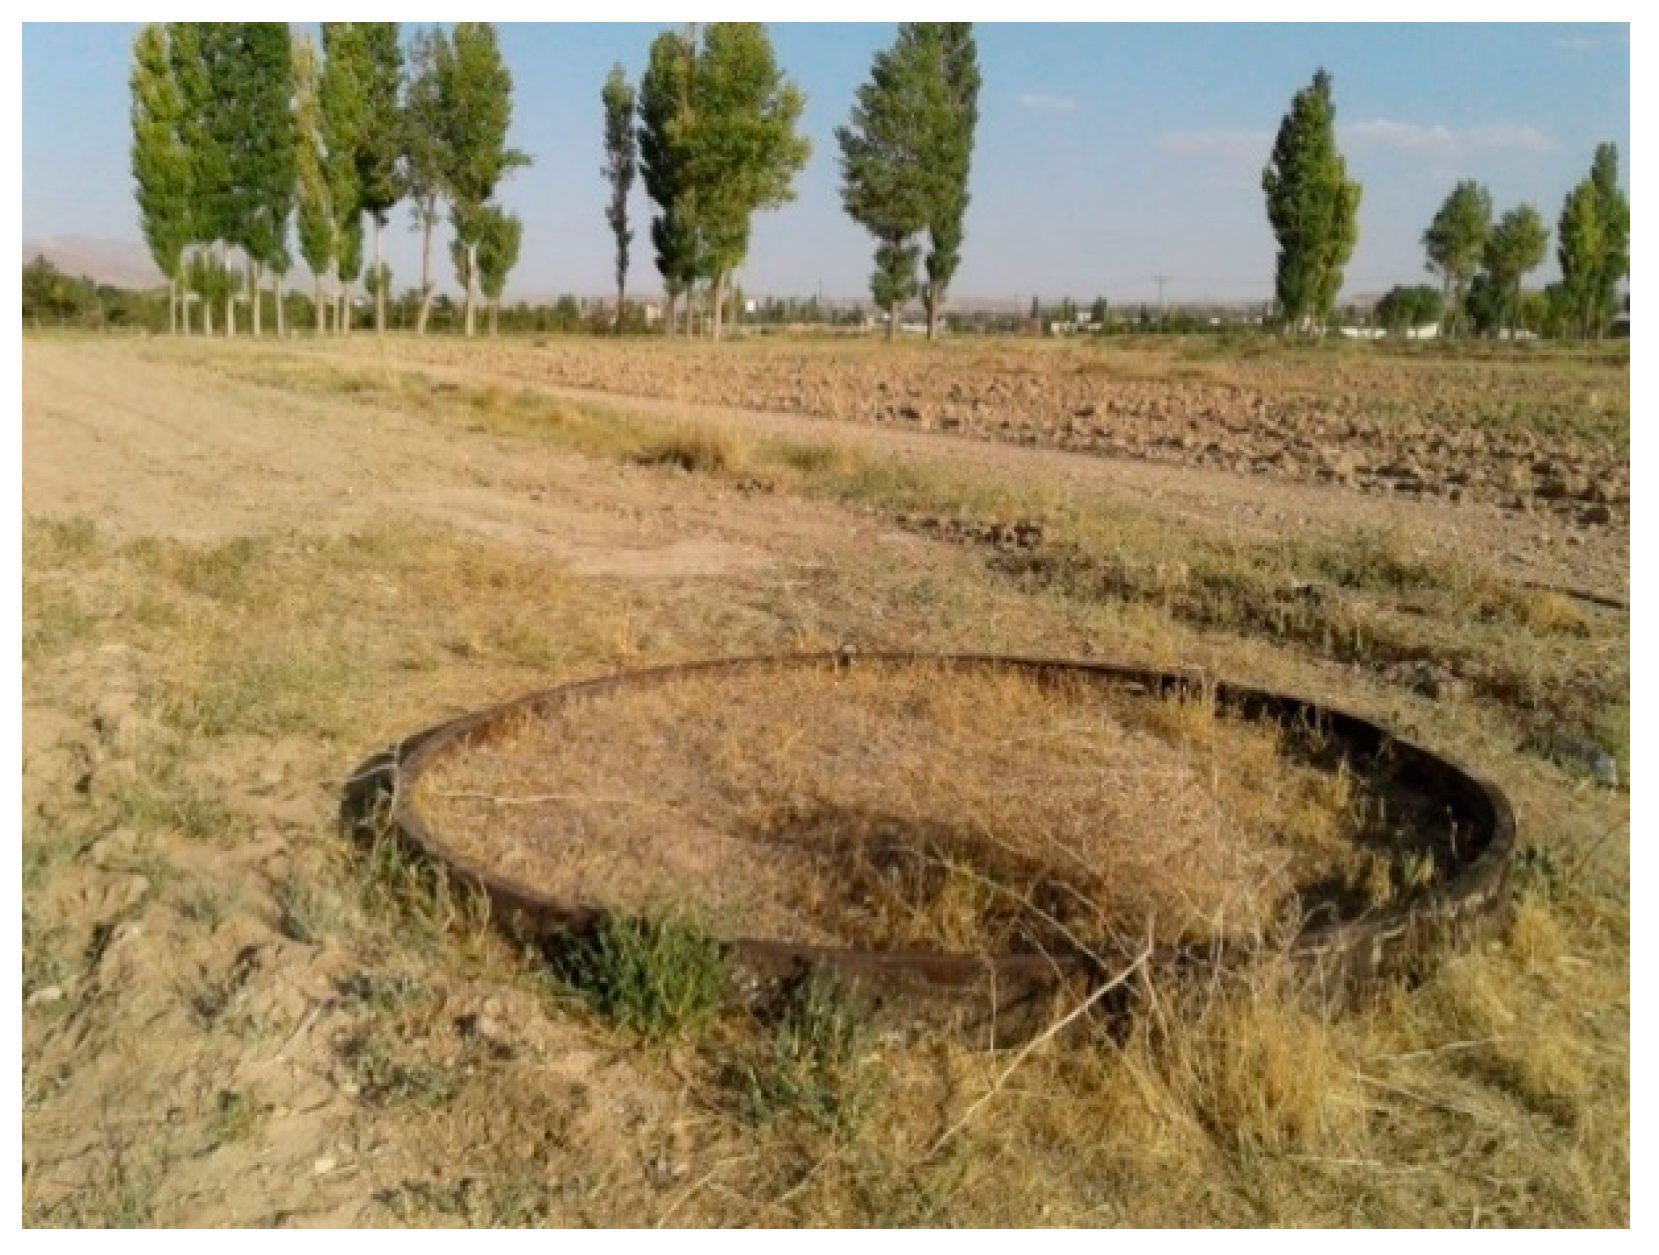
We had limited access to one lysimeter station inside the research farm of Tabriz University, of those only four days of year 2010 were comparable (Figure 6). The results of measured actual ET at the lysimeter station, the calculated data in the production maps by the METRIC algorithm and the output data from the WaPOR ET maps are shown in Table 3. Comparison of the results shows that lysimetric values are comparable with the values calculated by the METRIC algorithm using MODIS, while a significant difference is observed by comparing the lysimer ET with that obtained from the WaPOR product. The Differences could exceed 90% (27 May), suggesting that WaPOR significantly underestimates ET, compared to both lysimeter and METRIC estimate.
It should be noted that the lysimeter in the farm is only 70 square meters, while the pixel area of the METRIC algorithm is one square kilometer and the area of the WaPOR pixel is 62,500 square meters. This difference causes the effect of significant pixel mixing, but given the fact that the lysimeter is surrounded by alfalfa, it can be almost acceptable for validation analysis.
3.1.2. Irrigation Network
There is an irrigation network in South part of the Lake Urmia which called Zarrinerood irrigation network (Figure 7). The amount of annual water allocation and water consumption for each zone were measured in year 2014 by Yekom consulting engineers. Furthermore, the irrigation efficiency in this irrigation network is about 50%. In this study, we assumed that the 50% of total water consumption is turn into ET. Half of the annual water consumption for each zone is compared with annual ET of WaPOR and METRIC (Figure 8).
Relative RMSE (RMSE divided by the average observed) values for ETw and ETm are 16% and 14%, respectively. ETw underestimates and ETm overestimates the observed values, but in general, the difference between them and the observed values in these areas is assessed as acceptable compared to general uncertainty in estimation of ET. The amount of real water consumed in these areas is likely greater than the reported values, mainly due to unauthorized pumping that are not reported. This suggest that ETm may provide a more realistic estimate of water consumed in the Zarrinerood irrigation network than ETw.
3.2. Comparison of Actual ET from METRIC Algorithm and WaPOR Product
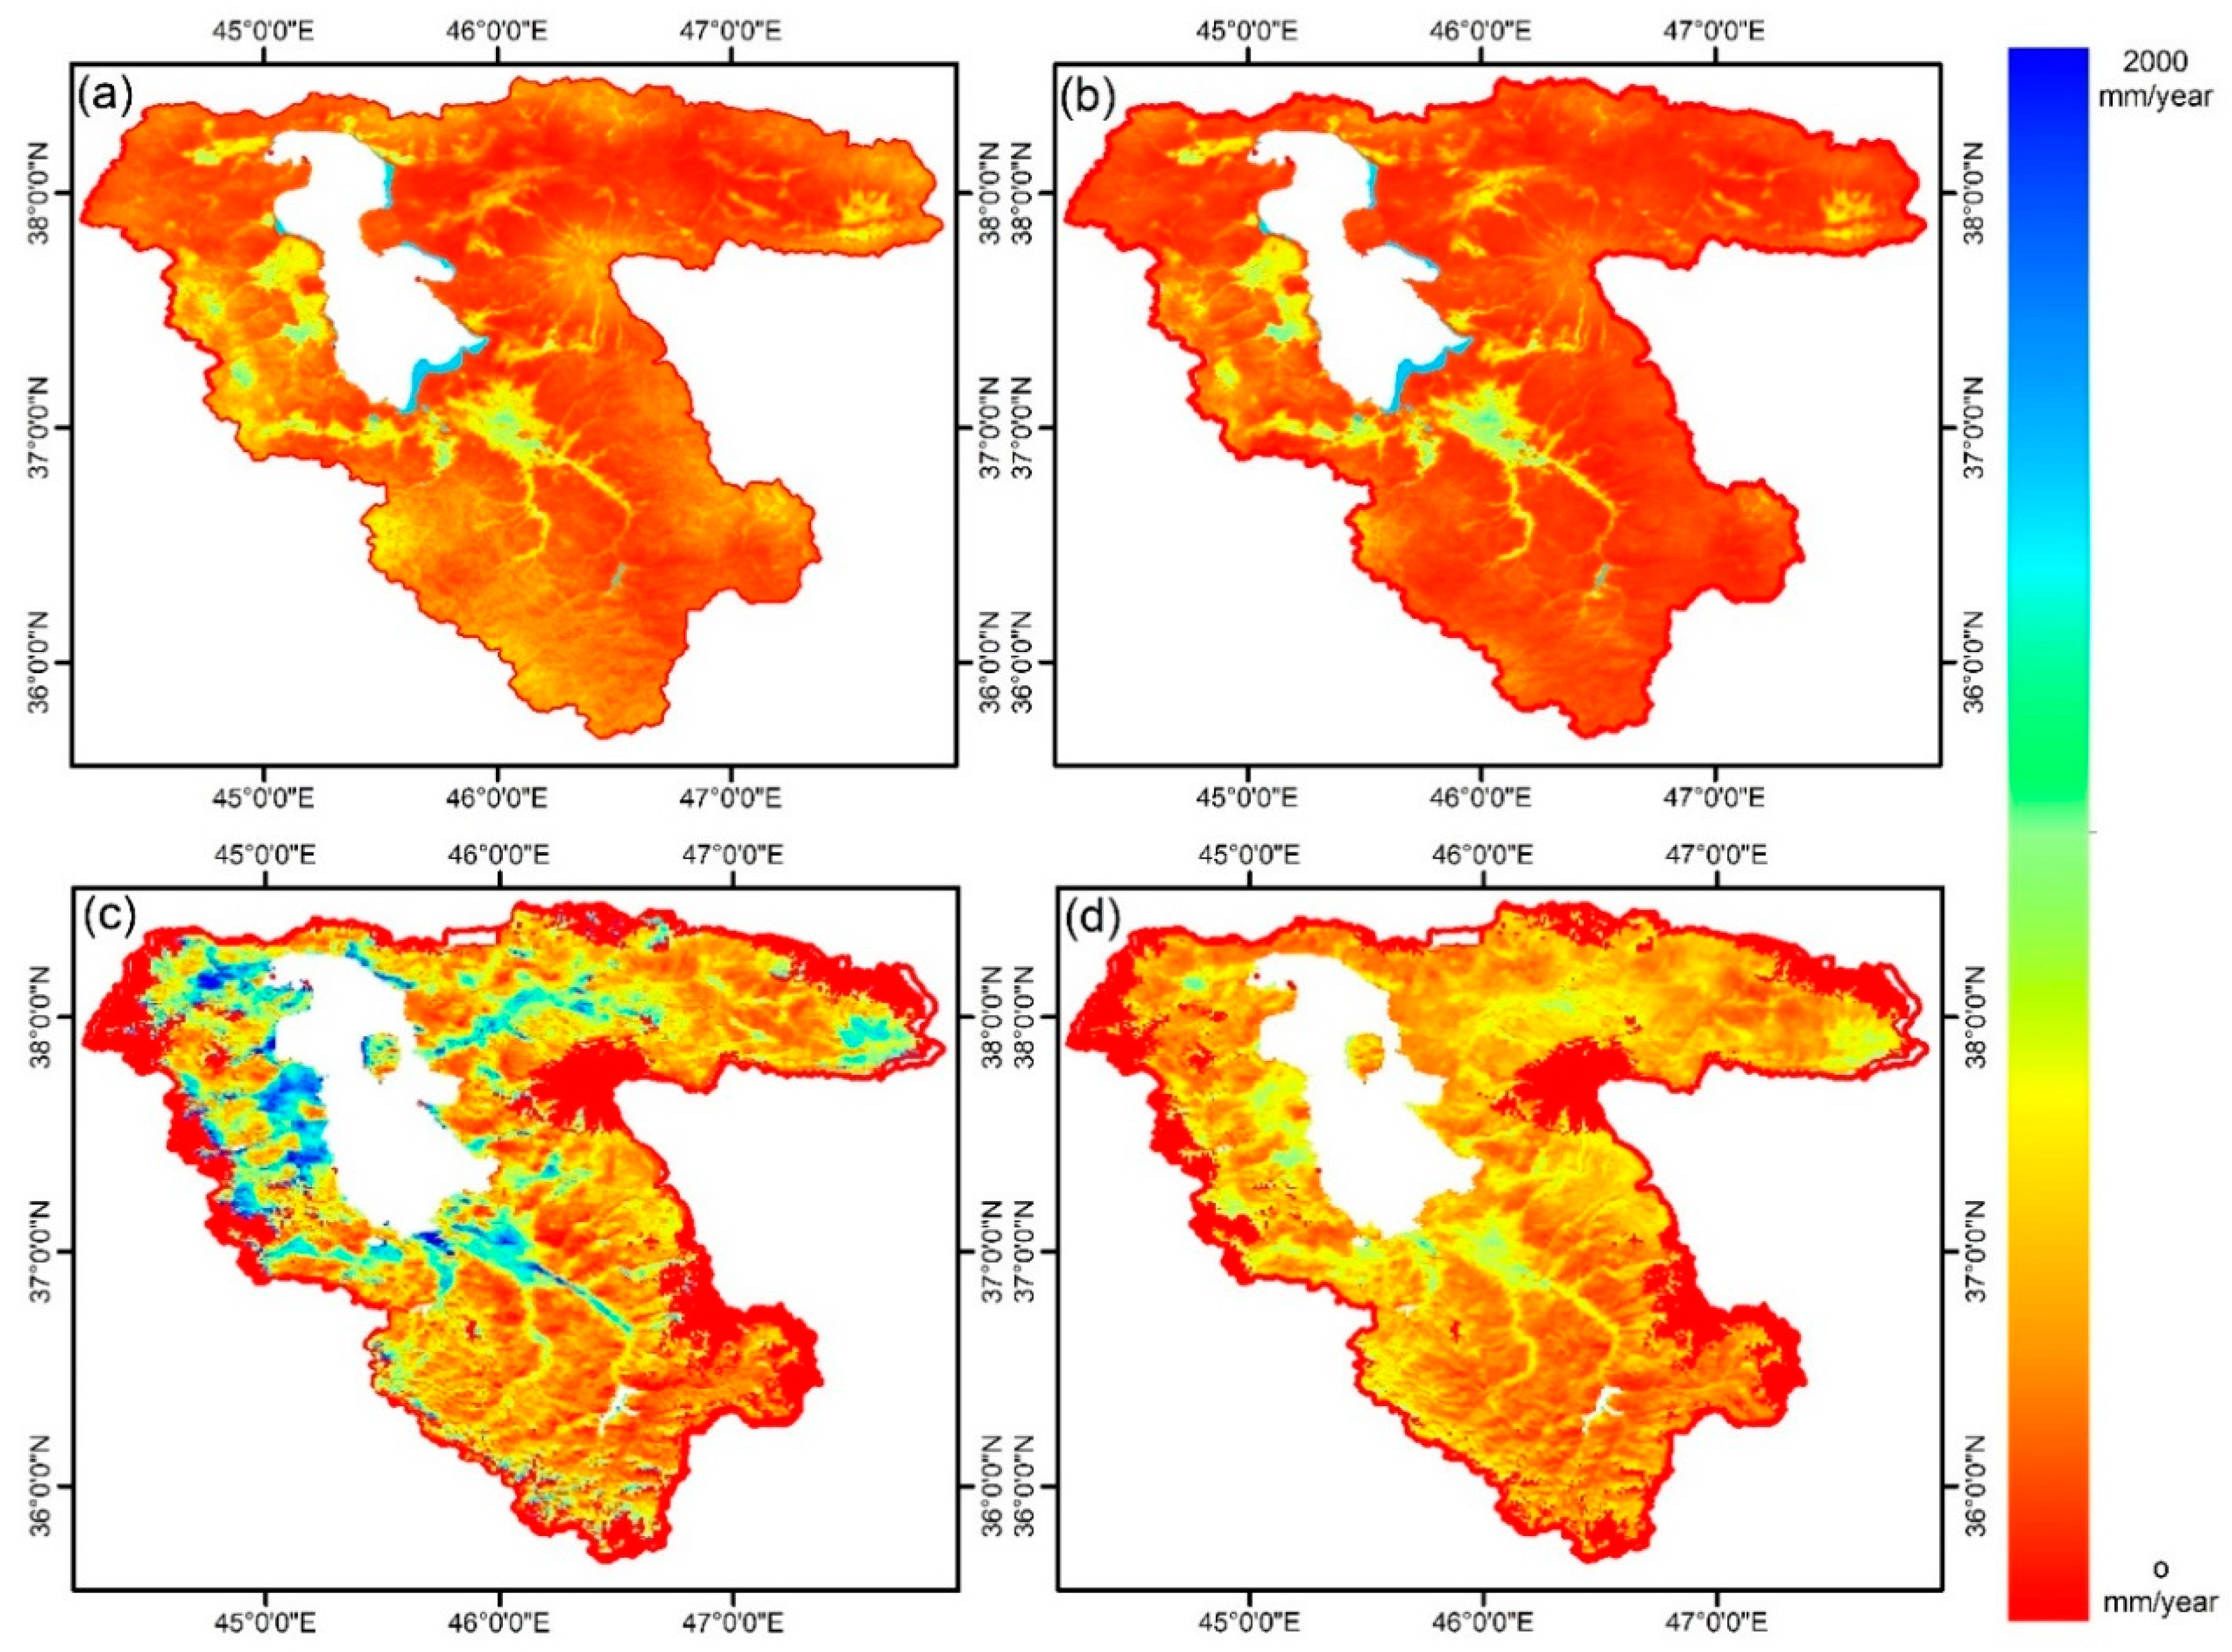
The map of ET in the Urmia Lake basin is shown in Figure 9 based on the WaPOR and the METRIC estimates for the years 2010 and 2014. The ET values in the METRIC algorithm (hereafter is referred to as ETm) are generally greater than ET from WaPOR product (hereafter is referred to as ETw), and the maximum differences of ETm and ETw are mainly over rangelands (Figure 9). In the spatial survey, it is also obvious that the difference between ETm and ETw is largest in the east side of the lake compared to other regions, and the least difference is in the plains south of the lake.
Moreover, the normalized difference vegetation index (NDVI) over Urmia lake basin in year 2014 (Figure 10), suggests that there is a good consistency between the high-ET pixels and high-NDVI pixels. This follows our expectation that higher-ET occurs over more vegetated regions.
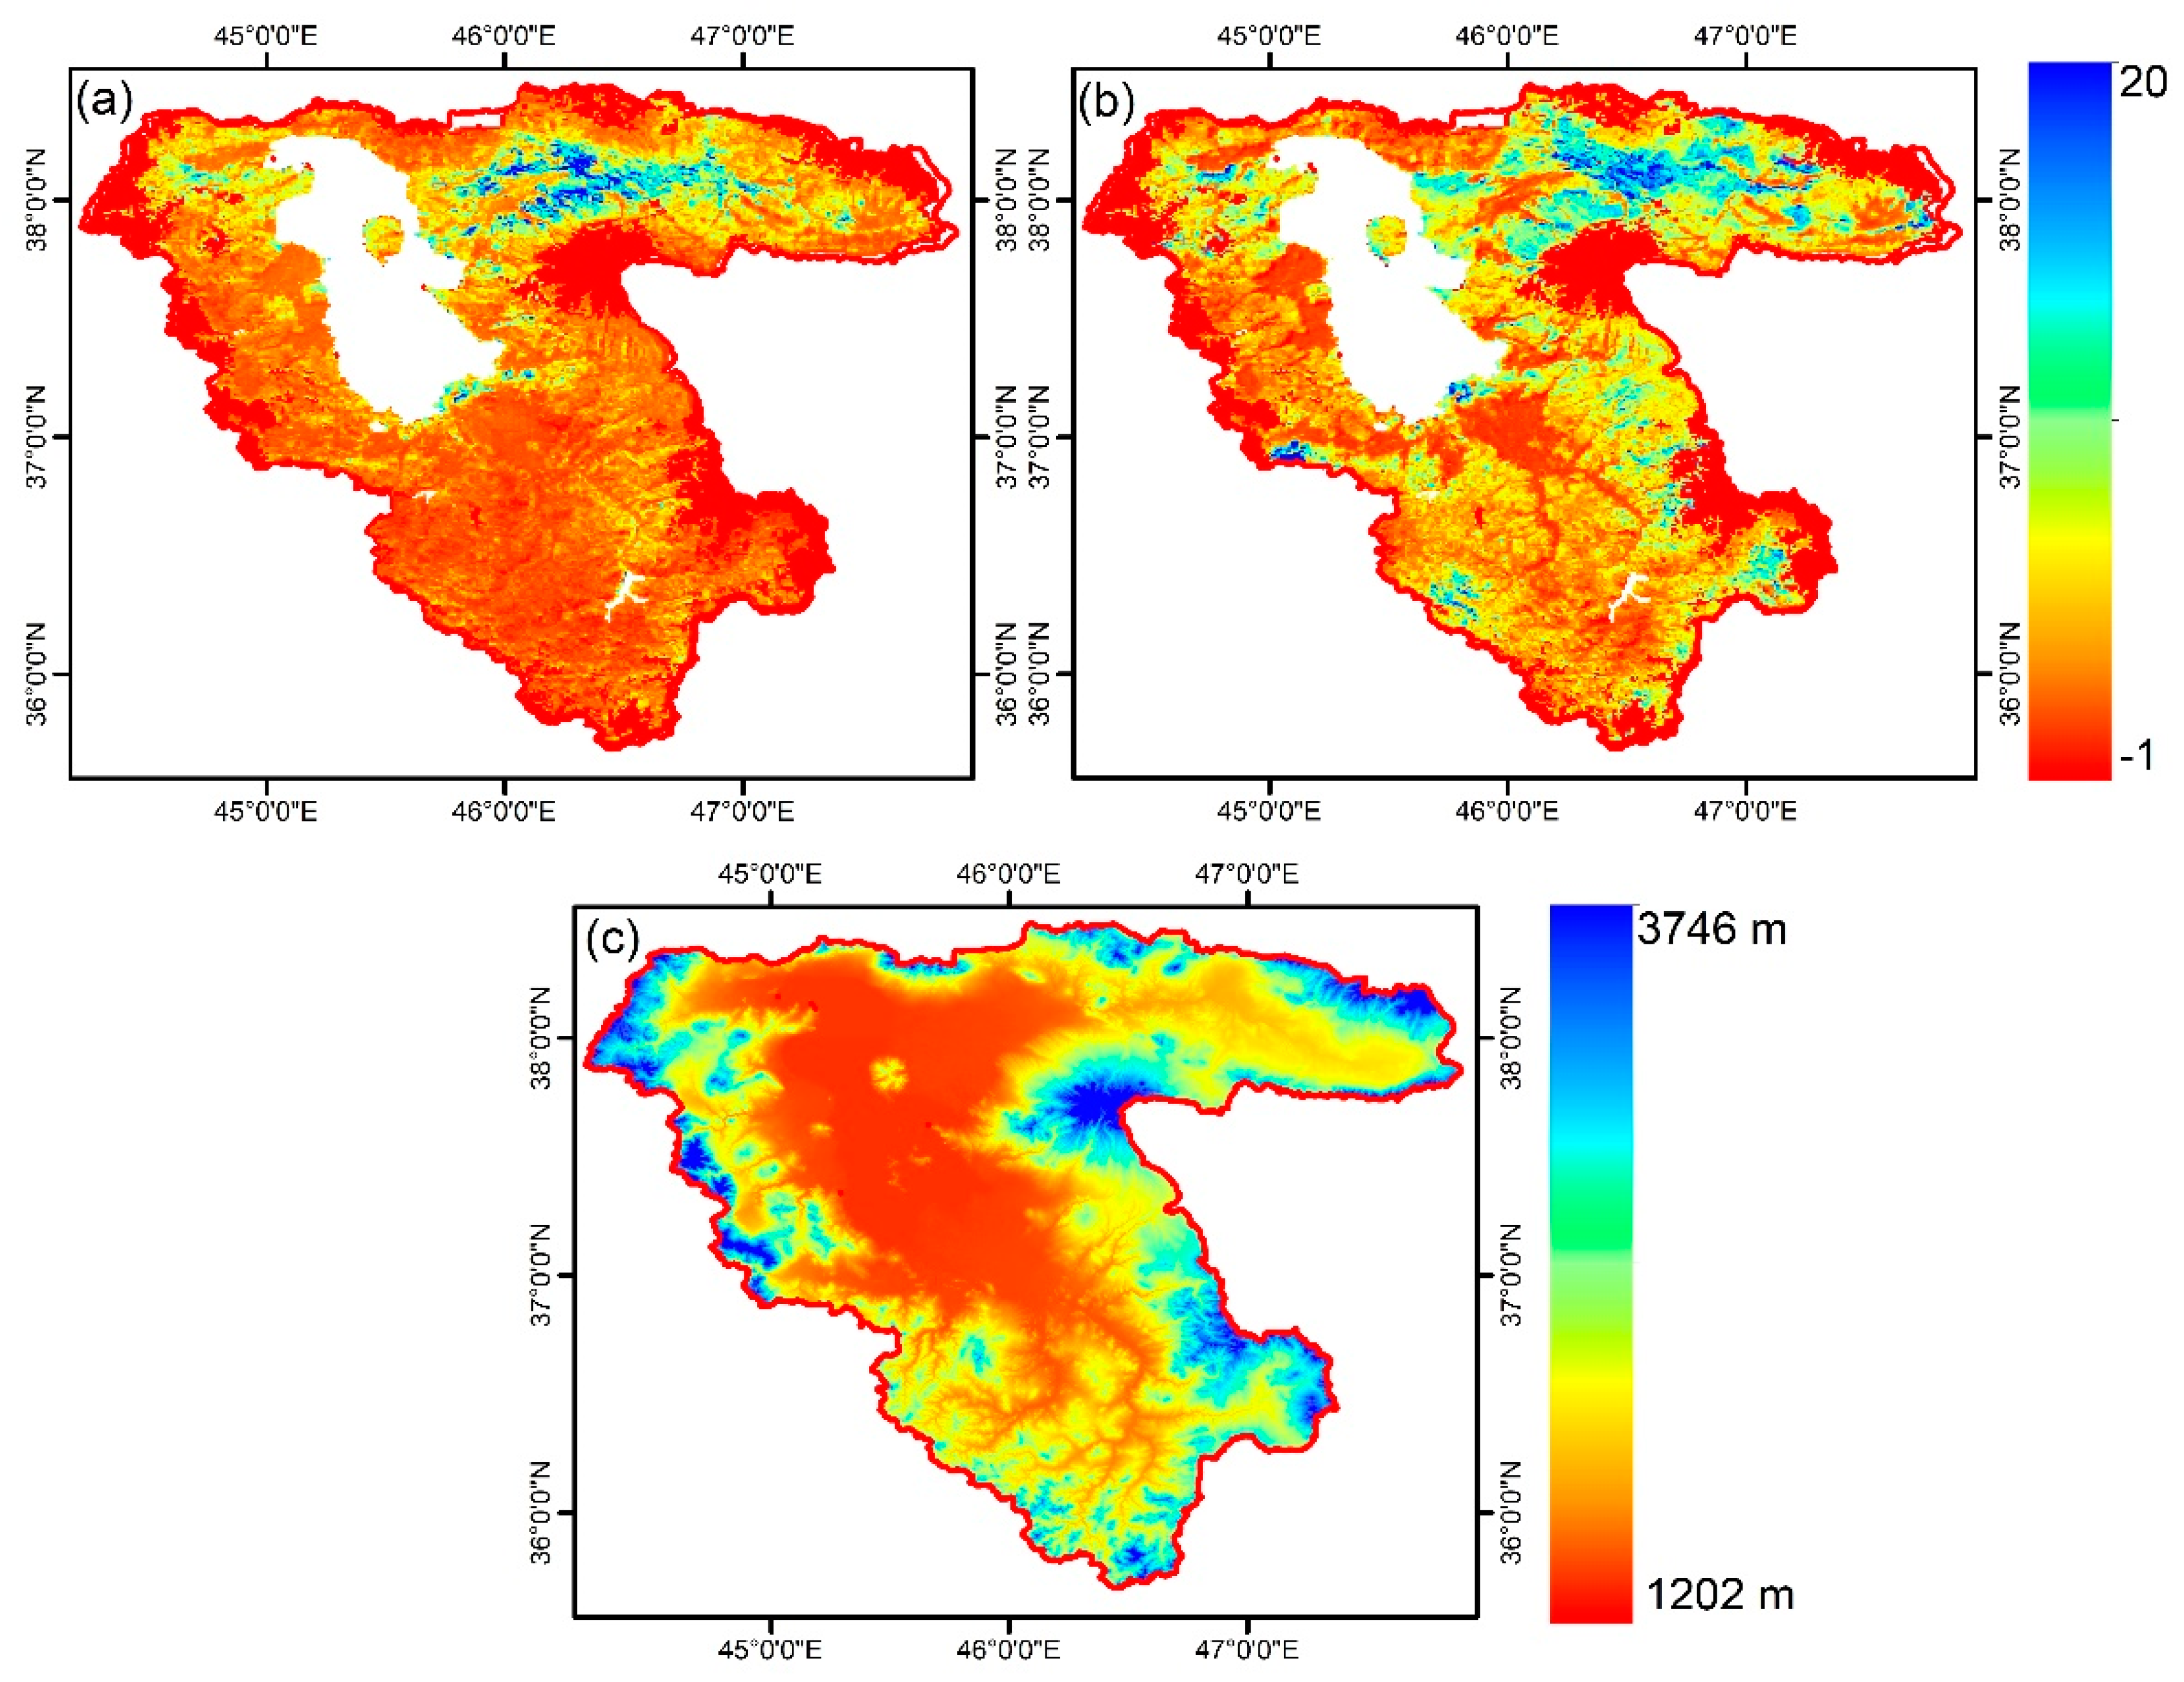
Figure 9 and Figure 11 suggest that there is likely an elevation dependence on the ET rates of each product as well as their differences.
Table 4 shows mean of relative difference between the ETm and ETw as a function of surface elevation from sea level for 2010 and 2014. The elevation ranges are defined based on equality in total number of pixels in each class. ETw shows lower values than ETm at all elevation ranges. The ET differences for the both years generally increase with elevation.
Histograms of the mean annual ET values of the two products are shown in Figure 12, separately for 2010 and 2014. The mean annual ETm is about 417 mm in 2010 and 458 mm in 2014, much higher than ETw, which is 260 mm in 2010 and 197 mm in 2014. The histograms also show that there are more extreme values in ETm in comparison to ETw. It means that for METRIC, high-ET pixels is as much as low-ET pixels. Given that low-ET and high-ET pixels are usually related to arid and irrigated lands respectively, and irrigated lands cover a relatively small fraction of Lake Urmia basin, one may find the ETw histogram (having lower frequency of intense ET) more reasonable than the ETm histogram.
3.3. Spatial and Temporal Comparison
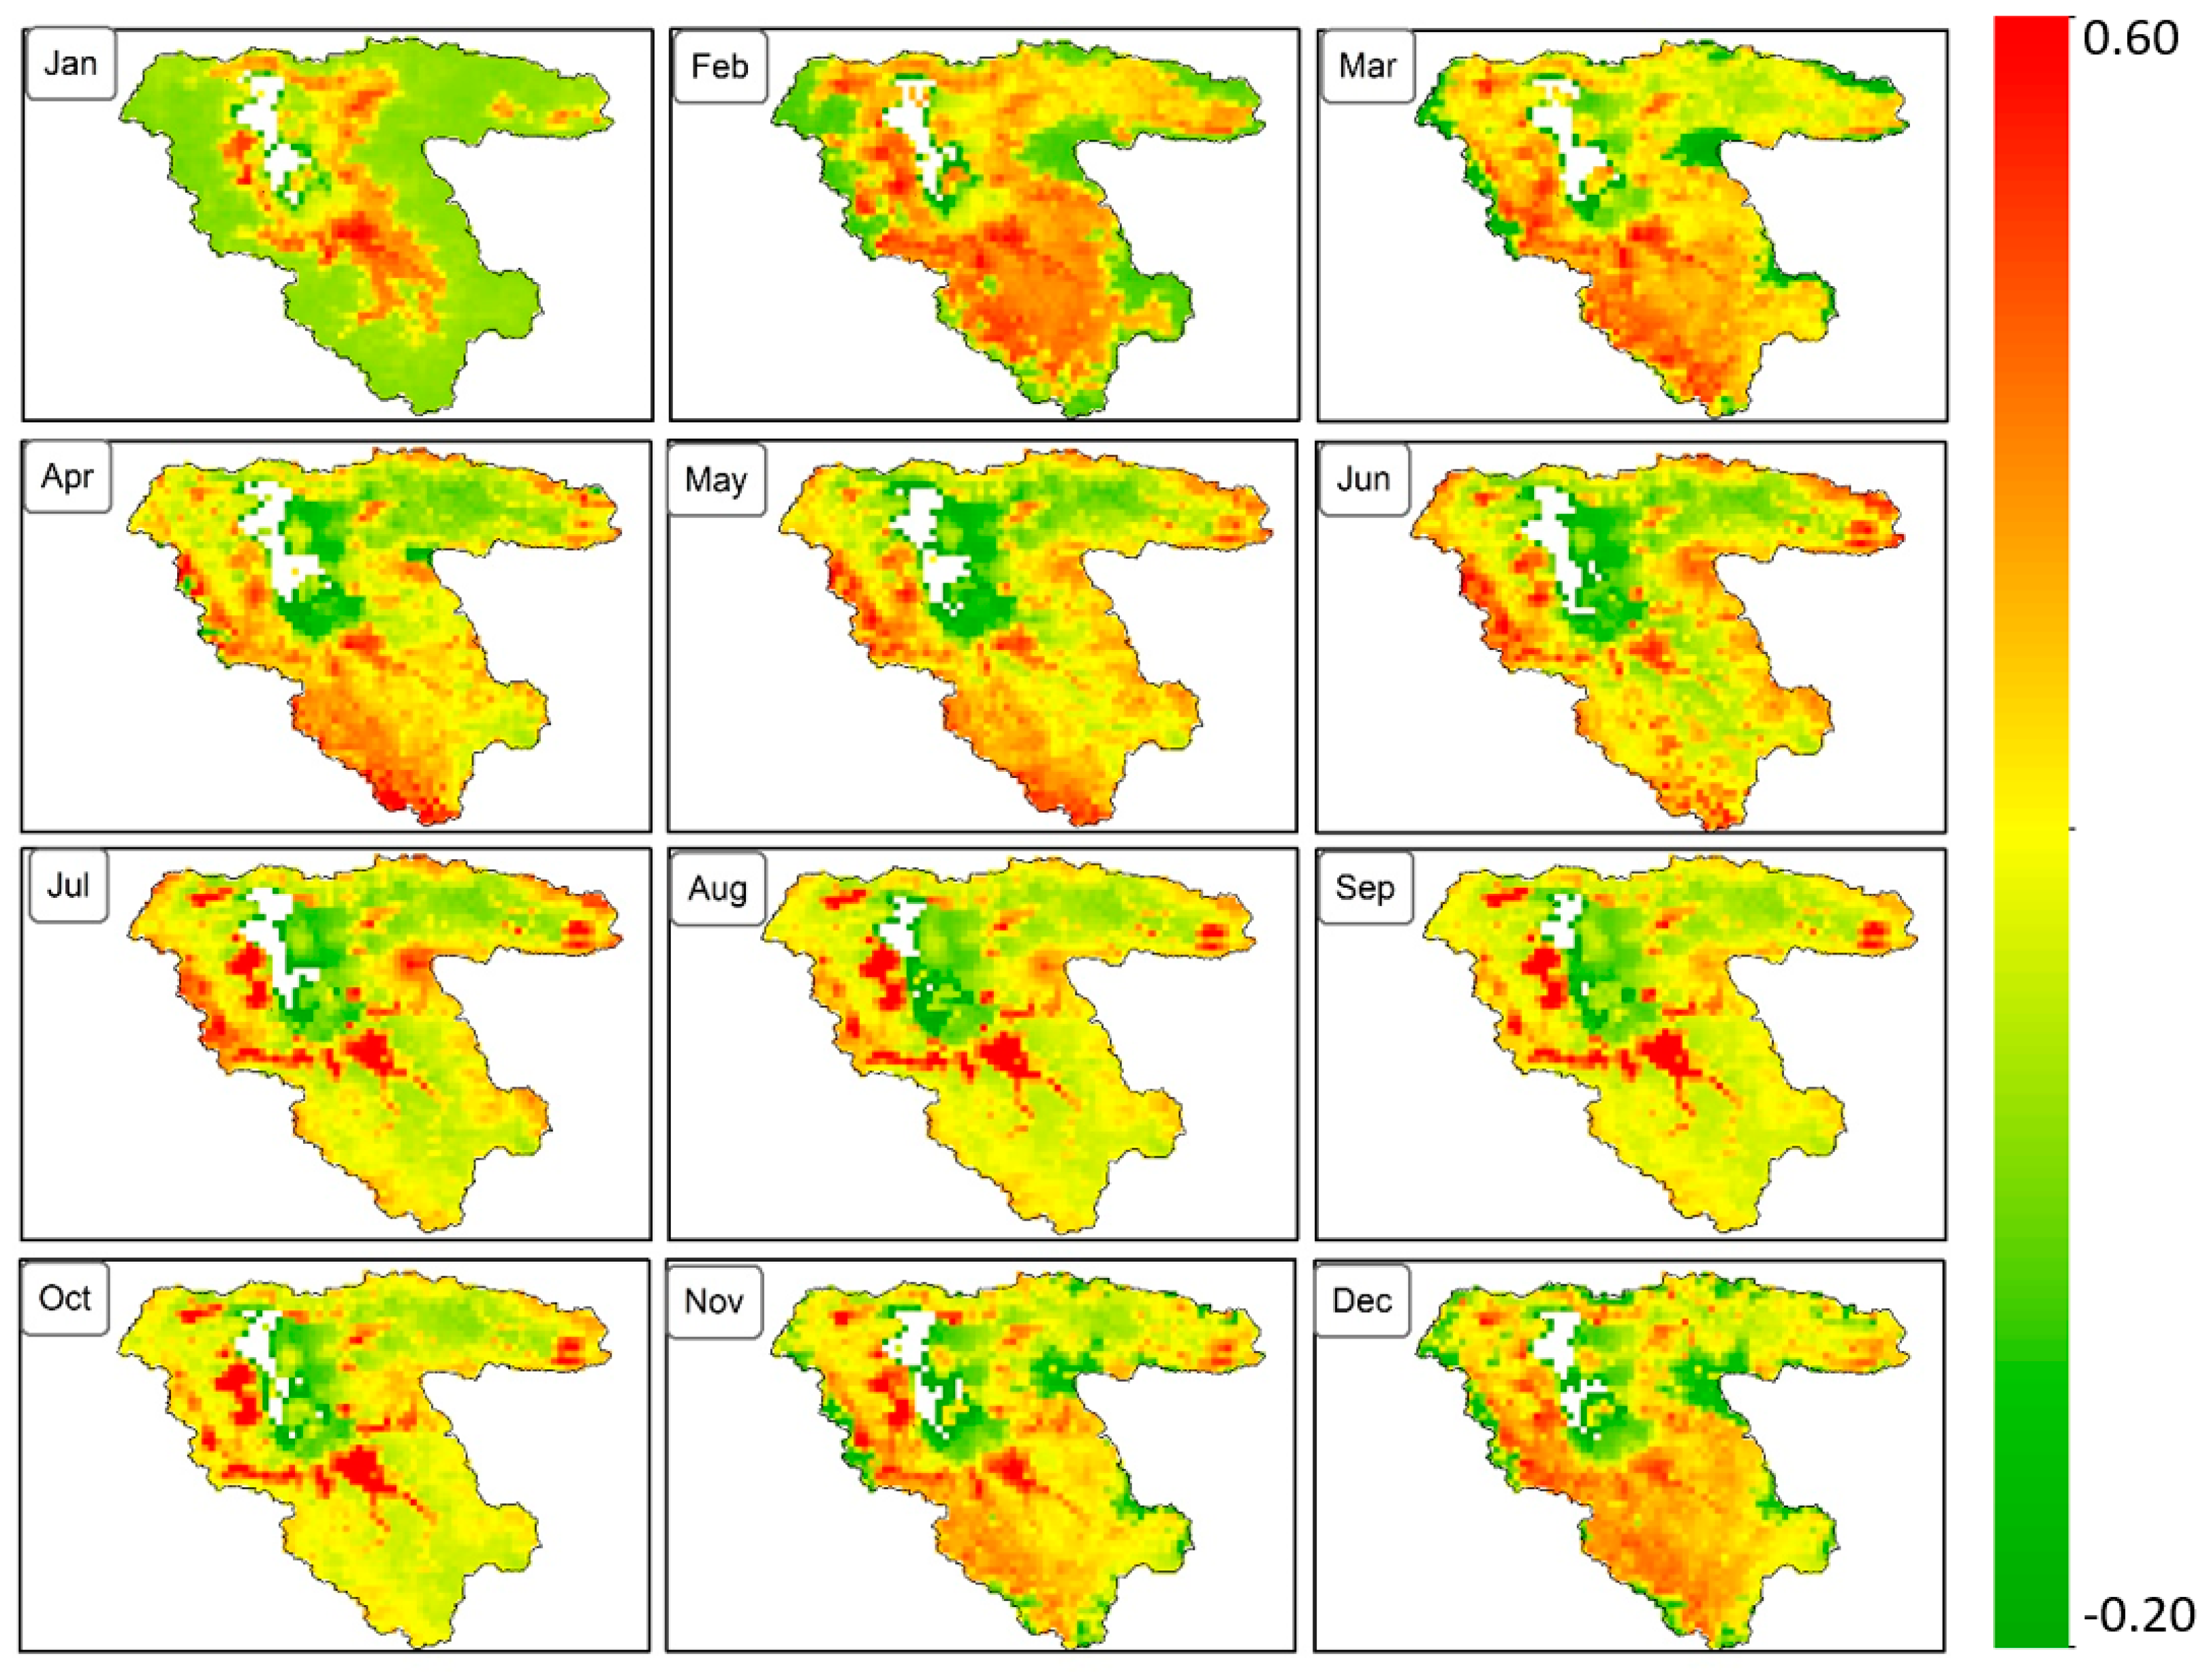
Figure 13 shows monthly average ET rates from ETm and ETw over Urmia lake basin for 2010 and 2014. In most of the months, ETw is lower than ETm, especially for cold months. Precipitation rate in 2010 (290 mm) is lower than 2014 (362 mm), but both are larger than annual mean ET from WaPOR (260 mm in 2010 and 197 mm in 2014). Knowing that about 8% of the basin is irrigated, METRIC seems to provide a more reasonable annual ET rate (417 mm in 2010 and 458 mm in 2014) than WaPOR product. In contrast to ETw, ETm has larger ET rate in 2014 than 2010, which is consistent with changes in precipitation rate.
The monthly ET rate plot (Figure 13a) shows that there is a significant difference between WaPOR and METRIC in May of 2010, which might be related to soil moisture increase in response to increase in rainfall rate in March-May of 2010 compared to the similar period in 2014 (Figure 14) ETLook uses soil moisture as the main input; so, it would be more sensitive to soil moisture in comparison to METRIC. In contrast, METRIC uses cloud-free images, thus during a rainy month ETm may not be trusted. This may justify why ETm is lower than ETw in May of 2010. In contrast, there is a spike in precipitation in October of 2014, yet ETw is less than ETm. October is at the end of the growing season, displaying lower NDVI than May (Figure 10). In lack of any major withdrawing for irrigation uses, intense rainfall events can entirely contribute to runoff and quickly drain into the Lake Urmia, resulting in a little effect on ET rates compared to that observed in October.
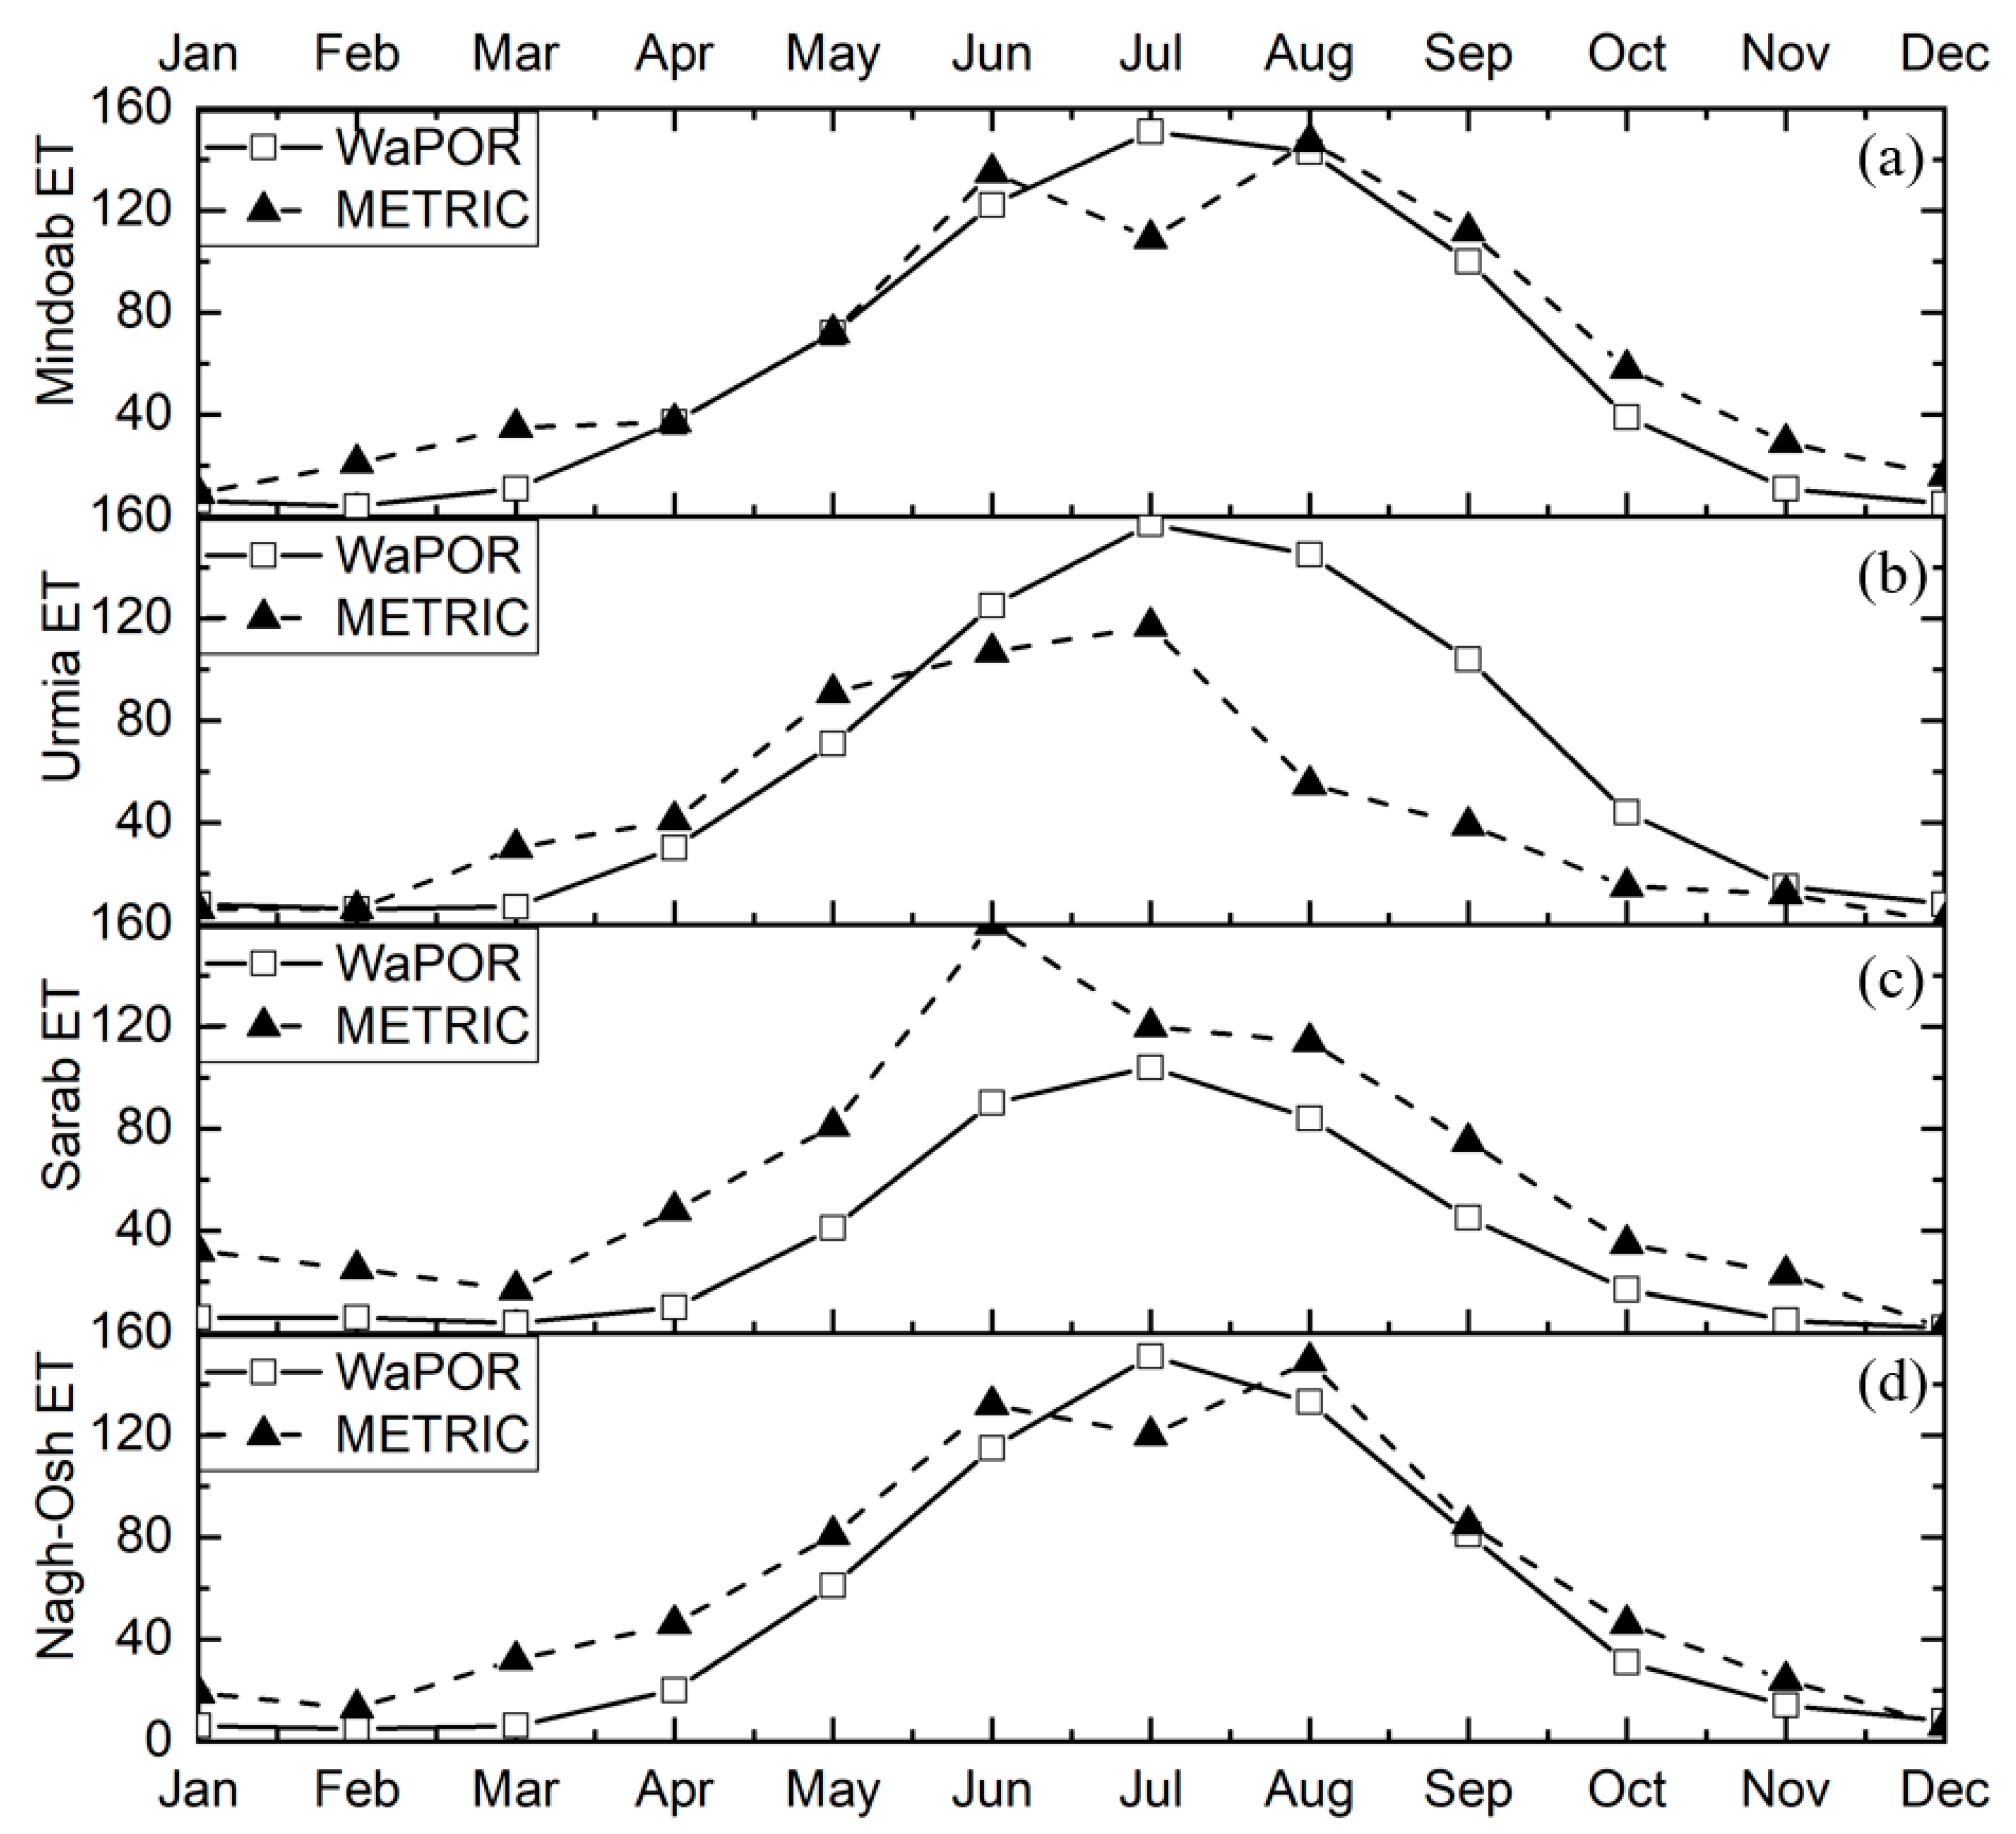
ET rates were also compared at four main sub-basins of the Urmia lake basin: Miandoab, Urmia, Naghadeh-Oshnavieh and Sarab sub-basin (Figure 1). These 4 sub-basins are the most irrigated regions of the basin (Figure 1). Agriculture lands of the Miandoab and Urmia sub-basin shows higher ET in comparison to Sarab and Naghadeh-Oshnavieh in all months (Figure 15). Also, the ET of Urmia sub-basin (717 mm) is higher than Miandoab (702 mm). In addition to the slight difference between the ET values of these two sub-basins, the ET ratio in different months is approximately the same in annual amounts in these two sub-basins, and as the crop moves to the growing season, it reaches the highest level in July. The sub-basin of Sarab, with its 413-mm maximum ET, has the least ET among the four sub-basins but it has the highest difference between two methods mainly because this sub-basin has high elevation in comparison to others (Figure 11c). However, ETm peaks for the agricultural lands of the Miandoab, Naghadeh–Oshnavieh, Urmia and Sarab sub-basins are 777, 754, 731, and 519 mm, respectively, which are far from ETw.
The rusults on the difference between the monthly ETw and ETm showed that the least difference was in the Miandoab plain and the highest difference was observed in the sub-basin of the Sarab. Furthermore, only in the Urmia region, ETw is more than ETm. In the other three sub-basins, the METRIC algorithm typically has higher values in all months.
3.4. Evaluation of Differences in Rainfed Agriculture Areas
In irrigated lands, the actual amount of ET can be several times larger than the total annual rainfall. In contrast, ET is expected to be small in non-irrigated mountainous ranges, partly because of the high slope of the land. However, annual ET cannot exceed annual precipitation in cultivated lands that are not irrigated by wells or rivers. According to Wang et al., ET often has a value of about 0.6 to 0.7 of precipitation [30]. Also, due to the fact that these lands are located mostly on mild slopes and are expected to have good moisture potential, so they can be a good representative for validating ET [31]. In other words, rainfed agriculture areas can be a good representative for validating ET because they are located between high and low elevated lands.
Figure 16 compares maps of annual precipitation minus annual actual ET rates from ETm and ETw for years 2010 and 2014 over rainfed lands. The ETw annual rates in 2010 and 2014 are 104 and 135 mm less than the corresponding annual precipitation rates (290 mm and 362 mm, respectively). In contrast, the average annual rates of ETm in 2010 and 2014 exceed the total annual precipitation by 100 and 170 mm, respectively. This suggests that METRIC is unrealistically high over rainfed regions while WaPOR estimates are reasonable. The reason for this unrealistic amount of ETm in rainfed lands might be due to the effect of soil moisture. Over these lands, LST is decreased by crops, consequently, the ETm would be high but it cannot completely distinguish a rainfed land from an irrigated land because it does not have soil moisture component in the model.
4. Concluding Remarks
Overconsumption of water for agriculture can cause serious problems in arid and semi-arid regions. A good example of such regions is Lake Urmia, which has significantly been shrunk in recent years due to increase in agricultural water consumption. Water consumption is well correlated with ET, thus improved estimate of ET can provide valuable information on water consumption planning and management. In this study, we compared the actual ET maps from two high resolution ET products (the WaPOR product, derived from the ETLook algorithm, and ET from the METRIC algorithm) over the Lake Urmia basin for year 2010 and 2014. METRIC algorithm has commonly been used over this region using MODIS images, it is important to quantify the differences between ET estimates from the newly available high resolution WaPOR product (i.e., 250 m spatial resolution) and METRIC, the results of which can add valuable insights onto hydrologic studies over the region. ETLook calculates ET using microwave images, so has no gap under cloudy conditions. This two-source algorithm has a high sensitivity to soil moisture data, while the METRIC one-source algorithm is more sensitive to land surface temperature (LST).
The maps produced by the WaPOR were found to be more realistic than the METRIC estimate (derived using MODIS images) in terms of temporal and spatial scales, potentially due to the ability of the ETLook algorithm to calculate ET in cloudy conditions using microwave images. Furthermore, we found that the ET rates from the WaPOR product are much smaller than the ET rates calculated from the METRIC algorithm in most part of the basin, especially over rangelands. By moving from low to high elevations, this difference tends to increase in both years. The temporal and spatial analysis of the results in the sub-basins of Lake Urmia basin indicates that the difference in the Miandoab plain (lowland sub-baisn) is lower than the other plains studied and the highest difference is in the Sarab plain that can be due to the elevation changes of the sub-basin and the sensitivity of production maps to changes in levels. Assessment of ET over precipitation ratio in rainfed agriculture areas indicates that METRIC produces unrealistically high ET (i.e., annual ET/P >1), but WaPOR produces a more realistic ET rates (i.e., annual ET/P <1).
Moreover, using the limited lysimeter data over the city of Tabriz, 80 km west of Lake Urmia, it was found that ET from METRIC algorithm matches lysimter measurements with no more than 19% difference, while in average WaPOR underestimates the ET rates by 71%. However, the outcomes of this comparison could be affected by large differences between footprint sizes of the METRIC estimates from MODIS (i.e., 1 km × 1 km), WaPOR product (i.e, 250 m ×250 m), and lysimeter (i.e., 70 m2). Lastly, by using reports of annual water consumption rates in an irrigation network South of Lake Urmia, we found that WaPOR and METRIC slightly under- and over-estimate ET rates. Knowing that water consumption reports do not account for unauthorized pumping, it was concluded that METRIC’s estimate is likely more realistic than that from WaPOR.
In a warming climate most lakes, especially those in arid and semi-arid regions are going through significant changes due to combination of natural responses (e.g., lower relative humidity, higher vapor pressure deficit, etc.) [32,33,34] and anthropogenic activities (e.g., surface and ground water extraction for agriculture, etc.). This heightens the need for more accurate measurements of regional water and energy cycle components for planning, prediction, and mitigation of negative social and environmental aspect of such changes. ET has remained one of the mostly poor measured component of water and energy cycle in most regions of the world, a good example of which is Lake Urmia and Aral Sea [35]. It is hoped that the new generation of instruments (e.g., ECOSTRESS [36], among others) can provide more reliable estimate of ET regionally and globally.
Author Contributions
Conceptualization, M.J., A.B., M.G., M.T.; Methodology, M.J., A.B., M.G., M.T.; Software, M.J., M.G.; Validation, M.J.; Formal Analysis, M.J., M.G.; Investigation, M.J., A.B., M.G., M.T.; Resources, M.J., A.B., M.G., M.T.; Data Curation, M.J., A.B., M.G., M.T.; Writing-Original Draft Preparation, M.J., A.B., M.G., M.T.; Writing-Review & Editing, M.J., A.B., M.G., M.T.; Visualization, M.J., A.B., M.G., M.T.; Supervision, A.B., M.T.; Project Administration, A.B., M.T.
Funding
This research received no external funding.
Acknowledgments
The authors thank Hosein Javadian for his inspiring role in this paper. May God give him eternal rest.
Conflicts of Interest
The authors declare no conflict of interest.
Appendix A
Figure A1.
Mean annual NDVI over Urmia lake basin.

References
- Allen, R.G.; Tasumi, M.; Trezza, R. Satellite-Based Energy Balance for Mapping Evapotranspiration with Internalized Calibration (METRIC)—Model. J. Irrig. Drain. Eng. 2007, 133, 380–394. [Google Scholar] [CrossRef]
- Calcagno, G.; Mendicino, G.; Monacelli, G.; Senatore, A.; Versace, P. Distributed estimation of actual evapotranspiration through remote sensing techniques. In Methods and Tools for Drought Analysis and Management; Rossi, G., Vega, T., Bonaccorso, B., Eds.; Springer: Dordrecht, The Netherlands, 2007; pp. 125–147. [Google Scholar]
- Golian, S.; Javadian, M.; Behrangi, A. On the use of satellite, gauge, and reanalysis precipitation products for drought studies. Environ. Res. Lett. 2019, 14, 075005. [Google Scholar] [CrossRef]
- Zhang, Y.; Yu, Z.; Niu, H. Standardized precipitation evapotranspiration index is highly correlated with total water storage over China under future climate scenarios. Atmosp. Environ. 2018, 194, 123–133. [Google Scholar] [CrossRef]
- Molden, D.; Sakthivadivel, R. Water accounting to assess use and productivity of water. Int. J. Water Res. Dev. 1999, 15, 55–71. [Google Scholar] [CrossRef]
- Zwart, S.J.; Bastiaanssen, W.G.M.; de Fraiture, C.; Molden, D.J. WATPRO: A remote sensing based model for mapping water productivity of wheat. Agric. Water Manag. 2010, 97, 1628–1636. [Google Scholar] [CrossRef]
- Wilcox, J.D. Total solar eclipse effects on evapotranspiration captured by groundwater fluctuations in a Southern Appalachian fen. Hydrol. Proc. 2019, 33, 1538–1541. [Google Scholar] [CrossRef]
- Javadian, M.; Aghaie, M.; Tajrishi, M. Simulation of interaction between aquifer and surface flow for different water resources utilization scenarios (Case Study: Urmia Plain). In Proceedings of the 45th International Hydrogeologists Congress, Daejeon, Korea, 12 September 2018. [Google Scholar]
- Javadian, M. Simulation of Interaction between Aquifer and Surface Flow for Different Water Resources Utilization Scenarios (Case Study: Urmia Plain); Sharif University of Technology: Tehran, Iran, 2018. [Google Scholar]
- Jackson, R.D.; Reginato, R.J.; Idso, S.B. Wheat canopy temperature: A practical tool for evaluating water requirements. Water Resour. Res. 1977, 13, 651–656. [Google Scholar] [CrossRef]
- Javadian, M.; Kordi, F.; Tajrishy, M. Evaluation and comparison of estimation methods for actual evapotranspiration in the Urmia Lake Basin. Iranian J. Ecohydrol. 2019, 6, 125–136. [Google Scholar] [CrossRef]
- Bastiaanssen, W.G.M. Regionalization of Surface Flux Densities and Moisture Indicators in Composite Terrain: A Remote Sensing Approach under Clear Skies in Mediterranean Climates; SC-DLO: Wageningen, The Netherlands, 1995. [Google Scholar]
- Bastiaanssen, W.G.M.; Pelgrum, H.; Wang, J.; Ma, Y.; Moreno, J.F.; Roerink, G.J.; van der Wal, T. A remote sensing surface energy balance algorithm for land (SEBAL): 2. Validation. J. Hydrol. 1998, 212, 213–229. [Google Scholar] [CrossRef]
- Zwart, S.J.; Bastiaanssen, W.G.M. SEBAL for detecting spatial variation of water productivity and scope for improvement in eight irrigated wheat systems. Agric. Water Manag. 2007, 89, 287–296. [Google Scholar] [CrossRef]
- Du, J.; Song, K.; Wang, Z.; Zhang, B.; Liu, D. Evapotranspiration estimation based on MODIS products and surface energy balance algorithms for land (SEBAL) model in Sanjiang Plain, Northeast China. Chin. Geograph. Sci. 2013, 23, 73–91. [Google Scholar] [CrossRef]
- Youneszadeh, S.; Sima, S.; Javadian, M.; Tajrishy, M. Determining daily variations of river flood plains in the southern buffer zone of Urmia Lake in 2010. Iran Water Resour. Res. 2018, 14, 25–31. [Google Scholar]
- Moghim, S.; Javadian, M. Characterization of hydroclimatological changes in Iran. In Proceedings of the 2017 AGU Fall Meeting, New Orleans, LA, USA, 11–15 December 2017. [Google Scholar]
- Youneszadeh, S.; Javadian, M.; Tajrishy, M.; Taheri, H. Extraction of the lake Urmia water bodies using landsat 8 imagery. In Proceedings of the 7th National Conference on Water Resources Management, Yazd, Iran, 25 April 2018. [Google Scholar]
- Hesami, A.; Amini, A. Changes in irrigated land and agricultural water use in the Lake Urmia basin. Lake Res. Manag. 2016, 32, 288–296. [Google Scholar] [CrossRef]
- Iran_Water_Research_Institute. Integrated Water Resources Management for Lake Urmia Basin; Iran Water Research Institute Tehran: Tehran, Iran, 2006. [Google Scholar]
- Bagheri, M.; Morid, S.; Arshad, S. Application of remotely-sensed data to estimate a water budget for data-scarce endorheic basins: A case study of lake Urmia basin, Iran. J. Ind. Soc. Remote Sens. 2017, 45, 101–112. [Google Scholar] [CrossRef]
- Taheri, M.; Emadzadeh, M.; Gholizadeh, M.; Tajrishi, M.; Ahmadi, M.; Moradi, M. Investigating the temporal and spatial variations of water consumption in Urmia Lake River Basin considering the climate and anthropogenic effects on the agriculture in the basin. Agric. Water Manag. 2019, 213, 782–791. [Google Scholar] [CrossRef]
- Jia, L.; Xi, G.; Shaomin, L.; Chao, H.; Yan, Y.; Liu, G. Regional estimation of daily to annual regional evapotranspiration with MODIS data in the Yellow River Delta wetland. Hidrol. Earth Syst. Sci. 2009, 13, 1775–1787. [Google Scholar] [CrossRef] [Green Version]
- Leung, T.; Kong, J.; Njoku, E.; Staelin, D.; Waters, J. Theory for microwave thermal emission from a layer of cloud or rain. IEEE Trans. Antennas Propag. 1977, 25, 650–657. [Google Scholar] [CrossRef]
- Bastiaanssen, W.G.M.; Cheema, M.J.; Immerzeel, W.W.J.; Miltenburg, I.; Pelgrum, H. Surface energy balance and actual evapotranspiration of the transboundary Indus Basin estimated from satellite measurements and the ETLOOK model. Water Resour. Res. 2012, 48, W11512. [Google Scholar] [CrossRef]
- Chen, Y.; Ebert, E.E.; Walsh, K.J.E.; Davidson, N.E. Evaluation of TRMM 3B42 precipitation estimates of tropical cyclone rainfall using PACRAIN data. J. Geophys. Res. Atmosp. 2013, 118, 2184–2196. [Google Scholar] [CrossRef]
- Bastiaanssen, W.G.M. SEBAL-based sensible and latent heat fluxes in the irrigated Gediz Basin, Turkey. J. Hidrol. 2000, 229, 87–100. [Google Scholar] [CrossRef]
- Kjaersgaard, J.H.; Allen, R.G.; Garcia, M.; Kramber, W.; Trezza, R. Automated Selection of anchor pixels for landsat based evapotranspiration estimation. In Proceedings of the World Environmental and Water Resources Congress, Kansas City, MO, USA, 17–21 May 2009. [Google Scholar] [CrossRef]
- FAO. WaPOR Database Methodology: Level 1. Remote Sensing for Water Productivity Technical Report: Methodology Series; FAO: Rome, Italy, 2018. [Google Scholar]
- Wang, Y.; Yu, P.; Xiong, W.; Shen, Z.; Mingchun, G.; Shi, Z.; Du, A.; Wang, L. Water-Yield Reduction After Afforestation and Related Processes in the Semiarid Liupan Mountains, Northwest China 1. JAWRA 2008, 44, 1086–1097. [Google Scholar]
- Gan, M.; Jia, Y.; Shao, M.A.; Guo, C.; Li, T. Permanent gully increases the heterogeneity of soil water retention capacity across a slope-gully system. Agric. Ecosyst. Environ. 2019, 272, 206–217. [Google Scholar] [CrossRef]
- Sherwood, S.; Fu, Q. Climate change. A drier future? Science 2014, 343, 737–739. [Google Scholar] [CrossRef] [PubMed]
- Behrangi, A.; Fetzer, E.J.; Granger, S.L. Early detection of drought onset using near surface temperature and humidity observed from space. Int. J. Remote Sens. 2016, 37, 3911–3923. [Google Scholar] [CrossRef]
- Behrangi, A.; Loikith, P.; Fetzer, E.M.; Nguyen, H.; Granger, S. Utilizing humidity and temperature data to advance monitoring and prediction of meteorological drought. Climate 2015, 3, 999–1017. [Google Scholar] [CrossRef]
- Singh, A.; Behrangi, A.B.; Fisher, J.T.; Reager, J. On the desiccation of the south aral sea observed from spaceborne missions. Remote Sens. 2018, 10, 793. [Google Scholar] [CrossRef]
- Hulley, G.; Hook, S.; Fisher, J.; Lee, C. ECOSTRESS, A NASA Earth-Ventures Instrument for studying links between the water cycle and plant health over the diurnal cycle. In Proceedings of the 2017 IEEE International Geoscience and Remote Sensing Symposium (IGARSS), Fort Worth, TX, USA, 23–28 July 2017; pp. 5494–5496. [Google Scholar]
Figure 1.
(a) Iran extent and (b) Urmia Lake and its basin boundary.

Figure 2.
Landuse map of the Urmia Lake basin.

Figure 3.
Total annual precipitation and average annual temperature time series of the Urmia synoptic station.
Figure 3.
Total annual precipitation and average annual temperature time series of the Urmia synoptic station.

Figure 4.
Location of synoptic stations.

Figure 5.
Conceptual diagram of ETLook algorithm [29].
Figure 5.
Conceptual diagram of ETLook algorithm [29].

Figure 6.
Lysimeter photo taken in the year 2018.

Figure 7.
(a) Location of Zarrinerood irrigation network, (b) Zones of Zarrinerood irrigation network.
Figure 7.
(a) Location of Zarrinerood irrigation network, (b) Zones of Zarrinerood irrigation network.

Figure 8.
Comparison of WaPOR and METRIC agricultural water consumption with real measurements in million cubic meters (MCM).
Figure 8.
Comparison of WaPOR and METRIC agricultural water consumption with real measurements in million cubic meters (MCM).

Figure 9.
Actual ET from: (a) WaPOR in 2010, (b) WaPOR in 2014, (c) METRIC in 2010 and (d) METRIC in 2014.
Figure 9.
Actual ET from: (a) WaPOR in 2010, (b) WaPOR in 2014, (c) METRIC in 2010 and (d) METRIC in 2014.

Figure 10.
Monthly averaged of NDVI in year 2014 by MODIS product.

Figure 11.
Relative difference of annual ET between WaPOR and METRIC in Urmia lake basin () in year: (a) 2010 and (b) 2014, (c) DEM.
Figure 11.
Relative difference of annual ET between WaPOR and METRIC in Urmia lake basin () in year: (a) 2010 and (b) 2014, (c) DEM.

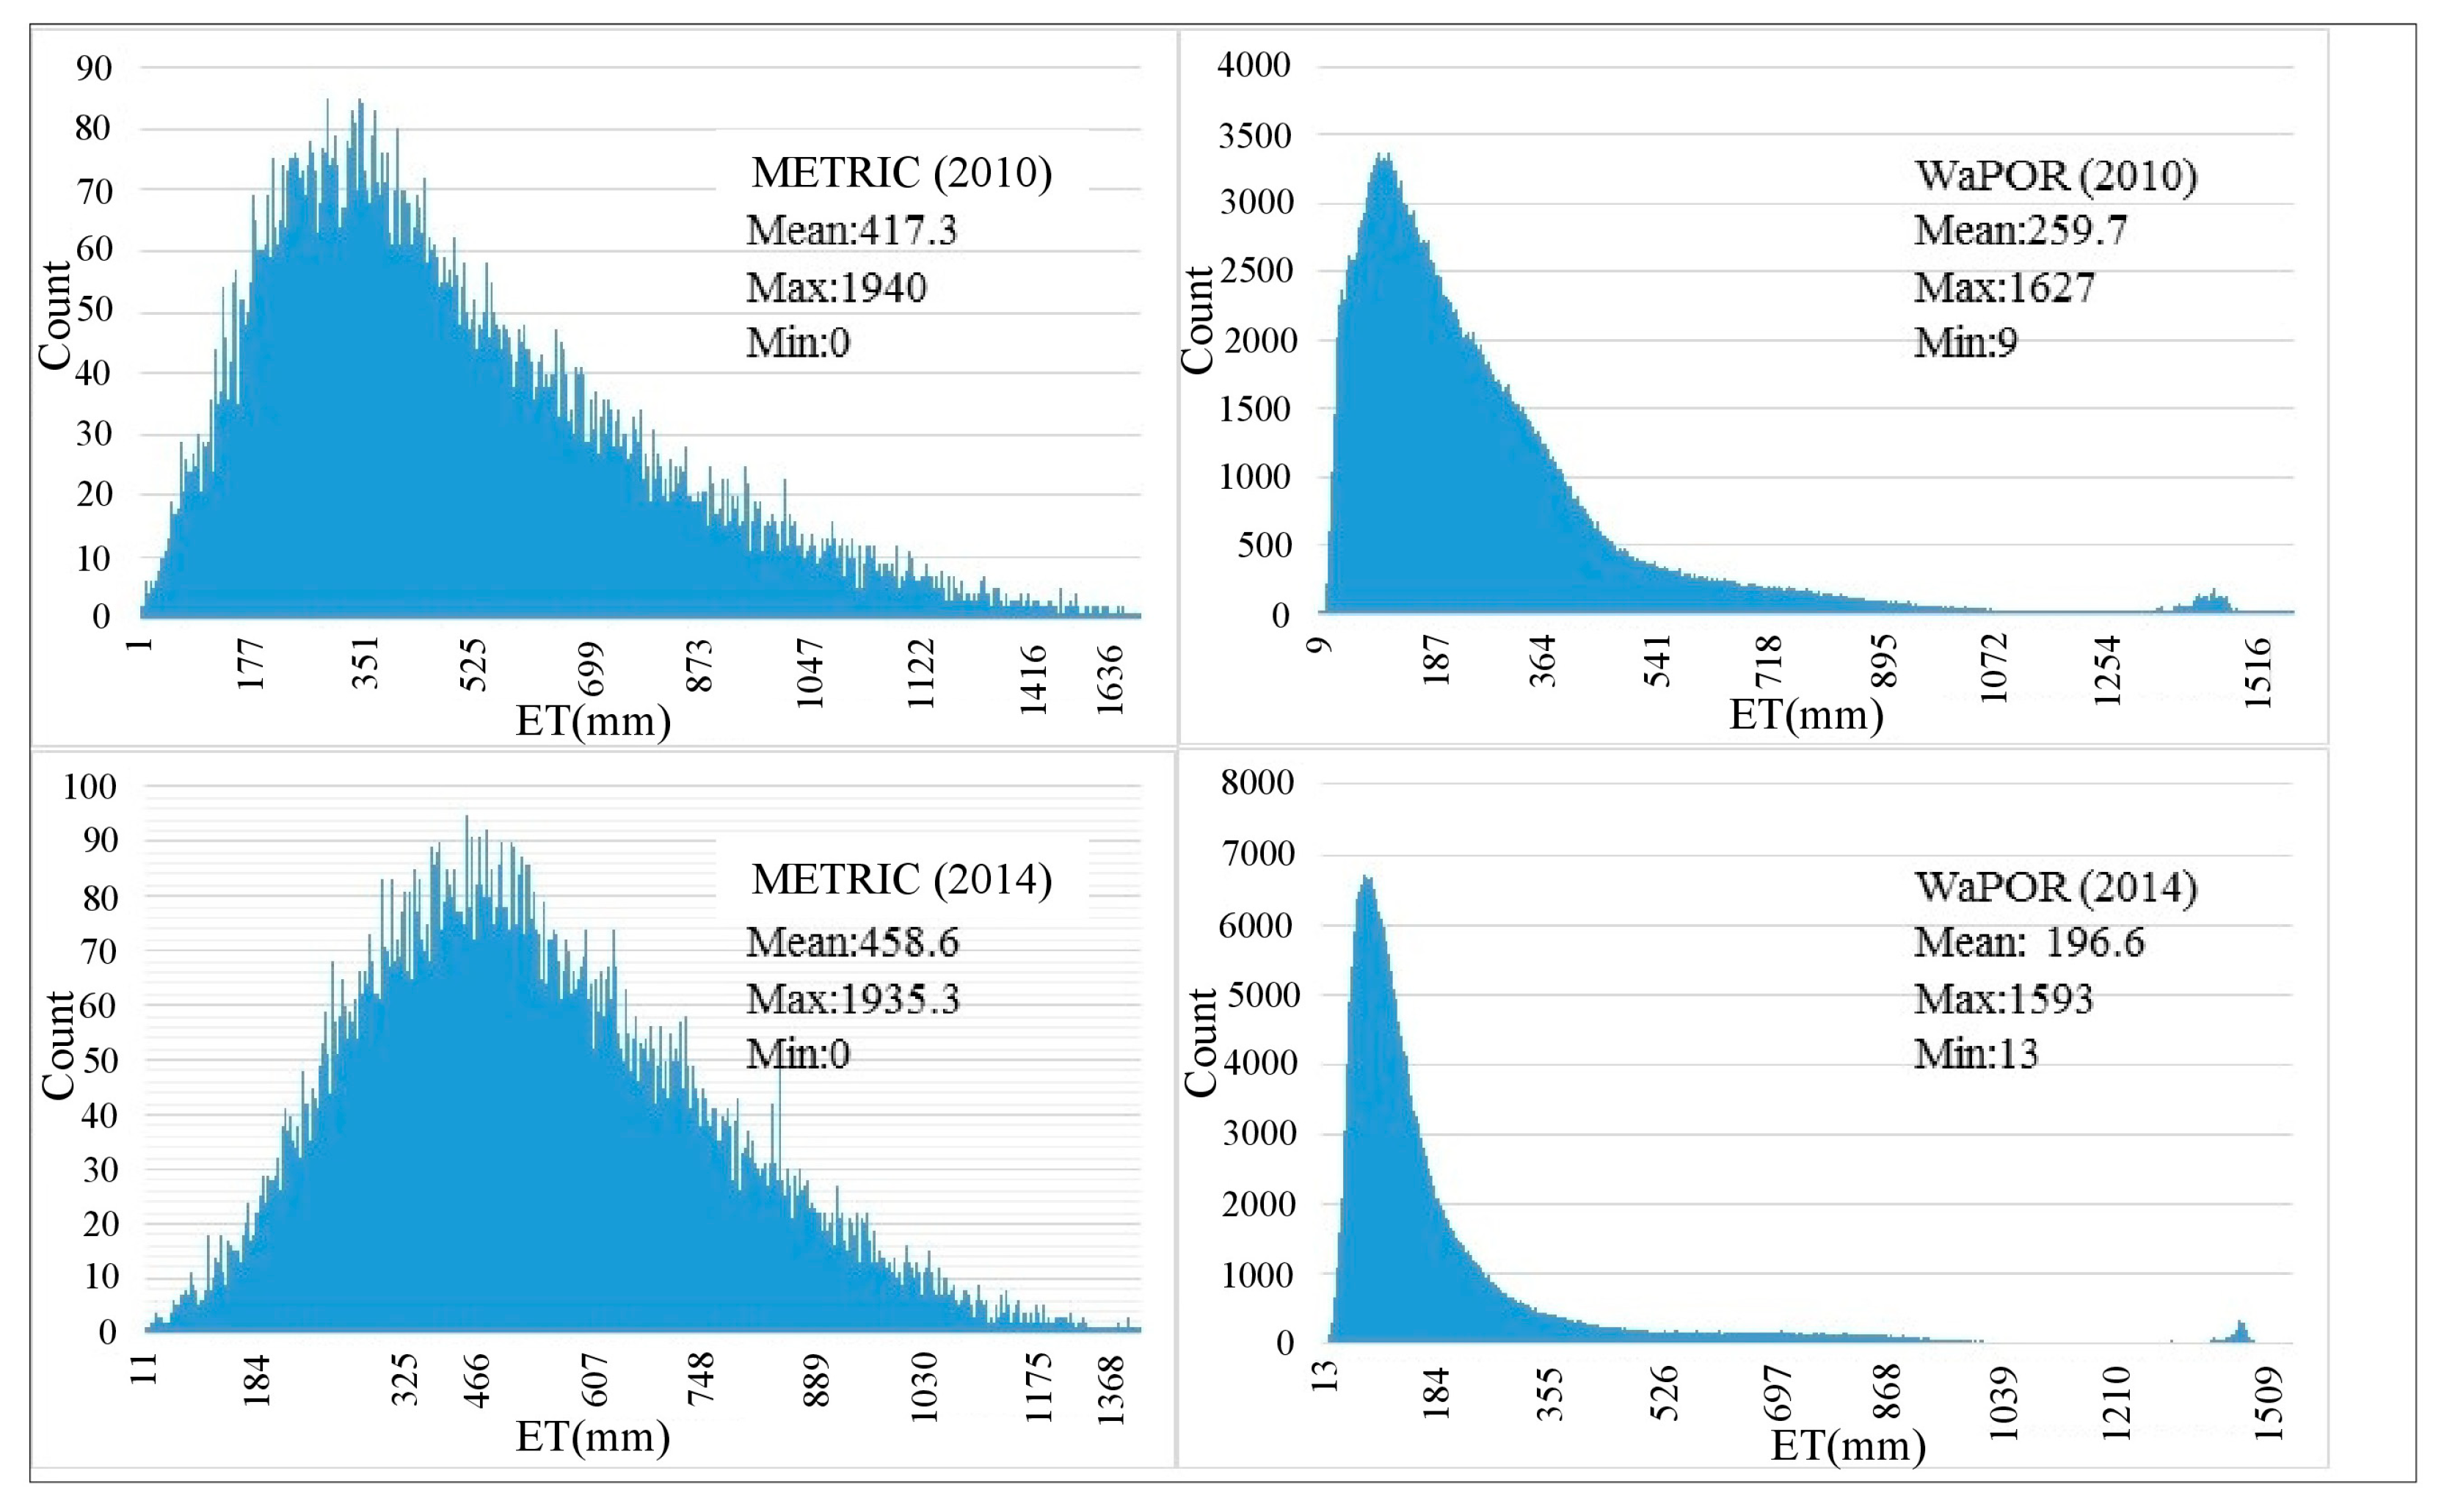
Figure 12.
Histogram of annual ET (2010 & 2014).

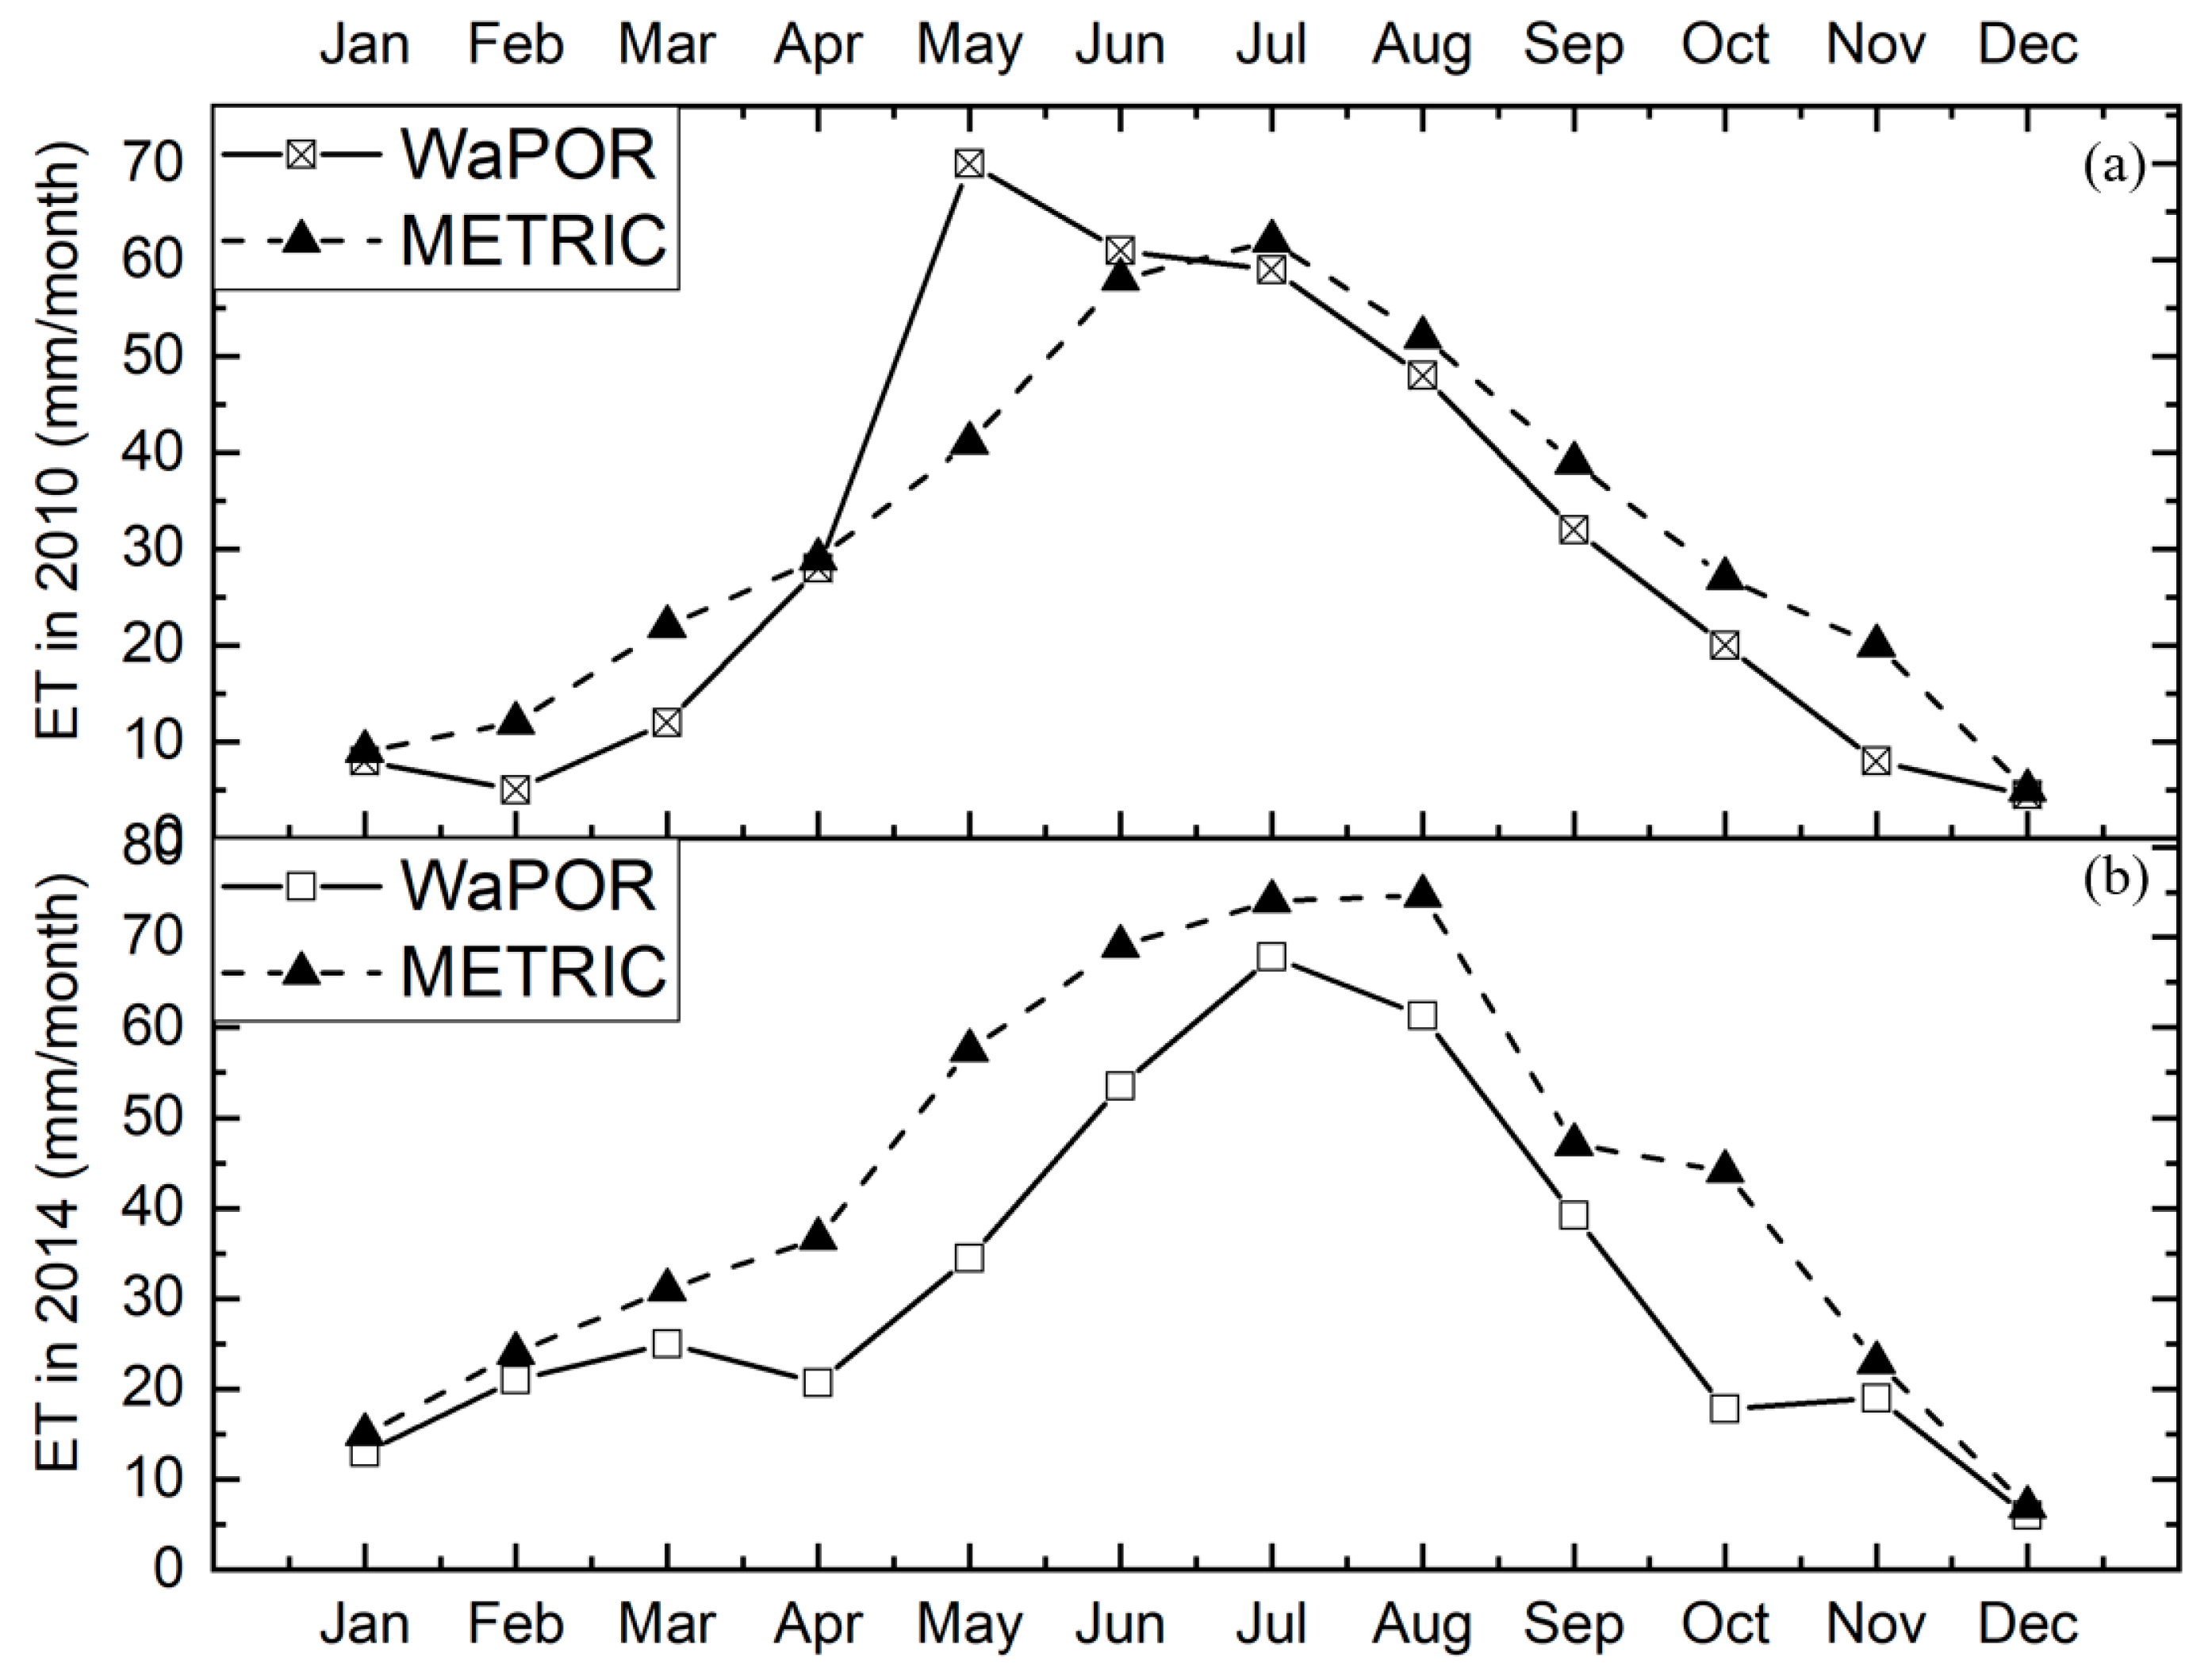
Figure 13.
Average ET in Urmia lake basin in year: (a) 2010 and (b) 2014.

Figure 14.
Monthly precipitation in Urmia weather station.

Figure 15.
Average monthly ET in agricultural landuse in Urmia lake sub-basins in year 2010: (a) Miandoab, (b) Urmia, (c) Sarab, (d) Naghade–Oshnavie (mm/month).
Figure 15.
Average monthly ET in agricultural landuse in Urmia lake sub-basins in year 2010: (a) Miandoab, (b) Urmia, (c) Sarab, (d) Naghade–Oshnavie (mm/month).

Figure 16.
Map of annual precipitation minus annual ET over rainfed agriculture calculated from: (a) METRIC algorithm for 2010, (b) WaPOR product for 2010, (c) METRIC algorithm for 2014 and (d) WaPOR product for 2014.
Figure 16.
Map of annual precipitation minus annual ET over rainfed agriculture calculated from: (a) METRIC algorithm for 2010, (b) WaPOR product for 2010, (c) METRIC algorithm for 2014 and (d) WaPOR product for 2014.


Table 1.
Inputs of energy balance algorithm with spatial and temporal resolution.
| Data | Product ID | Format | Temporal Res. | Spatial Res. |
|---|---|---|---|---|
| Land Surface Temperature (LST) | MOD11L2 | Raster | 5 min | 1 km |
| Leaf Area Index (LAI) | MCD15A3 | Raster | 4-day | 1 km |
| Normalized Difference Vegetation Index (NDVI) | MOD13A2 | Raster | 16-day | 1 km |
| Reflectance (all of band) | MOD02 & MOD09 | Raster | 5 min and daily | 1 km |
Table 2.
Statistical approach for automated cold and hot pixel selection based on Kjaersgaard et al. [28].
Table 2.
Statistical approach for automated cold and hot pixel selection based on Kjaersgaard et al. [28].
| Anchor Pixel | Step No | Procedure |
|---|---|---|
| Cold | 1 | Select the top 5% NDVI pixels within a predefined and filtered Area of Interest (AOI) |
| 2 | From the group in (1), calculate the average temperature among the coldest 20% of Ts | |
| 3 | Cold pixel candidates are pixels that have a Ts within ± 0.2 K of the average Ts from (2) and an albedo within ± 0.02 | |
| 4 | One pixel is selected from the group in (3) based on the homogeneity among its neighboring pixels | |
| Hot | 1 | Select the lowest 10% NDVI pixels within a predefined and filtered Area of Interest (AOI). |
| 2 | From the group in (1) calculate the average temperature among the hottest 20% Ts. | |
| 3 | One pixel is selected from the group in (2) that has a Ts ± 0.2 K of the average Ts and has high homogeneity among neighboring pixels |
Table 3.
Comparison between ETa of Tabriz lysimeter and the products (mm/day).
| Date | Lysimeter ET | METRIC ET | WaPOR ET |
|---|---|---|---|
| 27 May 2010 | 5 | 4.7 | 0.4 |
| 3 June 2010 | 4.1 | 3.8 | 1.3 |
| 9 July 2010 | 10.5 | 8.1 | 1.9 |
| 30 July 2010 | 2.2 | 3.1 | 1.5 |
Table 4.
Relative difference of average ET between WaPOR and METRIC in different elevations (2010 & 2014).
Table 4.
Relative difference of average ET between WaPOR and METRIC in different elevations (2010 & 2014).
| Elevation Ranges (m) | Average of Relative Spatial Difference between METRIC & WaPOR in 2010 | Average of Relative Spatial Difference between METRIC & WaPOR in 2014 |
|---|---|---|
| 1235–1400 | 1.12 | 1.08 |
| 1400–1600 | 1.23 | 1.31 |
| 1600–1800 | 3.61 | 4.12 |
| 1800–2000 | 4.79 | 4.05 |
| 2000–2200 | 4.23 | 3.85 |
© 2019 by the authors. Licensee MDPI, Basel, Switzerland. This article is an open access article distributed under the terms and conditions of the Creative Commons Attribution (CC BY) license (http://creativecommons.org/licenses/by/4.0/).
Share and Cite
MDPI and ACS Style
Javadian, M.; Behrangi, A.; Gholizadeh, M.; Tajrishy, M. METRIC and WaPOR Estimates of Evapotranspiration over the Lake Urmia Basin: Comparative Analysis and Composite Assessment. Water 2019, 11, 1647. https://doi.org/10.3390/w11081647
AMA Style
Javadian M, Behrangi A, Gholizadeh M, Tajrishy M. METRIC and WaPOR Estimates of Evapotranspiration over the Lake Urmia Basin: Comparative Analysis and Composite Assessment. Water. 2019; 11(8):1647. https://doi.org/10.3390/w11081647
Chicago/Turabian StyleJavadian, Mostafa, Ali Behrangi, Mohsen Gholizadeh, and Masoud Tajrishy. 2019. "METRIC and WaPOR Estimates of Evapotranspiration over the Lake Urmia Basin: Comparative Analysis and Composite Assessment" Water 11, no. 8: 1647. https://doi.org/10.3390/w11081647
Note that from the first issue of 2016, this journal uses article numbers instead of page numbers. See further details here.