Effect of the North Atlantic Thermohaline Circulation on Changes in Climatic Conditions and River Flow in Poland


1
Department of Hydrology and Water Management, Institute of Physical Geography and Environmental Planning, Faculty of Geographical and Geological Sciences, Adam Mickiewicz University, Krygowskiego str. 10, 61-680 Poznań, Poland
2
Polish Geophysical Society—The Baltic Branch, Waszyngtona str. 42, 81-342 Gdynia, Poland
3
Department of Urban Design and Regional Planning, Faculty of Architecture, Gdansk University of Technology, Narutowicza str. 11/12, 80-233 Gdansk, Poland
*
Author to whom correspondence should be addressed.
Water 2019, 11(8), 1622; https://doi.org/10.3390/w11081622
Submission received: 24 May 2019
/
Revised: 24 July 2019
/
Accepted: 1 August 2019
/
Published: 6 August 2019
(This article belongs to the Special Issue Effects of Oceanic-Atmospheric Oscillations on Rivers)
Abstract
:The purpose of this study is to find connections between the North Atlantic Thermohaline Circulation (NA THC), climate elements, such as cloud cover, precipitation, air temperature, sunshine duration, and relative humidity, and flow of rivers in Poland. The intensity of NA THC was characterized by the DG3L index, which was established to assess changes in the amount of heat transported by NA THC along with the transport of water to the Arctic. The paper explains and discusses the mechanism of impact of the NA THC changeability on the elements of the catchment water balance variability. The positive and negative phases of the DG3L index are strongly correlated with the heat anomalies in the upper layer of the North Atlantic waters. The obtained results show that changes of NA THC have significant impact on weather conditions and selected climate elements in Poland. Statistically significant positive correlations were found between the DG3L index and average annual air temperatures, particularly in April, July, and August, while negative between the DG3L index and the total cloud cover. Consequently, in the years with the positive values of the DG3L index, there are favorable conditions for the strong increase in evaporation and evapotranspiration from the ground surface. This has impact on flow of rivers in Poland, which shows considerable regional differences.
1. Introduction
Understanding of contemporary changes in climatic conditions and their hydrological consequences is one of the key issues in hydrological and climatological studies. Research on the impact of climate fluctuations and climate changes on hydrological processes is usually carried out by detecting trends in hydrological and climatological variables, mainly precipitation and air temperature, followed by analysis of their correlations with river flows. Such an analysis can be the starting point for determining the causes of the increase in hydrological anomalies observed in recent years, which in Poland are reflected in extremely low river flows [1,2,3,4].
Previous results of studies on long-term changes in the flow of rivers in Poland do not provide explicit conclusions on the causes of flow variations as a function of time [5,6,7,8]. It is also complicated to determine the causes of periodic and nonperiodic changes in the river flow trends. Labat et al. [9] introduced the wavelet transform to investigate temporal behavior of local precipitation and watershed runoffs of Licq–Atherey karstic system in southern France. The wavelet transform was also applied by Labat et al. [10] to estimate impact of global warming on the continental and global runoff. Lavado Casimiro et al. [11,12] analyzed relations between meteorological and hydrological elements in selected river catchments of Peru. While a clear positive temperature trend was detected in 1965–2007, there was no clear trend in rainfall in that period. Furthermore, relationships between rainfall and El Niño-Southern Oscillation (ENSO) events appeared to be limited, but there were relations between ENSO and the interannual temperature variability [11]. Additionally, human activity may have been responsible for changes in runoff [12]. Some authors [13,14,15,16,17] point at changes in precipitation and air temperature associated with changes in atmospheric circulation, especially the North Atlantic Oscillation, as the main cause.
Recent studies carried out in the Mediterranean Sea basin also confirmed relations between the marine water circulation and synoptic conditions of that area. De Serio et al. [18] investigated the hydrodynamics of the Mar Piccolo, a coastal basin located on the northern side of the Gulf of Taranto in the Ionian Sea in Italy. Results of the mathematical modelling were compared with the field measurements in terms of velocity. It was observed that during small tides, when the wind effect prevailed over the stratification effect, the best model results were obtained for the most superficial layer and that superficial patterns reproduced by the model were more sensitive to wind direction than to stratification. On the contrary, when the wind effect decreased or the thermohaline effect rose, best results occurred in deeper layers. Pinardi et al. [19] found the presence of an anticyclonic large-scale gyre occupying the central open ocean area of the Gulf of Taranto, thus providing the synoptic evidence of the large-scale circulation structure and associated meso-scale variability in that part of the Mediterranean. Federico et al. [20] developed a forecasting system called SANIFS to predict the three-dimensional fields of active tracers and hydrodynamics for the southern Adriatic and northern Ionian seas, with special regard to the Gulf of Taranto. Boero et al. [21] investigated water circulation patterns as one of key oceanographic features to define management and conservation marine units and identify networks of Marine Protected Areas in the Mediterranean and Black seas, coupled with sea-based wind energy potential.
The regulatory role of changes in the intensity of the North Atlantic Thermohaline Circulation in the course of hydrological processes in North America has been known for several years. Enfield et al. [22] found relationship between the AMO (Atlantic Multidecadal Oscillation) phase [23,24] and flows of the American rivers. The range of differences between these flows in the positive and negative phases of AMO varied from 10% in the Mississippi River basin to 40% in Florida, respectively. These variations were associated by Enfield et al. [22] with variability of precipitation recorded in the positive and negative phases of AMO. The influence of the AMO variability on the size of river flow in North America was confirmed by a number of other studies, as for example [25]. Oglesby et al. [26] proved connections between the AMO phase and the occurrence of droughts in North America. Boé and Habets [27] detected long-term oscillations with an interval of about 21 years in the flow of rivers in France and linked them with the influence of AMO. According to these researchers, these connections were particularly strong in spring, when the differences between the average flows in different phases of the Oscillation reached up to 40%. The reason for these connections is the variability of the large-scale atmospheric circulation regulated by AMO, which then regulates precipitation and air temperature over France in the spring season.
In previous studies, the authors attempted to detect connections between AMO and the variability of hydrological elements in Poland. However, the detected relationships were weak and statistically not significant [28].
Jokiel and Kożuchowski [5] and Gutry-Korycka and Boryczka [29] pointed at the occurrence of long-term, multidecadal variability in the annual flows of the largest Polish rivers. This variability was reflected in the occurrence of 30- to 40-year periods, during which the river flows were alternately larger and smaller than the average multiannual flows. This is the reason for the occurrence of subtrends in the time series of flows, with varying signs—alternately positive and negative. Marsz et al. [28] showed that the most important reason for this variability were changes in the North Atlantic Thermohaline Circulation (NA THC) intensity. These changes, by regulating a number of climate features, have a quasi-periodic impact on changes in the water balance of the catchment. The current state of research, however, does not provide more detailed picture of these dependencies. Thus, the question is how the relationships between the variability of the North Atlantic Thermohaline Circulation (hereinafter called: NA THC) and the flow of rivers in Poland are shaped in space and time.
The aim of this paper is to present results of research on determining relationships between the variability of the NA THC intensity and changes of the river flow in Poland, as well as of climatic mechanisms, which allow the impact of NA THC changes to be transferred to the water balance in river catchments. This would then allow us to better understand the causes of the long-term fluctuations in water resources of Central Europe.
2. Materials and Methods
2.1. Study Area and Data
Poland covers an area of 312,823 km2 and is characterized by relatively large differences of its environmental conditions, including topography, climate, and hydrology. While more than 75% of its territory is lower than 200 m A.S.l., the southern part of the country is occupied by mountains higher than 2000 m A.S.l. Woś [30] distinguished 28 climatic regions in Poland based mainly on thermal and pluvial differences. Consequently, conditions of river feeding and seasonal changeability of river flow are also differentiated. Runoff is characterized by a distinct zonality: the highest values, exceeding 1500 mm, are recorded on the south (mountain catchments of the Tatras), while in the central regions (Greater Poland, Kujawy, and a part of the Mazovian Lowland) it is as low as 100 mm (locally even lower than 60 mm), which makes that part of Poland has one of the poorest water resources in Europe. In the northern (lake-land) regions runoff is higher than 300 mm (Figure 1). Dynowska [31] identified five major types of hydrological regimes of the Polish rivers, namely: nival poorly developed, nival medium developed, nival clearly developed, nival-pluvial and pluvial-nival. Details of these types of regime can be found in Dynowska and Pociask-Karteczka [32] and Wrzesiński [33] (Figure 1). In addition, the influence of the macro-scale climatic phenomena on the country’s hydrological and meteorological elements in different regions of Poland shows relatively large variability.
In this study, we analyzed average monthly and annual cloudiness (total cloud cover), sunshine duration, relative humidity, air temperature, and precipitation recorded at 42 meteorological stations, and also daily discharges from 516 gauging stations located on 290 rivers in Poland in the multi-year period 1971–2015.
2.2. Methods
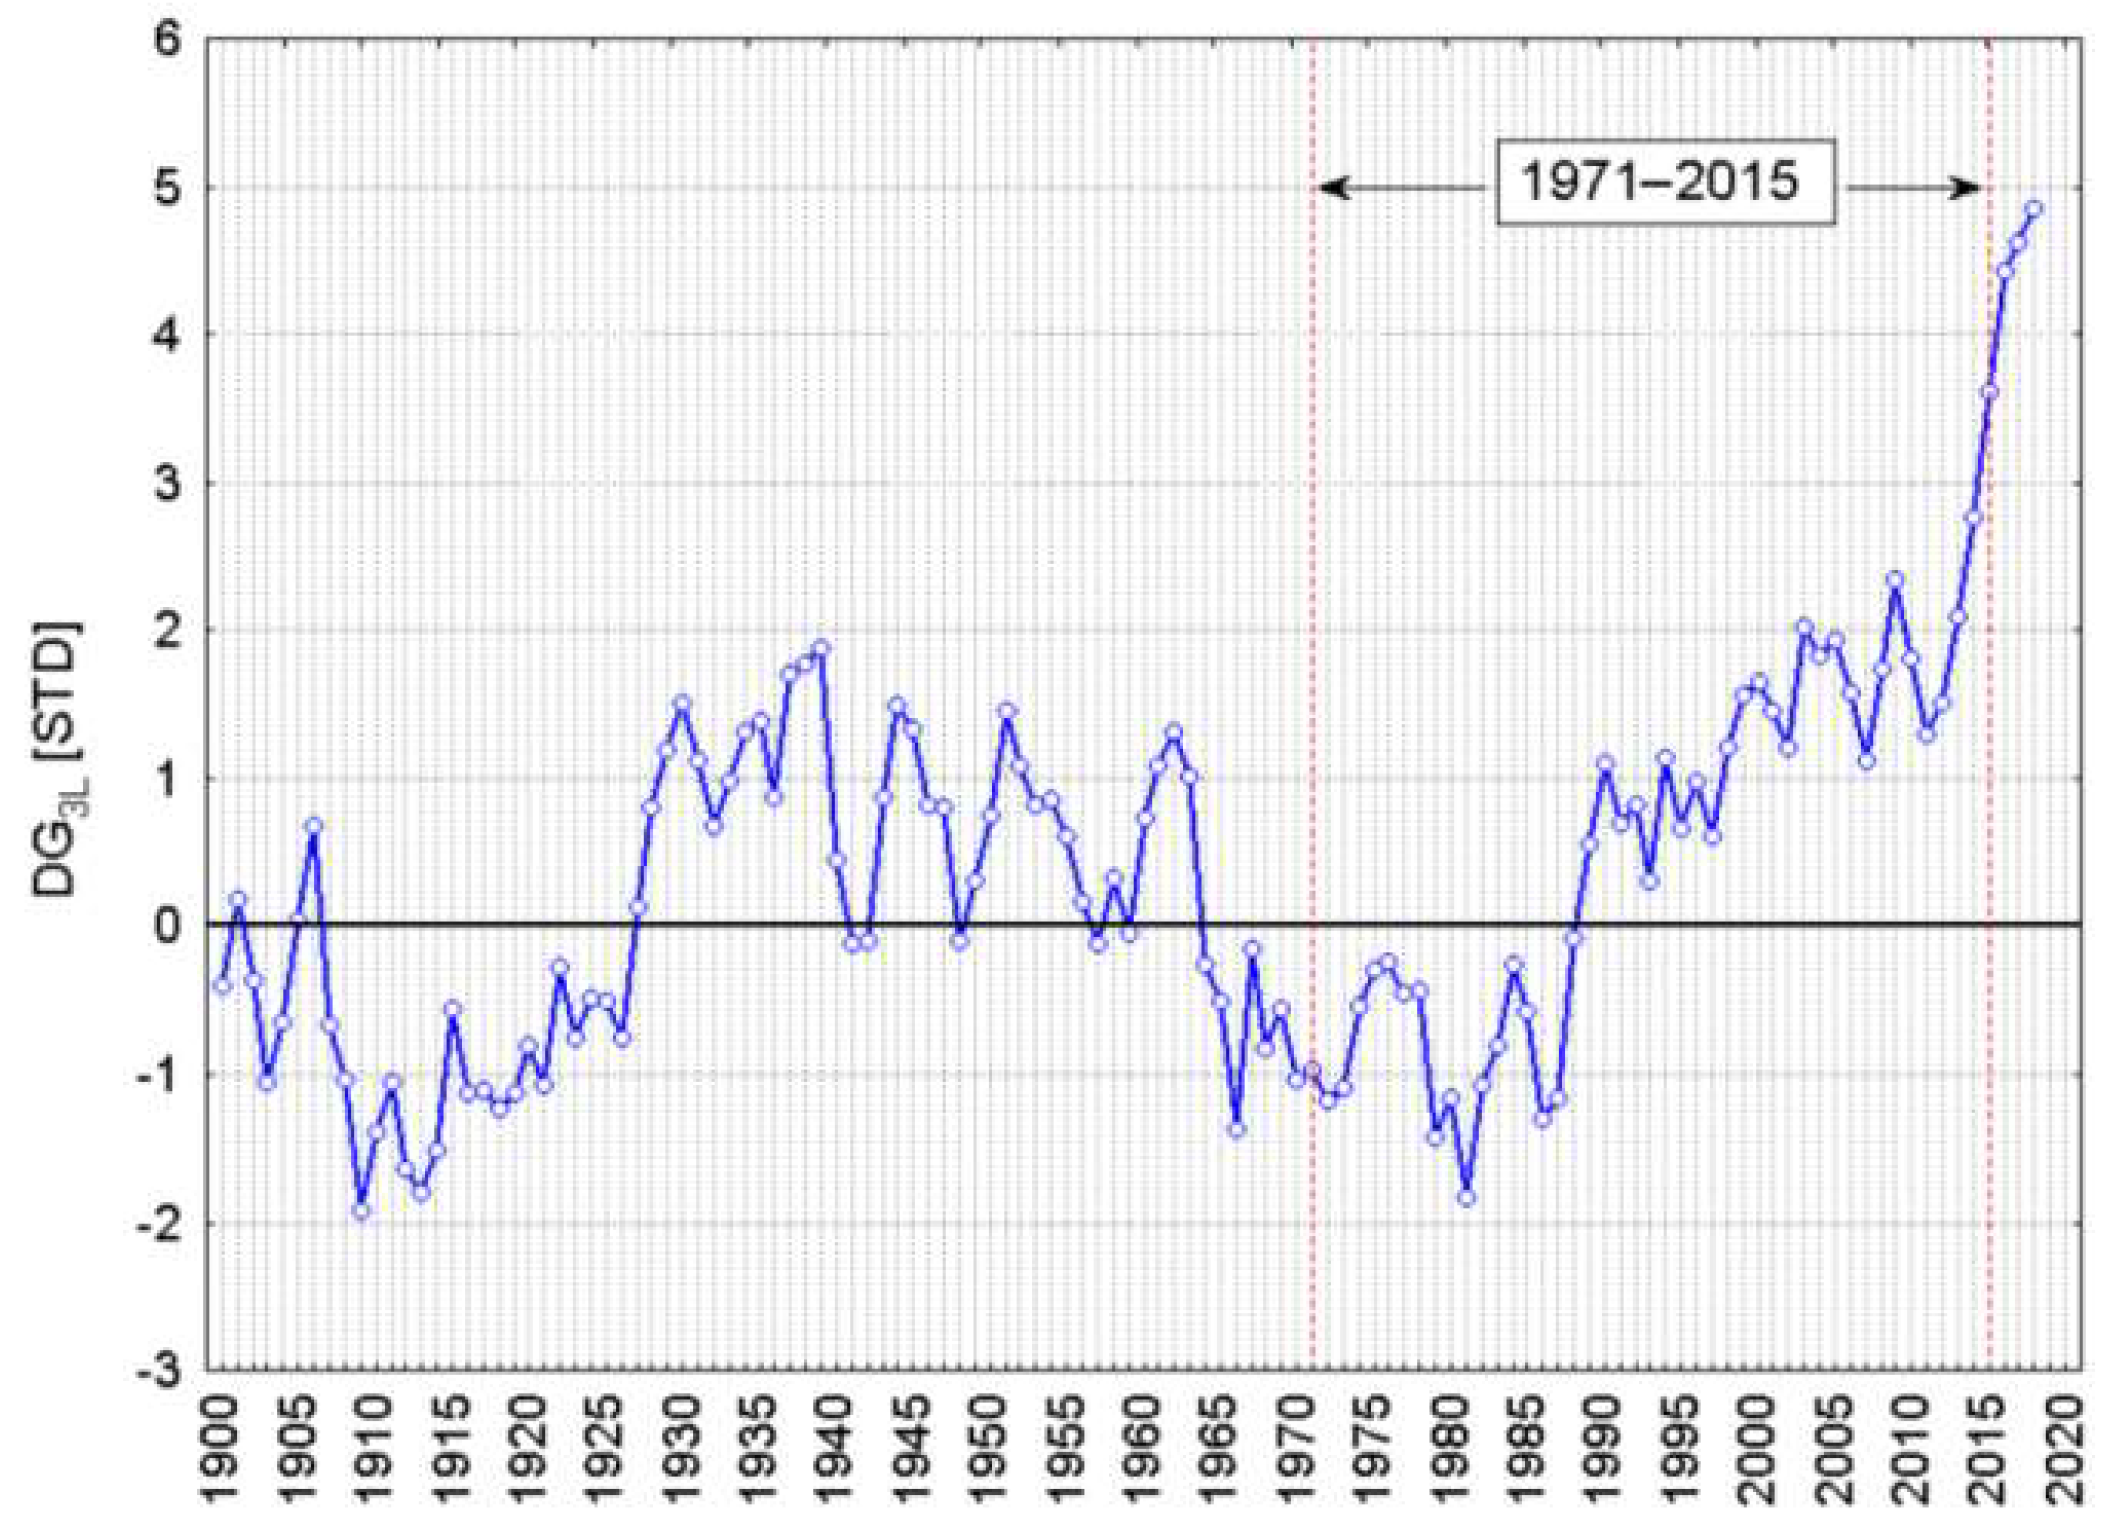
In order to characterize intensity of the North Atlantic Thermohaline Circulation, we introduced an index marked with the acronym DG3L. It was established to assess changes in the amount of heat transported by NA THC along with the transport of water to the north, to the Arctic [35,36]. Detailed physical explanation of its structure was presented by Marsz [36]. This index is calculated based on the Sea Surface Temperature (SST) values within the boundaries of the Sargasso Sea and the Gulf Stream waters (38° N–56° W). The data source for calculating that index was derived from the Extended Reconstructed Sea Surface Temperature (ERSST) v.3b set [37,38]. ERSST is a global monthly sea surface temperature dataset derived from the International Comprehensive Ocean-Atmosphere Dataset (ICOADS). The DG3L index takes into account the total advection heat transferred by the Gulf Stream system and the solar heat accumulated in tropical waters.
The first step in calculating the index is to obtain the average value from SST in February (02), August (08), and September (09), respectively, in k-year, designated as DG(k):
where k is the year number.
DG(k) = (SST02[38N,56W] + SST08[38N,56W] + SST09[38N,56W])/3,
The subsequent DG values from three years: from the previous two years (k − 2), from the previous one year (k − 1), and from the index-dating year (k), constitute the DGG index for a given year (k):
DGG(k) = 0.42DG(k) + 0.33DG(k − 1) + 0.25DG(k − 2)
In weighing the DGG(k) indicator a triangular, asymmetrical filter is used, which takes into account the so-called “signal prolongation” that means its slow weakening and disappearance as a function of time. This occurs when the temporal resolution of data (in this case annual) is smaller than the duration of the impulse (in this case three years, in the fourth year (k + 4) the impact of the signal from the k-th year equals zero). At the same time, the filter does not lose signal strength. Therefore:
- k-th year: 0.42;
- k − 1-th year: 0.33;
- k − 2-th year: 0.25.
The sum of these coefficients is 1 because the entire signal from a given year is used up within three years.
The calculated index in this way is expressed in °C. Then, in order to transform it into a dimensionless value of anomaly, it is standardized against the average value from the years 1901–2000 (mean 23.25, σ = 0.28):
DG3L(k) = (DGG(k) − 23.25)/0.28
The course of the DG3L index is shown in Figure 2, while its values for the period 1880–2018 are presented in Table A1 (Appendix A). The DG3L index is strongly correlated with the heat anomalies in the upper (0–700 m) layer of the North Atlantic waters (Data source: NAtlantic_Ocean_Heat_content_h22-a0-700m (www.nodc.noaa.gov/OC5/3M_HEAT_ CONTENT/basin_data.html)) (r = 0.81, 1955–2017) and also with the unsmoothed and not detrended AMO index (r = 0.68, 1951–2017) (Data source: AMO unsmoothed from the Kaplan SSTv2. Calculated at NOAA/ESRL/PSD1. (http://www.esrl.noaa.gov/psd/data/timeseries/AMO/)). It shows strong correlations with the annual global temperature anomalies (r = 0.70), the annual temperature anomalies of the Northern Hemisphere (r = 0.76), and the annual temperature anomalies recorded in the temperate zone of the Northern Hemisphere (Data source: ZonAnn.Ts.txt (https://data.giss.nasa.gov/gistemp/tabledata_v3/ZonAnn.Ts.txt)) (r = 0.72, 1951–2017).
The course of the DG3L index, regardless of its intra-year variability, is characterized by the occurrence of the positive and negative phases in the multidecadal time scale (Figure 2), in which the positive or negative average values of the index prevail. The positive phases refer to the periods of the increased intensity of NA THC compared to the average value from the years 1901–2000, while the negative ones to the periods with the decreased intensity of the northward ocean heat transport through NA THC. The positive phases of NA THC correspond to the positive phases of the Atlantic Multidecadal Oscillation (AMO), and vice versa. In the years 1880–2017 the index was quasi-periodic with a period of about 70 years (Figure 2). Transitions from the positive to the negative phase (and vice versa) are relatively fast, and on average last for 2–4 years.
In the next stage, we calculated the Pearson correlation coefficients between the DG3L index values and values of average monthly and annual climate elements and river flows in Poland in 1971–2015. In the case of climate elements, such as the total cloud cover, precipitation, air temperature, sunshine duration, and relative humidity, we used values recorded at 22 meteorological stations evenly distributed over Poland. River flows were analyzed separately by correlating series of the daily flow values recorded at 516 gauging stations located on 290 rivers in Poland in the multi-year period 1971–2015 with the series of the DG3L values.
In order to explain relationships between the climate elements and the DG3L index we calculated linear correlations between that index and the annual frequency of macrotypes W, E, and C of the mid-tropospheric circulation (geopotential height of 500 hPa) according to classification by Girs [39], and also between the DG3L index and the frequency of the lower circulation types C2D and D2C according to classification by Osuchowska-Klein [40,41]. The analysis of relationships between the DG3L index and macrotypes W, E, and C referred to the period 1951–2015, while that between the DG3L index and the circulation types C2D and D2C to the period 1951–1990. This was conditioned by the availability of the time series of the lower circulation types.
Changes of the monthly and annual values of the analyzed meteorological and hydrological elements in the positive and negative phases of DG3L were determined for air temperature, precipitation, and river flow. Differences in the values of these elements in the positive and negative phases of DG3L were calculated in relation to their average values from the years 1971–2015. The period 1971–2015 used in the analyses was conditioned by the availability of complete data series on the river flow. The positive phase was chosen for 11 years with high DG3L indices (DG3L > 1.55), while the negative phase for 11 years with low DG3L indices (DG3L < −0.56). These numbers correspond to the values of the third and first quartiles from the entire set of the DG3L indices in 1971–2015, respectively. Statistical significance of the detected differences was examined by the Student’s t-test for dependent samples [42]. Each time the null hypothesis H0: μ = μ0 on the equality of the expected values was tested against H1: μ ≠ μ0. Rejection of the null hypothesis allowed to conclude significant differences between the values of the analyzed elements in different phases of DG3L and their average values from 1971 to 2015. In order to verify the hypothesis, we applied a small-sample test based on the Student’s t-distribution with n − 1 degrees of freedom:
where: n—sample size, s—standard deviation, —sample mean, μ0—average from the population [42].
3. Results
The analysis allowed identifying mechanisms of the impact of the variability of the NA THC intensity on climate elements and river flow in Poland, and consequently its impact on the elements of the catchment water balance.
3.1. Impact of NA THC on Mechanism of Air Circulation
In the construction of the DG3L index, a slow propagation of the THC signal and the long-term impact of changes in the heat resources of the North Atlantic waters on climate are considered.
The influence of the THC changes on air circulation over Poland is complex. In a given year the impact of the change in the DG3L index on weather conditions extends over the next two to three years. The reason for this can be explained by the structure of the index, which takes into account that the THC signal from a given year spreads slowly, and in the North Atlantic waters (50–60° N) it appears as still relatively strong only after one year, while in the Arctic waters (the Barents Sea, the Greenland Sea) even later.
A credible explanation of the functioning of the climate mechanism requires going beyond the period 1971–2015, for which in this study the analysis of relationships between NA THC and river flow is carried out. To simplify, only links between the NA THC changes and changes in weather conditions taking place in the same year will be considered below.
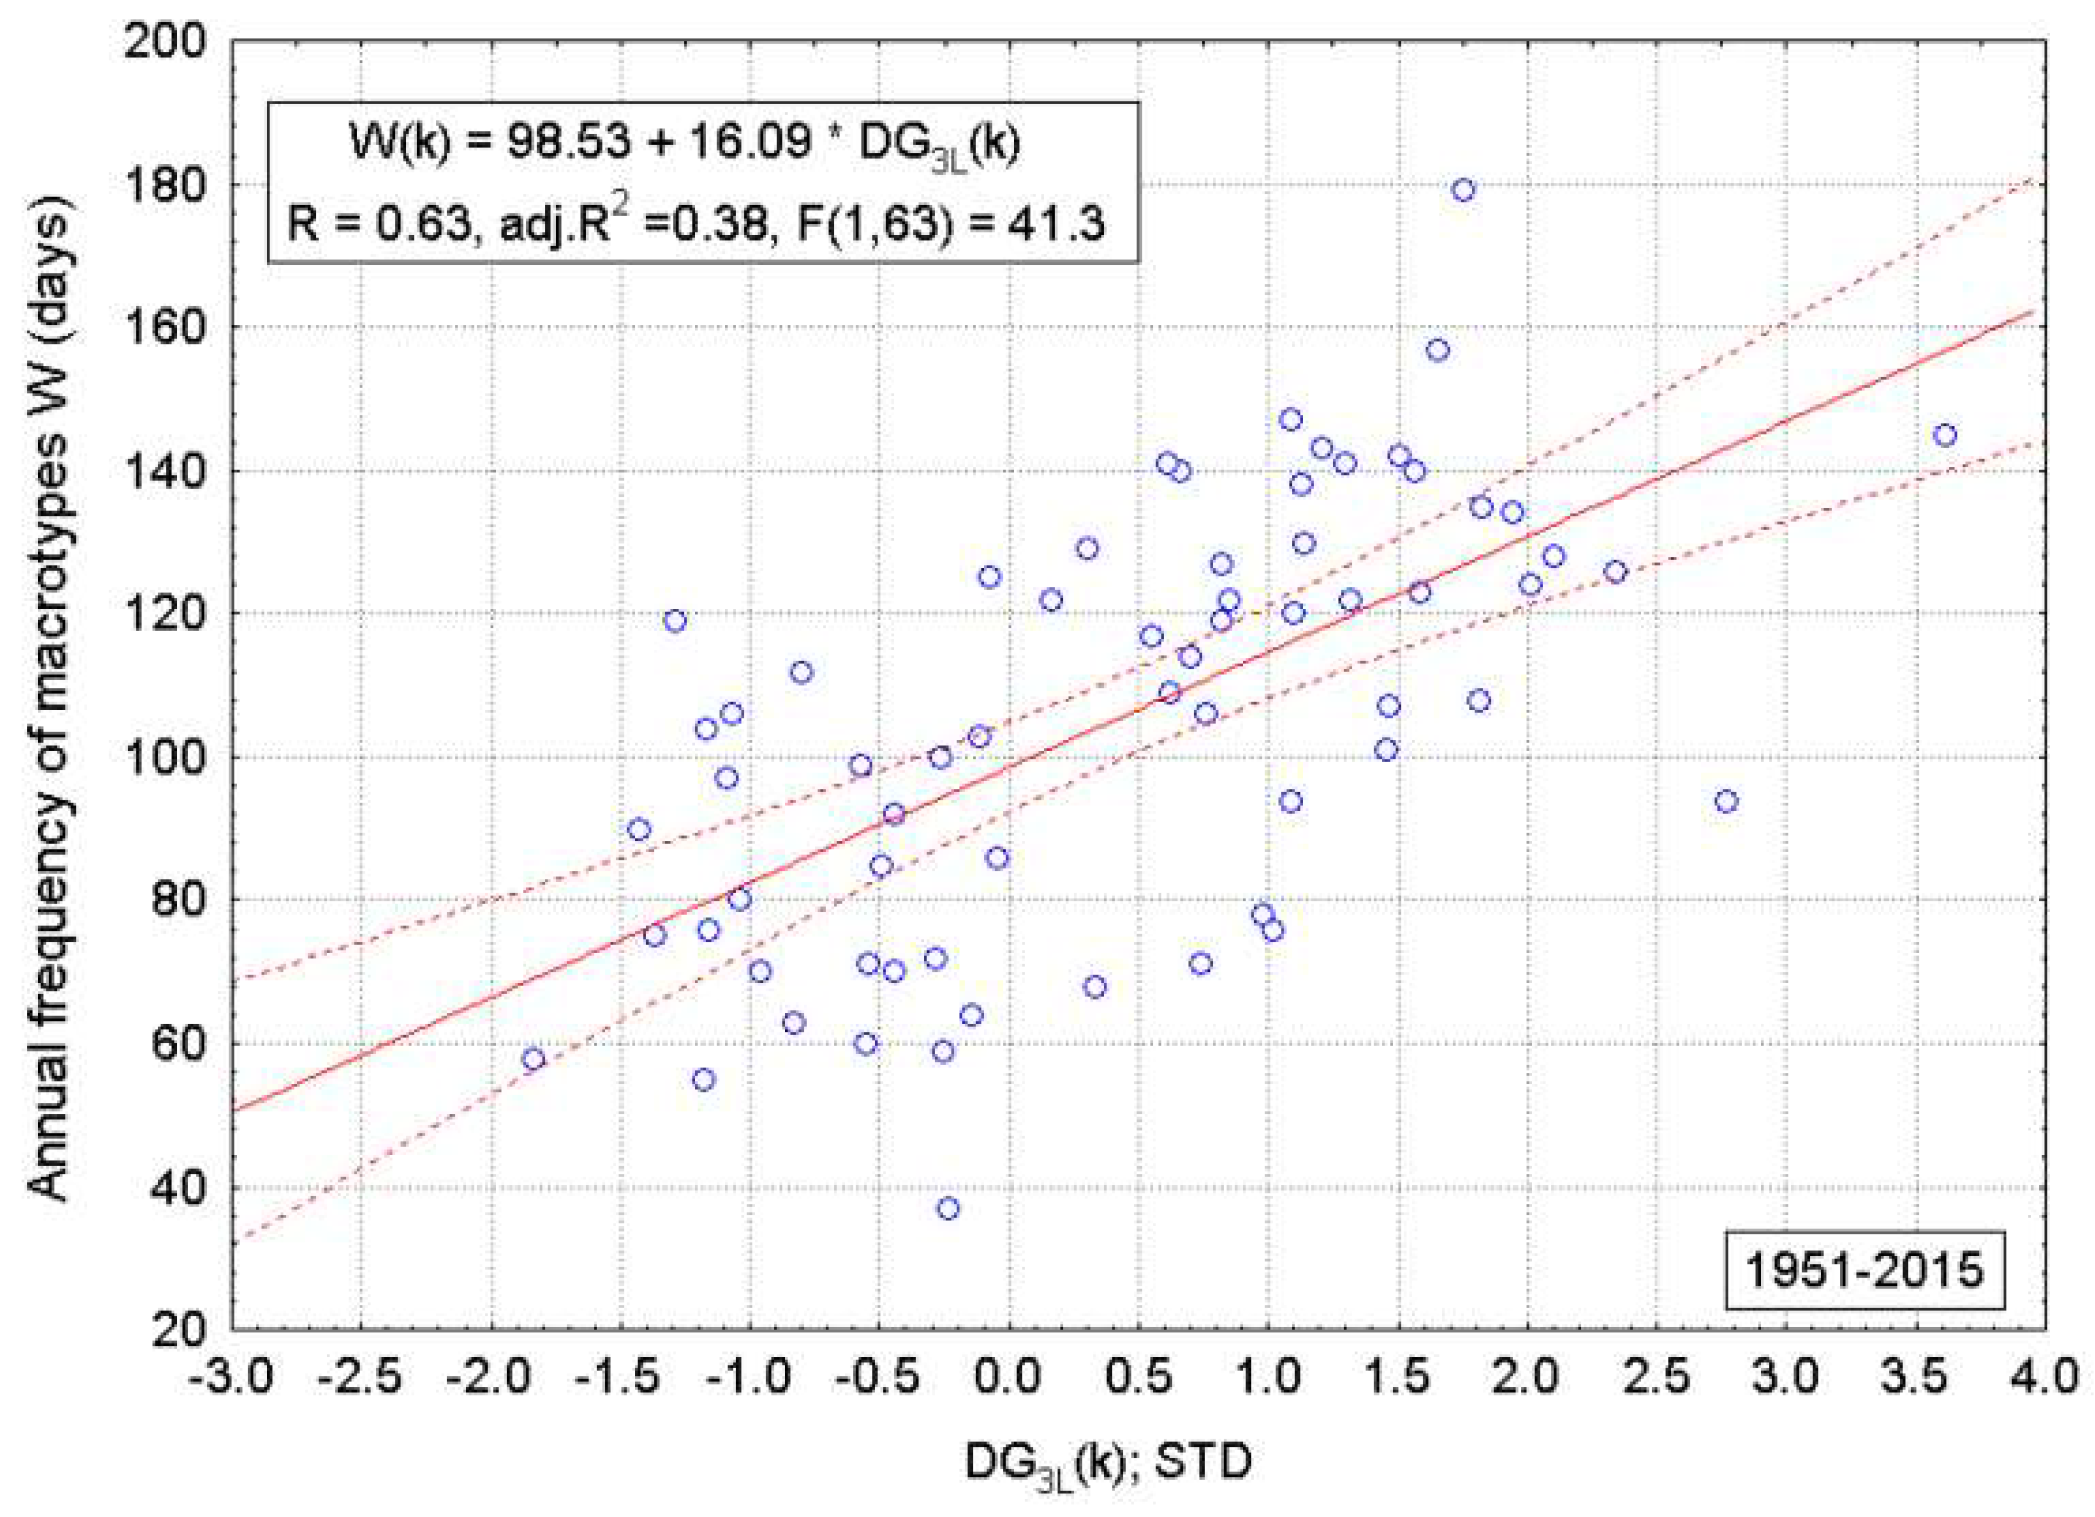
The increase in the intensity of NA THC, reflected in the increase of the DG3L index, results in the increased heat transport along with the northward transport of waters. Then, the heat resources in the waters of the subtropical, temperate, and subpolar zones of the North Atlantic grow. The earliest increase of the heat resources of waters is recorded in the subtropical latitudes (31–39° N) of the central part (51–29° W) of the North Atlantic. Changes in the intensity of the heat flow from the ocean to the atmosphere result in modification of the long-wave system (the Rossby waves) over the North Atlantic. This modification leads to the increase in the frequency of macrotype W of the mid-tropospheric circulation (500 hPa), according to classification by Girs [35] (Figure 3), and to simultaneous decrease in the frequency of macrotype E in the whole Atlantic-Eurasian circulation sector (Coefficient of correlation between the annual frequency of macrotype W and macrotype E equals −0.89 (p < 0.001; 1971–2015)). Macrotypes (frequency of macrotypes) of the mid-tropospheric circulation control the processes of air circulation in the lower atmosphere (distribution of SLP, changes of pressure-area).
The occurrence of macrotype W implies the appearance of the zonal circulation, and the occurrence of macrotype E (and not discussed here macrotype C) results in the appearance of a strong meridional circulation in the central and lower troposphere of the Atlantic-European circular sector. Because the number of days in a year, season, or month is finite, the increase in the frequency of one macrotype in a given period results in the decrease in the frequency of the remaining macrotypes by the same number. Such changes in the mid-tropospheric circulation, through their impact on synoptic situation of the lower atmosphere, result in a number of effects in the course of weather conditions over Central Europe in a given year.
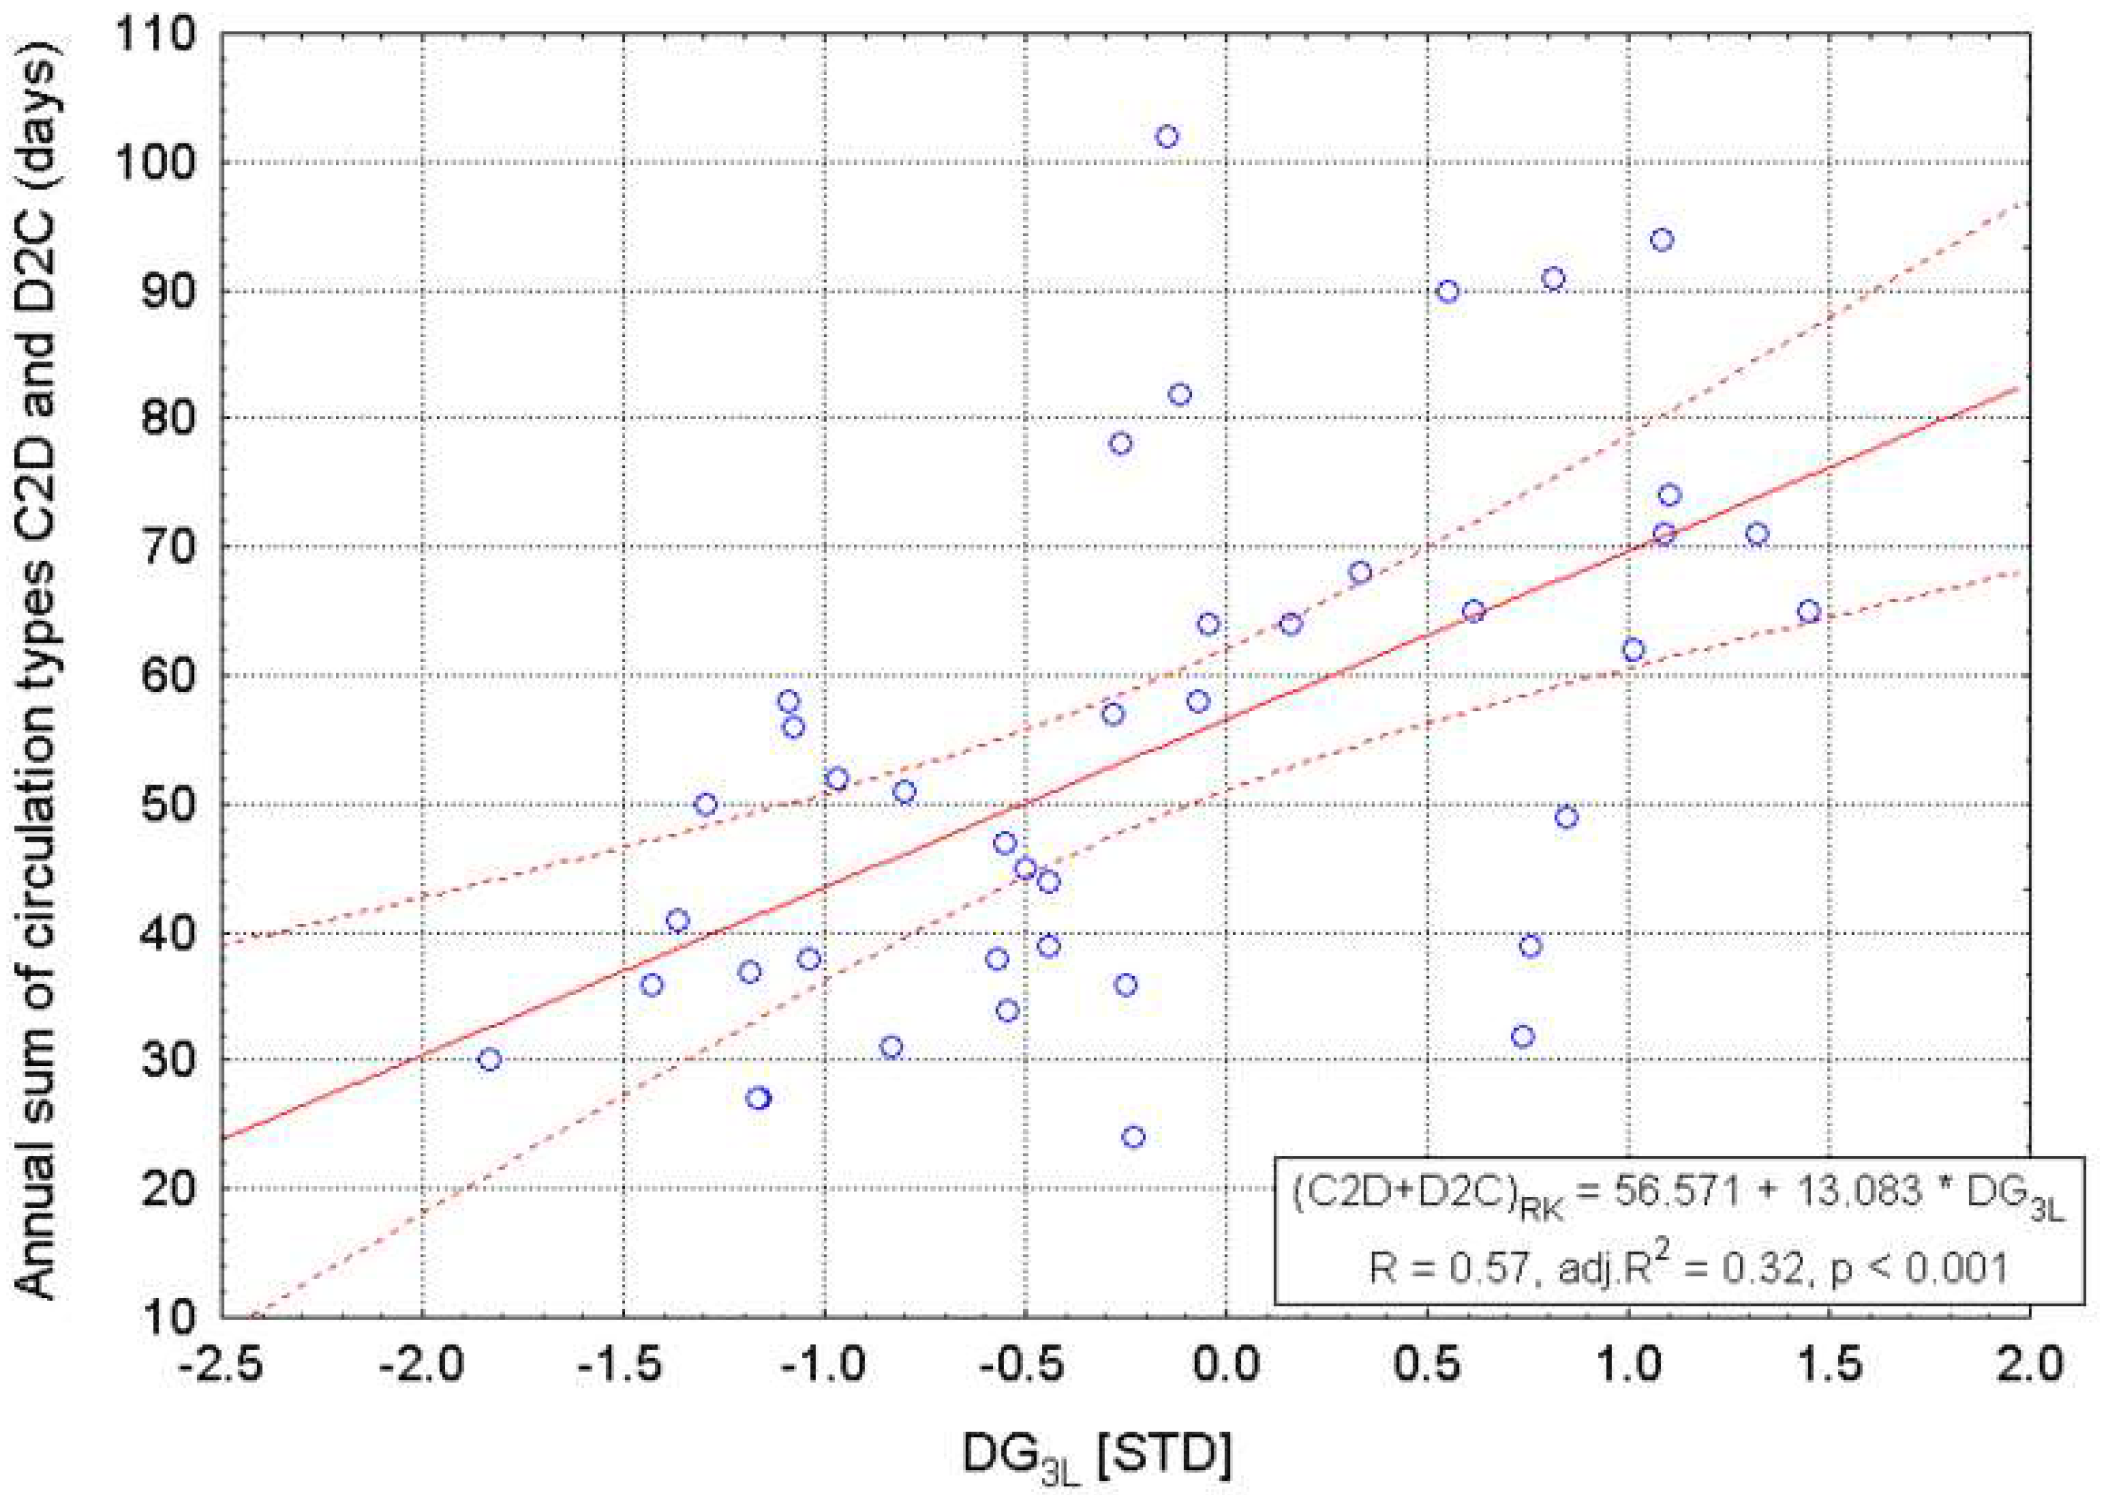
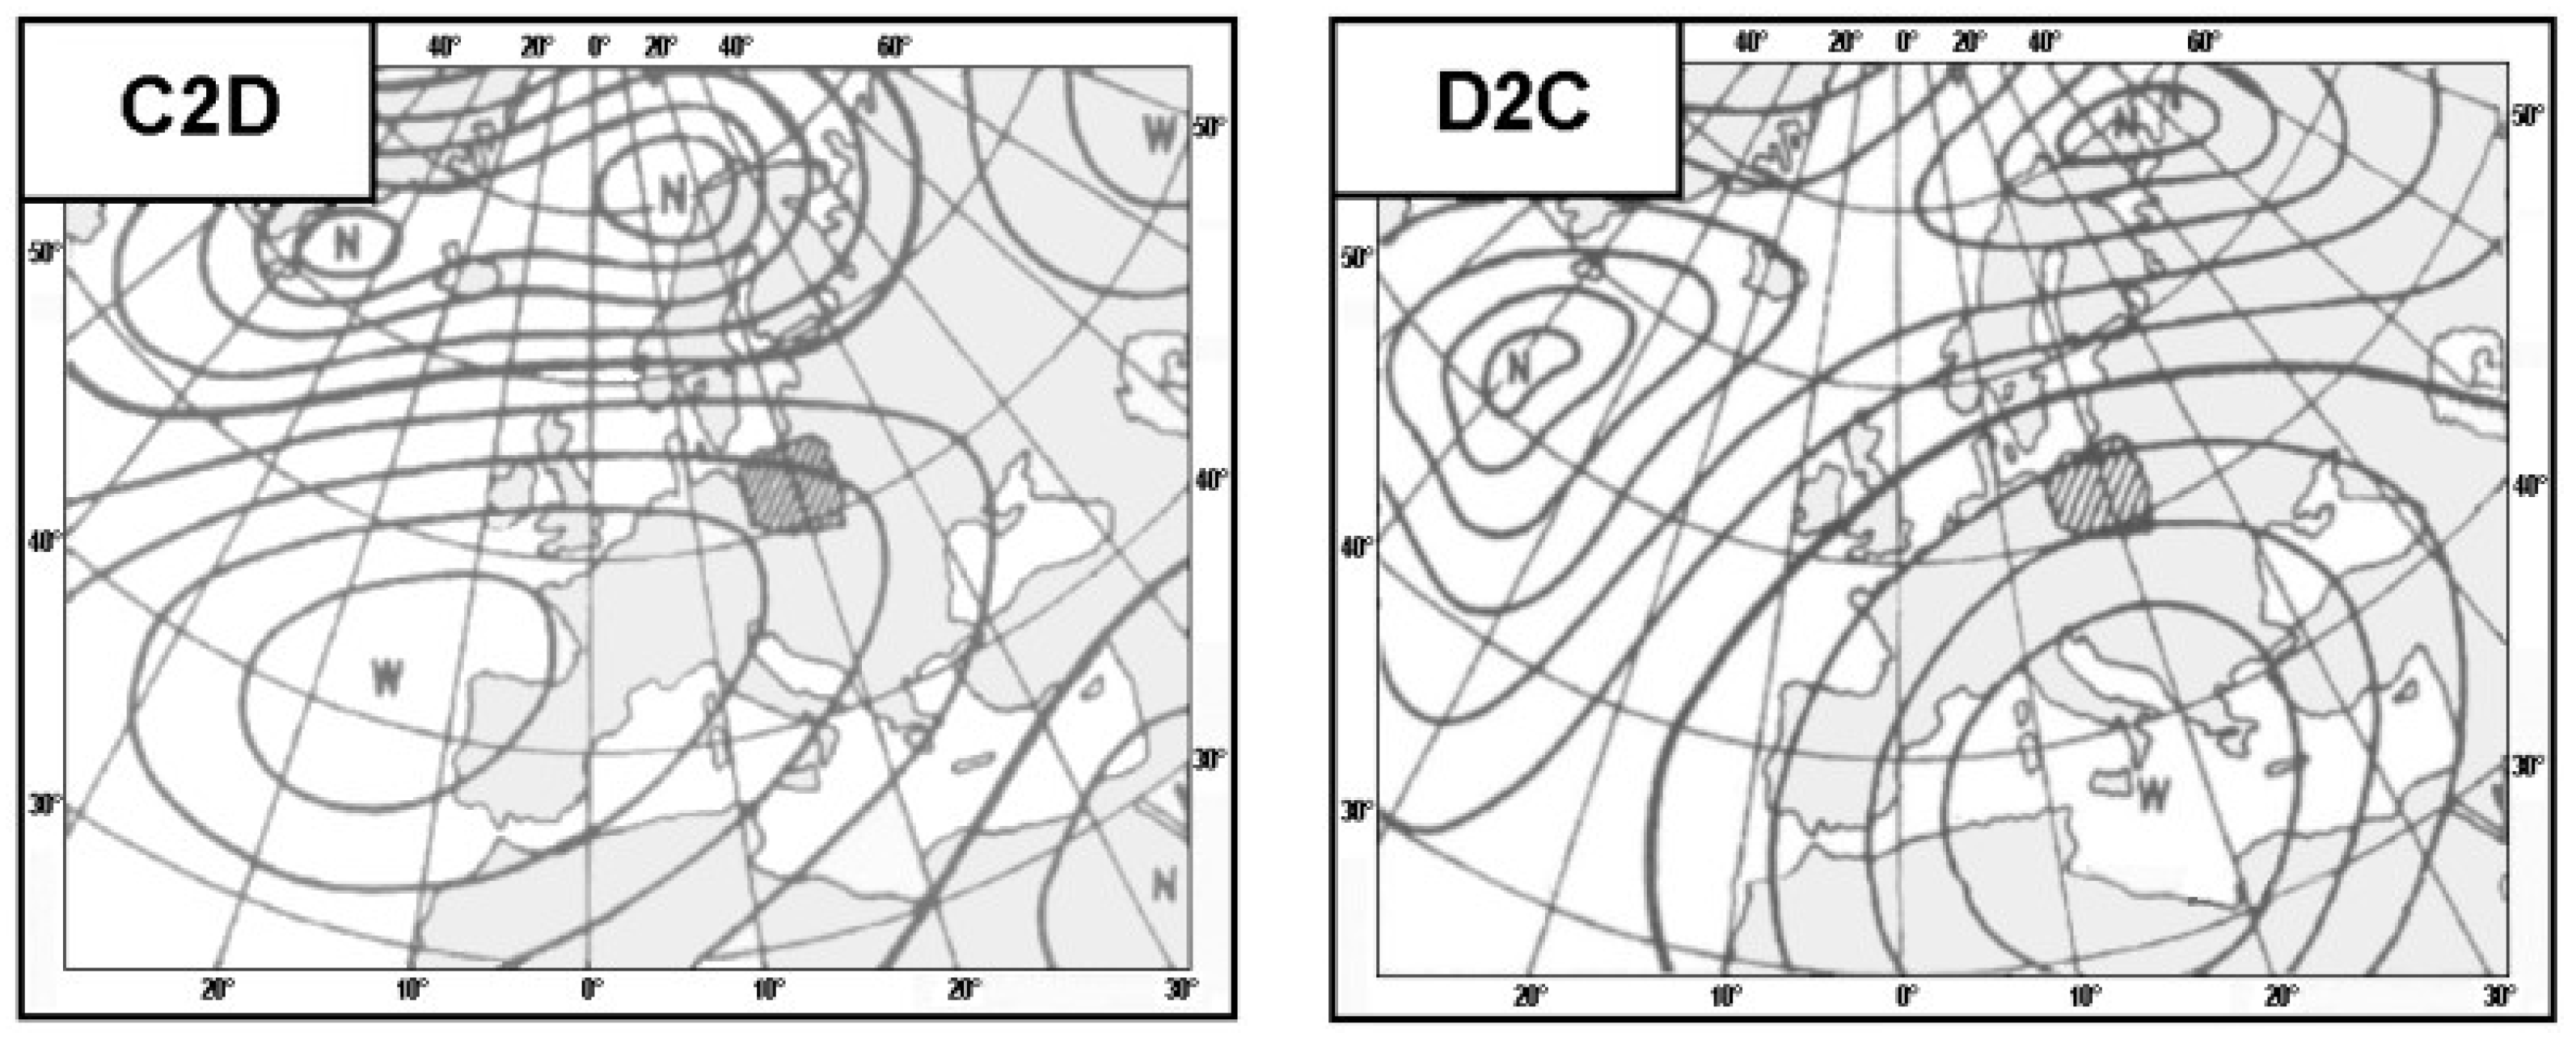
The occurrence of macrotype W is associated with the statistically significant increase in the frequency of two types (C2D and D2C) of the lower atmospheric circulation, according to classification by Osuchowska-Klein [40,41] (Figure 4 and Figure 5). In the lower pressure area, this is reflected by a shift of the center of the Azores High towards E-NE and the formation of its trough, extending farther east over Europe, to 25–35° E. The two types of circulation direct warm moist air masses from the Atlantic Ocean over Central Europe. These air masses are slowly transformed into the continental air masses when flowing over Europe, and in spring and summer, after a few days of lingering over Central Europe (including Poland), they are entirely transformed into dry and warm continental air masses. Statistically, these types of circulation show the highest frequency of occurrence in the spring and summer periods (March to August).
The increased frequency of macrotype W (and the above-mentioned types of air circulation in the lower atmosphere) increases the frequency of sunny weather, with low cloudiness and weak winds from SW to S or varying directions over Poland. Precipitation recorded during such weather is only convective, usually of high intensity, but also of short duration and very limited spatial extent. These weather conditions are recorded in the recurring periods, when occur the lower atmospheric circulation types C2D and D2C, lasting from several to even over a dozen days. In years with higher intensity of NA THC increases the frequency of macrotype W and the associated with it types of circulation C2D and D2C. As a result of the increase in the frequency of the described weather conditions, which are a consequence of the entire chain of dependences in the atmospheric processes, some meteorological elements show a direct correlation with the DG3L index.
3.2. Relationships between the DG3L Index and Climate Elements
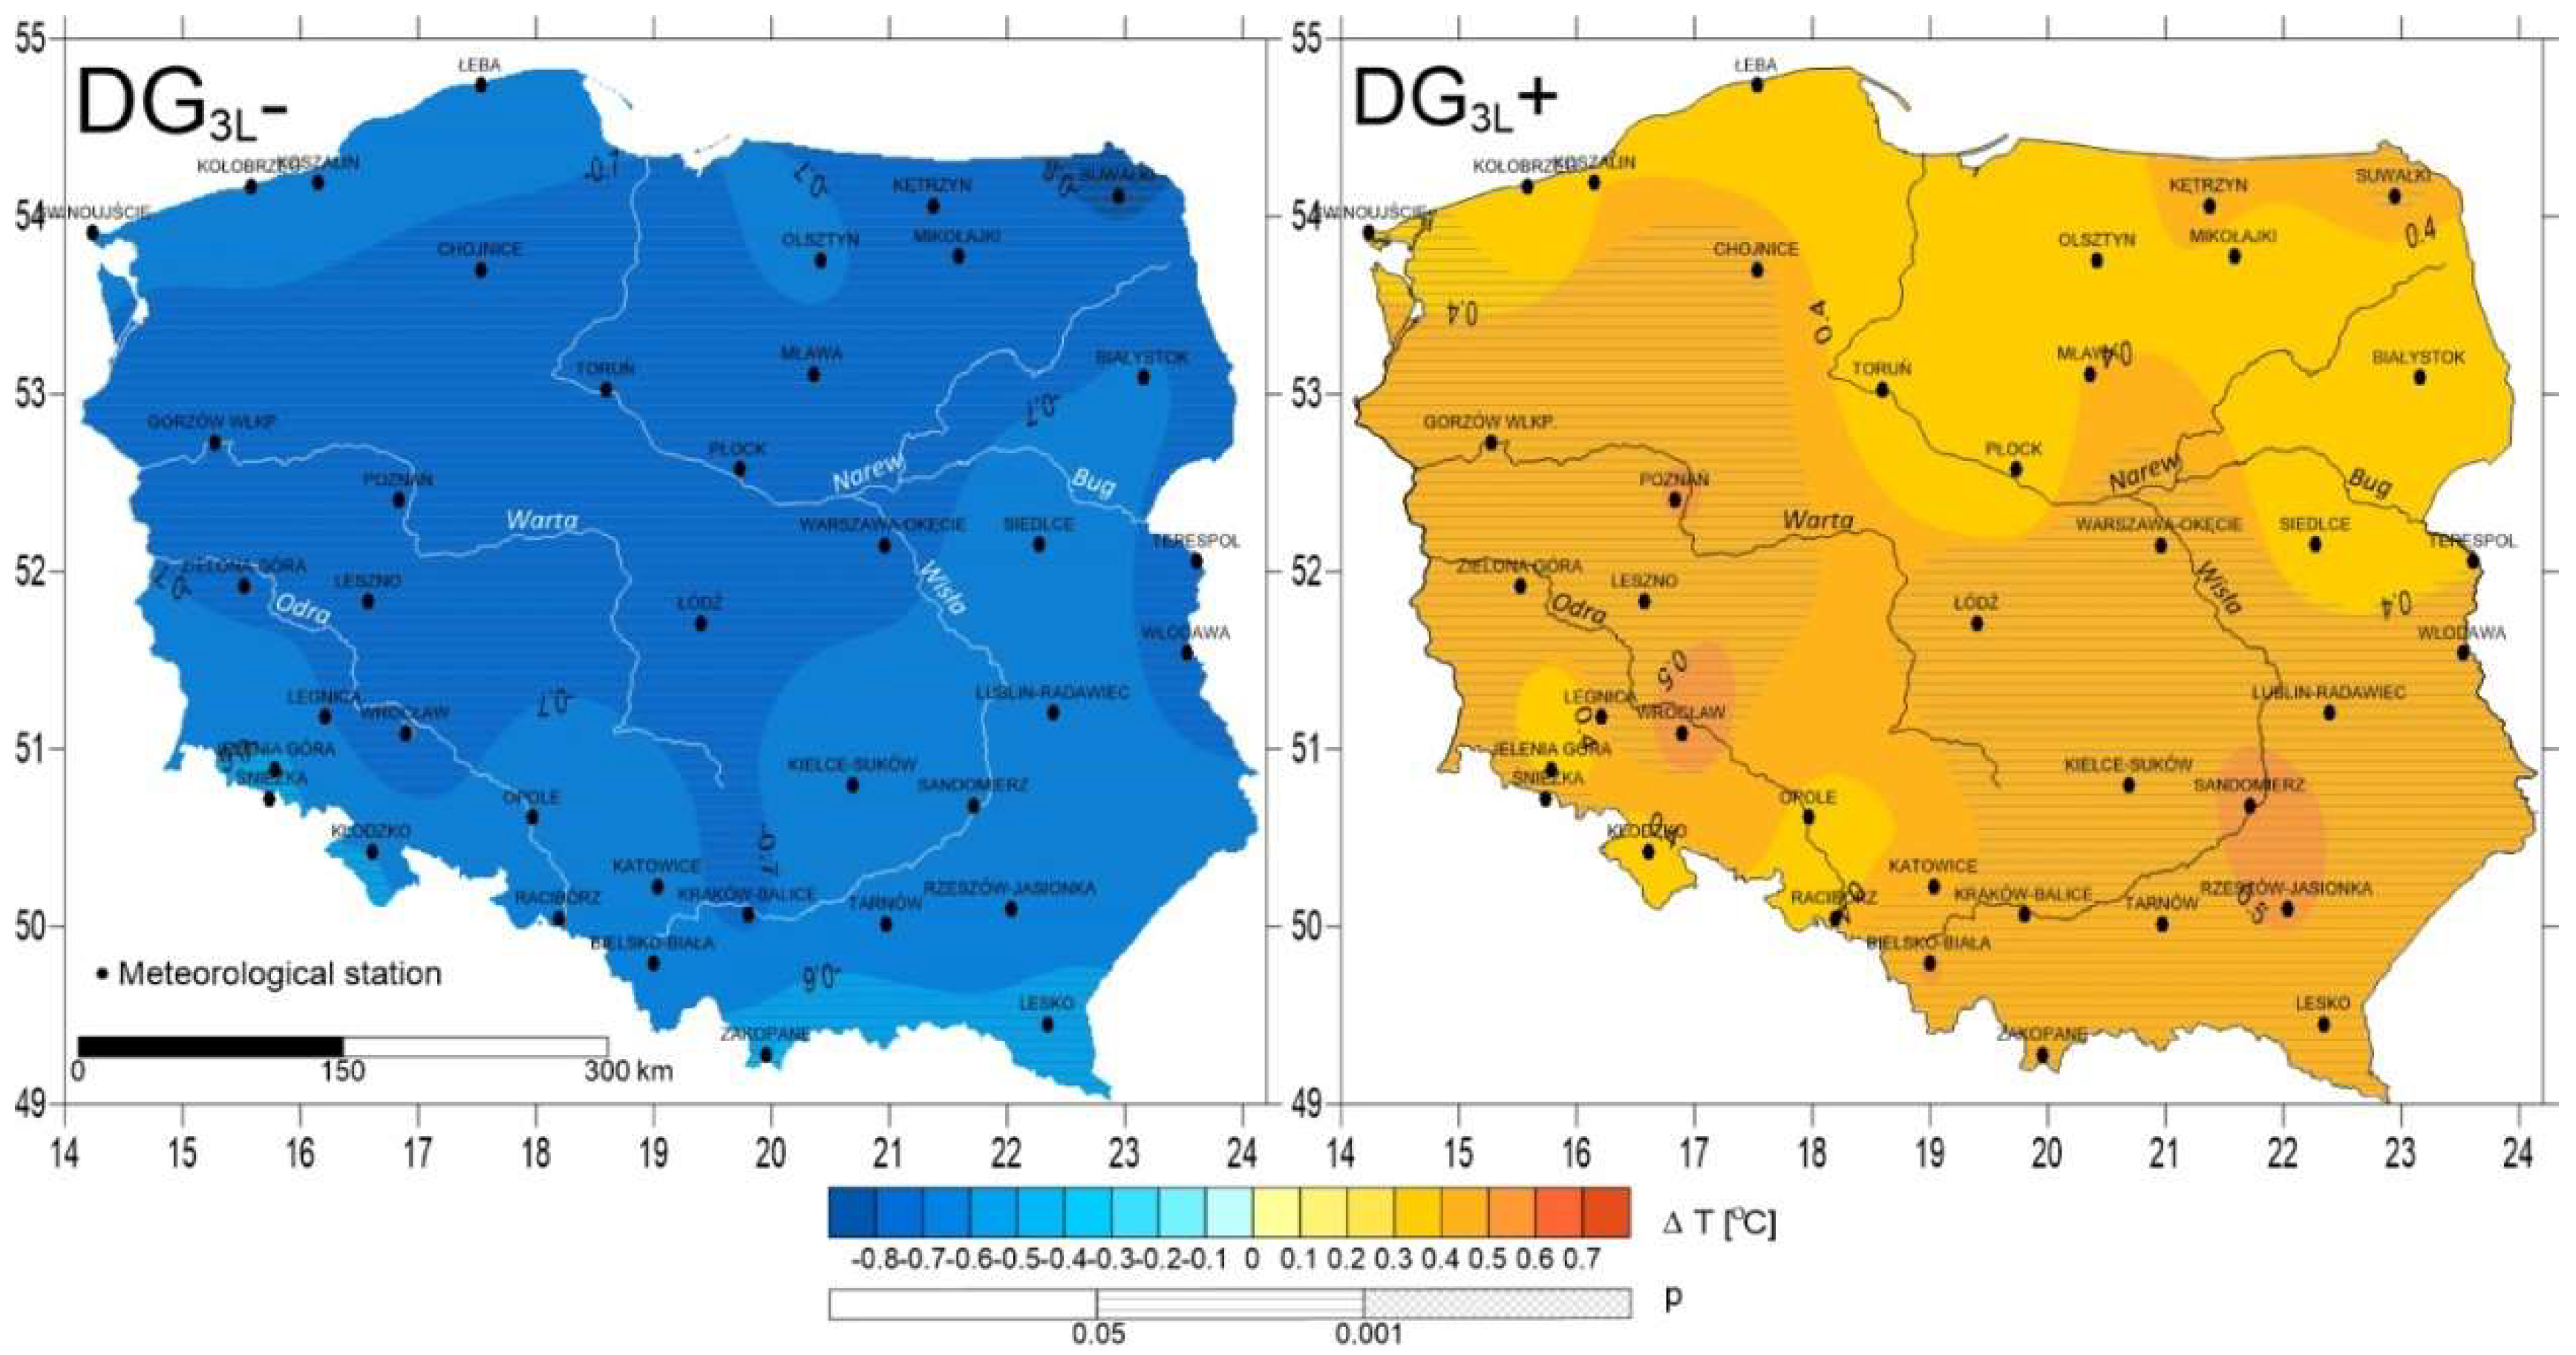
The intensity of NA THC, through forcing the occurrence of certain types of weather, has a significant impact on air temperature in the whole area of Poland. This is indicated by very high, statistically significant (p < 0.001) correlation coefficients of the DG3L index and the values of the average annual air temperature (Table 1). Spatial differences in air temperatures over Poland, influenced by changes of the DG3L index, are small and they do not exceed one-tenth of the r value. Only in spring and early summer the cooling influence of the Baltic Sea waters is more clearly visible in the northern part of the country. As a result, in years when the DG3L index has the positive value, the annual temperature in Poland is higher (when the DG3L value is changed by one unit, the annual temperature is changed by 0.43 (±0.08) °C, in accordance with the change of the index sign).
In the negative phase of DG3L, the annual air temperatures in the whole country are visibly lower compared to the average values in the years 1971–2015. The smallest differences, however statistically significant (p < 0.01), are observed in mountainous areas (0.5–0.6 °C), while slightly higher in upland and coastal areas (0.6–0.7 °C). The largest differences in temperature are recorded in central Poland (>0.7 °C), with the maximum in the north-eastern regions (Suwałki station, >0.8 °C). In the positive phase of DG3L, air temperatures are higher than the average values by 0.3–0.6 °C; the differences and their statistical significances are spatially differentiated (Figure 6). The largest, statistically significant (p < 0.05) differences (0.4–0.6 °C) are recorded in western and south-eastern Poland.
Analysis of the correlations reveals that the effect of NA THC on monthly temperatures is diversified on an annual basis. The strongest correlations are recorded in April, July, and August, respectively. Air temperatures in these months at all meteorological stations in Poland are statistically significant (p < 0.01) and they are positively correlated with the DG3L index. In June significant (p < 0.05) positive correlations are observed in the south, while in September in the central and northern parts of Poland. The temperatures of April (0.68 (±0.14) °C), July, and August (0.57 (±0.11) °C), respectively, show the strongest reactions to changes in the DG3L index. As a result, with the appearance of the positive sign of the DG3L index, air temperatures in spring and summer are higher, proportionally to the index value.
Precipitation in Poland does not show statistically significant, direct correlation with the DG3L index. The detected weak, significant correlations between DG3L and precipitation at individual stations in some months should rather be regarded as coincidental. The total cloud cover, very strongly positively correlated with precipitation, does not show direct relationships with DG3L. These correlations are low, negligible, and predominantly negative (Table 1). However, these weak, negative correlations between the total cloud cover and DG3L are strong enough to make sunshine duration in Poland significantly correlated with DG3L. Along with the increase of the DG3L index, the operation of the Sun over Poland increases sharply. The strongest relationships are recorded in April, July, and August, respectively, that is in the same months, when h500 and temperature show the strongest correlations with DG3L. This suggests that the increase in temperature, which takes place along with the increase in the DG3L index, is not only of advective origin but it also results from the increasing solar heat supply to the ground surface and from the turbulent exchange, in the part of sensible heat exchange taking place between the ground surface and the atmosphere. If the commonly known dependences in meteorology and thermodynamics of the boundary layer are taken into account, it has to be concluded that along with the higher DG3L values also the temperature of the ground surface should be obviously higher than on the average.
Stronger air heating while limiting the size of the horizontal steam vapor streams (non-convection weather) causes the increase of saturation deficit, which is reflected in the reduction of relative humidity. Relative humidity over Poland, on the scale of annual average values, shows negative correlation with the DG3L index (Table 1). At most stations, except those located along the Baltic Sea coast, the correlations are statistically significant or highly significant. Air humidity decreases the most along with the increase of the DG3L index in March-April and June-August, that is in the second part of spring and in summer.
As a result of summation of these observed effects, consisting of:
- -
- increased inflow of solar radiation to the active ground surface,
- -
- relatively strong increase in air temperature in April, July, and August,
and also
- -
- decreased relative humidity in spring and summer (increase of water vapor deficit in the air), in the years with the positive values of the DG3L index, there are favorable conditions for the strong increase in evaporation and evapotranspiration from the ground surface, which reduces the surface runoff accordingly.
3.3. Relationships between the DG3L Index and River Flow
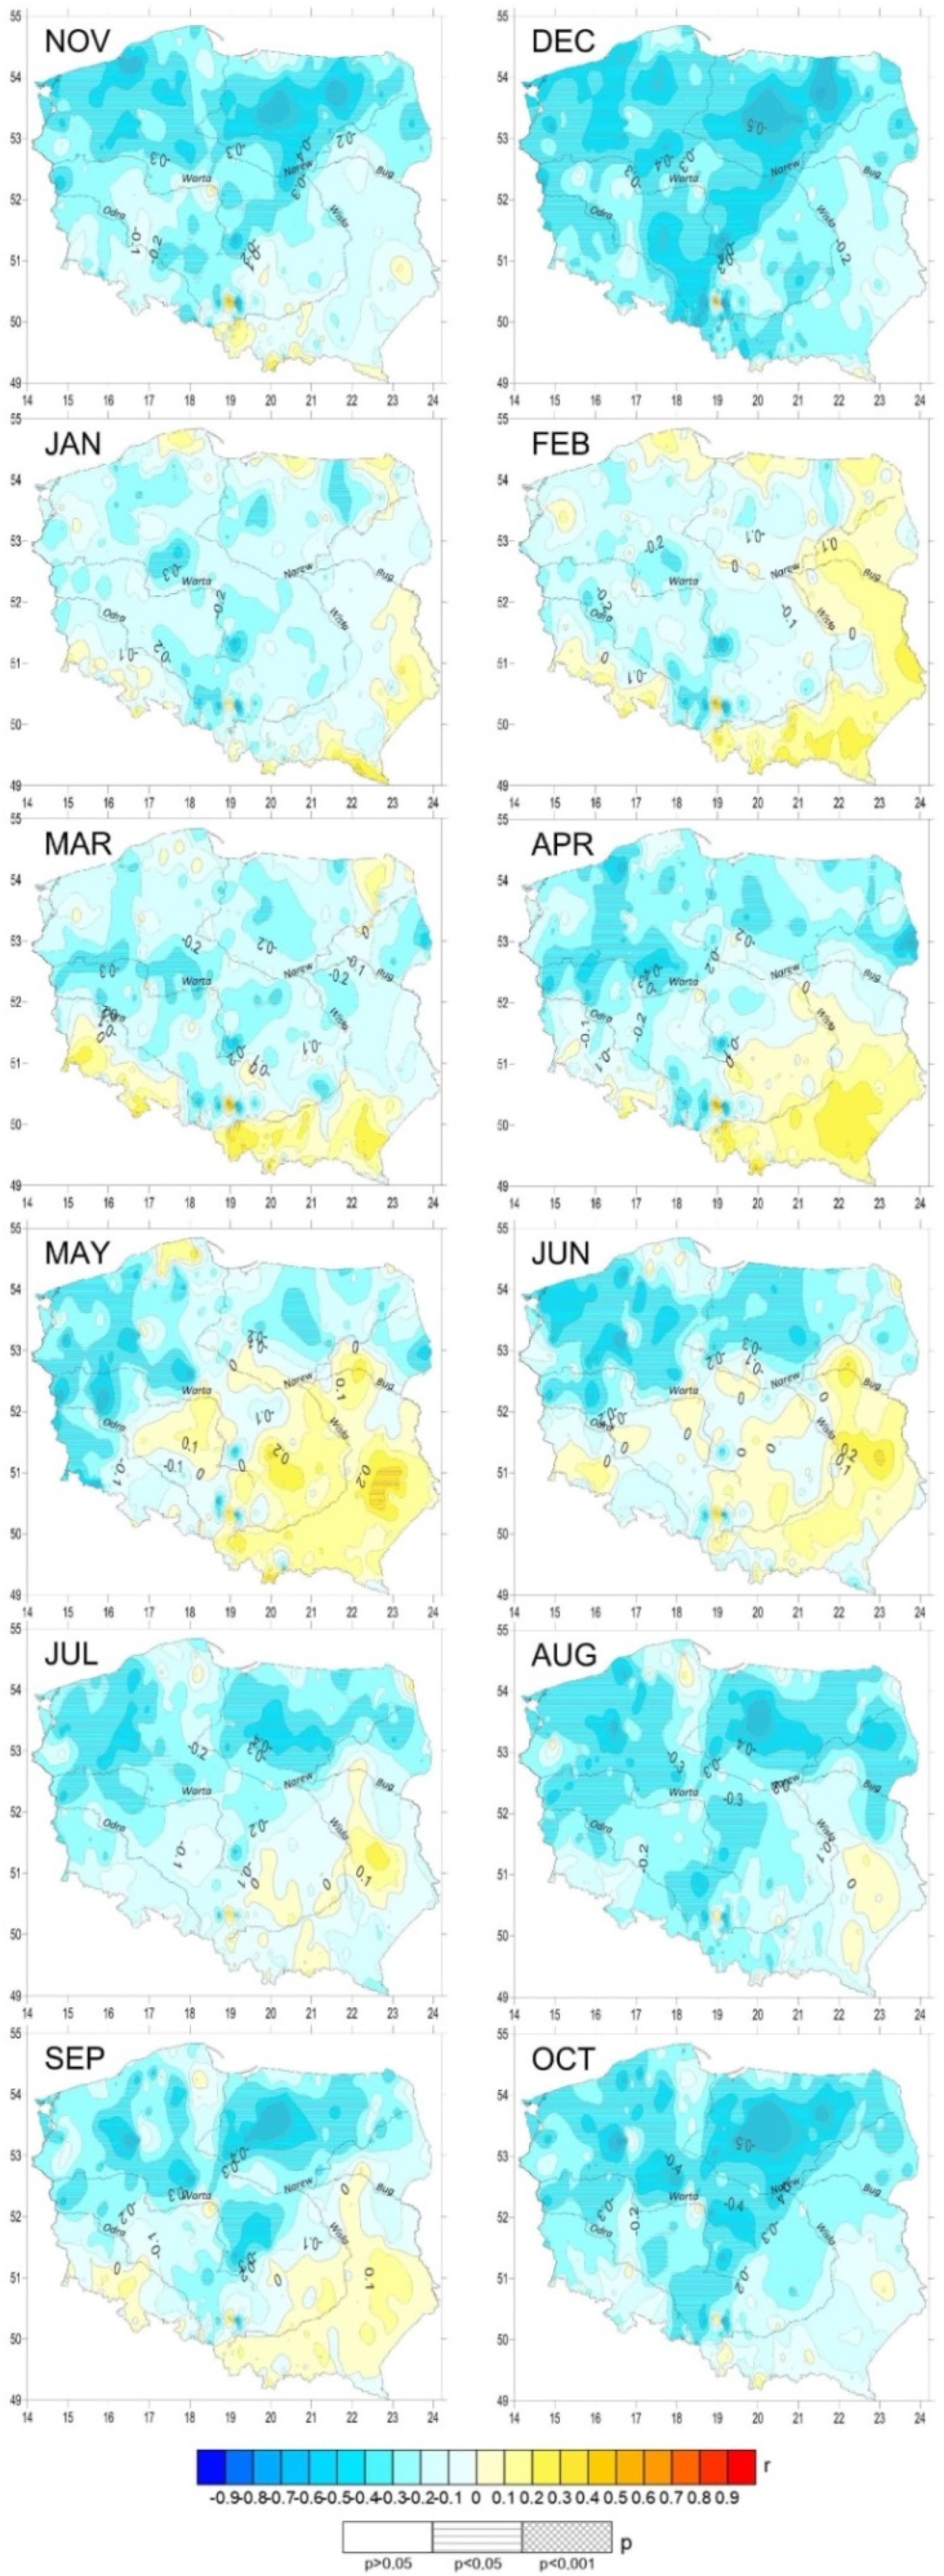
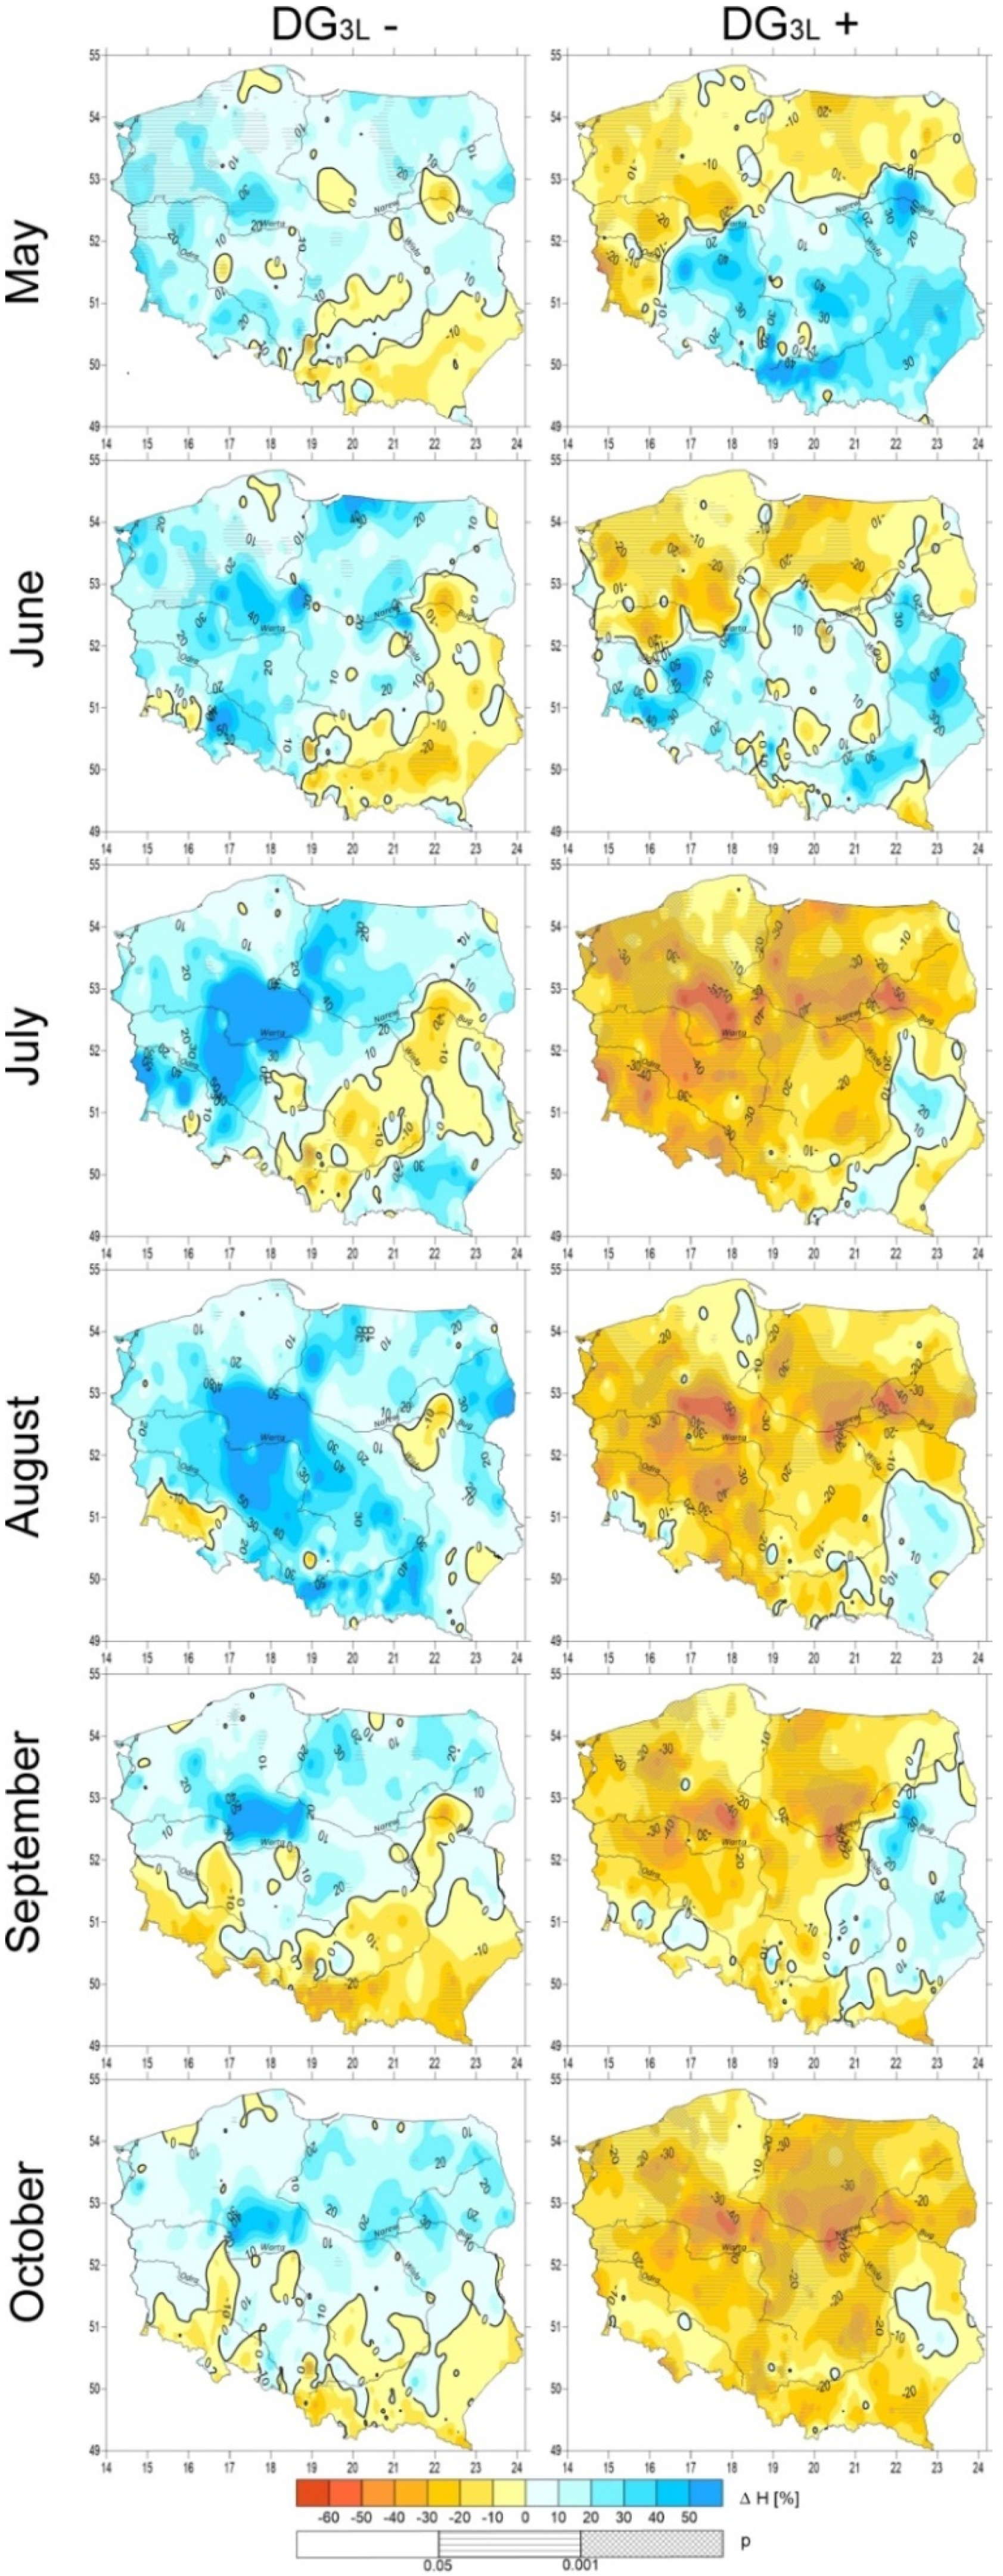
The study proves pieces of evidence that the NA THC intensity has impact on river flow in Poland. Analysis of relationships between the intensity of NA THC and monthly values of river flow shows that there exists significant temporal and spatial differentiation as a function of time. This is indicated by the results of the correlation analysis (Figure 7 and Figure 8) and the analysis of deviations of monthly flows in various phases of DG3L. Figure 9 and Figure 10 present distribution of the values of deviations of monthly flows from the average flows in a given month in the years 1971–2015 during the negative (DG3L −) and positive phases (DG3L +) of NA THC in the winter and summer half-years, respectively. Even a simple analysis shows that relationships between the flows in individual catchments and NA THC at a given DG3L index change significantly in individual months.
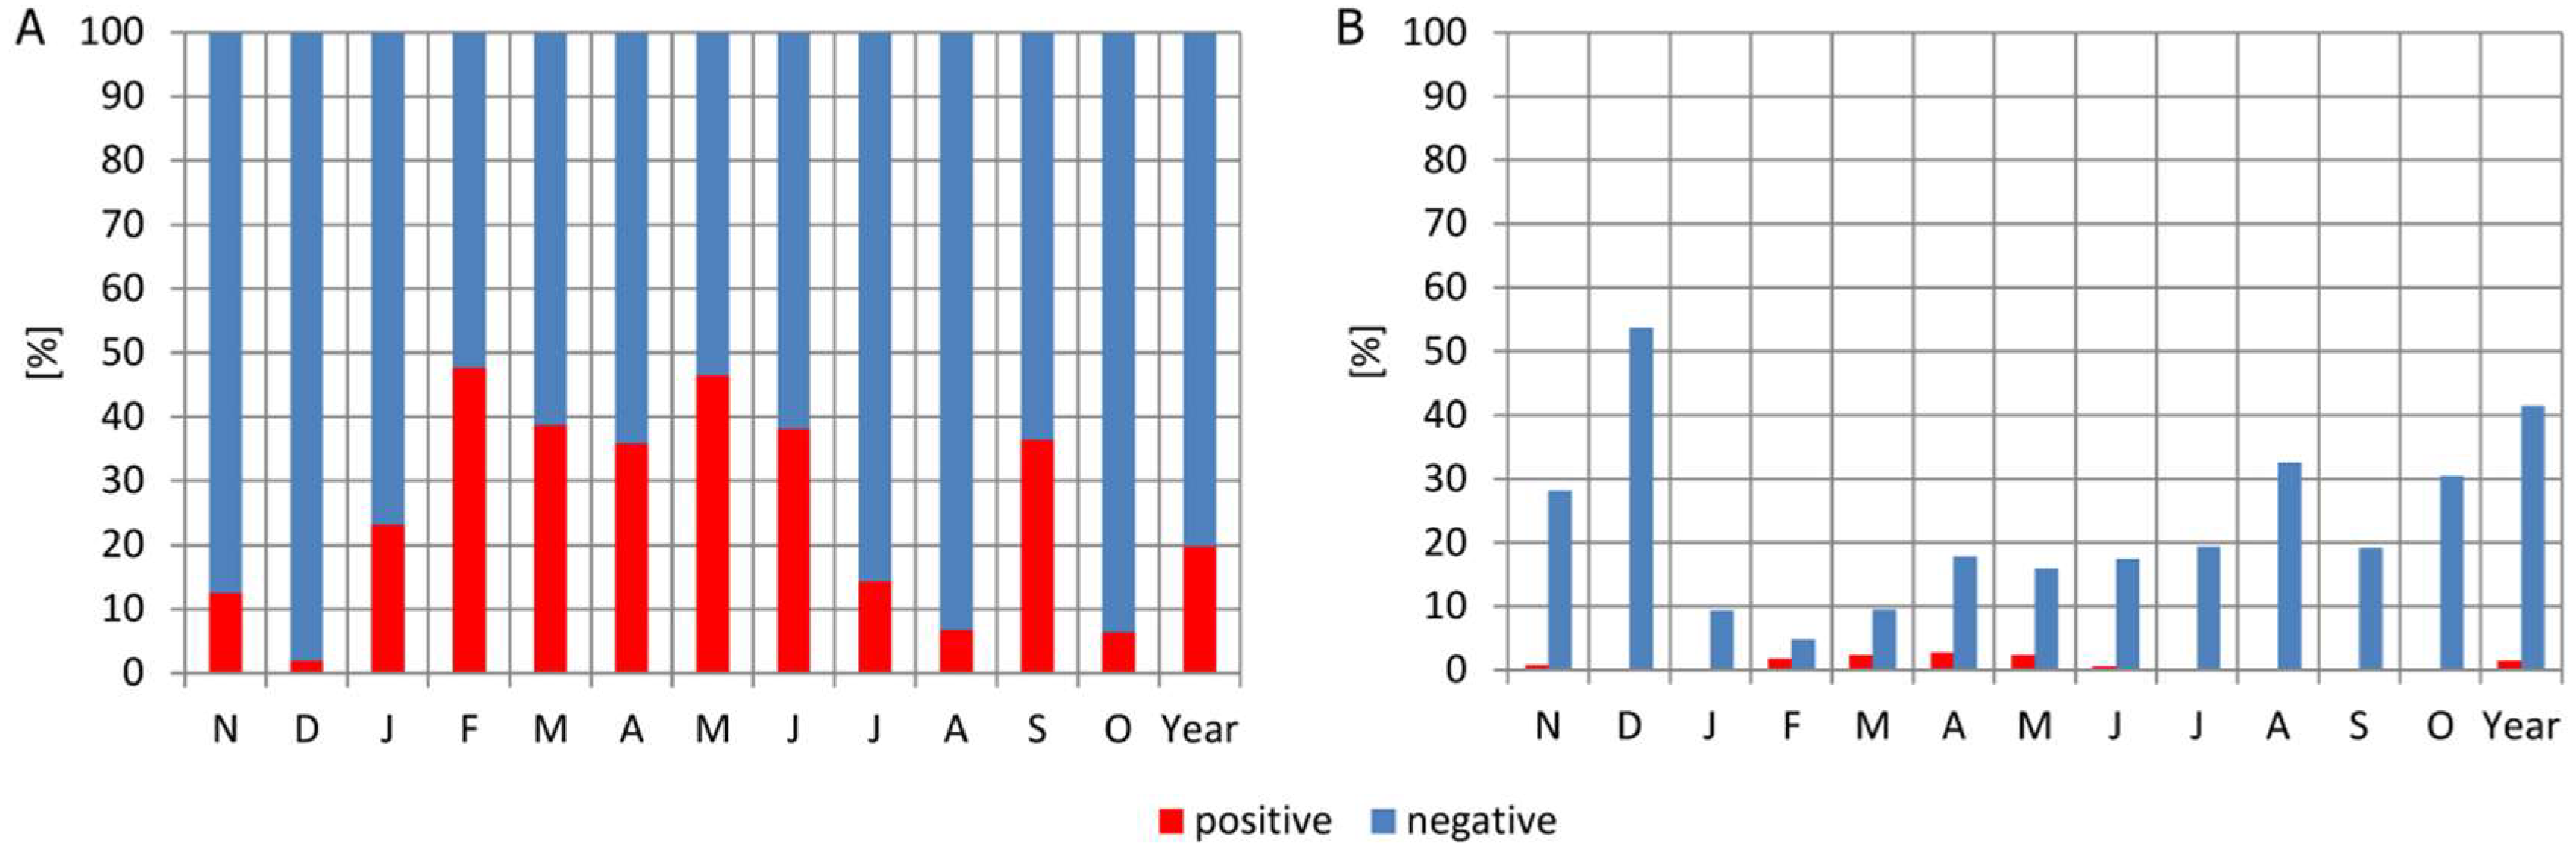
In the cold season (from November to February), the strongest, negative correlations with the DG3L index are recorded in November and December. However, the highest negative deviations of flows, statistically significant in most rivers, are observed in January. Poor correlation between precipitation and air temperature and NA THC recorded in that month indicates that the strong decline in flow in the positive phase of DG3L in the cold season is determined by the lack of replenishment of the catchments water resources after the dry and warmer summer-autumn period. Spatial variability of flows from March to June, especially in the positive phase of DG3L, is different, with flows lower than the average in the north and higher in the southern part of the country. However, statistically significant differences are observed only in the northern part of Poland, from the Lubusz Land, through northern Greater Poland to Kujawy, and in northern Mazovia. In the following months, in the summer and autumn periods, the influence of the intensity of NA THC becomes even stronger. Negative correlations are observed in most rivers, and deviations of river flows in Greater Poland, Kujawy, and Mazovia are as high as 40–50% compared to the average values. In the positive phase of DG3L, they are statistically highly significant (p < 0.001). The impact of NA THC on the reduction of the summer and autumn flows is mainly due to the increased losses of water resources in the summer months, associated with an obvious, statistically significant increase in air temperatures observed in the positive phase of DG3L.
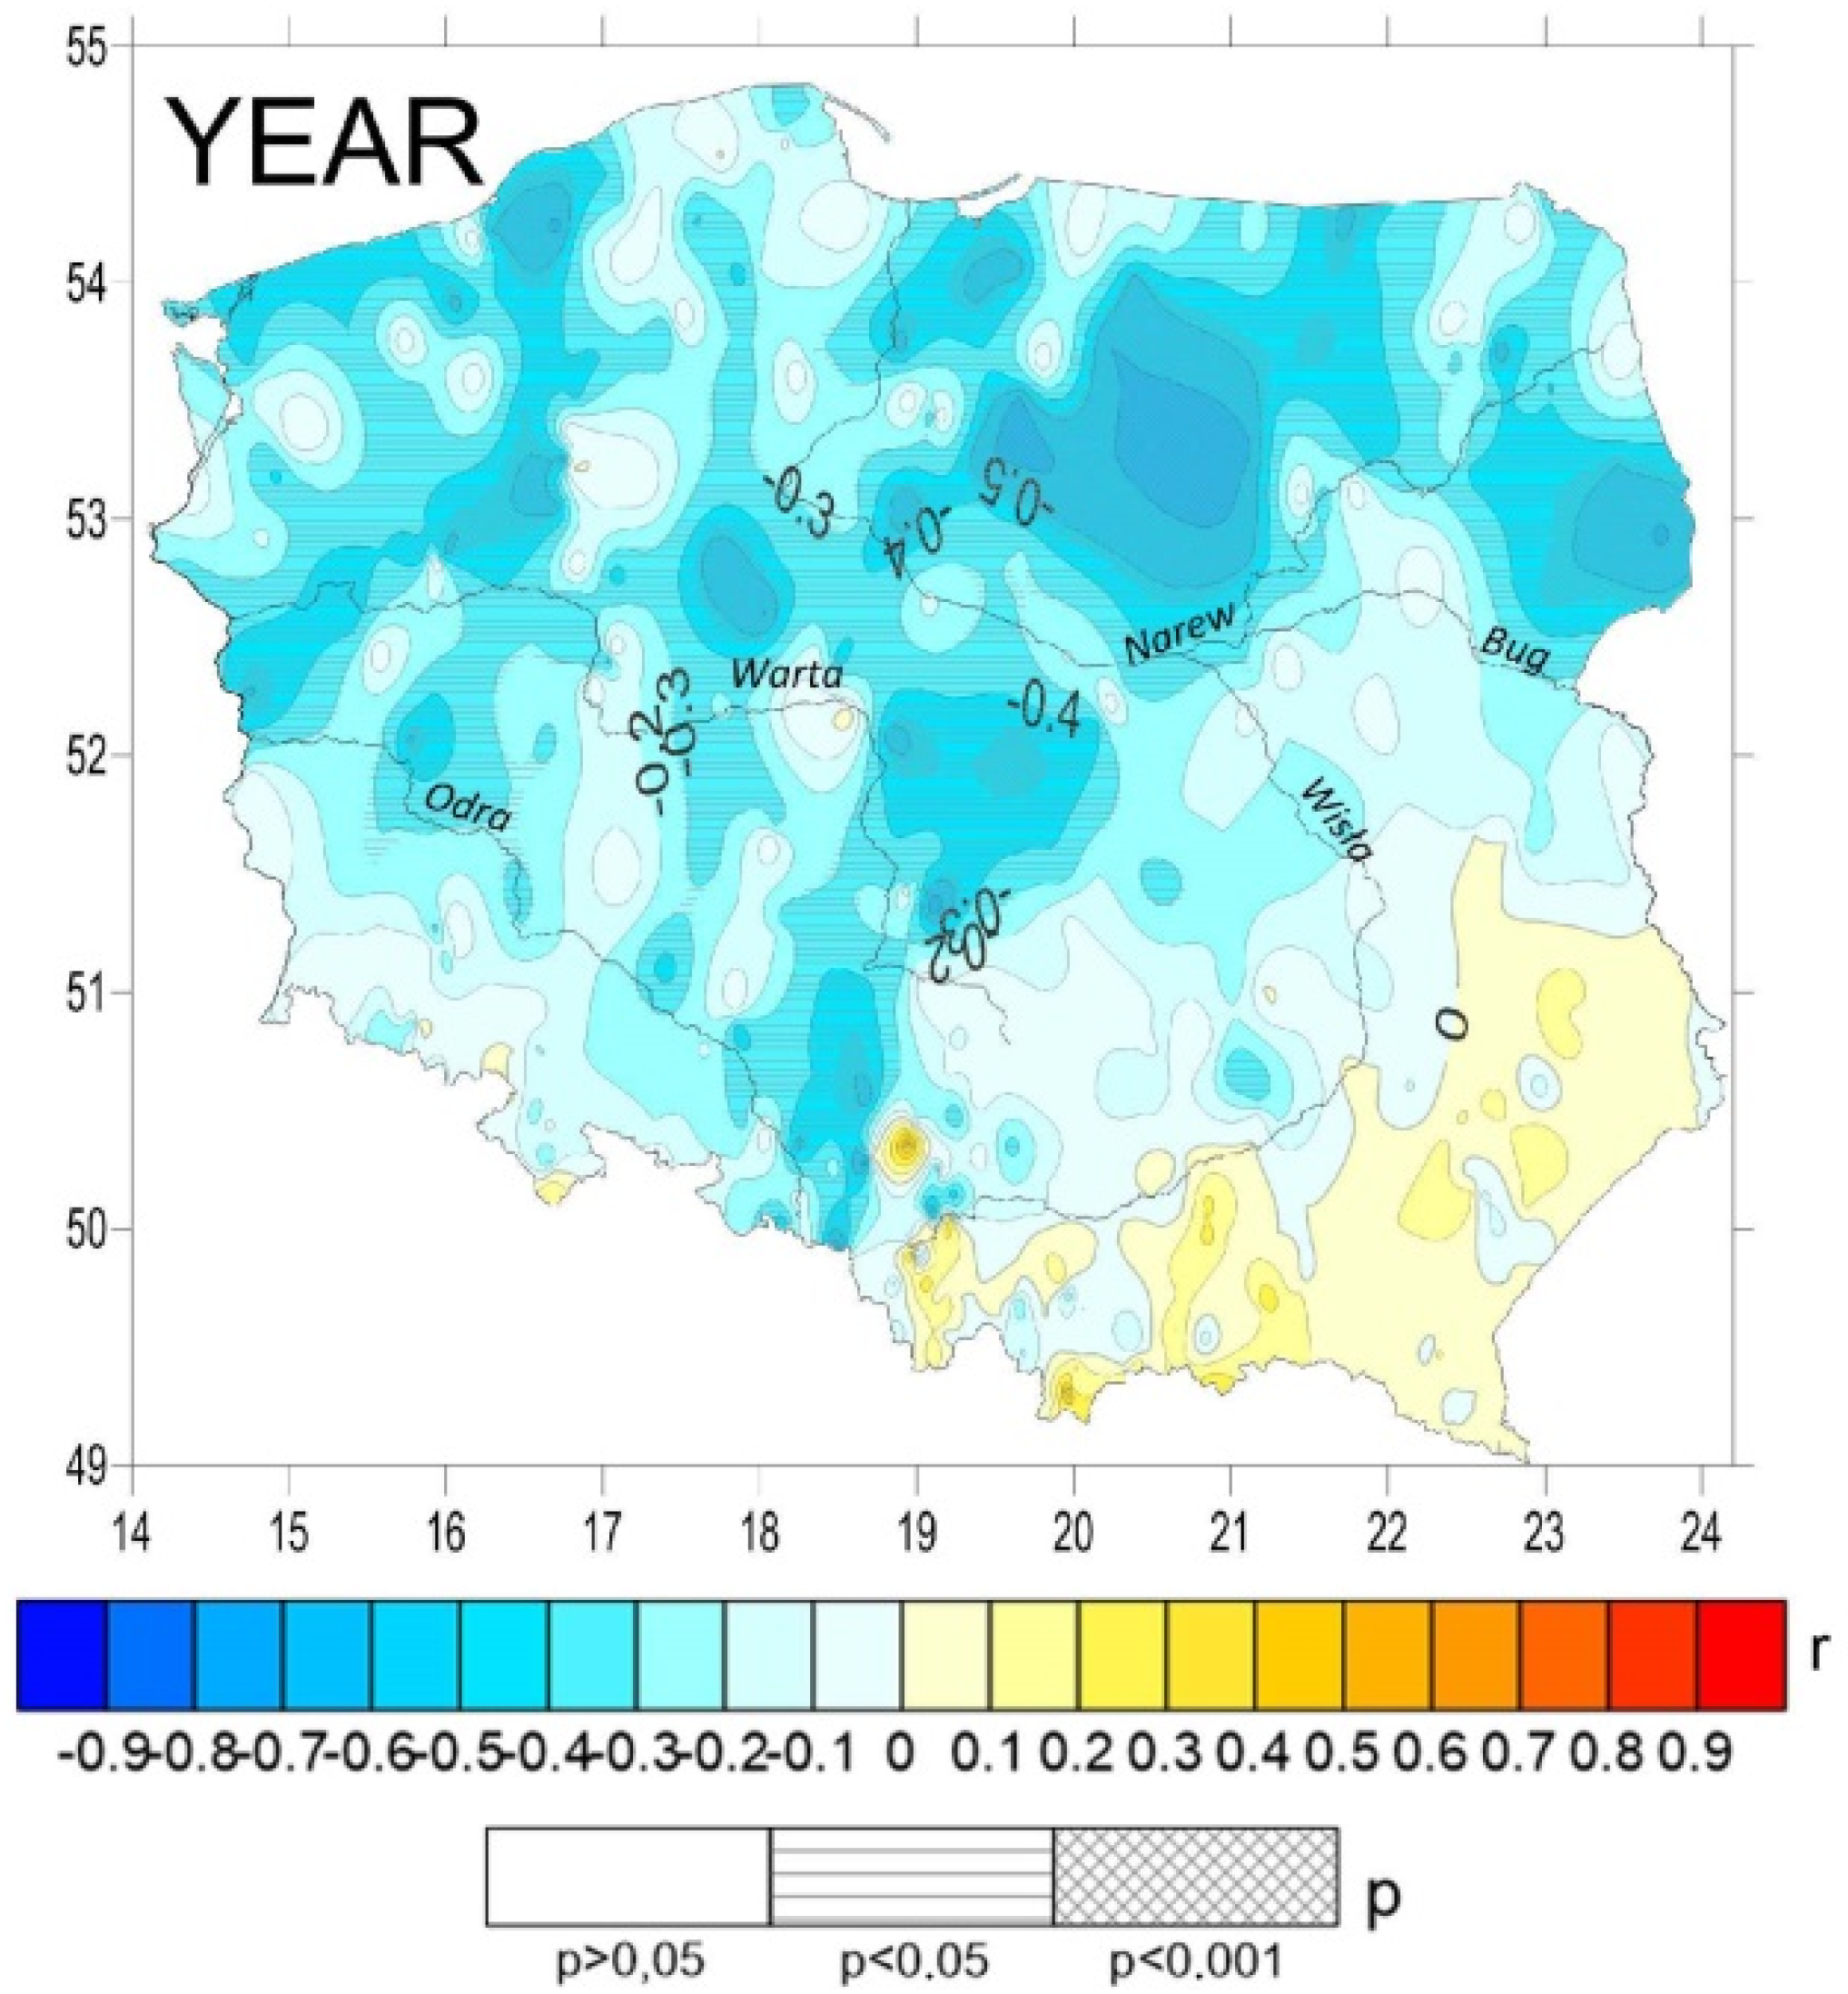
As a consequence of the aggregation of the monthly deviations of flows recorded at individual gauges in the yearly cycle, relationships between the sign and the value of the DG3L index and the annual flows become clearer and more orderly in space, and their statistical significances are higher. In the case of the annual flows, for most rivers, the correlations with the DG3L index are negative (Figure 11). Only flows of the Carpathian rivers in the south-eastern part of Poland are positive, however, statistically insignificant. Negative, statistically significant (p < 0.01) correlations are recorded in the case of many coastal, lake-land, and lowland rivers in Poland.
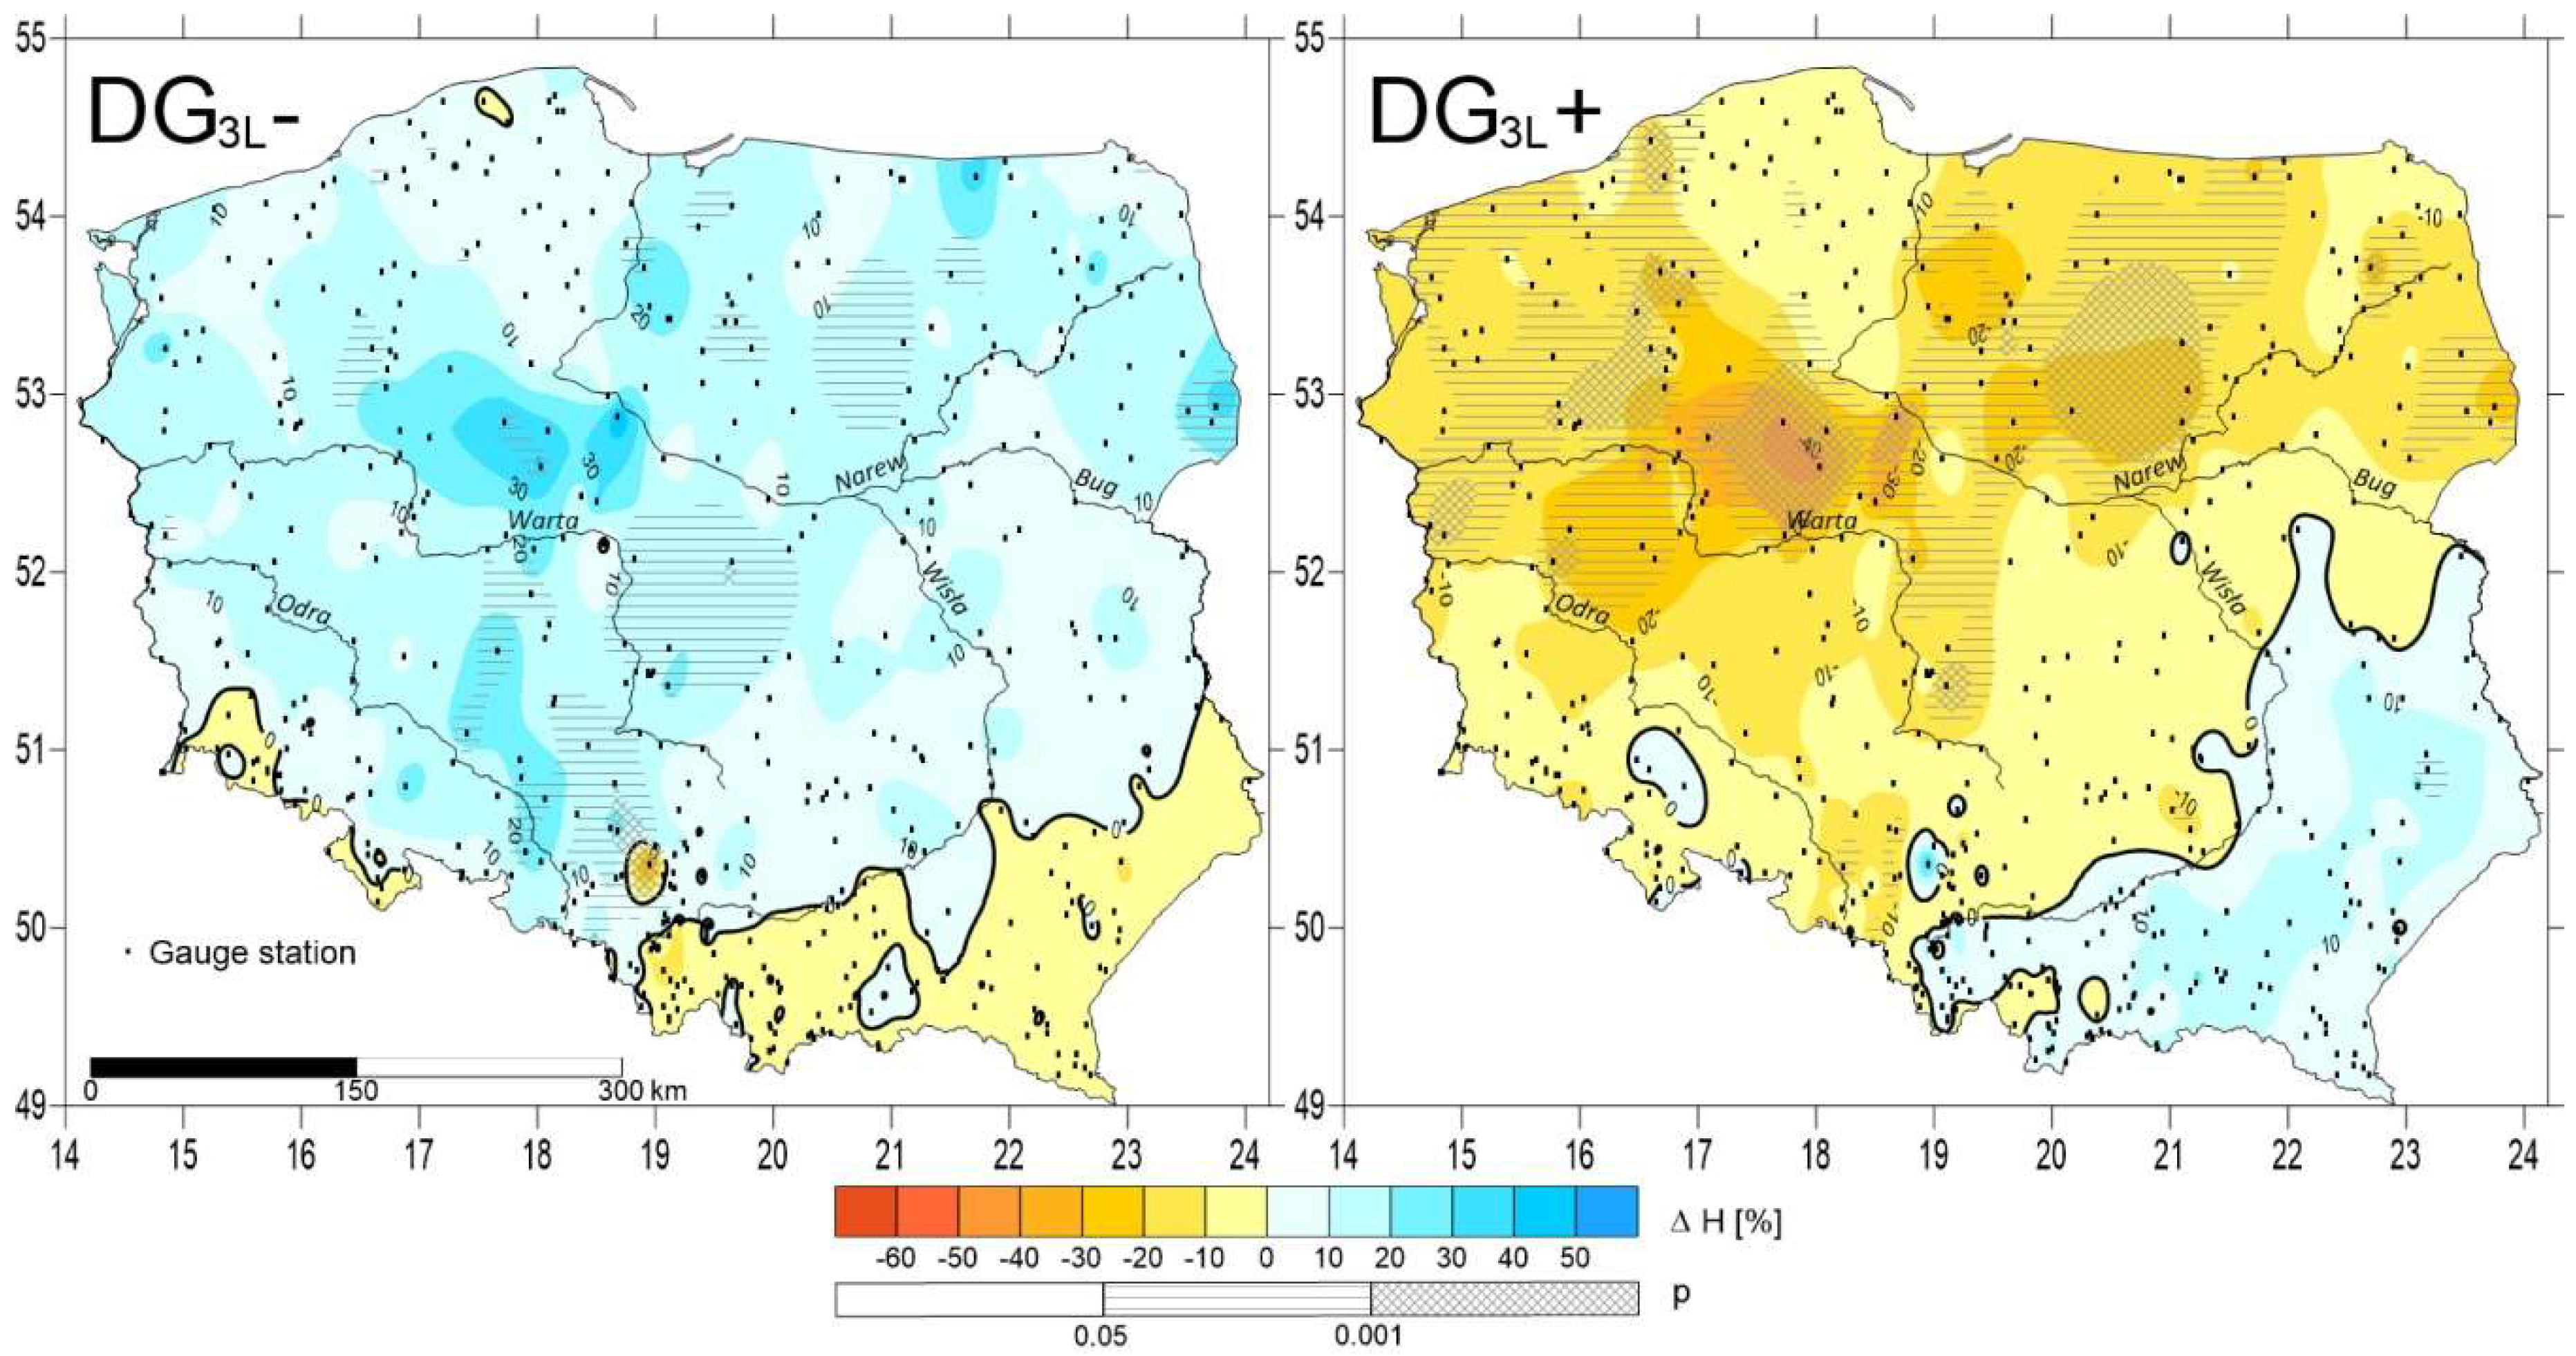
These relationships are confirmed by the detected differences in flows in different phases of DG3L. In the negative phase, the annual flows of most rivers are 10–30% higher compared to the average values from the years 1971–2015, and statistically significant differences (p < 0.05) are detected in 13% of the analyzed gauges (Figure 12). Conversely, in the positive phase of DG3L, with the exception of rivers located in the south-eastern part of the country, the annual flows are lower than the average. The largest deviations, up to 20–40%, are observed in rivers of central Poland, and statistically significant differences are detected in 22% of the studied gauges.
4. Discussion
In this paper, in order to determine the intensity of the North Atlantic Thermohaline Circulation, the DG3L index was used instead of the commonly used AMO index. This allowed demonstration of the existence of a significant influence of the variability of NA THC on the course of meteorological and hydrological processes in Poland. Along with the long-term changeability of NA THC, changes in the water balance components in Poland take place in the same multidecadal rhythm, resulting in a quasi-periodic variability of river flow in that country.
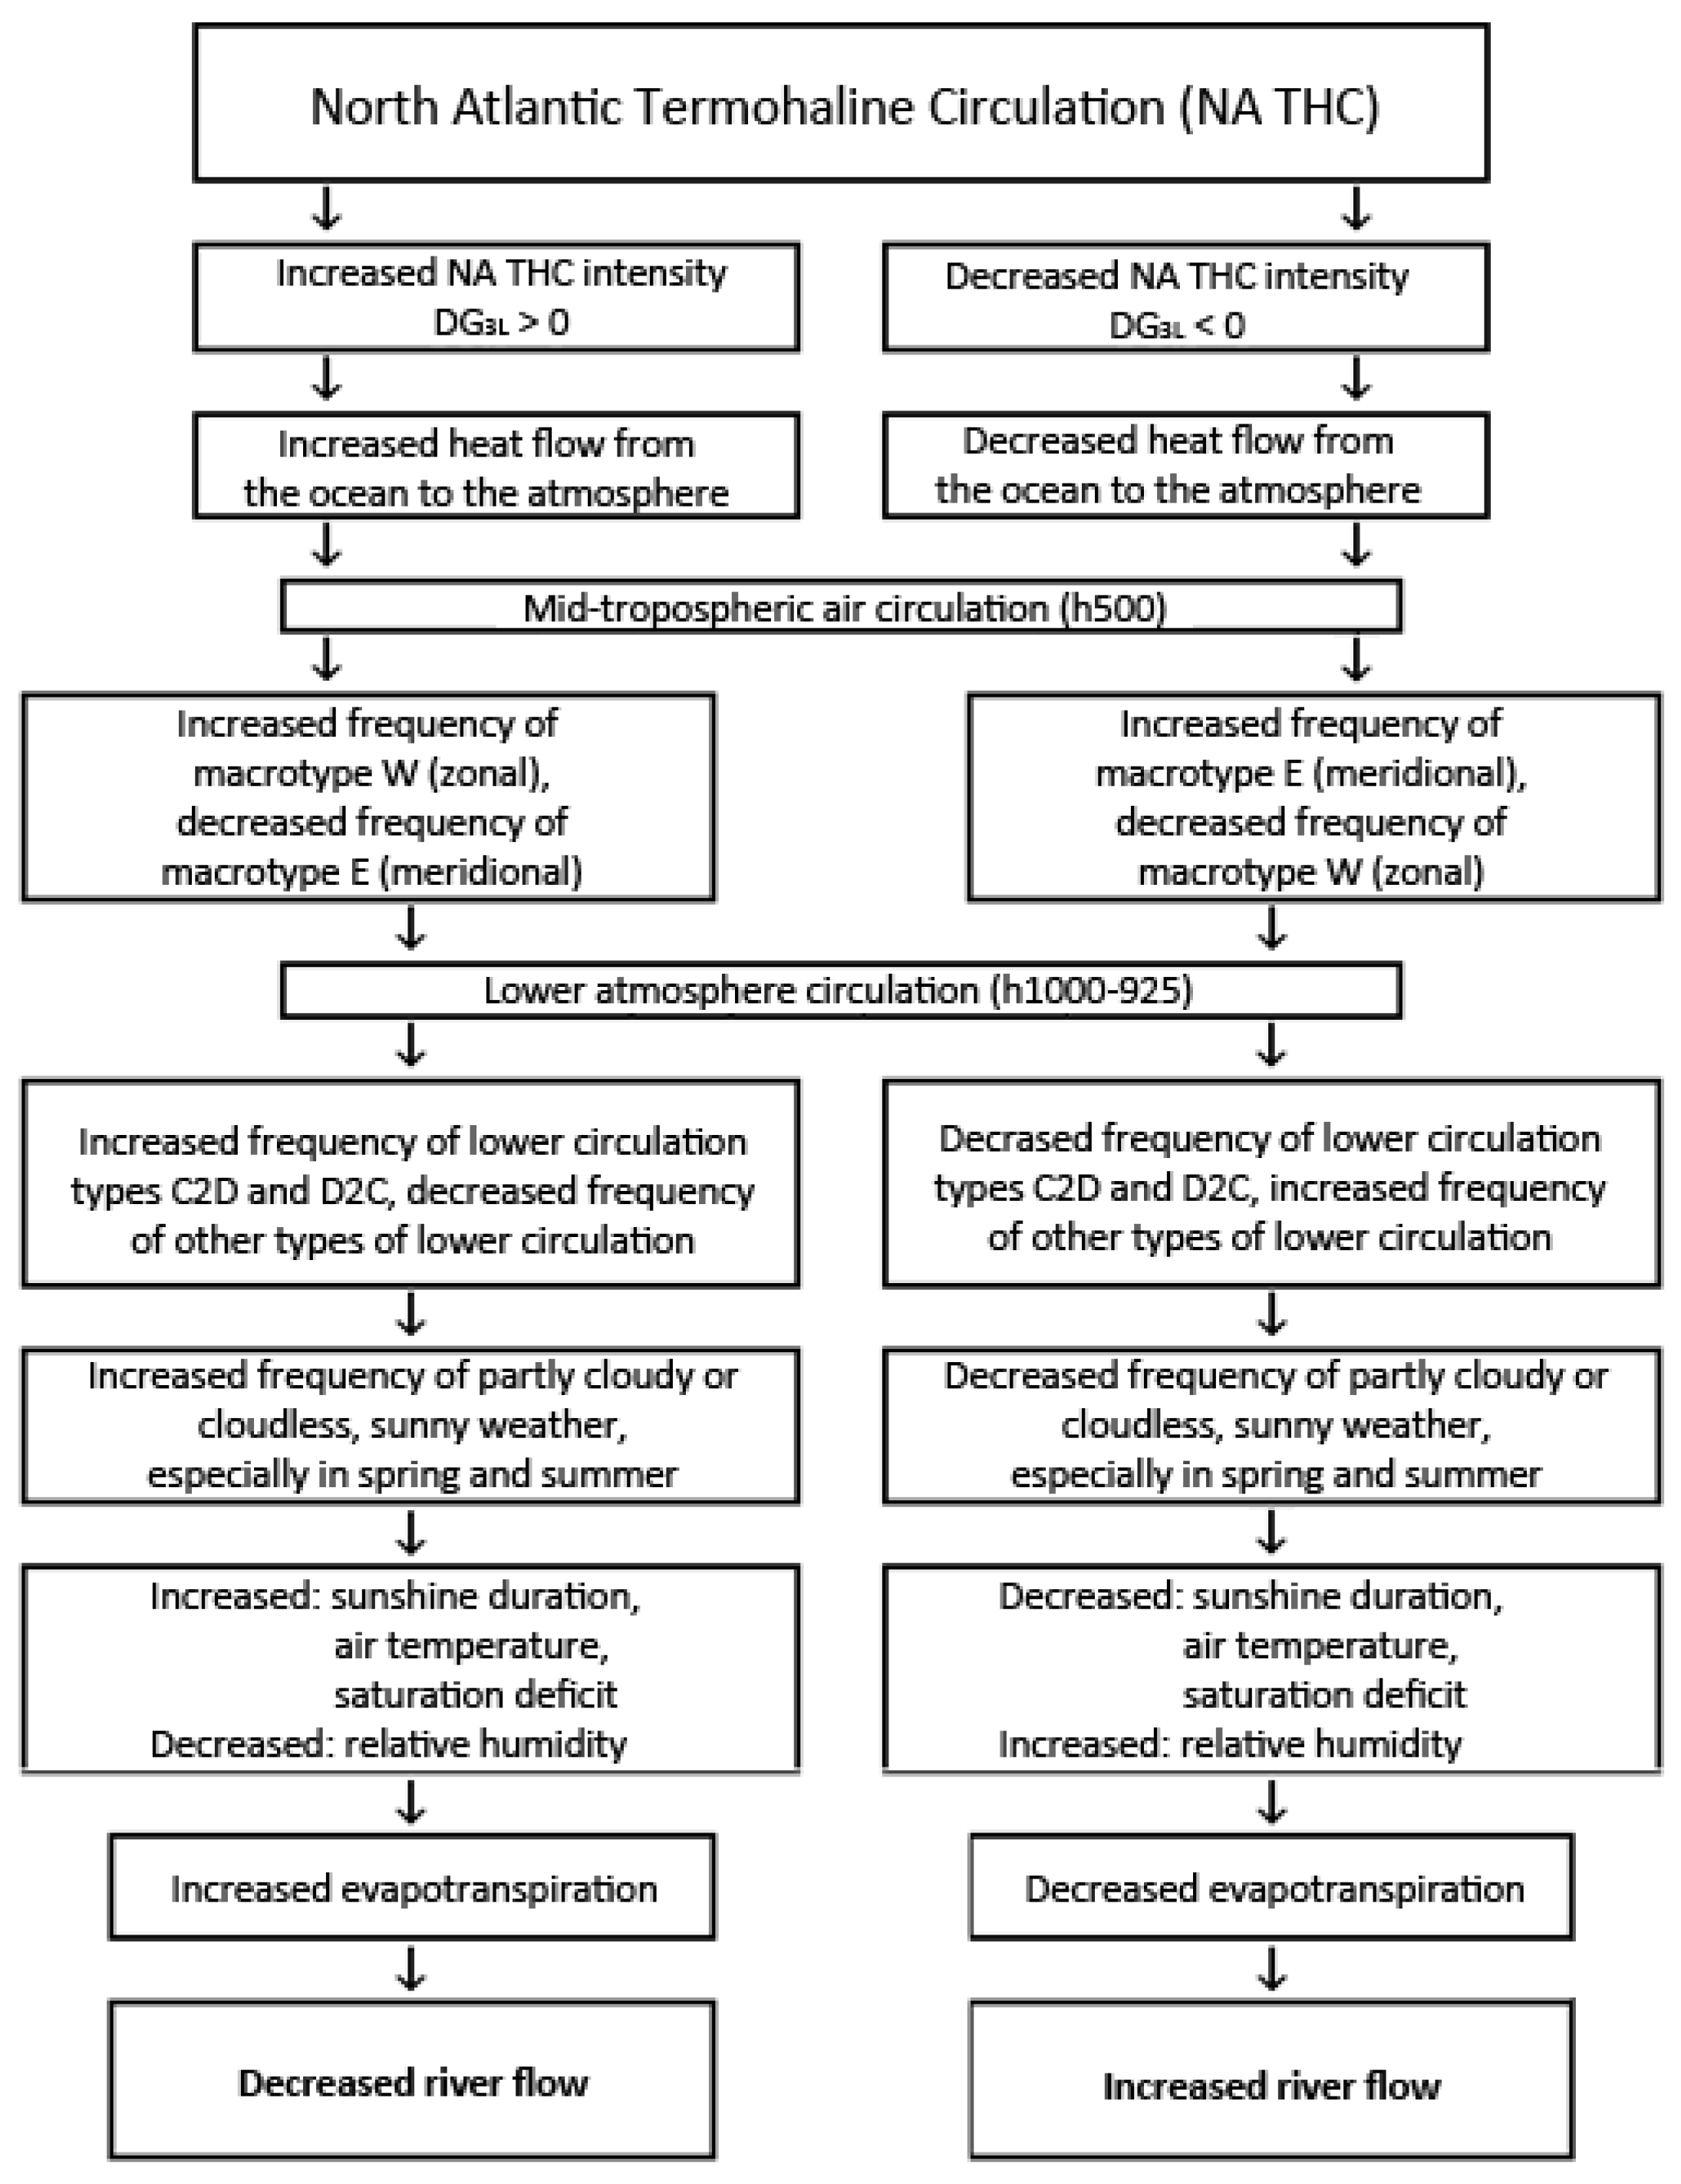
The mechanism of the impact of NA THC variability on the river flow variability in Poland is quite complicated. In a simplified form it can be presented as a flowchart (Figure 13), showing the successive interactions: from changes of the heat flow from the ocean to the atmosphere, controlled by the NA THC variability, through the atmospheric circulation at various levels to the frequency of occurrence of specific types of weather, which regulated by climate elements finally affect elements of the water balance in catchments.
This chain of interconnections explains the reasons for the existence of relationships between changes in DG3L (cause) and river flow in Poland (effect). The same analysis explains how changes of NA THC, through a fairly complex system of dependencies in the climate system, control certain elements of the water balance in areas distant from the ocean.
The results presented in the paper are largely consistent with results of the model experiment obtained by Pohlmann et al. [43], who studied the impact of the Atlantic Meridional Overturning Circulation on changes of climatic conditions in Europe. The results of the model testing have shown that differences between the strong and weak phases of NA THC cause in Poland a significant increase in the annual temperature (0.9–1.2 °C), decrease in the number of cold days (8–12 days a year), increase in the number of hot days with daily temperature >25.0 °C (3–9 days per year), as well as very slight (1 mm per month) increase in rainfall in the areas adjacent to the Pomeranian and Gdansk Bays and a slight (1–2 mm per month) decrease in precipitation in northern and central Poland, slightly larger (2–3 mm per month) in southern Poland [43] (Figure 3). Thus, the modeling has also proved that the THC changes may lead to significant changes in temperature in Poland, but very limited in precipitation. Similar tendencies were found by Lavado Casimiro et al. [11,12] for selected Peruvian basins in South America. This research reveals that the mechanism of the NA THC impact on river flow in Poland is different from that occurring in North America or France, where changes in precipitation and air temperature are the main causes of the flow changes [22,25,27,44]. In Poland precipitation does not show statistically significant correlations with the DG3L index (Table 1). The most important cause of changes in river flow in Poland is the variability in the size of the evapotranspiration losses in the water balance of catchments in spring and summer, caused by simultaneous increases in sunshine duration, air temperature, and saturation deficit (decrease in relative humidity) (Figure 13). Interestingly, these findings are consistent with conclusions drawn by Labat et al. [10], who pointed at regional heterogeneities in the continental-scale runoff tendencies that reflect high nonlinearity of the hydrological cycle response to recent climate change.
The analysis of changes in the annual river flow in Poland (Figure 12) shows significant spatial variation of the flow deviations (ΔH), depending on the NA THC phase. Preliminary analysis of this variation indicates that generally they are conditioned by the climatic factors associated with the NA THC variation. The variability of climatic conditions caused by the NA THC variability (the DG3L index) is large scale, changes smoothly over distances of hundreds and thousands of kilometers, which results from the geometry of the Rossby waves and the typical sizes of the lower-atmosphere pressure systems.
Strong “mosaicism” of changes, visible in Figure 9 and Figure 10, as it can be guessed, reflects regional diversity of the catchments’ environment, in particular, the soil types and the land use patterns. Areas of the strongest negative deviations recorded in eastern Greater Poland and Kujawy, and in the lower Powiśle, belong to the zone of the lowest summer precipitation in Poland. Additionally, in these areas, soils with light mechanical composition are dominant, and local agriculture is highly intense. In the conditions of the increasing air temperature, the increase in sunshine duration and in the air “dryness”, which is recorded in the positive phases of NA THC, water shortages will occur in these areas, which is reflected in the decreased river flow.
The research shows that the effect of NA THC on river flow in Poland is diversified temporally and spatially (Figure 5). The NA THC intensity affects not only the flow volume but also its temporal distribution in the annual cycle. It causes that the types of the flow regime and its uncertainty may be subject to modifications [34]. In rivers located in central and northern Poland, representing the nival types of regimes, monthly flows (and thus also yearly flows) are clearly higher in the negative phase of DG3L and lower in its positive phase. However, this does not affect the type of river regime in this part of the country. At the same time, in the negative phase of DG3L, high-water periods caused by snowmelt are visibly higher, while in the positive phase of DG3L monthly flows in summer and autumn are half as high as these in the average conditions, which increases the probability of occurrence of dry periods with deep low-water stages.
This refers mainly to rivers of central Poland, which represent the well-formed nival regime with the most contrasting hydrological periods in the annual cycle, starting from the high-water periods caused by snowmelt in spring, then transformed into the deep low-water periods in summer and autumn. Different regularities are observed in rivers in the southern part of the country, representing complex regimes: nival-pluvial and pluvial-nival. In the positive phase of DG3L, distinct increases in the spring flows and decreases in the summer and autumn flows prove that high-water periods caused by rainfall with culminations in July, typical of rivers having these types of regime, disappear. Therefore, the nival-pluvial type of regime can be transformed into the nival medium-formed or the nival well-formed, while the pluvial-nival into the nival-pluvial one. In the negative phase of DG3L, both the flow volume and the type of river regime do not change much.
Author Contributions
Conceptualization, D.W., A.A.M. and A.S.; methodology, D.W., A.A.M. and A.S.; software, D.W., A.A.M., A.S. and L.S.; validation, D.W., A.A.M. and A.S.; formal analysis, D.W., A.A.M. and A.S.; investigation, data curation, D.W.; writing—original draft preparation, D.W., A.A.M., A.S. and L.S.; writing—review and editing, L.S.; visualization, D.W., A.A.M. and A.S.; supervision, D.W. and L.S.
Funding
This research received no external funding.
Acknowledgments
The authors are grateful to the Institute of Meteorology and Water Management in Warsaw, Poland for providing the data used in this paper.
Conflicts of Interest
The authors declare no conflict of interest.
Appendix A

Table A1.
Values of the DG3L index in the years 1880–2018. Estimation based on [33].
Table A1.
Values of the DG3L index in the years 1880–2018. Estimation based on [33].
| Year | 0 | 1 | 2 | 3 | 4 | 5 | 6 | 7 | 8 | 9 |
|---|---|---|---|---|---|---|---|---|---|---|
| 188x | −0.44 | −0.30 | −0.47 | −0.17 | 0.24 | 0.05 | −0.71 | −1.13 | −1.71 | −1.42 |
| 189x | −0.84 | −0.25 | −0.28 | −1.11 | −1.25 | −0.84 | −0.30 | −0.12 | 0.51 | −0.69 |
| 190x | −0.39 | 0.19 | −0.36 | −1.06 | −0.65 | 0.04 | 0.68 | −0.67 | −1.03 | −1.92 |
| 191x | −1.39 | −1.05 | −1.64 | −1.80 | −1.52 | −0.55 | −1.12 | −1.10 | −1.24 | −1.13 |
| 192x | −0.81 | −1.07 | −0.28 | −0.76 | −0.49 | −0.50 | −0.75 | 0.13 | 0.80 | 1.19 |
| 193x | 1.51 | 1.13 | 0.68 | 0.97 | 1.31 | 1.38 | 0.88 | 1.71 | 1.78 | 1.88 |
| 194x | 0.45 | −0.11 | −0.09 | 0.88 | 1.49 | 1.34 | 0.82 | 0.81 | −0.09 | 0.31 |
| 195x | 0.76 | 1.45 | 1.09 | 0.82 | 0.85 | 0.62 | 0.16 | −0.12 | 0.33 | −0.05 |
| 196x | 0.73 | 1.08 | 1.32 | 1.01 | −0.26 | −0.50 | −1.37 | −0.15 | −0.83 | −0.55 |
| 197x | −1.04 | −0.97 | −1.18 | −1.09 | −0.55 | −0.29 | −0.23 | −0.44 | −0.44 | −1.43 |
| 198x | −1.16 | −1.84 | −1.07 | −0.80 | −0.25 | −0.57 | −1.29 | −1.17 | −0.07 | 0.55 |
| 199x | 1.10 | 0.70 | 0.82 | 0.30 | 1.14 | 0.66 | 0.98 | 0.61 | 1.20 | 1.56 |
| 200x | 1.66 | 1.46 | 1.21 | 2.02 | 1.82 | 1.94 | 1.58 | 1.13 | 1.75 | 2.34 |
| 201x | 1.81 | 1.29 | 1.50 | 2.10 | 2.77 | 3.61 | 4.43 | 4.63 | 4.85 |
References
- Van Lanen, H.A.J.; Laaha, G.; Kingston, D.G.; Gauster, T.; Ionita, M.; Vidal, J.-P.; Vlnas, R.; Tallaksen, L.M.; Stahl, K.; Hannaford, J.; et al. Hydrology needed to manage droughts: The 2015 European case. Hydrol. Process. 2016, 30, 3097–3104. [Google Scholar] [CrossRef]
- Krasowski, W.; Tokarczyk, T. 2015–2016 Hydrological Drought in Poland Compared to Multi-Annual Period. Gospodarka Wodna 2017, 9, 277–284. (In Polish) [Google Scholar]
- Kaznowska, E.; Hejduk, A.; Kempiński, C. Low Flows of the Vistula River in Warsaw in the 21st century (in Polish). Acta Sci. Pol. Form. Circumiectus 2018, 17, 33–44. (In Polish) [Google Scholar] [CrossRef]
- Kubiak-Wójcicka, K.; Bąk, B. Monitoring of meteorological and hydrological droughts in the Vistula basin (Poland). Environ. Monit. Assess. 2018, 190, 691. [Google Scholar] [CrossRef] [PubMed] [Green Version]
- Jokiel, P.; Kożuchowski, K. Changes in selected hydro-climatic characteristics of Poland in the current century. In Dokumentacja Geograficzna; IGiPZ PAN: Warszawa, Poland, 1989; Volume 6, pp. 1–94. (In Polish) [Google Scholar]
- Wrzesiński, D. Tendencies of changes in the flow of Polish rivers in the second half of the 20th century. Bad. Fizjogr. Na. Pol. Zach. 2009, 60, 147–162. (In Polish) [Google Scholar]
- Wrzesiński, D.; Sobkowiak, L. Detection of changes in flow regime of rivers in Poland. J. Hydrol Hydromech. 2018, 66, 55–64. [Google Scholar] [CrossRef]
- Piniewski, M.; Marcinkowski, P.; Kundzewicz, Z.W. Trend detection in river flow indices in Poland. Acta Geophys. 2018, 66, 347–360. [Google Scholar] [CrossRef] [Green Version]
- Labat, D.; Ababou, R.; Mangin, A. Introduction of wavelet analyses to rainfall/runoffs relationship for a karstic basin: The case of Licq-Atherey karstic system (France). Groundwater 2001, 39, 605–615. [Google Scholar] [CrossRef]
- Labat, D.; Goddéris, Y.; Probst, J.L.; Guyot, J.L. Evidence for global runoff increase related to climate warming. Adv. Water Resour. 2004, 27, 631–642. [Google Scholar] [CrossRef]
- Lavado Casimiro, W.S.; Labat, D.; Ronchail, J.; Espinoza, J.C.; Guyot, J.L. Trends in rainfall and temperature in the Peruvian Amazon-Andes basin over the last 40 years (1965–2007). Hydrol. Process. 2013, 27, 2944–2957. [Google Scholar] [CrossRef]
- Lavado Casimiro, W.S.; Ronchail, J.; Labat, D.; Espinoza, J.C.; Guyot, J.L. Basin-scale analysis of rainfall and runoff in Peru (1969–2004): Pacific, Titicaca and Amazonas drainages. Hydrol. Sci. J. 2012, 57, 625–642. [Google Scholar] [CrossRef]
- Pociask-Karteczka, J.; Limanówka, D.; Nieckarz, Z. Impact of the North Atlantic Oscillation on hydrological regime in the Polish Carpathians (1951–2000). Folia Geogr. Ser. Geogr. Phys. 2002–2003, 33–34, 89–104. (In Polish) [Google Scholar]
- Styszyńska, A.; Tamulewicz, J. Warta River discharges in Poznań and atmospheric circulation in the North Atlantic region. Quaest. Geogr. 2004, 23, 63–81. [Google Scholar]
- Pociask-Karteczka, J. River Hydrology and the North Atlantic Oscillation: A General Review. AMBIO 2006, 35, 312–314. [Google Scholar] [CrossRef] [PubMed]
- Wrzesiński, D. Regional differences in the influence of the North Atlantic Oscillation on seasonal river runoff in Poland. Quaest. Geogr. 2011, 30, 127–136. [Google Scholar] [CrossRef] [Green Version]
- Wrzesiński, D.; Paluszkiewicz, R. Spatial differences in the impact of the North Atlantic Oscillation on the flow of rivers in Europe. Hydrol. Res. 2011, 42, 30–39. [Google Scholar] [CrossRef]
- De Serio, F.; Malcangio, D.; Mossa, M. Circulation in a Southern Italy coastal basin: Modelling and field measurements. Cont. Shelf Res. 2007, 27, 779–797. [Google Scholar] [CrossRef]
- Pinadi, N.; Lyubartsev, V.; Cardellicchio, N.; Caporale, C.; Ciliberti, S.; Coppini, G.; De Pascalis, F.; Dialti, L.; Federico, I.; Filippone, M.; et al. Marine Rapid Environmental Assessment in the Gulf of Taranto: a multiscale approach. Nat. Hazards Earth Syst. Sci. 2016, 16, 2623–2639. [Google Scholar] [CrossRef] [Green Version]
- Federico, I.; Pinardi, N.; Coppini, G.; Oddo, P.; Lecci, R.; Mossa, M. Coastal ocean forecasting with an unstructured grid model in the Southern Adriatic northern Ionian Sea. Nat. Hazards Earth Syst. Sci. 2017, 17, 45–59. [Google Scholar] [CrossRef]
- Boero, F.; Foglini, F.; Fraschetti, S.; Goriup, P.; Macpherson, E.; Planes, S.; Soukissian, T.; Mossa, M. The CoCoNet Consortium. CoCoNet: towards coast to coast networks of marine protected areas (from the shore to the high and deep sea), coupled with sea-based wind energy potential. SCIRES-IT. 2016, 6, 1–95. [Google Scholar] [CrossRef]
- Enfield, D.B.; Mestas-Nuñez, A.M.; Trimble, P.J. The Atlantic multidecadal oscillation and its relation to rainfall and river flows in the continental U.S. Geophys. Res. Lett. 2001, 28, 2077–2080. [Google Scholar] [CrossRef]
- Kerr, R.A. A North Atlantic Climate Pacemaker for the Centuries. Science 2000, 288, 1984–1986. [Google Scholar] [CrossRef] [PubMed]
- Knight, J.R.; Folland, C.K.; Scaife, A.A. Climate impacts of the Atlantic Multidecadal Oscillation. Geophys. Res. Lett. 2006, 33, L17706. [Google Scholar] [CrossRef]
- Rogers, J.C.; Coleman, J.S.M. Interactions between the Atlantic Multidecadal Oscillation, El Niño/La Niña, and the PNA in winter Mississippi Valley stream flow. Geophys. Res. Lett. 2003, 30, 1518. [Google Scholar] [CrossRef]
- Oglesby, R.; Feng, S.; Hu, Q.; Rowe, C. The role of the Atlantic Multidecadal Oscillation on medieval drought in North America: Synthesizing results from proxy data and climate models. Glob. Planet. Chang. 2012, 84–85, 56–65. [Google Scholar] [CrossRef]
- Boé, J.; Habets, F. Multi-decadal river flow variations in France. Hydrol. Earth Syst. Sci. 2014, 18, 691–708. [Google Scholar] [CrossRef] [Green Version]
- Marsz, A.A.; Styszyńska, A.; Krawczyk, E.W. The long-term fluctuations in annual flows of rivers in Poland and their relationship with the North Atlantic Thermohaline Circulation. Przegląd Geogr. 2016, 88, 295–316. (In Polish) [Google Scholar] [CrossRef]
- Gutry-Korycka, M.; Boryczka, J. Long-term changes in water balance elements in Poland and the Baltic Sea basin. Przegląd Geofiz. 1990, 35, 19–32. (In Polish) [Google Scholar]
- Woś, A. Climate of Poland in the Second Half of the 20th Century; Wydawnictwo Naukowe UAM: Poznań, Poland, 2010; pp. 1–489. (In Polish) [Google Scholar]
- Dynowska, I. Regime of river flow Sheet: 32.3. In Atlas of the Republic of Poland; IG PZ PAN: Warszawa, Poland, 1994; pp. 1–157. (In Polish) [Google Scholar]
- Dynowska, I.; Pociask-Karteczka, J. Water circulation. In Geography of Poland. Natural Environment; Starkel, L., Ed.; Wydawnictwo Naukowe PWN: Warszawa, Poland, 1999; pp. 343–373. (In Polish) [Google Scholar]
- Wrzesiński, D. River regimes of Poland. In Hydrology of Poland; Jokiel, P., Marszalewski, W., Pociask-Karteczka, J., Eds.; PWN: Warszawa, Poland, 2017; pp. 215–221. (In Polish) [Google Scholar]
- Wrzesiński, D. Use of entropy in the assessment of uncertainty of river runoff regime in Poland. Acta Geophys. 2016, 64, 1825–1839. [Google Scholar] [CrossRef]
- Marsz, A.; Styszyńska, A. Oceanic control of the warming processes in the Arctic—A different point of view for the reasons of changes in the Arctic climate. Probl. Klimatol. Polarn. 2009, 19, 7–31. [Google Scholar]
- Marsz, A.A. Model of changes in the Arctic sea-ice extent (1979–2013)—Variables steering the ‘minimalist’ model and their climatic significance(in Polish). Probl. Klimatol. Polarn. 2015, 25, 249–334. [Google Scholar]
- NOAA NCDC Extended Reconstructed Sea Surface Temperature (ERSST) v3b. Available online: https://www.ncdc.noaa.gov/data-access/marineocean-data/extended-reconstructed-sea-surface-temperature-ersst-v3b (accessed on 13 May 2019).
- Smith, T.M.; Reynolds, R.W.; Peterson, T.C.; Lawrimore, J. Improvements to NOAA’s Historical Merged Land-Ocean Surface Temperature Analysis (1880–2006). J. Clim. 2008, 21, 2283–2296. [Google Scholar] [CrossRef]
- Girs, A.A. Macro-Circulation Method of Long-Term Forecasts; Gidrometeoizdat Publishing House: Leningrad, Russia, 1974; pp. 1–488. (In Russian) [Google Scholar]
- Osuchowska-Klein, B. Catalogue of atmospheric circulation types. In IMGW; Wydawnictwa Komunikacji i Łączności: Warsaw, Poland, 1978; pp. 1–192. (In Polish) [Google Scholar]
- Osuchowska-Klein, B. Catalogue of atmospheric circulation types 1976–1990. In IMGW; Wydawnictwa Komunikacji i Łączności: Warsaw, Poland, 1991; pp. 1–50. (In Polish) [Google Scholar]
- Sobczyk, M. Statistics; Wydawnictwo Naukowe PWN: Warszawa, Poland, 2007; pp. 1–428. (In Polish) [Google Scholar]
- Pohlmann, H.; Sienz, F.; Latif, M. Influence of the Multidecadal Atlantic Meridional Over-turning Circulation Variability on European Climate. J. Clim. 2006, 19, 6062–6067. [Google Scholar] [CrossRef]
- Kelly, M.H.; Gore, J.A. Florida river flow patterns and the Atlantic multidecadal oscillation. River Res. Appl. 2008, 24, 598–616. [Google Scholar] [CrossRef]
Figure 1.
River runoff (H) and types of flow regime of rivers in Poland (based on Wrzesiński [33,34]). 1. rivers and reservoirs; 2. state borders; 3. voivodeship cities. Types of regime: A—nival poorly formed; B—nival moderately formed; C—nival well-formed; D—nival-pluvial; E—pluvial-nival.

Figure 2.
The course of the DG3L index in the years 1901–2018. The multi-year period 1971–2015 is marked, in which relationships between the index and the meteorological and hydrological elements are analyzed.
Figure 2.
The course of the DG3L index in the years 1901–2018. The multi-year period 1971–2015 is marked, in which relationships between the index and the meteorological and hydrological elements are analyzed.

Figure 3.
Relationship between the DG3L index and the annual frequency of macrotype W of the mid-tropospheric circulation, according to classification by Girs [39]. Marked are: regression line (solid line) and 95% confidence level (dashed lines).
Figure 3.
Relationship between the DG3L index and the annual frequency of macrotype W of the mid-tropospheric circulation, according to classification by Girs [39]. Marked are: regression line (solid line) and 95% confidence level (dashed lines).

Figure 4.
Relationship between the DG3L index and the annual frequency (number of days) of the occurrence of C2D and D2C types of atmospheric circulation, according to classification by Osuchowska-Klein [40,41]. Sampling period: 1951–1990. Marked are: regression line (solid line) and 95% confidence level (dashed lines).

Figure 5.
Schematic charts of distribution of the atmospheric pressure at the sea level (SLP) in C2D and D2C types of the lower atmospheric circulation, according to classification by Osuchowska-Klein [40,41].

Figure 6.
Average annual air temperature deviations (ΔT) in the negative (DG3L −) and positive (DG3L +) phases of DG3L compared to the average values, and their statistical significance (p).
Figure 6.
Average annual air temperature deviations (ΔT) in the negative (DG3L −) and positive (DG3L +) phases of DG3L compared to the average values, and their statistical significance (p).

Figure 7.
The percent share of the positive and negative coefficients of correlation between monthly flows and the DG3L index (A), and the percent share of the statistically significant coefficients of correlation (p < 0.05) (B).
Figure 7.
The percent share of the positive and negative coefficients of correlation between monthly flows and the DG3L index (A), and the percent share of the statistically significant coefficients of correlation (p < 0.05) (B).

Figure 8.
Spatial distribution of correlations between monthly river flows and the DG3L index, and their statistical significance (p).
Figure 8.
Spatial distribution of correlations between monthly river flows and the DG3L index, and their statistical significance (p).

Figure 9.
Deviations of monthly river flows in the negative (DG3L −) and positive (DG3L +) phases of DG3L compared to the average values (1971–2015), and their statistical significance (p)—winter half-year (November–April).
Figure 9.
Deviations of monthly river flows in the negative (DG3L −) and positive (DG3L +) phases of DG3L compared to the average values (1971–2015), and their statistical significance (p)—winter half-year (November–April).

Figure 10.
Deviations of monthly river flows in the negative (DG3L −) and positive (DG3L +) phases of DG3L compared to the average values (1971–2015), and their statistical significance (p)—summer half-year (May–October).
Figure 10.
Deviations of monthly river flows in the negative (DG3L −) and positive (DG3L +) phases of DG3L compared to the average values (1971–2015), and their statistical significance (p)—summer half-year (May–October).

Figure 11.
Spatial distribution of correlations between average annual river flows and the DG3L index, and their statistical significance (p).
Figure 11.
Spatial distribution of correlations between average annual river flows and the DG3L index, and their statistical significance (p).

Figure 12.
Deviations of average annual river flows in the negative (DG3L −) and positive (DG3L +) phases of DG3L compared to the average values (1971–2015), and their statistical significance (p).
Figure 12.
Deviations of average annual river flows in the negative (DG3L −) and positive (DG3L +) phases of DG3L compared to the average values (1971–2015), and their statistical significance (p).

Figure 13.
Flowchart explaining the mechanism of the influence of changes in the intensity of the North Atlantic Thermohaline Circulation (NA THC) on river flow in Poland.
Figure 13.
Flowchart explaining the mechanism of the influence of changes in the intensity of the North Atlantic Thermohaline Circulation (NA THC) on river flow in Poland.

Table 1.
Values of the coefficient of correlation (r) between the DG3L index and selected climate elements in Poland (1971–2015). Significant values (p < 0.05) of the coefficients of correlation are shown in bold, highly significant values (p < 0.001) are additionally marked with asterisk (*).
Table 1.
Values of the coefficient of correlation (r) between the DG3L index and selected climate elements in Poland (1971–2015). Significant values (p < 0.05) of the coefficients of correlation are shown in bold, highly significant values (p < 0.001) are additionally marked with asterisk (*).
| Climate Element | January | February | March | April | May | June | July | August | September | October | November | December | Year |
|---|---|---|---|---|---|---|---|---|---|---|---|---|---|
| Total cloud cover | 0.24 | 0.15 | 0.04 | −0.25 | 0.12 | 0.03 | −0.04 | −0.14 | −0.01 | 0.13 | 0.14 | 0.12 | 0.11 |
| Total precipitation | 0.16 | 0.17 | 0.28 | −0.03 | 0.26 | −0.25 | 0.02 | −0.06 | 0.05 | −0.07 | 0.05 | −0.09 | 0.06 |
| Air temperature | 0.27 | 0.26 | 0.20 | 0.63 * | 0.14 | 0.25 | 0.50 * | 0.56 * | 0.33 | 0.18 | 0.32 | 0.09 | 0.63 * |
| Sunshine duration | 0.07 | 0.14 | 0.28 | 0.52 * | 0.24 | 0.43 | 0.41 | 0.44 | 0.35 | 0.20 | 0.23 | 0.30 | 0.70 * |
| Relative humidity | 0.06 | −0.19 | −0.31 | −0.52 * | −0.25 | −0.34 | −0.39 | −0.41 | −0.32 | −0.14 | 0.32 | −0.13 | −0.58 * |
© 2019 by the authors. Licensee MDPI, Basel, Switzerland. This article is an open access article distributed under the terms and conditions of the Creative Commons Attribution (CC BY) license (http://creativecommons.org/licenses/by/4.0/).
Share and Cite
MDPI and ACS Style
Wrzesiński, D.; Marsz, A.A.; Styszyńska, A.; Sobkowiak, L. Effect of the North Atlantic Thermohaline Circulation on Changes in Climatic Conditions and River Flow in Poland. Water 2019, 11, 1622. https://doi.org/10.3390/w11081622
AMA Style
Wrzesiński D, Marsz AA, Styszyńska A, Sobkowiak L. Effect of the North Atlantic Thermohaline Circulation on Changes in Climatic Conditions and River Flow in Poland. Water. 2019; 11(8):1622. https://doi.org/10.3390/w11081622
Chicago/Turabian StyleWrzesiński, Dariusz, Andrzej A. Marsz, Anna Styszyńska, and Leszek Sobkowiak. 2019. "Effect of the North Atlantic Thermohaline Circulation on Changes in Climatic Conditions and River Flow in Poland" Water 11, no. 8: 1622. https://doi.org/10.3390/w11081622
Note that from the first issue of 2016, this journal uses article numbers instead of page numbers. See further details here.