System Dynamics Approach for Assessing the Behaviour of the Lim Reservoir System (Serbia) under Changing Climate Conditions

Department of Civil and Environmental Engineering, University of Western Ontario, London, ON N6A 3K7, Canada
*
Author to whom correspondence should be addressed.
Water 2019, 11(8), 1620; https://doi.org/10.3390/w11081620
Submission received: 9 July 2019
/
Revised: 29 July 2019
/
Accepted: 1 August 2019
/
Published: 6 August 2019
(This article belongs to the Special Issue Application of the Systems Approach to the Management of Complex Water Systems)
Abstract
:Investigating the impact of climate change on the management of a complex multipurpose water system is a critical issue. The presented study focuses on different steps of the climate change impact analysis process: (i) Use of three regional climate models (RCMs), (ii) use of four bias correction methods (BCMs), (iii) use of three concentration scenarios (CSs), (iv) use of two model averaging procedures, (v) use of the hydrological model and (vi) use of the system dynamics simulation model (SDSM). The analyses are performed for a future period, from 2006 to 2055 and the reference period, from 1971 to 2000. As a case study area, the Lim water system in Serbia (southeast Europe) is used. The Lim river system consists of four hydraulically connected reservoirs (Uvac, Kokin Brod, Radojnja, Potpec) with a primary purpose of hydropower generation. The results of the climate change impact analyses indicate change in the future hydropower generation at the annual level from −3.5% to +17.9%. The change has a seasonal variation with an increase for the winter season up to +20.3% and decrease for the summer season up to −33.6%. Furthermore, the study analyzes the uncertainty in the SDSM outputs introduced by different steps of the modelling process. The most dominant source of uncertainty in power production is the choice of BCMs (54%), followed by the selection of RCMs (41%). The least significant source of uncertainty is the choice of CSs (6%). The uncertainty in the inflows and outflows is equally dominated by the choice of BCM (49%) and RCM (45%).
1. Introduction
Water resources management relies on the application of a systems approach to deal with complex problems [1]. This approach uses a systems analysis in finding solutions for complex water problems trying to balance between conflicting social, ecological and economic concerns that affect the decision-making process [2]. This study uses one of the two main techniques of systems analysis -simulation. In particular, the system dynamics simulation based on the causal, stock and flow diagraming is implemented. System dynamics simulation is an appropriate approach for the analyses of interconnecting processes and functional relationships of the water resource system components [3]. Using systems analysis, the water resources professionals are able to define plans, design and define reservoir operations for complex water systems under present and future climates.
1.1. System Dynamics Simulation Approach for the Climate Change Impacts Assessment
Water resource management is affected by changing climate conditions combined with accelerated environmental and social changes [4]. An increase in temperature, changes in the precipitation pattern, an increase in the frequency and magnitude of extreme climatic events and a decrease of the snow cover are some of the climate change implications with significant impacts on water resources [5]. The intensification of the hydrological cycle under a changing climate will result in higher flows during the winter season and lower flows for the summer and autumn months. The demand for freshwater, water for irrigation, hydropower generation and instream flows to sustain river health are likely to increase due to a rapid increase in the population. Hence, it is evident that the existing reservoir operations will need to address the challenges of the imbalance between water supply and demand [6,7]. The changing climate is therefore expected to affect the management of complex water resource systems significantly [8]. The implications of climate change on water resource management will affect the planning and real-time operation stages of water systems [6]. Under the changing climate, population growth and water technology deployments, the water systems in the planning stage should explicitly consider the trade-offs between releases from the reservoirs to maintain normal operational levels, environmental flow, water demand for industry and households, agricultural irrigation and hydropower generation. For the case of existing reservoirs, the design capacity of the reservoir storage and hydropower plant (HPP) characteristics need to be re-evaluated together with the real-time reservoir operations in the changing climate conditions. The revisions may end by suggesting the use of both, non-structural and structural measures [9]. For example, the addition of a turbine to an existing power plant due to higher flows in winter is a structural measure, while the change of reservoir operating rules is considered as a non-structural adaptation measure. The latter adjusts levels in reservoirs over the winter and spring months, increasing the releases through the turbines, and consequently increasing the hydropower generation [10]. Applying adaptive real-time reservoir operation rules and water management policy for the river basins impacted by climate change can reduce the vulnerability associated with the hydropower generation and should be an effective non-structural measure capable of responding to changing climate conditions [10].
1.2. System Dynamics Simulation Modelling Processes and Its Uncertainty
Several system dynamics simulation modelling studies have been performed in the past focusing on the reservoir operations and adaptation measures under the changing climate conditions [9,10,11,12,13]. The climate change impact studies use the following steps to estimate the impacts on the reservoir system operations: (1) Selection of the global climate model/s (GCMs) and/or regional climate model/s (RCMs), (2) selection of the concentration scenarios, (3) correction of raw climatic data from the climate models using bias correction methods (BCMs), (4) application of averaging procedures to combine the outputs from the climate models, (5) application of the hydrological model to estimate the inflows for the reservoir system simulation model, (6) development of the system dynamics model and operational rules to transform available water resources in space and time considering the constraints of the system and needs of the users.
To close the science-practice gap, it is required to provide a clear understanding of the uncertainty within the climate change impact analysis processes [4]. The uncertainty associated with future climate variations and natural hydrologic variability represents a great challenge for the water resource system management [14]. The reservoir inflows are the most significant contributor of uncertainty to water resources management. The sources of uncertainty in the reservoir inflows originate in model parameters and the model structure [14].
Furthermore, inflows can be uncertain due to differences in the space and time distribution scales [15]. However, the greatest uncertainty in the hydrological outputs under the present and future climate conditions stems from the uncertainty in the model structure, not the parameters [16]. The significant uncertainty in the inflows, and consequently in the outflows, is associated with the choice of the climate model, rather than the concentration scenario and choice of the hydrological model [17,18]. The statistical post-processing tools contribute to the highest level of uncertainty in the reservoir inflows, propagating it to the hydropower generation [8]. To provide scientifically based advice to decision-makers, it is highly recommended to use different approaches for each step of the climate change impact modelling process. Integrating uncertainties into the decision-making process of reservoir management can increase the utility of the decision support tools [4].
1.3. The Goals of the Study
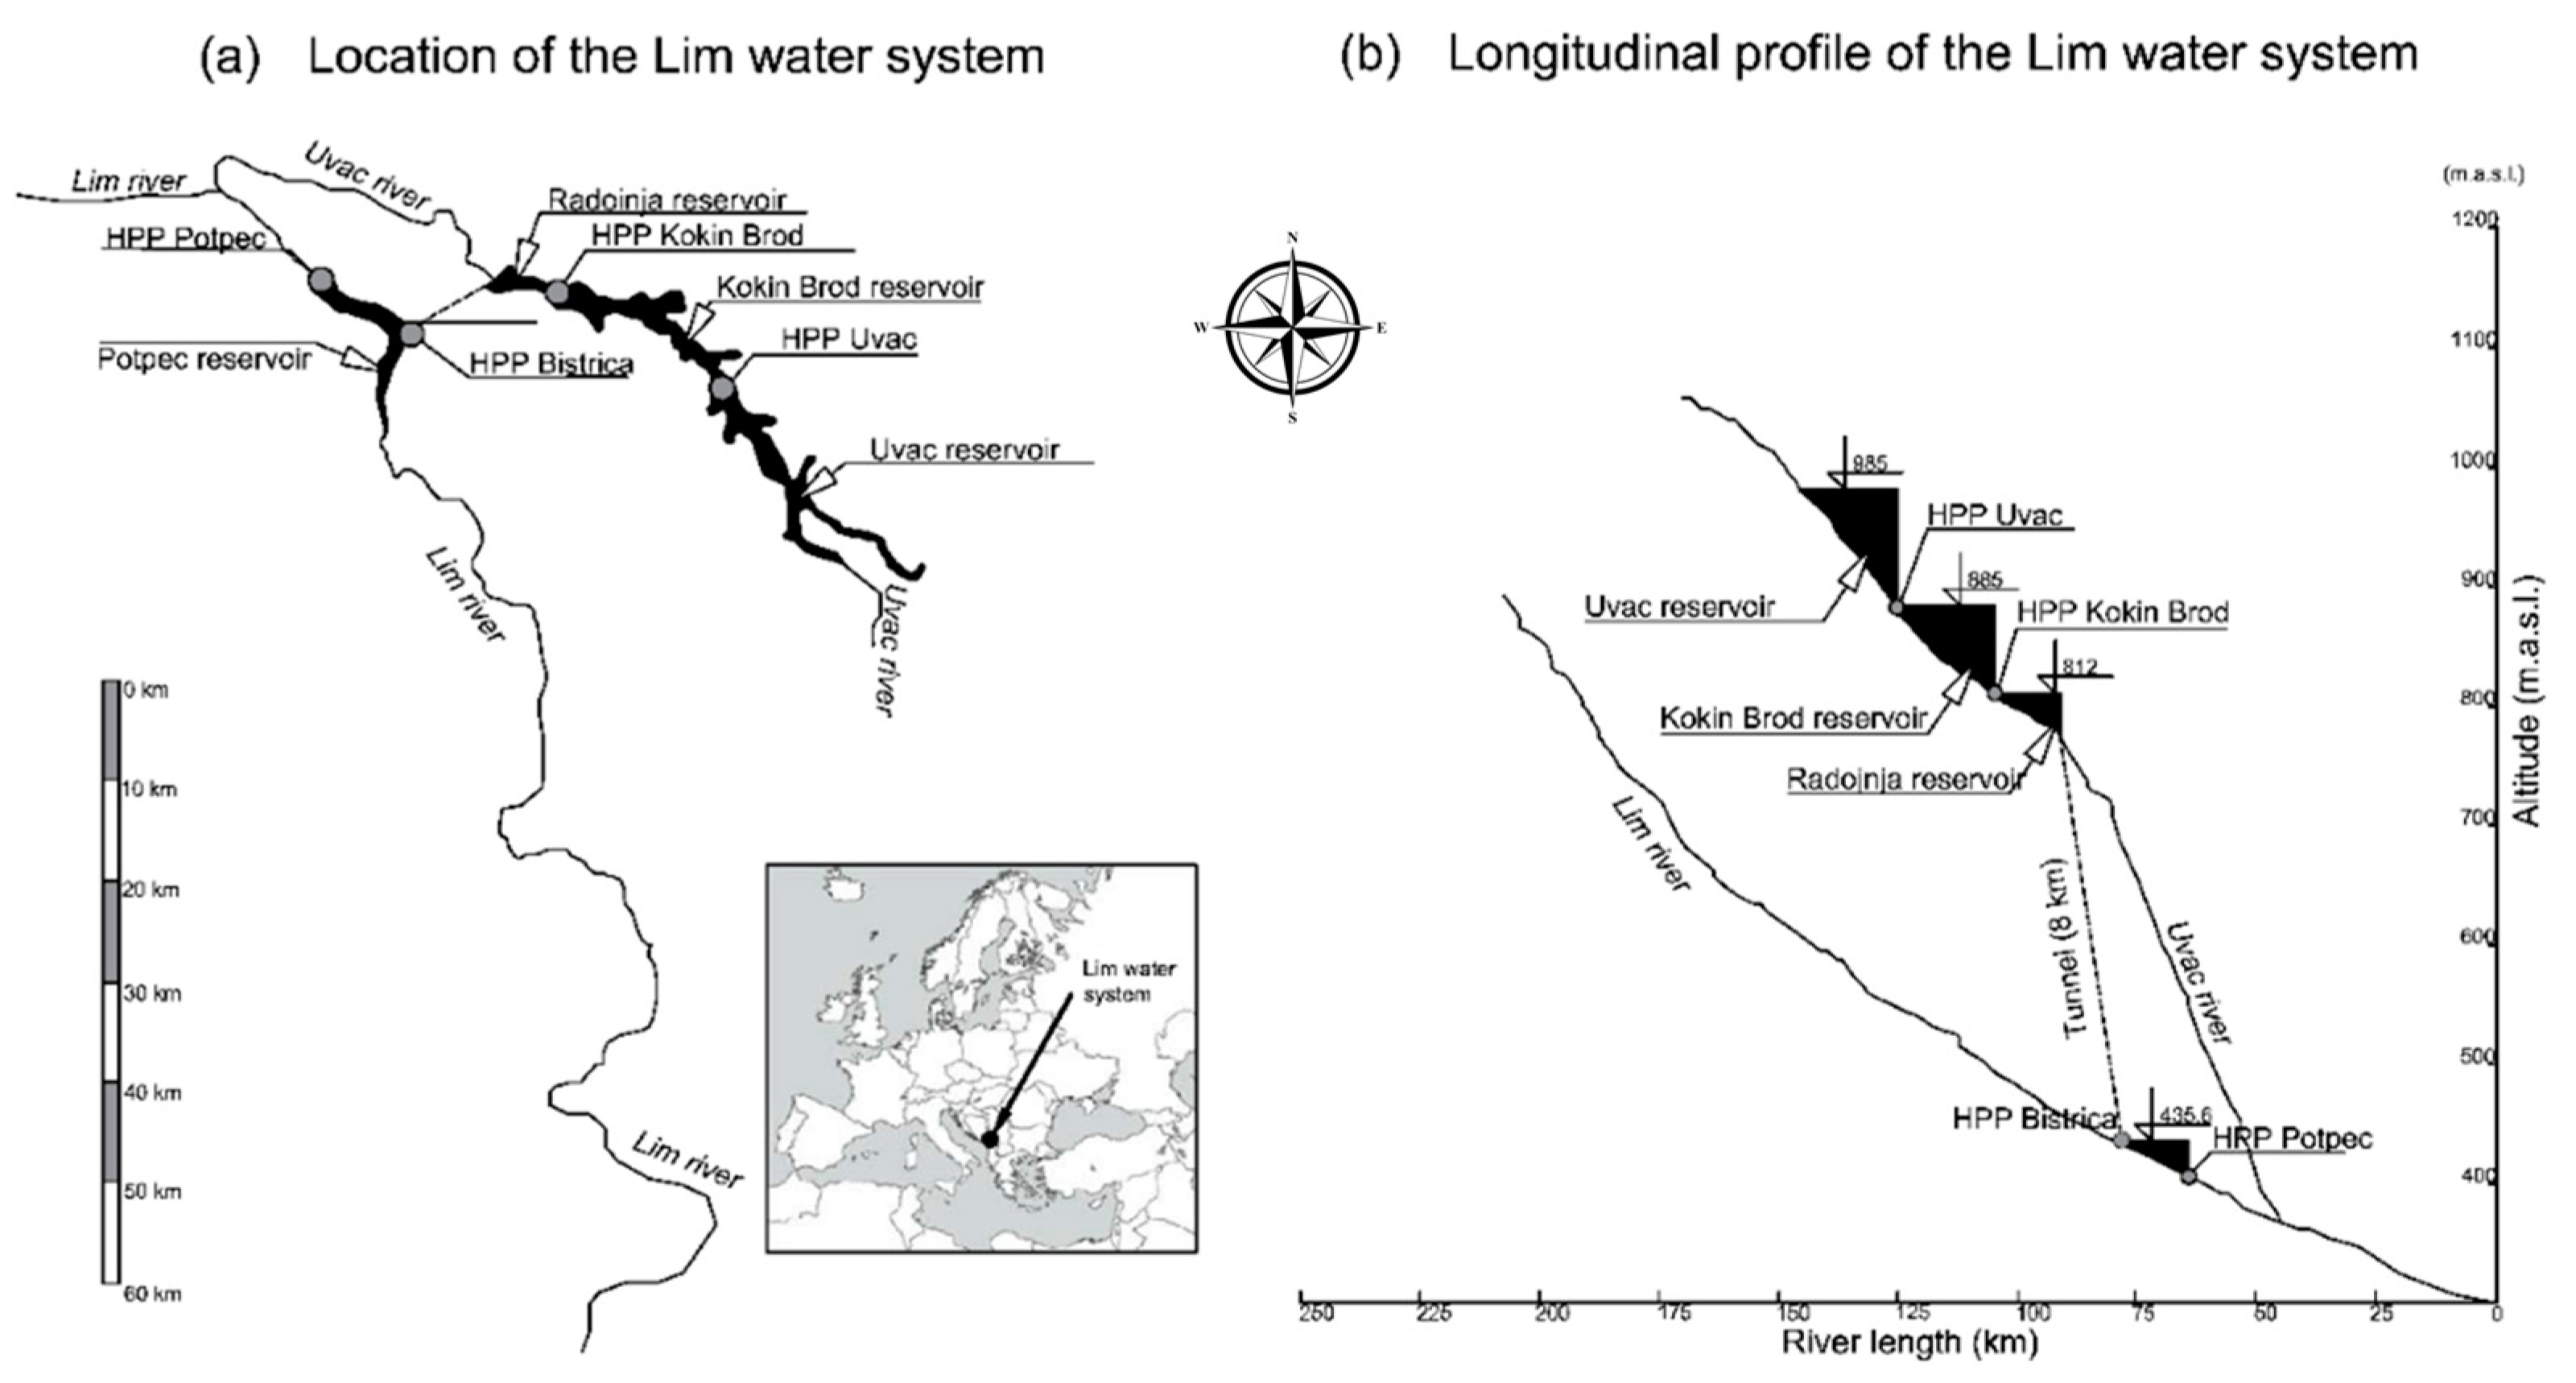
This study is carried out for the Lim water system that includes the Lim and Uvac rivers (Serbia, southeast Europe), Figure 1. The primary purpose of the system is the hydropower generation. In addition, the Lim water system mitigates adverse hazardous events and improves the downstream water quality [19]. Variation of the inflows and hydropower generation mostly depend on the climate conditions. Therefore, the primary goal of the presented study is to assess the climate-related impacts on the Lim river basin using the simulation model of hydraulically connected reservoirs (Figure 1).
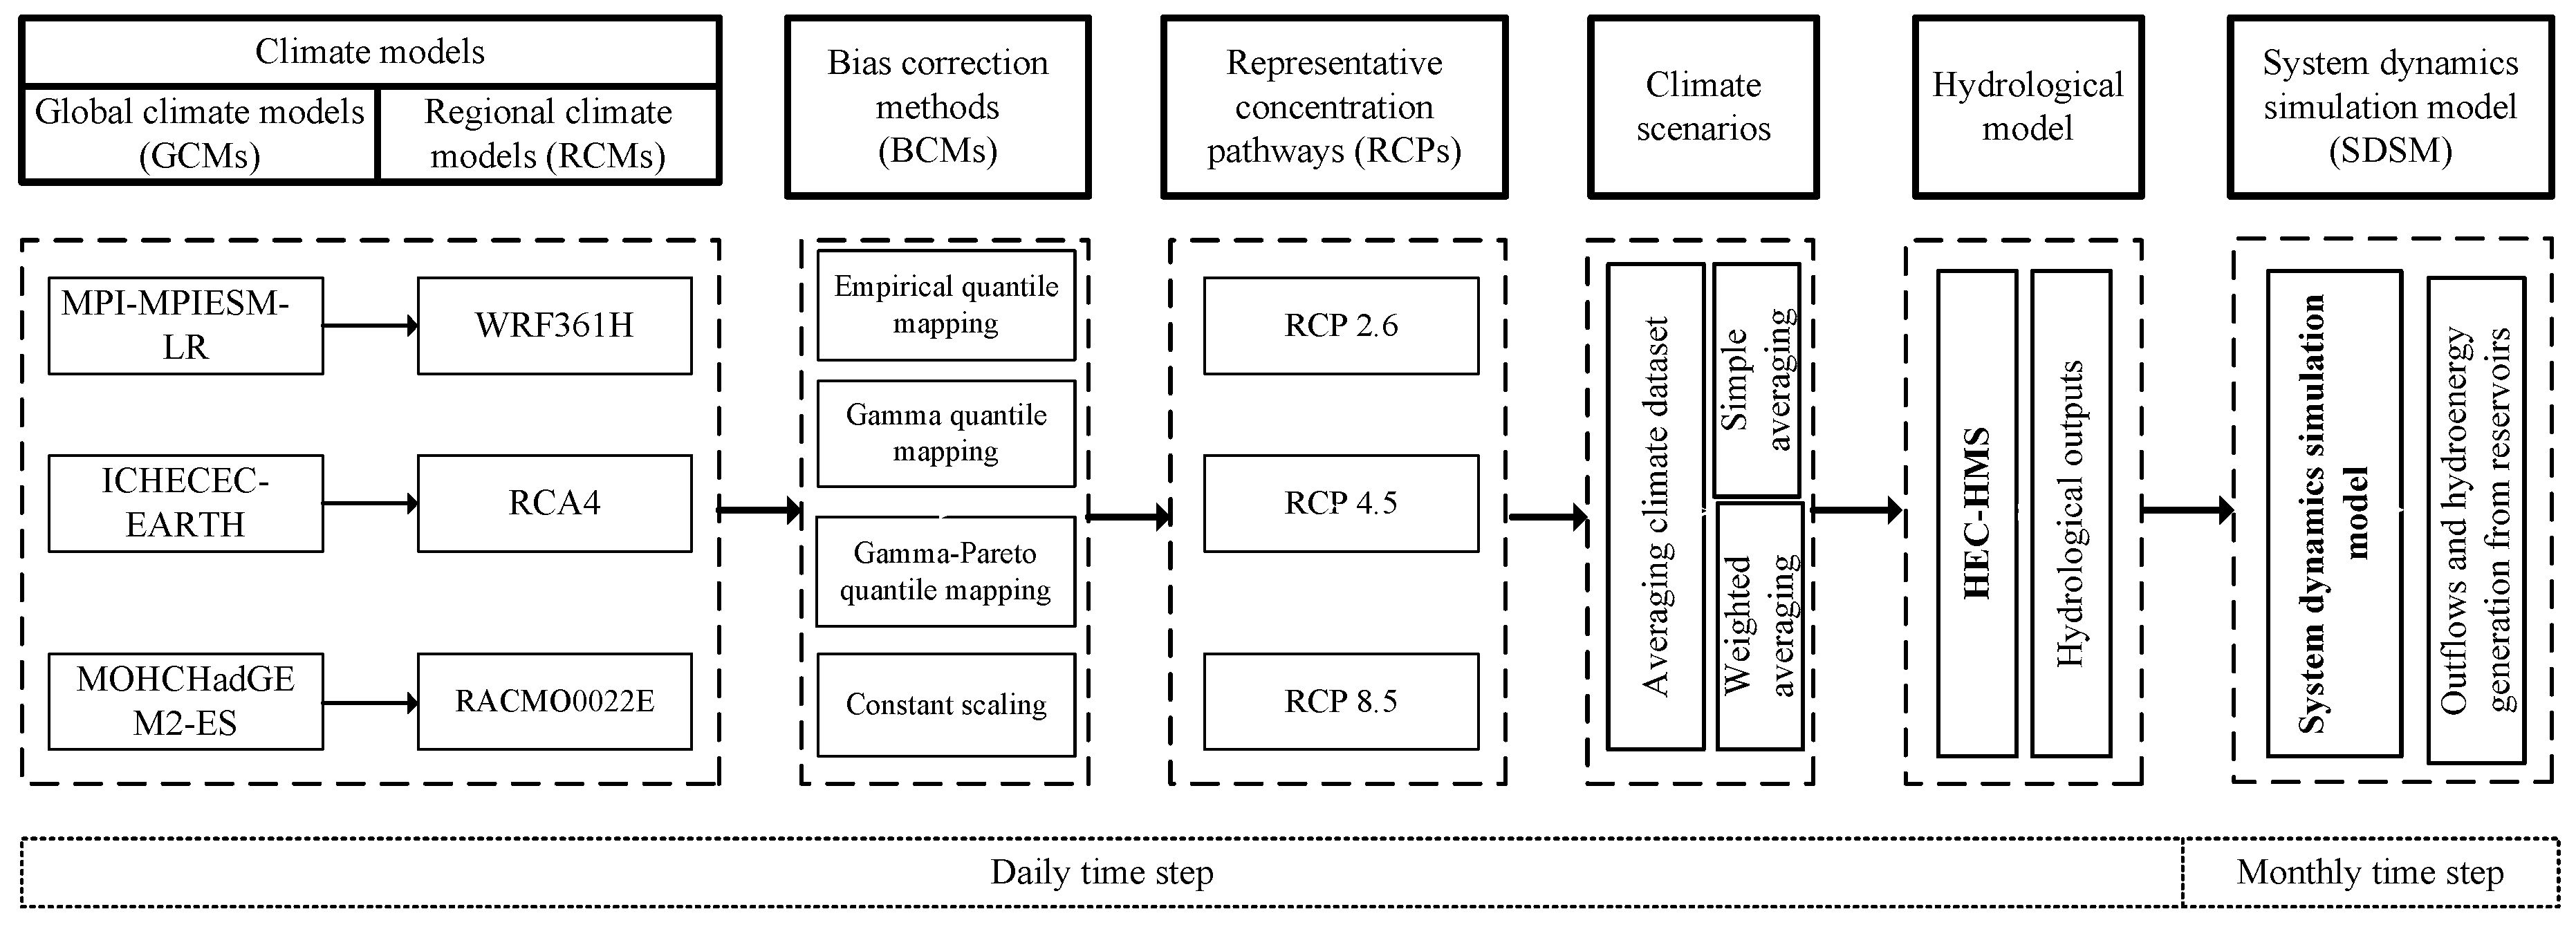
The assessment of the climate-related impacts on the hydropower generation of the Lim water system has been performed in [19]. A traditional engineering approach (flow duration analyses under present and future climates) was used to estimate the impacts of the changing climate on the hydropower generation [20]. This study extends the World Bank analyses using an approach based on the system analysis and simulation of climate-related impacts on the Lim water system [1]. It employs the climate change impact analysis processes and corresponding steps implemented in this study are illustrated in Figure 2. The impact assessment is obtained by using three RCMs, three CSs, four BCMs, two averaging techniques, a single hydrological model and system dynamics simulation model (SDSM). The BCMs transform raw precipitation from the climate models. Subsequently, averaging procedures are used to identify the processes that contribute to the uncertainty in the SDSM outputs. Next, the hydrological model is used to convey the climate change signal to the watershed response. Finally, the SDSM is used to capture the complex system structure and assess the climate change-related impacts on the outputs of SDSM within the Lim river basin.
The goals of the study are therefore multifold: (1) To develop the SDSM and to propose adaptive operational rules for the existing system reservoirs within the Lim river basin, (2) to assess the impacts of the changing climate on the SDSM outputs, (3) to quantify the contribution of the uncertainty of each individual climate change impact analysis steps on the system performance using SDSM.
The rest of the paper is organized as follows. The description of the Lim water system is presented in Section 2. Section 3 describes the SDSM of the Lim water system alongside the operational rules of the reservoir system. The methodology for the uncertainty assessment within the different steps of the impact assessment process is presented in Section 4. The assessment results and their discussion are in Section 5, while conclusions end the paper in Section 6.
2. Lim Water System
The Lim water system is located in Serbia (southeast Europe) and extends over an area of around 3600 km2. It represents a multipurpose complex system including four hydraulically connected reservoirs (the Potpec, Uvac, Kokin Brod and Radojnja). The locations of the Lim water system reservoirs alongside the longitudinal profiles of the Lim and Uvac rivers are depicted in Figure 1. The Potpec reservoir lies on the Lim river, while the remaining three reservoirs, namely the Uvac, Kokin Brod and Radojnja, are located on the Uvac river. The Lim and Uvac rivers are part of the international trans-boundary Drina river system [19]. The Lim river and Uvac river (the biggest tributary of the Lim river), are respectively 220 km and 115 km long. The specific water yield of the Uvac river is 9.9 l/s/km2, while the contribution of the Lim river is much greater, ranging from 26.0 l/s/km2 to 43.8 l/s/km2 [21,22].
The primary purpose of the Lim water system is the hydropower generation (Table 1). In addition, the Lim water system is used for mitigation of floods, and downstream water quality control by regulation of the outflows over the low-flow season. The management of the Lim water system depends on the actual volume of water stored in the reservoirs, inflows and energy demand.
The concrete gravity dam of the Potpec reservoir is 46 m in height and 215 m in length (Figure 1a). The power plant has three turbines (51 MW) for power generation with the maximal and minimal discharges of 165 m3/s and 18.5 m3/s, respectively. Active storage of the Potpec reservoir is 19.8 × 10⁶ m3. Three gated spillways are located at the middle part of the dam with the capacity of 3000 m3/s. The Uvac, Kokin Brod and Radojnja reservoirs are hydraulically connected. They satisfy the demand for the hydropower generation and provide storage for attenuation of flood waves (Figure 1). The Uvac reservoir is the second largest reservoir within the Lim water system with active storage of 160 × 106 m3. The Kokin Brod and Radojnja reservoirs are located on the downstream river section (Figure 1a,b). The Kokin Brod reservoir has the largest active storage of 209 × 106 m3. Downstream of the Kokin Brod reservoir is situated the Radojnja reservoir with the active storage of 4.1 × 10⁶ m3. The lateral flow between the Uvac and Kokin Brod reservoirs is equal to 2.5 m3/s, while the lateral flow which contributes to the Radojnja reservoirs is 0.5 m3/s. The dams of the Kokin Brod and Radojnja reservoirs are rockfill dams, while the Uvac dam is an earthfill dam. The dams of the Uvac, Kokin Brod and Radojnja reservoirs are 110 m, 82 m and 42 m high and 307 m, 1220 m and 361 m long, respectively. The Uvac and Kokin Brod power plants have turbines with the maximal discharge of 43 m3/s (36 MW) and 36 m3/s (2 × 10.7 MW), respectively. The Radojnja reservoir is hydraulically connected with diversion-type turbines at the Bistrica power plant by the 8 km pressure tunnel (Figure 1a,b). The Bistrica power plant has two turbines (2 × 18 m3/s, 2 × 51.5 MW) and is located at the Lim river nearby the Potpec reservoir. The pressure tunnel conveys the water from the Uvac river to the Lim river providing a significant contribution to the total annual flow at the Potpec reservoir (77.6 m3/s). Note that the total annual inflow of the Radojnja reservoir is equal to 14.4 m3/s. The maximal spillway capacities of the Uvac, Kokin Brod and Radojnja reservoirs are 1050 m3/s, 1400 m3/s and 1400 m3/s, respectively.
3. System Dynamics Simulation Model of the Lim Water System
3.1. General Approach
The presented climate change impact analysis study organization is shown in Figure 2. Three RCMs from the EURO-CORDEX initiative are selected [23]: WRF361H (DWD—Deutscher Wetterdienst), RCA4 (SMHI—Swedish Meteorological and Hydrological Institute) and RACMO 22E (Royal Netherlands Meteorological Institute). The selected RCMs driven by the boundary conditions from GCMs are illustrated in Figure 2. Climate simulations cover the case study area with the datasets at a high spatial resolution of 0.11 degrees (~2.5 km). Such RCM resolution is selected since it can reproduce extreme precipitation behavior. Furthermore, the availability of the simulated climate for the future period under the RCP 2.6, RCP 4.5 and RCP 8.5 emission trajectories is used. Selected climate options cover a wide range of future socioeconomic scenarios and projected CS. Furthermore, the EURO-CORDEX collection also offers climate simulations from many RCMs with different spatial resolutions. For example, HIRHAM5 and REMO2009, REGCM3 and HadRM3Q16, RACMO2 and RCA provide the simulated precipitation and temperature with spatial resolutions of 12.5 km2, 25 km2, and 50 km2, respectively.
Then, BCMs are applied to statistically correct climate model outputs. Selected BCMs include empirical quantile mapping—EQM [24], gamma quantile mapping—GQM [25], gamma-Pareto quantile mapping—GPQM [13] and constant scaling—CS [26]. Next, the averaging methods are used to estimate average climate signals from multiple RCMs and BCMs. The simple model averaging [27] is introduced to analyze uncertainty in the climate models, statistical post-processing tools and concentration scenarios (CSs). The Bates-Granger averaging [28] is used to form the median of the ensemble using the weighted realizations from each RCM and BCM. Using the averaging procedures, a set of climate scenarios are formed. Then, the hydrological modelling system (HEC-HMS) version 4.2.1 is used to derive a watershed response under the climate scenarios [29]. The model hydrological structure includes six modelling components: Meteorological input, snow, precipitation loss, direct runoff, baseflow, and river routing. The applied structure of the hydrological model is capable of performing continuous hydrological simulation under present and future climates [30,31]. Average climate outputs are used by the hydrological model to obtain the inflows for the Lim water system reservoirs (Figure 1a). The inflows are then used by SDSM to simulate the Lim water system performance. The SDSM is developed using the Vensim system dynamics simulation software [32]. The SDSM transforms (in space and time) the outputs of the hydrological model through the hydraulically connected system of reservoirs resulting in the spillway, turbine flow and environmental reservoir releases. A description of the SDSM is provided in the following section.
3.2. The System Dynamics Simulation Model
3.2.1. Reservoir Operations
The Lim water system reservoirs regulate downstream flows in time and space to meet the demand for the hydropower generation, attenuate flood waves and improve the downstream water quality. The reservoir capacity of the Lim water system is divided into three parts [33]: Active storage, dead storage and flood storage. The active storage capacity of the reservoirs is used for the hydropower generation and environmental flow management, while the flood storage capacity is reserved to reduce the flooding downstream. The dead storage capacity of the reservoirs is required for the sediment deposition. The existence of large reservoirs on the Uvac river enables the active storage capacity of the Uvac and Kokin Brod reservoirs to be separated into two parts: Over-year storage capacity, and within-year storage volume. The Radojnja and Potpec reservoirs participate only in daily flow regulation due to the smaller reservoir capacity.
Operations of the Lim water system are driven by technically experienced staff of the public power utility “Elektroprivreda Serbia” to meet the needs of the Serbian power system over the peak demand hours. However, the change of climatic conditions will intensify the hydrological cycle, leading to changes in the annual and seasonal streamflow distribution. Since reservoirs are built to alter the natural spatial and temporal distribution of streamflow, flexible operational rules, associated with the use of the active storage capacity, are required to deal with the annual and interannual changes of the inflows. The climate change impacts on the operational rules of the Uvac and Kokin Brod reservoirs, which can regulate the seasonal and annual flow variations, are much more important than the impacts on the Radojnja and Potpec reservoirs operating at a daily basis. Accordingly, the over-year storage capacity and within-year storage volume of the Uvac and Kokin Brod reservoirs is re-optimized. The operational rules at the monthly time scale are developed using the yield model solved by the sequent peak method [33]. This method enables the adaptation of reservoir operations according to the changes in the multi-annual and seasonal flow distributions [10]. In this way, the release policy is adapted to the climate signal changes because the climate drivers are the main forcing factor of flow variations. For the Radojnja and Potpec reservoirs, multi-annual and interannual flow distribution does not affect their regular operations and, therefore, the standard operational policy is applied [33].
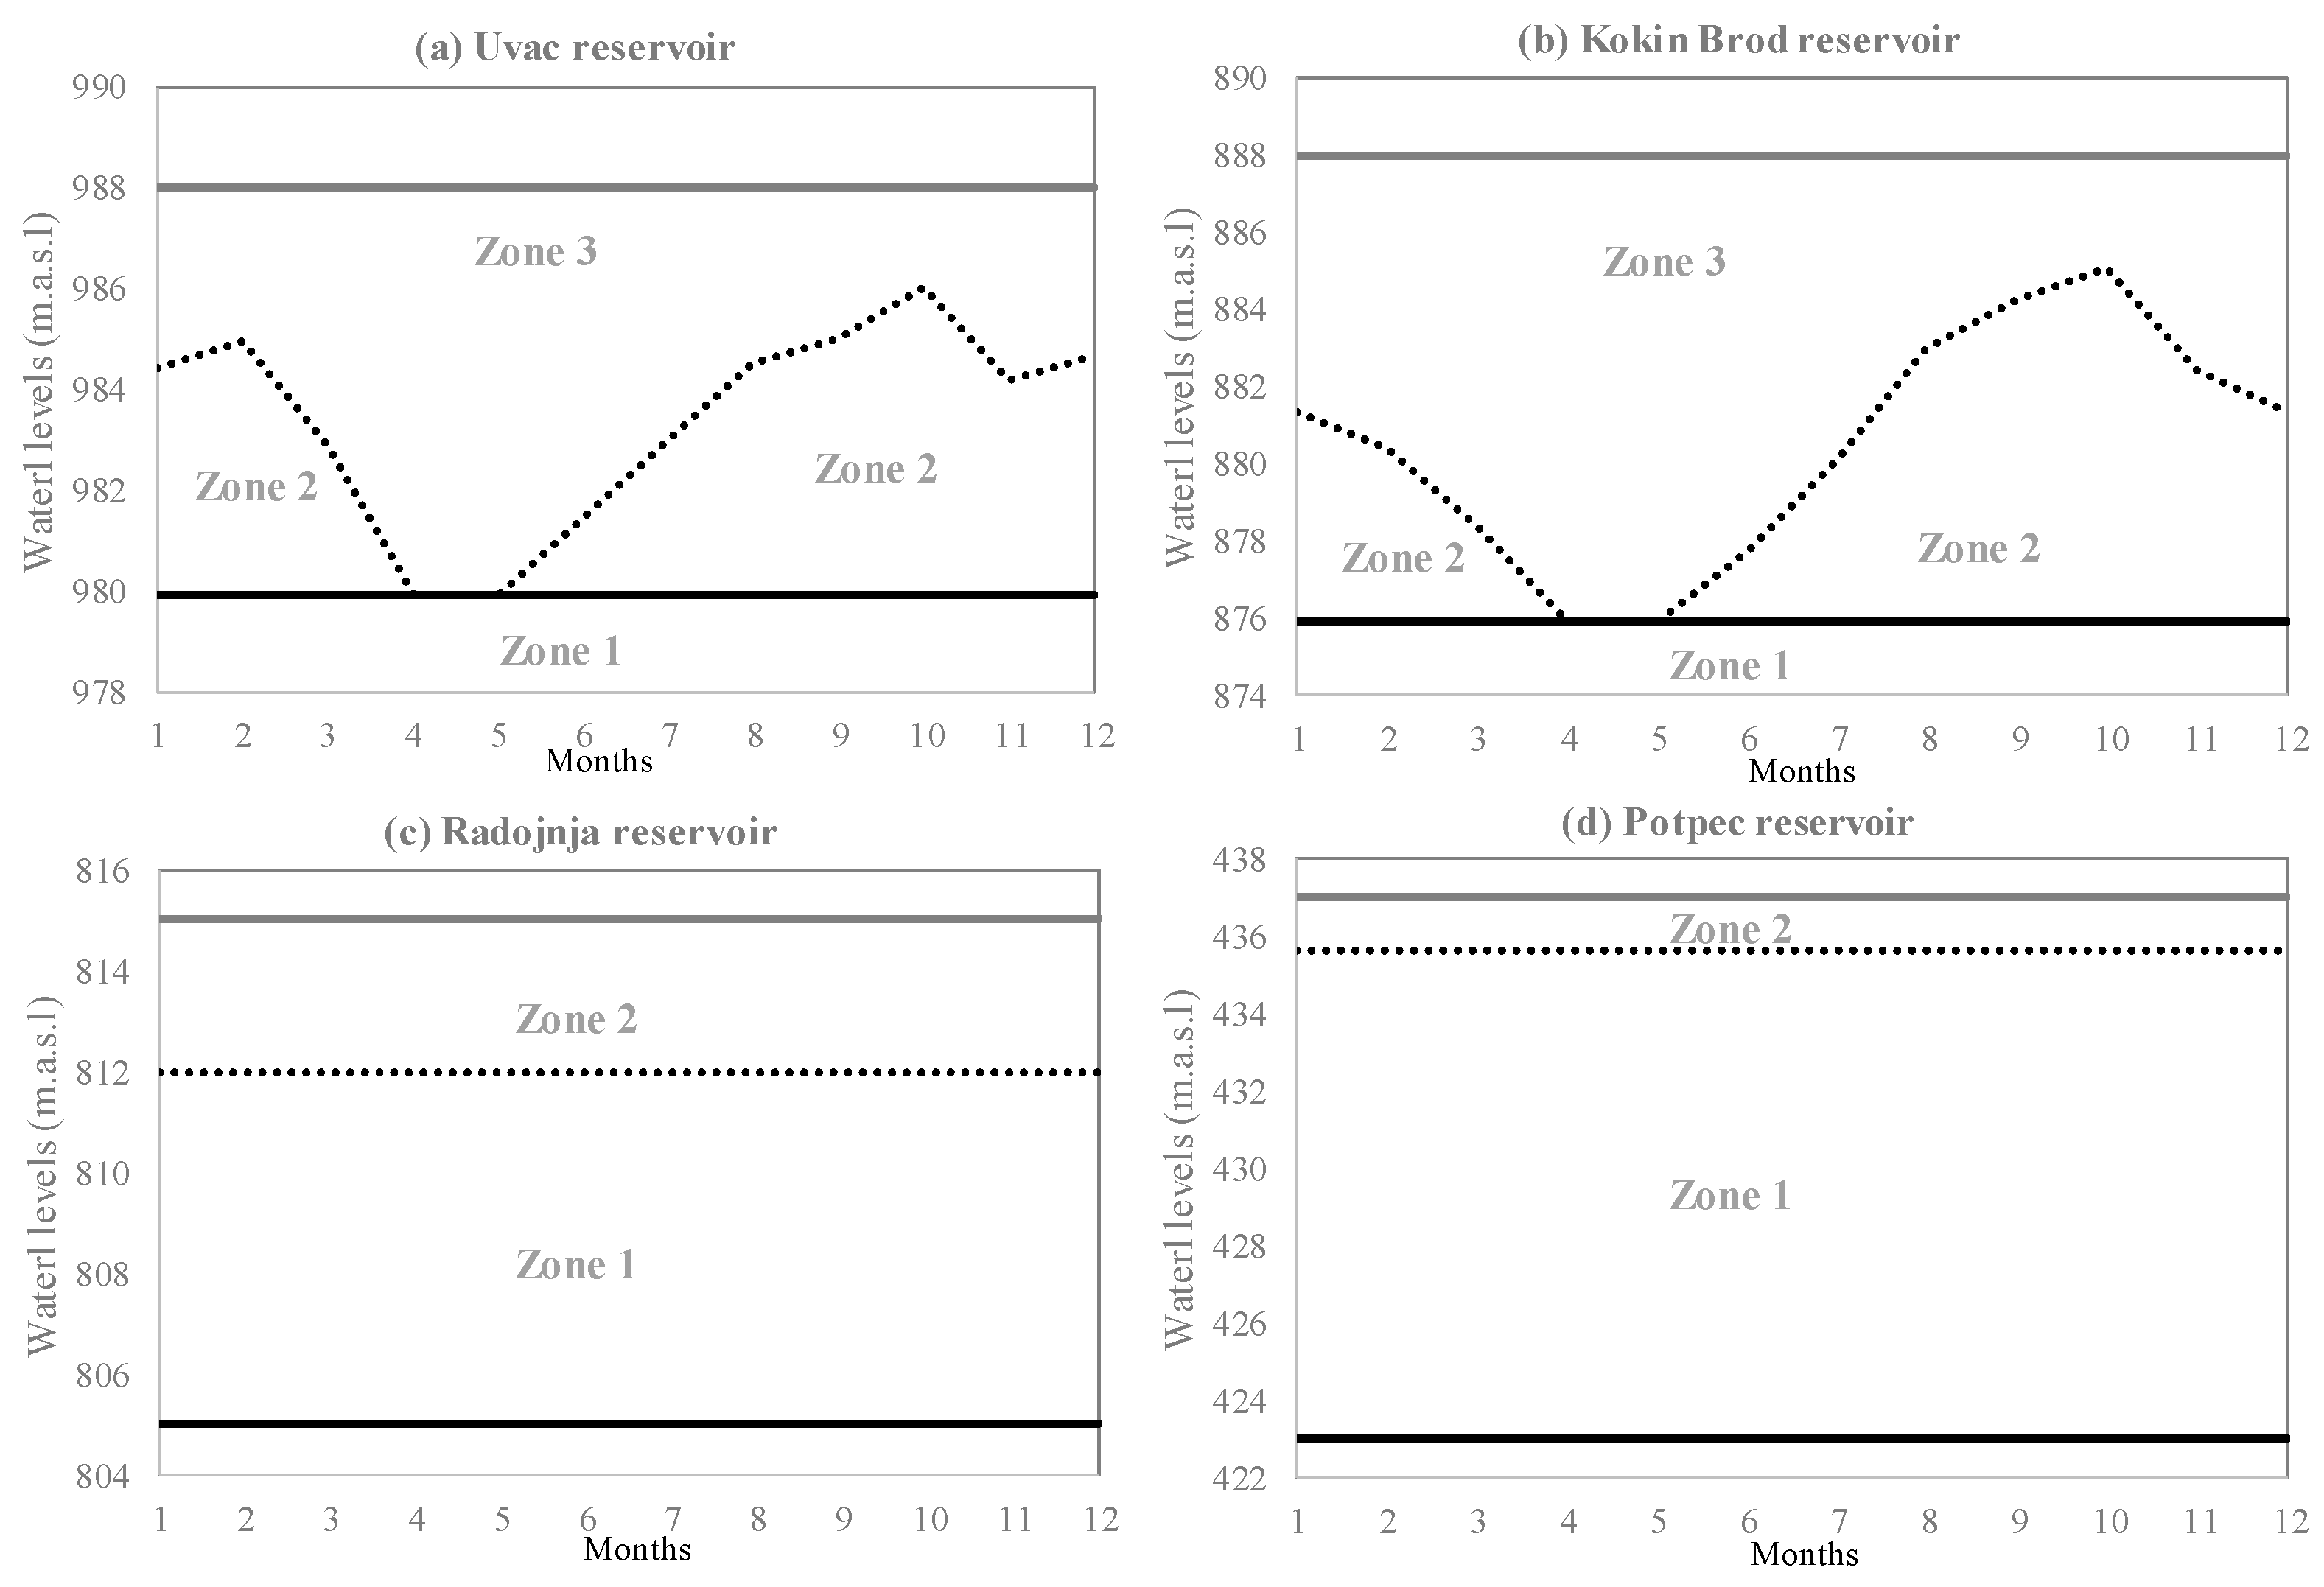
The operational rules for the reservoirs shown in Figure 3 identify the storage volume zones associated with a particular release policy. The Uvac and Kokin Brod reservoirs have the within-year storage capacity below zone 2 because the distribution of the within-year inflows requires additional reservoir capacity (Figure 3a,b). For this purpose, monthly hydropower releases with 50% reliability are used to define the optimal yields and the corresponding reservoir release rules. Zone 1 indicates the release policy to satisfy the variations between the annual inflow distribution and annual yield estimated as a median of the actual annual hydropower releases (Figure 3a,b). Maximal operational levels and the upper bound of zone 2 correspond to zone 3 (Figure 3a,b). If at any time t the storage volume is in zone 3, releases from the Uvac and Kokin Brod reservoirs cannot be greater than the maximal turbine discharge given at 43 m3/s and 37.4 m3/s, respectively. Within zone 2, releases from reservoirs at any time t should not be higher than the optimal yield with a probability of 50% for each month. Releases in zone 1 can be also made to satisfy any demand lower or equal to the annual yield for the Uvac (9.3 m3/s) and Kokin Brod reservoirs (11.3 m3/s). If the water levels in the reservoirs are beyond the limits of zone 3, there are no hydropower releases. Consequently, spillway releases from the reservoirs can be made to reduce the actual storage in the reservoirs to spillway crest elevations (Table 2). The storage above these elevations is considered as the flood storage volume for the Uvac and Kokin Brod reservoirs.
The Radojnja and Potpec reservoirs use the standard operational policy. The active storage capacity is divided in accordance with their minimal, normal and maximal operation levels. In the first zone, minimal and normal operational levels are used to set operational rules related to the first part of their active storage (Figure 3c,d). The release policy made within the first zone is to satisfy any demand limited with the maximal and minimal turbine discharges (Table 1). The maximal release policy is made in the second part zone 2 corresponding to the installed turbine capacity of the Bistrica (36 m3/s) and Potpec (165 m3/s) HPPs. Note that the upper limits of zone 2 represent the maximal operational levels of the powerplants. If at any time t the water levels rise above zone 2, spillways are activated reducing the water levels below the maximal operational levels. In addition to operational flood rules, releases from these reservoirs have to be made to improve the downstream water quality. The release has to meet environmental flows standing at 1.2 m3/s and 13.9 m3/s for the Radojnja and Potpec reservoirs, respectively.
3.2.2. System Dynamics Simulation Model of the Lim Water System
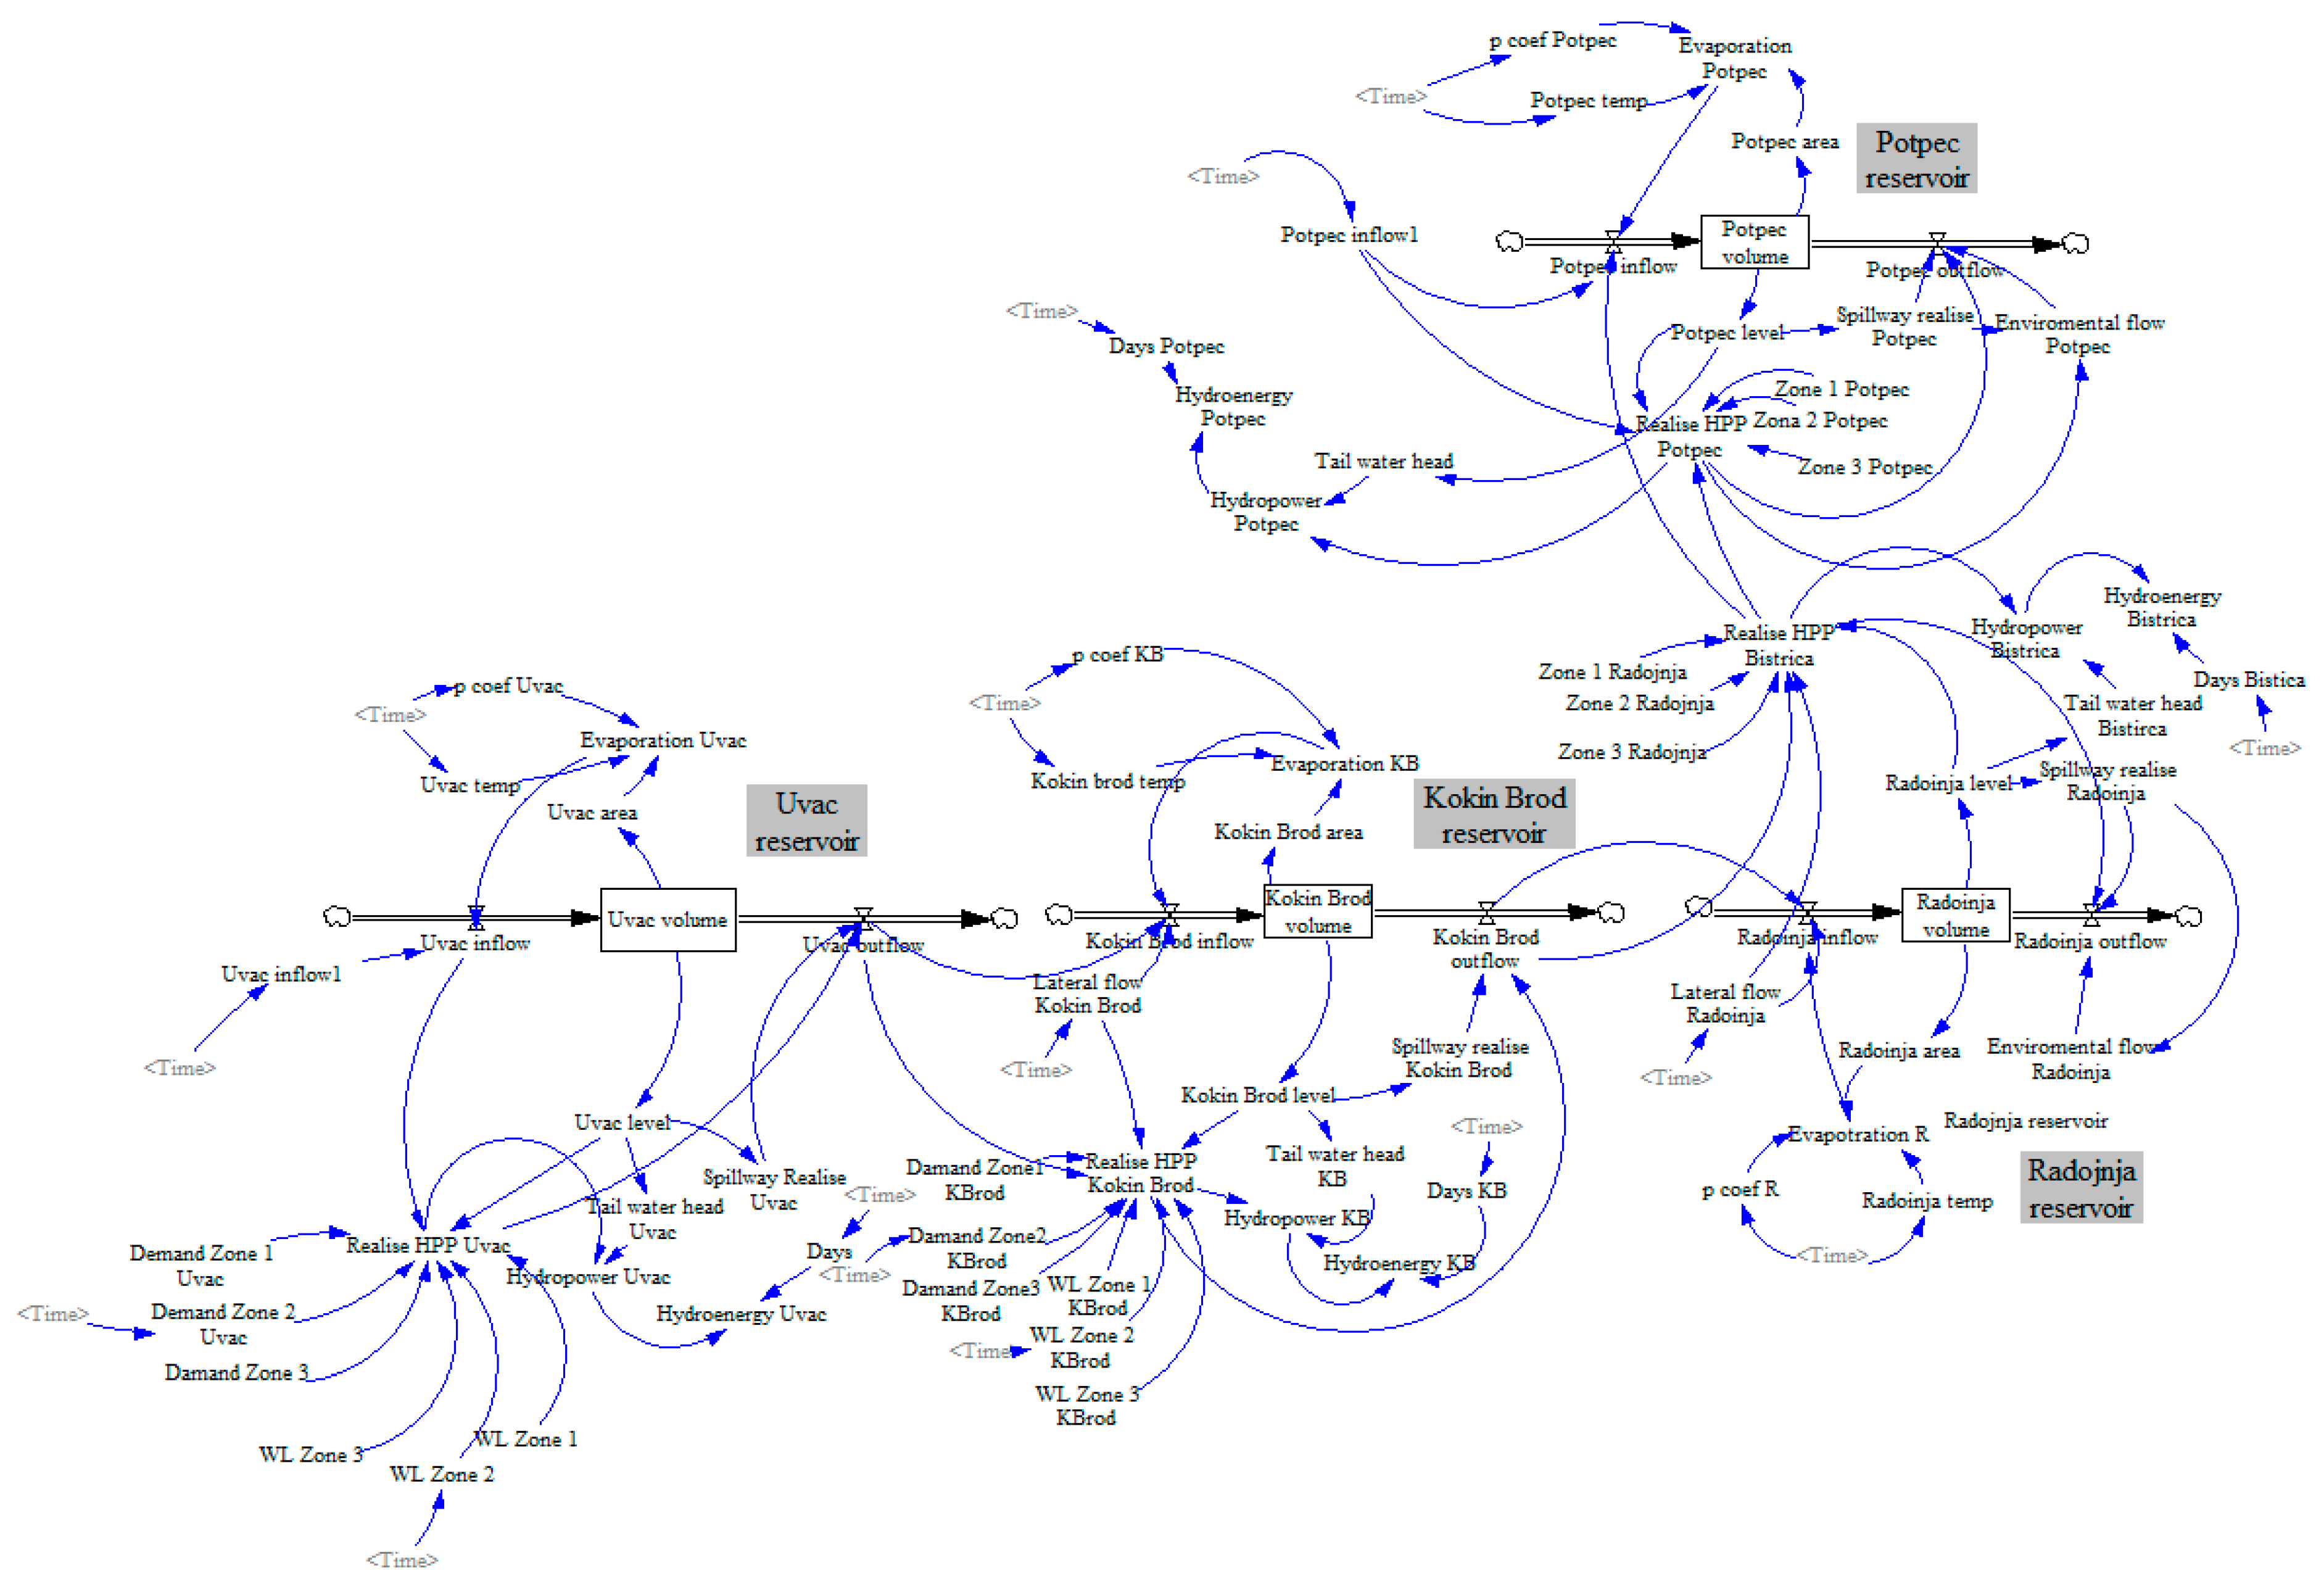
The SDSM of the complex Lim water system is developed in the Vensim software [32]. The SDSM uses a stock and flow diagraming to capture the system structure. The stock and flow diagrams use four graphical objects to represent a complex system structure: (1) Stocks, (2) flows, (3) auxiliary variables and (4) arrows. The reservoirs of the Lim water system are modelled as stocks because they represent state variables accumulating over time. Inflows to and releases from the reservoirs are modelled as flows. They are attached to stocks and change the state of the accumulated water in reservoirs. Other variables in the Lim water system SDSM are represented using auxiliaries. Arrows are connecting stocks, flows and auxiliary variables to close the system structure. They convey information from one variable to another. The stock and flow diagram of the Lim water system is presented in Figure 4. The model simulation uses monthly time step and hydrological model outputs under current conditions. Three reservoirs on the Uvac river, namely the Uvac, Kokin Brod and Radojnja, are in series. The hydropower and spillway releases of the Uvac reservoir are the inflows for the Kokin Brod reservoir together with an additional contribution of lateral flows. Similarly, the outflow from the Kokin Brod reservoir is the major inflow of the Radojnja reservoir, which represents the last reservoir in the series. The hydropower releases of the Radojnja reservoir (the Bistrica HPP) contribute to the inflow of the Potpec reservoir transferring water from the Uvac river to the Lim river (Figure 3). Note that the spillway and environmental releases from the Uvac reservoir continue to flow downstream the Uvac river until its confluence with the Lim river (Figure 1). Alongside outflows from the Radojnja reservoir, the Potpec reservoir at the Lim river receives more significant inflow from the major course-the Lim river. The SDSM is developed to follow the release policy described in Section 3.2.1. As any reservoirs, the Lim water system reservoirs, accumulate their flows in the following way [1]:
where and are the values of the reservoir flows at any time t between the initial time t0 and current time t, while are the cumulative losses (evaporation and seepage) from the reservoirs over time t0 and t. and denote the actual volume of reservoirs in m3 at time steps t and t0, respectively.
Evaporation losses in Equation (1) are estimated due to their importance, especially for reservoirs with large storage capacity (Uvac and Kokin Brod reservoirs). For the monthly evaporation rates from the surface of reservoirs, the Blaney–Criddle formula is applied [34]:
where is the mean monthly temperature in degrees Celsius at time , is the percentage of mean annual daytime hours for each month over the year and denotes the area of reservoirs in square metres at time .
Although seepage losses contribute toward the total releases from the Lim water system, there are no available information on driving factors (e.g., seepage rates, geological formation, permeability, soil moisture conditions) to estimate the seepage rates from the reservoirs. Therefore, the SDSM model does not account for seepage losses.
Inflows in Equation (1) are natural streamflows simulated by the HEC-HMS (Section 3.1). They are transformed over time and space in accordance with the release policy described in Section 3.2.1. The outflows in Equation (1) account for the hydropower () and spillway () releases as well as environmental flow releases (). The hydropower releases for reservoirs are expressed as a function of time depending on inflows in the system () and a random term ():
The discrepancy in the seasonal pattern between the inflows and hydropower demand is simulated with a time delay function in the Vensim software. The time delay of two months is used considering the observed inflows and turbine releases. In addition, uncertainties in hydropower releases are simulated by the random term under the assumption that it follows the normal distribution. The differences among the observed inflows and hydropower releases serve as a basis to estimate the variance of the random term () with the median having the value zero.
Based on the simulated turbine flows, the following equation is used for the hydropower calculation:
where is the megawatts of power produced in time t, is the net head in metres of water available for the hydropower generation during time t and is the turbine efficiency.
Spillway releases () are solved simultaneously until the water level in reservoirs reaches the spillway crest elevation. The spillway release curves are linearly interpolated to determine at time step t. Moreover, if the outflows on the downstream sections of the Uvac and Lim river are below the values required to maintain the river health, an additional release from the Radojnja reservoir ( = 1.2 m3/s) and Potpec reservoir ( = 13.9 m3/s) are calculated to meet these requirements.
4. Uncertainty Assessment within the Climate Change Impact Analysis Process
The outflows from the Lim system of the reservoirs and corresponding hydropower generation reflect the release policy acting to modify the natural hydrological regime to satisfy the multiple water needs (e.g., demand for hydropower generation, flood mitigation, environmental flow releases). Inflows under the changing climate, as the main inputs into the system dynamics simulations, increase the total level of uncertainty due to uncertainty in climate modelling (choice of climate model, bias correction tools and concentration scenarios) and statistical post-processing (selection of the averaging method). The system dynamics modelling and model’s ability to capture the complex system structure accurately can add extra uncertainty to the SDSM outputs. There are several uncertainty assessment approaches (e.g., Monte-Carlo simulation [35], GLUE [36], direct variance method [37]). Since this study aims at quantifying how different steps of the impact analyses process influence the SDSM simulated variables, the direct variance method is selected. It is a straightforward approach capable of assessing the contribution of each step to the total uncertainty by varying the samples and calculating the variance of the ensemble. As a robust statistical method, the variance method represents the proxy measure for determining the uncertainty in the climate change impact analysis process. The drawback lies in the fact that it considers individual variations of each step as a proxy measure of uncertainty, rather than using the hindcast process accuracy during the recorded period. The mean variances of particular variables (e.g., hydropower generation, inflows, outflows) with respect to the selection of RCMs, BCMs and CSs are estimated in the following way:
A simple model averaging method is used with equally weighted variables and from each RCM, BCM and CS [27]:
where the numbers of selected RCMs, BCMs and CSs are denoted as , and , respectively.
Next, the Bates-Granger averaging is applied to estimate the average values of the ensemble with all individual realizations of RCMs, BCMs and CSs [28]:
where are the weights of each RCM and BCM obtained with respect to their hindcast accuracy over the reference period. The contributions of each climate change impact analysis step (RCMs, CSs, BCMs) to the total uncertainty are estimated as follows:
where , and denote the percent contribution of uncertainty introduced by RCMs, BCMs and CSs, respectively.
5. Results and Discussion
5.1. Model Verification
The SDSM is developed for four reservoirs of the Lim water system (Figure 1). Simulations are performed using the monthly time step. The Lim water system model (Figure 4) is implemented in the Vensim software which allows an easy modification of the system structure (by the manipulation of four graphical objects) and model simulations using different dataset. In this study, the outputs of the hydrological model are used as inputs to system dynamics simulations. Hydrological simulations are conducted with a variety of climatic datasets including the observed and simulated climate (Section 3.1). The HEC-HMS deterministic hydrological model is set for the Lim river basin and Lim water system.
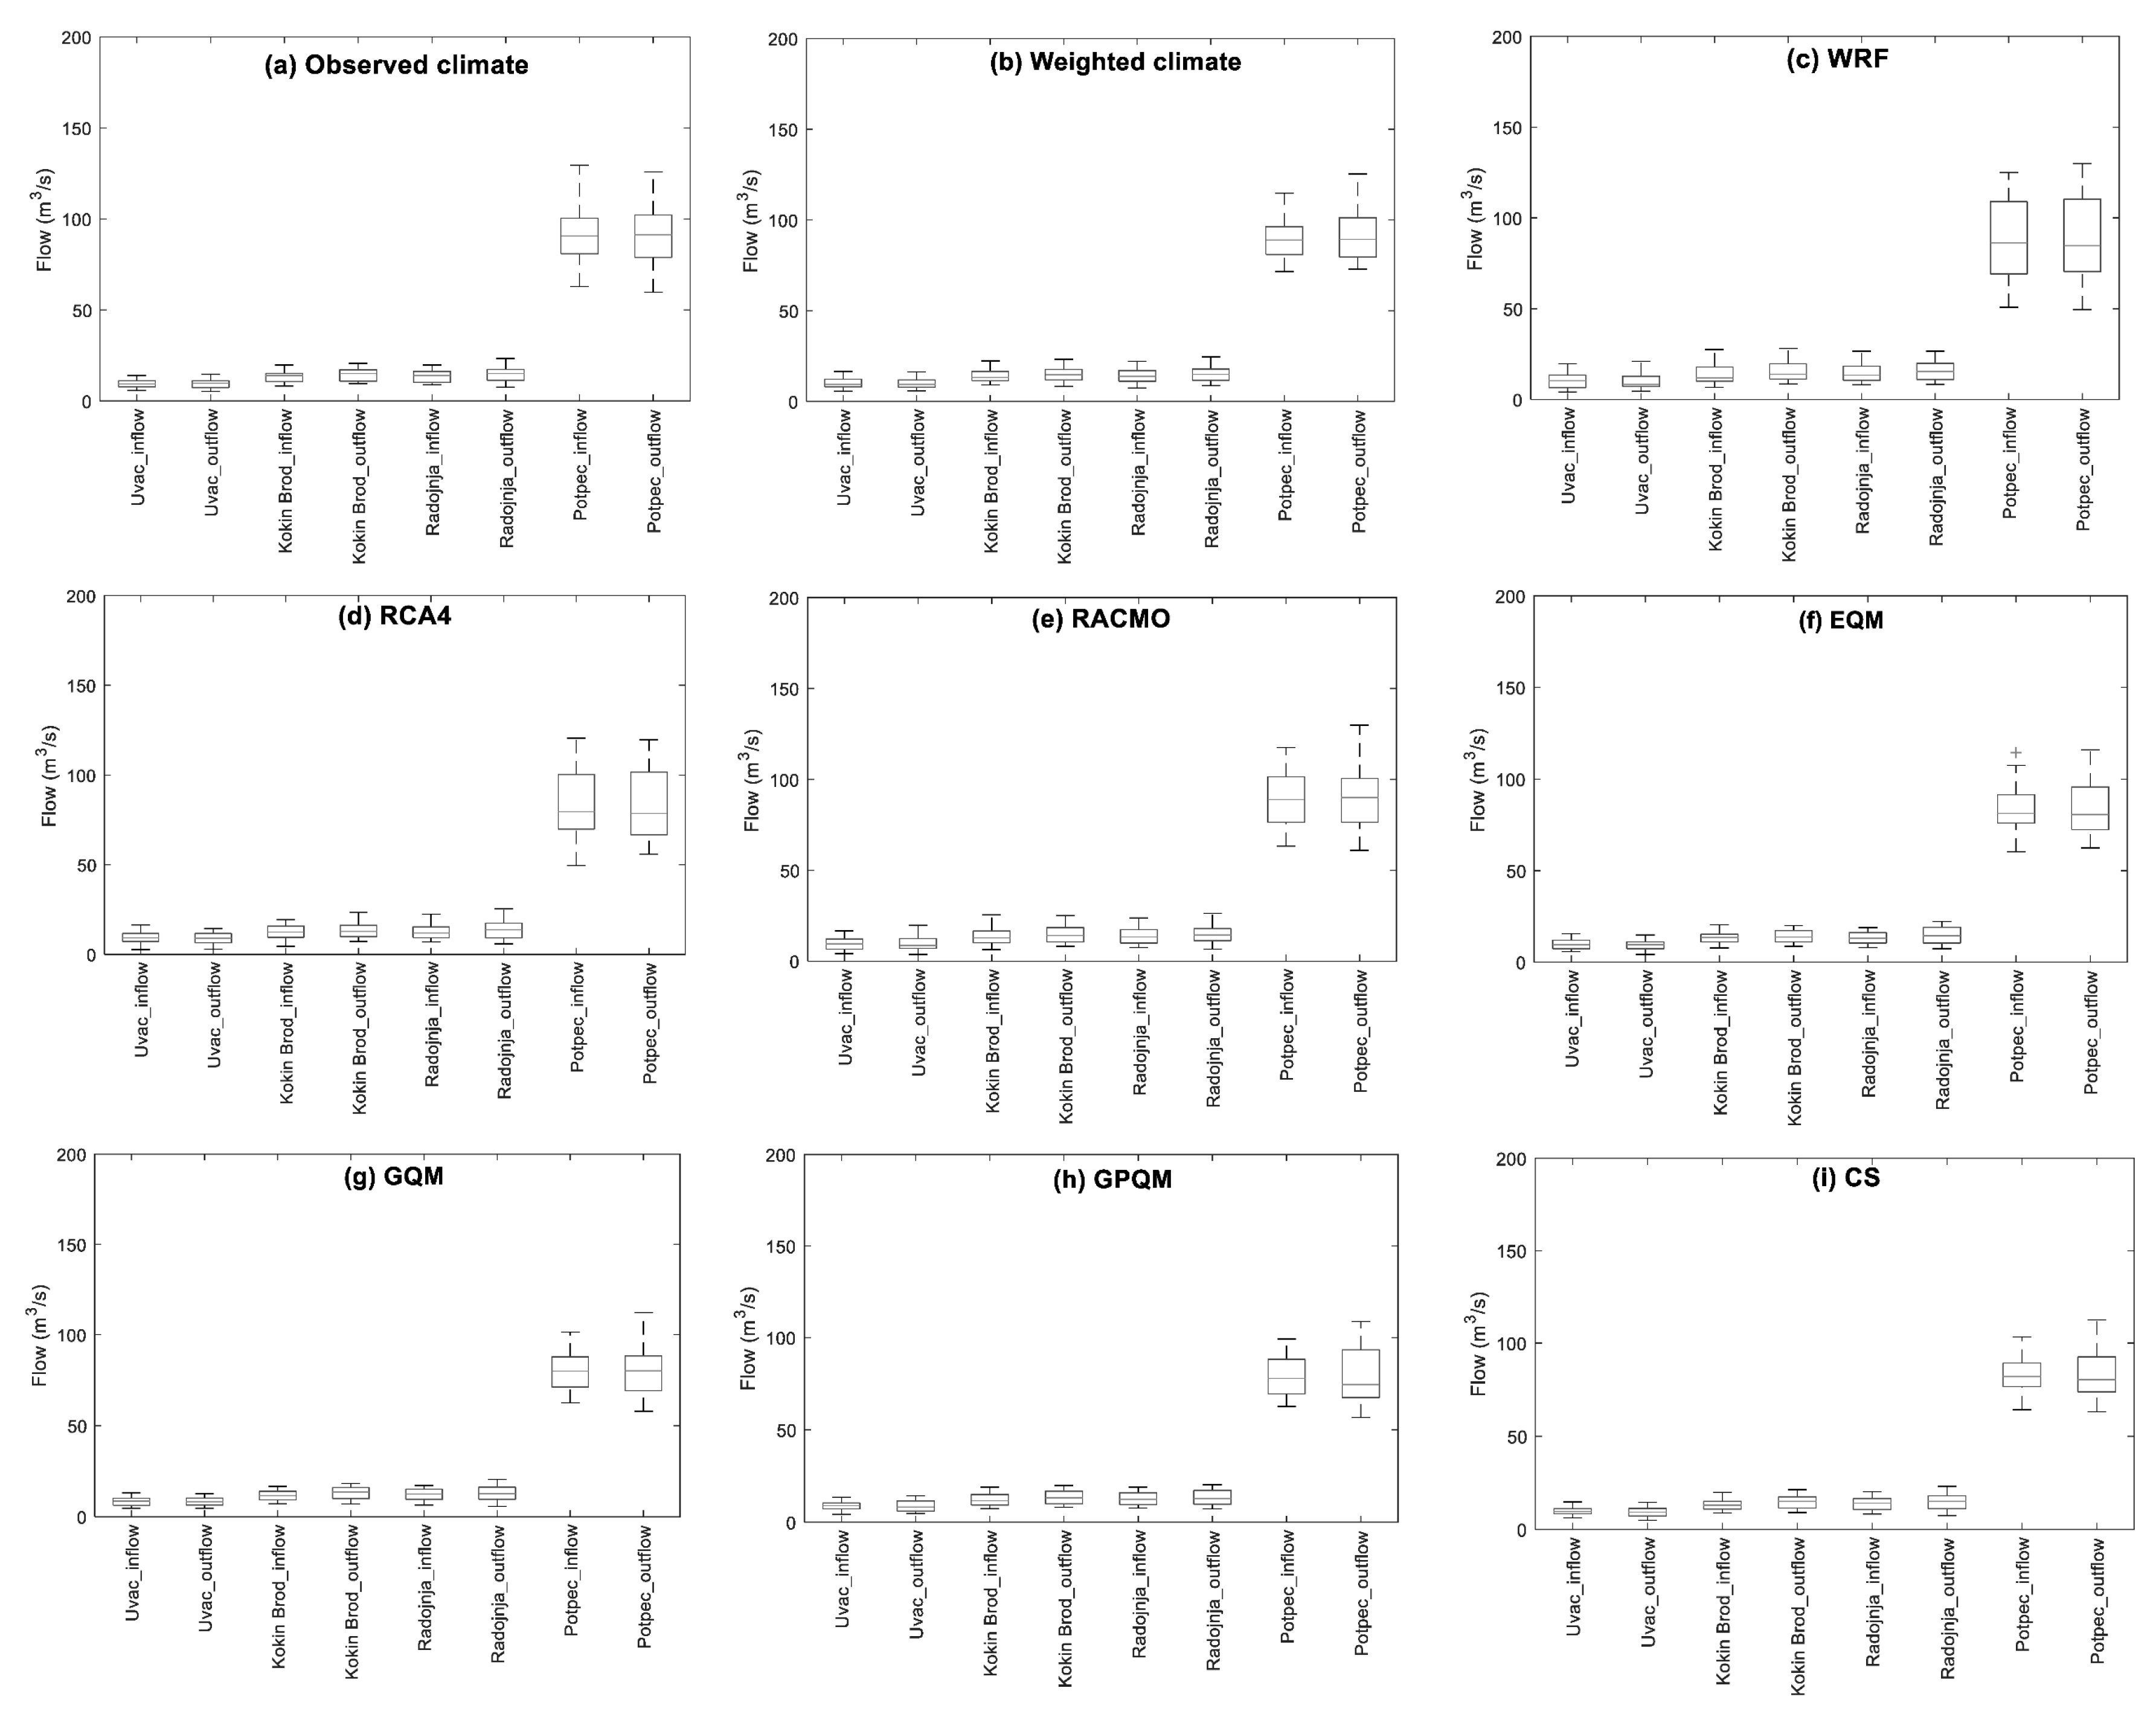
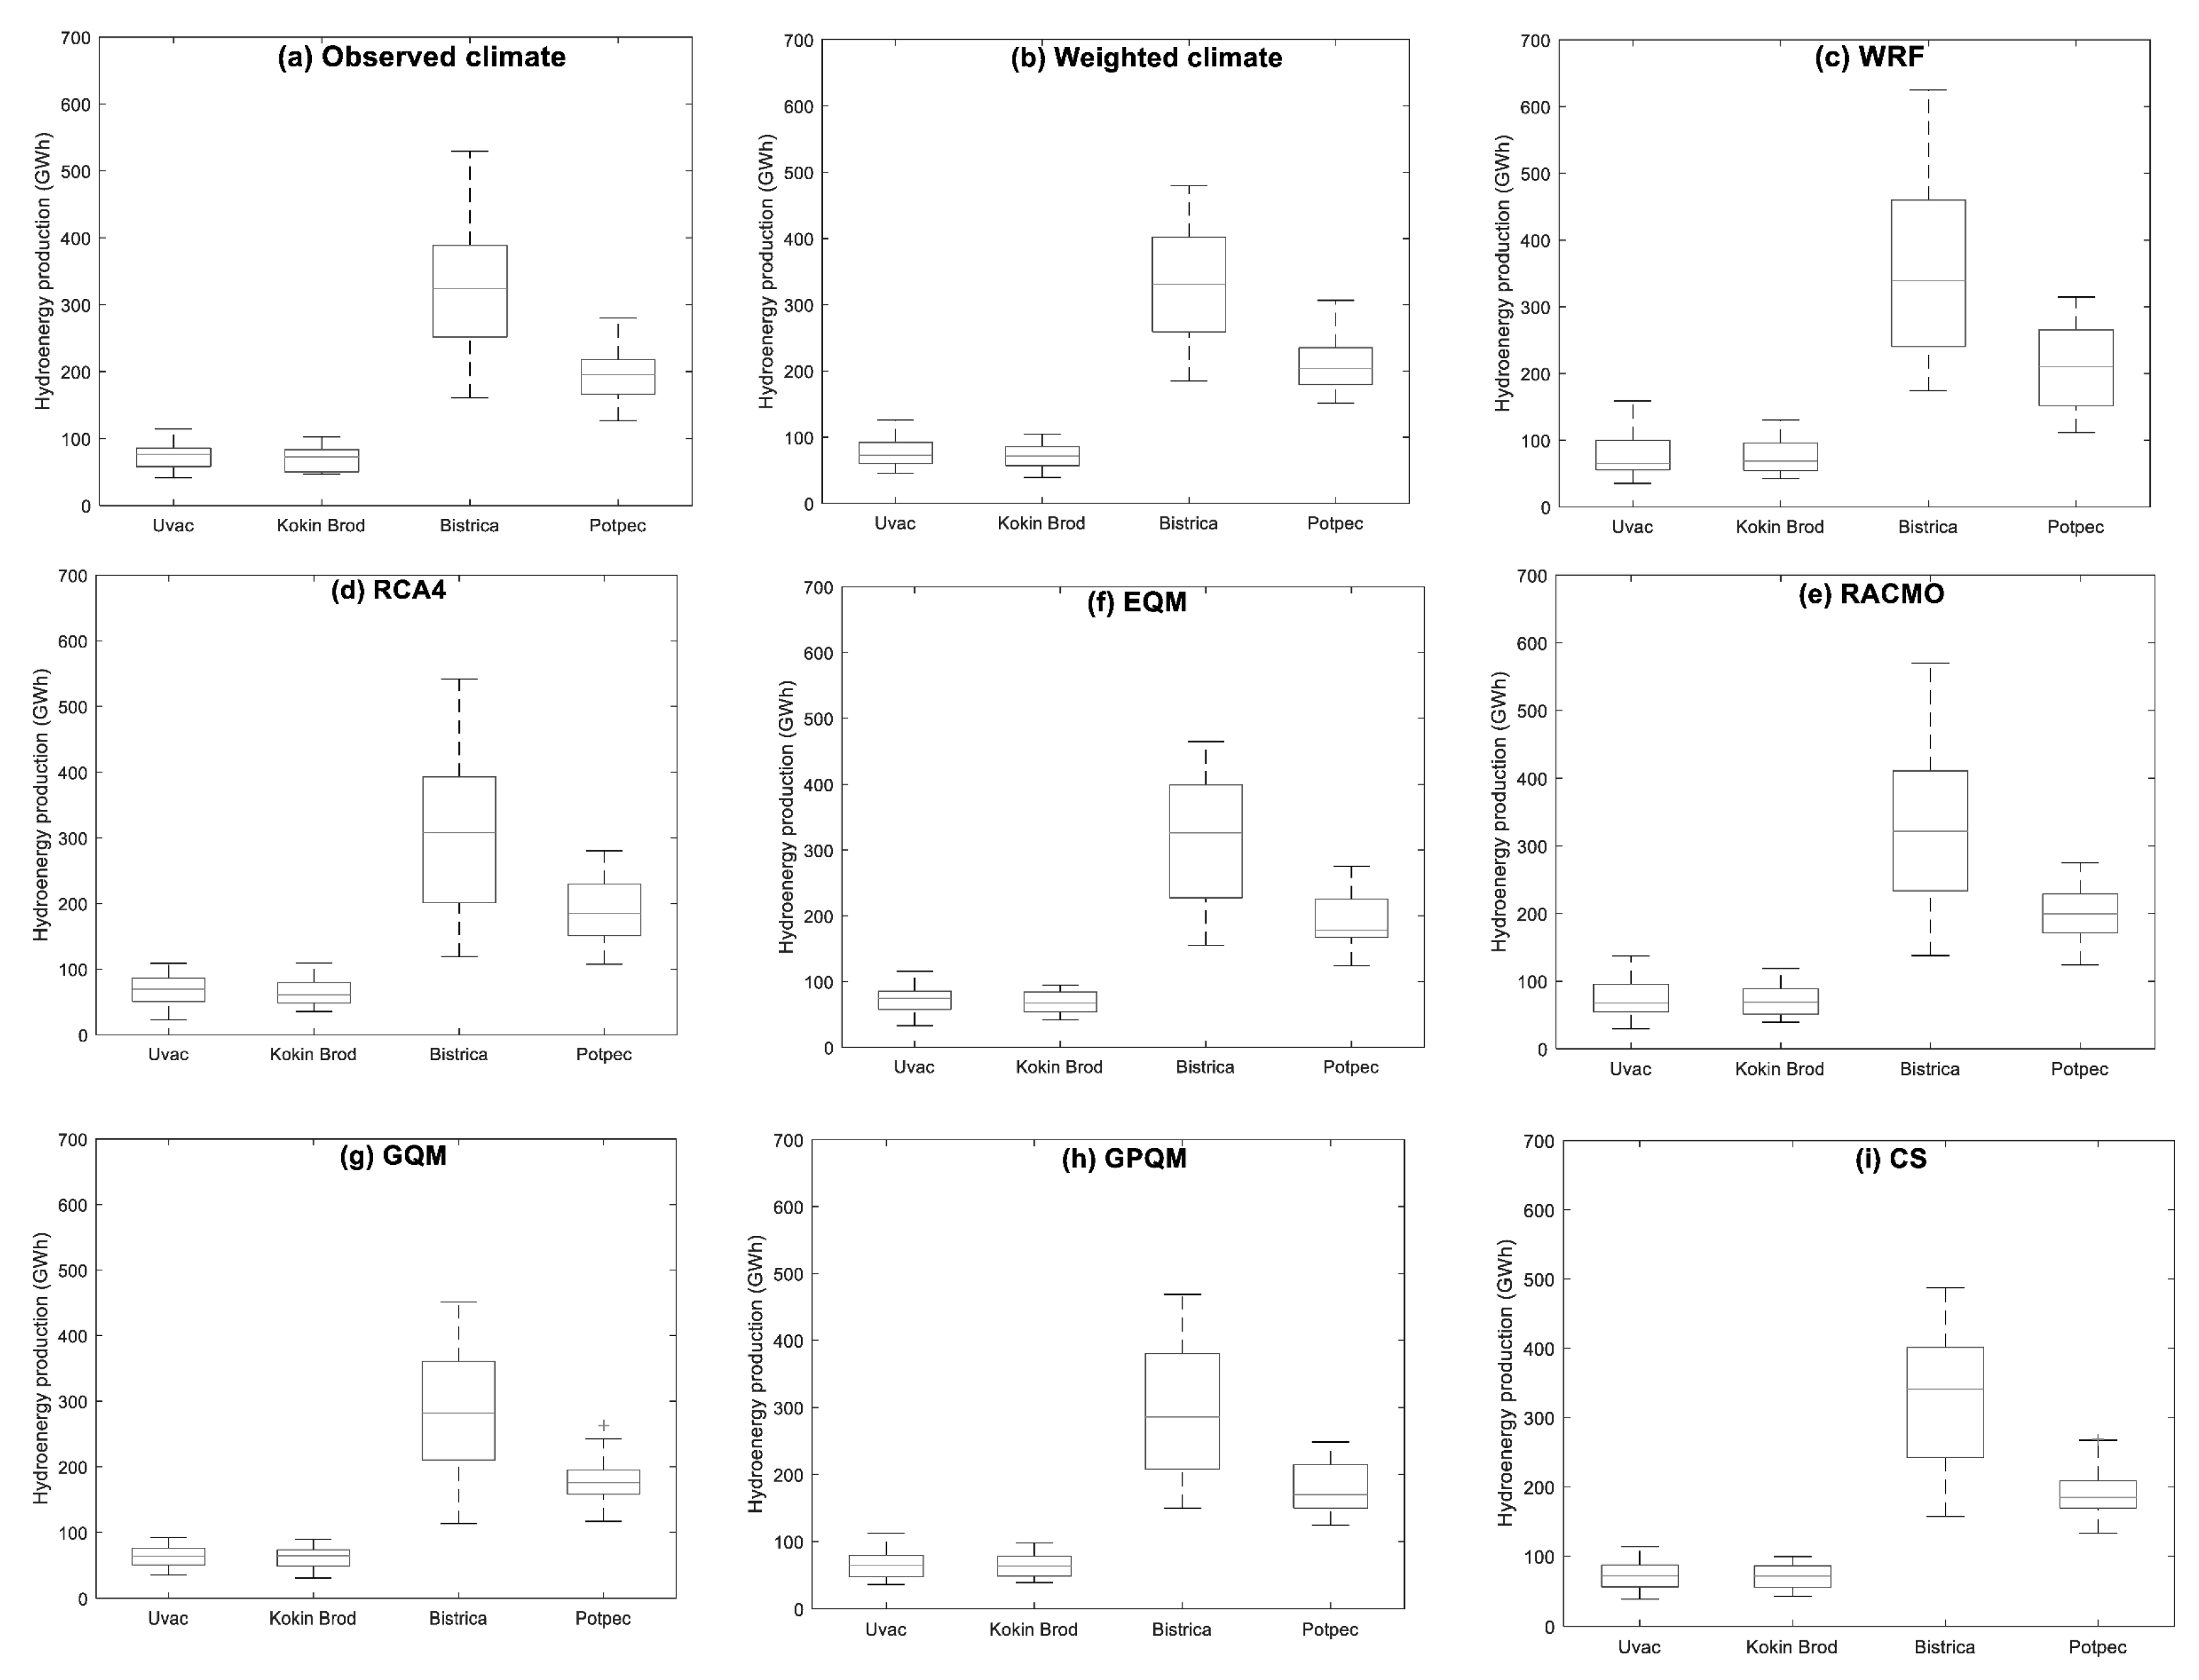
The SDSM structure of the Lim water system is verified over the referenced period. The SDSM simulation results are compared with the observed values of the inflows, outflows and hydropower generation from 1971 to 2000. Note that the simulated climate dataset considered seven realizations from three RCMs (WRF, RCA4, RACMO), and four BCMs (EQM, GQM, GPQM, CS) by applying the simple model averaging method (Section 4). In addition, the average ensemble value is estimated with the Bates-Granger averaging. In this manner, eight time series for each variable of the SDSM are determined for the reference period of 1971–2000. The simulated inflows and outflows from the system of reservoirs at the Lim and Uvac rivers are shown in Figure 5, while Figure 6 shows the hydropower generation for each powerplant within the system. The median values of inflows/outflows for each reservoir well match the observed values (Uvac—9.5 m3/s; Kokin Brod—13.5 m3/s; Radojnja—13.5 m3/s; Potpec—79.9 m3/s). The simulated medians of monthly inflows/outflows depend on the climate data analyzed. They are in the range of 8.2–10.4 m3/s, 11.7–15.0 m3/s, 11.8–15.4 m3/s and 74.3–91.3 m3/s for the Uvac, Kokin Brod, Radojnja and Potpec reservoirs, respectively. Similarly, the simulated annual hydropower generation for most HPPs reasonably fit the observed long-term values (Uvac—72 GWh, Kokin Brod—60 GWh, Bistrica—370 GWh, Potpec—216 GWh). This is highlighted for the Uvac and Kokin Brod power plants where the medians of the annual hydropower generation are equal to 63.9–76.2 GWh and 60.9–72.8 GWh, respectively. The annual hydropower generation for the Bistrica (281.6–340.6 GWh) and Potpec (170.8–210.5 GWh) powerplants are somewhat overestimated, perhaps due to uncertainty in the reservoir elevation–volume rating curves available for these reservoirs.
5.2. Future Projections
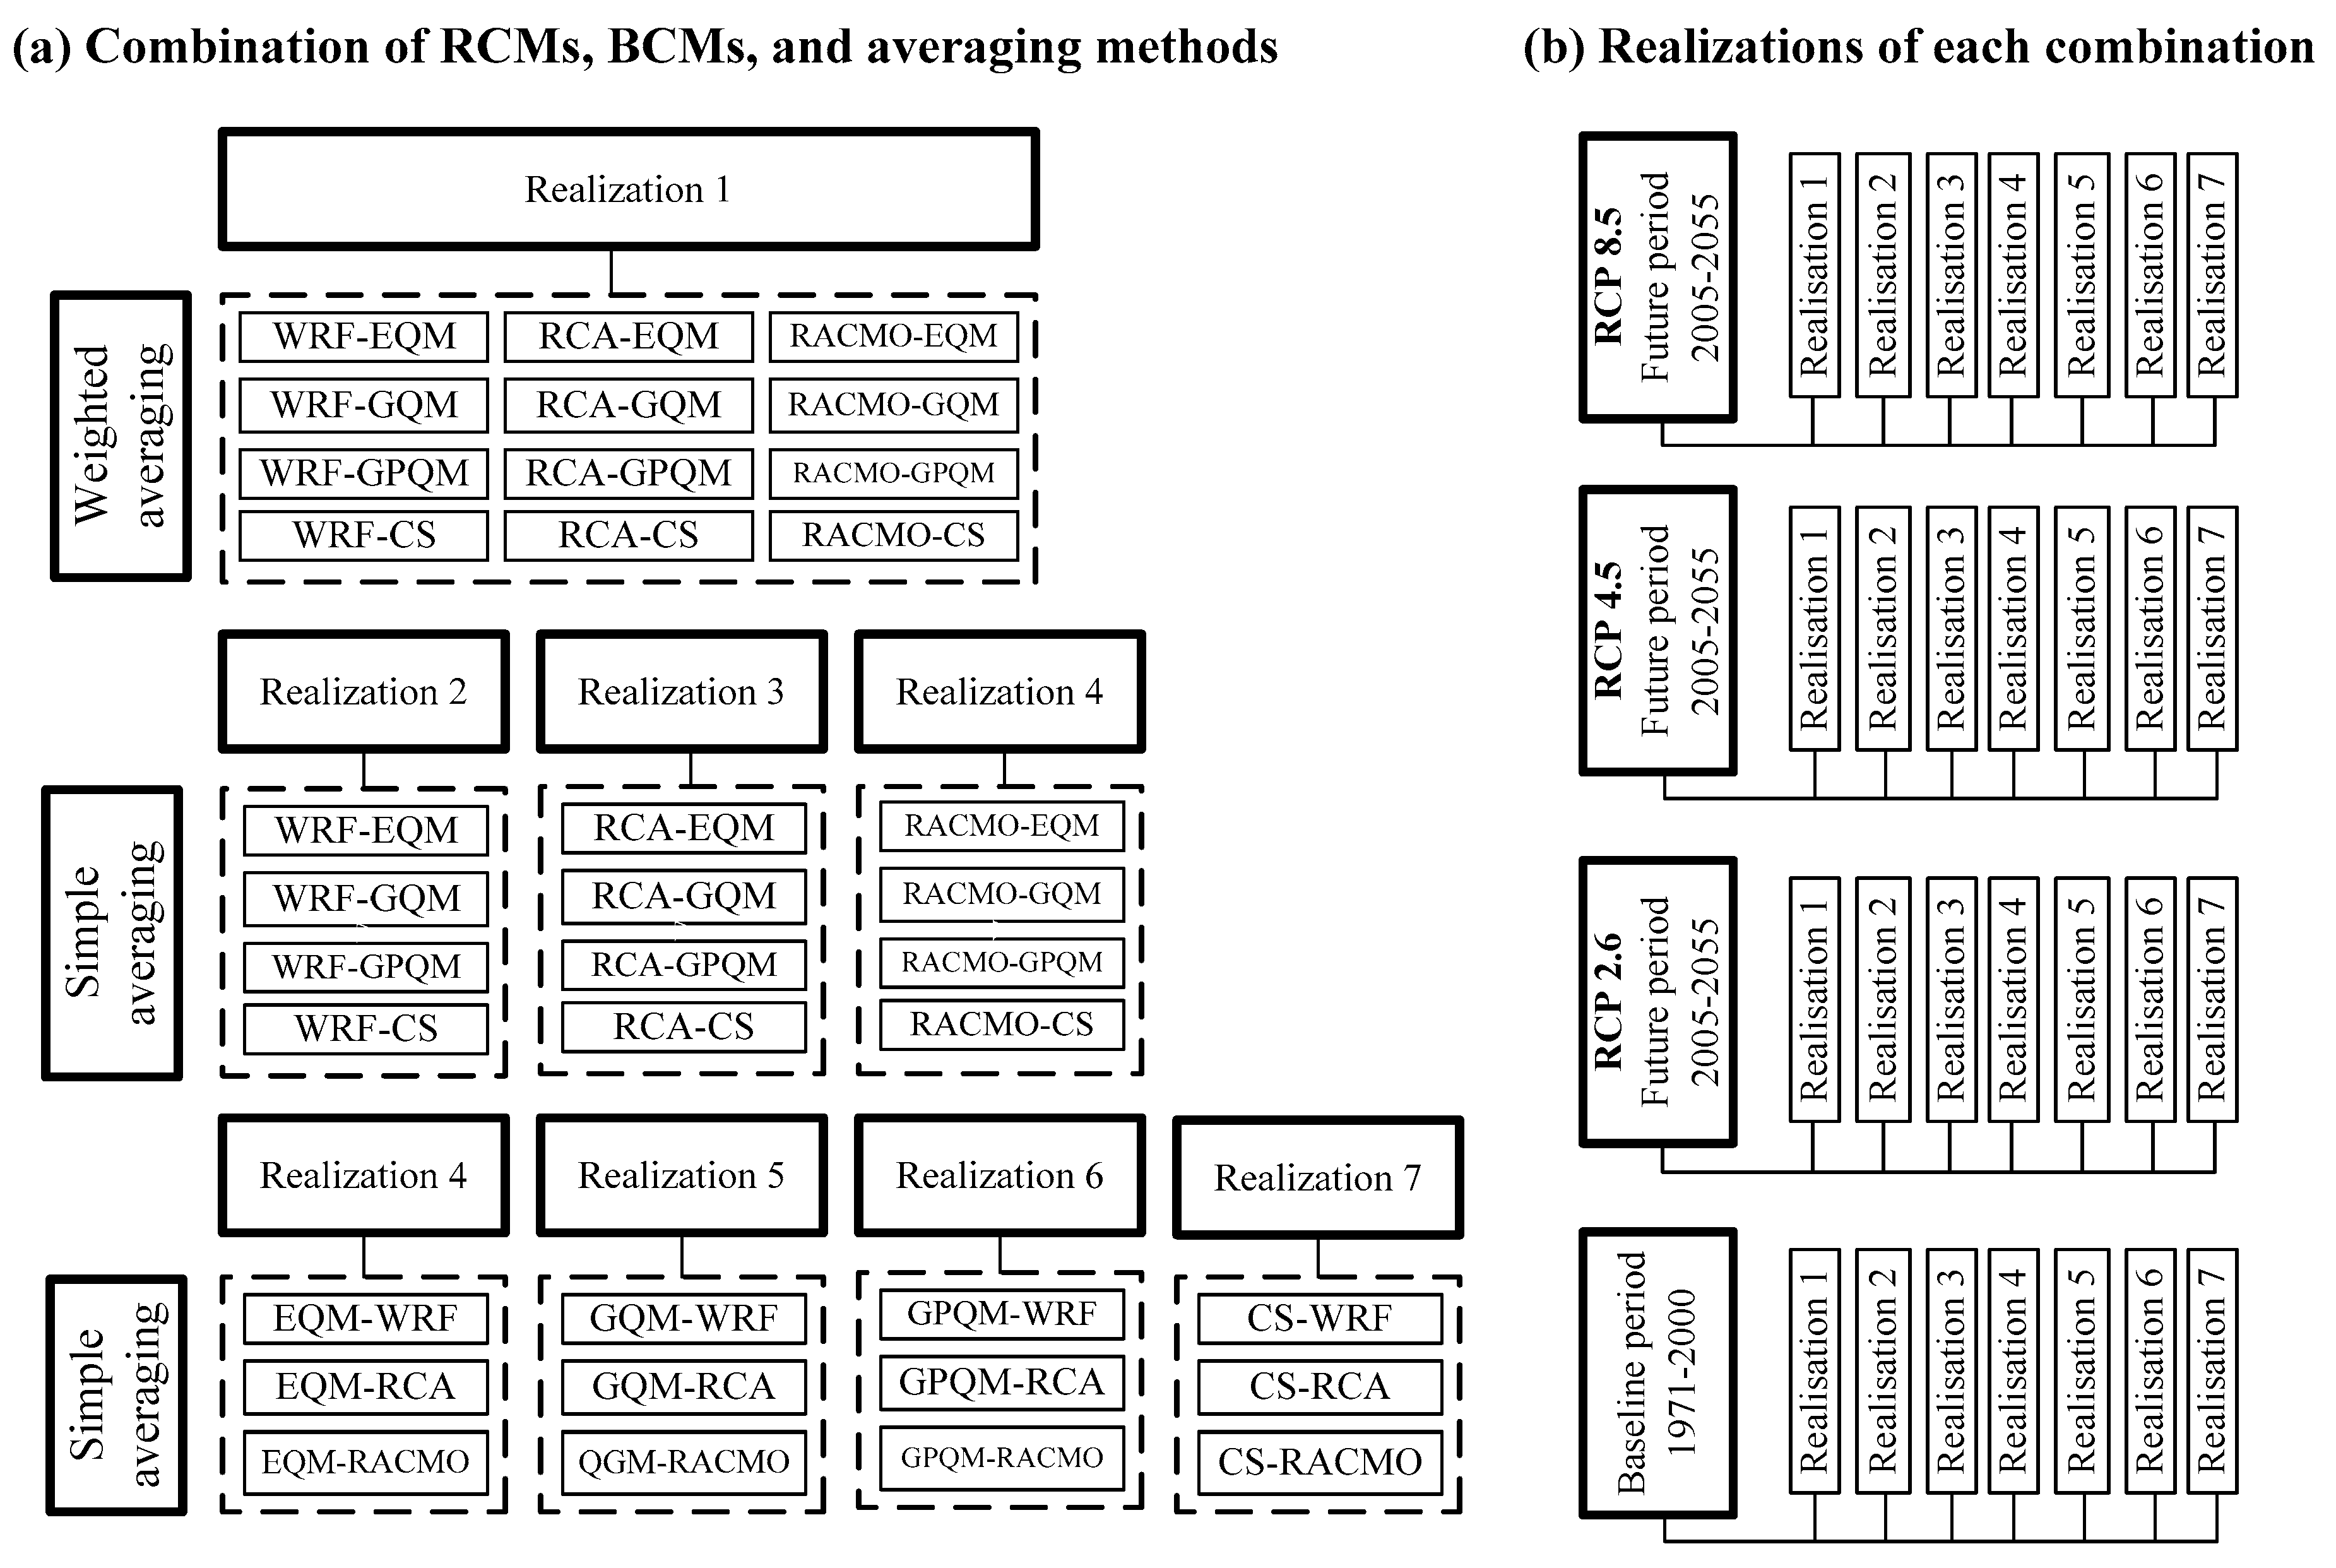
The verified SDSM model of the Lim water system is used to obtain the long-term prediction of system outflows and hydropower generation. The selected RCMs, BCMs and averaging procedures (Figure 2) are used to derive the precipitation and temperature for the Lim and Uvac river basins under RCP 2.6, RCP 4.5, RCP 8.5 concentration scenarios. The combinations of the different climate change modelling steps are shown in Figure 7a, while Figure 7b illustrates realisations of each climate dataset for the observed period of 1971–2000 and future period of 2006–2055 under the RCP options. Climate realisations under the aforementioned options cover the synchronous period with a length of 50 years. Therefore, the available climate outputs for the entire time period are used in the study since they provide more uncertain estimates of the future climate.
Based on the different climate data set realizations, the HEC-HMS is used to estimate inflows into the reservoir system for the future period of 2006–2055. The simulation model is then utilized to obtain 24 time series for each system variable under different concentration scenarios for the future period of 2006–2055. These time series include 21 realizations from each RCM/BCM combination and three realizations for the entire ensemble. The latter uses the weighted precipitation and corresponding hydrological response, derived from the Bates-Granger averaging, to obtain reservoir outflows and hydropower generation. This averaging method weights the selected RCMs and BCMs based on their hindcast accuracy. Therefore, the members of the ensemble that reproduce better climate drivers are heavily weighted providing the minimum possible uncertainty in the projected inflows used for system dynamics simulations.
The projected changes in annual inflows of the Uvac river reservoirs are in the range from −3.5% to 12.5%. In contrast, the Lim river shows less significant annual change in the inflows ranging from −5.9% to 4.9%. Variation in the hydrological inputs has an impact on the hydropower generation shown as relative change in the electricity production with respect to the reference period of 1971–2000 (Table 3). The expected changes in the annual hydropower generation are from −3.5% to +17.9% and from −2.7% to +7.9% for the Uvac and Lim reservoirs, respectively. The projected annual change in the outputs of the SDSM significantly depends on the concentration scenarios. The most severe option is RCP 8.5 with an annual decrease of the hydropower generation of −7.9%, while the RCP 4.5 scenarios shows an increase in the hydropower generation for the analyzed reservoirs (+9.6%). The annual decrease of the hydropower generation for the Uvac river reservoirs is equal to −2.3% under the RCP 2.6 scenario.
The impacts of climate change on the hydropower generation for the Lim water system are also analyzed by the study given in the literature [19]. This analysis encompasses the future period from 2011 to 2040 with regard to the reference period from 1961 to 1990. Two RCMs are used for further hydroenergetic analysis under RCP 4.5 and RCP 8.5 concentration scenarios, namely CCLM 4-8-19 and ALADIN 5.2 [19]. The study uses the traditional engineering approach based on the flow duration curve under climate change [20]. This approach allows the estimation of the percentage of corresponding turbines working time. The findings suggest that the changes in annual electricity production for the Lim river reservoirs are in the range from −6.3% to +9.4% [19]. In spite of the different modelling approach used in the study presented in this paper, the results show a significant agreement. For example, the estimated annual change in the electricity production for the Potpec reservoir is from −7.9% to +2.7% (Table 3).
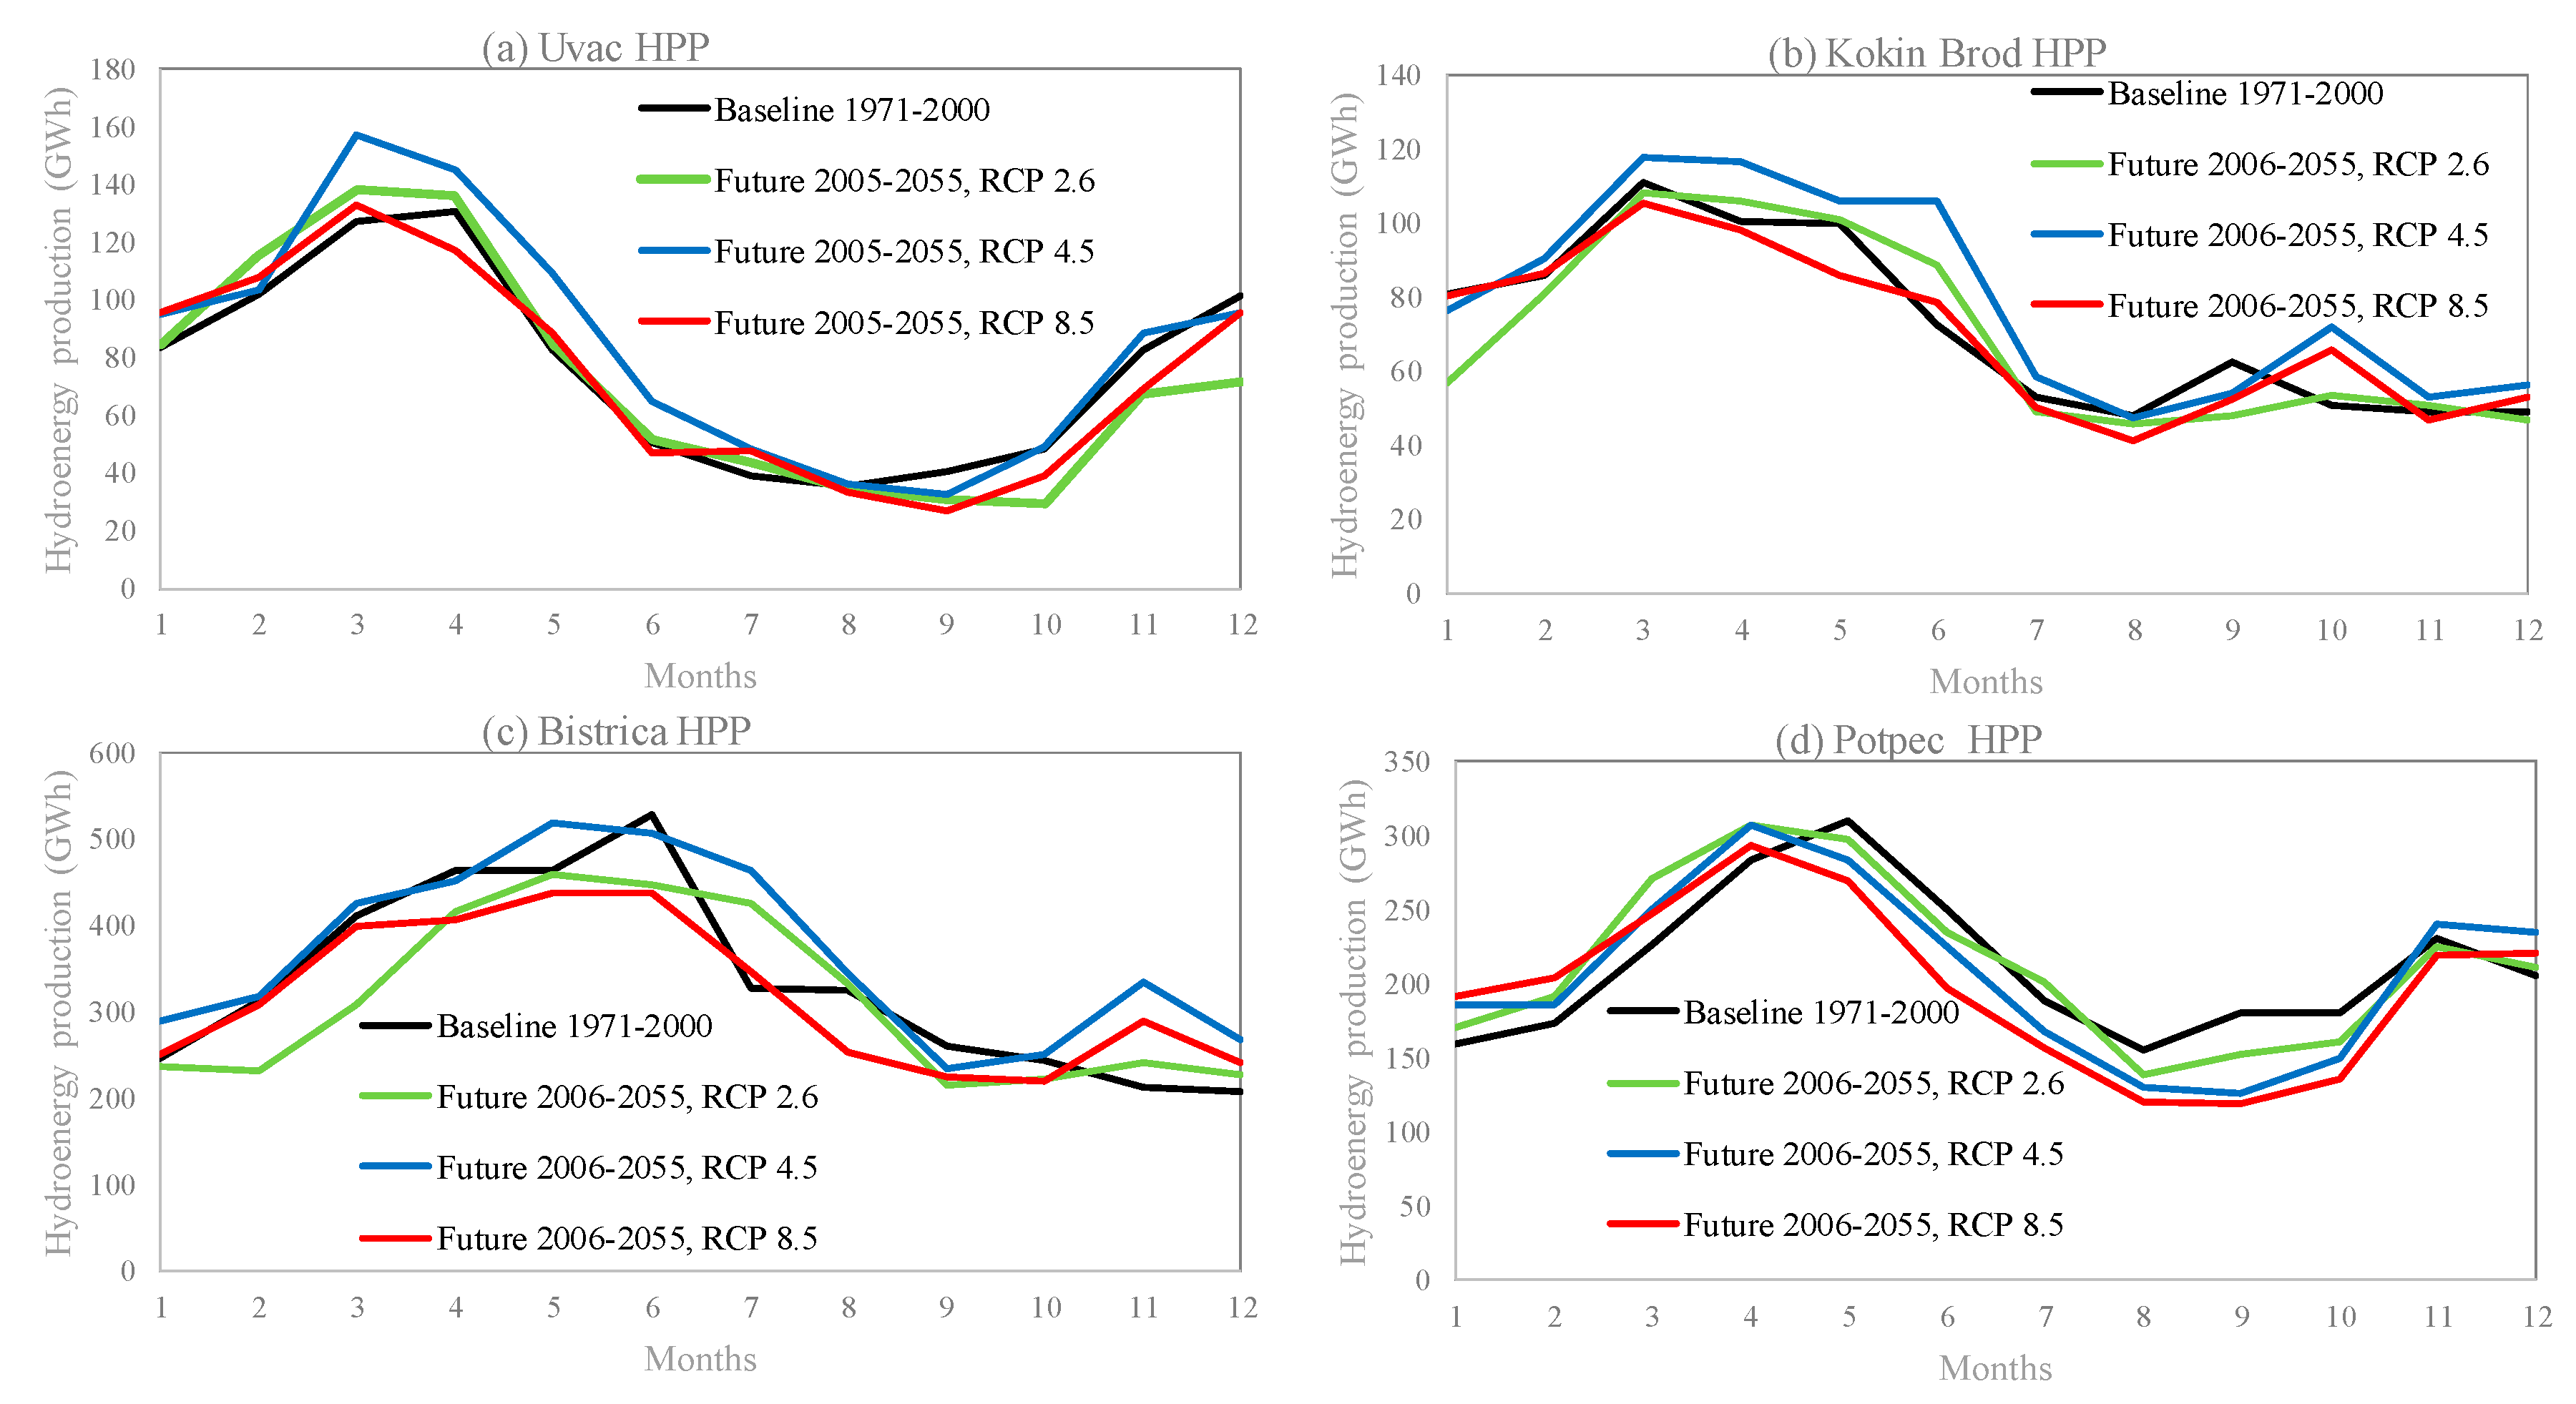
Since the seasonality adds an important variation in the hydropower generation, the traditional approach based on the flow duration curve is not capable of capturing the changes in the seasonal power generation [20]. Higher temperature over the year will modify the seasonality of the inflows available for the hydropower generation [38]. The natural climate variation is also an important factor which affects the variation in seasonal flows [39]. In this study, the system dynamics simulation approach is employed to assess the changes in the seasonal electricity generation which depends on the inflows available for power generation and demand for electricity in Serbia. In the SDSM the turbine flows are simulated as a time delay function of the inflows and random terms (Equation (3)) to ensure that the changes in the hydropower generation follow the seasonal variations of the inflows. Figure 8 shows the hydropower generation for both, the reference period of 1971–2000 and the future period of 2006–2055 under RCP 2.6, RCP 4.5, RCP 8.5 scenarios. The simulated values are estimated by the Bates–Granger averaging of the climate dataset (Section 4). The most prominent change in the seasonal hydropower generation pattern can be seen for the Uvac HPP (Figure 8a) and Potpec HPP (Figure 8d). These reservoirs receive unregulated inflows with the modified seasonal distribution due to the changing climate. Therefore, an increase in the hydropower generation within the winter months (January–March) ranging from +1.6% to +20.3% can be expected. A rapid decrease in monthly flows over the summer and autumn months brings about the lower level of electricity generation from August to September (from −2.8% to −33.6%). Large variations in the seasonal power generation are noted for the downstream HPPs at the Uvac river, Kokin Brod HPP and Bistrica HPP (Figure 8). These variations can be attributed to the dynamics of the multiple reservoir operations since the operations of the upstream reservoir (Uvac reservoir) has an effect on the downstream Kokin Brod and Radojnja reservoirs [3].
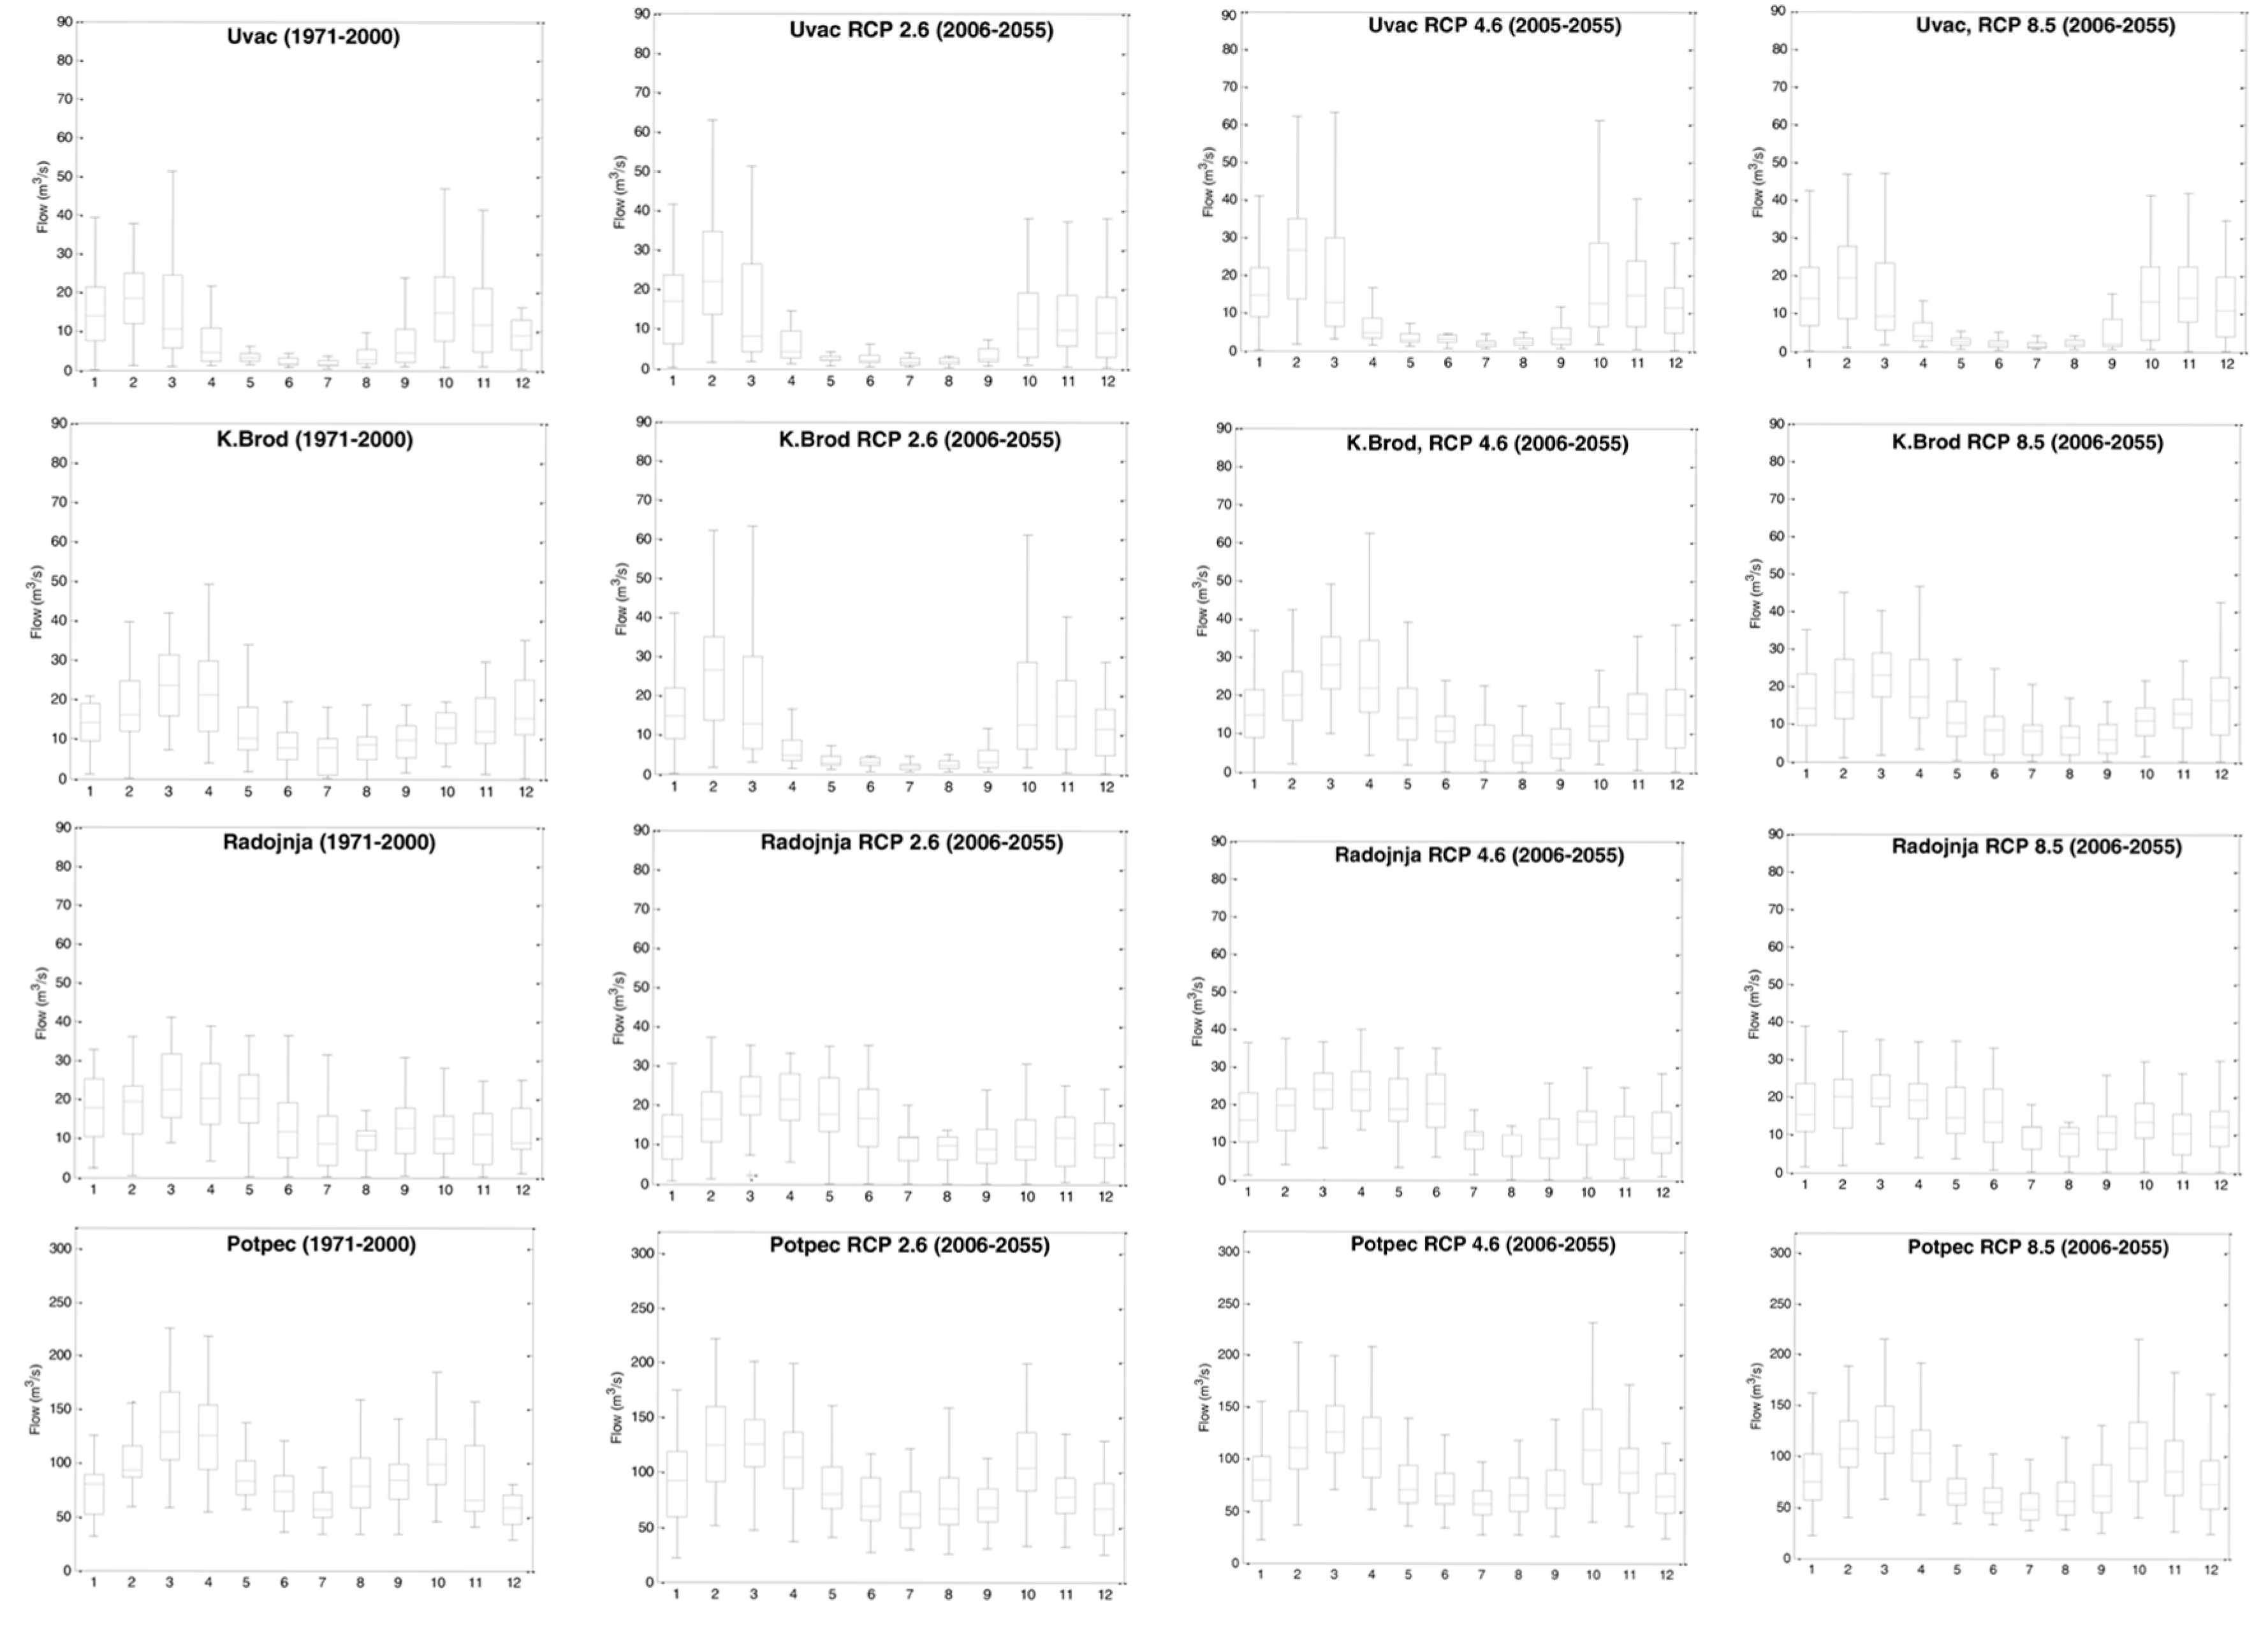
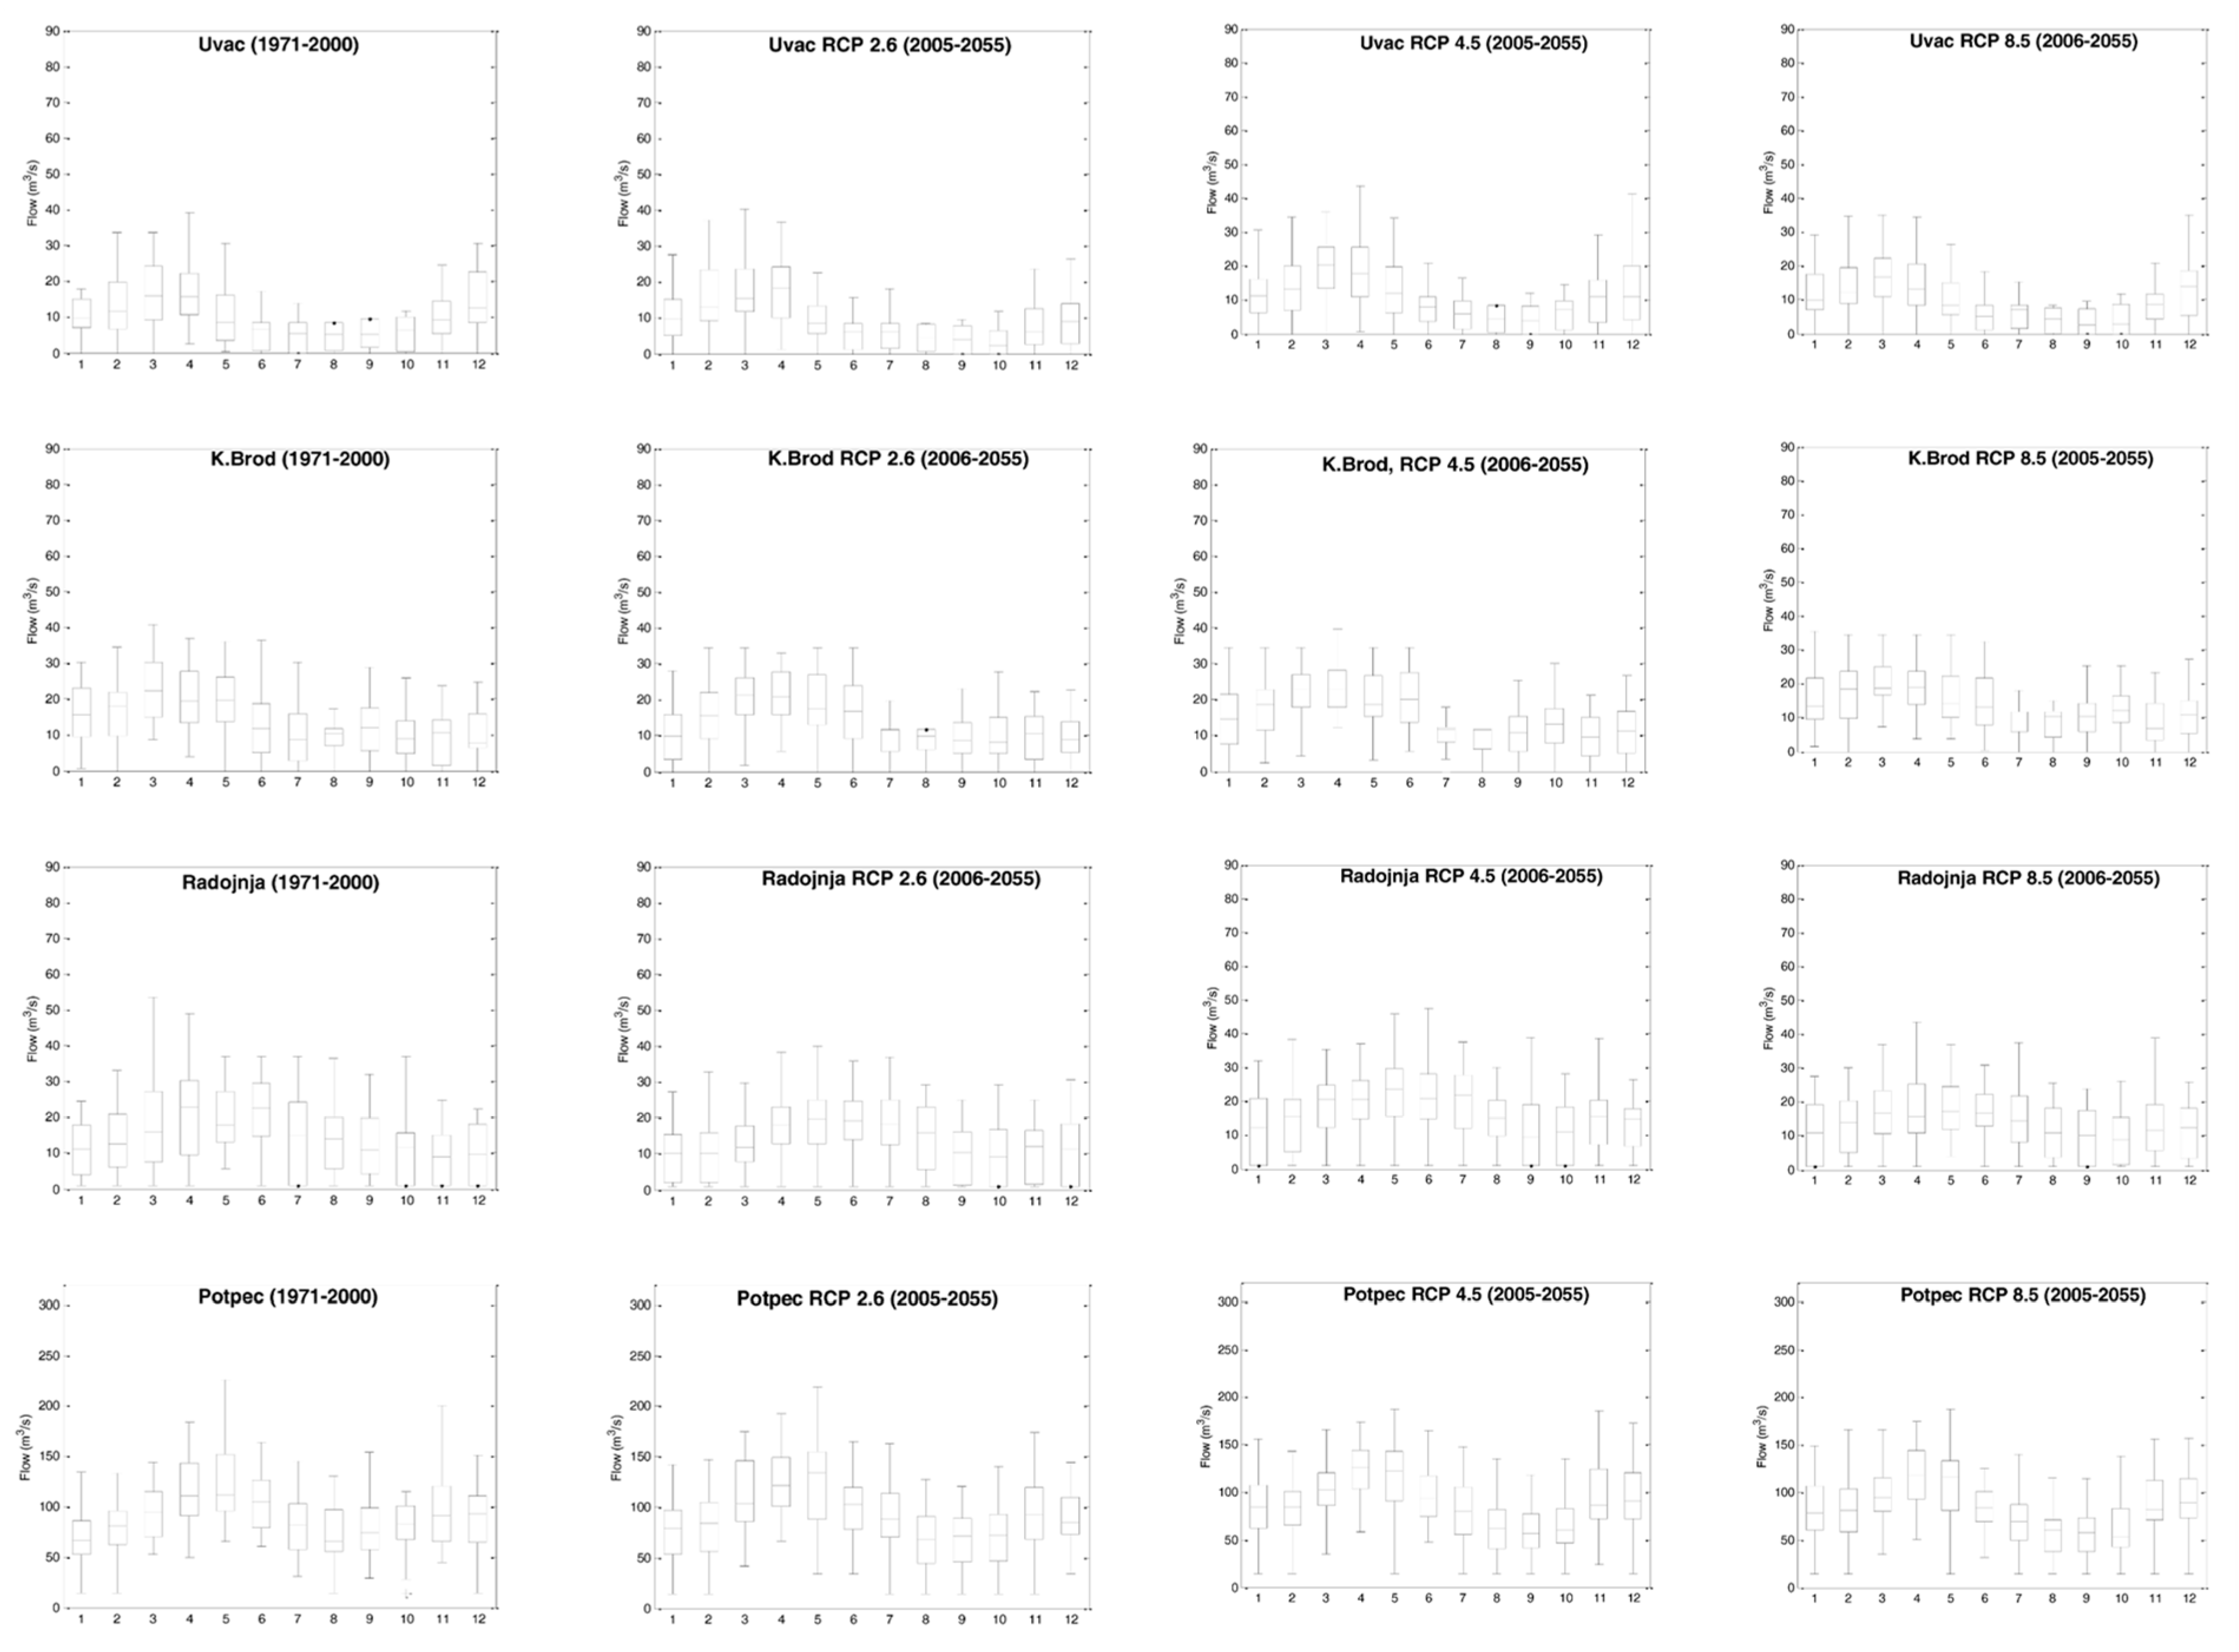
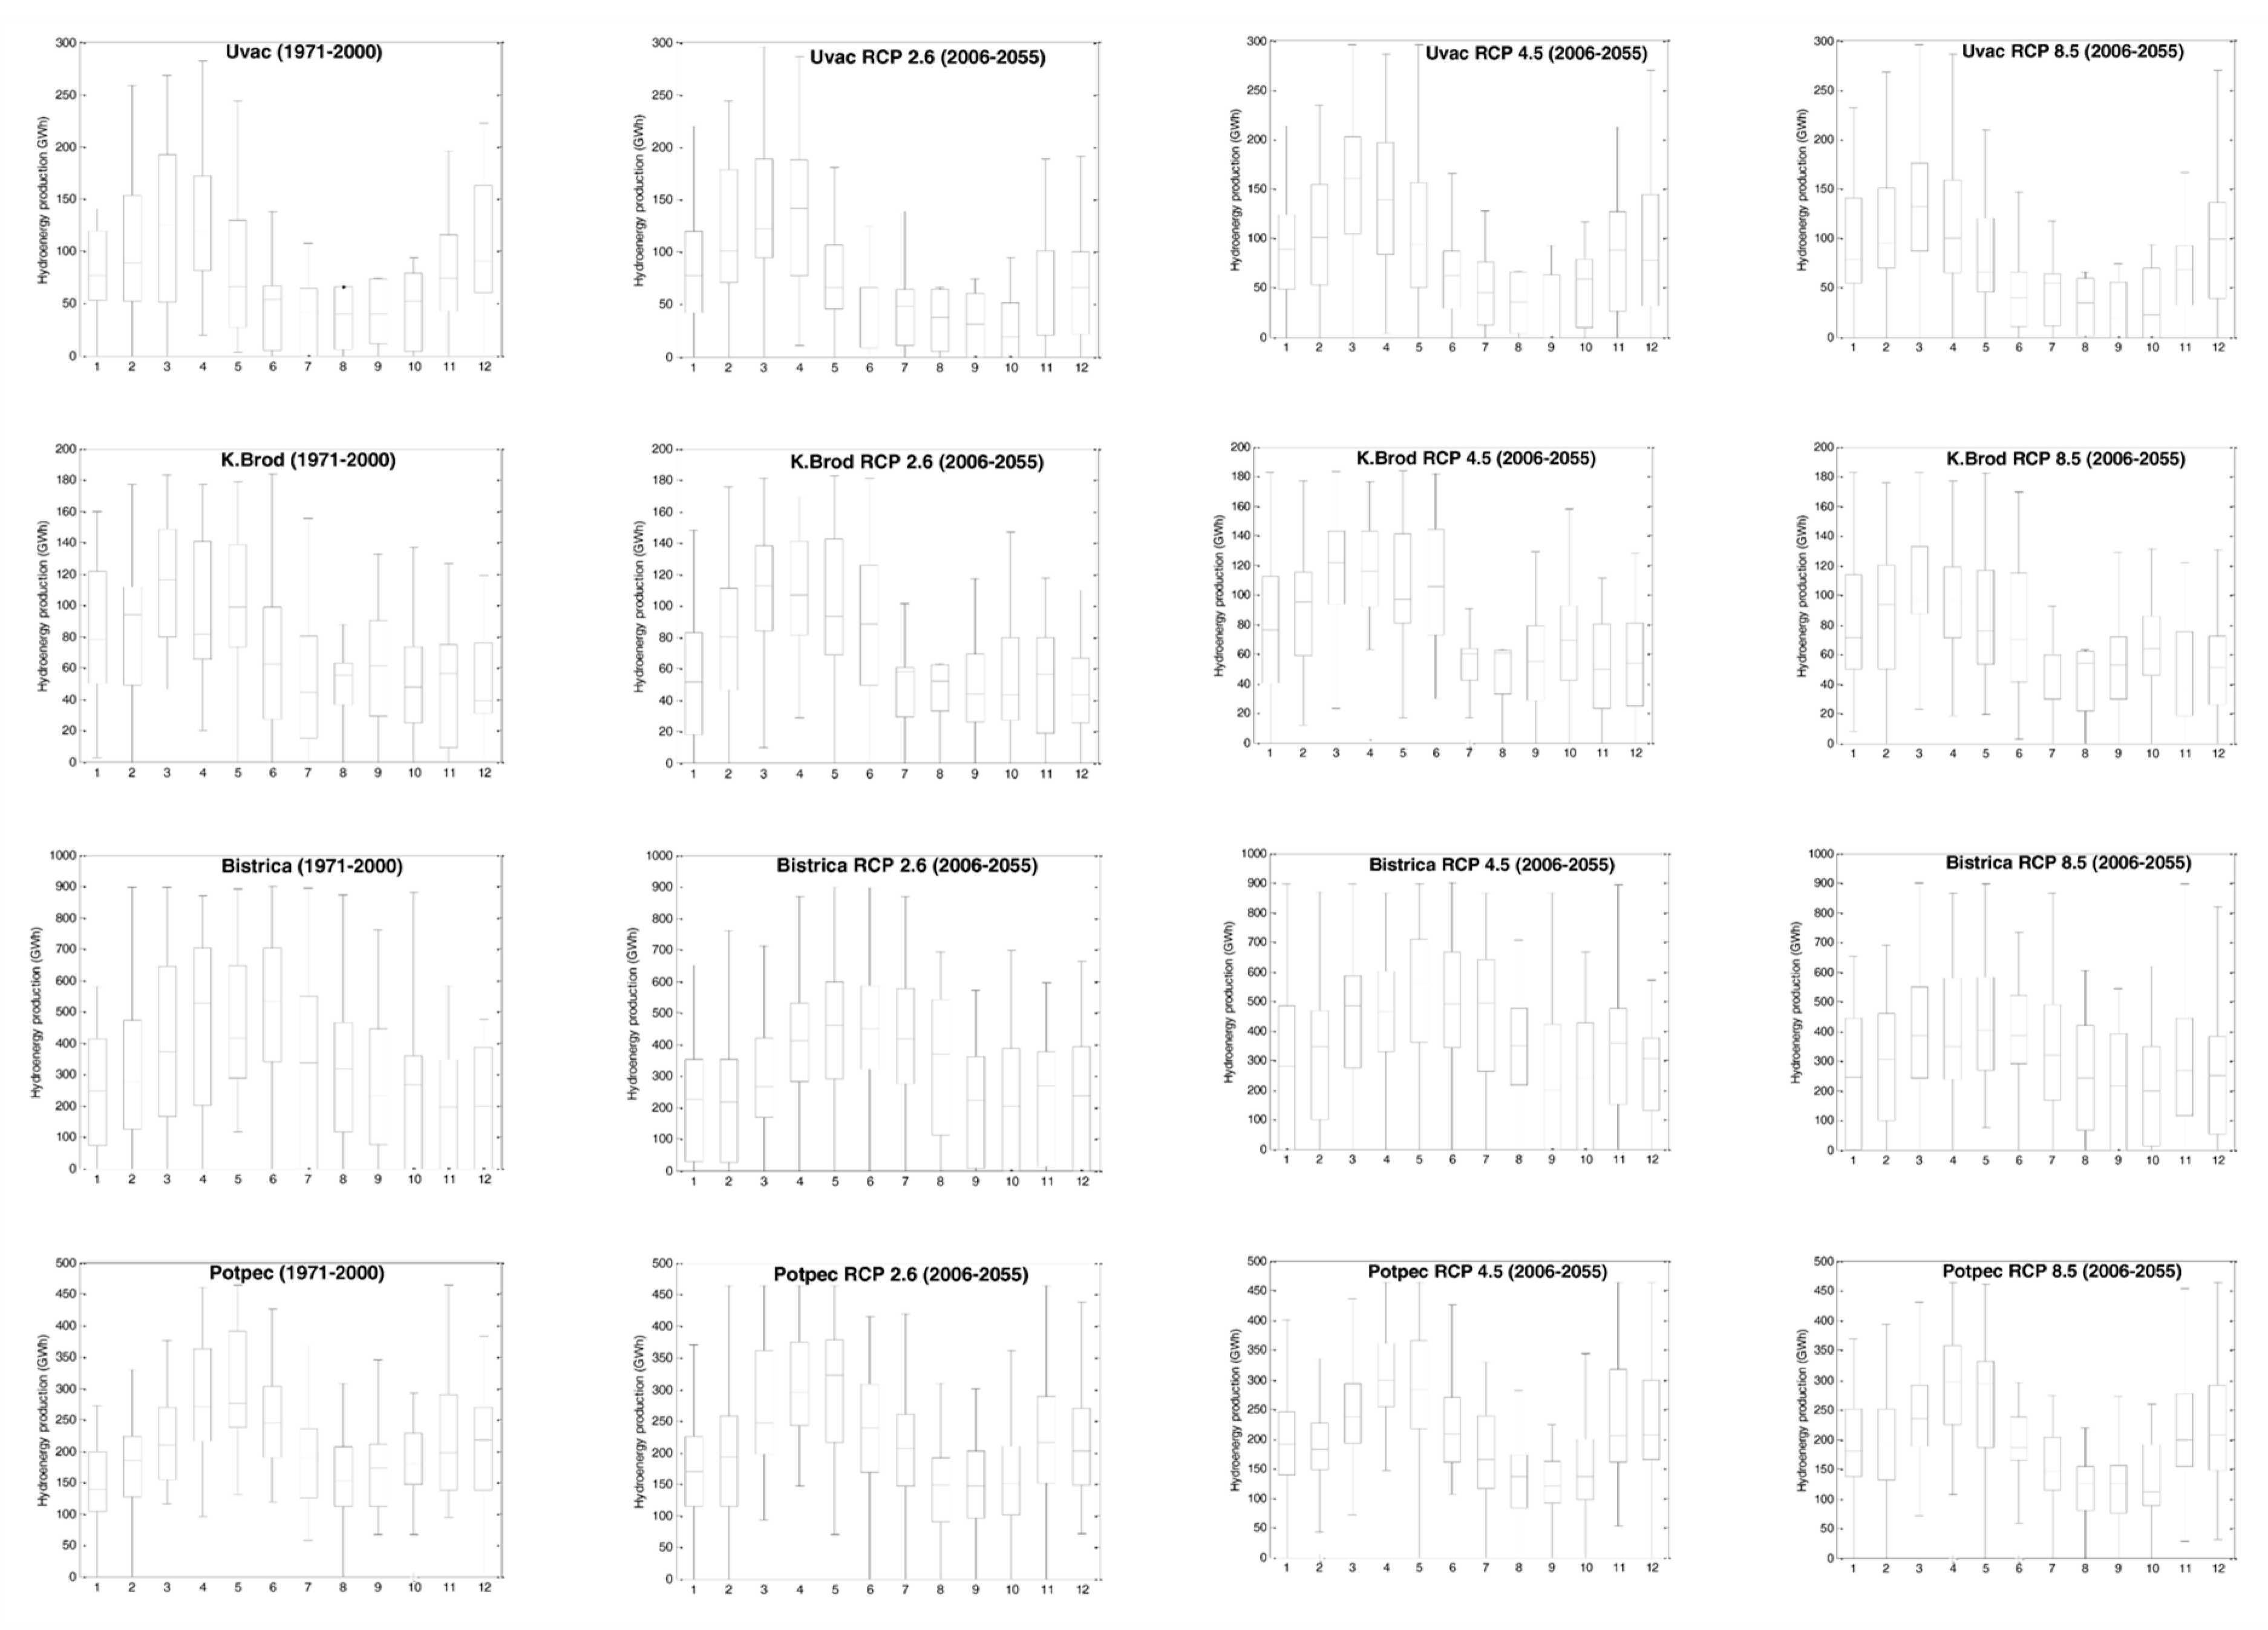
Monthly values in the hydropower generation are also used to analyze the impact of the the changing climate on the simulation outputs of SDSM. The box plots of monthly predicted inflows, outflows and hydropower generation for the reference period (1971–2000) and future period (2006–2055) are shown, respectively in Figure 9, Figure 10 and Figure 11. Based on the monthly values, the duration curves for each realization of SDSM are calculated to examine the changes in the lower and higher values of the monthly hydropower generation. A decrease in the lower values of the hydropower generation are between −9.8% and −5.6% for the RCP 2.6 and RCP 8.5 scenarios, respectively. However, an increase in the hydropower generation for the case of the RCP 4.5 scenario equal to 10% is observed. Higher values of the hydropower generation suggest an overall increase of 3% for the RCP 2.6 and RCP 8.5 scenarios, while the RCP 4.5 shows that the change in the hydropower generation is negligible.
5.3. Uncertainty Assessment
Sources of uncertainty within the climate change impact studies of the Lim water system have not yet been evaluated, mainly because of the oversimplified method used to assess the climate change impacts on the hydropower generation [19]. However, the unawareness of the uncertainty in the SDSM outputs may introduce high risk into the system planning and management activities.
This study employs the different climate change impact analysis process (Figure 2). It should be noted that some of the steps in the assessment process are limited to single modeling approaches. For instance, in this study only one hydrological model is used as well as only one system dynamics model. Therefore, the assessment of the uncertainties introduced by these approaches requires a model ensemble. Significantly more attention is devoted to the assessment of the uncertainty introduced by the selection of climate models, statistical post-processing tools and concentration scenarios. A spread of variance in the monthly time series of inflows, hydropower generation and outflows from the system of reservoirs are analyzed as a proxy measure to quantify the contribution of uncertainties introduced by the choice of RCMs, BCMs and CSs to the total uncertainty. The variance of each step is calculated by Equations(5)–(7). A higher spread of variance corresponds to a higher uncertainty in the process analyzed and vice versa. The entire ensemble is used to assess the spread of variance of the individual climate change impact analysis process steps. The Bates–Granger averaging estimates the weights of different process steps based on their ability to reproduce the variables within the reference period of 1971–2000. Subsequently, the estimated weights are applied for the future period of 2006–2055. The simple averaging of the SDSM outputs is performed by Equations (8)–(10). Finally, the application of Equations (12)–(14) provides the contribution of each step uncertainty (RCM, BCM, ES) to the total uncertainty in the SDSM outputs.
The inflows and outflows from the reservoirs of the Lim water system, as well as the hydropower generation of HPPs, are selected to quantify the contribution of different modelling steps to the total uncertainty. The results presented in Table 4 suggest that the largest source of uncertainty in the SDSM variables is contributed by the choice of BCMs followed by the contribution introduced by the choice of RCMs. The least significant source of uncertainty is obviously the choice of CSs. These findings agree with the results from the previous study done for Canada [8]. The results of the broader literature indicate that the climate models are the predominant source of uncertainty in the projection of monthly flows during most of the annual cycle, while the statistical post-processing methods are the most important source of uncertainty in the extreme flows [37].
The inflows and outflows from the Lim water system reservoirs shows a similar contribution of uncertainty arising from different modelling steps. Uncertainty introduced by BCMs is slightly higher (~49%) than uncertainty introduced by RCMs (~45%). It is clear that the lowest source of uncertainty is introduced by CSs, accounting only for 5%. However, the uncertainty contribution in the hydropower generation has a quite different distribution (Table 4). Note that the highest level of uncertainty is introduced by the choice of BCMs (~54%), followed by the choice of RCMs (about 41%) and emissions scenarios contributing only ~6%.
The different distribution between the contribution of uncertainty in the SDSM outputs can be attributed to their nature. Namely, the hydropower generation is calculated using Equation (4) accumulating the uncertainties from the inflows and reservoir water levels. It is, therefore, evident that multiplying the individual sources of uncertainty increases the uncertainty in the selection of BCMs. In contrast, the uncertainty in the hydropower generation introduced by the selection of RCMs is lower than the uncertainty in the inflows/outflows (~41%) and the uncertainty contribution from the choice of concentration scenarios (~5–6%). This finding suggests that the different RCMs and BCMs exhibit similar tendencies in each concentration scenario.
6. Conclusions
The study focuses on the development of the system dynamics simulation model of the complex water resources system alongside the operational rules under present and future climates. The main objective of the study is to estimate the climate change impacts on the performance of the Lim water system represented by the outputs of the simulation model using different climate change impact analysis process steps. In addition, the study assesses the uncertainty contribution of each process step to the total uncertainty of the system performance.
The Lim water system in Serbia (southeast Europe) is selected as a case study. This water system includes four hydraulically connected reservoirs at the Lim (Potpec reservoir) and Uvac rivers (Uvac, Kokin Brod, Radojnja reservoirs). The primary purpose of the Lim water system is the hydropower generation, followed by flood mitigation and downstream water quality management. Different climate drivers introduce variation in the inflows of the Lim water system resulting in different hydropower generations. Therefore, addressing the impacts of the changing climate on the Lim reservoir operations is of high importance for the region.
The study uses the following process steps to assess the climate change-related impacts: Three RCMs, four BCMs, three CSs, two averaging procedures, single hydrological model and one SDSM. The raw precipitation data from the RCMs under the RCP 2.6, RCP 4.5 and RCP 8.5 concentration scenarios are corrected using the multiple BCMs. Then, the simple and weighted averaging methods are applied to the precipitation datasets to quantify the contribution of process uncertainty to the total uncertainty in the system performance. Prior to the system dynamics modelling, the HEC-HMS hydrological model is applied to transform the climate data information into the hydrological response (flow). The SDSM is built using the Vensim system dynamics simulation software and uses the inflows derived by the HEC-HMS hydrological model. The system dynamics simulation model of the Lim water system is developed in a holistic manner to evaluate the climate-related impacts on the system outflows and hydropower generation. For the reservoirs with multi-annual and seasonal flow regulation (Uvac and Kokin Brod reservoirs), the reservoir operations are developed using the yield model solved by the sequent peak method. Reservoirs with daily regulation (Potpec and Radojnja reservoirs) use the standard operational policy. Note that the proposed operational rules can be adjusted in accordance with the changes in the seasonal flow distribution.
The projected changes in the hydropower generation of the Lim water system depend on the inflows into the reservoirs and their available water volume. The findings suggest that the change in annual power production can be expected in the range from −3.5% to +17.9%. More severe change is expected at the seasonal level with the decrease in annual production ranging from −2.8% to −33.6% for the summer and autumn seasons. A rapid increase in power production is reported for the winter months, from +1.6% to +20.3%. The study also provides the quantification of the uncertainty contribution for each process step using the variance method. The most dominant source of uncertainty in the hydropower generation is introduced by the choice of BCMs (53.5%) followed by the choice of RCMs (40.6%). The least contribution of uncertainty comes from the choice of CSs (5.9%). However, the contributions of uncertainty of different process steps to the uncertainty in the inflows into and outflows from the Lim system reservoirs have different distributions. The choice of BCM and RCM contribute to 45.7–44.7% and 49.0–49.2%, respectively. The ES contributes the least to the uncertainty in the predicted inflows/outflows (5.0–6.3%). In contrast to the inflows or outflows, the hydropower generation accumulates the uncertainties in the inflows and reservoir water levels, resulting in the different distribution of uncertainty contributions.
The findings point out the importance of analyzing the operation of the Lim system reservoirs under changing climate conditions to support a more efficient decision-making. Future research should concentrate on investigating additional sources of uncertainty, particularly those stemming from the reservoir operation and hydrological model structure. That will require the use of multiple operational rules obtained by different reservoir operations modelling approaches [33] and the use of different hydrological models [40,41].
Author Contributions
M.S. and S.P.S. designed the research framework; M.S. conducted simulations and wrote the paper; S.P.S. supervised the paper.
Funding
This research was funded by the Natural Sciences and Engineering Research Council of Canada and Chaucer Syndicates Ltd.
Acknowledgments
We acknowledge the financial support provided to the second author by the Natural Sciences and Engineering Research Council of Canada and Chaucer Syndicates Ltd.
Conflicts of Interest
The authors declare no conflict of interest.
References
- Simonovic, S.P. Managing Water Resources: Methods and Tools for a Systems Approach; UNSECO Publishing: Paris, France; Earthscan James & James: London, UK, 2009. [Google Scholar]
- Oni, S.K.; Dillon, P.J.; Metcalfe, R.A.; Futter, N.N. Dynamic Modelling of the Impact of Climate Change and Power Flow Management Options using STELLA: Application to the Steephill Falls Reservoir, Ontario, Canada. Can. Water Resour. J. 2012, 37, 125–148. [Google Scholar] [CrossRef] [Green Version]
- Teegavarapu, R.; Simonovic, S.P. Object Oriented Simulation of Multiple Hydropower Reservoir Operations using System Dynamics Approach. Water Resour. Manag. 2014, 28, 1937–1958. [Google Scholar] [CrossRef]
- Hollermann, B.; Evers, M. Coping with uncertainty in water management: Qualitative system analysis as a vehicle to visualize the plurality of practitioners’ uncertainty handling routines. J. Environ. Manag. 2019, 235, 213–223. [Google Scholar] [CrossRef] [PubMed]
- EEA Climate Impacts on Water Resources; European Environment Agency: Copenhagen, Denmark, 2017.
- Ehsani, N.; Vorosmarty, C.J.; Fekete, B.M.; Stakhiv, E.Z. Reservoir operations under climate change: Storage capacity options to mitigate risk. J. Hydrol. 2017, 555, 435–446. [Google Scholar] [CrossRef]
- International Commission for the Protection of the Danube River (ICPDR). Danube Study—Climate Change Adaptation, Final Report; International Commission for the Protection of the Danube River: Vienna, Austria, 2012. [Google Scholar]
- Mandal, S.; Arunkumar, R.; Breach, P.A.; Simonovic, S.P. Reservoir Operations under Changing Climate Conditions: Hydropower-Production Perspective. J. Water Resour. Plan. Manag. 2019, 145, 04019016. [Google Scholar] [CrossRef]
- Arsenault, R.; Brissette, F.; Malo, J.S.; Minville, M.; Leconte, R. Structural and Non-Structural Climate Change Adaptation Strategies for the Péribonka Water Resource System. Water Resour. Manag. 2013, 27, 2075–2087. [Google Scholar] [CrossRef]
- Haguma, D.; Leconte, R.; Côté, P.; Krau, S.; Brissette, F. Optimal Hydropower Generation Under Climate Change Conditions for a Northern Water Resources System. Water Resour. Manag. 2017, 28, 4631–4644. [Google Scholar] [CrossRef]
- Ahmadi, M.; Haddad, O.B.; Loáiciga, H.A. Adaptive Reservoir Operation Rules Under Climatic Change. Water Resour. Manag. 2015, 29, 1247–1266. [Google Scholar] [CrossRef]
- Burn, H.D.; Simonovic, S.P. Sensitivity Of Reservoir Operation Performance To Climatic Change. Water Resour. Manag. 1996, 6, 463–478. [Google Scholar] [CrossRef]
- Mandal, S. Uncertainty Modeling in The Assessment of Climate Change Impacts on Water Resources Management. Ph.D. Thesis, University of Western Ontario, London, ON, Canada, 2017. [Google Scholar]
- Goharian, E.; Zahmatkesh, Z.; Sandoval-Solis, S. Uncertainty Propagation of Hydrologic Modeling in Water Supply System Performance: Application of Markov Chain Monte Carlo Method. J. Hydrol. Eng. 2018, 23, 04018013. [Google Scholar] [CrossRef]
- Gaur, A.; Simonovic, S.P. Towards Reducing Climate Change Impact Assessment Process Uncertainty. Environ. Process. J. 2015, 2, 275–290. [Google Scholar] [CrossRef] [Green Version]
- Poulin, A.; Brissette, F.; Leconte, R.; Arsenault, R.; Malo, J.S. Uncertainty of hydrological modelling in climate change impact studies in a Canadian, snow-dominated river basin. J. Hydrol. 2011, 409, 626–636. [Google Scholar] [CrossRef]
- Das, J.; Treesa, A.; Umamahesh, N. Modelling Impacts of Climate Change on a River Basin: Analysis of Uncertainty Using REA & Possibilistic Approach. Water Resour. Manag. 2018, 32, 4833–4852. [Google Scholar]
- Joseph, J.; Ghosh, S.; Pathak, A.; Sahai, A.K. Hydrologic impacts of climate change: Comparisons between hydrological parameter uncertainty and climate model uncertainty. J. Hydrol. 2018, 566, 1–12. [Google Scholar] [CrossRef]
- Support to Water Resources Management in the Drina River Basin; World Bank: Washington, DC, USA, 2019. Available online: http://www.wb-drinaproject.com/index.php/en/ (accessed on 4 August 2019).
- Reichl, F.; Hack, J. Derivation of Flow Duration Curves to Estimate Hydropower Generation Potential in Data-Scarce Regions Data-Scarce Regions. Water 2017, 9, 572. [Google Scholar] [CrossRef]
- Institute for the Development of Water Resources Jaroslav Cerni. Water Resource Management Plan of Montenegro WRMPM; Institute for the Development of Water Resources Jaroslav Cerni: Belgrade, Serbia, 2001. [Google Scholar]
- Institute for the Development of Water Resources Jaroslav Cerni. Water Resource Management Plan of Serbia WRMPS; Institute for the Development of Water Resources Jaroslav Cerni: Belgrade, Serbia, 2010. [Google Scholar]
- Jacob, D.; Petersen, J.; Eggert, B.; Alias, A.; Christensen, O.B.; Bouwer, L.M.; Braun, A.; Colette, A.; Déqué, M.; Georgievski, G.; et al. EURO-CORDEX: New high-resolution climate change projections for European impact research. Reg. Environ. Chang. 2014, 14, 563–578. [Google Scholar] [CrossRef]
- Teutschbeina, C.; Seibert, J. Bias correction of regional climate model simulations for hydrological climate-change impact studies: Review and evaluation of different methods. J. Hydrol. 2012, 456, 12–29. [Google Scholar] [CrossRef]
- Piani, C.; Haerter, J.O.; Coppola, E. Statistical bias correction for daily precipitation in regional climate models over Europe. Theor. Appl. Climatol. 2010, 99, 187–192. [Google Scholar] [CrossRef]
- Cannon, A.J.; Sobie, S.R.; Murdock, T.Q. Bias Correction of GCM Precipitation by Quantile Mapping: How Well Do Methods Preserve Changes in Quantiles and Extremes? J. Clim. 2015, 28, 6938–6959. [Google Scholar] [CrossRef]
- Mani, A.; Tsai, F.T.C. Ensemble Averaging Methods for Quantifying Uncertainty Sources in Modeling Climate Change Impact on Runoff Projection. J. Hydrol. Eng. 2016, 22, 04016067. [Google Scholar] [CrossRef]
- Bates, J.M.; Granger, C.W.J. The combination of forecasts. Oper. Res. Q. 1969, 20, 451–468. [Google Scholar] [CrossRef]
- Scharffenberg, W. Hydrological Modelling System; HEC-HMS: US Army Corps of Engineers, Institute for Water Resources, Hydrologic Engineering Centre: Davis, CA, USA, 2016. [Google Scholar]
- Azmat, M.; Qamar, M.U.; Huggel, C.; Hussain, E. Future climate and cryosphere impacts on the hydrology of a scarcely gauged catchment on the Jhelum river basin, Northern Pakistan. Sci. Total Environ. 2018, 639, 961–976. [Google Scholar] [CrossRef] [PubMed]
- Annex 1. Development of the Hydrologic Model for the Sava River Basin. In Water Climate and Adaptation Plan for the Sava River Basin; Final Report; World Bank: Washington, DC, USA, 2015; Available online: http://documents.worldbank.org/curated/en/111101468188370674/Annex-one-development-of-the-hydrologic-model-for-the-Sava-river-basin (accessed on 4 August 2019).
- Vensim Reference Manual Version: 7.3; VENTANA System Inc.: Tucson, AZ, USA. Available online: https://vensim.com/docs/ (accessed on 9 July 2019).
- Loucks, D.P.; Beek, E. Water Resources Systems Planning and Management: An Introduction to Methods, Models and Applications; Deltares and UNESCO-IHE: Delft, The Netherlands, 2017. [Google Scholar]
- Brouwer, C.; Heibloem, M. Irrigation Water Management: Irrigation Water Needs; The International Institute for Land Reclamation and Improvement: Rome, Italy, 1986. [Google Scholar]
- Wilby, R.L.; Harris, I. A framework for assessing uncertainties in climate change impacts: Low-flow scenarios for the River Thames, U.K. Water Resour. Res. 2006, 42. [Google Scholar] [CrossRef]
- Bastola, S.; Murphy, C.; Fealy, R. Generating probabilistic estimates of hydrological response for Irish catchments using a weather generator and probabilistic climate change scenarios. Hydrol. Process. 2012, 26, 2307–2321. [Google Scholar] [CrossRef]
- Yuan, F.; Chun, K.P.; Sapriza-Azuri, G.; Bruen, M.; Wheater, H.S. Assessing the relative importance of parameter and forcing uncertainty and their interactions in conceptual hydrological model simulations. J. Hydrol. 2017, 554, 434–450. [Google Scholar] [CrossRef]
- Ranzani, A.; Bonato, M.; Patro, E.R.; Gaudard, L.; Michele, C.D. Hydropower Future: Between Climate Change, Renewable Deployment, Carbon and Fuel Prices. Water 2017, 10, 1197. [Google Scholar] [CrossRef]
- Chai, Y.; Li, Y.T.; Yang, Y.P.; Zhu, B.Y.; Li, S.X.; Xu, C.; Liu, C.C. Influence of Climate Variability and Reservoir Operation on Streamflow in the Yangtze River. Sci. Rep. 2019, 9, 5060. [Google Scholar] [CrossRef]
- Markstrom, S.L.; Regan, R.S.; Hay, L.E.; Viger, R.J.; Webb, R.M.T.; Payn, R.A.; LaFontaine, J.H. PRMS-IV, the Precipitation-Runoff Modeling System; Version 4; Geological Survey: Reston, VA, USA, 2015. [Google Scholar]
- SWAT: Soil & Water Assessment Tool. Available online: https://swat.tamu.edu/ (accessed on 2 June 2019).
Figure 1.
Location of the Lim water system reservoirs (a) together with the longitudinal profile (b).
Figure 1.
Location of the Lim water system reservoirs (a) together with the longitudinal profile (b).

Figure 2.
The climate change impact analysis process used in the study.

Figure 3.
Reservoir release rules for the Lim water system: (a) Uvac reservoir, (b) Kokin Brod reservoir, (c) Radojnja reservoir, (d) Potpec reservoir.
Figure 3.
Reservoir release rules for the Lim water system: (a) Uvac reservoir, (b) Kokin Brod reservoir, (c) Radojnja reservoir, (d) Potpec reservoir.

Figure 4.
Stock and flow diagram of the Lim water system consisting of four reservoirs (Uvac, Kokin Brod, Radojnja and Potpec).
Figure 4.
Stock and flow diagram of the Lim water system consisting of four reservoirs (Uvac, Kokin Brod, Radojnja and Potpec).

Figure 5.
Monthly inflows to and outflows from the Lim water system reservoirs (Uvac, Kokin Brod, Radojnja and Potpec) estimated with the following climate datasets: (a) Observed climate, (b) weighted climate simulations, (c–e) regional climate model simulations—WRF, RCA4, RACMO, (f–i) bias correction methods—EQM (empirical quantile mapping), GQM (Gamma quantile mapping), GPQM Gamma Pareto quantile mapping), CS (constant scaling).

Figure 6.
Annual hydropower generation of the Lim water system estimated with the following climate datasets: (a) Observed climate, (b) weighted climate simulations, (c–e) regional climate model simulations—WRF, RCA4, RACMO, (f–i) bias correction methods—EQM, GQM, GPQM, CS.
Figure 6.
Annual hydropower generation of the Lim water system estimated with the following climate datasets: (a) Observed climate, (b) weighted climate simulations, (c–e) regional climate model simulations—WRF, RCA4, RACMO, (f–i) bias correction methods—EQM, GQM, GPQM, CS.

Figure 7.
Climate scenarios within the Lim river basin: (a) Combination of RCMs (regional climate models), BCMs (bias correction methods), and averaging procedures, (b) realisations of each climate dataset combination for the baseline time period of 1971–2000 and future time period of 2006–2055 under RCP (representative concentration pathway) 2.6, RCP 4.5, and RCP 8.5.

Figure 8.
Seasonal distribution of the hydropower generation (gigawatt hours (GWh)) for the hydropower plants (HPPs) of the Lim water system: Bold line—baseline period 1971–2000, thin lines—future period 2006–2055 under RCP 2.6, RCP 4.5, RCP 8.5. ((a) Uvac HPP, (b) Kokin Brod HPP, (c) Bistrica HPP, (d) Potpec HPP).

Figure 9.
Box plots of the monthly inflows into the Lim water system (Uvac, Kokin Brod, Radojnja and Potpec).
Figure 9.
Box plots of the monthly inflows into the Lim water system (Uvac, Kokin Brod, Radojnja and Potpec).

Figure 10.
Box plots of the monthly outflows from the Lim water system reservoirs (Uvac, Kokin Brod, Radojnja and Potpec).
Figure 10.
Box plots of the monthly outflows from the Lim water system reservoirs (Uvac, Kokin Brod, Radojnja and Potpec).

Figure 11.
Box plots of the monthly hydropower generation of the Lim water system power plants (Uvac, Kokin Brod, Bistrica and Potpec).
Figure 11.
Box plots of the monthly hydropower generation of the Lim water system power plants (Uvac, Kokin Brod, Bistrica and Potpec).


Table 1.
The characteristics of reservoirs in the Lim water system.
| Reservoirs | Year Built | Drainage Area (km2) | Annual Inflows (m3/s) | Active Volume (106m3) | Maximal Operational Level (m.a.s.l.) | Minimal Operational Level (m.a.s.l.) | Spillway Capacity (m3/s) | Spillway Crest Elevation (m.a.s.l.) |
|---|---|---|---|---|---|---|---|---|
| Potpec | 1967 | 3605 | 79.9 | 19.8 | 437 | 423.6 | 3000 | 439 |
| Uvac | 1979 | 920 | 9.5 | 160 | 988 | 940 | 1050 | 986 |
| Kokin Brod | 1962 | 1170 | 13 | 209 | 888 | 845 | 1400 | 885.5 |
| Radojnja | 1959 | 1331 | 13.5 | 4.1 | 815 | 805 | 1400 | 816.2 |
Table 2.
The characteristics of hydropower plants in the Lim water system.
| Hydropower Plant | Type | Number of Turbines | Maximal Discharge (m3/s) | Instaled Power (MW) | Annual Energy Generation (GWh) | Maximal Water Head (m) | Minimal Water Head (m) |
|---|---|---|---|---|---|---|---|
| Potpec | Non-diversion | 3 | 165 | 52 | 216 | 38.4 | 25.6 |
| Uvac | Non-diversion | 1 | 43 | 36 | 72 | 100 | 55 |
| Kokin Brod | Non-diversion | 2 | 37.4 | 21.4 | 60 | 73 | - |
| Radojnja | Diversion | 2 | 36 | 103 | 370 | 378 | 345 |
Table 3.
The relative annual change (%) in the hydropower generation of the Lim water system (future period of 2006–2055 production compared to the baseline period of 1971–2000 production).
Table 3.
The relative annual change (%) in the hydropower generation of the Lim water system (future period of 2006–2055 production compared to the baseline period of 1971–2000 production).
| Emissions Scenarios | Uvac HPP | Kokin Brod HPP | Bistrica HPP | Potpec HPP |
|---|---|---|---|---|
| RCP 2.6 | −3.5 | −1.6 | −1.8 | +2.7 |
| RCP 4.5 | +8.1 | +17.9 | +15.3 | −3.0 |
| RCP 8.5 | −0.7 | −1.0 | −2.4 | −7.9 |
Table 4.
The contribution of the different climate change impact assessment steps uncertainty (RCMs, BCMs, CSs) to the total uncertainty in the predicted inflows, outflows and hydropower generation of the Lim water system for the future period (2006–2055).
Table 4.
The contribution of the different climate change impact assessment steps uncertainty (RCMs, BCMs, CSs) to the total uncertainty in the predicted inflows, outflows and hydropower generation of the Lim water system for the future period (2006–2055).
| Modelling Steps | Uncertainty within the Different Processes (%) | ||
|---|---|---|---|
| Inflows | Outflows | Hydropower Generation | |
| RCMs | 44.7 | 45.7 | 40.6 |
| BCMs | 49.0 | 49.2 | 53.5 |
| CSs | 6.3 | 5.0 | 5.9 |
© 2019 by the authors. Licensee MDPI, Basel, Switzerland. This article is an open access article distributed under the terms and conditions of the Creative Commons Attribution (CC BY) license (http://creativecommons.org/licenses/by/4.0/).
Share and Cite
MDPI and ACS Style
Stojkovic, M.; Simonovic, S.P. System Dynamics Approach for Assessing the Behaviour of the Lim Reservoir System (Serbia) under Changing Climate Conditions. Water 2019, 11, 1620. https://doi.org/10.3390/w11081620
AMA Style
Stojkovic M, Simonovic SP. System Dynamics Approach for Assessing the Behaviour of the Lim Reservoir System (Serbia) under Changing Climate Conditions. Water. 2019; 11(8):1620. https://doi.org/10.3390/w11081620
Chicago/Turabian StyleStojkovic, Milan, and Slobodan P. Simonovic. 2019. "System Dynamics Approach for Assessing the Behaviour of the Lim Reservoir System (Serbia) under Changing Climate Conditions" Water 11, no. 8: 1620. https://doi.org/10.3390/w11081620
Note that from the first issue of 2016, this journal uses article numbers instead of page numbers. See further details here.