Environmental and Energy Assessment of Municipal Wastewater Treatment Plants in Italy and Romania: A Comparative Study


1
Department of Environmental Engineering and Management, “Cristofor Simionescu” Faculty of Chemical Engineering and Environmental Protection, “Gheorghe Asachi” Technical University of Iasi, 73 Prof. Dr. D. Mangeron Str., 700050 Iasi, Romania
2
DIATI (Department of Engineering for Environment, Land and Infrastructures), Politecnico di Torino, Corso Duca degli Abruzzi 24, 10129 Torino, Italy
*
Authors to whom correspondence should be addressed.
Water 2019, 11(8), 1611; https://doi.org/10.3390/w11081611
Submission received: 18 June 2019
/
Revised: 29 July 2019
/
Accepted: 31 July 2019
/
Published: 3 August 2019
(This article belongs to the Special Issue Integrated Approaches of the Water Use Cycle: Technical and Environmental Challenges for Sustainability)
Abstract
:Municipal wastewater treatment plants (MWWTPs) are essential infrastructures in any urban context, but they may be considered as a potential source of greenhouse gas (GHG) emissions and should be coherent with European Union (EU) policy on energy efficiency. This study presents a sustainability evaluation of four Italian and Romanian MWWTPs in terms of energy efficiency and greenhouse gas emissions using Energy Performance and Carbon Emissions Assessment and Monitoring (ECAM) tool software. The obtained results indicated that biogas recovery improved energy performances, while the largest contributions in terms of GHG emissions were in all cases caused by energy consumption and methane produced during wastewater treatment. The Romanian plants exhibited higher GHG emissions, compared to the Italian plants, mainly because of the different values of national conversion factors for grid electricity (0.41 kg CO2/kWh for Italy and 1.07 kg CO2/kWh for Romania). Two scenarios aimed at enhancing the overall sustainability were hypothesized, based on increasing the serviced population or energy efficiency, achieving significant improvements. A sustainability assessment of MWWTPs should be adopted as a useful tool to help water utilities to introduce low-energy, low-carbon management practices as well as being useful for policy recommendations.
Highlights
- -
- Sustainability assessment of MWWTPs based on energy consumption and GHG emissions
- -
- Biogas valorization leads to lower energy consumption
- -
- Higher GHG emissions caused by energy consumption and methane production
- -
- Different scenarios were hypothesized to improve sustainability
- -
- National conversion factor, linked to local energy mix, played a key role
1. Introduction
Water is considered an important resource in the context of sustainable development, being vital for health, welfare, economic and social development, and conservation of ecosystems [1]. Municipal wastewater treatment plants (MWWTPs) lead to the conservation of the aquatic environment by removing from wastewater the pollutants generated by municipalities and industries, and minimizing the negative effects on environmental quality and human health [2]. Wastewater utilities can become engines for the circular economy, playing an important role in the water cycle that allows water sanitation and reuse, facilitating energy production and allowing the recovery of various products from wastes. The water sector could therefore contribute significantly to achieving the target of the 2015 Paris Agreement, and it could play a part in each country’s Nationally Determined Contributions. Recent studies identified MWWTPs as a potential source of anthropogenic greenhouse gas emissions, which are causing climate change and air pollution [3,4]. The main identified negative impacts include sludge disposal, electricity and chemical consumption, and direct greenhouse gas (GHG) emissions. The main gases emitted from an MWWTP during the treatment processes are carbon dioxide (CO2), methane (CH4), and nitrous oxide (N2O), while carbon dioxide is also emitted from the production of energy necessary for the plant operation. By enhancing the energy efficiency of MWWTPs, the carbon dioxide release may be reduced, leading to a decrease in treatment costs and environmental impacts. The production of nitrous oxide is associated with biological nitrogen removal from wastewater as it is an intermediate product of the nitrification and denitrification processes [5]. Around 72% of methane emissions are produced in the sludge line where anaerobic digestion occurs [6]. The remaining emissions are generated from biological treatment and can be ascribed to methane dissolved in wastewater.
Currently, new challenges are oriented toward ensuring the sustainability of MWWTPs with respect to their economic feasibility and environmental impact [6]. By assessing the treatment efficiency of different plants, their performance may be compared and therefore best practices be identified [7]. The performance of MWWTPs is usually measured in terms of contaminant removal per unit cost, assuming that legal requirements of the treated wastewater before discharge or reuse are met [8]. GHG emissions from conventional MWWTPs have already been analyzed, but the evaluation of possible alternatives to minimize these emissions has not yet been undertaken [6]. Considering the complexity of MWWTPs as well as the need to decrease their energy costs and emissions, adequate methods to evaluate the sustainability of municipal wastewater treatment processes are urgently needed. Some studies have been conducted to assess the environmental impacts caused by MWWTPs, evaluating energy consumption during their lifetime, GHG emissions from existing plants, and alternative new technologies to reduce the environmental impacts [9,10,11,12]. These impacts greatly affect local and global sustainability, especially in the operational phases of MWWTPs. An overview of the most important studies regarding carbon footprint and energy performance assessments of wastewater treatment facilities is presented in Table 1. These research articles present different aspects related to energy efficiencies and greenhouse gas emissions during the operation of municipal wastewater treatment plants, but not through an integrated approach.
Thanks to our cooperation with regional water operators, we have published various articles so far [1,17,23,24,25], in which we studied the environmental and energy performance of municipal wastewater treatment plants. The reader may find further details regarding the problems with data collecting processing in those articles.
The novelty of this study is based on two aspects. First, the existing evaluation instruments for energy performance and GHG emission assessments are not always easy and intuitive and the comparison between various MWWTPs requires expert users in order to understand the output data. Therefore, the choice of an easy-to-use tool that generates results that can be understood not only by professionals is of paramount importance. For these reasons, the ECAM tool, an open-source software that is consistent with Intergovernmental Panel on Climate Change (IPPC) Guidelines, was chosen as assessment tool for the study. Second, to our knowledge an analysis specifically aimed at the contemporary evaluation of GHG emissions and energy efficiency on same case studies, involving different European Union (EU) countries, is new. An integrated approach on energy efficiency and GHG evaluation need to be done in order to drive the GHG emission reductions related to the energy consumption during the operation of MWWTPs.
From our experience, the ECAM tool can be used more easily than other evaluation instruments, such as life cycle assessment (LCA), carbon footprint (CF), water footprint (WF), and environmental impact quantification [1,23,24,25].
The aim of this research was to assess the sustainability of four municipal wastewater treatment plants having a similar process outline and size, two in Italy and two in Romania, by comparing their energy efficiency and GHG emissions. The evaluation’s goal was to identify the differences in the wastewater treatment facilities’ sustainable operation in the EU context as well as strong and weak points that could be useful for all the stakeholders involved (academics, plant managers, professionals, local authorities) in introducing low-energy, low-carbon water management practices and for policy recommendations.
2. Materials and Methods
2.1. ECAM Tool
The Energy Performance and Carbon Emissions Assessment and Monitoring (ECAM) tool is an open-source software developed within the Water and Wastewater Companies for Climate Mitigation (WaCCliM) project. It is recommended as a source of valuable information for energy performances at the operational level and for identifying the stages within the urban water cycle where GHG emissions could be reduced [26]. The ECAM tool only requires data typically available in utilities; the methodology can be applied to utilities nationwide, facilitating national benchmarking and knowledge exchange between utilities. ECAM results could then be compared with known benchmarks so that hot-spots can be identified, and decision makers can prioritize improvements in the most promising stage, that is, improve energy efficiency of the water pumping systems, improve the water efficiency (reusing treated wastewater), and generate the energy from renewable resources such as solar energy and biogas. As far as we know, only four countries (Jordan, Mexico, Peru, and Thailand) have applied this instrument for water companies as pilot studies [26]. The ECAM tool enables the measurement and management of GHG emissions and energy consumption at a system-wide level in water and/or wastewater management, identifying the critical areas for GHG emission reduction, increasing energy savings, and improving overall efficiencies to reduce the costs. It can be very useful for all stakeholders involved in water service management and planning for GHG emission and energy performance assessments and to identify appropriate and operative perspectives to limit overall carbon dioxide emissions.
The Performance Indicators publications of the International Water Association (IWA) [26] for water supply and wastewater, along with some additional indicators, are the starting point for the calculation of service levels and energy performance. The energy requirements are translated into GHG emissions using a conversion factor based on the specific country’s electricity mix (kg CO2/kWh). This allows the users to avoid any fluctuation of the GHG emissions that are unrelated to the performance of the utility itself [26].
The ECAM tool considers the entire urban water cycle from water abstraction and treatment to wastewater treatment and discharge. In this research paper, we took only the wastewater utility into consideration. The holistic approach of ECAM (version 1) first requires an initial assessment (called Tier A), which gives a comprehensive overview of GHG emissions and energy consumption. Tier A is based on detailed data related to resident and serviced population, treated wastewater daily flow, energy consumed from the grid, monthly energy and running costs, volume of fuel consumed, distance to sludge disposal site, average total nitrogen at discharge sludge, and biogas production.
A detailed assessment (called Tier B) is divided into two sections—GHG assessment and energy performance. The GHG assessment includes the following input data: resident and serviced population, volume of collected and treated wastewater five-day biological oxygen demand (BOD5) influent and effluent loads, total nitrogen load in the effluent, CH4 emission factor, and volume of fuel consumed. The energy performance is then carried out regarding the three main sections of an MWWTP—collection, treatment, and discharge/reuse. The Intergovernmental Panel on Climate Change (IPCC) definitions refer to GHG emission targets as scope 1 (direct emission), 2 (indirect emission from electric energy), and 3 (other indirect emission) [26].
The methodology adopted in the research was based on consequent phases, namely, 1. Data inventory—the collection of input data for an evaluation period of one year (2015); 2. Transformation of input data into performance indicators—GHG emissions by treatment stage (collection, treatment, discharge), by source (electricity, N2O, and CH4), by United Nations Framework Convention on Climate Change (UNFCCC) categories (electricity and heat, solid waste, wastewater treatment, and discharge); energy consumption by stage (as above), and energy fraction of operational costs; and 3. Development of different scenarios aimed at the reduction of GHG emissions in relation to the serviced population and the reduction of wastewater costs in relation to the decrease in energy consumed.
2.2. Case Studies
Four MWWTPs (A and B in Italy and C and D in Romania) were selected as case studies (see Table 2). The input data related to the plants were obtained through questionnaires filled in by the managing companies and/or through the Sustainability Balance report published on their Internet site. The plants are cited in anonymous form, that is, they were chosen with similar process outlines (all with activated sludge biological module and two with biogas recovery) and sizes to achieve consistency in the assessment.
The last phase of data inventory was based on clustering the input data considering the following aspects: treatment process outline, size of the plant, type of influent, and characteristics of the effluent. Treatment process outline consisted in all cases in preliminary and primary treatments followed by secondary and tertiary treatments (see Table 2), with differences about the nutrient removal module (nitrification/denitrification) that was placed upstream or downstream of secondary biological treatment. The Italian case studies (A and B) are respectively the largest and smallest plants analyzed, whereas the Romanian case studies (C and D) are of analogous size.
The ECAM tool takes into consideration four quality indicators, as presented in Table 3, together with their respective maximum allowed concentrations for discharging in natural water bodies, as regulated by the Romanian and Italian legislation, through the Government Decision No. 352/2005 [27] and Legislative Decree 152/2006 [28] for the discharge of water into the receiving body.
3. Results and Discussion
3.1. Comparative Analysis of the Case Studies
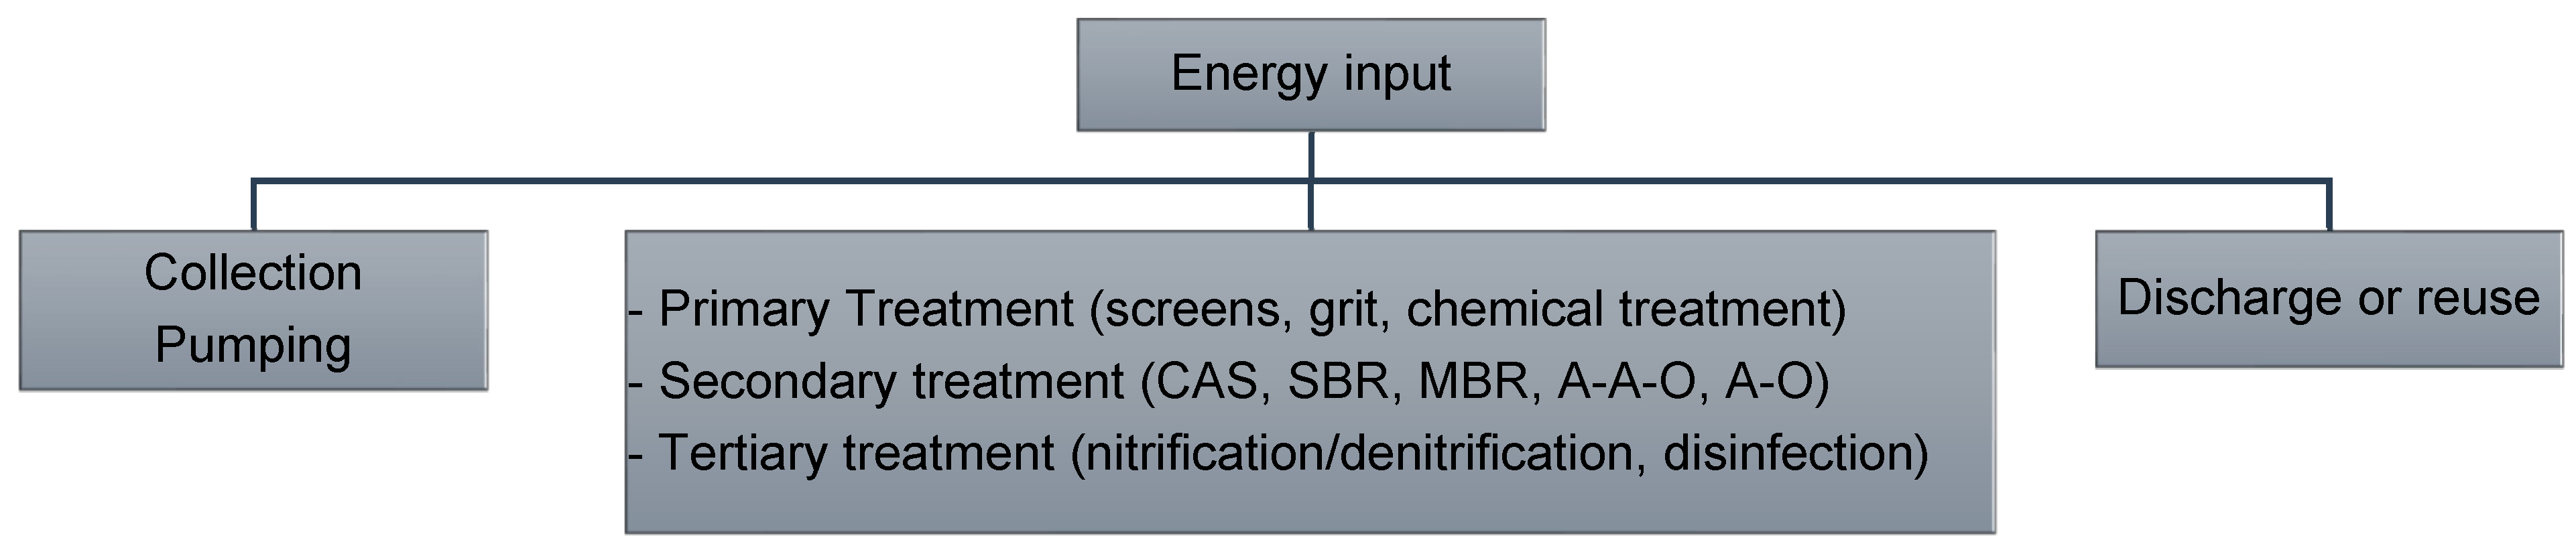
Energy efficiency in water and wastewater sectors allows local and regional governments to reduce operating costs, unlocking resources for further investments in other areas. The operation of MWWTPs requires energy, mostly electricity, but also gas or other fuels for wastewater collection, treatment, sludge disposal or treatment, and treated wastewater discharge or reuse (see Figure 1). MWWTP management costs may be reduced by ensuring an efficient design and operation of wastewater treatment stages and by generating electricity and heat through biogas valorization. The former allows the reduction of wastewater quantity to be treated, which in turn reduces the amount of energy required; the latter ideally allows the consideration of the MWWTP as a “net zero” consumer of energy. In this way, the MWWTP gets the same benefits but uses less energy. Improving energy efficiency in water and wastewater facilities can produce a range of environmental, economic, and other benefits, such as reducing air pollution and GHG emissions, improving energy and water security, reducing energy costs, extending the life of equipment, and protecting public health [29].
In Italy, the total electricity consumption due to the entire integrated water services is about 3.25 billion kWh/year, the annual cost being around € 0.5 billion a year [30]. For this reason, it is important to know that by saving energy the costs for generating, conveying, and distributing energy from power plants decrease and several environmental and economic benefits occur. A comparative analysis between the Romanian and Italian context could be useful to understand the differences and possible optimization perspectives in terms of energy consumption and GHG emissions generated from the MWWTPs in an international analysis framework. For this reason, the first difference to consider is the conversion factor for grid electricity, provided by the International Energy Agency (www.iea.org), which is respectively 0.41 kg CO2/kWh for Italy and 1.07 kg CO2/kWh for Romania [31]. The difference between the electricity-specific factors varies by country and it is due to the types of fuels (fossil and/or renewable) used to generate electricity and heat, and the different levels of heat generation. In 2015, according to the European Commission [32], electricity generation in Italy (population 57.88 M inhabitants; GDP 1.490 billion Euros at current prices; 503.7 million tons of CO2 emitted; CO2 GDP intensity equal to 309 million tons/million Euros) was based on solid fuel (10%), petroleum and products (liquefied petroleum gas (LPG), motor gasoline, gas/diesel oil, 50%), gases (21%), and renewable fuels (mostly hydro, and also geothermal, from wind and biomass, solar, 19%). Electricity generation in Romania (population 19.87 M inhabitants; GDP 160 billion Euros at current prices; 78.5 million tons of CO2 emitted; CO2 GDP intensity equal to 544.6 million tons/million Euros) was based on solid fuel (coal, 27.3%), petroleum and products (0.7%), gases (14.3%), nuclear (17.6%), and renewable fuels (mostly hydro, and also from wind, solar, 40.1%). This means that for the same consumption of electricity, there may be different values in terms of GHG emissions. Hence, the electricity-specific factors are very important because they allow the emissions from electricity to not be over- or underestimated within GHG accounts. The output values generated by the ECAM tool derived from the service level indicators are reported in Table 4.
The serviced population is the percentage of the resident population that is connected to the sewerage system and shows which type of wastewater is treated by the MWWTP. The highest percentage of service population was displayed in the case of plant C followed by plant D. This means that, despite major problems due to the lack of sewerage system development in Romania, the Romanian MWWTPs showed a higher percentage of serviced population than the Italian MWWTPs. It is also important to remember that plants A and B are in line with the Italian standards, where the average of serviced population is around 85% [33].
Regarding the treated wastewater per person per day, plant B shows the highest value, which is around 430 L/serv.pop./day. Furthermore, the treated wastewater per person per day is related to the possible infiltrations in the sewerage system. The collected wastewater treated shows the percentage of the collected sewage prior to dilution or overflows in the sewer system that is treated in the MWWTP. In fact, according to the previous issues, plant B shows the lowest percentage of collected wastewater treated, which is around 94.5%, whereas plant A shows the highest percentage, which is 97.7%, with a treated wastewater per person per day of 277.38 L/serv.pop./day, more or less in line with the Italian average (250 L/serv.pop./day) [34]. In addition, the treated wastewater per person per day in plant B is justified by a failure at the input counter and the presence of an industrial discharge, as reported by the managing company.
The Romanian MWWTPs are characterized by high values of treated wastewater per person per day (360–400 L/serv.pop./day), considering that the average in Romania is around 136 L/serv.pop./day according to the water and wastewater service in the Danube Region [35]. This is due to the presence of infiltration in the sewerage systems and industrial discharges.
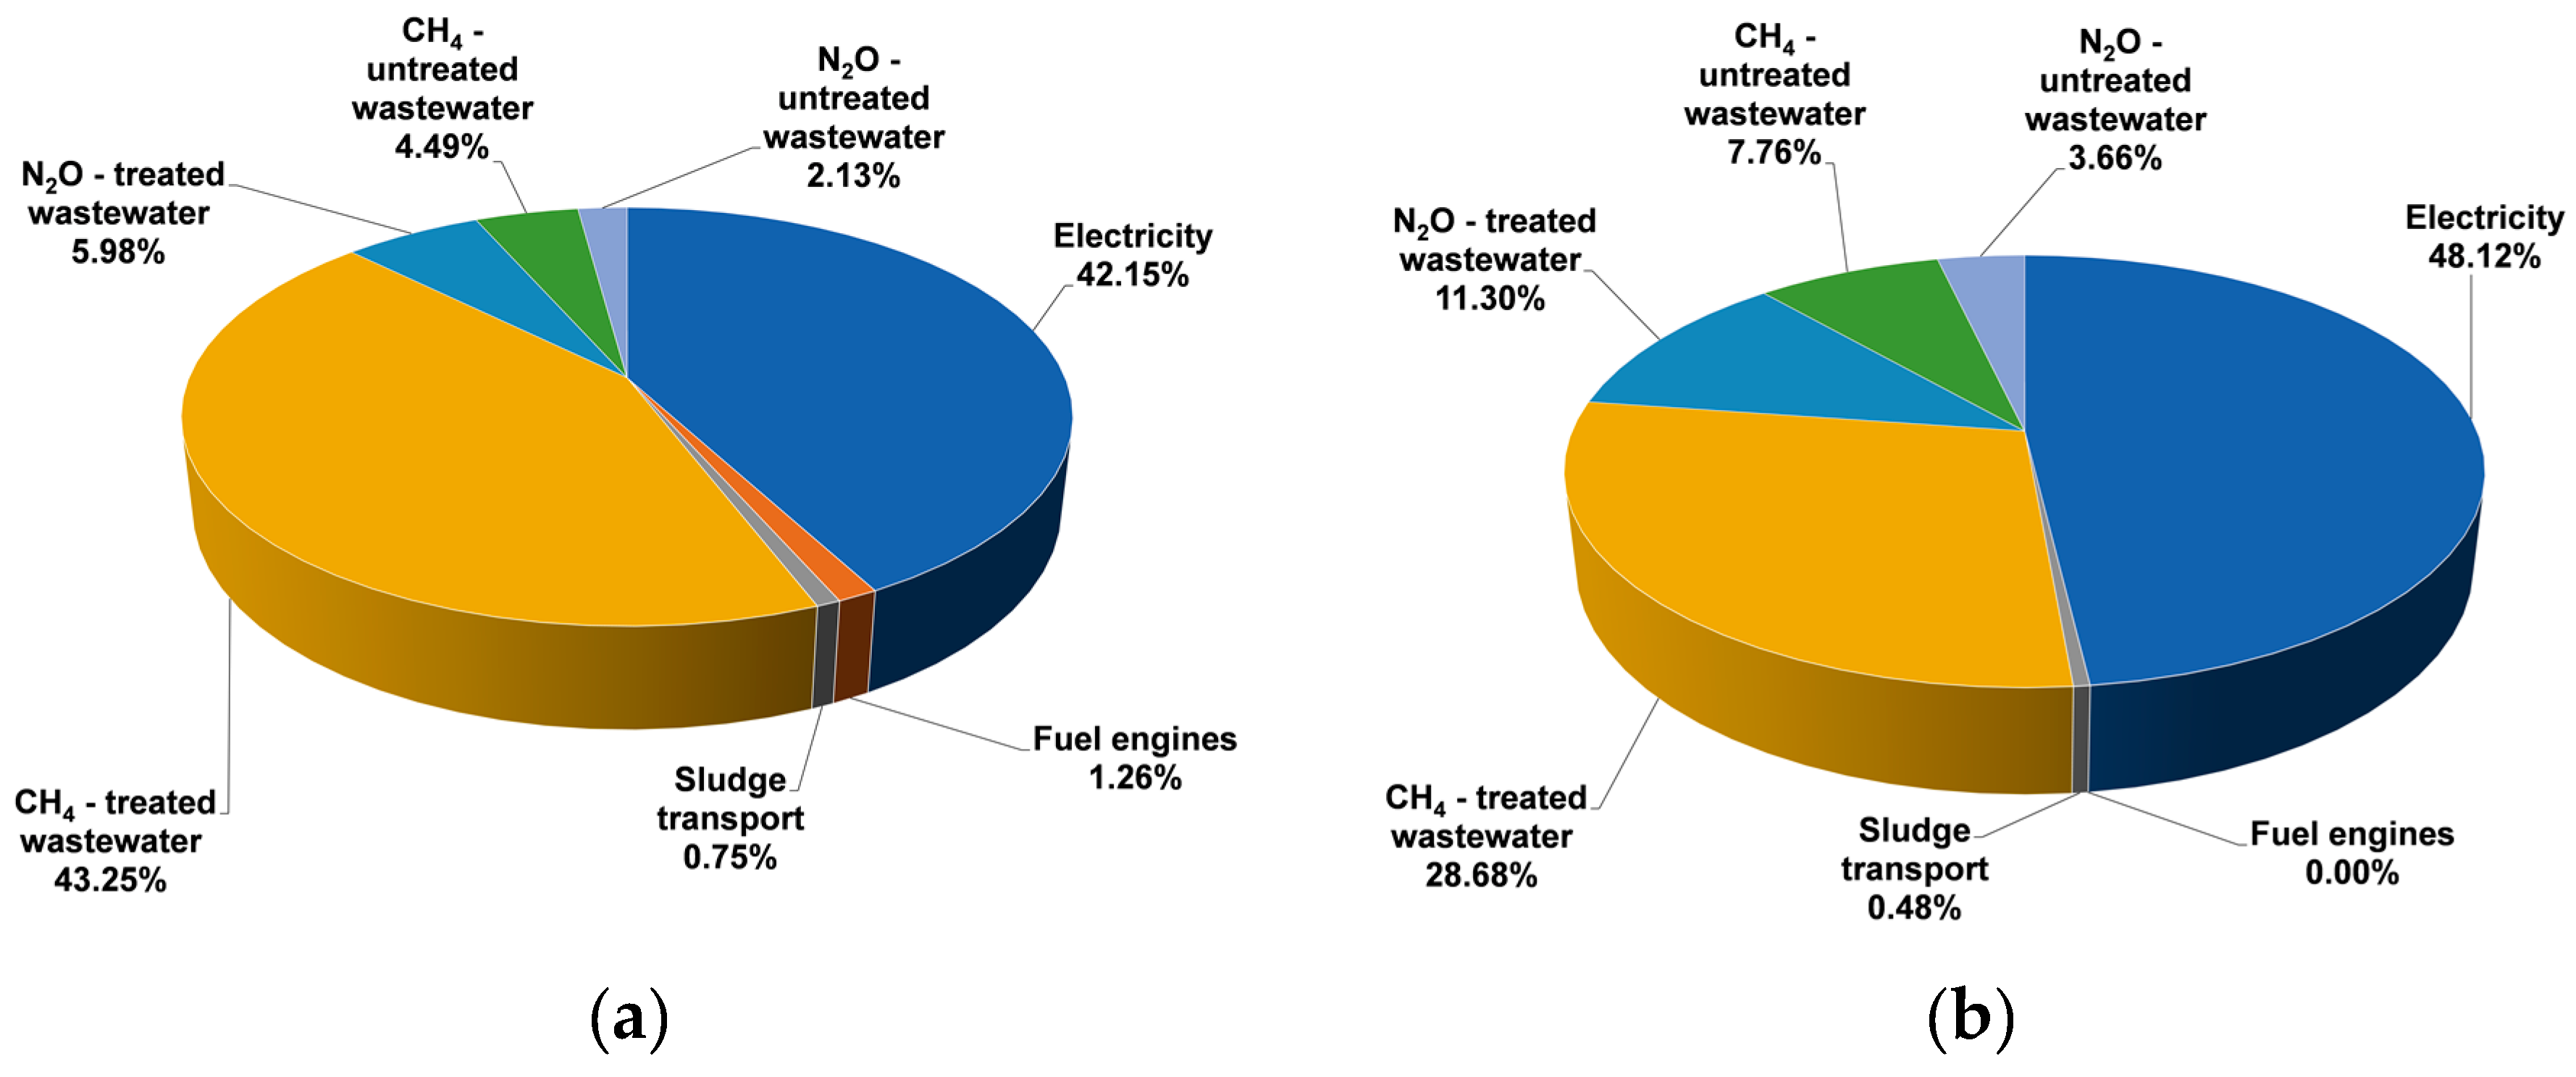
GHG emissions related to different sources coming from the treatment stage are reported in Figure 2, expressed as percentage from total amount of CO2/year/inhab. It is noticeable that in plants where biogas valorization occurs (A and D), the largest contribution in terms of GHG emissions is due to the methane produced by wastewater treatment, whereas in MWWTPs where the sludge is not digested (B and C), the main contribution is due to electricity consumption. The GHG emissions calculated per inhabitant per year are 2.5 times higher for the Romanian plants compared to the Italian ones, in agreement with the difference between the conversion factor for grid electricity.
Energy performance indicators related to the three main stages of collection, treatment, and discharge of wastewater are presented in Table 5. Energy consumption for wastewater collection was detected in plants A and D, whereas it was equal to zero in plants B and C. Considering the treatment phase, the highest value of energy consumption per treated wastewater is represented by plant C (0.3 kWh/m3), and it is analogous to the value calculated for plant A (0.28 kWh/m3), which is a larger scale plant, whereas the lowest is given by plant D (0.18 kWh/m3). The obtained data are in agreement with the literature (0.26 to 0.87 kWh/m3) [36]. Regarding the energy consumption per BOD5 mass removed, the values are similar in the Italian context, whereas in the Romanian context, plant C (1.92 kWh/kg BOD5 removed) exhibited values that were doubled if compared to plant D (0.98 kWh/kg BOD5 removed). This indicator considers the percentage of energy consumed in wastewater treatment with regards to the total energy consumed from the grid and self-produced in the plant. Considering the MWWTPs where biogas valorization takes place, the values of energy production per BOD5 mass removed in plant A is 0.11 kWh/m3, whereas in plant D it is 0.04 kWh/m3, and this value is directly proportional to the electrical energy produced from biogas valorization. MWWTP D showed 100% of electrical energy produced per total available energy in biogas (i.e., the entire energy content of biogas was valorized), whereas for plant A it was 86.62%. Plants A and D showed the same value for the biogas produced per BOD5 mass removed. Finally, the energy consumption and energy recovery for wastewater discharge were equal to zero for all case studies. This means that in both the Italian and Romanian contexts, the MWWTPs were designed with a favorable slope in order to discharge the water gravitationally, without energy consumption (topographic energy). It is a common design strategy to decrease energy consumption in MWWTPs.
The percentages of estimated energy costs from the annual management costs by each plant have also been calculated. MWWTPs A (15.3%) and D (11.7%) show a lower percentage of energy costs, due to biogas valorization; on the other hand, MWWTPs B (39.3%) and C (34.3%) show similar energy percentage costs, in agreement with the 25–40% conventionally assumed by the literature [37].
3.2. Proposed Scenarios
3.2.1. Improvement of Serviced Population
The ECAM tool allows users to create different scenarios in order to reduce GHG emissions and wastewater costs considering the untreated wastewater (related to the serviced population that is not 100% connected to the sewer network) and the energy efficiency. Table 6 presents the GHG reduction calculated starting from the actual serviced population of each MWWTP until 100% of population is connected to the sewerage systems. This means that even if all MWWTPs have a high percentage of serviced population, it is necessary to continue to improve their services in order to reduce the percentage of wastewater untreated and the relative GHG emissions.
3.2.2. Reduction of Energy Consumption
Another scenario proposed considered the reduction of multi-level energy consumption and the consequent reduction in GHG emissions as reported in Table 6. This scenario could be very useful when local authorities and governments require specific targets in terms of energy reduction and for the European 20-20-20 climate and energy targets [38].
The sustainability of MWWTPs can also be measured in terms of their economic feasibility, with wastewater treatment cost being an important decision factor. The reduction of energy consumption allows the quantification of energy savings for different stages of wastewater treatment. The percentage of the CO2 emission reduction is higher for plants B and C, where the biogas production does not occur, because the largest contribution of GHG emissions is due to energy consumption. In plants A and D that are producing biogas, the contribution to GHG emissions is due to CH4 from wastewater treatment, which is almost similar in percentage as the energy consumption.
A recent benchmark study [19] evaluated the energy savings from operational optimization and technology improvements between 5 and 30%. The aeration system improvements can include online aeration control, energy-efficient bubble aerators, and an update of the sludge line with separate side-stream of rejected water from anaerobic digestion [17].
Based on the results obtained for the four case studies considered in this study, the ECAM tool presented some general recommendations to improve the sustainability of wastewater treatment facilities. They include pump efficiency optimization, the reduction of infiltration in the inflow, the use of renewable energy (solar and wind energy), biogas valorization to produce heat and/or electricity, final effluent recycling in order to reduce fresh water consumption, aeration system optimization, covered basins (in northern climates), and the use of a wastewater treatment process modeling software to identify opportunities for optimizing process and reducing energy consumption and GHG emissions. In the case of municipal wastewater treatment plants B (Italy) and C (Romania), we can recommend biogas valorization in order to produce heat and/or energy, reducing the energy costs. It is highly recommended that the entire resident population be connected to the sewer system and the wastewater treated in a municipal wastewater treatment plant. Additionally, it is necessary to improve the sewer systems in order to avoid the infiltration in the sewer system.
Moreover, other perspectives involve energy recovery from wastewater discharges through microturbines to produce renewable energy, energy recovery from organic matter and heat in wastewater, as well as building energy requirements for lighting and heating, ventilation, and air conditioning (HVAC) [39,40,41].
4. Conclusions
In this study, the sustainability of four MWWTPs (two in Italy and two in Romania) was investigated using the ECAM tool, permitting us to obtain an overview of the associated energy consumption and the corresponding GHG emissions. This approach enables the analyst to rank the main sources in terms of energy consumption and GHG emissions and, based on this information, to develop strategies for the improvement of MWWTP energy consumption and sustainability. All the analyzed plants presented high percentages of serviced population, which reflects the Italian and Romanian standards (>80% of resident population). In MWWTP A (Italy) and D (Romania), where there is biogas valorization, the largest contribution in terms of GHG emissions was provided by methane produced by wastewater treatment following by electricity consumption. The opposite situation was presented in MWWTPs B and C, where there is no biogas valorization and the main contribution in terms of GHG emissions is due to electricity consumption followed by methane produced by wastewater treatment. The Romanian MWWTPs showed a higher impact on GHG emissions than the Italian ones because of the values of the conversion factor for grid electricity, which is 2.5 times higher than in Italy. The ECAM tool also assessed the energy performance considering the three main steps in an MWWTP—collection, treatment, and discharge of wastewater. This shows that almost all electricity consumed is related to wastewater treatment stages. Finally, different scenarios (based on the maximization of the serviced population at 100% and on an improvement of the energy efficiency by reducing 10%, 15%, and 20% energy consumption) were hypothesized to enhance the sustainability of the considered case studies, observing significant improvements in all cases.
In conclusion, energy consumption and GHG emissions are key factors to be considered in the sustainability evaluation of MWWTPs. Sustainable wastewater management should address two main problems—the reduction of direct discharges of untreated wastewater and the mitigation of GHG emissions from the water sector. MWWTP management costs can be reduced by ensuring an efficient design and operation of wastewater treatment stages and by generating electricity and heat onsite. To achieve the aim of enhanced sustainability of the studied MWWTPs, the annual energy consumption and GHG emissions should be systematically reduced.
Author Contributions
Conceptualization, C.T. and S.F.; methodology, D.F., writing—original draft preparation, D.F., C.T., and S.F. All authors reviewed and edited the article.
Funding
This research did not receive any specific grant from funding agencies in the public, commercial, or not-for-profit sectors.
Acknowledgments
The authors gratefully acknowledge the Italian and Romanian MWWTPs that offered the input data for this study (plants B, C, D). The input data for MWWTP A are derived from the Sustainability Balance report available at www.smatorino.it. The authors would like to thank Massimiliano Gurnari for his contribution in organizing the input data.
Conflicts of Interest
The authors declare no conflict of interest.
References
- Teodosiu, C.; Barjoveanu, G.; Sluser, B.M.; Ene Popa, S.A.; Trofin, O. Environmental assessment of municipal wastewater discharges: A comparative study of evaluation methods. Int. J. Life Cycle Assess. 2016, 21, 395–411. [Google Scholar] [CrossRef]
- Shao, S.; Mu, H.; Yang, F.; Zhang, Y.; Li, J. Application of energy analysis to the sustainability evaluation of municipal wastewater treatment plants. Sustainability 2017, 9, 8. [Google Scholar] [CrossRef]
- Larsen, T.A. CO2 neutral wastewater treatment plants or robust, climate friendly wastewater management? A system perspective. Water Res. 2015, 87, 513–521. [Google Scholar] [CrossRef] [PubMed]
- Sweetapple, C.; Fu, G.; Butler, D. Identifying sensitive sources and key control handles for the reduction of greenhouse gas emissions from wastewater treatment. Water Res. 2014, 62, 249–259. [Google Scholar] [CrossRef] [PubMed] [Green Version]
- Wu, J.; Zhang, J.; Jia, W.; Xie, H.; Gu, R.; Li, C.; Gao, B. Impact of COD/N on Nitrous Oxide Emission From Microcosm Wetlands and Their Performance in Removing Nitrogen From Wastewater. Bioresour. Technol. 2009, 100, 2910–2917. [Google Scholar] [CrossRef] [PubMed]
- Campos, J.L.; Valenzuela-Heredia, D.; Pedrouso, A.; Val del Rio, A.; Belmonte, M.; Mosquera-Corral, A. Greenhouse Gases Emissions from Wastewater Treatment Plants: Minimization, Treatment, and Prevention. J. Chem. 2016, 2016, 1–12. [Google Scholar] [CrossRef] [Green Version]
- Castellet, L.; Molino-Senante, M. Efficiency assessment of wastewater treatment plants: A data envelopment analysis approach integrating technical, economic and environmental issues. J. Environ. Manag. 2016, 167, 160–168. [Google Scholar] [CrossRef]
- Remy, C.; Boulestreau, M.; Warneke, J.; Jossa, P.; Lesjean, B. Evaluating new processes and concepts for energy and resource recovery from municipal wastewater with life cycle assessment. Water Sci. Technol. 2016, 73, 1074–1080. [Google Scholar] [CrossRef]
- Wang, Q.; Wei, W.; Gong, Y.; Yu, Q.; Li, Q.; Sun, J.; Yuan, Z. Technologies for reducing sludge production in wastewater treatment plants: State of the art. Sci. Total Environ. 2017, 587, 510–521. [Google Scholar] [CrossRef]
- Lundin, M.; Bengtsson, M.; Molander, S. Life cycle assessment of wastewater systems: Influence of system boundaries and scale on calculated environmental loads. Environ. Sci. Technol. 2000, 34, 180–186. [Google Scholar] [CrossRef]
- Renou, S.; Thomas, J.; Aoustin, E.; Pons, M. Influence of impact assessment methods in wastewater treatment LCA. J. Clean. Prod. 2008, 16, 1098–1105. [Google Scholar] [CrossRef]
- Zappone, M.; Fiore, S.; Genon, G.; Venkatesh, G.; Brattebo, H.; Meucci, L. Life Cycle Energy and GHG Emission within the Turin Metropolitan Area Urban Water Cycle. Procedia Eng. 2014, 89, 1382–1389. [Google Scholar] [CrossRef] [Green Version]
- Parravicini, V.; Svardal, K.; Krampe, J. Greenhouse gas emissions from wastewater treatment plants. Energy Procedia 2016, 97, 246–253. [Google Scholar] [CrossRef]
- Mannina, G.; Ekama, G.; Caniani, D.; Cosenza, A.; Esposito, G.; Gori, R.; Garrido-Baserba, M.; Rosso, D.; Olsson, G. Greenhouse gases from wastewater treatment—A review of modelling tools. Sci. Total Environ. 2016, 551, 254–270. [Google Scholar] [CrossRef] [PubMed]
- Daelman, M.R.; van Voorthuizen, E.M.; van Dongen, L.; Volcke, E.; van Loosdrecht, M. Methane emission during municipal wastewater treatment. Water Res. 2012, 46, 3657–3670. [Google Scholar] [CrossRef]
- Rodriguez-Caballero, A.; Aymerich, I.; Marques, R.; Poch, M.; Pijuan, M. Minimizing N2O emissions and carbon footprint on a full-scale activated sludge sequencing batch reactor. Water Resour. 2015, 71, 1–10. [Google Scholar] [CrossRef]
- Panepinto, D.; Fiore, S.; Zappone, M.; Genon, G.; Meucci, L. Evaluation of energy efficiency of a large wastewater treatment plant in Italy. Appl. Energy 2016, 161, 404–411. [Google Scholar] [CrossRef]
- Frijns, J.; Hofman, J.; Nederlof, M. The potential of (waste)water as a energy carrier. Energy Convers. Manag. 2013, 65, 357–363. [Google Scholar] [CrossRef]
- Longo, S.; D’antoni, B.M.; Bongards, M.; Chaparro, A.; Cronrath, A.; Fatone, F.; Lema, J.M.; Mauricio-Iglesias, M.; Soares, A.; Hospido, A. Monitoring and diagnosis of energy consumption in wastewater treatment plants. A state of the art and proposals for improvement. Appl. Energy 2016, 179, 1251–1268. [Google Scholar] [CrossRef]
- Henriques, J.; Catarino, J. Sustainable value—An energy efficiency indicator in wastewater treatment plants. J. Clean. Prod. 2017, 142, 323–330. [Google Scholar] [CrossRef]
- Felca, A.T.A.; Barros, R.M.; Filho, G.L.T.; Dos Santos, I.F.S.; Ribeiro, E.M. Analysis of biogas produced by the anaerobic digestion of sludge generated at wastewater treatment plants in the South of Minas Gerais, Brazil as a potential energy source. Sustain. Cities Soc. 2018, 41, 139–153. [Google Scholar] [CrossRef]
- Gu, Y.; Li, Y.; Li, X.; Luo, P.; Wang, H.; Wang, X.; Wu, J.; Li, F. Energy Self-sufficient Wastewater Treatment Plants: Feasibilities and Challenges. Energy Procedia 2017, 105, 3741–3751. [Google Scholar] [CrossRef]
- Bârjoveanu, G.; Teodosiu, C.; Gîlcă, A.F.; Roman, I.; Fiore, S. Environmental performance evaluation of a drinking water treatment plant: A life cycle assessment perspective. Environ. Eng. Manag. J. 2019, 18, 513–522. [Google Scholar]
- Pintilie, L.; Torres, C.M.; Teodosiu, C.; Castelles, F. Urban wastewater reclamation for industrial reuse: An LCA case study. J. Clean. Prod. 2016, 139, 1–14. [Google Scholar] [CrossRef]
- Barjoveanu, G.; Comandaru, I.M.; Rodriguez-Garcia, G.; Hospido, A.; Teodosiu, C. Evaluation of water services system through LCA. A case study for Iasi City, Romania. Int. J. Life Cycle Assess. 2014, 19, 449–462. [Google Scholar] [CrossRef]
- Energy Performance and Carbon Emissions Assessment and Monitoring Tool (ECAM Tool). Water and Wastewater Companies for Climate Mitigation 2015. Available online: http://wacclim.org/ecam/v1/ (accessed on 21 August 2018).
- Government Decision no. 352/2005 for modifying Government Decision no. 188/2002 for approving conditions of discharging wastewaters into aquatic environments, Official Monitor of Romania no. 398/11.05.2005 (in Romanian). Available online: http://legislatie.just.ro/Public/DetaliiDocument/61585 (accessed on 21 August 2018).
- Gazzetta Ufficiale Decreto Legislativo 3 aprile 2006 n. 152, Norme in materia ambientale. Gazzetta Ufficiale n. 88 del 14 aprile 2006. Available online: https://www.camera.it/parlam/leggi/deleghe/06152dl.htm (accessed on 21 August 2018).
- Energy Efficiency in Water and Wastewater Facilities. In A Guide to Developing and Implementing Greenhouse Gas Reduction Programs; U.S. Environmental Protection Agency (USEPA): Washington, DC, USA, 2013. Available online: https://www.epa.gov/sites/production/files/2015-08/documents/wastewater-guide.pdf (accessed on 21 August 2018).
- Campanelli, M.; Foladori, P.; Mentore, V. Consumi Elettrici ed Efficienza Energetica nel Trattamento Delle Acque Reflue; Maggioli Editore: Santarcangelo di Romagna, Italy, 2013; p. 368. (In Italian) [Google Scholar]
- Brander, M.; Sood, A.; Wylie, C.; Haughton, A.; Lovell, J. Electricity-Specific Emission Factor for Grid Electricity. 2011. Available online: https://ecometrica.com/assets/Electricity-specific-emission-factors-for-grid-electricity.pdf (accessed on 21 August 2018).
- EC. European Commission. Country Datasheets on Energy Statistics. 2018. Available online: https://ec.europa.eu/energy/en/data-analysis/country/ (accessed on 21 August 2018).
- Istituto Nazionale di Statistica. Available online: https://www.istat.it/ (accessed on 15 June 2017).
- Bonomo, L. Trattamenti Delle Acque Reflue; Mcgraw Hill Education: New York, NY, USA, 2008; p. 637. (In Italian) [Google Scholar]
- Danube Water Program. Water and Wastewater Services in the Danube Region, a State of the Sector. 2015. Available online: http://www.danube-water-program.org/media/publications/sos_Report.pdf/ (accessed on 21 August 2018).
- Gandiglio, M.; Lanzini, A.; Soto, A.; Leone, P.; Santarelli, M. Enhancing the energy efficiency of wastewater treatment plants through co-digestion and fuel cell systems. Front. Environ. Sci. 2017, 5, 1–21. [Google Scholar] [CrossRef]
- Metcalf, E. Wastewater Engineering: Treatment and Reuse, 5th ed.; McGraw-Hill: New York, NY, USA, 2013; p. 2018. [Google Scholar]
- European Commission. Taking Stock of the Europe 2020 Strategy for Smart, Sustainable and Inclusive Growth, COM (2014) 130 Final; European Commission: Brussels, Belgium, 2014; Available online: http://ec.europa.eu/transparency/regdoc/rep/1/2014/EN/1-2014-130-EN-F1-1.Pdf (accessed on 26 July 2018).
- WaCCliM. Explore Opportunities to Reduce GHG, Energy and Water Footprints of Your Utility (WaCCliM). 2018. Available online: http://climatesmartwater.org/opportunities_all/ (accessed on 21 August 2018).
- Puyol, D.; Batstone, D.J.; Hulsen, T.; Astals, S.; Peces, M.; Kromer, J.O. Resource recovery from wastewater by biological technologies: Opportunities, Challenges and Prospects. Front. Microbiol. 2017, 7, 2016. [Google Scholar] [CrossRef]
- Hendry, S.; Benidickson, J. Chapter 25: Legal and policy frameworks for the management of wastewater. In Innovative Wastewater Treatment & Resource Recovery Technologies, Impacts on Energy, Economy and Environment; Lema, J.M., Martinez, S.S., Eds.; IWA Publishing: London, UK, 2017; pp. 434–549. [Google Scholar]
Figure 1.
Energy input in wastewater treatment plants (CAS, conventional activated sludge; SBR, sequencing batch reactor; MBR, membrane bioreactor; A-A-O, anaerobic-anoxic-oxic system; A-O, anaerobic-oxic system).
Figure 1.
Energy input in wastewater treatment plants (CAS, conventional activated sludge; SBR, sequencing batch reactor; MBR, membrane bioreactor; A-A-O, anaerobic-anoxic-oxic system; A-O, anaerobic-oxic system).

Figure 2.
Comparison of GHG emissions of the considered case studies. (a) MWWTP A, 25.41 kg CO2/year/inhab.; (b) MWWTP B, 26.81 kg CO2/year/inhab.; (c) MWWTP C, 64.32 kg CO2/year/inhab.; (d) MWWTP D, 68.36 kg CO2/year/inhab.
Figure 2.
Comparison of GHG emissions of the considered case studies. (a) MWWTP A, 25.41 kg CO2/year/inhab.; (b) MWWTP B, 26.81 kg CO2/year/inhab.; (c) MWWTP C, 64.32 kg CO2/year/inhab.; (d) MWWTP D, 68.36 kg CO2/year/inhab.


Table 1.
Overview of the most relevant studies for energy performance and greenhouse gas (GHG) emission assessments of wastewater treatment facilities.
Table 1.
Overview of the most relevant studies for energy performance and greenhouse gas (GHG) emission assessments of wastewater treatment facilities.
| Evaluation Instruments | Goal or Targeted Aspects | Analyzed Impacts | References |
|---|---|---|---|
| Carbon footprint | Direct and indirect GHG emissions of two model WWTPs (with anaerobic digestion and simultaneous aerobic sludge stabilization) | CO2 emissions | [13] |
| Incorporation of carbon footprint and GHG quantification in MWWTP modelling | GHG emissions | [14] | |
| Evaluation of methane emissions from an MWWTP with sludge digestion | Methane emissions | [15] | |
| Minimizing N2O emissions and carbon footprint on a full-scale sequencing batch reactor | N2O emissions, carbon footprint | [16] | |
| GHG emissions from WWTPs: minimization, treatment, and prevention | GHG emissions | [6] | |
| Energy assessment | Evaluation of energy efficiency of a large WWTP | Energy efficiency | [17] |
| Water cycle viewed as a carrier of energy | Energy recovery | [18] | |
| Overview on evaluation of energy-use performance studies and methods for energy benchmarking | Energy efficiency | [19] | |
| Evaluation of the energy consumption in 14 MWWTPs | Energy efficiency | [20] | |
| Evaluation of the biogas energy potential of the anaerobic digestion of sludge generated in MWWTPs | Energy efficiency, CO2 emissions | [21] | |
| Analysis on energy consumption and recovery in MWWTPs (energy self-sufficient MWWTPs) | Optimization of energy efficiency | [22] |
Table 2.
Process outlines of the considered case studies (Ox, biological oxidation, N, nitrification, DN, denitrification, SS, secondary sedimentation; P.E., population equivalents).
Table 2.
Process outlines of the considered case studies (Ox, biological oxidation, N, nitrification, DN, denitrification, SS, secondary sedimentation; P.E., population equivalents).
| No. | MWWTP | Plant Size (Hydraulic P.E.) | Type of Technology | Biogas Valorization | |
|---|---|---|---|---|---|
| Secondary + Tertiary Treatment | Disinfection | ||||
| 1 | A (IT) | 2,710,164 | DN + Ox, N, SS | x | x |
| 2 | B (IT) | 52,158 | Ox + DN, post-DN, SS | x | - |
| 3 | C (RO) | 609,601 | Ox, N, DN, SS | - | - |
| 4 | D (RO) | 524,158 | Ox, N, DN, SS | - | x |
Table 3.
Removal efficiencies of the selected indicators and maximum concentrations for discharging in natural water bodies.
Table 3.
Removal efficiencies of the selected indicators and maximum concentrations for discharging in natural water bodies.
| Indicators/WWTP | Removal Efficiency (%) | Maximum Allowable Concentration (M.A.C.) | |||
|---|---|---|---|---|---|
| A | B | C | D | ||
| COD | 95 | 87 | 95 | 92 | 125 mg O2/L |
| BOD5 | 98 | 93 | 91 | 94 | 25 mg O2/L |
| TSS | 96 | 83 | 93 | 93 | 35 mg/L |
| TN | 73 | 72 | 85 | 69 | 10 mg/L |
COD, chemical oxygen demand; BOD5, five-day biological oxygen demand; TSS, total suspended solids; TN, total nitrogen.
Table 4.
Service level indicators.
| Description/MWWTP | A | B | C | D |
|---|---|---|---|---|
| Serviced population (%) | 84.41 | 80.34 | 92.24 | 87.58 |
| Treated wastewater per person per day (L/serv.pop/day) | 277.38 | 428.75 | 360.46 | 396.85 |
| Collected wastewater treated (%) | 97.07 | 94.52 | 96.08 | 94.27 |
Table 5.
Comparison of energy performances of the considered case studies.
| COLLECTION | A | B | C | D | Unit |
|---|---|---|---|---|---|
| Energy consumption per conveying wastewater to treatment | 0.02 | 0 | 0 | 0.02 | kWh/m3 |
| Collected wastewater treated | 97.07 | 94.52 | 96.08 | 94.27 | % |
| TREATMENT | |||||
| Energy consumption per treated wastewater | 0.28 | 0.25 | 0.3 | 0.18 | kWh/m3 |
| Energy consumption per BOD5 mass removed | 1.36 | 1.51 | 1.92 | 0.98 | kWh/kg BOD5 removed |
| Energy production per mass removed | 0.11 | 0 | 0 | 0.04 | kWh/m3 |
| Electrical energy produced per total available energy in biogas | 86.62 | 0 | 0 | 100 | % |
| Biogas produced per mass removed | 0.1 | 0 | 0 | 0.11 | Nm3/kg BOD5 removed |
| DISCHARGE | |||||
| Energy consumption per discharged wastewater | 0 | 0 | 0 | 0 | kWh/m3 |
| Energy recovery per discharged water | 0 | 0 | 0 | 0 | kWh/m3 |
Table 6.
Evaluation of GHG reduction considering different scenarios: increase in serviced population and reduction of energy consumption.
Table 6.
Evaluation of GHG reduction considering different scenarios: increase in serviced population and reduction of energy consumption.
| MWWTP | A | B | C | D | ||||
|---|---|---|---|---|---|---|---|---|
| Untreated Wastewater | Kg CO2 Reduced | % | Kg CO2 Reduced | % | Kg CO2 Reduced | % | Kg CO2 Reduced | % |
| Serviced population (100%) | 3,860,747 | 6.54 | 65,979 | 11.43 | 792,845 | 3.83 | 1,015,918 | 5.1 |
| Energy consumption reduction (% of wastewater emissions) | ||||||||
| 10% | 2,478,474 | 4.2 | 27,767 | 4.81 | 1,248,805 | 6.04 | 784,759 | 3.94 |
| 15% | 3,717,711 | 6.3 | 41,650 | 7.22 | 1,873,208 | 9.06 | 1,177,139 | 5.91 |
| 20% | 4,956,949 | 8.4 | 55,534 | 9.62 | 2,497,611 | 12.08 | 1,569,519 | 7.88 |
© 2019 by the authors. Licensee MDPI, Basel, Switzerland. This article is an open access article distributed under the terms and conditions of the Creative Commons Attribution (CC BY) license (http://creativecommons.org/licenses/by/4.0/).
Share and Cite
MDPI and ACS Style
Fighir, D.; Teodosiu, C.; Fiore, S. Environmental and Energy Assessment of Municipal Wastewater Treatment Plants in Italy and Romania: A Comparative Study. Water 2019, 11, 1611. https://doi.org/10.3390/w11081611
AMA Style
Fighir D, Teodosiu C, Fiore S. Environmental and Energy Assessment of Municipal Wastewater Treatment Plants in Italy and Romania: A Comparative Study. Water. 2019; 11(8):1611. https://doi.org/10.3390/w11081611
Chicago/Turabian StyleFighir (Arsene), Daniela, Carmen Teodosiu, and Silvia Fiore. 2019. "Environmental and Energy Assessment of Municipal Wastewater Treatment Plants in Italy and Romania: A Comparative Study" Water 11, no. 8: 1611. https://doi.org/10.3390/w11081611
Note that from the first issue of 2016, this journal uses article numbers instead of page numbers. See further details here.