Article

Impact of Climate Change and Land-Use on the Propagation from Meteorological Drought to Hydrological Drought in the Eastern Qilian Mountains

1
College of Geography and Environment Science, Northwest Normal University, Lanzhou 730070, China
2
The Administrative Center for China’s Agenda 21, Beijing 100038, China
3
Shiyang River Basin Water Resources Bureau of Gansu Province, Wuwei 733000, China
4
College of Social Development and Public Administration, Northwest Normal University, Lanzhou 730070, China
5
State Key Laboratory of Cryosphere Science, Northwest institute of Eco-Environment and Resources, Chinese Academy of Sciences, Lanzhou 730070, China
6
Gansu Engineering Research Center of Land Utilization and Comprehension Consolidation, Lanzhou 730070, China
*
Authors to whom correspondence should be addressed.
Water 2019, 11(8), 1602; https://doi.org/10.3390/w11081602
Submission received: 1 July 2019 / Revised: 24 July 2019 / Accepted: 30 July 2019 / Published: 2 August 2019
(This article belongs to the Special Issue Global Changes in Drought Frequency and Severity)

Abstract

:
As one of the most destructive and costly natural disasters, drought has far-reaching negative effects on agriculture, water resources, the environment, and human life. Scientific understanding of propagation from meteorological to hydrological drought is of great significance for accurate forecasting of hydrological drought and preventing and mitigating drought disasters. The objective of this study is to analyze the spatio-temporal variational characteristics of propagation from meteorological drought to hydrological drought and the associated driving mechanisms in the eastern Qilian Mountains using the standard precipitation index (SPI), standardized runoff index (SRI), and drought propagation intensity index (DPI). The results show that there has been meteorological humidification and hydrological aridification in the upper reaches of the Shiyang River Basin over the last 56 years; especially in the 2000s, the intensity of hydrological drought was the strongest and the intensity of meteorological drought was the weakest, indicating the propagation intensity of meteorological drought to hydrological drought was extremely strong during this period. The changes of meteorological and hydrological dry–wet are different, both on seasonal and monthly scales. The meteorological dry–wet is shown to have had a significant effect both on the current and month-ahead hydrological dry–wet, where the one-month lag effect was most obvious. The relationship between meteorological and hydrological droughts also vary in space: Hydrological aridification in the Huangyang River, and the rivers east of it, was greater than that in the western tributaries. The drought propagation intensities from west to east showed a decreasing trend, excluding the Huangyang River. Climate and land-use changes are the main factors affecting the propagation from meteorological drought to hydrological drought. When the natural vegetation area accounted for between 76.3–78%, the cultivated land area between 0.55–3.6% and the construction area between 0.08–0.22% were a peer-to-peer propagation process from meteorological drought to hydrological drought in the upper reaches of the Shiyang River.

Graphical Abstract

1. Introduction

As one of the most destructive and costly natural disasters, drought has far-reaching negative effects on agriculture, water resources, the environment, and human life [1,2]. With climate change, especially with the impact of extreme climate conditions [3], the frequencies and durations of major drought events have increased over the past decade [4]. An assessment of drought and desertification from the Intergovernmental Panel on Climate Change (IPCC) showed that aridification around the world is likely to continue through the next 30–50 years, leading to adverse effects on ecosystems and sustainable development [5,6]. Therefore, it is of great significance to explore the mechanisms of drought propagation and understand the occurrence of drought in guiding the rational distribution of the industrial economy, preventing and reducing disasters [7] and informing the decisions of decision-makers in the fields of hydrology, ecology, agriculture, and water resources, and so on [8].
The American Meteorological Society classifies drought into four types: meteorological drought, hydrological drought, agricultural drought, and socio-economic drought [9]. Among the four drought types, meteorological drought is the cause of the other three drought types. Hydrological drought is the secondary stage of natural drought development [10] and, as an intermediate link, it directly affects agricultural drought and socio-economic drought [11,12]. Therefore, meteorological drought is the foundation of drought, and hydrological drought is the link and bridge for the other types of drought. The drought index is an indispensable basic tool for drought detection, monitoring, and impact assessment [13,14] and is usually used to determine moisture status and degree of water shortage [15]. According to the statistics of the World Meteorological Organization, there are as many as 55 commonly used drought indexes, such as Standardized Precipitation Index (SPI) and Standardized Runoff Index (SRI), and so on [4]. Among these, the SPI was proposed by McKee in 1993 to study drought in Colorado, USA. Due to its simple calculation, multiple time scales, better reflection of drought intensity, and higher sensibility to drought changes, SPI has been popularized by the World Meteorological Organization and applied globally [16], and can well assess climate drought and can intuitively reflect the impact of precipitation on drought. The SRI was proposed by Shukla and Wood in 2008, and its concept was based on the concept of SPI [17]. Shao concluded that the evaluation results of drought and flood by SRI had a good consistency and certain applicability in different climatic regions [18], and could very well evaluate hydrological drought. Up to now, drought indices have become an important means for many scholars to study drought conditions, and some meaningful results have been achieved [19,20,21,22,23,24]. Using the standardized indexes of meteorological and hydrological drought to discuss the internal correlation between them can help us to better understand the propagation processes and formation mechanisms of the water cycle, and also may aid in forming more complete basic theories of drought monitoring [25]. Relevant studies have shown that most hydrological droughts lag behind meteorological droughts, but the lag characteristics have obvious spatial heterogeneity [26,27]. Moreover, on the monthly to quarterly scale, SRI is a useful supplement to SPI’s description of drought [28]. However, to date, the related studies have mainly focused on meteorological drought with a single index, and a few have focused on hydrological drought, especially the relationships between hydrological drought and meteorological drought response, resulting in an unclear understanding of the propagation process of meteorological drought to hydrological drought and its influencing factors.
The Shiyang River Basin is located in the transition zone of the Inner Mongolia Plateau, Loess Plateau, and Qinghai-Tibet Plateau and, located at the edge of a monsoon region, is a sensitive area to ecological environment change [29,30]; It is also one of the most densely populated basins of the inland river basins of China, with the highest degree of water resource development and utilization and the most serious ecological environmental problems [31]. Special geographical conditions and climatic characteristics have determined that the Shiyang River Basin is a region with frequent droughts [32]. Its upstream originates from the Eastern Qilian Mountains, which is the water conservation area in the Shiyang River Basin and is, also, a typical ecologically fragile area with higher sensitivity to global warming. Under the background of global change, a change in the hydrological cycle process in the Qilian Mountains (i.e., in the upper reaches of the Shiyang River) not only affects ecological security in the upper reaches but also directly affects the healthy development of social economy in the oasis of the middle and lower reaches of the Shiyang River. Based on this, three issues to be studied in this paper as follows: (1) The spatial and temporal characteristics of meteorological drought propagating to hydrological drought in the eastern part of Qilian Mountains in the past 56 years; (2) The mechanism of the impacts on climate and land-use change on meteorological drought propagating to hydrological drought; and (3) The threshold of land-use structure on the peer-to-peer propagation from meteorological drought to hydrological drought. The research results will further improve the related theories of meteorological drought propagating to hydrological drought and provide scientific support for drought monitoring and prediction.

2. Materials and Methods
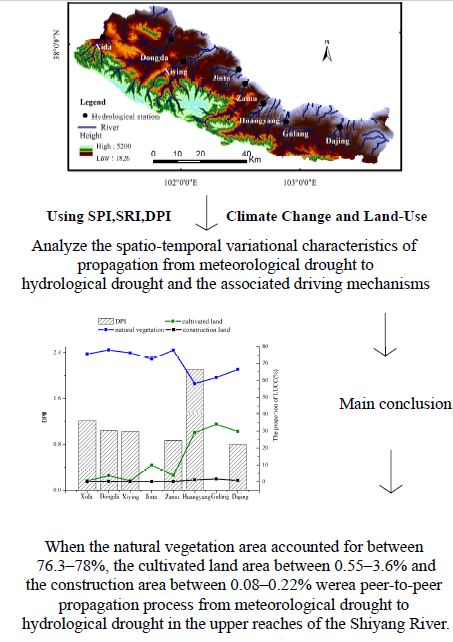
2.1. Study Area

The upper reaches of the Shiyang River (101°41′–103°48′ E and 36°29′–38°18′ N) originate from the northern slope of Lenglongling, eastern Qilian Mountains, with the elevation being 2000–5031 m and a total area of about 11,550 km2 (Figure 1). The mountain range runs from northwest to southeast. From east to west, the upper reaches of the Shiyang River are composed of eight tributaries—the Dajing River, the Gulang River, the Huangyang River, the Zamu River, the Jinta River, the Xiying River, the Dongda River, and the Xida River—and several small ditches and rivers. The climate is alpine, semi-arid, and semi-humid, with precipitation ranging from 400–600 mm and potential evaporation ranging from 880–1000 mm. The upper reaches of the Shiyang River are similar to those of other arid inland rivers, with precipitation and melted alpine ice and snow as the main water sources [33]. The main land-use types in the basin are natural vegetation (grassland and woodland), cultivated land, construction land, water areas, and unused land. From 1986 to 2016, the area of natural vegetation (grassland and woodland) and water areas in the upper reaches of the Shiyang River showed a first decreasing and then increasing trend; whereas, the area of cultivated land showed the opposite trend, and the area of construction land continued to increase. Spring wheat is the main commodity grain in the Shiyang River Basin.

2.2. Data Sets

2.2.1. Meteorological Data

The monthly precipitation, monthly mean temperature, daily maximum temperature, and daily minimum temperature data were all derived from the China Meteorological Data Network. The monthly surface precipitation data from 1961–2016 were given as 0.5° × 0.5° grid data. The upper reaches of the Shiyang River occupied 13 grid points. Each tributary occupied multiple grid points, and the meteorological data of the eight tributaries were calculated by weighting the proportion of area in each grid point of each tributary.

2.2.2. Runoff Data

The monthly flow data of the eight tributaries in the upper reaches of the Shiyang River, from 1961–2016 were obtained from electronic data provided by the Shiyang River Basin Administration and the Water Resources Bulletin of the Shiyang River Basin. Table 1 shows the hydrological station information. Among the tributaries, the Gulang River lacked monthly flow data from 1961–1988, and the Jinta River lacked monthly flow data from 1961–1975. For the accuracy of the results, the data were not interpolated artificially.

2.2.3. Land-Use Data

Landsat/TM remote sensing image data from the United States was received by the China Remote Sensing Satellite Ground Station, with a resolution of 30 m, orbital numbers 131-33, 132-33, 131-34, and 132-34, and with data acquisition time from June to September, using remote sensing images with less cloudiness and better quality in 1986, 2000, and 2015. ArcGIS 10.4 software was used to interpret remote sensing images by an artificial visual method.

2.3. Methods

2.3.1. Standardized Precipitation Index (SPI) and Standardized Runoff Index (SRI)

As precipitation distribution is a skewed distribution [34], McKee selected the Γ probability distribution to describe the change of precipitation when proposing SPI, and then calculated the SPI value by normalization. For the specific calculation steps of SPI, refer to the literature [35]. SPI has multiple time scales, and the SPI at different time scales reflect different drought and flood situations. SPI3 can accurately identify short-term meteorological drought and flood and has a high correlation with agricultural droughts. SPI12 is an accurate indicator of long-term drought and flooding and their durations and is usually highly correlated with rivers, reservoirs, and groundwater levels [36,37]. Therefore, SPI1, SPI3, and SPI12 were selected to analyze the monthly, seasonal, and annual dry–wet. Kingtse (2008) considered that SRI can be calculated by imitating SPI [17]. Shao calculated the SRI by using the calculation method of SPI, which proved that the calculated SRI was correct and could be used in the study of drought and flood identification and its evolution process [18].
The SPI and SRI drought grades were classified based on previous studies [38,39,40] and the situation of the Shiyang River Basin, as shown in Table 2.

2.3.2. Time-Delay Correlation Coefficient

The time-delay correlation analysis method was used to calculate the time-delay. This method is applied to the correlation analysis of a finite discrete time-series. It considers the time lag of interaction between different time series elements; that is, if there exists a reaction delay process. The procedure for calculating the time-delay correlation coefficient may be found in [26].

2.3.3. Potential Evaporation Calculation Model

Potential evaporation (ET0) is usually calculated by mechanism models in the world. There are dozens of calculation models, among which the Penman model, Thornthwaite model, Selianinov model, and Hargreaves formula (H formula) are the most commonly used [41]. Revised and corrected for many years, the Penman model can fully analyze the influencing factors by integrating the characteristics of turbulent energy transfer, energy balance, and physiological characteristics of vegetation [42]. According to a comparative study between the United States and the European Union, the Penman model was relatively accurate with respect to dry–wet and, so, it has been widely used globally [43,44]. However, the Penman model needs a lot of meteorological data. For an ET0 calculation in the case of a lack of meteorological data, the United Nations Food and Agriculture Organization (FAO) recommended the H formula to estimate ET0. However, a large number of research results have shown that there were deviations in calculating ET0 in different regions with the H formula and, so, the results must be corrected when applying the formula in a certain region [45].
Based on the daily meteorological data of the Wushaoling Meteorological Station in the upper reaches of the Shiyang River from 1961–2016, ET0-P and ET0-H were calculated by the P-M formula and H formula, respectively, and a regression model between them was established. Then, it was corrected using the regression model of [46], the ET0-H was calculated by the H formula based on grid data, and then the precise potential evaporation in the study area was obtained.

2.3.4. Drought Propagation Intensity Index (DPI)

In order to quantitatively express the propagation process of meteorological drought to hydrological drought, an index of drought propagation intensity was constructed, and its calculation formula is as follows:
DPI = HA MA ( MA 0 ) .
In this formula, DPI is the drought propagation intensity index, HA is the hydrological drought intensity over a certain period of time, and MA is the meteorological drought intensity over a certain period of time. Drought intensity refers to the average value of SPI or SRI in a drought year.
The direction of drought propagation is defined as meteorological drought to hydrological drought. When the DPI is greater than 1, hydrological drought is greater than meteorological drought, and the intensity of the meteorological drought propagating to hydrological drought is strong. When the DPI is less than 1, hydrological drought is less than meteorological drought, and the intensity of meteorological drought propagating to hydrological drought is weak. When the intensity index of drought propagation is equal to 1, there is a peer-to-peer propagation from meteorological drought to hydrological drought. According to the classification of SPI and SRI, combined with the DPI in the upper reaches of the Shiyang River, the DPI was classified, as shown in Table 3.

3. Results

3.1. Interannual and Interdecadal Response Characteristics

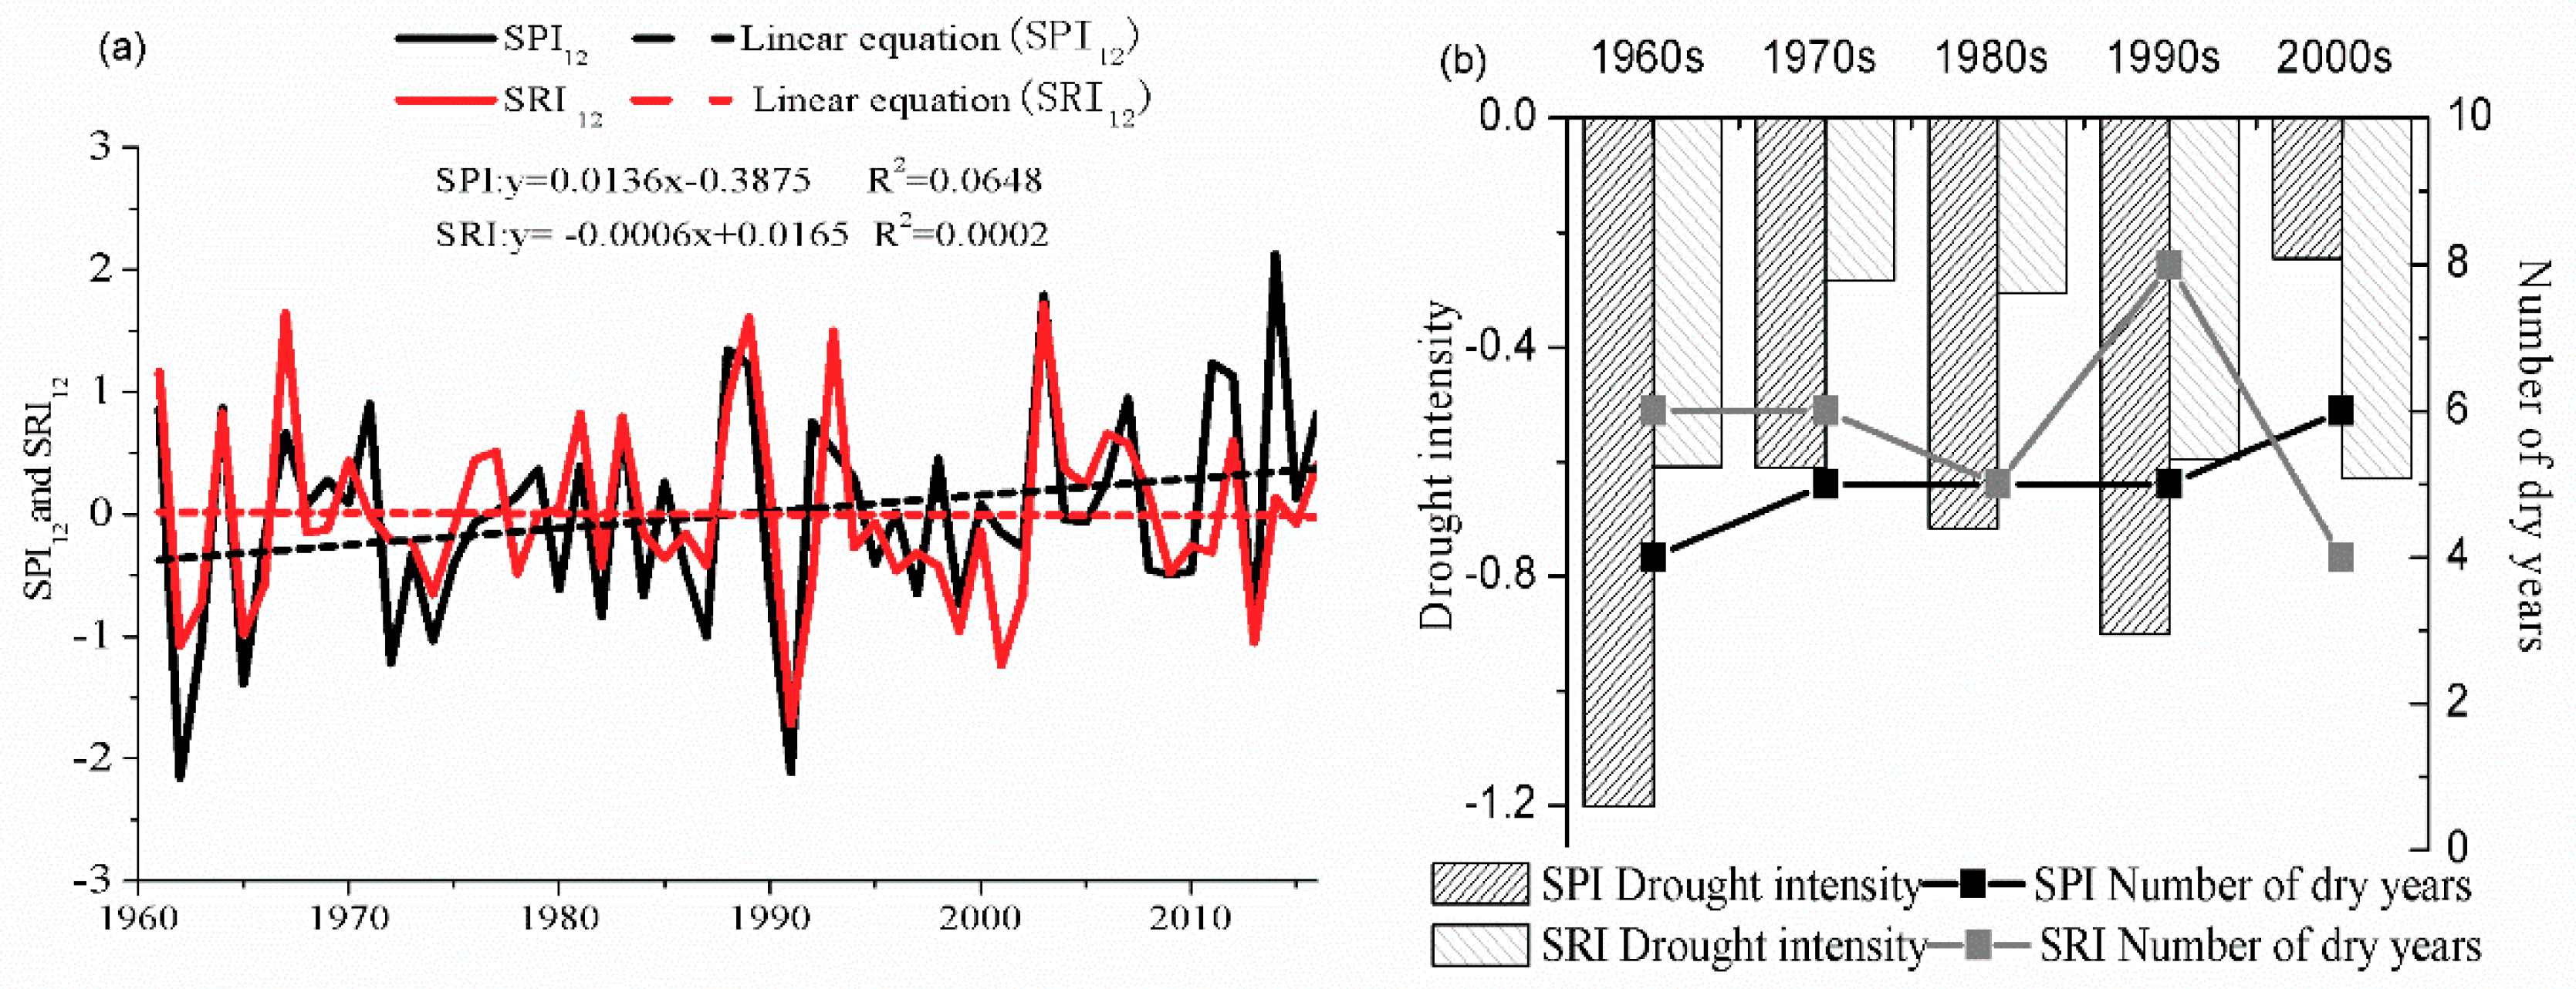
3.1.1. Response of Hydrological Drought to Upstream Meteorological Drought

The values SPI12 and SRI12 in the upstream, from 1960–2016, were calculated as the annual scale drought indicators, and their variation characteristics were analyzed.
As can be seen from Figure 2a, on an annual scale: (1) the upper reaches of the Shiyang River showed meteorological humidification and hydrological aridification, (2) the correlation coefficient between SPI12 and SRI12 was 0.69 (p < 0.01), and there was a significant positive correlation between SPI12 and SRI12, but there were differences in the degree of correlation between SPI12 and SRI12 in different periods, especially in 2010–2016 (except in 2013), where the obvious meteorological humidification did not create obvious hydrological humidification; (3) the coefficients of variation of SPI12 and SRI12 were 0.4001 and 0.4223, respectively; that is, the fluctuation degree of meteorological dry–wet is less than that of hydrological dry–wet. Among these, from 1961 to 2016, both SPI12 and SRI12 had the similar periodic fluctuation characteristics of intense (1960s)–gentle (late 1970s–1980s)–intense (late 1980s–early 1990s)–gentle (mid-late 1990s–early 2000s), with the most intense fluctuation around 1990; (4) Before the end of the 1990s, the degree of meteorological drought was greater than that of hydrological drought but, after 2000, it was the opposite case. Both 1962 and 1991 were extreme meteorological drought years, and there was no extreme meteorological year after the end of the 1990s; 1991 was the worst year for hydrological drought, with severe drought; there was no extreme hydrological drought year.
Interdecadal changes can better illustrate the stages and persistence characteristics of meteorological and hydrological droughts in the upper reaches of the Shiyang River. In order to further illustrate the characteristics of meteorological drought propagation to hydrological drought, the number of drought years was counted and the average values of SPI12 and SRI12 in the drought years were calculated.
As shown in Figure 2b, (1) the number of meteorological drought years increased gradually and the intensity of meteorological drought experienced three stages: weakening (1960s–1970s), strengthening (1970s–1990s), and, again, weakening (1990s–2000s); the number of hydrological drought years experienced a process of decrease (1960s–1980s), increase (1980s–1990s), and decrease (1990s–2000s). The intensity of hydrological drought has gradually increased since the 1970s, and the 2000s was the era with the strongest hydrological drought intensity and the weakest meteorological drought intensity. (2) In the 1960s, 1970s, 1980s, and 1990s, the intensity of hydrological drought was less than the meteorological drought, where the DPI were 0.5, 0.46, 0.42, and 0.66, respectively; so, the intensity of meteorological drought propagating to hydrological drought was extremely weak, and the number of hydrological drought years in each decade was greater than or equal to the number of meteorological drought years. After entering into the 21st century, the intensity of hydrological drought was greater than that of meteorological drought, with the highest DPI being 2.56, so the intensity of meteorological drought propagating to hydrological drought was extremely strong, and the number of hydrological drought years was less than that of meteorological drought years. On the whole, the average DPI over the past 56 years was 0.68, and the intensity of meteorological drought propagating to hydrological drought was weak. In each decade where the intensity of meteorological drought was greater than that of hydrological drought, the number of meteorological drought years was less than that of hydrological drought years. When the intensity of meteorological drought is less than that of hydrological drought, the number of meteorological drought years was more than that of hydrological drought years.

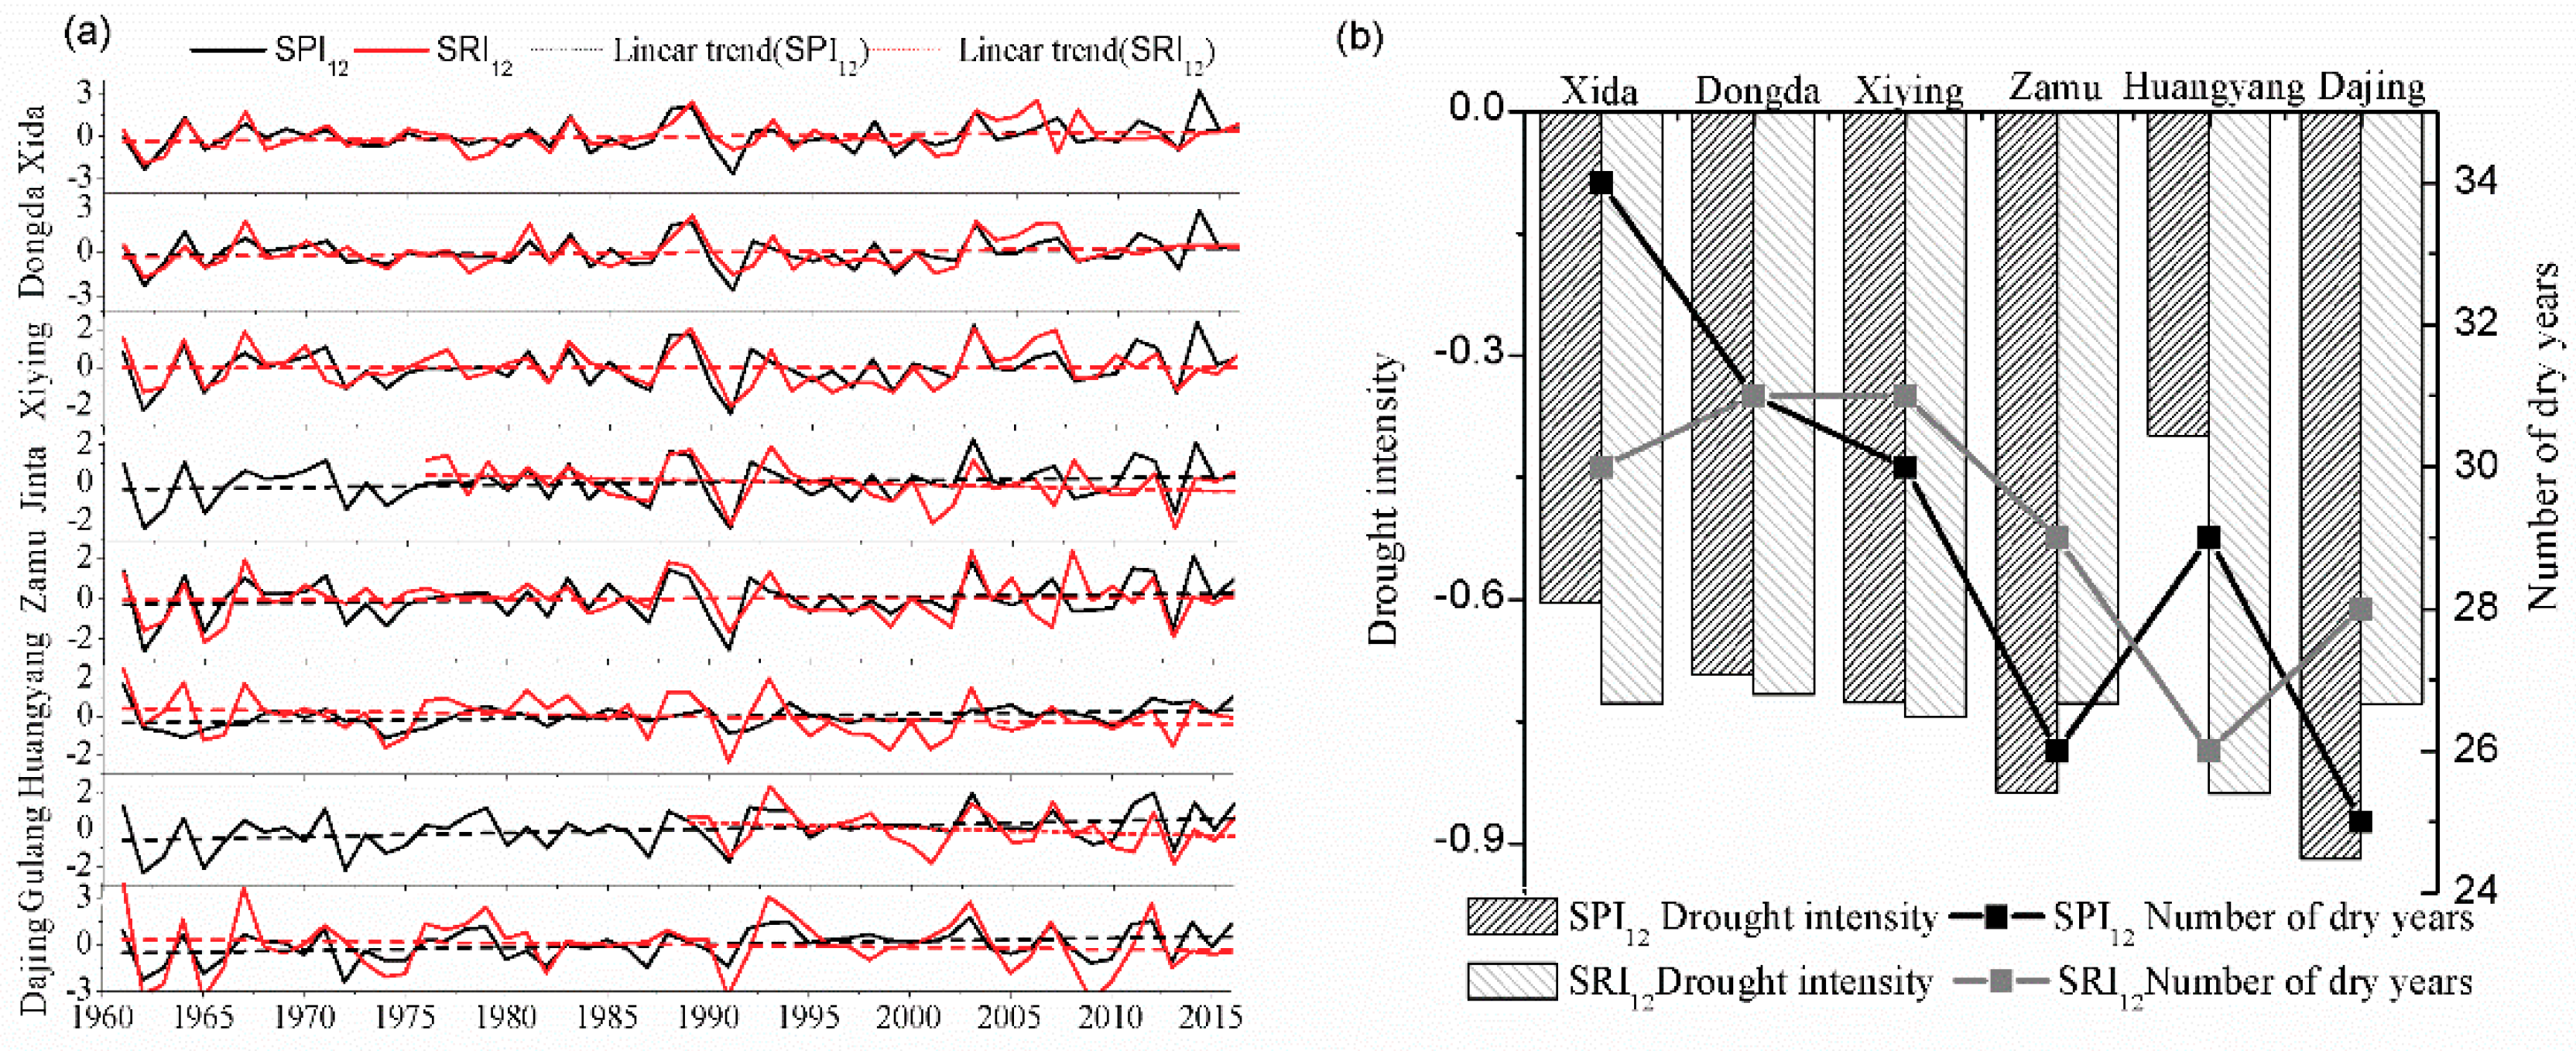
3.1.2. Response of Hydrological Drought to Meteorological Drought in Different Tributaries

The values SPI12 and SRI12 for the eight tributaries, from 1960–2016, were calculated as annual scale drought indicators, and their variation characteristics were analyzed.
The results are shown in Figure 3a and are as follows: (1) meteorological humidification and hydrological aridification were shown in the Xiying River and the rivers east of it, which are those upstream of it; whereas meteorological and hydrological humidification were seen in the rivers to the west of the Xiying River. Moreover, the hydrological aridification of the Huangyang River and the rivers east of it was greater than that of the western rivers, and the aridification of the Huangyang River was the most obvious (Figure 3a, Table 4). (2) The approximate periodic fluctuations of SPI12 and SRI12 for the eight tributaries were consistent with the upstream (Figure 3a). Among them, the meteorological dry–wet fluctuations of the Huangyang River and the rivers east of it were greater than their hydrological dry–wet fluctuations, while the meteorological dry–wet fluctuations of the rivers west of the Huangyang River were less than their hydrological dry–wet fluctuations. The hydrological dry–wet fluctuations of the Huangyang River and the rivers east of it were less than that of the rivers west of the Huangyang River, and the meteorological dry–wet fluctuations were greater than that in the rivers west of Huangyang River (Table 4). (3) The values of SPI12 and SRI12 in the eight tributaries had significant positive correlations, and that of the Xiying River had the strongest correlation, while that of the Huangyang River was the weakest (Table 4). (4) After the 1990s, the characteristics of the hydrological drought intensity were greater than those of the meteorological drought intensity most obviously for the Huangyang River (Figure 3a).
In order to analyze the spatial characteristics of meteorological drought propagating to hydrological drought, the average values of SPI12 and SR12 and the number of drought years in each tributary, from 1961–2016, were calculated.
According to Figure 3b, the number of years of meteorological drought and hydrological drought, from the west to the east, of the six tributaries was gradually decreasing, and the intensity of meteorological drought gradually increased (except for Huangyang River). The hydrological drought intensity of Huangyang River was the most serious and the meteorological drought intensity was the smallest. Combined with Figure 6, it can be seen that there were obvious spatial differences in the intensity of meteorological drought propagating to hydrological drought. Except for the Huangyang River, the DPI gradually decreased from west to east. Among the tributaries, the hydrological drought intensities of the Zamu and Dajing Rivers were less than that of meteorological drought, with the DPI being 0.87 and 0.79, respectively (indicating that the intensity of meteorological drought propagating to hydrological drought were moderately weak and severely weak, respectively), and the number of hydrological drought years were more than that of meteorological drought years. The hydrological drought intensities of the other tributaries were greater than the meteorological drought intensities. The DPI of the Dongda and Xiying Rivers were 1.03 and 1.02, respectively, which were very close to peer-to-peer propagation. The DPI of the Xida and Huangyang Rivers were 1.2 and 2.1, respectively, indicating that the intensities of meteorological drought propagating to hydrological drought were moderately strong and extremely strong, respectively, and that the number of hydrological drought years was less than that of meteorological drought years.

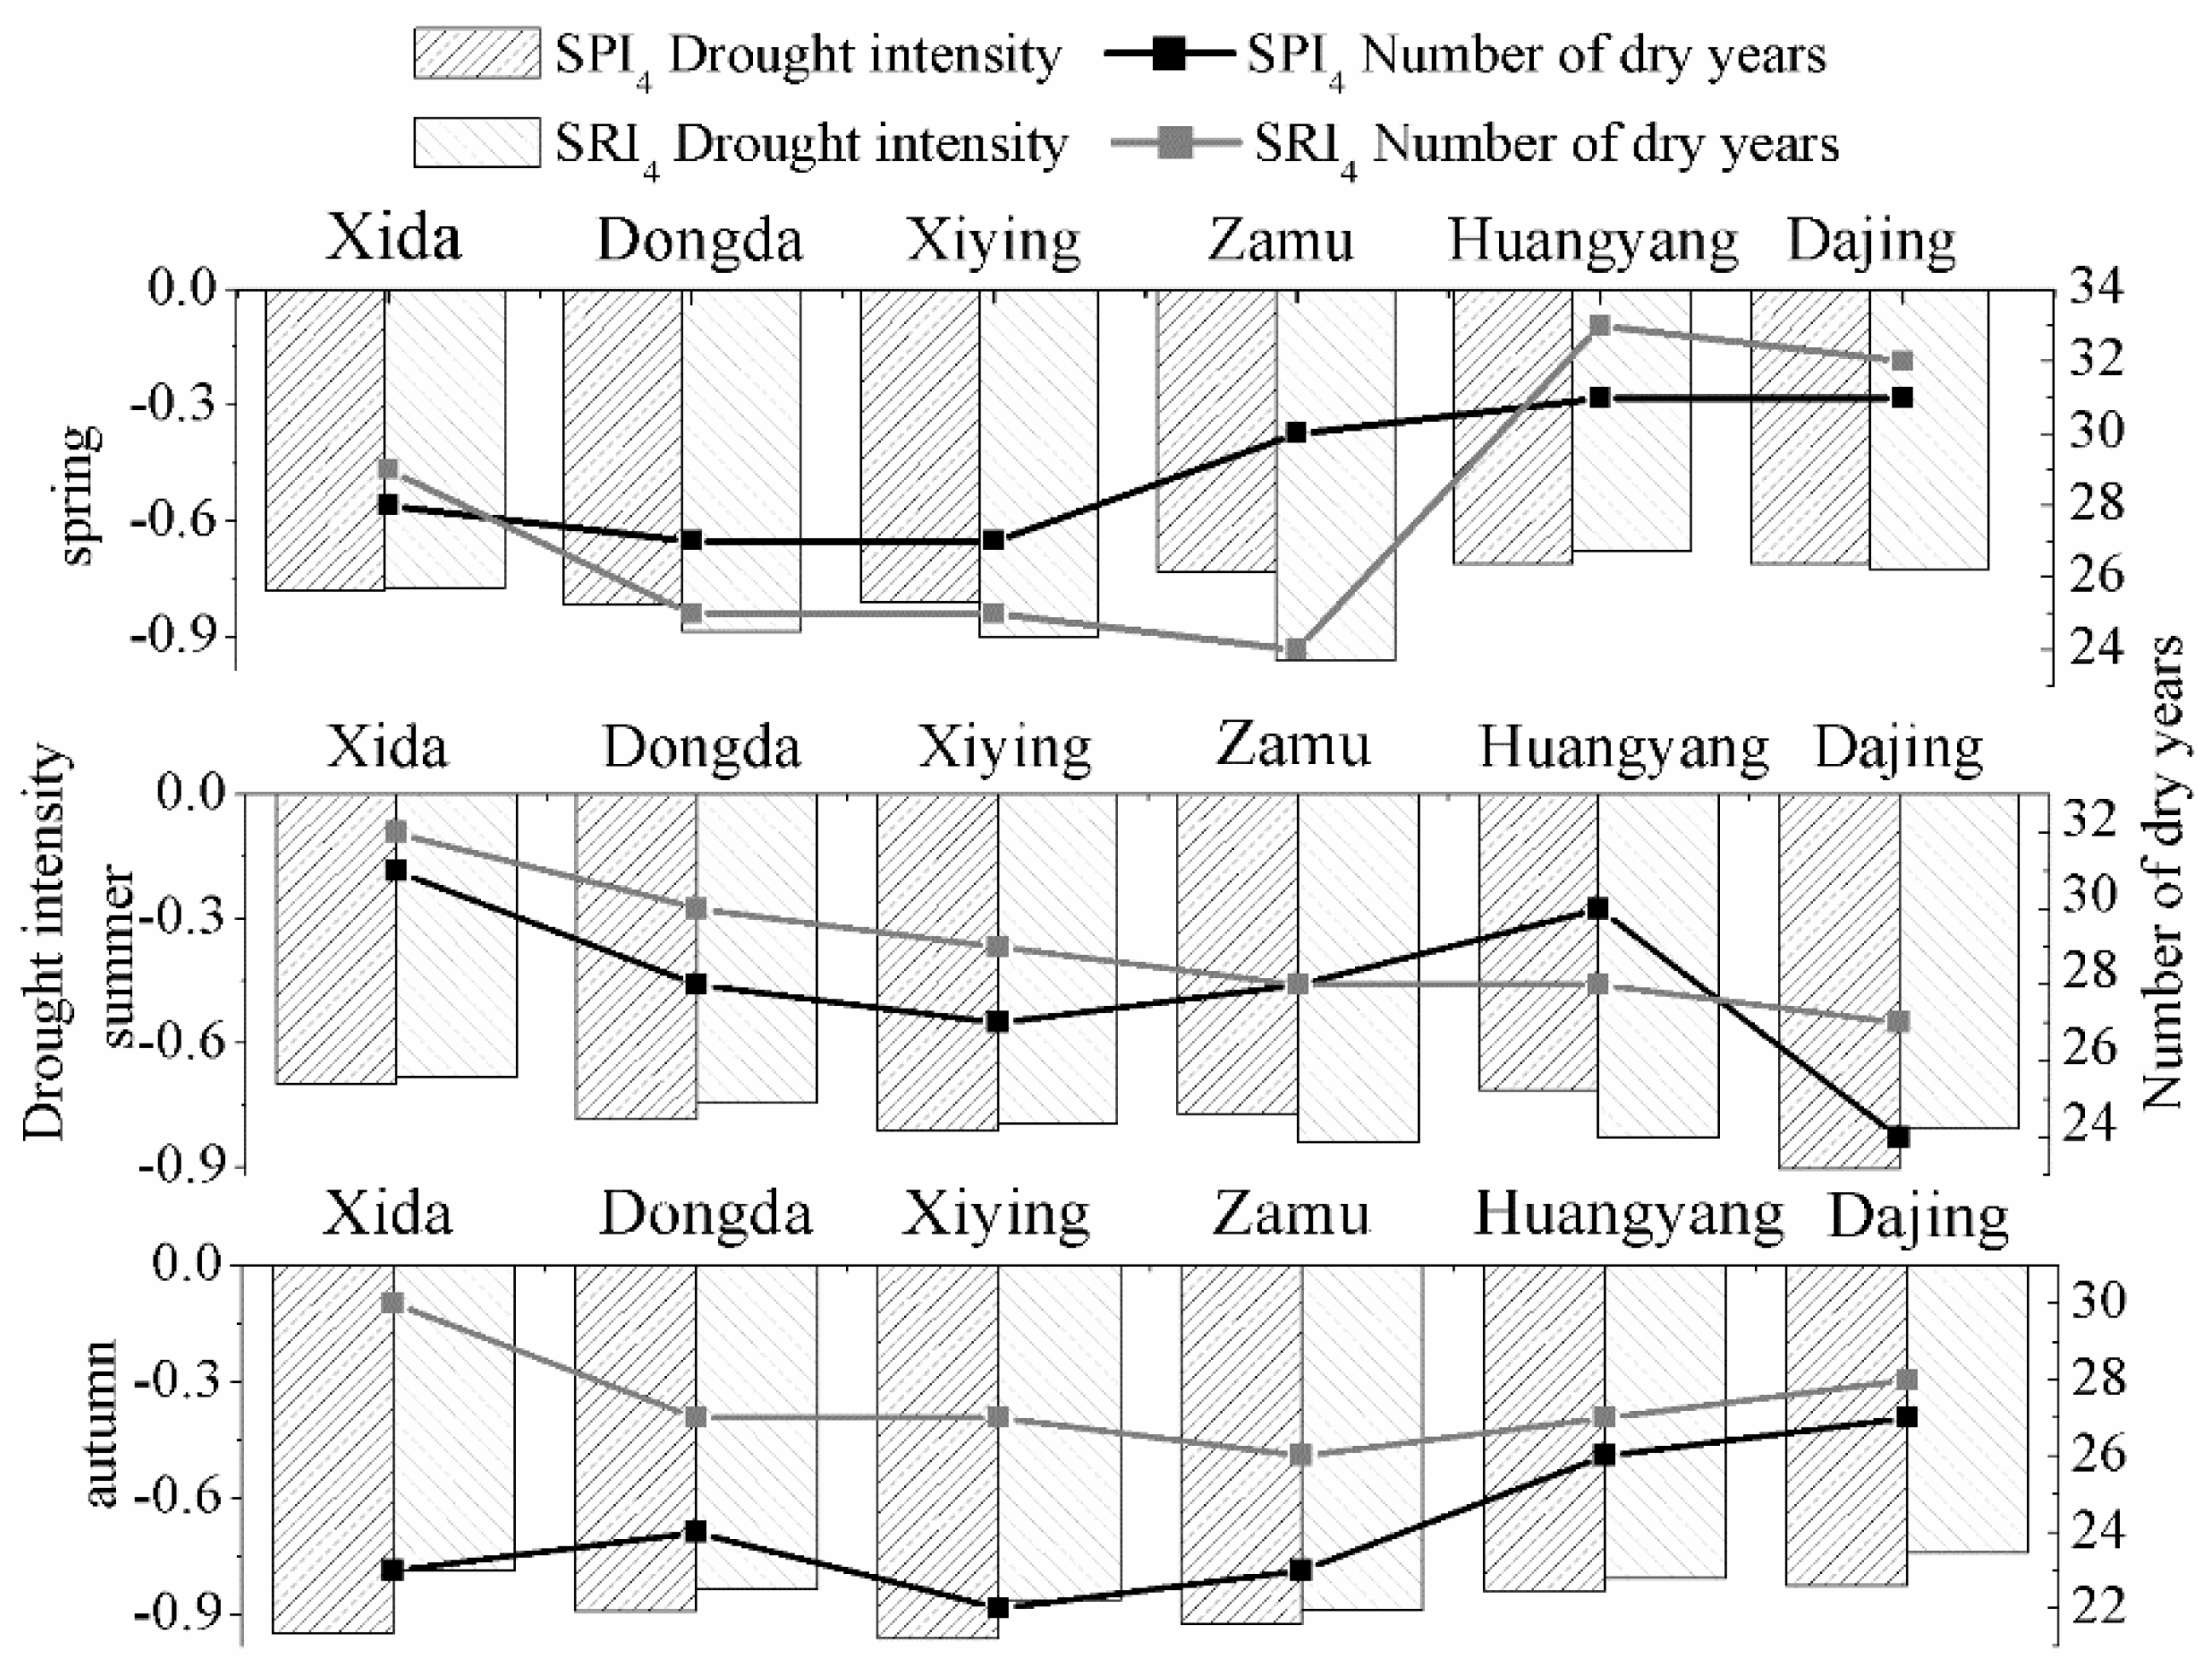
3.2. Seasonal Response Characteristics

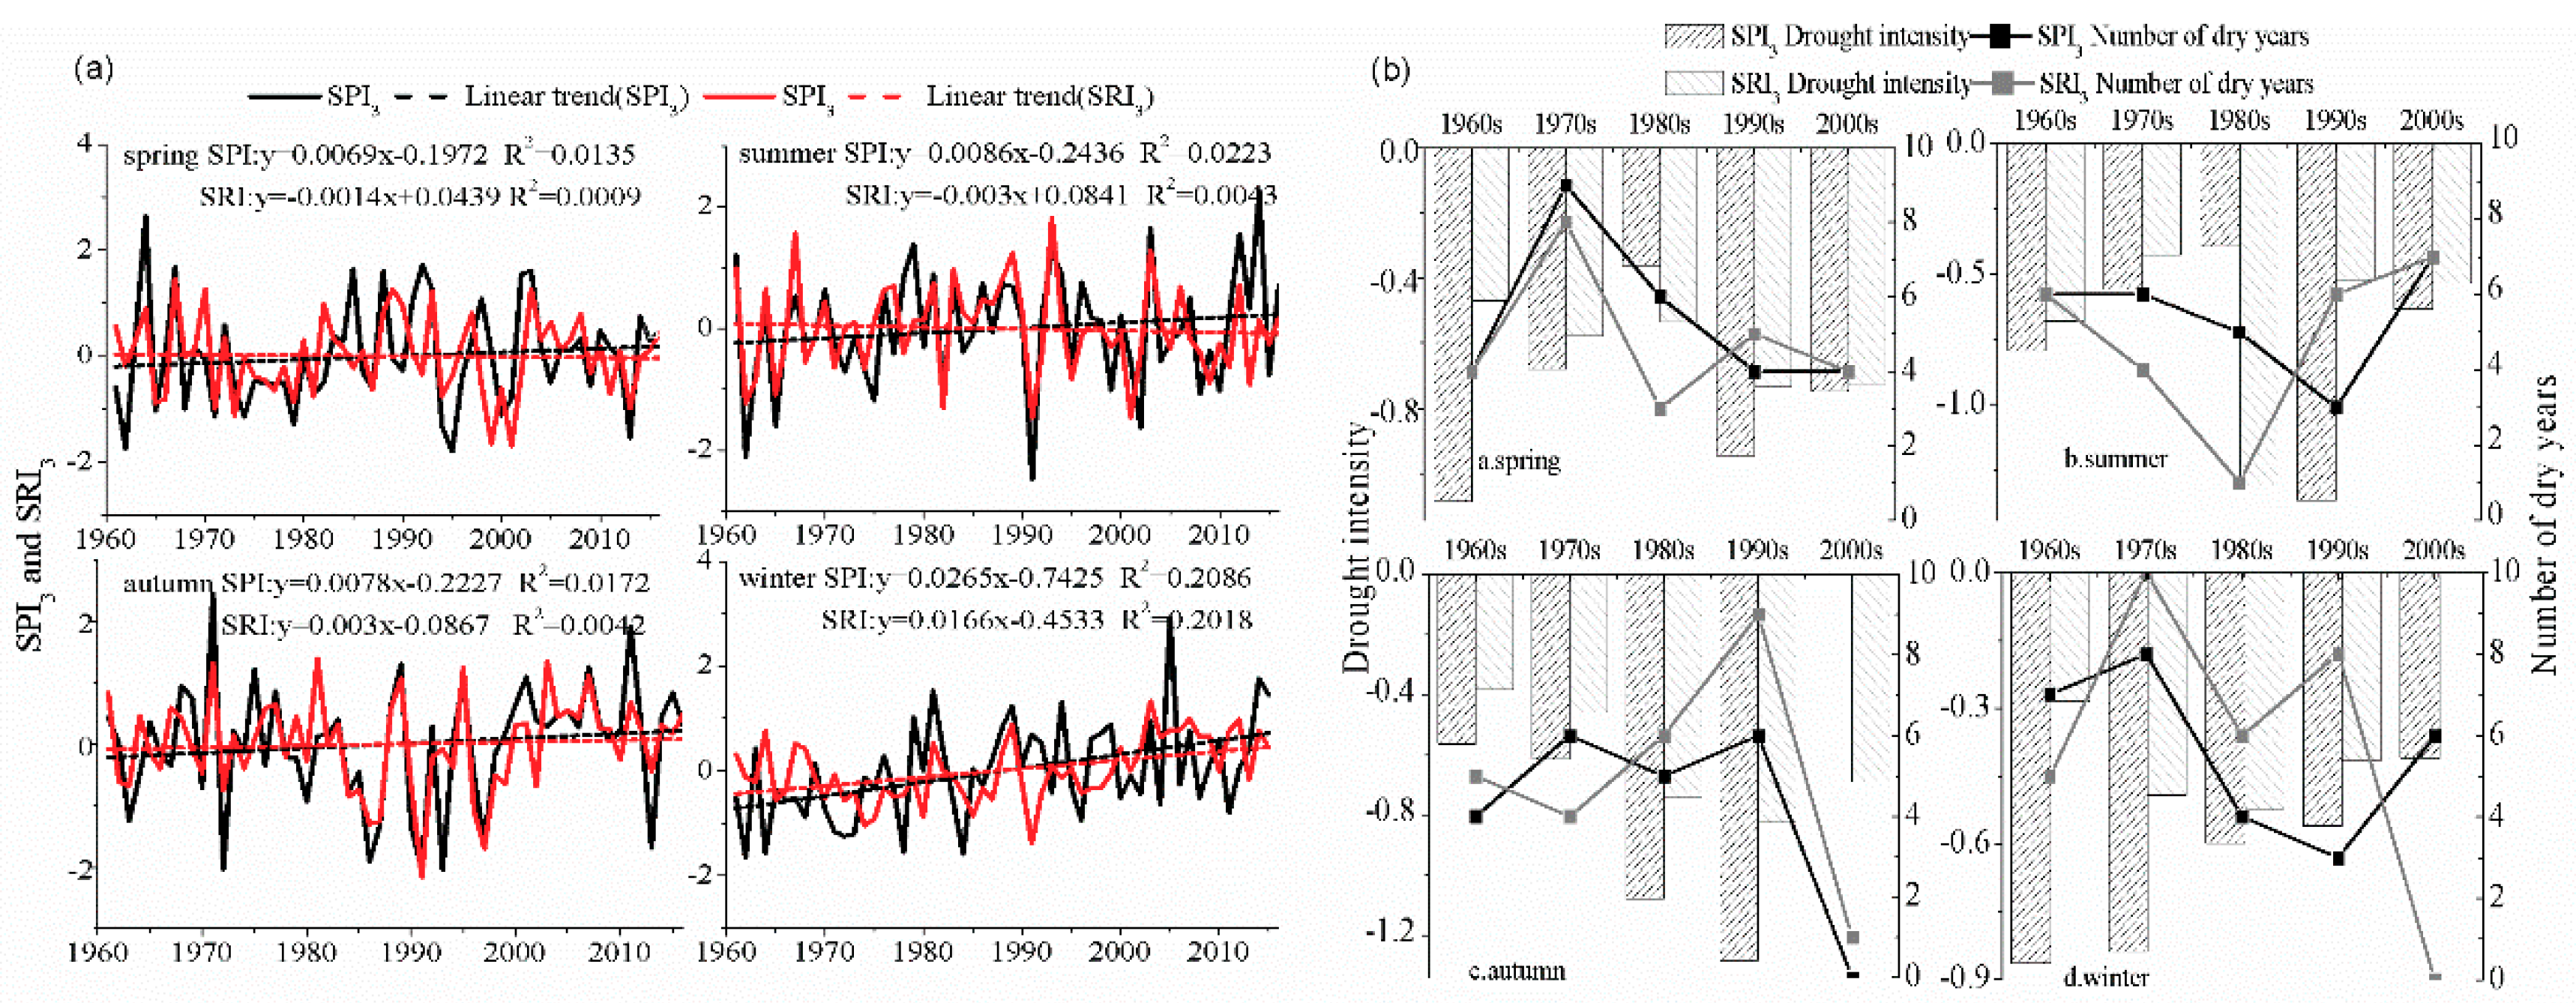
3.2.1. Response of Hydrological Drought to Meteorological Drought in the Upstream

The values of SPI3 and SRI3 in the upper reaches of the Shiyang River, from 1960–2016, were calculated as seasonal drought indicators, and their variational characteristics were analyzed.
On the seasonal scale, the results are as follows, as shown in Figure 4a: (1) Meteorological humidification and hydrological aridification occurred in spring and summer. In autumn and winter, there was meteorological and hydrological humidification (Figure 4a). (2) Except for in summer, the meteorological dry–wet fluctuations were greater than hydrological dry–wet fluctuations (Table 5). (3) There was no extremely dry year in spring and winter; the years with extreme drought in autumn were the most numerous, of which three were extremely meteorological dry years (1972, 1991, and 1993) and one was an extremely hydrological dry year (1991). There were two extremely meteorological dry years in summer (1962 and 1991), and no extremely hydrological dry year (Figure 4a). (4) There was a significant correlation between SPI3 and SRI3 in spring, summer, and autumn, in which the correlation between SPI3 and SRI3 was the strongest in autumn, followed by summer and spring (Table 5); there was no significant correlation between SPI3 and SRI3 in winter. The low correlation between SPI3 and SRI3 in spring is mainly affected by the melt-water of ice and snow, as well as agriculture. Spring wheat is the main agricultural grain in the upper reaches of the Shiyang River, and the key water source for crop cultivation is the interception of runoff in spring. SRI3 in winter is closely related to SPI3 in summer and autumn (Table 5), mainly due to the fact that the runoff of rivers in winter is mainly recharged by groundwater, which is less affected by solid precipitation in that season, while the amount of groundwater in winter is closely related to the recharge of groundwater by precipitation in summer and autumn.
Combining seasonal interdecadal drought characteristics (Figure 4b) and DPI (Table 6), we can see that: (1) Over the past 56 years, the intensity of meteorological drought propagating to hydrological drought in spring and summer was weak, while that in autumn and winter was extremely weak; that is to say, the intensity of meteorological drought propagating to hydrological drought in spring and summer was greater than that in autumn and winter. The intensities of hydrological drought in spring and summer in the 1980s and autumn in the 2000s were greater than those of meteorological drought, and the DPI was greater than 1.4, indicating that the intensity of meteorological drought propagating to hydrological drought was extremely strong. In other years, the intensity of hydrological drought was less than that of meteorological drought and the DPI was less than 1, indicating that the intensity of meteorological drought propagating to hydrological drought was weak. (2) On the whole, the number of meteorological drought years in spring and summer was more than that of hydrological drought years, while the number for autumn and winter shows the opposite case. The number of meteorological and hydrological drought years in spring, autumn, and winter increased first and then decreased, and the number of meteorological and hydrological drought years in summer decreased first and then increased. The number of years of hydrological drought after the 1990s, in spring and summer, was more than or equal to the number of years of meteorological drought.

3.2.2. Response of Hydrological Drought to Meteorological Drought in Different Tributaries

The SPI3 and SRI3 values of the eight tributaries of the upper Shiyang River, from 1960 to 2016, were calculated as drought indicators on a seasonal scale, and their variational characteristics were analyzed.
According to Table 7, SPI3 showed humidification in eight tributaries in each season. Among them, there was the most obvious meteorological humidification in the Dajing and Gulang Rivers. SRI3 shows different trends for different tributaries and seasons. The hydrological drought in the Xida River showed a weakening trend in all seasons, and hydrological drought in the Huangyang River showed an increasing trend. On the whole, the hydrological drought showed a trend of weakening in the western tributaries to increasing in the eastern tributaries. In summer and autumn, meteorological humidification and hydrological aridification of the Huangyang River and the rivers east of it were greater than that in the western tributaries of the Huangyang River.
In order to analyze the spatial characteristics of meteorological drought propagating to hydrological drought, the average values of SPI3 and SRI3 and the number of drought years in each tributary, from 1961–2016, were calculated. As there was no significant correlation between winter SPI and SRI, the winter drought characteristics of different tributaries were not analyzed.
As can be seen from Figure 5 and Figure 6: (1) In spring, the hydrological drought intensity was greater than meteorological drought in the Dongda, Xiying, Zamu, and Dajing Rivers, with respective DPI of 1.08, 1.01, 1.31, and 1.01, indicating that the intensity of meteorological drought propagating to hydrological drought was mildly strong, micro strong, extremely strong, and mildly strong, respectively. The hydrological drought intensities of the Xida and Huangyang Rivers were less than that of meteorological drought, with respective DPI of 0.99 and 0.95, indicating that the intensity of meteorological drought propagating to hydrological drought was mildly weak. The number of drought years in the six tributaries increased gradually, from west to east. Among them, the hydrological drought years of the Xida, Huangyang, and Dajing Rivers numbered more than meteorological drought years, while the other tributaries showed the opposite. (2) In summer, the hydrological drought intensities of the Zamu and Huangyang River tributaries were greater than those of meteorological drought. The respective DPI were 1.09 and 1.15, indicating that the intensities of meteorological drought propagating to hydrological drought were mildly strong and moderately strong, respectively. The hydrological drought intensities of the Xida, Dongda, Xiying, and Dajing Rivers were less than those of meteorological drought. The respective DPI were 0.97, 0.94, 0.98, and 0.89, indicating that the intensities of meteorological drought propagating to hydrological drought were mildly weak, mildly weak, mildly weak, and moderately weak, respectively. The number of meteorological and hydrological drought years in the six tributaries gradually decreased from west to east. Among all tributaries, except for the Zamu and Huangyang Rivers, the hydrological drought years numbered more than meteorological drought years. (3) In autumn, the hydrological drought intensities of all tributaries were less than those of meteorological drought. The respective DPI of the Xida, Dongda, Xiying, Zamu, Huangyang, and Dajing Rivers were 0.829, 0.937, 0.895, 0.962, 0.959, and 0.898, indicating that the intensity of meteorological drought propagating to hydrological drought was moderately weak, mildly weak, moderately weak, mildly weak, mildly weak, and moderately weak, respectively. The number of hydrological drought years decreased gradually, from west to east, while the number of meteorological drought years increased gradually, and the number of hydrological drought years of all tributaries was more than that of meteorological drought years.
According to Figure 6, in each of the time scales, the intensity of meteorological drought propagating to hydrological drought was weakest in autumn. Except for the Huangyang and Xida Rivers, the propagation from meteorological drought to hydrological drought had the strongest intensities in spring, and the intensity of meteorological drought propagating to hydrological drought, on the interannual scale, was the strongest in the Huangyang and Xida Rivers. On the seasonal scale, the Huangyang River had the strongest intensity of meteorological drought propagating to hydrological drought in summer; this happened for the other tributaries in spring.

3.3. Monthly Response of Hydrological Drought to Meteorological Drought

According to Table 8, on the monthly scale, at K = 0 and K = 1, the time-delay correlation coefficients of SPI1 and SRI1 in the upstream and its eight tributaries were larger and had a significant positive correlation. This shows that the meteorological dry–wet had a significant effect, both on the current and the month-ahead hydrological dry–wet, and the one-month lag effect was the most obvious; especially for the Xida, Jinta, Zamu, and Dajing Rivers.

4. Discussion

4.1. Comparison with Previous Studies

The meteorological humidification and hydrological aridification in the eastern Qilian Mountains agrees with the existing research results [7,47,48]. There are differences in the process of meteorological drought propagating to hydrological drought at different spatial and temporal scales. Among these, the meteorological drought has a significant lag transfer effect on the hydrological dry–wet of the next month on the monthly scale, which is similar to the existing research results, to a certain extent [11,26,27,49], but the hydrological drought lags behind the meteorological drought in different basins at different times. For example, He concluded that the hydrological drought in the Yellow River Basin had a delay of 1–5 months, compared with the meteorological drought [26]. Liu concluded that the hydrological drought in the Oklahoma Blue River Basin lagged behind the meteorological drought by two months [27].

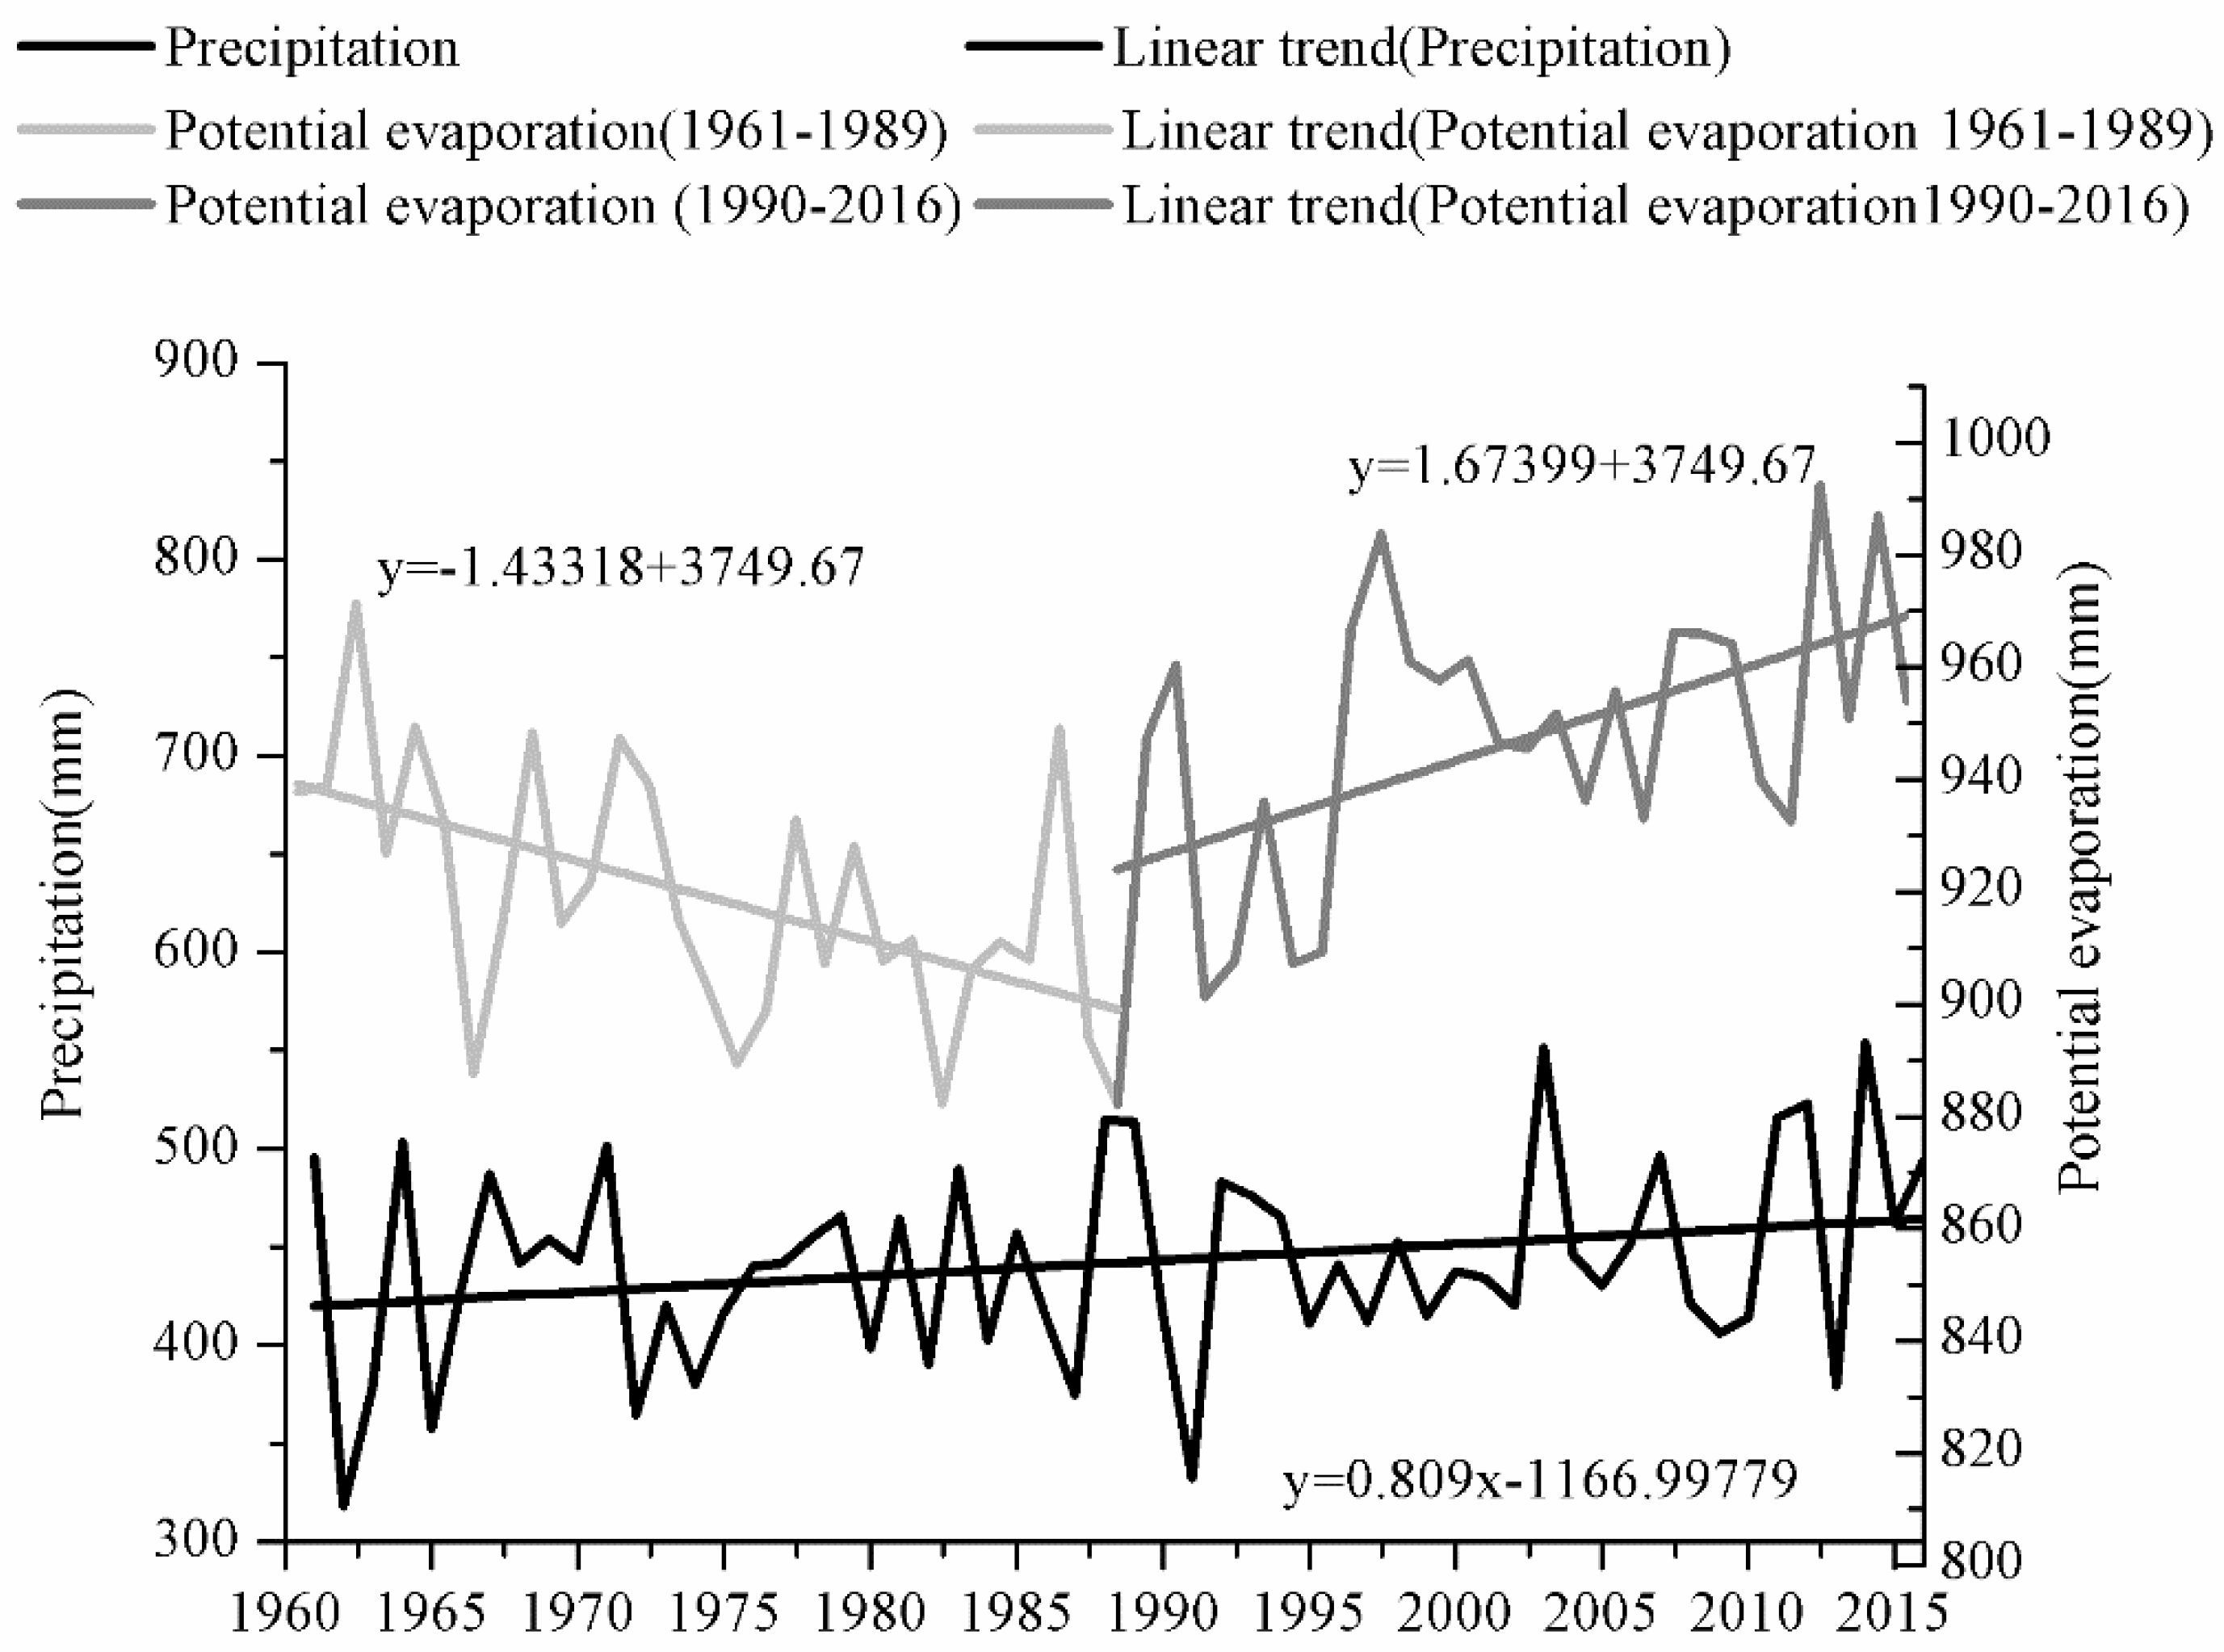
4.2. Impact of Climate Change on Meteorological Drought propagating to Hydrological Drought

Climate change has a potentially significant impact on hydrological cycles and water resources [50]. Among these, balancing relationships between precipitation and evaporation directly affect regional water yield, which then affects the process of meteorological dry–wet propagating to hydrological dry–wet. Precipitation in the upper reaches of the Shiyang River has increased from the 1960s, while evaporation has experienced a trend of decreasing first (1960s–1990s) and then increasing (since the 1990s) (Figure 7). Before the 1990s, meteorological drought was serious and decreasing evaporation prevented the propagation of meteorological drought to hydrological drought, resulting in an overall intensity of hydrological drought less than that of meteorological drought. After the 1990s, precipitation increased but, at the same time, the increase of evaporation strengthened the propagation of meteorological drought to hydrological drought, to a certain extent, resulting in the overall intensity of hydrological drought being greater than that of meteorological drought. This is the main reason for the opposite characteristics of meteorological drought and hydrological drought before and after the 1990s. Therefore, the balance relationship between precipitation and evaporation is the main factor affecting the propagation of meteorological dry–wet to hydrological dry–wet in the upper reaches of the Shiyang River. At the same time, there were differences among different tributaries. The increasing trend of precipitation in the Huangyang River and its eastern tributaries was larger than that in the western tributaries of the Huangyang River, and the increasing trend of evaporation was smaller than that in the rivers west of the Huangyang River [46]. However, the phenomenon of hydrological drought in the rivers east of the Huangyang River was more serious, showing that changes in human activities, especially in land-use types and structures, will directly affect the propagation of meteorological dry–wet to hydrological dry–wet, in addition to meteorological factors.

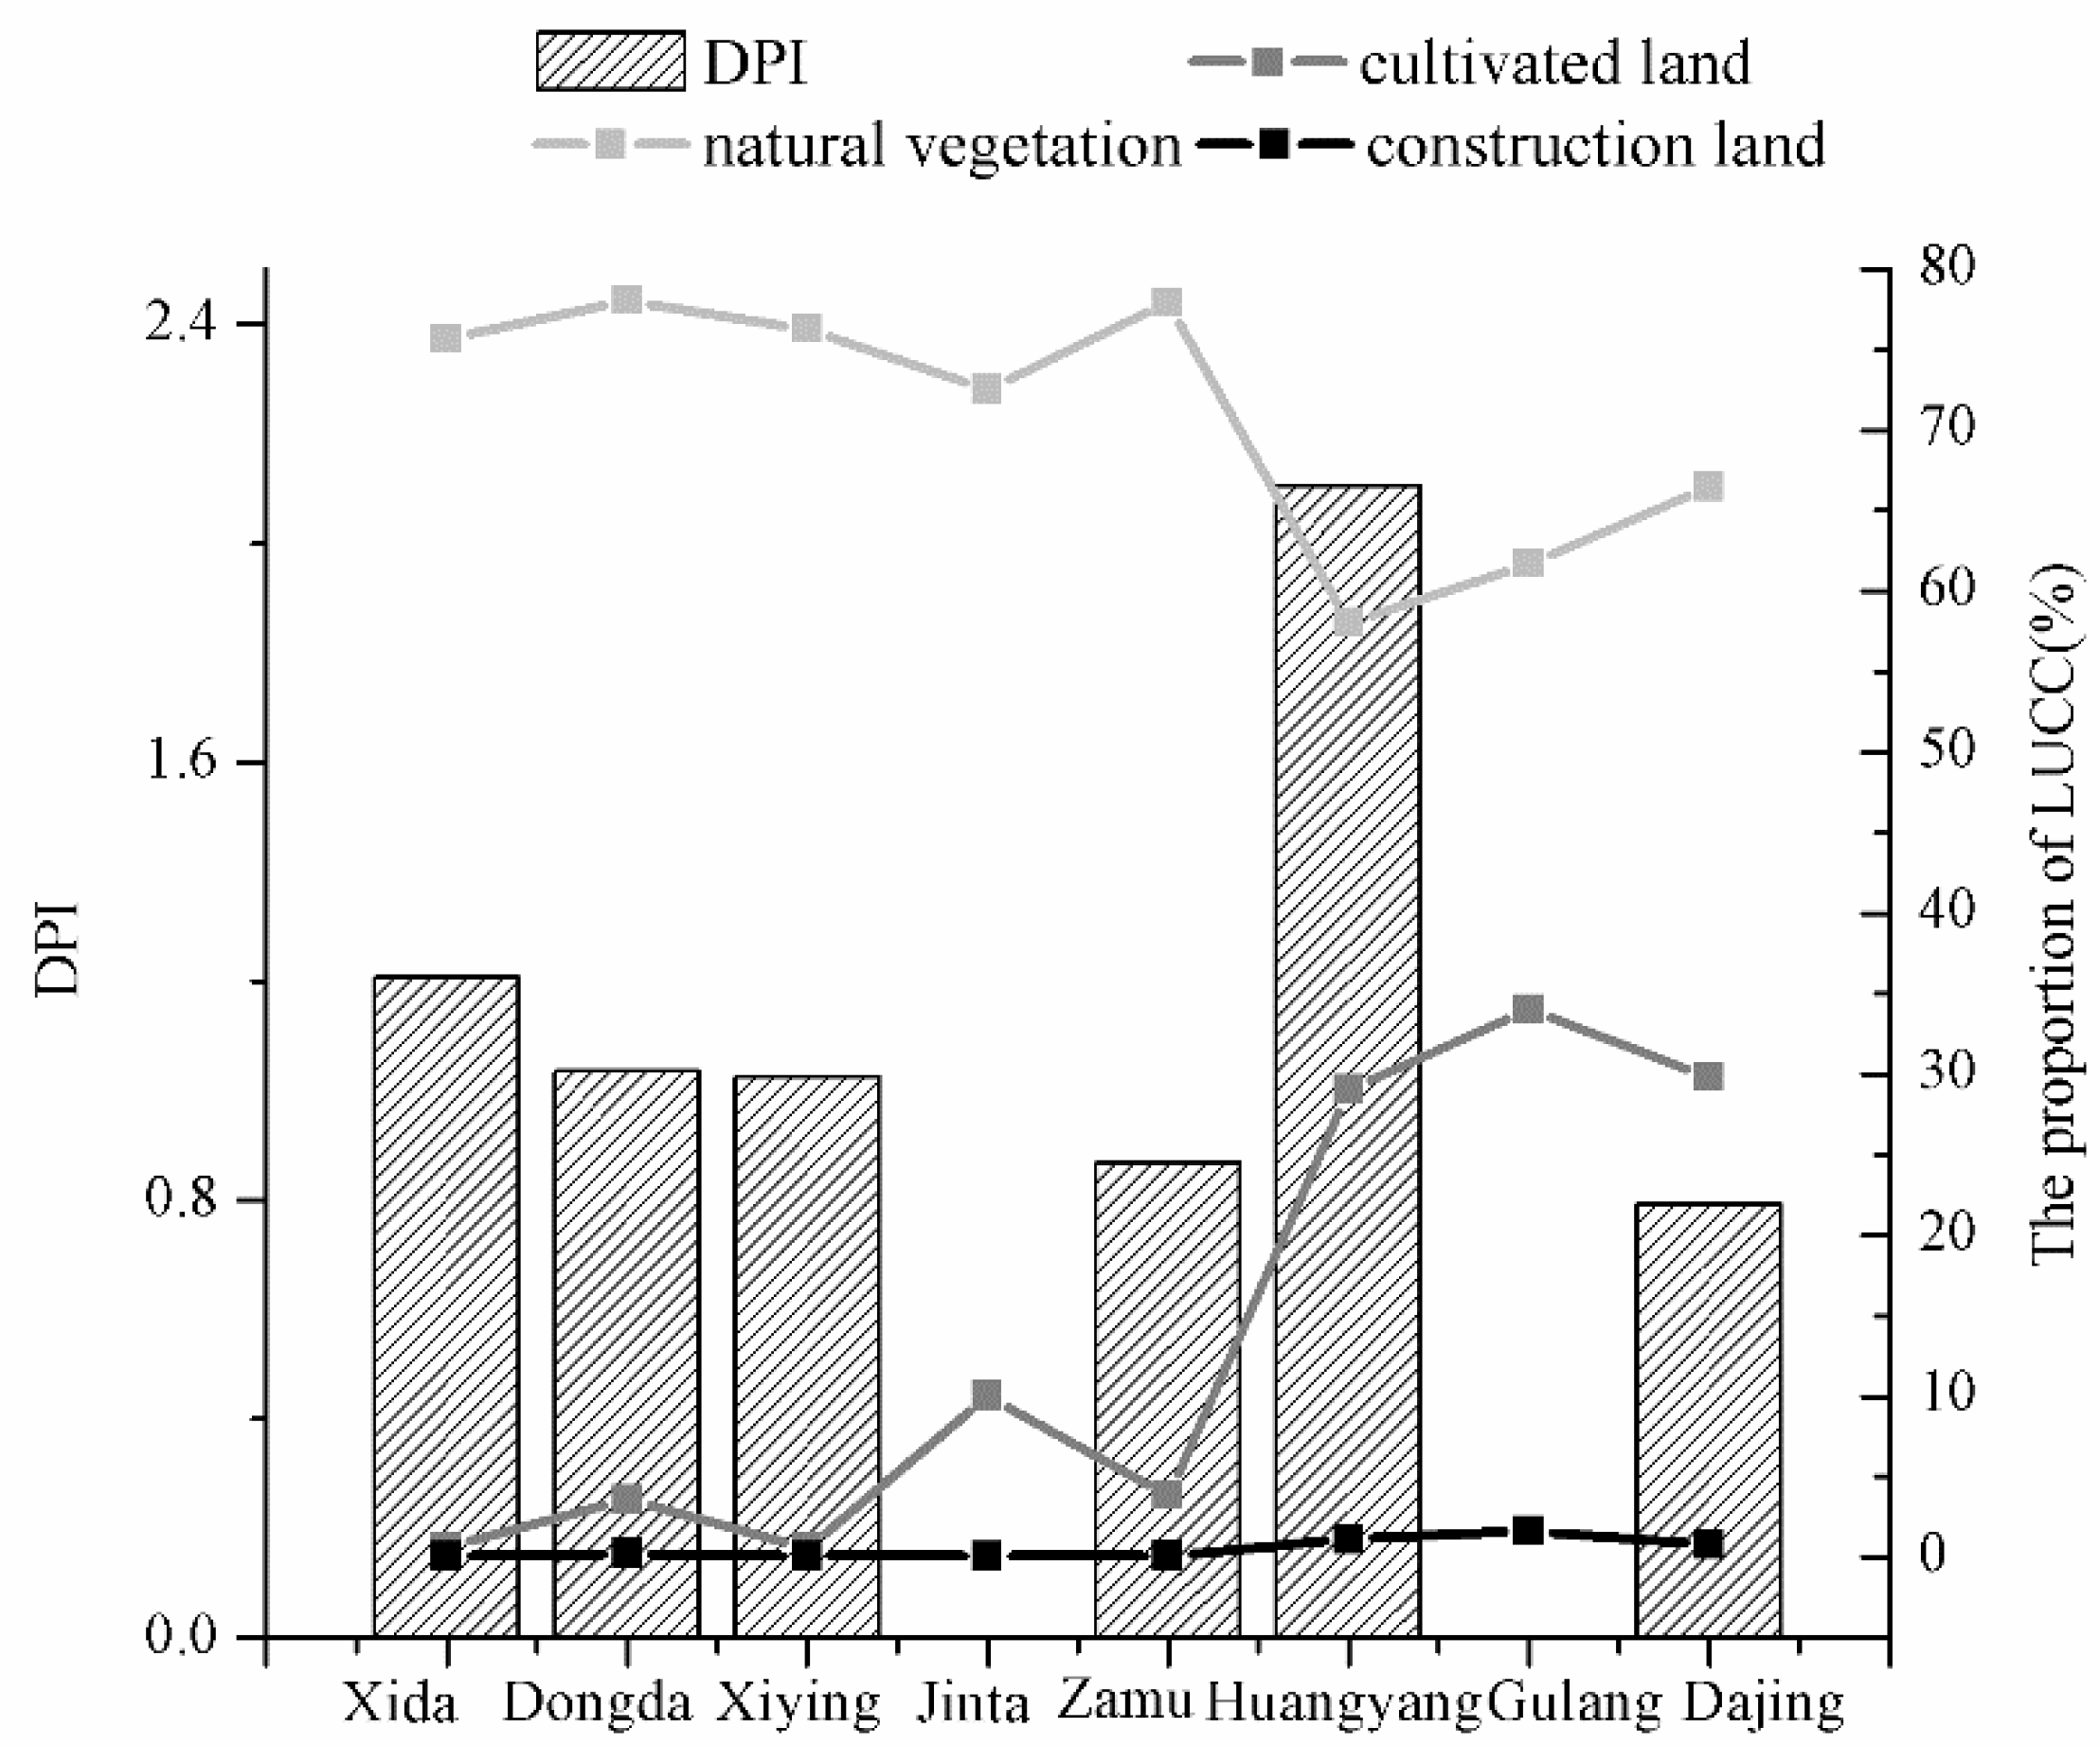
4.3. Impact of Land-Use on Meteorological Drought Propagating to Hydrological Drought

The average value and its proportion were obtained by counting the land areas of cultivated land, construction land, and natural vegetation (including woodland and grassland) in the catchment area above tributary hydrological monitoring stations in 1986, 2000, and 2016 (Figure 8).
As can be seen from Figure 8, the land-use structures of different tributaries were obviously different. With the Huangyang River as a boundary, the proportion of cultivated land and construction land in the eastern three rivers was much larger than that in the western five rivers, and the proportion of natural vegetation area was smaller than that in the five tributaries west of the Huangyang River.
Land-use and its spatial structure affects the propagation process of meteorological drought to hydrological drought by influencing runoff generation and confluence processes in the basin. Firstly, the effects of different cover types on water balance have been shown to be different [46]. Among these, the evapotranspiration capacity of a water body is the strongest (9.3226 mm), followed by woodland (8.6681 mm), and grassland (7.9051 mm) [51]. As a result, the water production capacity of the eight tributaries in the upper reaches of Shiyang River with different land-use structures varied greatly, which affected the propagation of meteorological drought to hydrological drought. Comparing Figure 8 and Table 9, it can be seen that the water production coefficient (water productivity/precipitation) of five tributaries in the west, which were less affected by human activities, corresponded well with the DPI value; that is, the larger the water production coefficient, the smaller the DPI value. Secondly, the water conservation capacities of different land-use types are quite different [52], which affects the propagation of meteorological drought to hydrological drought. The average water conservations of woodland and grassland in natural vegetation are 90.38 mm and 41.72 mm, respectively, which are much larger than those of other land-use types, having a strong water storage capacity and strong transpiration, making it difficult for precipitation to form runoff; however, this has a certain regulation effect on hydrological drought caused by meteorological drought in years with less precipitation. Relatively speaking, the average water conservation capacity of cultivated land and construction land is poor, with water conservation capacities of 27.36 mm and 4.15 mm, respectively. The propagation process of meteorological drought to hydrological drought is a comprehensive reflection of the impact of different land-use types and their spatial distribution on the various links of the hydrological cycle process. Considering the DPI (Figure 8), we can see that the DPI of the Dongda and Xiying Rivers are 1.03 and 1.02, respectively, which are very close to peer-to-peer propagation. Therefore, when the natural vegetation area accounted for between 76.3–78%, the cultivated land area is between 0.55–3.6%, and the construction area is between 0.08–0.22%, there was a peer-to-peer propagation process from meteorological drought propagating to hydrological drought in the upper reaches of the Shiyang River. The abnormal propagation of meteorological drought to hydrological drought occurred in the Huangyang River and the rivers east of it, due to the large proportion of cultivated land and small area of natural vegetation; especially in the Huangyang River Basin, where the natural vegetation area accounts for the smallest proportion and the cultivated land area accounts for the largest proportion. The total population of the Huangyang River Basin was about 63,000, ranking the first among the eight tributaries, and the water consumption of humans and livestock was relatively large. Meanwhile, the water used in the 260 km2 of cultivated land in the Zhangyi Irrigation Area above the Huangyang Reservoir was taken from the Huangyang River, resulting in a hydrological drought intensity of the basin much stronger than meteorological drought intensity and, so, the intensity of meteorological drought propagating to hydrological drought was extremely strong. On the contrary, the Dajing River had a weak propagation process of drought, which indicates that the moderate interference of human activities can weaken meteorological drought propagating to hydrological drought; however, excessive interference can also lead to the extremely strong propagation of drought.

4.4. Impact of Climate and Land-Use Change Interactions

The influencing mechanisms of meteorological drought propagating to hydrological drought are very complex. Under the background of global change, natural factors, and human activities, the change of any link in the water cycle process will affect the propagation from meteorological drought to hydrological drought. Climate change promotes the movement of water molecules, which, as the main driving factor in atmospheric circulation and the hydrological cycle, causes evaporation, rainfall, runoff, soil moisture, and other factors in the circulation process to change, accordingly, ultimately affecting spatial and temporal distribution characteristics of water resources [53,54]. Human activities, which are dominated by changes in land-use patterns, have an impact on surface runoff, evapotranspiration, and so on, through changing factors, such as infiltration and soil moisture in the underlying surface of the area [55]. Therefore, the combined effects of climate change and land-use patterns will cause differences in water cycle processes and water resource allocation, which affects the propagation process of meteorological drought to hydrological drought.
This paper has attempted to explore the influencing mechanisms of meteorological drought propagating to hydrological drought from two aspects of climate change and land-use, the concepts of DPI index and land-use threshold are proposed. These conclusions provide a theoretical basis and practical reference for adjusting land-use structure, rational utilization of water resources, and drought prevention and control in the Qilian Mountains. However, the applicability of these conclusions, especially with respect to the land-use thresholds of drought peer-to-peer propagation, in the Qilian Mountains needs further demonstration of relevant research in the future. Moreover, the impact of land-use change on the propagation process of meteorological drought to hydrological drought is reflected not only in the change of land-use structure, but also in the change of land-use landscape patterns. Therefore, future research should investigate the impacts of land-use landscape patterns and micro-landform changes on the propagation process of meteorological drought to hydrological drought. Meanwhile, in order to make the results more accurate and reduce the discrepancies between the temporal resolutions of climatological and hydrological data sets, the deployment of weather generators will effectively solve this problem [56,57,58]. It is, therefore, recommended to introduce weather generators into subsequent studies as much as possible.

5. Conclusions

On the interdecadal scale, meteorological humidification and hydrological aridification were shown in the Qilian Mountains (in the upper reaches of the Shiyang River), where there was a positive correlation between them. During the fluctuation process of an approximate cycle, the fluctuation degree of meteorological dry–wet was less than that of hydrological dry–wet. On average, the intensity of meteorological drought propagating to hydrological drought in the 1960s, 1970s, 1980s, and 1990s was extremely weak, while the 2000s was the period of the greatest intensity of hydrological drought and the weakest intensity of meteorological drought, and the intensity of meteorological drought propagating to hydrological drought was extremely strong. The correlation between SPI12 and SRI12 in the Xiying River was the strongest and was weakest in the Huangyang River. Hydrological aridification in the Huangyang River and the rivers east of it was greater than that in the rivers west of the Huangyang River; the hydrological aridification in Huangyang River was the most obvious. Except for the Huangyang River, the DPI decreased gradually from west to east.
On a seasonal scale, meteorological humidification and hydrological aridification occurred in spring and summer, and meteorological and hydrological humidification occurred in autumn and winter. SPI3 and SRI3 had a significant positive correlation in spring, summer, and autumn, with the strongest correlation in autumn, while SRI3 in winter was closely related to SPI3 in summer and autumn. The intensity of meteorological drought propagating to hydrological drought in spring and summer was stronger than that in autumn and winter. The SPI3 values showed humidification in each season for the eight tributaries. Among them, the meteorological humidification in the Dajing and Gulang Rivers was the most obvious, while the hydrological aridification in different seasons was weak in the western tributaries and increased in the eastern tributaries. In the autumn, the propagation of meteorological drought to hydrological drought was the weakest. Except for the Huangyang and Xida Rivers, the intensity of meteorological drought propagating to hydrological drought was strongest in the spring.
On a monthly scale, the meteorological dry–wet had a significant effect, both on the current and month-ahead hydrological dry–wet, where the one-month lag effect was most obvious.
Climate and land-use change are the main factors affecting the propagation of meteorological drought to hydrological drought. The balance between precipitation and evaporation directly affects regional water yield. In addition, the water conservation capacities of different land-use types are quite different. Therefore, the change of land-use structure, directly or indirectly, affects each link of the hydrological cycle, which then affects the propagation of meteorological drought to hydrological drought. The study found that, when the natural vegetation area accounted for between 76.3–78.0%, the cultivated land area was between 0.55–3.6% and the construction area was between 0.08–0.22%, there was a peer-to-peer propagation process from meteorological drought to hydrological drought in the upper reaches of the Shiyang River.

Author Contributions

Data curation, Q.L.; Formal analysis, J.Z. and Q.L.; Funding acquisition, J.Z., W.W., G.Z. and C.L.; Investigation, L.W. and L.L.; Methodology, J.Z. and Q.L.; Software, Q.L., J.X., W.F., M.H., Y.Z. and D.X.; Writing–original draft, J.Z., Q.L.; Writing–review & editing, J.Z., G.Z.

Funding

This research was funded by the National Natural Science Foundation of China, grant numbers 41761047, 41661005, 41867030, 41861040, and 41861034.

Acknowledgments

We would like to thank the colleagues in the Northwest Normal University for their help in writing process. We are grateful to anonymous reviewers and editorial staff for their constructive and helpful suggestions.

Conflicts of Interest

The authors declare no conflict of interest.

References

  1. Goddard, S.; Harms, S.K.; Reichenbach, S.E.; Tadesse, T.; Waltman, W.J. Geospatial decision support for drought risk management. Commun. ACM 2003, 46, 35–37. [Google Scholar] [CrossRef]
  2. Panagoulia, D.; Dimou, G. Definitions and Effects of Droughts. In Proceedings of the Conference on Mediterranean Water Policy: Building on Existing Experience, Mediterranean Water Network, Valencia, Spain, 16–18 April 1998; Volume I. General Lecture, Invited Presentation, Research Gate. [Google Scholar]
  3. Li, X.; Wang, X.; Babovic, V. Analysis of variability and trends of precipitation extremes in Singapore during 1980–2013. Int. J. Climatol. 2018, 38, 125–141. [Google Scholar] [CrossRef]
  4. Wang, J.S.; Li, Y.H.; Wang, R.Y.; Feng, J.Y.; Zhao, Y.X. Preliminary analysis on the demand and review of progress in the field of meteorological drought research. J. Arid Meteorol. 2012, 30, 497–508. [Google Scholar]
  5. IPCC. Climate Change 2013: The Physical Science Basis, Summary for Policymakers, Contribution of WGI to the Fifth Assessment Report of the Intergovernmental Panel on Climate Change; Cambridge University Press: Cambridge, UK; New York, NY, USA, 2013. [Google Scholar]
  6. IPCC. Climate Change 2007: The Physical Science Basis, Summary for Policymakers; IPCC WGI Fourth Report; IPCC: Paris, France, 2007. [Google Scholar]
  7. Zhai, L.X.; Feng, Q. Dryness/Wetness Climate Variation Based on Standardized Precipitation Index in Northwest China. J. Nat. Resour. 2011, 26, 847–857. [Google Scholar]
  8. Li, X.; Meshgi, A.; Babovic, V. Spatio-temporal variation of wet and dry spell characteristics of tropical precipitation in Singapore and its association with ENSO. Int. J. Climatol. 2016, 36, 4831–4846. [Google Scholar] [CrossRef]
  9. Heim, R.R. A review of twentieth-century drought indices used in the United States. Bull. Am. Meteorol. Soc. 2002, 83, 1149–1166. [Google Scholar] [CrossRef]
  10. Dong, Q.J.; Xie, P. Advances in hydrological drought research. J. China Hydrol. 2014, 34, 1–7. [Google Scholar]
  11. Pi, W.Y.; Zhao, X.H.; Zhu, X.P. Relationship between hydrologic drought and meteorological drought in the upstream of Fenhe River. Water Resour. Power 2018, 36, 19–22. [Google Scholar]
  12. Panagoulia, D. Definitions, implications and coping strategies of droughts, Keynote Speech. In Proceedings of the 2nd International Conference on Environment—Sustainable Management of Water Resources-Advanced Technologies for Water Saving of Association of Civil Engineers of Greece and Europe, Athens, Greece, July 2007. [Google Scholar]
  13. Mishra, A.K.; Singh, V.P. A review of drought concepts. J. Hydrol. 2010, 391, 202–216. [Google Scholar] [CrossRef]
  14. Zargar, A.; Sadiq, R.; Naser, B.; Khan, F.I. A review of drought indices. Environ. Rev. 2011, 19, 333–349. [Google Scholar] [CrossRef]
  15. Zhu, G.F.; Yang, L.; Qin, D.H.; Tong, H.l.; Liu, Y.F.; Li, J.F. Spatial and temporal variation of drought index in a typical steep alpine terrain in Hengduan Mountains. J. Mt. Sci. 2016, 13, 1186–1199. [Google Scholar] [CrossRef]
  16. Svoboda, M.D.; Hayes, M.; Wood, D. Standardized Precipitation Index User Guide; World Meteorological Organization: Geneva, Switzerland, 2012. [Google Scholar]
  17. Mo, K.C. Model-based drought indices over the United States. J. Hydrometeorol. 2008, 9, 1212–1230. [Google Scholar] [CrossRef]
  18. Shao, J.; Li, Y.; Song, S.B. New computing method for standardized runoff index and its application. J. Nat. Disasters 2014, 23, 79–87. [Google Scholar] [CrossRef]
  19. Zhang, L.L.; Zhou, J.J.; Zhang, H.W.; Wang, B.; Cao, J.J. Temporal and spatial patterns of climate drought-wet and drought event based on Standard Precipitation Index in Shiyang River Basin. Acta Ecol. Sin. 2017, 37, 996–1007. [Google Scholar] [CrossRef] [Green Version]
  20. Ma, B.; Zhang, B.; Zhou, D.; Zhang, Y.Z.; Wang, G.Q.; Tang, M. Analysis of drought characteristics of the east China monsoon area based on standardized precipitation evapotranspiration index. J. Nat. Resour. 2016, 31, 1185–1197. [Google Scholar] [CrossRef]
  21. Guhathakurta, P.; Menon, P.; Inkane, P.M.; Krishnan, U.; Sable, S.T. Trends and variability of meteorological drought over the districts of India using standardized precipitation index. Hydrol. Earth Syst. Sci. 2017, 126, 120. [Google Scholar] [CrossRef]
  22. Gidey, E.; Dikinya, O.; Sebego, R.; Segosebe, E.; Zenebe, A. Modeling the spatio-temporal meteorological drought characteristics using the standardized precipitation index (SPI) in Raya and its environs. Northern Ethiopia. Earth Syst. Environ. 2018, 2, 281–292. [Google Scholar] [CrossRef]
  23. Wang, K.; Li, T.; Wei, J. Exploring Drought Conditions in the Three River Headwaters Region from 2002 to 2011 Using Multiple Drought Indices. Water 2019, 11, 190. [Google Scholar] [CrossRef]
  24. Wang, H.; Chen, Z.; Chen, Y.; Pan, Y.; Feng, R. Identification of the Space-Time Variability of Hydrological Drought in the Arid Region of Northwestern China. Water 2019, 11, 1051. [Google Scholar] [CrossRef]
  25. Barker, L.J.; Hannaford, J.; Chiverton, A.; Svensson, C. From meteorological to hydrological drought using standardised indicators. Hydrol. Earth Syst. Sci. 2016, 20, 2483–2505. [Google Scholar] [CrossRef] [Green Version]
  26. He, F.L.; Hu, C.H.; Wang, J.J.; Wang, Y.L. Analysis of meteorological and hydrological drought in the Yellow River Basin during the past 50 years based on SPI and SDI. Geogr. Geo-Inf. Sci. 2015, 31, 69–75. [Google Scholar] [CrossRef]
  27. Liu, L.; Hong, Y.; Christopher, N.B.; Yong, B.; Mark, A.S.; James, E.H. Hydro-Climatological Drought Analyses and Projections Using Meteorological and Hydrological Drought Indices: A Case Study in Blue River Basin, Oklahoma. Water Resour. Manag. 2012, 26, 2761–2779. [Google Scholar] [CrossRef]
  28. Shukla, S.; Wood, A.W. Use of a standardized runoff index for characterizing hydrologic drought. Geophys. Res. Lett. 2008, 35, L02405. [Google Scholar] [CrossRef]
  29. Wei, W.; Shi, P.J.; Zhao, J.; Wang, X.F. Spatial relationship between elevation, vegetation cover and Landscape types in Shiyang River Basin. Arid Land Geogr. 2012, 35, 91–98. [Google Scholar] [CrossRef]
  30. Xiao, D.N.; Li, X.Y.; Song, D.M. Landscape changes and ecological reconstruction in Minqin Huqu oasis. Acta Ecol. Sin. 2005, 25, 2477–2483. [Google Scholar]
  31. Li, L.P.; Liu, M.C. Changing trend and features of the runoff from mountain areas of rivers in Shiyang River drainage basin. J. Soil Water Conserv. 2011, 25, 58–63. [Google Scholar] [CrossRef]
  32. Liu, M.C. Analysis and assessment of climatic dry and wet conditions in Shiyang River Basin. Chin. J. Ecol. 2006, 25, 880–884. [Google Scholar] [CrossRef]
  33. Feng, J.Y.; Wang, J.S.; Han, Y.X. Impact of the Surface Runoff of Inland Rivers on the Spring Wheat Yields in Hexi Corridor of Gansu. Arid Meteorol. 2004, 22, 17–20. [Google Scholar]
  34. Fatichi, S.; Ivanov, V.Y.; Caporali, E. Investigating interannual variability of precipitation at the global scale: Is there a connection with seasonality? J. Clim. 2012, 25, 5512–5523. [Google Scholar] [CrossRef]
  35. Husak, G.J.; Michaelsen, J.; Funk, C. Use of the gamma distribution to represent monthly rainfall in Africa for drought monitoring applications. Int. J. Climatol. 2007, 27, 935–944. [Google Scholar] [CrossRef]
  36. Ye, Z.W. Flood and drought change based SPI analysis in the developing coastal region of Jiangsu Province: A case study in Yancheng City. Sci. Geogr. Sin. 2014, 34, 479–487. [Google Scholar] [CrossRef]
  37. Wang, Y.Y.; Zhang, B. Analysis of Drought-flood Spatial-temporal Characteristics Based on Standard Precipitation Index in East Region of Gansu in Recent 40 Years. J. Nat. Resour. 2012, 27, 2135–2144. [Google Scholar]
  38. McKee, T.B.; Doesken, N.J.; Kleist, J. The relationship of drought frequency and duration to time scales. In Proceedings of the 8th Conference on Applied Climatology, Anaheim, CA, USA, 17–23 January 1993; American Meteorological Society: Boston, MA, USA, 1993; Volume 17, pp. 179–184. [Google Scholar]
  39. Lloyd-Hughes, B.; Saunders, M.A. A drought climatology for Europe. Int. J. Climatol. 2002, 22, 1571–1592. [Google Scholar] [CrossRef]
  40. Hassan, I.H.; Mdemu, M.V.; Shemdoe, R.S.; Stordal, F. Drought pattern along the coastal forest zone of Tanzania. Atmos. Clim. Sci. 2014, 4, 369–384. [Google Scholar] [CrossRef]
  41. Wu, S.H.; Yin, Y.H.; Zheng, D.; Yang, Q.Y. Climate change in the Tibetan Plateau during the last three decades. Acta Geogr. Sin. 2005, 60, 3–11. [Google Scholar]
  42. Wang, Q.; Zhang, M.J.; Pan, S.k. Spatiotemporal variation patterns of potential evapotranspiration in the Yangtze River basin of China. Chin. J. Ecol. 2013, 32, 1292–1302. [Google Scholar]
  43. Allen-Wardell, G.; Bernhardt, P.; Bitner, R.; Burquez, A. The potential consequences of pollinator declines on the conservation of biodiversity and stability of food crop yield. Soc. Conserv. Biol. 2008, 12, 8–17. [Google Scholar] [CrossRef]
  44. Zhang, M.J.; Li, R.X.; Jia, W.X.; Wang, X.F. Temporal and spatial changes of potential evaporation in Tianshan mountains from 1960 to 2006. Acta Geogr. Sin. 2009, 64, 798–806. [Google Scholar]
  45. Feng, K.P.; Tian, J.C. Estimation of evapotranspiration in Ningxia by Hargreaves equation. J. Arid Land Resour. Environ. 2014, 28, 100–105. [Google Scholar]
  46. Zhang, L.L. The Change of Water Yield in the Upstream of Shiyang River and Its Response to Climate and Land Use Change Based on InVEST; Northwest Normal University: Lanzhou, China, 2007. [Google Scholar]
  47. Zhou, J.J.; Shi, W.; Shi, P.J.; Kong, L.G.; Jia, Z.P. Characteristics of mountainous runoff and its responses to climate change in the upper reaches of Shiyang river basin during 1956–2009. J. Lanzhou Univ. Nat. Sci. 2012, 48, 27–34. [Google Scholar]
  48. Zhou, J.J.; Shi, P.J.; Shi, W. Temporal and Spatial Characteristics of Climate Change and Extreme Dry and Wet Events in Shiyang River Basin from 1960 to 2009. J. Nat. Resour. 2012, 27, 143–153. [Google Scholar]
  49. Li, Y.G.; He, J.N.; Li, X. Hydrological and meteorological droughts in the Red River Basin of Yunnan Province based on SPEI and SDI Indices. Prog. Geogr. 2016, 35, 758–767. [Google Scholar] [CrossRef]
  50. Fatichi, S.; Ivanov, V.Y.; Caporali, E. Simulation of future climate scenarios with a weather generator. Adv. Water Resour. 2011, 34, 448–467. [Google Scholar] [CrossRef]
  51. Liu, C.-y.; Zhao, J.; Liu, Y.-y.; Wei, W. Remote Sensing Estimation of Evapotranspiration Quantity and Analysis of Space-time Structure over Shiyang River Basin. Remote Sens. Land Resour. 2011, 23, 117–122. [Google Scholar]
  52. Wang, Y.C.; Zhao, J.; Fu, J.W.; Wei, W. Quantitative assessment of water conservation function and spatial pattern in Shiyang River basin. Acta Ecol. Sin. 2018, 38, 4637–4648. [Google Scholar] [CrossRef]
  53. He, J.S.; Lin, H.X. Introduction to Water Resource; China Agricultural University Press: Beijing, China, 2006. [Google Scholar]
  54. Pan, H.X.; Zhu, G.F.; Zhang, Y.; Guo, H.W.; Yong, L.L.; Wan, Q.Z.; Ma, H.Y.; Li, S. Spatial and temporal variations of relative soil moisture in China’s farmland. Acta Geogr. Sin. 2019, 74, 117–130. [Google Scholar] [CrossRef]
  55. Mo, G.Y. Runoff Response to the Climate and Land Use Change in the Long Tan Basin; Guangxi University: Nanning, China, 2018. [Google Scholar]
  56. Peleg, N.; Fatichi, S.; Paschalis, A.; Molnar, P.; Burlando, P. An advanced stochastic weather generator for simulating 2-D high-resolution climate variables. J. Adv. Model. Earth Syst. 2017, 9, 1595–1627. [Google Scholar] [CrossRef]
  57. Li, X.; Babovic, V. A new scheme for multivariate, multisite weather generator with inter-variable, inter-site dependence and inter-annual variability based on empirical copula approach. Clim. Dyn. 2019, 52, 2247–2267. [Google Scholar] [CrossRef]
  58. Li, X.; Babovic, V. Multi-site multivariate downscaling of global climate model outputs: An integrated framework combining quantile mapping, stochastic weather generator and Empirical Copula Approach. Clim. Dyn. 2019, 52, 5775–5799. [Google Scholar] [CrossRef]
Figure 1. Overview of the study area.
Water 11 01602 g001
Figure 2. Interannual and interdecadal response characteristics in the upstream. (a) SPI12 and SRI12 change trends; (b) interdecadal variability of meteorological and hydrological drought.
Water 11 01602 g002
Figure 3. Interannual and interdecadal response characteristics in different tributaries (a) SPI12 and SRI12 change trends; (b) spatial characteristics of meteorological and hydrological drought.
Water 11 01602 g003
Figure 4. Seasonal response characteristics in the upstream. (a) SPI3 and SRI3 change trends; (b) drought characteristics of SPI3 and SRI3.
Water 11 01602 g004
Figure 5. Characteristics of meteorological drought and hydrological drought in different seasons.
Water 11 01602 g005
Figure 6. DPI of different time scales in each tributary.
Water 11 01602 g006
Figure 7. Trends of annual precipitation and potential evaporation in the upper reaches of the Shiyang River from 1960–2016.
Water 11 01602 g007
Figure 8. Relationship between the proportion of land-use area and DPI.
Water 11 01602 g008
Table 1. Locations of the tributaries’ hydrological stations.
TributariesHydrological StationLatitudeLongitude
Xida RiverXida38°3′00″101°22′59″
Dongda RiverShagousi38°1′00″101°57′00″
Xiying RiverJiutiaoling37°52′00″102°3′00″
Jinta RiverNanying Reservoir37°48′00″102°31′00″
Zamu RiverZamusi37°42′00″102°34′00″
Huangyang RiverHuangyang37°34′00″102°43′00″
Gulang RiverGulang37°25′59″102°54′00″
Dajing RiverDajingxia37°22′59″103°21′00″
Table 2. Classification of standard precipitation index (SPI) and standardized runoff index (SRI) drought.
Index RangeSPI and SRI Level
(−1,0)Mild drought
(−1.5,−1]Moderate drought
(−2,−1.5]Severe drought
(−∞,−2]Extreme drought
Table 3. Drought propagation intensity (DPI) index classification.
Index RangeLevelIndex RangeLevel
1Peer-to-peer
(1,1.1]Mildly strong[0.9,1)Mildly weak
(1.1,1.2]Moderately Strong[0.8,0.9)Moderately weak
(1.2,1.3]Extra strong[0.7,0.8)Extra weak
(+∞,1.3)Extremely strong(0,0.7)Extremely weak
Note: When meteorological drought intensity is 0 and hydrological drought intensity is not 0, the grade of DPI is extremely strong.
Table 4. Change tendency rate, coefficient of variation (CV), and correlation coefficient of SPI12 and SRI12 in eight tributaries.
ItemsIndexesXidaDongdaXiyingJintaZamuHuangyangGulangDajing
Change Tendency RateSPI120.1380.0980.1020.1200.1000.1150.2150.202
SRI120.1290.129−0.004-−0.018−0.156-−0.134
CVSPI120.3810.3840.410.4240.3830.4760.4240.417
SRI120.5160.5750.488-0.4630.427-0.413
Correlation Coefficient0.55 **0.66 **0.675 **0.52 **0.58 **0.299 *0.53 **0.52 **
Note: **, p < 0.01, *, p < 0.05.
Table 5. Coefficient of variation (CV) and correlation coefficients of SPI3 and SRI3 from 1961 to 2016 in the upstream.
ItemsIndexesSpringSummerAutumnWinter
CVSPI30.5322150.3744380.4703140.550405
SRI30.4327260.4982150.3467080.411916
Correlation CoefficientsSPI3 and SRI30.47 **0.66 **0.72 **0.24
SPI3 and winter SRI30.2130.393 **0.452 **0.24
Note: **, p < 0.01, *, p < 0.05.
Table 6. Interdecadal variations of DPI in different seasons.
PeriodSpringSummerAutumnWinter
1960s0.4334880.8551590.6813940.32863
1970s0.8478360.7636290.7470620.586071
1980s1.4700813.3481550.6874490.878939
1990s0.7736240.3802790.6431430.742972
2000s0.9760680.842752Extremely strong0
1961–20160.8380340.8129420.6697220.605535
Table 7. Seasonal change tendency rate of SPI3 and SRI3 in different tributaries (unit:/10a).
SeasonXidaDongdaXiyingJintaZamuHuangyangGulangDajing
SpringSPI0.070.060.070.080.050.050.090.08
SRI00.31−0.08-−0.03−0.27-−0.14
SummerSPI0.10.070.060.080.060.080.130.12
SRI0.17−0.04−0.02-−0.01−0.09-−0.15
AutumnSPI0.030.020.080.040.050.110.170.18
SRI0.050.120.08-0.07−0.1-−0.04
WinterSPI0.230.180.190.210.230.40.390.39
SRI0.150.250.15-0.18−0.72-0.2
Table 8. Table8. Time-delay correlation between SPI1 and SRI1 in the upstream and tributaries.
RiverK = 0K = 1K = 2K = 3
Upstream0.329 **0.357 **0.242 **0.157 **
Xida0.218 **0.238 **0.170 **0.074
Dongda0.281 **0.249 **0.155 **0.084 *
Xiying0.290 **0.265 **0.179 **0.130 **
Jinta0.242 **0.253 **0.203 **0.143 **
Zamu0.251 **0.275 **0.246 **0.155 **
Huangyang0.335 **0.320 **0.223 **0.171 **
Gulang0.346 **0.205 **0.156 **0.088 **
Dajing0.254 **0.272 **0.136 **0.095 *
Note: **, p < 0.01; *, p < 0.05.
Table 9. Water production coefficient of each tributary.
XidaDongdaXiyingJintaZamuHuangyangGulangDajing
31.6537.7437.6535.6740.7532.9629.3325.55

