Article

Raw Water Storage as a Simple Means for Controlling Membrane Fouling Caused by Inorganic Foulants in River Water in a Tropical Region

by
Takashi Hashimoto
1,*,
Patricia Angelina Gunawan
1,
Suraphong Wattanachira
2,
Aunnop Wongrueng
2 and
Satoshi Takizawa
1,2
1
Department of Urban Engineering, The University of Tokyo, 7-3-1, Bunkyo-ku, Hongo, Tokyo 113-8656, Japan
2
Department of Environmental Engineering, Faculty of Engineering, Chiang Mai University, 239 Huey Kaew Road, Muang District, Chiang Mai 50200, Thailand
*
Author to whom correspondence should be addressed.
Water 2019, 11(8), 1592; https://doi.org/10.3390/w11081592
Submission received: 28 June 2019 / Revised: 25 July 2019 / Accepted: 29 July 2019 / Published: 31 July 2019
(This article belongs to the Section Wastewater Treatment and Reuse)

Abstract

:
Natural waters in tropical countries are turbid and rich in inorganic substances such as iron and manganese. Hence, membrane fouling by these inorganic substances is the most serious problem in membrane filtration processes for potable water production. This study aimed to assess raw water storage as a simple but effective means for controlling membrane fouling in the filtration of river water in a tropical country. Raw water taken from the Ping River in Chiang Mai, Thailand, in different seasons, was either immediately filtered or stored in a tank for two days before filtration through a polyvinylidene difluoride (PVDF) membrane with a nominal pore size of 0.1 μm. The turbidity and particulate organic carbon (POC) in the raw water were reduced by storage, while dissolved manganese was oxidized during the storage period. Although the amounts of metallic substances retained on membranes were larger than those of silica and organic matter, their contribution to the fouling resistance was found to be less than silica and organic carbon. The fouling analysis using hydraulically irreversible fouling index (HIFI) was found to be not able to measure the effects of storage when the initial flux increased. Hence, the ratio of the hydraulically reversible fouling index (HRFI) to the total fouling index (TFI), i.e., HRFI/TFI, was proposed to elucidate the effects of raw water storage on membrane fouling, which was manifest during the early stage of membrane filtration operation.

1. Introduction

The water demand in the world is predicted to double by 2030 and exceed the available water supply by more than 40% due to rapid economic growth in developing countries [1]. Although the population without access to safe drinking water is decreasing and target 7.C in the Millennium Development Goals was achieved in 2010 [2], meeting Goal 6.1 of the Sustainable Development Goal, namely, achieving universal and equitable access to safe and affordable drinking water for all by 2030, is still a great challenge for humanity.
In small-scale water supply systems in developing countries, maintaining operational integrity is key for the sustainable supply of safe drinking water. Operational failure is caused by a lack of trained operators, budget limits, and limited access to repair parts [3]. It is also caused by difficulty in the operation of conventional water purification systems, such as rapid sand filters, wherein there are many operational parameters such as coagulant dose, pH adjustment, coagulation–flocculation mixing, and sand filter backwashing [4]. The operational failure of water supply systems causes problems such as the leakage of contaminants into treated water and/or water supply outage [5].
Recently, membrane filtration became popular not only in developed countries, but also in developing countries, because of its high-quality treated water and ease of operation and maintenance [4]. The membrane filtration process is effective for the treatment of highly turbid surface waters often found in rivers in tropical developing countries, and it can achieve high removal efficiency of suspended solids and pathogenic microorganisms compared to the conventional coagulation and rapid sand filtration processes [6]. However, the mitigation and control of membrane fouling is a crucial issue for the operation of membrane filtration systems. Membrane fouling lowers treatment efficiency by increasing the filtration resistance and cleaning frequency of the membranes [7].
The quality of raw water taken from tropical rivers is characterized by high turbidity with wide fluctuations and high concentrations of iron and manganese. High turbidity promotes physically irreversible membrane fouling [8,9], and the oxidation of manganese in the membrane filtration process causes serious membrane fouling due to the deposition of oxidized manganese particles inside the pores [10]. Thus, to mitigate membrane fouling, pretreatment of raw water before membrane filtration and cleaning of fouled membranes are commonly applied [11]. The most widely used pretreatment processes for turbidity removal are coagulation and sedimentation processes. Coagulation pretreatment requires technical knowledge and skills to prepare the chemical coagulant and to adjust dosing rates to the fluctuating raw water quality. However, in the small-scale water supply systems of developing countries, there are few skilled operators who have sufficient technical skills to operate coagulation–sedimentation processes properly [12,13]. Thus, a simple and easy-to-operate pretreatment system is required for the sustainable operation of small-scale membrane filtration systems in developing countries.
While coagulation and sedimentation processes can remove insoluble fractions of iron and manganese, the removal rates are not high due to the presence of dissolved fractions. Thus, for the removal of dissolved manganese and iron, it is necessary to apply oxidation and sand filtration to transform dissolved manganese and iron into insoluble colloids and then remove them using sand filters [14]. The oxidation–sand filtration processes are difficult to apply to raw water from tropical rivers due to its high turbidity, which can easily clog sand filters, and the high cost of oxidants. Thus, even if high turbidity could be reduced by coagulation–sedimentation, there remains the problem of other foulants such as manganese, iron, and dissolved organic matter.
Storage of raw water is commonly considered as a measure to avoid water shortages and abrupt water quality change; however, as turbidity is lowered by gravity settling, it can be also considered to be one of the simplest pretreatment procedures. During storage of raw water, some silt settles out and pathogens die off. After storage for at least 48 h, any Schistosome cercariae becomes noninfective [15]. Storage of raw water does not require any special skill or facility, and is feasible in rural areas in developing countries where a land plot for water storage is available. However, little is known to date about the effect of raw water storage on manganese, iron, and dissolved organic matter in raw water, which also cause membrane fouling. Thus, this study aimed to evaluate the effectiveness of raw water storage on membrane fouling mitigation in the membrane filtration of river water in different seasons of a tropical country, with special attention to inorganic substances, including iron and manganese, and dissolved organic matter. Raw water was obtained in November 2014 and in March 2015 from a river in Chiang Mai, Thailand and stored for up to two days in both cases. The raw water was stored for two days, and the changes in water quality were measured before and after raw water storage. In order to investigate the mechanism of membrane fouling mitigation, fouling development during the filtration of stored and non-stored raw water was analyzed by utilizing unified membrane fouling index (UMFI), and by the amounts of foulants extracted from used membranes using a chemical cleaning solution, as well as the residual foulants that remained on the membrane after chemical cleaning. The commonly used indicator of membrane fouling, i.e., hydraulically irreversible fouling index (HIFI), was found to be misleading when the initial flux was high and, thus, an alternative index of a ratio of the hydraulically reversible fouling index (HRFI) to the total fouling index (TFI), i.e., HRFI/TFI, was proposed to analyze the effectiveness of storage on membrane fouling mitigation.

2. Materials and Methods

2.1. Raw Water Source

Raw water for membrane filtration experiments was taken from the Ping River, Chiang Mai, Thailand, which is a source of municipal water supply to Chiang Mai City (Figure 1), in November 2014 and March 2015. The river water was highly turbid and contained high concentrations of iron and manganese, which were derived geologically from laterite distributed widely in this tropical region. Turbidity of the Ping River is high, similarly to many other rivers in southeast Asia. In the rainy season, turbidity increased to more than 100 Nephelometric Turbidity Unit (NTU), with the maximum being more than 500 NTU. Even in the dry season (typically from November to April), the turbidity of the Ping River was around 40 NTU on average. Dissolved organic carbon (DOC) in the dry season was around 2.0 mg/L, while that of rainy season was relatively higher, at 2.9–5.7 mg/L.
The raw water sampling site was located in an area upstream of Chiang Mai City with low population density, to avoid any major artificial influence on water quality (Figure 1). After sampling, half of the water sample was kept still in a 20-L tank for two days before filtration experiments, while the other half was used for filtration experiments just after sampling. From the stored raw water, samples were taken after 20, 25, 44, 50, and 70 h to analyze the soluble manganese in November 2014 and, similarly, samples were taken for the same purpose after 0.5, 2, 28, 30, 46, 50, 52, 70, 72, 75, and 100 h in March 2015.

2.2. Membrane Filtration

Membrane filtration was performed in a stirred cell (Amicon 8050, Merck Millipore, Burlington, MA, USA) with a cell volume of 50 mL (Figure 2). The stirred cell was connected to a feed water reservoir (DV-20, Advantec Toyo Kaisha, Ltd. Tokyo, Japan), which was pressurized with a nitrogen gas cylinder. A flat sheet of polyvinylidene difluoride (PVDF) membrane (VVLP, Merck Millipore Burlington, MA, USA), with an effective filtration area of 13.4 cm2 and a nominal pore size of 0.1 μm, was installed in the cell. A duplicated filtration experiment was conducted at a constant pressure of 50 kPa, which was monitored by a digital pressure gauge. The filtrate weights were continuously measured by a digital balance, and the filtrate volume was calculated by dividing the filtrate weights with the specific density of water. Backwashing was manually performed every 30 min by reversing the membrane filter in the filter cell, and then by passing through 50 mL of pure water at 100 kPa. Pure water permeability of the membranes was measured before and after the filtration experiments. In November 2014, 8-h membrane filtration experiments were conducted for all experimental conditions, while respective 2-h, 4-h, and 8-h filtration experiments were conducted in March 2015.

2.3. Foulant Extraction

The foulants were extracted in two steps, namely, chemical extraction and membrane digestion. Chemical extraction was performed by soaking in 50 mL of 3.6 × 10⁻²% (w/v) HCl (pH 2) for 13 h, followed by soaking in 4 × 10⁻⁴% (w/v) NaOH (pH 10) for 13 h. After chemical extraction, the membranes were digested with 6% (w/v) nitric acid by a microwave (Multiwave 3000, PerkinElmer Japan, Yokohama, Japan) to extract the remaining inorganic substances from the membranes.

2.4. Analytical Methods

The pH, electric conductivity (EC) and turbidity of the raw water and the filtrate were analyzed onsite by an MP-6 Portable Meter (Hach, Loveland, CO, USA) and 2100Q Portable Turbidity Meter (Hach, Loveland, CO, USA), respectively. The total organic carbon (TOC) of raw water, membrane filtrates, and chemical cleaning solutions was analyzed by TOC-L (Shimadzu, Kyoto, Japan) with the non-purgeable organic carbon method. Excitation–emission matrix analysis for those samples was also conducted by a Cary Eclipse Fluorescence Spectrophotometer (Agilent, Santa Clara, CA, USA). Iron, manganese, calcium, and aluminum in raw and filtrated water, and inorganic extracts from membranes were measured by inductively coupled plasma mass spectrometry (Agilent 7500cx, Agilent, Santa Clara, CA, USA).

2.5. Fouling Analysis

The unified membrane fouling index (UMFI), which was developed to analyze membrane fouling both in constant pressure mode and constant flow-rate mode for comparing fouling tendency in bench-scale experiments and full-scale operation [16,17], was applied to analyze membrane fouling in this study. Filtration resistance ( R ) is the sum of clean membrane resistance ( R m ), hydraulically reversible resistance ( R HR ), hydraulically irreversible resistance ( R HI ), and chemically irreversible resistance ( R CI ).
R total   =   R m   +   ( R HR   +   R HI   +   R CI )   =   R m   +   R f .
If the simplifying assumption is made that total fouling resistance increases linearly with the filtered volume, fouling resistance ( R f ) can be described as R f = k f V , where k f is a rate constant for the increase in resistance and V is the specific filtration volume (filtered volume per membrane surface area).
Specific flux J S was calculated as follows:
J S = J Δ P   =   1 μ ( R m   +   k f V ) ,
where J is the flux, Δ P is the transmembrane pressure, and μ is the viscosity.
Filtration performance can be normalized by dividing J / Δ P at any specific volume by the following initial condition:
J S   =   ( J / Δ P ) V ( J / Δ P ) 0 = 1 1   +   k f R m V ,     or       1 J S   =   ( J / Δ P ) 0 ( J / Δ P ) V = 1   +   ( k f R m ) V .
For a single filtration cycle between hydraulic backwashes, the total fouling index (TFI) can be related to the normalized specific flux and the specific volume as follows:
1 J S   =   1   +   ( TFI ) V .
For multiple hydraulic backwash cycles without any chemical cleaning, the hydraulically irreversible fouling index, HIFI, can similarly be related to average values of JS’ during individual filtration cycles and V as follows:
1 J S   =   1   +   ( HIFI ) V .
The slope in a plot of 1 / J S versus V represents the hydraulically irreversible fouling index (HIFI). This HIFI value can be interpreted as the rate of hydraulically irreversible fouling development and, thus, utilized to quantify fouling mitigation effect, for example, by coagulation pre-treatment [17]. In another study, the HIFI values were utilized to show the influence of biopolymer concentration on the hydraulically irreversible fouling rate through the filtration of different surface waters [18]. Because no chemical cleaning was applied to the filtration experiments in this study, the total fouling index (TFI) is the sum of HIFI and hydraulically reversible fouling index (HRFI), TFI = HIFI + HRFI [17].
Fouling resistance ( R f ) developed by filtration or fouling resistance remaining after chemical cleaning can be shown as follows:
R f R m   =   R total     R m R m .

3. Results and Discussions

3.1. Water Quality of Raw Water and Filtrate

The water samples were taken in the dry season in November 2014 and March 2015. The turbidity and DOC, iron, and manganese contents of the raw water with and without storage are shown in Table 1, Table 2, Table 3 and Table 4.
In November 2014, after two days of storage, the turbidity was decreased from 16.1 NTU to 9.8 NTU, which corresponds to a 39% reduction. TOC was also reduced from 2.8 mg∙L−1 to 2.1 mg∙L−1 by storage (25% reduction), while DOC, which is shown in the “filtrate” row in Table 1, was reduced from 2.4 mg∙L−1 to 2.1 mg∙L−1 (13% reduction). It is important to note that, after storage for two days, the TOC concentration became almost the same as the DOC concentration. The reduction of UV254 from 0.045 to 0.038 (16% reduction), which represents the concentration of ultraviolet (UV)-absorbing matter, was less than the TOC; thus, the specific UV absorbance (SUVA) value increased slightly after storage. The oxidation–reduction potential (ORP) values increased slightly from 180 mV to 194 mV, indicating that the raw water was maintained in an oxic condition during the storage period. The dissolved organic matter contained a soluble microbial by-product-like fraction and humic and fulvic acid fractions according to the fluorescent excitation–emission matrix (EEM) result of raw water (data not shown).
In March 2015, the turbidity was 42.5 ± 9.1 NTU, which was higher than that of November 2014. Contrary to November 2014, TOC was not reduced by storage. UV254 for the samples in March 2015 was not determined due to the limitation of the sample volume. EC was lower and ORP was higher than in November 2014. According to these results, although both November and March were in the dry season, the river water in March 2015 was more affected by the precipitation compared to November 2014. In general, rain water contains fewer ions and is in relatively oxic conditions, which led to lowering EC and the increase of ORP of river water in March 2015. The rainfall also caused erosion and/or washout of soil and mixing of bottom sediment, which led to higher turbidity. After storage, turbidity was reduced to 27.0 ± 4.5 NTU. Higher water temperature was due to the higher atmospheric temperature of March, which is the second hottest month to April in Thailand.
Table 3 and Table 4 show the concentration of inorganic substances in the raw and filtered water before and after storage in November 2014 and March 2015. Concentrations of total iron and total manganese in the raw river water in November 2014 were 0.87 mg∙L−1 and 0.24 mg∙L−1, respectively. These iron and manganese components were geologically derived. Most of the total iron in the raw water existed in a particulate form, as indicated by the low dissolved iron levels before storage (0.01 mg∙L−1). This is also supported by the concentration of soluble iron (S-Fe) in the filtrate. However, most of the manganese in the raw water existed in a dissolved form, as evidenced by the total manganese (T-Mn) concentration of 0.24 mg∙L−1 and soluble manganese (S-Mn) concentration of 0.23 mg∙L−1. The T-Mn concentration slightly decreased to 0.20 mg∙L−1 after storage (17% reduction), but S-Mn was significantly reduced to 0.12 mg∙L−1 (48% reduction). The filtrate concentration was even less at 0.09 mg∙L−1. Although precipitation of oversaturated manganese carbonate and manganese hydroxide could take place in natural waters, their solubility (MnCO3 14.5 μM; Mn(OH)2 61.8 μM, [19]) is higher than the manganese concentrations in the raw water samples in this study. Thus, it was found that the dissolved manganese (S-Mn) was oxidized by two days of storage under oxic conditions.
Among other metals, calcium was present at the highest concentration (30.6 mg∙L−1), followed by magnesium (6.4 mg∙L−1), sodium (6.2 mg∙L−1), and aluminum (0.7 mg∙L−1).
In March 2015, the concentration of total iron (T-Fe) in the raw river water was 2.12 mg∙L−1, which was higher than that in November 2014, and total manganese (T-Mn) was 0.30 mg∙L−1, which was comparable to that in November 2014. While most of the iron existed in a particulate form as indicated by the low dissolved iron levels before storage, about two-thirds of T-Mn existed in a dissolved form as indicated by the dissolved manganese (S-Mn) levels before storage (0.21 mg∙L−1). T-Fe concentration was reduced to 1.02 mg∙L−1 (52% reduction) after storage due to the settling. T-Mn concentration was reduced to 0.07 mg∙L−1 (77% reduction) and S-Mn concentration was reduced from 0.21 mg∙L−1 to 0.01 mg∙L−1 (95% reduction) after storage.

3.2. Manganese Oxidation and Removal by Storage

Most soluble manganese exists as Mn(II). Mn(II) oxidation by dissolved oxygen, as shown by Equation (7), is thermodynamically unfavorable and hardly occurs in natural waters [20].
Mn 2 +   +   1 4 O 2   +   3 2 H 2 O     MnOOH ( s ) + 2 H + .
Diem and Stumm (1984) reported that Mn(II) oxidation by O2 did not occur in a time frame of years in solutions which were homogeneous with respect to Mn(II) (not oversaturated with regard to MnCO3 or Mn(OH)2) and were sterile [21]. However, when oversaturated with MnCO3 or Mn(OH)2, Mn(II) was oxidized to about one-fifth of the initial concentration within several days due to surface complexation on MnCO3 or Mn(OH)2 with Mn(II). Mn(II) oxidation rate is also enhanced on metal oxide surfaces [22,23]. In addition, microbial activity involves and enhances Mn(II) oxidation in natural waters [21,24,25], although there is no unequivocal evidence directly linking Mn(II) oxidation to energy conservation [26].
Manganese oxidation reaction kinetics can be described as follows [21]:
d [ Mn ( II ) ] d t = k 1 [ Mn ( II ) ] + k 2 [ Mn ( II ) ] [ MnO 2 ] ,
where k 1 is the rate constant for the oxidation of dissolved manganese, and k 2 is the rate constant for the autocatalytic oxidation. MnO 2 is supposed to be produced by the oxidation of Mn ( II ) , shown as follows:
d [ Mn ( II ) ] d t = d [ MnO 2 ] d t ,
[ MnO 2 ] = [ Mn ( II ) ] 0 [ Mn ( II ) ] + [ MnO 2 ] 0 ,
where [ Mn ( II ) ] 0 is the initial concentration of dissolved manganese, and [ MnO 2 ] 0 is the initial concentration of MnO 2 , which is assumed to be zero. If manganese oxidation by the autocatalytic reaction as shown in Equation (8) was significant during the storage, the reduction rate of Mn ( II ) would not follow the pseudo-first-order kinetics, but would be curved as [Mn(II)] decreased. However, in Figure 3, the decreasing rate of ln[Mn(II)] follows a straight line, indicating k1[Mn(II)] >> k2[Mn(II)][MnO2]. Thus, under the storage condition in this study, the autocatalytic oxidation of Mn ( II ) was estimated to be negligible.
From Figure 3, the pseudo-first-order rate constant ( k 1 ) was estimated to be 0.33 day−1 or 2.3 × 10⁻⁴ min−1 for the experiment in November 2014, and 0.92 day−1 or 6.4 × 10⁻⁴ min−1 for the experiment in March 2015, values which were larger than the value of less than 2 × 10⁻⁶ min−1 (pH 8.35, pO2 = 1.0 atm) for homogeneous conditions with respect to Mn(II), but smaller than the values of 3.0 × 10⁻³ min−1 (pH 8.5, pO2 = 0.21 atm) or 1.2 × 10⁻² min−1 (pH 8.5, pO2 = 1.0 atm) in the presence of a metal oxide, i.e., goethite ( α FeOOH , 10 mM Fe) [23]. Thus, in the storage condition of this study, the manganese oxidation rate might be accelerated possibly due to the presence of other metal oxides than MnO2 on the suspended solids. The Ping River water was highly turbid and contained total iron, most of which existed as suspended solids of iron oxide. The surface of these iron oxide solids could serve as Mn(II) oxidation sites, which was supported by the higher oxidation rate for March 2015 with the higher total iron concentration of 2.12 mg/L than that for November 2014. However, the concentrations of iron oxide in the Ping River water were much smaller than the goethite concentration (550 mg/L as Fe) reported in a previous study [23], which led to the smaller rate constant found in the storage condition in this study.
For the membrane fouling by inorganic substances such as iron or manganese through long-term operation, comparatively larger iron-oxide particles initially clogged pores and, afterward, smaller manganese was oxidized and precipitate in the membrane pores [27,28]. However, the filtration term of this study was so comparatively shorter than those previous studies that the severe fouling by manganese did not start during filtration experiments, even though the Mn(II) was reduced by storage. This is also supported by analysis of extracted foulants shown in Section 3.8.

3.3. Iron Removal by Storage

Total iron (T-Fe) was removed by the gravitational settlement of iron-containing particles during storage, since most of the iron in the raw water existed in the particulate form in both November 2014 and March 2015, as indicated by the low dissolved iron levels before storage (Table 3 and Table 4). In March 2015, T-Fe concentration decreased from 2.12 mg/L to 1.02 mg/L after two days of storage, which was about a 50% reduction, and almost three days were required for more than 75% removal (Table 4 and Figure 4). However, it was found difficult to remove most of the iron-containing particles by gravity settlement within several days because of the presence of small-sized iron-containing particles in Ping River as reported elsewhere [27,29]. Consequently, substantial amounts of iron-contacting particles remained in the raw water even after storage, and they were retained on the membranes as a dominant foulant during the membrane filtration process, as described in Section 3.8.

3.4. Organic Carbon Reduction during Storage

Total organic carbon (TOC) was reduced from 2.8 mg/L to 2.1 mg/L by storage in November 2014, while almost no TOC reduction by storage was observed in March 2015 (Table 1 and Table 2).
The difference between TOC and DOC in November 2014 could be interpreted as particulate organic matter (POC). Thus, the reduction of TOC was due to settling of POC and precipitation of a portion of dissolved component during storage. On the other hand, TOC was not reduced by storage in March 2015. Although the average DOC value was reduced, the variance was large, and a statistically significant difference was not observed between DOC concentrations before and after storage.
The difference between these two results may be attributed to the difference of co-existing cation concentration of the raw water in November 2014 and March 2015. The co-existing cations had an important role for the fate of the organic matter during storage. Divalent metal ions, such as calcium ion (Ca2+) or magnesium ion (Mg2+), enhance the adsorption capacity of metal oxide by alternating surface charge from negative to positive [30], as well as the aggregation of metal oxide–organic matter complexes by charge neutralization [31]. As Ca2+ concentration in November 2014 (0.75 mM or 30 mg/L) was higher than that in March 2015 (0.4 mM or 16.5 mg/L), these mechanisms were supposed to promote DOC removal during storage in November 2014.

3.5. Membrane Filtration Flux

Figure 5 shows the flux normalized at 100 kPa versus the specific filtration volume V (m3∙m−2) throughout the whole filtration experiments with periodical hydraulic backwash in November 2014 (Figure 5a) and in March 2015 (Figure 5b).
Through the whole filtration cycles in November 2014, the flux without storage condition was reduced from 58.2 m3∙m−2∙d−1 to 12.3 m3∙m−2∙d−1, and that with storage condition was reduced from 55.9 m3∙m−2∙d−1 to 15.7 m3∙m−2∙d−1. As the degree of flux reduction without storage condition was larger, it indicated that raw water storage mitigated fouling development.
On the other hand, the fluxes without and with storage conditions in March 2015 were reduced from 43.5 m3∙m−2∙d−1 to 11.7 m3∙m−2∙d−1 and from 53.7 m3∙m−2∙d−1 to 11.1 m3∙m−2∙d−1, respectively. Storage led to a higher initial flux, probably due to the turbidity reduction (42.5 NTU to 27.0 NTU). However, final fluxes were within the similar range. Thus, it is indicated that the influence of turbidity reduction diminished as the membrane fouling developed.
Flux reduction during each filtration cycle for both without and with storage condition in March 2015 was more severe than that in November 2014, which was easily noticeable for the early stage of the filtration cycles. The final fluxes for both conditions in March 2015 were lower than those in November 2014. The higher turbidity led to a rapid increase of transmembrane pressure in the operation mode of the constant flow rate [8]. Thus, this noticeable reduction of flux in the constant pressure operation mode would be due to the high turbidity in the raw water in March 2015 (42.5 ± 9.1 NTU) compared to November 2014 (16.1 NTU).

3.6. Hydraulically Irreversible Fouling

Figure 6 shows 1 / J S versus V throughout the whole experiment in this study with periodical hydraulic backwash. The plotted values of 1 / J S versus V were the averages of duplicate measurements. Linear regression lines were drawn from the data for the whole experiment. The slopes of the regression lines represent the hydraulically irreversible fouling index (HIFI) [17].
In November 2014, the difference between the HIFI values for filtration with and without storage (0.54 and 0.86 m2∙m−3, respectively) clearly shows the mitigation effect on membrane fouling by storage (Figure 6a). This difference between the two conditions is in agreement with the reduction of turbidity, organic matter, iron, and manganese by storage (Table 1 and Table 2). For the fouling by organic matter, large hydrophilic organic matter is reported to contribute mainly to the physically irreversible fouling for the PVDF membrane [32], due to the strong hydrogen bonding between the hydroxyl group in the organic matter and the fluorine in the PVDF membrane material [33]. Furthermore, comparatively large-sized iron oxide contributes to the initial fouling development by blocking membrane pores [27,28]. Thus, raw water storage plays an important role of reducing these foulants, even though it is not possible to identify each specific contribution.
In contrast to November 2014, the HIFI value for 8-h filtration with storage (0.78 m2∙m−3) in March 2015 was larger than that without storage (0.64 m2∙m−3). A possible reason for the higher HIFI value for filtration with storage in March 2015 was its higher initial flux (54 m3∙m−2∙d−1) than that without storage (43 m3∙m−2∙d−1), which was due to the turbidity reduction by storage (Figure 4b, inset graphs). According to the calculation equations for HIFI (Equations (3) and (5)), HIFI value is normalized by the initial flux ( J / Δ P ) 0 . Consequently, a higher initial flux could lead to an apparently higher 1 / J S value than the filtration with a lower initial flux, even though the terminal fluxes are comparable. Then, an apparently higher HIFI value could be derived. Therefore, the evaluation of the membrane fouling for the membrane filtration with the different initial fluxes, such as that in March 2015, by using HIFI is not appropriate and an alternative index is necessary to better elucidate the results of different initial fluxes instead of HIFI.

3.7. Contribution of Turbidity Removal

In this section, the influence of turbidity removal by storage on the cake resistance is discussed. Raw water storage reduced turbidity from 16.1 NTU to 9.8 NTU in November 2014 and from 42.5 NTU to 27 NTU in March 2015, due to the settling of the larger-sized suspended solids. The reduction of solid load on the membrane surface resulted in the reduction of cake layer thickness formed on the membrane surface, which led to the lower filtration resistance. On the other hand, the reduction of larger particles in the cake layer led to a less porous and denser cake structure with higher filtration resistance than that without storage. Thus, the combination effect of the cake layer thickness and cake layer porosity should be considered to understand the effect of turbidity removal.
The settling diameter of particles after storage was estimated by Stokes’ law, shown in Equation (11).
v SL   =   g ( ρ p     ρ ) d p 2 18 μ ,
where v SL is the terminal settling velocity (m∙s−1) in the laminar flow condition, g is the acceleration of gravity, 9.8 m∙s−2; ρ p is the density of particles, 2.7 g∙cm−3; ρ is the density of water, 0.997 g∙cm−3 at 25 °C; d p is the diameter of the particles (m), and μ is the dynamic viscosity, 8.9 × 10⁻³ Pa·s at 25 °C.
The turbidity of suspended particles after two days of storage was 9.8 NTU in November 2014, and 27 NTU in March 2015. In this study, we used a tank with a water depth of about 50 cm for storage. From Equation (11), the diameter of a particle with the settling velocity of 0.25 m∙d−1, or 0.5 m per two days, was estimated to be 1.67 μm, with the assumption of the particle density as 2.7 g∙cm−3. Thus, it can be estimated that the raw water after storage only contained particles smaller than a few micrometers.
Suspended solids in raw water contribute to the cake layer formation on a membrane surface during one filtration cycle. If the fouling resistance was dominated by the cake layer on top of the membrane surface, cake resistance during filtration can be expressed as follows [7]:
R C   =   ( α cake A ) m cake .
If the cake layer is mainly composed of particles, the specific cake resistance of the cake layer, α cake , can be expressed by
α cake   =   ( 1     ε ) 2 ( S p / V p ) 2 5 ρ p ε 3 = 36 ( 1     ε ) 2 5 ρ p ε 3 d p 2 ,
where R C is the cake resistance, A is the membrane surface area, m cake is the cake mass, ε is the porosity of the cake layer, and S p , V p , and ρ p are the surface area, volume, and density of the individual particle, respectively.
The specific fouling resistance, i.e., filtration resistance per cake layer, increased because the mean diameter of particles in the cake layer decreased after storage, while the total amount of the cake ( m cake ) was reduced. Thus, the total effect of raw water storage was determined by the balance between the reduced amounts of cake-layer deposits and the increased specific resistance.
In November 2014, HIFI was reduced by storage (Figure 6a) due to the reduction of turbidity and other foulants. This indicated that the fouling mitigation effect by the reduction of cake mass ( m cake ) was larger than the fouling resistance increase by the porosity reduction of cake due to decrease in the mean diameter of particles.
The reason why the clear effect of storage appeared after several filtration cycles in November 2014 (Figure 6a) was probably due to the transition of the dominant fouling mechanism from pore clogging to the cake filtration. This can be explained by the ratio of the average hydraulically reversible fouling index (HRFI) to total fouling index (TFI) for each filtration cycle (HRFI/TFI) shown in Figure 6a. Because no chemical cleaning was applied to the filtration experiments in this study, TFI represents the combined effects of the hydraulically reversible and irreversible fouling without any effect of chemical cleaning. The HRFI/TFI values for the first two cycles of filtration without and with storage were 0.16 and 0.37, and 0.54 and 0.62, respectively, which were smaller than those of after the third cycle. The smaller HRFI/TFI value indicated that the hydraulically irreversible fouling due to pore clogging [34] was dominant in the initial stage of filtration cycles, even when TFI values were small. Furthermore, relatively larger initial HRFI/TFI values for the filtration with storage than those for without storage condition supported the positive effect of storage on the physically irreversible fouling mitigation. As the filtration cycle increased, the relative influence of hydraulically irreversible fouling was reduced due to the development of cake layer on the membrane surface.
In contrast, in March 2015 (Figure 7b), HRFI/TFI values without and with storage in March 2015 were above 0.8 for the whole filtration cycles. Higher HRFI/TFI values, especially for the beginning of the filtration cycles, indicated that the influence of hydraulically reversible fouling was relatively larger than hydraulically irreversible fouling. This relatively larger influence of hydraulically reversible fouling was due to the higher turbidity load from the raw river water, which resulted in a thicker cake layer formed on the membrane surface. Furthermore, the thicker cake layer associated with a higher turbidity of raw water led to lower hydraulically irreversible fouling (HIFI), since a thicker cake layer could function as a coating and reduce membrane foulants [35,36]. In March 2015, almost no difference was observed between HRFI/TFI values for the raw water without and with storage, even though the HIFI value with storage was higher (Figure 6b).
As shown above, a new indicator of the ratio of HRFI to TFI (HRFI/TFI) could explain the hydraulic reversibility of membrane fouling during the course of filtration. It was also indicated that this new index was useful for comparing the membrane filtration performance and the hydraulic reversibility of membrane fouling of different raw waters.

3.8. Fouling Resistance and Influence of Foulants

The total amounts of foulants extracted from the membranes by each chemical cleaning step and acid digestion are shown in Figure 8. Both with and without storage conditions, iron and aluminum were the dominant foulants extracted from the used membranes both in November 2014 and March 2015. Generally, iron and aluminum are known as being abundant elements in the Earth’s crust and are distributed widely in soil. In fact, lateritic soils, which contain higher amounts of iron oxide in any form, widely occur in southeast Asia, as in other humid tropical regions [37]. Those lateritic soils could be a source of ferruginous substances in surface water, resulting as one of the dominant inorganic foulants. As shown in Table 3 and Table 4, significant portions of iron and aluminum in the raw water existed in suspended form, and, as described in Section 3.7, the suspended particles after storage were estimated to be smaller than 1.67 µm. These smaller particles of iron and aluminum clogged and remained inside the membrane pores due to the physical irreversibility [27,38]. The total extracted amount of other inorganic substances (i.e., Mn, Ca) was less than one-fifth of iron or aluminum. Although the manganese concentration in the raw water was not so low, the amount of manganese retained on the membrane was small because most of the manganese existed in dissolved form before the storage (Table 3 and 4), and oxidized manganese was removed from the raw water due to precipitation after storage, as shown in Section 3.2.
The amount of silica and organic carbon extracted from the membrane in March 2015 was larger than in November 2014.
In November 2014, the total retained amount of inorganic substances, with the exception of manganese, decreased with storage, which can be explained by the settling of suspended inorganic matter during storage. On the other hand, the retained amount of manganese increased with storage by more than 75% due to the oxidation of manganese during storage, as described in the above section, and the retention of manganese precipitated on the membrane. The amount of organic matter retained on the membrane decreased almost by half, even when the extracted amounts were small compared to inorganic substances. This was supported by the removal of a wide fraction of organic matter shown in the EEM analysis of alkaline extracts (Figure S1, Supplementary Materials). According to these results, the decreased fouling resistance in the experiment with storage was attributed to the decrease in inorganic and organic foulants on the membrane.
In March 2015, the amounts of extracted foulants were not significantly different without and with storage, although the fouling resistance was slightly higher with storage conditions than that without storage. The higher fouling resistance of the condition with storage in March 2015 was probably due to the decreased porosity of the fouling layer and higher initial flux. The average sizes of the inorganic particles composing the fouling layer with storage were smaller than without storage, although the amount of inorganic foulants was within a similar range both without and with storage, which led to increased resistance in the condition with storage. The compaction of the fouling layer due to the higher initial flux with storage condition also led to the increase in the fouling resistance. According to these results, the effect of raw water storage is dependent on raw water quality and, thus, a preliminary experiment is required to decide whether a storage tank will be installed.
Compared to the results in November 2014, the amounts of dominant iron and aluminum were less in Mach 2015. On the other hand, the amounts of silica and organic matter were larger in March 2015 than in November 2014. The increase in the silica retained on the membrane in March 2015 was probably due to the difference in type and amount of clay mineral in raw river water as indicated by the turbidity difference in these two seasons (Table 1 and 2). The increase in the retained organic matter in March 2015 might be due to the difference in the composition of organic matter or the larger DOC concentration in raw water. According to these comparisons, dominant inorganic substances such as iron and aluminum did not seem to have a significant influence on the increase in fouling resistance in March 2015. However, silica, organic carbon, or both had a significant influence, even though the absolute extracted amount of these substances was smaller than other substances, probably due to the gel layer formation on the membrane surface by these compounds [28,39].
Furthermore, the ratio of silica to aluminum in November 2014 was smaller than that in March 2015, which indicated that the aluminum foulants in November 2014 were not associated with clay minerals, such as aluminosilicate, but probably due to aluminum-oxide particles. It is indicated that the clay mineral containing raw water may cause fouling with higher hydraulic reversibility, as shown by the index of HRFI/TFI (Figure 7b). Thus, even in the membrane filtration of highly turbid water containing a large amount of inorganic substances, the control of concentration or composition of organic matter, and the clay mineral content in the raw water are important for mitigating the fouling resistance.

4. Conclusions

In order to evaluate the effectiveness of raw water storage on membrane fouling mitigation in the membrane filtration of river water from a tropical country, membrane filtration experiments of river water in different seasons were conducted in this study. Water quality, membrane fouling development, and membrane foulants were compared between the raw water with and without storage, and the following conclusions were obtained:
  • Two days of raw water storage reduced turbidity by about 40% and also suspended inorganic substances, i.e., iron. Although particulate organic carbon was removed by storage in November 2014, no TOC removal was observed in March 2015, which was probably due to the difference in composition of organic matter in river water. According to the lower EC and pH, and higher ORP and turbidity in March 2015 than in November 2014, the effect of the precipitation was large in March 2015.
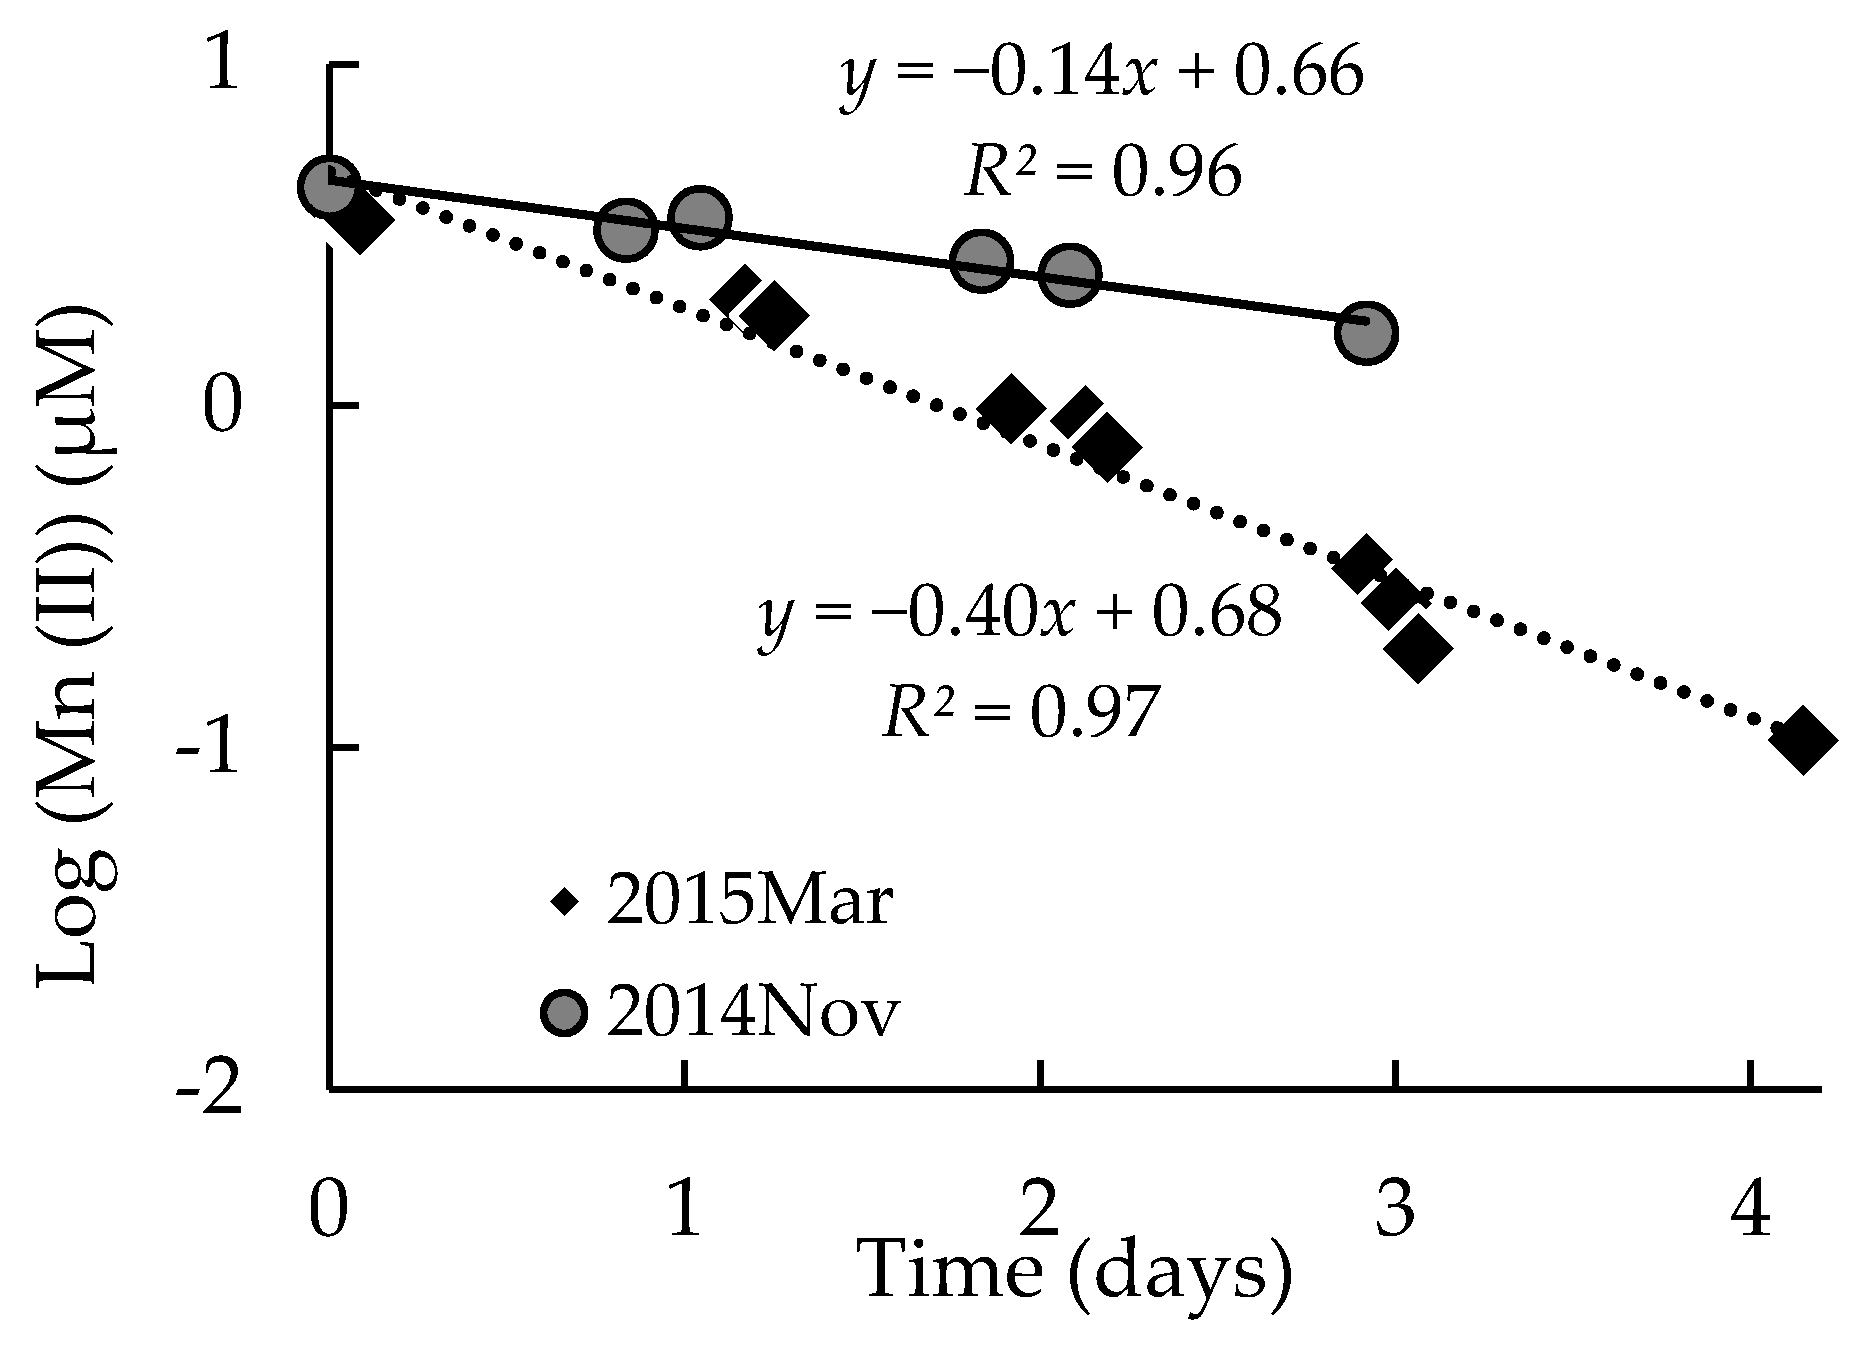
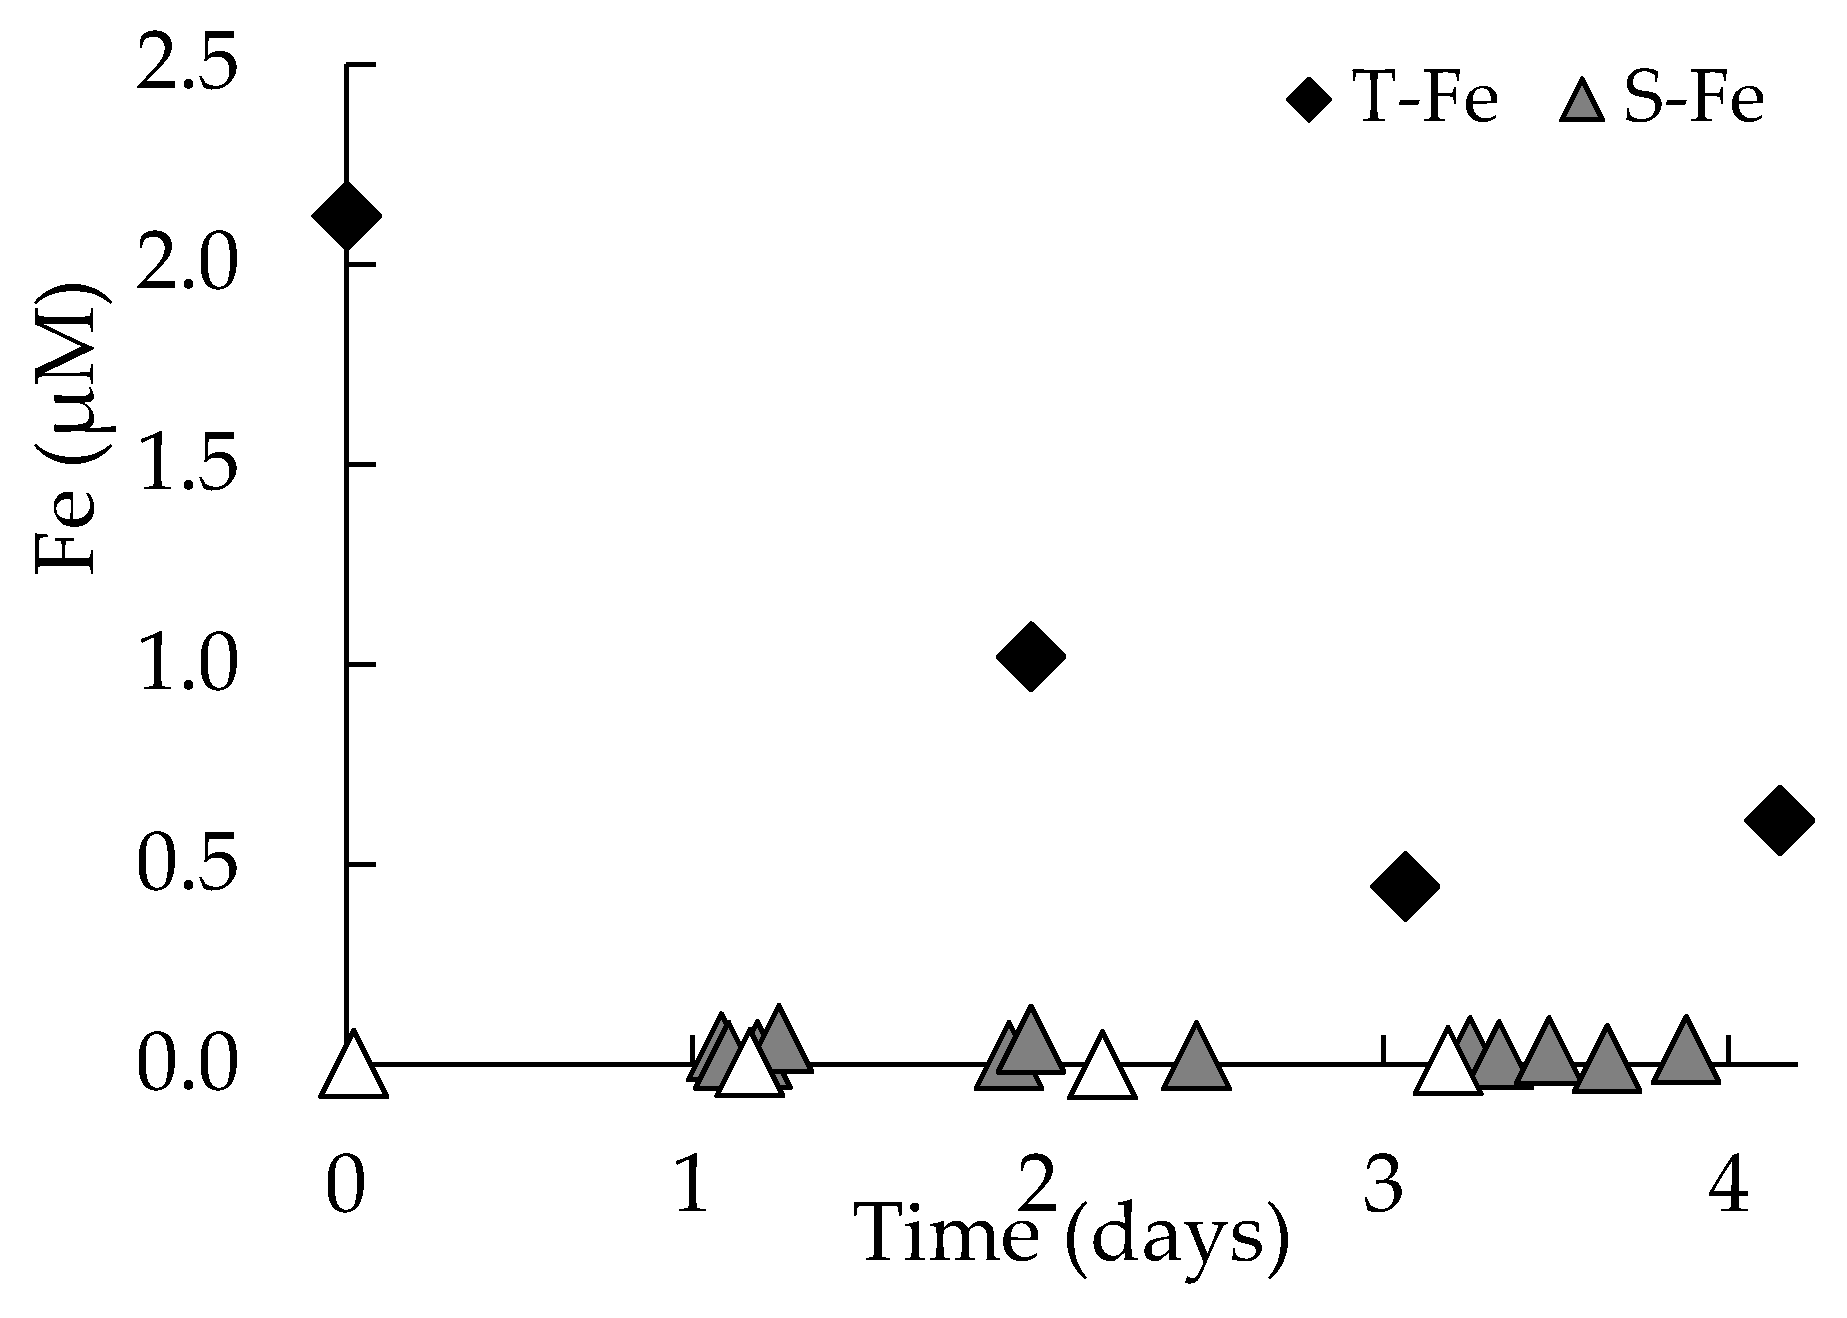
  • Although the river water contained both iron and manganese in high concentrations, most of the iron existed in particulate form, while manganese existed in dissolved form. In March 2015, iron was not removed fully by storage because almost half of it existed as small-sized particles. Dissolved manganese was oxidized to form insoluble manganese after two days of storage both in November 2014 and March 2015. The manganese oxidation reaction followed a first-order reaction, indicating that autocatalytic oxidation was not dominant. The co-existing iron-oxide concentration had an important role in the manganese oxidation reaction because the surface of iron-oxide solids could serve as Mn(II) oxidation sites, which was supported by a higher manganese oxidation rate constant in March 2015.
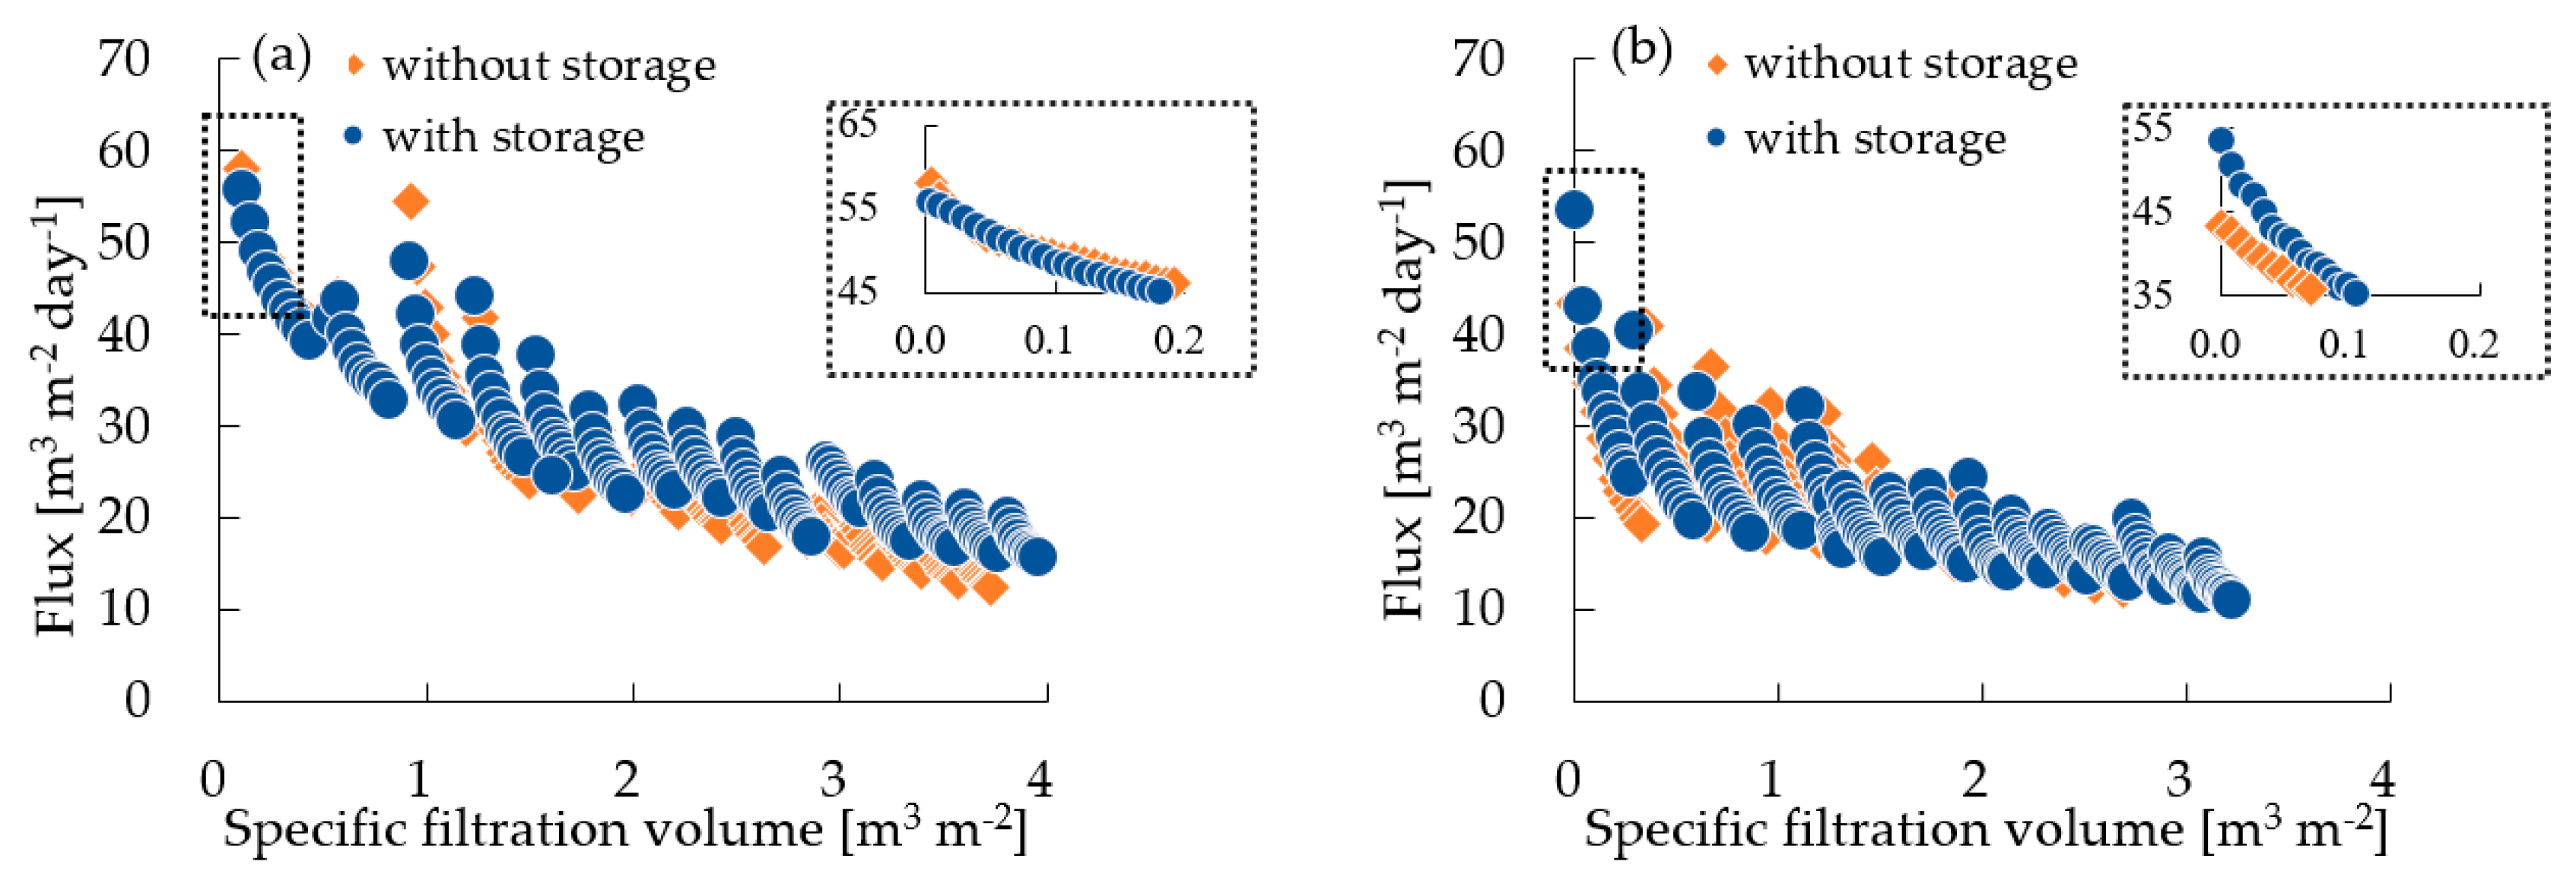
  • Storage of raw water for two days was effective in the mitigation of filtration flux decline during filtration experiments in November 2014, because of the removal of turbidity, including inorganics such as iron and manganese, and TOC. On the other hand, although the initial filtration flux was significantly increased by storage in March 2015, the filtration fluxes without and with storage at the end of the filtration cycles were within a similar range.
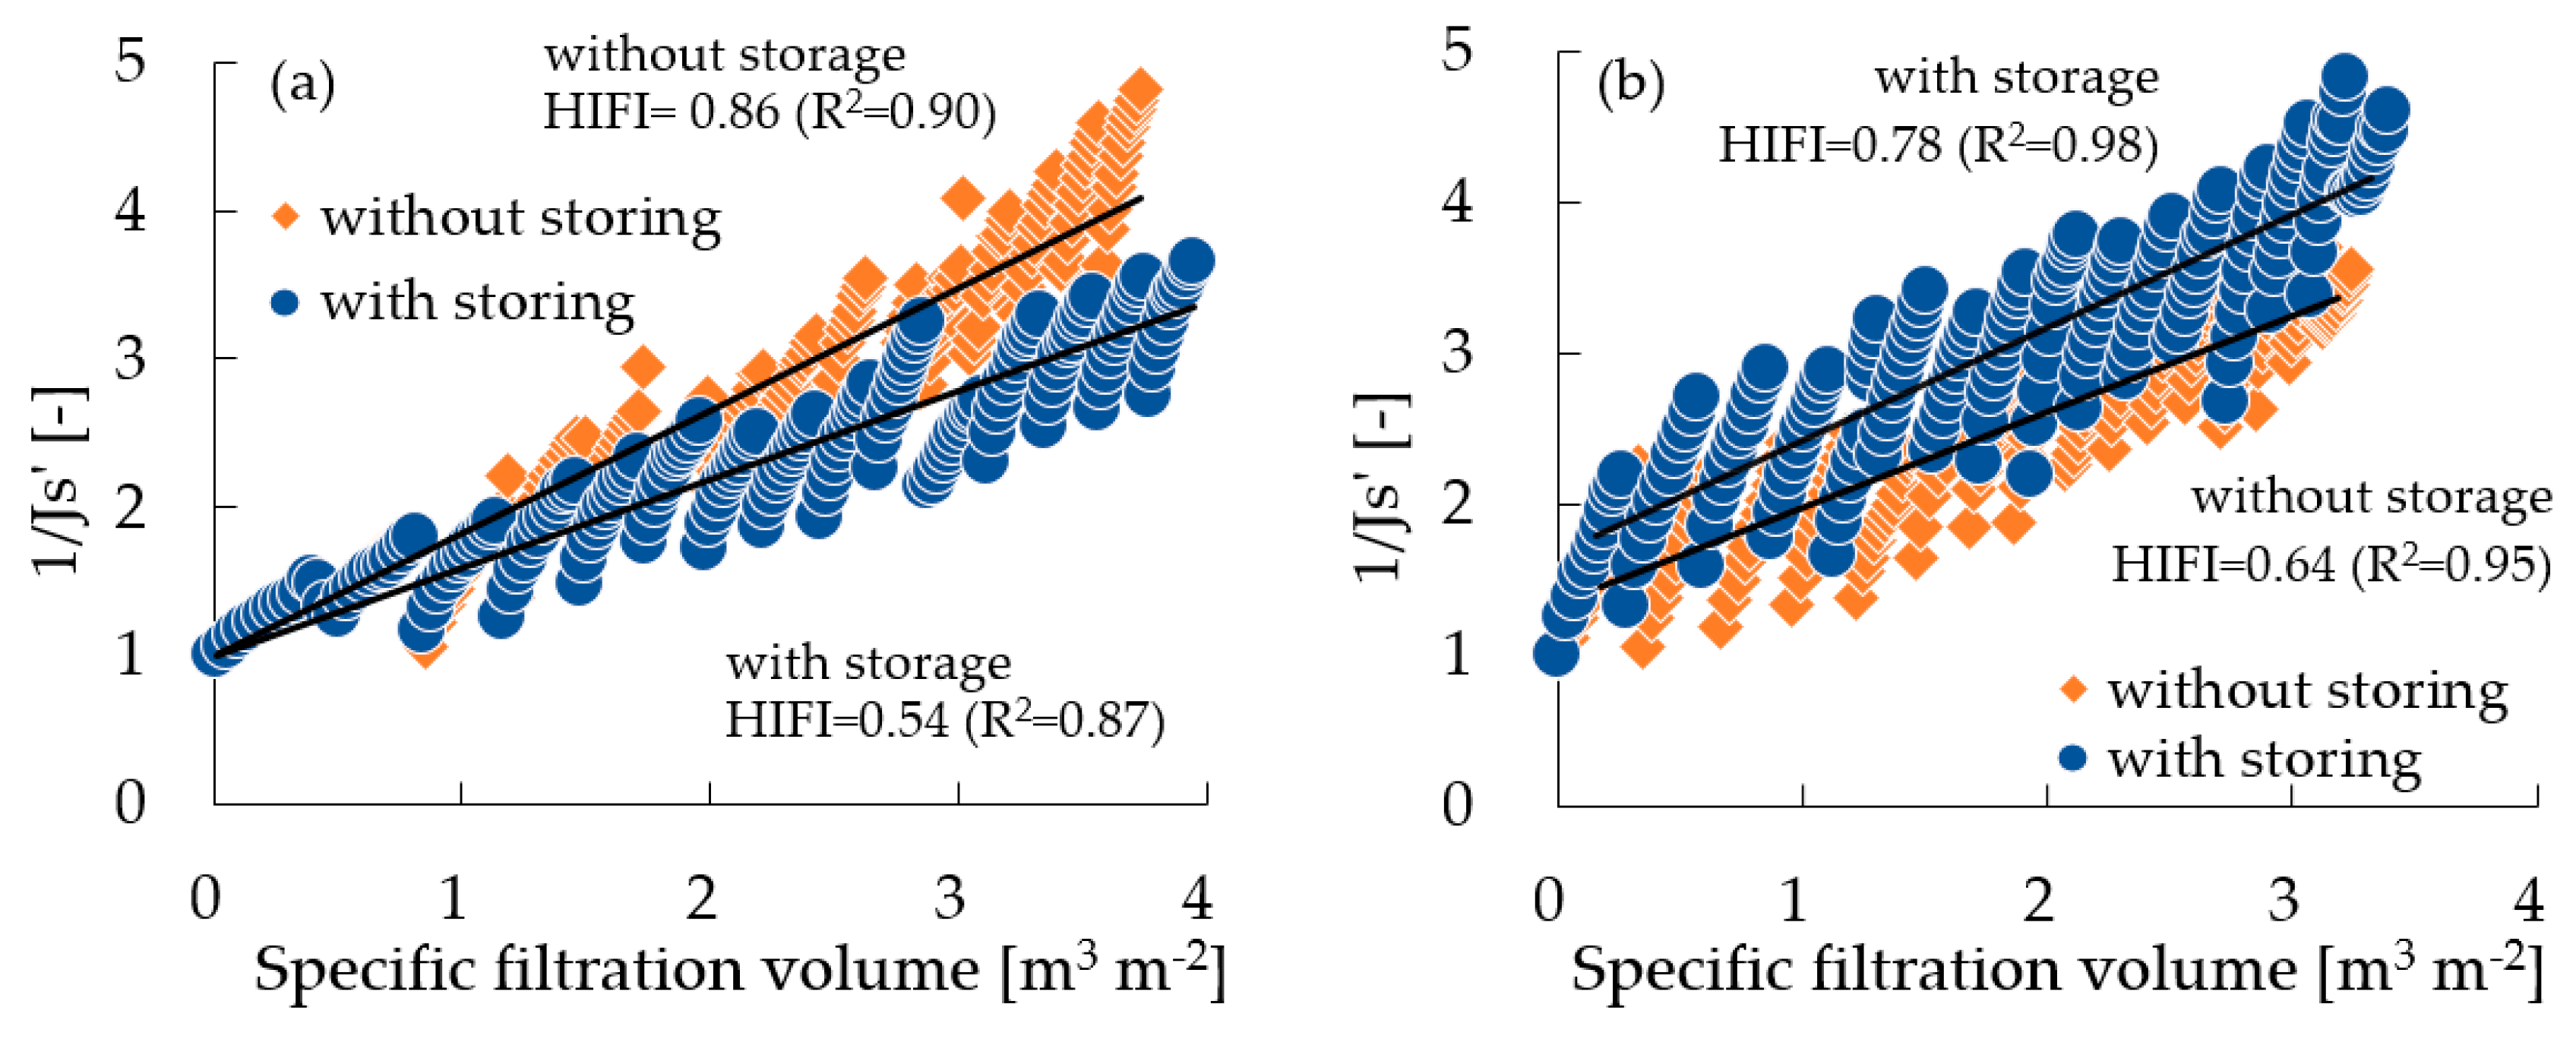
  • Although the evaluation of the hydraulically irreversible fouling development in November 2014 by HIFI clearly showed the fouling mitigation effect of storage, the HIFI increased by storage in March 2015 due to the higher initial filtration flux with storage than that without storage. Therefore, it was found that the HIFI is not an appropriate index to measure the effects of raw water storage when the initial fluxes are different between filtration experiments with and without raw water storage.
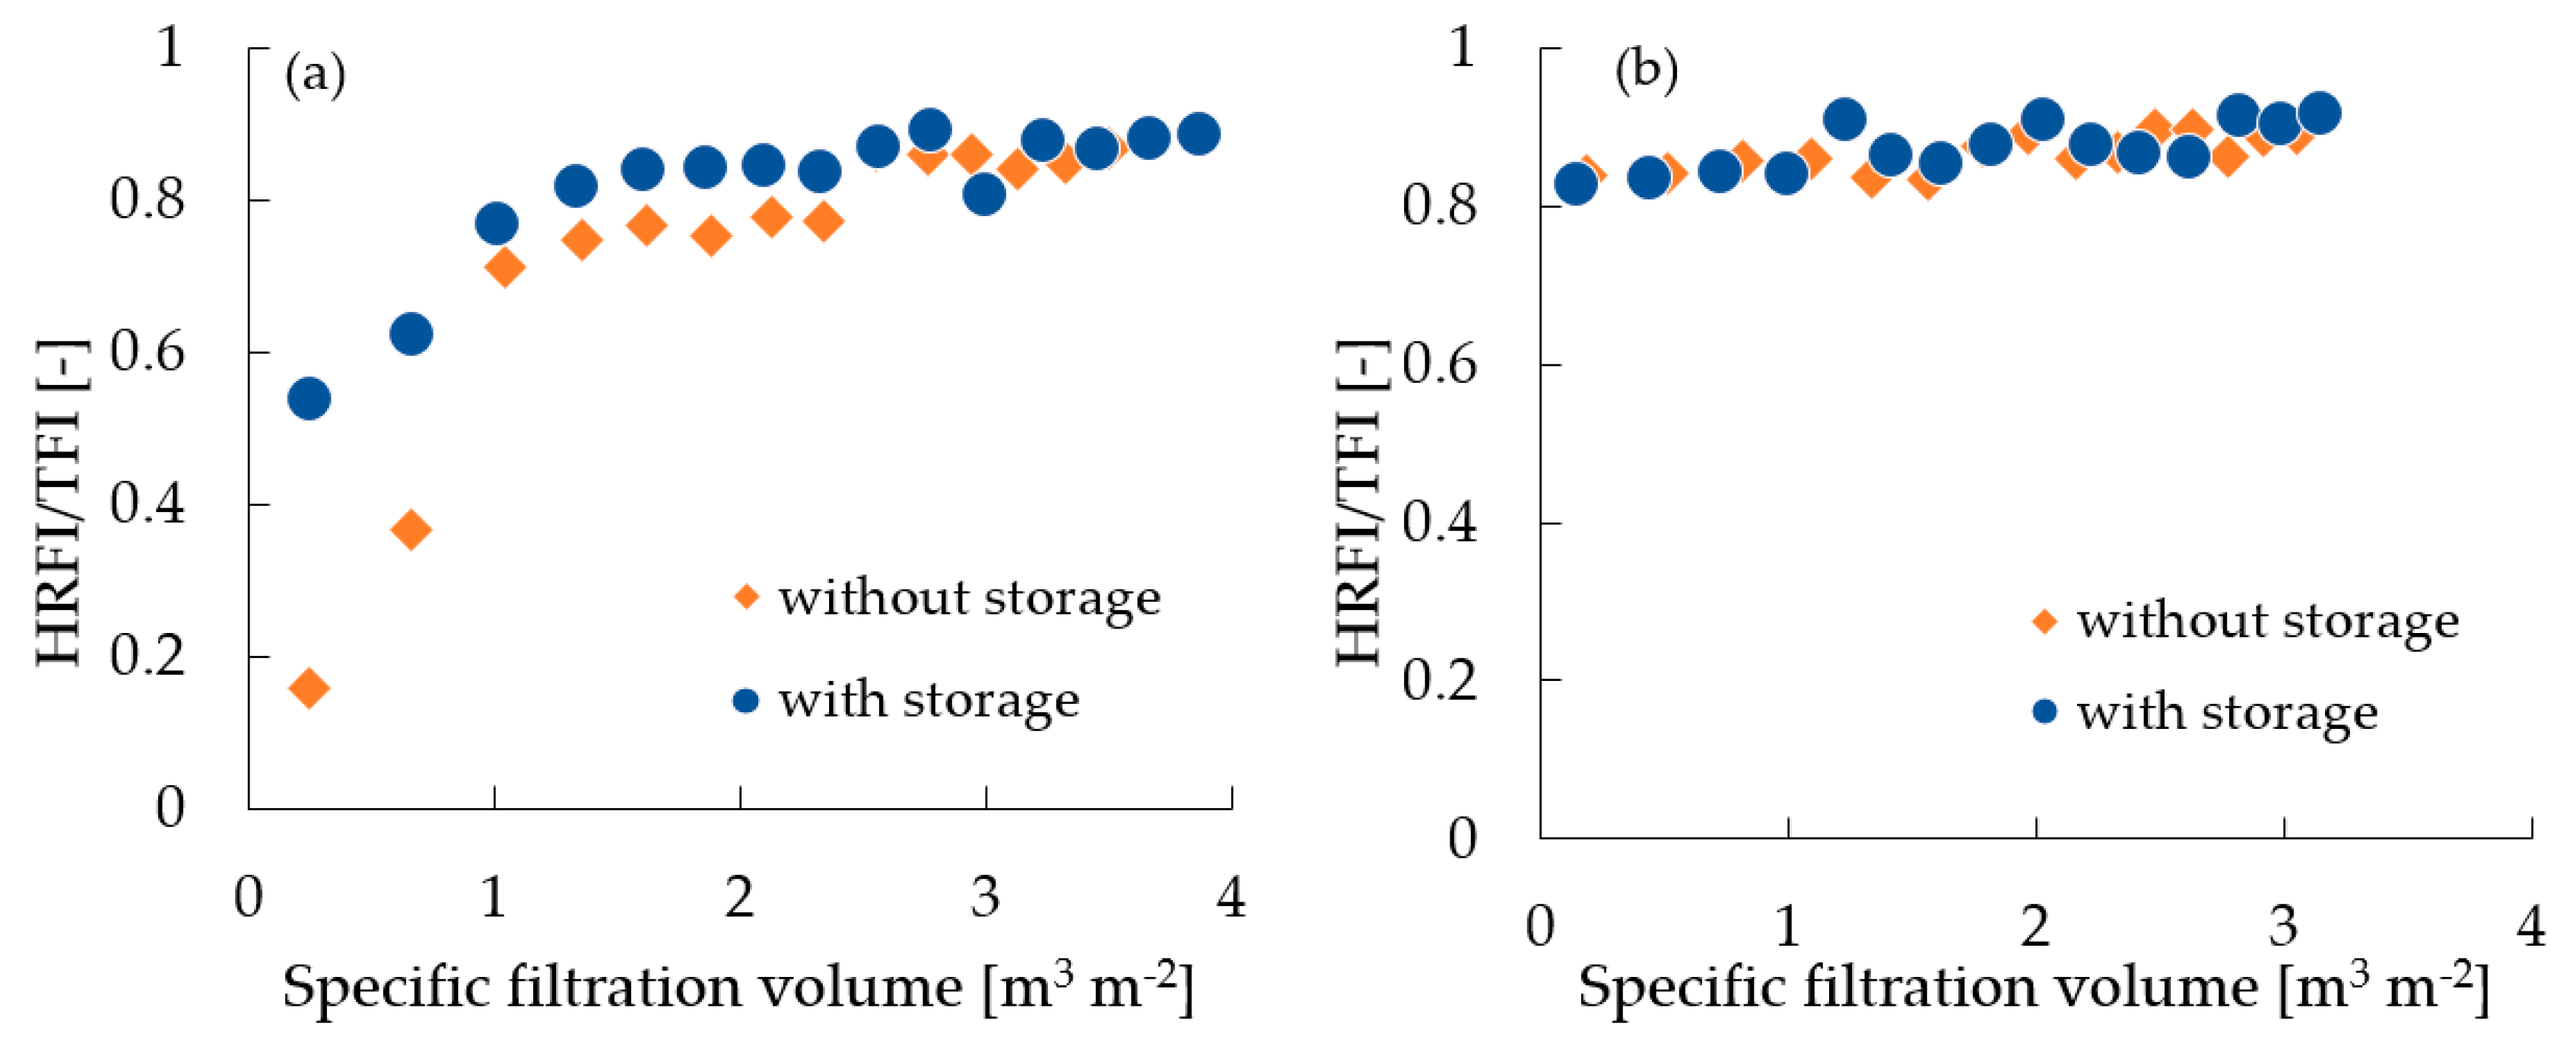
  • Thus, a new index was proposed as the ratio of the average hydraulically reversible fouling index (HRFI) to the total fouling index (TFI), i.e., HRFI/TFI, to assess the effects of raw water storage. Using this index, it was found that the effect of storage on fouling mitigation was manifest in the early stage of filtration when the hydraulically irreversible components were removed from raw water by storage.
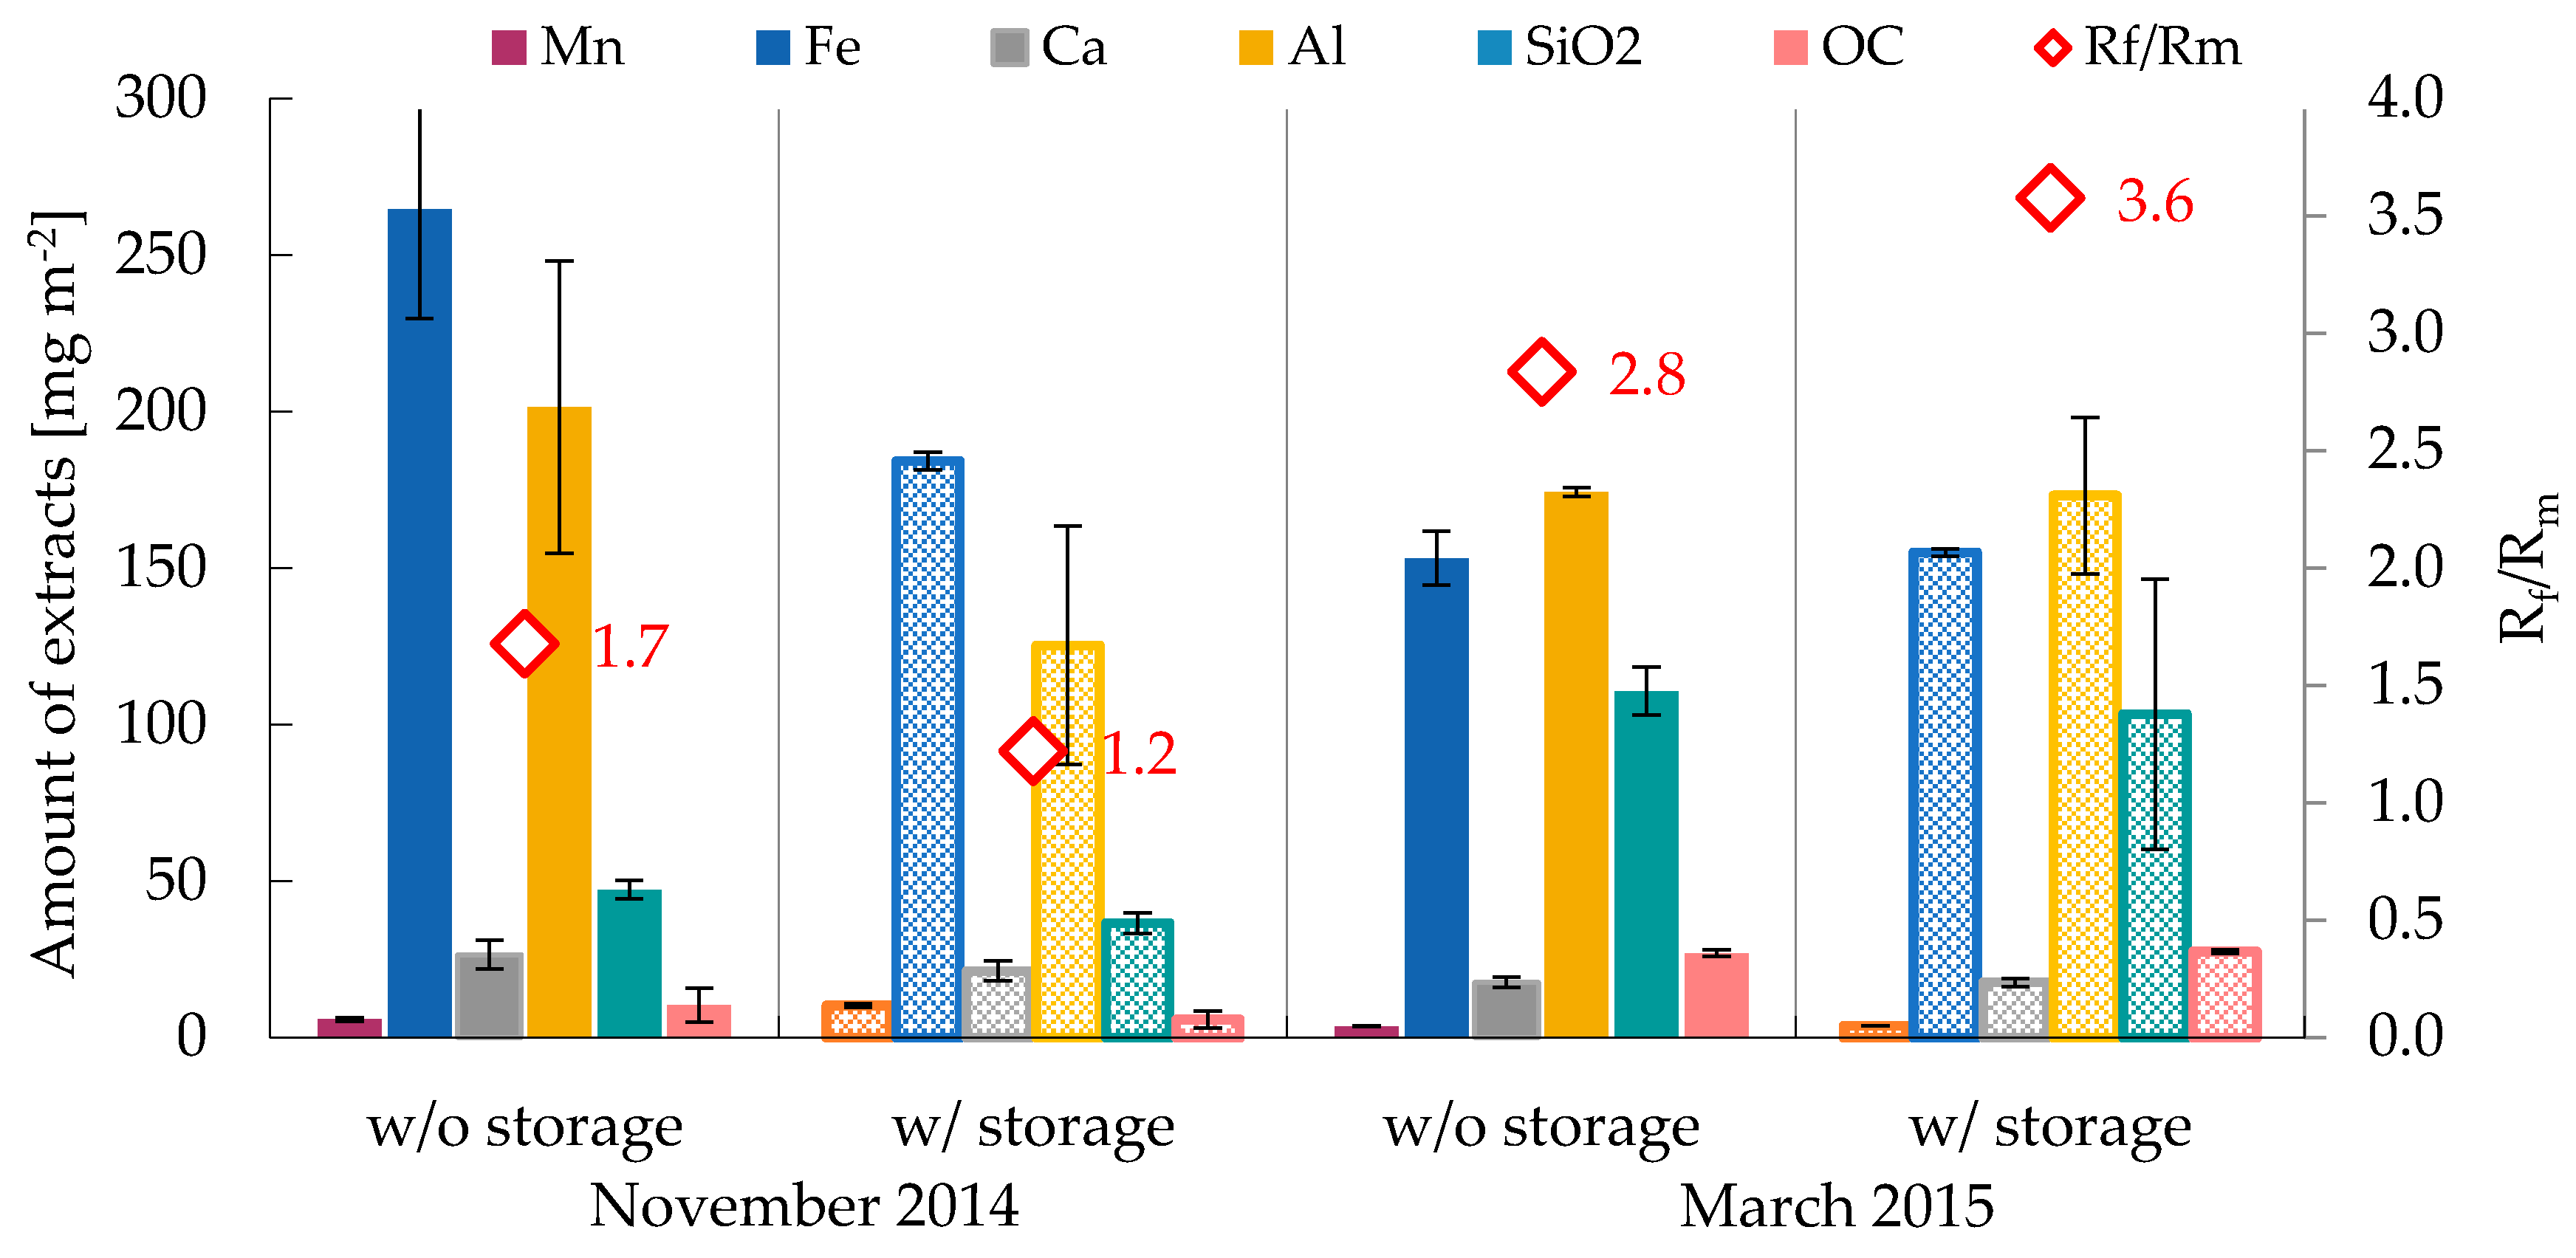
  • A comparison of the amount of foulants extracted from the used membranes in November 2014 and March 2015 revealed that silica and/or organic carbon had a significant influence on the fouling resistance even though the absolute amounts were less than other inorganic foulants. Thus, even in the membrane filtration of highly turbid water containing a large amount of inorganic substances, the control of the concentration or composition of silica and organic matter in the raw water is important for mitigating the fouling resistance.

Supplementary Materials

The following are available online at https://www.mdpi.com/2073-4441/11/8/1592/s1, Figure S1: Excitation–emission matrix (EEM) of alkaline cleaning solutions.

Author Contributions

Conceptualization, T.H. and S.T.; methodology, T.H., S.T., and A.W.; experimental investigation, T.H. and P.A.G.; writing—original draft preparation, T.H.; writing—review and editing, S.T.; project administration, S.W. and S.T.; funding acquisition, S.T.

Funding

This research was funded by a Grant-in-Aid for Scientific Research (No. 26303013 and No. 26889019) by the Japan Society for the Promotion of Sciences (JSPS).

Acknowledgments

The authors would like to thank the staff and students of the Department of Environmental Engineering, Faculty of Engineering, Chiang Mai University for their support of our experimental work.

Conflicts of Interest

The authors declare no conflicts of interest.

References

  1. Saghir, J.; Berntell, A.; Chartres, C.; Waughray, D.; Leape, J.; Briscoe, J.; Klop, P.; Rosegrant, M.; Norton, M.; Steduto, P.; et al. Charting Our Water Future; McKinsey & Company: New York, NY, USA, 2009. [Google Scholar]
  2. WHO/UNICEF Joint Monitoring Programme for Water Supply, Sanitation and Hygiene. Progress on Drinking Water, Sanitation and Hygiene: 2017 Update and SDG Baselines; World Health Organization (WHO) and the United Nations Children’s Fund (UNICEF): Geneva, Switzerland, 2017; ISBN 978-92-4-151289-3. [Google Scholar]
  3. Sima, L.C.; Elimelech, M. More than a Drop in the Bucket: Decentralized Membrane-Based Drinking Water Refill Stations in Southeast Asia. Environ. Sci. Technol. 2013, 47, 7580–7588. [Google Scholar] [CrossRef] [PubMed]
  4. Peter-Varbanets, M.; Zurbrügg, C.; Swartz, C.; Pronk, W. Decentralized systems for potable water and the potential of membrane technology. Water Res. 2009, 43, 245–265. [Google Scholar] [CrossRef] [PubMed]
  5. Asian Development Bank. Project Performance Audit Report on the Rural Water Supply and Sanitation Sector Project in Indonesia (Loan 1352-INO); Asian Development Bank: Manila, Philippines, 2004. [Google Scholar]
  6. Hata, A.; Katayama, H.; Wattanachira, S.; Sethy, S.; Masago, Y.; Honda, R.; Matsui, Y. Removal of microbes from highly turbid surface water in Southeast Asia using ceramic membrane filters. Southeast Asian Water Environ. 2010, 4, 153–158. [Google Scholar]
  7. Zeman, L.J.; Zydney, A.L. Microfiltration and Ultrafiltration: Principles and Applications, 1st ed.; Marcel Dekker Inc.: New York, NY, USA, 1996. [Google Scholar]
  8. Abeynayaka, A.; Visvanathan, C.; Khandarith, S.; Hashimoto, T.; Katayama, H.; Matsui, Y.; Werellagama, D.R.I.B. Long-term studies on hybrid ceramic microfiltration for treatment of surface water containing high dissolved organic matter. Water Sci. Technol. Water Supply 2014, 14, 246–254. [Google Scholar] [CrossRef]
  9. Choi, Y.H.; Kweon, J.H. Impacts of highly turbid water on microfiltration with coagulation pretreatment. KSCE J. Civ. Eng. 2010, 14, 273–280. [Google Scholar] [CrossRef]
  10. Choo, K.H.; Lee, H.; Choi, S.J. Iron and manganese removal and membrane fouling during UF in conjunction with prechlorination for drinking water treatment. J. Membr. Sci. 2005, 267, 18–26. [Google Scholar] [CrossRef]
  11. Huang, H.; Schwab, K.; Jacangelo, J.G. Pretreatment for low pressure membranes in water treatment: A review. Environ. Sci. Technol. 2009, 43, 3011–3019. [Google Scholar] [CrossRef] [PubMed]
  12. United Nations World Water Assessment Programme. The United Nations World Water Development Report 2016: Water and Jobs; UNESCO: Paris, France, 2016; ISBN 978-92-3-100146-8. [Google Scholar]
  13. Gadgil, A. Drinking water in developing countries. Annu. Rev. Energy Environ. 1998, 23, 253–286. [Google Scholar] [CrossRef]
  14. Mackenzie, D. Water and Wastewater Engineering, 1st ed.; McGraw-Hill Education: New York, NY, USA, 2010; ISBN 10: 9780071713849. [Google Scholar]
  15. Islam, A.K.M.N.; Kitawaki, H. Appropriate Technology for Water Supply and Sanitation (1st Draft for Review); International Environmental Planning Centre (INTEP), Department of Urban Engineering, The University of Tokyo: Tokyo, Japan, 1996. [Google Scholar]
  16. Huang, H.; Young, T.A.; Jacangelo, J.G. Unified Membrane Fouling Index for Low Pressure Membrane Filtration of Natural Waters: Principles and Methodology. Environ. Sci. Technol. 2008, 42, 714–720. [Google Scholar] [CrossRef] [PubMed]
  17. Nguyen, A.H.; Tobiason, J.E.; Howe, K.J. Fouling indices for low pressure hollow fiber membrane performance assessment. Water Res. 2011, 45, 2627–2637. [Google Scholar] [CrossRef] [PubMed]
  18. Kimura, K.; Tanaka, K.; Watanabe, Y. Microfiltration of different surface waters with/without coagulation: Clear correlations between membrane fouling and hydrophilic biopolymers. Water Res. 2014, 49, 434–443. [Google Scholar] [CrossRef] [PubMed] [Green Version]
  19. Weast, R.C.; Astle, M.J.; Beyer, W.H.; Company, C.R.; Selby, S.M.; Lide, D.R.; Frederikse, H.P.R.; Haynes, W.M.; Bruno, T.J. CRC Handbook of Chemistry and Physics, 82nd ed.; David, R.L., Ed.; CRC Press: Boca Raton, FL, USA, 2001; ISBN 0849304822. [Google Scholar]
  20. Stumm, W.; Morgan, J.J. Aquatic Chemistry: Chemical Equilibria and Rates in Natural Waters, 3rd ed.; Wiley-Interscience: New York, NY, USA, 1996; ISBN 10 0471511854. [Google Scholar]
  21. Diem, D.; Stumm, W. Is dissolved Mn2+ being oxidized by O2 in absence of Mn-bacteria or surface catalysts? Geochim. Cosmochim. Acta 1984, 48, 1571–1573. [Google Scholar] [CrossRef]
  22. Sung, W.; Morgan, J.J. Oxidative removal of Mn(II) from solution catalysed by the gamma-FeOOH (lepidocrocite) surface. Geochim. Cosmochim. Acta 1981, 45, 2377–2383. [Google Scholar] [CrossRef]
  23. Davies, S.H.R.; Morgan, J.J. Manganese (ll) Oxidation Kinetics on Metal Oxide Surfaces. J. Colloid Interface Sci. 1989, 129, 63–77. [Google Scholar] [CrossRef]
  24. Chapnick, S.D.; Moore, W.S.; Nealson, K.H. Microbially mediated manganese oxidation in a freshwater lake. Limnol. Oceanogr. 1982, 27, 1004–1014. [Google Scholar] [CrossRef]
  25. Emerson, S.; Kalhorn, S.; Jacobs, L.; Tebo, B.M.; Nealson, K.H.; Rosson, R.A. Environmental oxidation rate of manganese(II): Bacterial catalysis. Geochim. Cosmochim. Acta 1982, 46, 1073–1079. [Google Scholar] [CrossRef]
  26. Tebo, B.M.; Johnson, H.A.; McCarthy, J.K.; Templeton, A.S. Geomicrobiology of manganese(II) oxidation. Trends Microbiol. 2005, 13, 421–428. [Google Scholar] [CrossRef]
  27. Yamamura, H.; Chae, S.; Kimura, K.; Watanabe, Y. Transition in fouling mechanism in microfiltration of a surface water. Water Res. 2007, 41, 3812–3822. [Google Scholar] [CrossRef]
  28. Yamamura, H.; Kimura, K.; Higuchi, K.; Watanabe, Y.; Ding, Q.; Hafuka, A. Tracking inorganic foulants irreversibly accumulated on low-pressure membranes for treating surface water. Water Res. 2015, 87, 218–224. [Google Scholar] [CrossRef]
  29. Haibo, G.; Barnard, A.S. Naturally occurring iron oxide nanoparticles: Morphology, surface chemistry and environmental stability. J. Mater. Chem. A 2013, 1, 27–42. [Google Scholar] [CrossRef]
  30. Tipping, E.; Heaton, M.J. The adsorption of aquatic humic substances by two oxides of manganese. Geochim. Cosmochim. Acta 1983, 47, 1393–1397. [Google Scholar] [CrossRef]
  31. Ma, J.; Huangfu, X.; Liu, Y.; Cheng, H.; Lu, X.; Wang, Y.; Jiang, J.; Zhang, X. Reduction-induced aggregation and/or dissolution of MnO2 colloids by organics. Colloids Surf. A Physicochem. Eng. Asp. 2015, 482, 485–490. [Google Scholar] [CrossRef]
  32. Yamamura, H.; Okimoto, K.; Kimura, K.; Watanabe, Y. Hydrophilic fraction of natural organic matter causing irreversible fouling of microfiltration and ultrafiltration membranes. Water Res. 2014, 54, 123–136. [Google Scholar] [CrossRef] [PubMed]
  33. Yamamura, H.; Kimura, K.; Okajima, T.; Tokumoto, H.; Watanabe, Y. Affinity of functional groups for membrane surfaces: Implications for physically irreversible fouling. Environ. Sci. Technol. 2008, 42, 5310–5315. [Google Scholar] [CrossRef] [PubMed]
  34. Taniguchi, M.; Kilduff, J.E.; Belfort, G. Modes of natural organic matter fouling during ultrafiltration. Environ. Sci. Technol. 2003, 37, 1676–1683. [Google Scholar] [CrossRef] [PubMed]
  35. Chang, Y.; Benjamin, M.M. Iron oxide adsorption and UF to remove NOM and control fouling. J. Am. Water Works Assoc. 1996, 88, 74–88. [Google Scholar] [CrossRef]
  36. Kim, J.; Cai, Z.; Benjamin, M.M. Effects of adsorbents on membrane fouling by natural organic matter. J. Membr. Sci. 2008, 310, 356–364. [Google Scholar] [CrossRef]
  37. Indraratna, B.; Nutalaya, P. Some engineering characteristics of a compacted lateritic residual soil. Geotech. Geol. Eng. 1991, 9, 125–137. [Google Scholar] [CrossRef]
  38. Belfort, G.; Davis, R.H.; Zydney, A.L. The behavior of suspensions and macromolecular solutions in crossflow microfiltration. J. Membr. Sci. 1994, 96, 1–58. [Google Scholar] [CrossRef]
  39. Li, Q.; Elimelech, M. Organic fouling and chemical cleaning of nanofiltrtion membranes: Measurements and mechanisms. Environ. Sci. Technol. 2004, 38, 4683–4693. [Google Scholar] [CrossRef]
Figure 1. Location of the Ping River in Chiang Mai, Thailand.
Water 11 01592 g001
Figure 2. Schematic of the membrane filtration set-up and filtration cycle.
Water 11 01592 g002
Figure 3. Soluble Mn removal from the raw water during storage.
Water 11 01592 g003
Figure 4. Total and soluble iron removal during storage. Open triangle: below detection limit.
Water 11 01592 g004
Figure 5. Profiles of normalized flux at 100 kPa during the filtration of November 2014 (a) and March 2015 (b) (n = 2). The inset graphs show the magnified view of the dotted frame regions.
Water 11 01592 g005
Figure 6. Profiles of average hydraulically irreversible fouling index (HIFI) of November 2014 (a) and 2015 March (b) (n = 2).
Water 11 01592 g006
Figure 7. Ratio of hydraulically reversible fouling index (HRFI) to total fouling index (TFI) through the operation in (a) November 2014 and (b)March 2015.
Water 11 01592 g007
Figure 8. Total extracted foulants from used membranes in November 2014 and March 2015. Open diamond symbols show the average fouling resistance (Rf/Rm) in each experimental condition.
Water 11 01592 g008
Table 1. Raw water and filtrate * quality (November 2014).
Temp.pHTurbidityORPECTOCUV254SUVA
(°C)(NTU)(mV)(μS∙cm−-1)(mg∙L−1)(cm−1)(L∙mg−1∙m−1))
Raw waterBefore storage21.2–23.68.216.1180250.32.80.0451.61
After storage19.9–21.48.49.8194250.42.10.0381.81
Filtrate *Before storageN.A.**N.A.<0.01N.A.N.A.2.40.0381.58
After storageN.A.N.A.<0.01N.A.N.A.2.10.0321.52
* Filtrate sample: filtered by a 0.1-µm polyvinylidene difluoride (PVDF) membrane. ** N.A.: “not analyzed”.
Table 2. Raw water and filtrate * quality (March 2015).
Temp.pHTurbidityORPECTOCUV254SUVA
(°C)(NTU)(mV)(μS∙cm−1)(mg∙L−1)(cm−1)(L∙mg−1∙m−1))
Raw waterBefore storage25.8–28.37.8 ± 0.242.5 ± 9.1221 ± 23208.8 ± 3.12.8 ± 0.4N.A.N.A.
After storage24.5–30.38.1 ± 0.127.0 ± 4.5212 ± 32204.8 ± 3.92.8 ± 0.4N.A.N.A.
Filtrate *Before storage26.2–33.27.9 ± 0.2<0.01213 ± 18200.0 ± 7.42.8 ± 0.4N.A.N.A.
After storage25.2–33.18.2 ± 0.1<0.01222 ± 14199.4 ± 3.42.5 ± 0.2N.A.N.A.
* Filtrate sample: filtered by a 0.1-µm PVDF membrane. ** N.A.: “not analyzed”.
Table 3. Inorganic contents in raw water and filtrate (November 2014).
Ca*Al*T-MnS-MnT-FeS-Fe
(mg∙L−1)(mg∙L−1)(mg∙L−1)(mg∙L−1)(mg∙L-1)(mg∙L-1)
Raw waterBefore storage30.6 ± 0.40.7 ± 0.10.240.230.870.01
After storage29.7 ± 0.30.6 ± 0.00.200.12NA.**<0.01
FiltrateBefore storage29.6 ± 0.10.6 ± 0.0N.A.**0.23N.A.0.01
After storage29.7 ± 0.40.6 ± 0.0N.A.0.09N.A.<0.01
* Concentration after filtered by 0.1-μm PVDF membrane filter. ** N.A.: “not analyzed”.
Table 4. Inorganic contents in raw water and filtrate (March 2015).
Ca *Al *T-MnS-MnT-FeS-Fe
(mg∙L−1)(mg∙L−1)(mg∙L−1)(mg∙L−1)(mg∙L−1)(mg∙L−1)
Raw waterBefore storage17.1 ± 0.40.53 ± 0.100.300.212.120.02
After storage16.3 ± 0.00.20 ± 0.200.070.011.02<0.01
FiltrateBefore storage16.5 ± 0.20.02 ± 0.01N.A.**0.21N.A.0.02
After storage16.1 ± 0.1<0.01N.A.0.01N.A.<0.01
* Concentration after filtered by 0.1-μm PVDF membrane filter. ** N.A.: “not analyzed”.

