Prediction of Seasonal Frost Heave Behavior in Unsaturated Soil in Northeastern China Using Interactive Factor Analysis with Split-Plot Experiments and GRNN

 ,
,
Abstract
:
1. Introduction
2. Materials and Methods
2.1. Study Area
2.2. Soil Sample Collection and Testing
2.2.1. Sample Collection
2.2.2. Soil Testing
2.3. Experimental Methods
2.3.1. Improved Frost Heave Experiments
2.3.2. Frost heave Experiments
2.4. Data Analysis
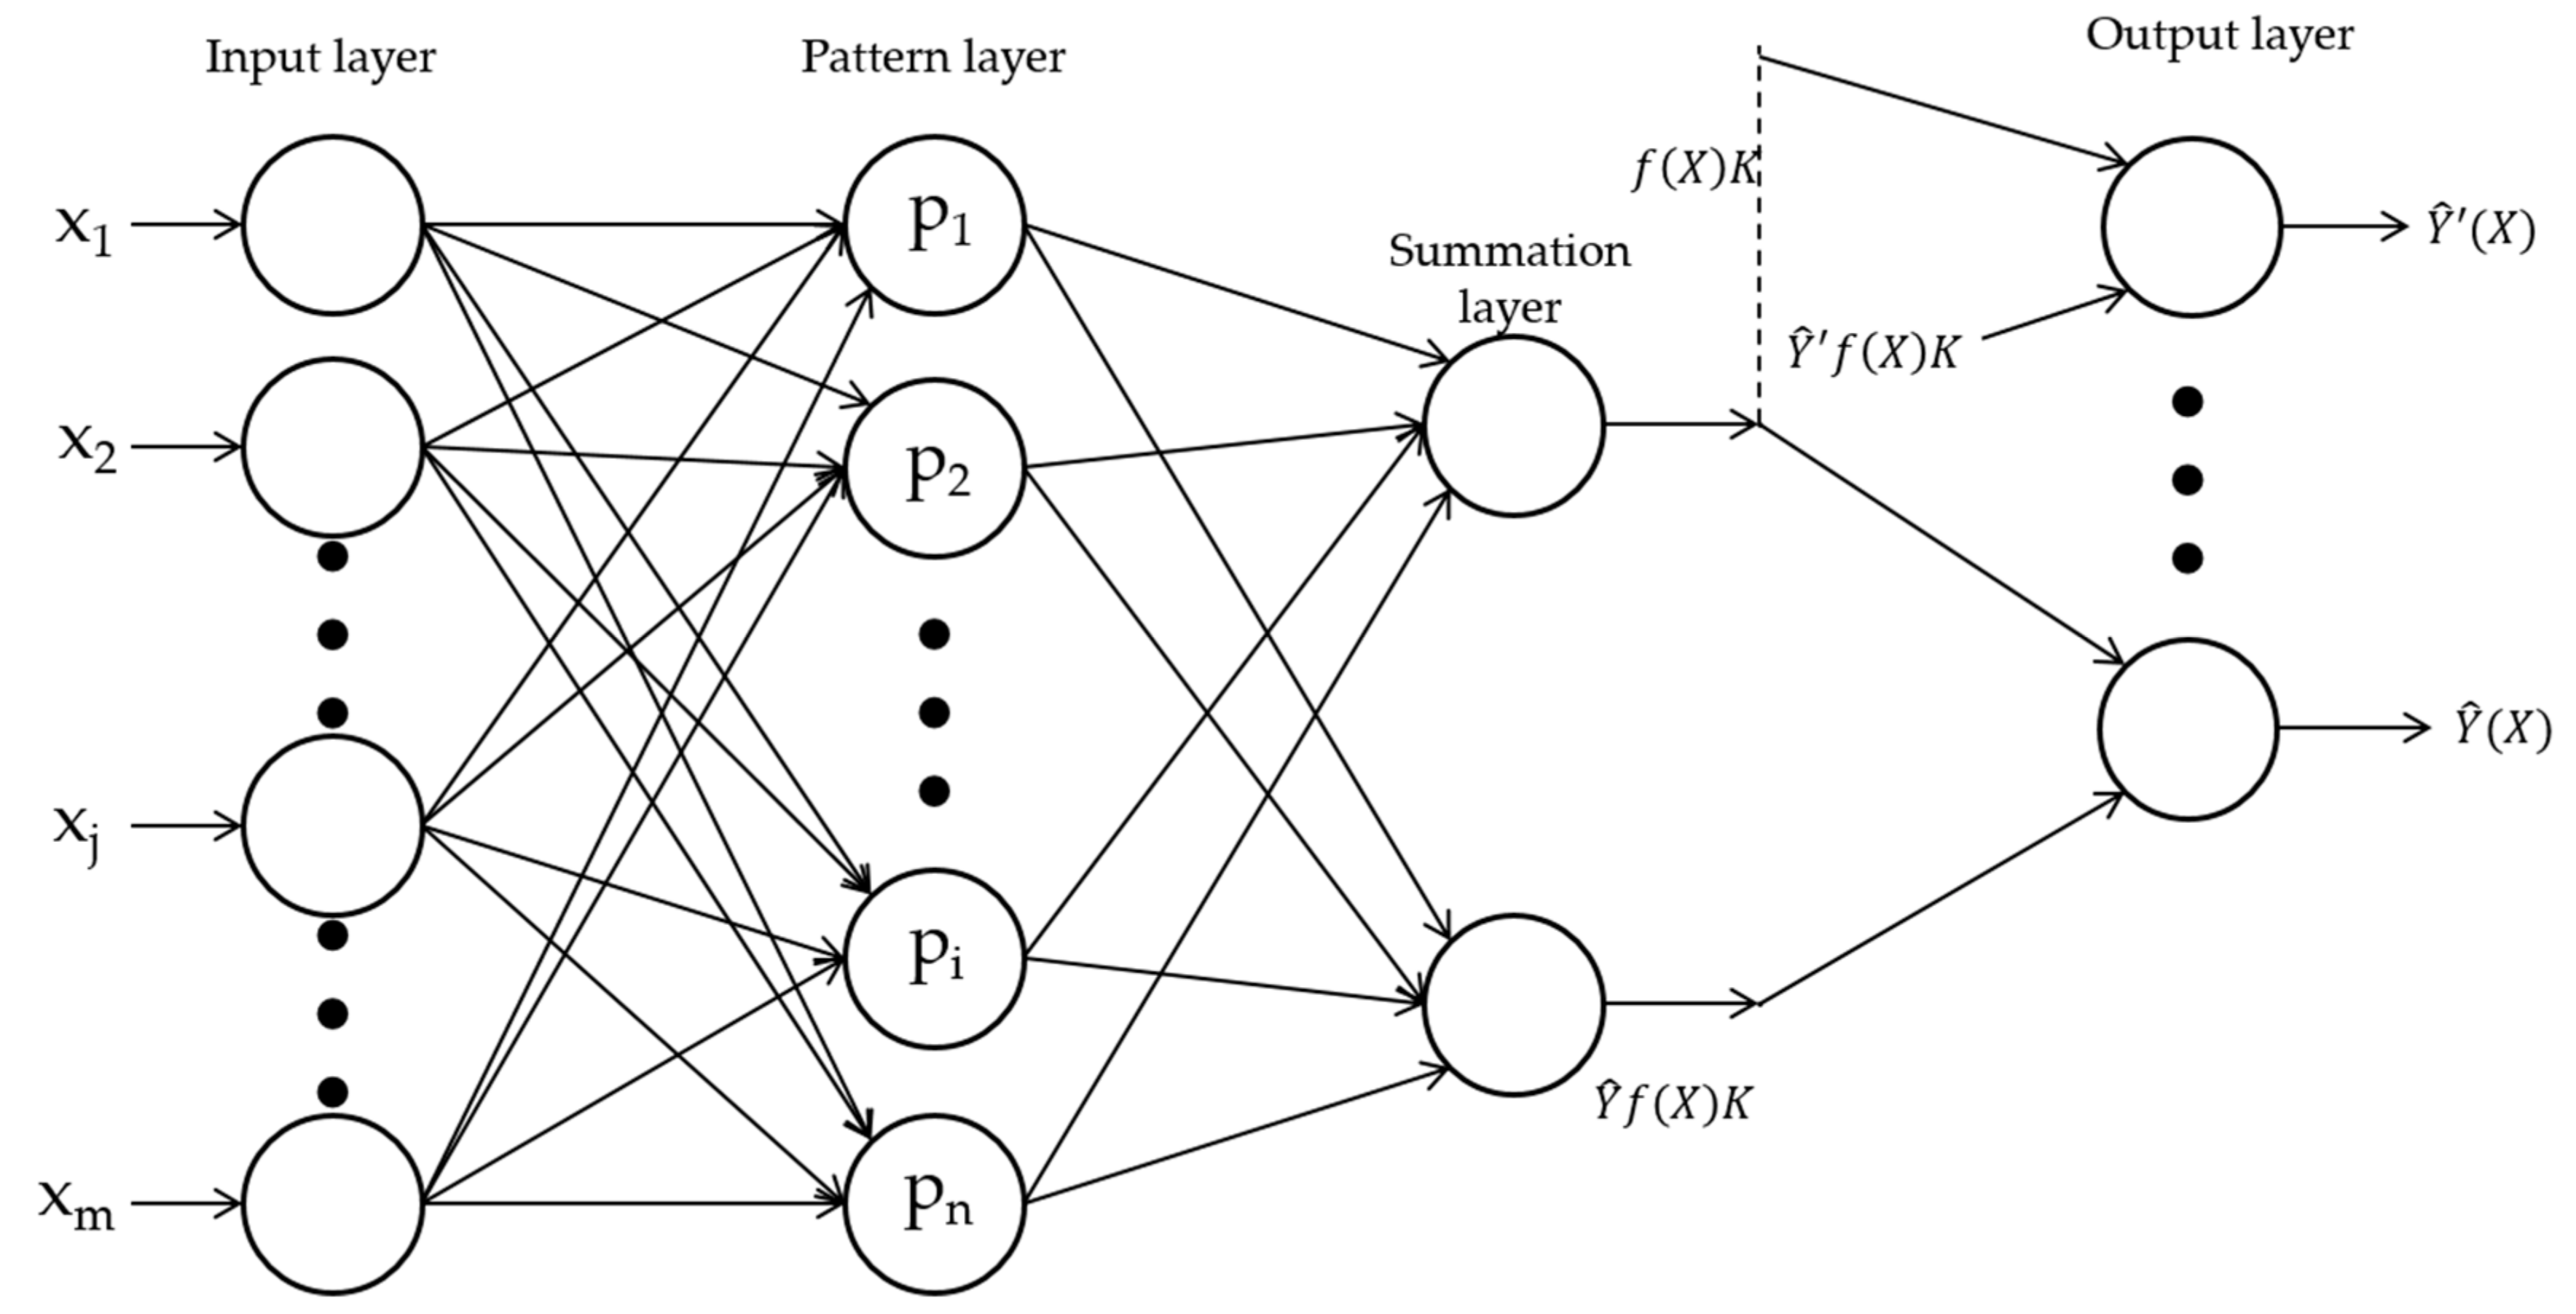
2.5. Prediction
3. Results and Discussion
3.1. Results of Improved Frost Heave Experiments
3.2. Frost Heave Experiments
3.3. Prediction of Frost Heave Behavior
4. Conclusions
Author Contributions
Funding
Acknowledgments
Conflicts of Interest
Appendix A

| NO. | CSS (%) | Compactness (%) | Temperature (°C) | Water Content (%) | η (%) |
|---|---|---|---|---|---|
| 1 | 1.5 | 95 | −2 | 22 | −0.09 |
| 2 | 1.5 | 95 | −4 | 22 | 0.93 |
| 3 | 1.5 | 95 | −25 | 26 | 2.00 |
| 4 | 1.5 | 95 | −15 | 21 | 1.18 |
| 5 | 1.5 | 95 | −15 | 20 | 0.72 |
| 6 | 1.5 | 95 | 0 | 24 | −0.18 |
| 7 | 1.5 | 95 | −20 | 21 | 1.23 |
| 8 | 1.5 | 95 | −25 | 20 | 0.79 |
| 9 | 1.5 | 95 | −6 | 26 | 1.64 |
| 10 | 1.5 | 95 | −8 | 18 | 0.02 |
| 11 | 1.5 | 95 | −20 | 18 | 0.07 |
| 12 | 1.5 | 95 | −10 | 18 | 0.01 |
| 13 | 1.5 | 95 | −25 | 18 | 0.11 |
| 14 | 1.5 | 95 | −8 | 24 | 1.61 |
| 15 | 1.5 | 95 | −15 | 18 | 0.03 |
| 16 | 1.5 | 95 | −8 | 22 | 1.25 |
| 17 | 1.5 | 95 | −25 | 24 | 1.85 |
| 18 | 1.5 | 95 | 0 | 22 | −0.07 |
| 19 | 1.5 | 95 | −25 | 22 | 1.5 |
| 20 | 1.5 | 95 | −8 | 20 | 0.67 |
| 21 | 1.5 | 95 | −20 | 26 | 2.06 |
| 22 | 1.5 | 95 | −15 | 22 | 1.41 |
| 23 | 1.5 | 95 | 0 | 26 | −0.1 |
| 24 | 1.5 | 95 | −10 | 20 | 0.67 |
| 25 | 1.5 | 95 | −10 | 24 | 1.65 |
| 26 | 1.5 | 95 | −15 | 26 | 2 |
| 27 | 1.5 | 95 | −6 | 22 | 1.14 |
| 28 | 1.5 | 95 | −6 | 24 | 1.43 |
| 29 | 1.5 | 95 | −8 | 21 | 1.1 |
| 30 | 1.5 | 95 | −2 | 18 | −0.08 |
| 31 | 1.5 | 95 | −4 | 24 | 1.23 |
| 32 | 1.5 | 95 | −4 | 21 | 0.95 |
| 33 | 1.5 | 95 | −2 | 24 | −0.2 |
| 34 | 1.5 | 95 | −10 | 21 | 1.11 |
| 35 | 1.5 | 95 | −4 | 26 | 1.36 |
| 36 | 1.5 | 95 | −2 | 26 | −0.11 |
| 37 | 1.5 | 95 | −25 | 21 | 1.27 |
| 38 | 1.5 | 95 | −4 | 20 | 0.6 |
| 39 | 1.5 | 95 | −2 | 21 | −0.08 |
| 40 | 1.5 | 95 | −6 | 18 | 0.02 |
| 41 | 1.5 | 95 | 0 | 20 | −0.08 |
| 42 | 1.5 | 95 | −15 | 24 | 1.76 |
| 43 | 1.5 | 95 | −6 | 21 | 1.06 |
| 44 | 1.5 | 95 | 0 | 21 | −0.07 |
| 45 | 1.5 | 95 | −10 | 22 | 1.3 |
| 46 | 1.5 | 95 | −20 | 22 | 1.44 |
| 47 | 1.5 | 95 | 0 | 18 | −0.06 |
| 48 | 1.5 | 95 | −20 | 20 | 0.76 |
| 49 | 0 | 85 | −6 | 18 | −0.01 |
| 50 | 0 | 85 | −15 | 20 | −0.06 |
| 51 | 0 | 85 | −10 | 22 | 0.29 |
| 52 | 0 | 85 | −8 | 21 | 0.25 |
| 53 | 0 | 85 | −10 | 26 | 0.7 |
| 54 | 0 | 85 | −15 | 21 | 0.25 |
| 55 | 0 | 85 | −15 | 24 | 0.79 |
| 56 | 0 | 85 | 0 | 18 | −0.01 |
| 57 | 0 | 85 | −20 | 20 | −0.07 |
| 58 | 0 | 85 | −4 | 24 | 0.82 |
| 59 | 0 | 85 | −20 | 24 | 0.81 |
| 60 | 0 | 85 | −4 | 20 | 0 |
| 61 | 0 | 85 | −4 | 18 | −0.01 |
| 62 | 0 | 85 | −4 | 26 | 0.68 |
| 63 | 0 | 85 | −20 | 22 | 0.3 |
| 64 | 0 | 85 | −8 | 26 | 0.69 |
| 65 | 0 | 85 | −6 | 21 | 0.25 |
| 66 | 0 | 85 | −10 | 21 | 0.25 |
| 67 | 0 | 85 | −10 | 24 | 0.78 |
| 68 | 0 | 85 | −6 | 24 | 0.8 |
| 69 | 0 | 85 | −25 | 20 | −0.08 |
| 70 | 0 | 85 | −6 | 20 | −0.02 |
| 71 | 0 | 85 | −2 | 22 | 0.3 |
| 72 | 0 | 85 | −20 | 26 | 0.76 |
| 73 | 0 | 85 | −15 | 18 | −0.01 |
| 74 | 0 | 85 | −10 | 20 | −0.04 |
| 75 | 0 | 85 | −25 | 22 | 0.3 |
| 76 | 0 | 85 | −15 | 22 | 0.29 |
| 77 | 0 | 85 | −6 | 22 | 0.29 |
| 78 | 0 | 85 | −20 | 21 | 0.25 |
| 79 | 0 | 85 | −25 | 26 | 0.78 |
| 80 | 0 | 85 | −2 | 26 | 0.64 |
| 81 | 0 | 85 | −8 | 18 | −0.01 |
| 82 | 0 | 85 | 0 | 26 | −0.07 |
| 83 | 0 | 85 | −25 | 24 | 0.83 |
| 84 | 0 | 85 | −8 | 24 | 0.78 |
| 85 | 0 | 85 | 0 | 21 | 0 |
| 86 | 0 | 85 | −2 | 21 | 0.25 |
| 87 | 0 | 85 | −8 | 22 | 0.29 |
| 88 | 0 | 85 | −25 | 18 | −0.01 |
| 89 | 0 | 85 | −8 | 20 | −0.03 |
| 90 | 0 | 85 | 0 | 24 | −0.05 |
| 91 | 0 | 85 | −25 | 21 | 0.25 |
| 92 | 0 | 85 | 0 | 20 | 0 |
| 93 | 0 | 85 | −10 | 18 | −0.01 |
| 94 | 0 | 85 | −2 | 18 | −0.01 |
| 95 | 0 | 85 | −2 | 24 | 0.83 |
| 96 | 0.3 | 95 | −10 | 21 | 1.23 |
| 97 | 0.3 | 95 | −25 | 24 | 1.37 |
| 98 | 0.3 | 95 | −6 | 18 | 0.7 |
| 99 | 0.3 | 95 | −15 | 24 | 1.33 |
| 100 | 0.3 | 95 | 0 | 18 | −0.05 |
| 101 | 0.3 | 95 | −10 | 26 | 1.35 |
| 102 | 0.3 | 95 | −10 | 24 | 1.29 |
| 103 | 0.3 | 95 | −20 | 21 | 1.21 |
| 104 | 0.3 | 95 | −20 | 20 | 1.13 |
| 105 | 0.3 | 95 | −25 | 22 | 1.23 |
| 106 | 0.3 | 95 | −20 | 24 | 1.35 |
| 107 | 0.3 | 95 | −4 | 26 | 1.37 |
| 108 | 0.3 | 95 | −2 | 18 | 0.68 |
| 109 | 0.3 | 95 | −2 | 26 | 1.06 |
| 110 | 0.3 | 95 | −10 | 18 | 0.75 |
| 111 | 0.3 | 95 | −20 | 26 | 1.37 |
| 112 | 0.3 | 95 | −15 | 20 | 1.13 |
| 113 | 0.3 | 95 | −20 | 18 | 0.78 |
| 114 | 0.3 | 95 | −2 | 22 | 1.14 |
| 115 | 0.3 | 95 | 0 | 26 | −0.09 |
| 116 | 0.3 | 95 | −2 | 21 | 1.06 |
| 117 | 0.3 | 95 | −10 | 22 | 1.18 |
| 118 | 0.3 | 95 | −10 | 20 | 1.13 |
| 119 | 0.3 | 95 | −4 | 21 | 1.27 |
| 120 | 0.3 | 95 | −15 | 18 | 0.75 |
| 121 | 0.3 | 95 | −25 | 26 | 1.39 |
| 122 | 0.3 | 95 | −20 | 22 | 1.22 |
| 123 | 0.3 | 95 | −15 | 21 | 1.22 |
| 124 | 0.3 | 95 | −6 | 22 | 1.19 |
| 125 | 0.3 | 95 | −4 | 20 | 1.2 |
| 126 | 0.3 | 95 | −25 | 20 | 1.13 |
| 127 | 0.3 | 95 | 0 | 21 | −0.03 |
| 128 | 0.3 | 95 | −8 | 24 | 1.27 |
| 129 | 0.3 | 95 | −4 | 22 | 1.2 |
| 130 | 0.3 | 95 | 0 | 22 | −0.1 |
| 131 | 0.3 | 95 | −8 | 18 | 0.72 |
| 132 | 0.3 | 95 | −8 | 21 | 1.24 |
| 133 | 0.3 | 95 | −8 | 20 | 1.15 |
| 134 | 0.3 | 95 | 0 | 20 | −0.07 |
| 135 | 0.3 | 95 | −6 | 24 | 1.26 |
| 136 | 0.3 | 95 | −15 | 26 | 1.36 |
| 137 | 0.3 | 95 | −6 | 26 | 1.36 |
| 138 | 0.3 | 95 | −4 | 18 | 0.69 |
| 139 | 0.3 | 95 | −6 | 21 | 1.25 |
| 140 | 0.3 | 85 | −6 | 21 | 0.15 |
| 141 | 0.3 | 85 | −6 | 22 | 0.25 |
| 142 | 0.3 | 85 | −10 | 22 | 0.23 |
| 143 | 0.3 | 85 | 0 | 20 | 0 |
| 144 | 0.3 | 85 | −2 | 24 | 0.92 |
| 145 | 0.3 | 85 | −6 | 20 | −0.06 |
| 146 | 0.3 | 85 | −4 | 22 | 0.27 |
| 147 | 0.3 | 85 | −15 | 26 | 1.23 |
| 148 | 0.3 | 85 | −8 | 26 | 1.18 |
| 149 | 0.3 | 85 | −20 | 20 | −0.13 |
| 150 | 0.3 | 85 | −4 | 21 | 0.15 |
| 151 | 0.3 | 85 | −6 | 26 | 1.16 |
| 152 | 0.3 | 85 | 0 | 26 | −0.03 |
| 153 | 0.3 | 85 | −8 | 21 | 0.15 |
| 154 | 0.3 | 85 | −25 | 20 | −0.14 |
| 155 | 0.3 | 85 | −15 | 22 | 0.23 |
| 156 | 0.3 | 85 | −25 | 24 | 0.92 |
| 157 | 0.3 | 85 | −4 | 24 | 0.92 |
| 158 | 0.3 | 85 | −8 | 22 | 0.24 |
| 159 | 0.3 | 85 | −15 | 20 | −0.12 |
| 160 | 0.3 | 85 | −8 | 18 | −0.09 |
| 161 | 0.3 | 85 | −15 | 24 | 0.9 |
| 162 | 0.3 | 85 | −2 | 21 | 0.14 |
| 163 | 0.3 | 85 | 0 | 18 | 0 |
| 164 | 0.3 | 85 | −10 | 21 | 0.15 |
| 165 | 0.3 | 85 | −6 | 24 | 0.91 |
| 166 | 0.3 | 85 | −25 | 18 | −0.2 |
| 167 | 0.3 | 85 | −4 | 18 | −0.08 |
| 168 | 0.3 | 85 | −10 | 18 | −0.12 |
| 169 | 0.3 | 85 | −10 | 24 | 0.89 |
| 170 | 0.3 | 85 | −8 | 20 | −0.09 |
| 171 | 0.3 | 85 | −10 | 26 | 1.19 |
| 172 | 0.3 | 85 | −8 | 24 | 0.9 |
| 173 | 0.3 | 85 | −25 | 22 | 0.24 |
| 174 | 0.3 | 85 | −25 | 26 | 1.27 |
| 175 | 0.3 | 85 | −4 | 20 | −0.05 |
| 176 | 0.3 | 85 | −25 | 21 | 0.16 |
| 177 | 0.3 | 85 | −20 | 26 | 1.26 |
| 178 | 0.3 | 85 | −6 | 18 | −0.09 |
| 179 | 0.3 | 85 | 0 | 21 | −0.03 |
| 180 | 0.3 | 85 | −15 | 18 | −0.18 |
| 181 | 0.3 | 85 | −2 | 22 | 0.28 |
| 182 | 0.3 | 85 | −20 | 22 | 0.23 |
| 183 | 0.3 | 85 | 0 | 24 | −0.08 |
| 184 | 0.3 | 85 | −20 | 18 | −0.2 |
| 185 | 0.5 | 95 | −15 | 24 | 1.4 |
| 186 | 0.5 | 95 | −25 | 18 | 0.63 |
| 187 | 0.5 | 95 | −10 | 20 | 1 |
| 188 | 0.5 | 95 | 0 | 18 | −0.06 |
| 189 | 0.5 | 95 | 0 | 20 | −0.04 |
| 190 | 0.5 | 95 | −6 | 26 | 1.41 |
| 191 | 0.5 | 95 | −8 | 18 | 0.56 |
| 192 | 0.5 | 95 | −10 | 18 | 0.58 |
| 193 | 0.5 | 95 | −6 | 20 | 1.01 |
| 194 | 0.5 | 95 | −6 | 24 | 1.35 |
| 195 | 0.5 | 95 | −2 | 21 | 1.05 |
| 196 | 0.5 | 95 | 0 | 24 | −0.05 |
| 197 | 0.5 | 95 | −2 | 18 | 0.29 |
| 198 | 0.5 | 95 | −2 | 26 | 1.23 |
| 199 | 0.5 | 95 | −4 | 22 | 1.36 |
| 200 | 0.5 | 95 | −20 | 21 | 1.23 |
| 201 | 0.5 | 95 | −15 | 18 | 0.63 |
| 202 | 0.5 | 95 | −4 | 18 | 0.60 |
| 203 | 0.5 | 95 | −4 | 21 | 1.14 |
| 204 | 0.5 | 95 | −25 | 21 | 1.25 |
| 205 | 0.5 | 95 | 0 | 22 | −0.01 |
| 206 | 0.5 | 95 | −15 | 22 | 1.35 |
| 207 | 0.5 | 95 | −25 | 20 | 1.02 |
| 208 | 0.5 | 95 | −15 | 21 | 1.21 |
| 209 | 0.5 | 95 | −25 | 24 | 1.43 |
| 210 | 0.5 | 95 | −2 | 20 | 0.95 |
| 211 | 0.5 | 95 | −4 | 24 | 1.38 |
| 212 | 0.5 | 95 | −2 | 24 | 1.24 |
| 213 | 0.5 | 95 | −8 | 21 | 1.16 |
| 214 | 0.5 | 95 | −4 | 20 | 1.02 |
| 215 | 0.5 | 95 | −4 | 26 | 1.37 |
| 216 | 0.5 | 95 | −25 | 26 | 1.49 |
| 217 | 0.5 | 95 | −2 | 22 | 0.52 |
| 218 | 0.5 | 95 | −20 | 20 | 1.02 |
| 219 | 0.5 | 95 | −6 | 21 | 1.15 |
| 220 | 0.5 | 95 | −10 | 24 | 1.39 |
| 221 | 0.5 | 95 | −8 | 20 | 1.01 |
| 222 | 0.5 | 95 | 0 | 21 | −0.05 |
| 223 | 0.5 | 95 | −15 | 26 | 1.48 |
| 224 | 0.5 | 95 | −10 | 22 | 1.35 |
| 225 | 0.5 | 95 | −20 | 18 | 0.66 |
| 226 | 0.5 | 95 | −25 | 22 | 1.38 |
| 227 | 0.5 | 95 | −20 | 24 | 1.41 |
| 228 | 0.5 | 95 | −10 | 26 | 1.44 |
| 229 | 0.5 | 95 | −20 | 22 | 1.38 |
| 230 | 1.2 | 90 | −25 | 26 | 3.11 |
| 231 | 1.2 | 90 | −20 | 26 | 2.97 |
| 232 | 1.2 | 90 | −8 | 24 | 1.38 |
| 233 | 1.2 | 90 | −15 | 20 | 0.36 |
| 234 | 1.2 | 90 | 0 | 21 | −0.041 |
| 235 | 1.2 | 90 | −15 | 18 | 0 |
| 236 | 1.2 | 90 | −10 | 24 | 1.4 |
| 237 | 1.2 | 90 | −2 | 20 | 0.08 |
| 238 | 1.2 | 90 | −15 | 24 | 1.46 |
| 239 | 1.2 | 90 | −8 | 26 | 2.83 |
| 240 | 1.2 | 90 | −4 | 18 | 0 |
| 241 | 1.2 | 90 | −10 | 26 | 2.86 |
| 242 | 1.2 | 90 | −2 | 18 | 0 |
| 243 | 1.2 | 90 | −4 | 22 | 0.61 |
| 244 | 1.2 | 90 | −10 | 18 | 0 |
| 245 | 1.2 | 90 | −25 | 22 | 0.71 |
| 246 | 1.2 | 90 | −10 | 21 | 0.64 |
| 247 | 1.2 | 90 | −4 | 21 | 0.61 |
| 248 | 1.2 | 90 | −6 | 24 | 1.36 |
| 249 | 1.2 | 90 | −6 | 21 | 0.62 |
| 250 | 1.2 | 90 | −20 | 24 | 1.5 |
| 251 | 1.2 | 90 | 0 | 18 | 0 |
| 252 | 1.2 | 90 | −2 | 21 | −0.01 |
| 253 | 1.2 | 90 | −4 | 24 | 1.33 |
| 254 | 1.2 | 90 | −4 | 26 | 2.71 |
| 255 | 1.2 | 90 | −25 | 21 | 0.7 |
| 256 | 1.2 | 90 | −6 | 26 | 2.79 |
| 257 | 1.2 | 90 | −25 | 18 | 0 |
| 258 | 1.2 | 90 | −8 | 21 | 0.63 |
| 259 | 1.2 | 90 | −25 | 20 | 0.37 |
| 260 | 1.2 | 90 | 0 | 20 | −0.04 |
| 261 | 1.2 | 90 | −2 | 22 | 0.22 |
| 262 | 1.2 | 90 | −2 | 26 | 0.76 |
| 263 | 1.2 | 90 | −6 | 22 | 0.62 |
| 264 | 1.2 | 90 | −2 | 24 | 1.23 |
| 265 | 1.2 | 90 | −20 | 18 | 0 |
| 266 | 1.2 | 90 | 0 | 22 | −0.04 |
| 267 | 1.2 | 90 | −20 | 22 | 0.71 |
| 268 | 1.2 | 90 | −4 | 20 | 0.48 |
| 269 | 1.2 | 90 | −10 | 20 | 0.39 |
| 270 | 1.2 | 90 | −15 | 22 | 0.7 |
| 271 | 1.2 | 90 | −8 | 20 | 0.39 |
| 272 | 1.5 | 85 | −4 | 20 | 0.4 |
| 273 | 1.5 | 85 | −2 | 20 | −0.08 |
| 274 | 1.5 | 85 | −6 | 24 | 1.03 |
| 275 | 1.5 | 85 | −20 | 21 | 0.54 |
| 276 | 1.5 | 85 | −4 | 22 | 0.75 |
| 277 | 1.5 | 85 | −10 | 20 | 0.34 |
| 278 | 1.5 | 85 | −8 | 22 | 0.85 |
| 279 | 1.5 | 85 | 0 | 22 | −0.11 |
| 280 | 1.5 | 85 | 0 | 26 | −0.07 |
| 281 | 1.5 | 85 | 0 | 21 | −0.12 |
| 282 | 1.5 | 85 | −10 | 24 | 1.16 |
| 283 | 1.5 | 85 | −15 | 26 | 1.86 |
| 284 | 1.5 | 85 | −15 | 24 | 1.25 |
| 285 | 1.5 | 85 | −10 | 21 | 0.38 |
| 286 | 1.5 | 85 | −2 | 24 | 0.25 |
| 287 | 1.5 | 85 | −2 | 21 | −0.14 |
| 288 | 1.5 | 85 | −2 | 18 | −0.06 |
| 289 | 1.5 | 85 | −25 | 22 | 1.08 |
| 290 | 1.5 | 85 | −4 | 24 | 0.89 |
| 291 | 1.5 | 85 | −25 | 18 | −0.55 |
| 292 | 1.5 | 85 | −6 | 21 | 0.23 |
| 293 | 1.5 | 85 | −4 | 26 | 1.80 |
| 294 | 1.5 | 85 | −15 | 21 | 0.48 |
| 295 | 1.5 | 85 | −6 | 22 | 0.82 |
| 296 | 1.5 | 85 | 0 | 18 | −0.05 |
| 297 | 1.5 | 85 | 0 | 20 | −0.07 |
| 298 | 1.5 | 85 | −8 | 20 | 0.35 |
| 299 | 1.5 | 85 | −10 | 18 | −0.58 |
| 300 | 1.5 | 85 | −6 | 26 | 1.8 |
| 301 | 1.5 | 85 | 0 | 24 | 0.22 |
| 302 | 1.5 | 85 | −4 | 21 | 0.09 |
| 303 | 1.5 | 85 | −20 | 26 | 1.9 |
| 304 | 1.5 | 85 | −8 | 26 | 1.8 |
| 305 | 1.5 | 85 | −8 | 24 | 1.12 |
| 306 | 1.5 | 85 | −15 | 20 | 0.36 |
| 307 | 1.5 | 85 | −6 | 18 | −0.53 |
| 308 | 1.5 | 85 | −2 | 22 | −0.12 |
| 309 | 1.5 | 85 | −20 | 24 | 1.3 |
| 310 | 1.5 | 85 | −20 | 18 | −0.6 |
| 311 | 1.5 | 85 | −10 | 26 | 1.8 |
| 312 | 1.5 | 85 | −15 | 18 | −0.6 |
| 313 | 1.5 | 85 | −6 | 20 | 0.37 |
| 314 | 1.5 | 85 | −25 | 21 | 0.57 |
| 315 | 1.5 | 85 | −20 | 20 | 0.38 |
| 316 | 1.5 | 85 | −4 | 18 | −0.42 |
| 317 | 1.5 | 85 | −8 | 18 | −0.57 |
| 318 | 0.5 | 85 | −10 | 21 | 0.19 |
| 319 | 0.5 | 85 | −2 | 18 | −0.06 |
| 320 | 0.5 | 85 | −6 | 24 | 0.99 |
| 321 | 0.5 | 85 | −15 | 20 | −0.22 |
| 322 | 0.5 | 85 | −10 | 26 | 1.29 |
| 323 | 0.5 | 85 | −15 | 21 | 0.18 |
| 324 | 0.5 | 85 | −2 | 20 | −0.16 |
| 325 | 0.5 | 85 | −8 | 22 | 0.25 |
| 326 | 0.5 | 85 | −4 | 21 | 0.23 |
| 327 | 0.5 | 85 | −6 | 22 | 0.26 |
| 328 | 0.5 | 85 | −20 | 21 | 0.18 |
| 329 | 0.5 | 85 | −25 | 24 | 0.99 |
| 330 | 0.5 | 85 | −20 | 24 | 0.99 |
| 331 | 0.5 | 85 | −20 | 26 | 1.41 |
| 332 | 0.5 | 85 | −10 | 18 | −0.23 |
| 333 | 0.5 | 85 | −2 | 22 | 0.21 |
| 334 | 0.5 | 85 | −2 | 24 | 0.58 |
| 335 | 0.5 | 85 | −4 | 24 | 0.99 |
| 336 | 0.5 | 85 | −6 | 18 | −0.23 |
| 337 | 0.5 | 85 | −6 | 26 | 1.29 |
| 338 | 0.5 | 85 | 0 | 21 | −0.03 |
| 339 | 0.5 | 85 | −20 | 22 | 0.23 |
| 340 | 0.5 | 85 | −20 | 20 | −0.22 |
| 341 | 0.5 | 85 | −4 | 18 | −0.30 |
| 342 | 0.5 | 85 | −15 | 26 | 1.34 |
| 343 | 0.5 | 85 | 0 | 26 | −0.03 |
| 344 | 0.5 | 85 | −10 | 24 | 0.97 |
| 345 | 0.5 | 85 | −6 | 20 | −0.19 |
| 346 | 0.5 | 85 | −25 | 20 | −0.22 |
| 347 | 0.5 | 85 | 0 | 22 | −0.02 |
| 348 | 0.5 | 85 | −8 | 26 | 1.3 |
| 349 | 0.5 | 85 | −25 | 26 | 1.46 |
| 350 | 0.5 | 85 | 0 | 20 | −0.01 |
| 351 | 0.5 | 85 | −2 | 21 | 0.22 |
| 352 | 0.5 | 85 | −8 | 24 | 0.99 |
| 353 | 0.5 | 85 | −15 | 18 | −0.23 |
| 354 | 0.5 | 85 | −25 | 22 | 0.23 |
| 355 | 0.5 | 85 | −25 | 18 | −0.22 |
| 356 | 0.5 | 85 | −8 | 20 | −0.21 |
| 357 | 0.5 | 85 | 0 | 18 | 0 |
| 358 | 0.5 | 85 | −8 | 21 | 0.19 |
| 359 | 0.5 | 85 | −6 | 21 | 0.19 |
| 360 | 0.5 | 85 | −25 | 21 | 0.19 |
| 361 | 0.5 | 85 | −10 | 20 | −0.22 |
| 362 | 0.5 | 90 | −15 | 18 | 0.06 |
| 363 | 0.5 | 90 | −20 | 22 | 0.94 |
| 364 | 0.5 | 90 | −2 | 26 | 1.3 |
| 365 | 0.5 | 90 | −15 | 21 | 0.92 |
| 366 | 0.5 | 90 | −4 | 21 | 0.83 |
| 367 | 0.5 | 90 | −10 | 24 | 1 |
| 368 | 0.5 | 90 | −2 | 20 | 0.42 |
| 369 | 0.5 | 90 | −6 | 20 | 0.33 |
| 370 | 0.5 | 90 | −8 | 26 | 1.37 |
| 371 | 0.5 | 90 | 0 | 22 | −0.02 |
| 372 | 0.5 | 90 | −8 | 21 | 0.85 |
| 373 | 0.5 | 90 | −15 | 26 | 1.41 |
| 374 | 0.5 | 90 | 0 | 26 | −0.06 |
| 375 | 0.5 | 90 | −8 | 24 | 0.98 |
| 376 | 0.5 | 90 | −20 | 18 | 0.05 |
| 377 | 0.5 | 90 | −20 | 20 | 0.4 |
| 378 | 0.5 | 90 | −10 | 26 | 1.39 |
| 379 | 0.5 | 90 | −2 | 18 | −0.02 |
| 380 | 0.5 | 90 | −6 | 26 | 1.37 |
| 381 | 0.5 | 90 | −10 | 18 | 0.08 |
| 382 | 0.5 | 90 | −8 | 22 | 0.93 |
| 383 | 0.5 | 90 | −4 | 22 | 0.96 |
| 384 | 0.5 | 90 | −15 | 20 | 0.36 |
| 385 | 0.5 | 90 | 0 | 18 | −0.01 |
| 386 | 0.5 | 90 | −8 | 18 | 0.1 |
| 387 | 0.5 | 90 | −8 | 20 | 0.35 |
| 388 | 0.5 | 90 | −6 | 18 | 0.1 |
| 389 | 0.5 | 90 | −25 | 21 | 0.95 |
| 390 | 0.5 | 90 | −4 | 20 | 0.32 |
| 391 | 0.5 | 90 | −6 | 22 | 0.94 |
| 392 | 0.5 | 90 | 0 | 24 | −0.06 |
| 393 | 0.5 | 90 | −2 | 24 | 0.85 |
| 394 | 0.5 | 90 | −4 | 18 | 0.11 |
| 395 | 0.5 | 90 | 0 | 21 | −0.06 |
| 396 | 0.5 | 90 | −6 | 21 | 0.84 |
| 397 | 0.5 | 90 | −10 | 21 | 0.9 |
| 398 | 0.5 | 90 | −6 | 24 | 0.96 |
| 399 | 0.5 | 90 | −25 | 18 | 0.04 |
| 400 | 0.5 | 90 | −2 | 22 | 0.97 |
| 401 | 0.5 | 90 | −10 | 22 | 0.92 |
| 402 | 0.5 | 90 | −25 | 22 | 0.95 |
| 403 | 0.5 | 90 | −25 | 24 | 1.19 |
| 404 | 0.5 | 90 | −25 | 20 | 0.4 |
| 405 | 0.5 | 90 | −25 | 26 | 1.45 |
| 406 | 0.5 | 90 | −20 | 26 | 1.43 |
| 407 | 0 | 95 | −15 | 22 | 2.09 |
| 408 | 0 | 95 | −8 | 26 | 2.05 |
| 409 | 0 | 95 | −2 | 18 | 1.14 |
| 410 | 0 | 95 | −20 | 18 | 1.05 |
| 411 | 0 | 95 | −4 | 22 | 2.07 |
| 412 | 0 | 95 | −8 | 21 | 2.07 |
| 413 | 0 | 95 | 0 | 21 | −0.03 |
| 414 | 0 | 95 | −10 | 20 | 1.57 |
| 415 | 0 | 95 | −25 | 22 | 2.12 |
| 416 | 0 | 95 | −2 | 24 | 2.49 |
| 417 | 0 | 95 | −10 | 21 | 2.06 |
| 418 | 0 | 95 | −6 | 21 | 2.07 |
| 419 | 0 | 95 | −6 | 18 | 1.12 |
| 420 | 0 | 95 | −10 | 18 | 1.1 |
| 421 | 0 | 95 | −10 | 26 | 2.06 |
| 422 | 0 | 95 | −25 | 20 | 1.56 |
| 423 | 0 | 95 | −15 | 26 | 2.11 |
| 424 | 0 | 95 | −4 | 20 | 1.64 |
| 425 | 0 | 95 | −8 | 20 | 1.59 |
| 426 | 0 | 95 | −10 | 24 | 2.52 |
| 427 | 0 | 95 | −25 | 21 | 2.1 |
| 428 | 0 | 95 | −15 | 24 | 2.51 |
| 429 | 0 | 95 | −20 | 21 | 2.08 |
| 430 | 0 | 95 | −10 | 22 | 2.08 |
| 431 | 0 | 95 | −20 | 20 | 1.56 |
| 432 | 0 | 95 | −2 | 26 | 1.94 |
| 433 | 0 | 95 | −20 | 24 | 2.52 |
| 434 | 0 | 95 | −15 | 18 | 1.05 |
| 435 | 0 | 95 | −15 | 21 | 2.07 |
| 436 | 0 | 95 | 0 | 24 | −0.04 |
| 437 | 0 | 95 | −8 | 18 | 1.11 |
| 438 | 0 | 95 | −6 | 26 | 2.03 |
| 439 | 0 | 95 | 0 | 20 | −0.04 |
| 440 | 0 | 95 | −4 | 21 | 2.08 |
| 441 | 0 | 95 | −6 | 20 | 1.65 |
| 442 | 0 | 95 | −4 | 18 | 1.11 |
| 443 | 0 | 95 | −25 | 26 | 2.15 |
| 444 | 0 | 95 | −6 | 24 | 2.51 |
| 445 | 0 | 95 | −25 | 18 | 1.05 |
| 446 | 0 | 95 | −2 | 21 | 1.95 |
| 447 | 0 | 95 | −8 | 24 | 2.51 |
| 448 | 0 | 95 | 0 | 26 | −0.05 |
| 449 | 0 | 95 | −15 | 20 | 1.56 |
| 450 | 0 | 95 | 0 | 22 | −0.03 |
| 451 | 1.2 | 85 | 0 | 26 | −0.07 |
| 452 | 1.2 | 85 | −2 | 26 | 0.26 |
| 453 | 1.2 | 85 | −4 | 22 | 0.24 |
| 454 | 1.2 | 85 | −8 | 24 | 0.98 |
| 455 | 1.2 | 85 | −6 | 18 | −0.48 |
| 456 | 1.2 | 85 | −4 | 26 | 1.46 |
| 457 | 1.2 | 85 | −10 | 20 | −0.14 |
| 458 | 1.2 | 85 | −15 | 18 | −0.54 |
| 459 | 1.2 | 85 | −10 | 26 | 1.68 |
| 460 | 1.2 | 85 | −15 | 20 | −0.17 |
| 461 | 1.2 | 85 | −25 | 20 | −0.18 |
| 462 | 1.2 | 85 | −10 | 24 | 1 |
| 463 | 1.2 | 85 | −20 | 18 | −0.55 |
| 464 | 1.2 | 85 | −4 | 20 | −0.09 |
| 465 | 1.2 | 85 | 0 | 20 | −0.04 |
| 466 | 1.2 | 85 | −2 | 18 | −0.35 |
| 467 | 1.2 | 85 | −15 | 22 | 0.31 |
| 468 | 1.2 | 85 | −8 | 21 | 0.19 |
| 469 | 1.2 | 85 | −10 | 18 | −0.52 |
| 470 | 1.2 | 85 | −10 | 21 | 0.17 |
| 471 | 1.2 | 85 | −6 | 22 | 0.26 |
| 472 | 1.2 | 85 | −25 | 18 | −0.56 |
| 473 | 1.2 | 85 | −4 | 21 | 0.23 |
| 474 | 1.2 | 85 | −2 | 20 | −0.03 |
| 475 | 1.2 | 85 | −6 | 24 | 0.96 |
| 476 | 1.2 | 85 | 0 | 18 | 0 |
| 477 | 1.2 | 85 | −20 | 26 | 1.77 |
| 478 | 1.2 | 85 | −2 | 21 | 0.15 |
| 479 | 1.2 | 85 | −15 | 26 | 1.74 |
| 480 | 1.2 | 85 | −15 | 24 | 1.03 |
| 481 | 1.2 | 85 | 0 | 21 | −0.01 |
| 482 | 1.2 | 85 | −25 | 21 | 0.17 |
| 483 | 1.2 | 85 | −8 | 26 | 1.67 |
| 484 | 1.2 | 85 | −8 | 18 | −0.5 |
| 485 | 1.2 | 85 | −4 | 18 | −0.43 |
| 486 | 1.2 | 85 | −10 | 22 | 0.28 |
| 487 | 1.2 | 85 | −25 | 22 | 0.32 |
| 488 | 1.2 | 85 | −8 | 20 | −0.13 |
| 489 | 1.2 | 85 | −2 | 24 | 0.85 |
| 490 | 1.2 | 85 | −20 | 22 | 0.32 |
| 491 | 1.2 | 85 | −8 | 22 | 0.27 |
| 492 | 1.2 | 85 | −6 | 26 | 1.57 |
| 493 | 1.2 | 85 | −2 | 22 | −0.03 |
| 494 | 1.2 | 85 | −6 | 21 | 0.2 |
| 495 | 1.2 | 85 | 0 | 24 | −0.06 |
| 496 | 1.2 | 85 | −6 | 20 | −0.11 |
| 497 | 0.3 | 90 | −6 | 22 | 0.49 |
| 498 | 0.3 | 90 | −15 | 18 | −0.12 |
| 499 | 0.3 | 90 | −2 | 24 | 0.85 |
| 500 | 0.3 | 90 | −6 | 24 | 0.82 |
| 501 | 0.3 | 90 | −15 | 20 | 0.06 |
| 502 | 0.3 | 90 | −25 | 18 | −0.14 |
| 503 | 0.3 | 90 | −2 | 18 | −0.05 |
| 504 | 0.3 | 90 | −25 | 22 | 0.46 |
| 505 | 0.3 | 90 | −10 | 22 | 0.47 |
| 506 | 0.3 | 90 | −2 | 22 | 0.53 |
| 507 | 0.3 | 90 | −4 | 20 | 0.11 |
| 508 | 0.3 | 90 | −10 | 18 | −0.11 |
| 509 | 0.3 | 90 | −10 | 21 | 0.21 |
| 510 | 0.3 | 90 | 0 | 22 | −0.07 |
| 511 | 0.3 | 90 | −8 | 26 | 1.24 |
| 512 | 0.3 | 90 | −8 | 24 | 0.81 |
| 513 | 0.3 | 90 | −8 | 22 | 0.48 |
| 514 | 0.3 | 90 | −15 | 22 | 0.47 |
| 515 | 0.3 | 90 | −20 | 26 | 1.31 |
| 516 | 0.3 | 90 | 0 | 21 | 0 |
| 517 | 0.3 | 90 | −20 | 22 | 0.46 |
| 518 | 0.3 | 90 | −8 | 20 | 0.1 |
| 519 | 0.3 | 90 | −6 | 18 | −0.06 |
| 520 | 0.3 | 90 | −25 | 20 | 0.04 |
| 521 | 0.3 | 90 | −2 | 20 | −0.02 |
| 522 | 0.3 | 90 | −15 | 21 | 0.2 |
| 523 | 0.3 | 90 | −4 | 26 | 1.2 |
| 524 | 0.3 | 90 | −6 | 21 | 0.22 |
| 525 | 0.3 | 90 | 0 | 24 | −0.09 |
| 526 | 0.3 | 90 | −4 | 24 | 0.84 |
| 527 | 0.3 | 90 | −20 | 21 | 0.2 |
| 528 | 0.3 | 90 | −25 | 21 | 0.2 |
| 529 | 0.3 | 90 | 0 | 20 | −0.01 |
| 530 | 0.3 | 90 | −10 | 20 | 0.08 |
| 531 | 0.3 | 90 | −10 | 26 | 1.26 |
| 532 | 0.3 | 90 | −8 | 18 | −0.09 |
| 533 | 0.3 | 90 | −4 | 22 | 0.51 |
| 534 | 0.3 | 90 | −20 | 24 | 0.84 |
| 535 | 0.3 | 90 | −2 | 26 | 1.06 |
| 536 | 0.3 | 90 | −15 | 26 | 1.29 |
| 537 | 0.3 | 90 | −20 | 18 | −0.13 |
| 538 | 0.3 | 90 | 0 | 26 | −0.16 |
| 539 | 0.3 | 90 | −4 | 21 | 0.24 |
| 540 | 0.3 | 90 | −20 | 20 | 0.05 |
| 541 | 0.3 | 90 | −4 | 18 | −0.05 |
| 542 | 0.3 | 90 | −8 | 21 | 0.21 |
| 543 | 0.3 | 90 | 0 | 18 | 0 |
| 544 | 0.3 | 90 | −2 | 21 | 0.25 |
| 545 | 0.3 | 90 | −10 | 24 | 0.81 |
| 546 | 0.3 | 90 | −6 | 20 | 0.1 |
| 547 | 1.2 | 95 | −2 | 21 | −0.06 |
| 548 | 1.2 | 95 | −10 | 22 | 1.42 |
| 549 | 1.2 | 95 | −8 | 20 | 1.27 |
| 550 | 1.2 | 95 | −2 | 22 | 1.09 |
| 551 | 1.2 | 95 | −2 | 24 | 0.36 |
| 552 | 1.2 | 95 | −20 | 20 | 1.41 |
| 553 | 1.2 | 95 | −2 | 18 | −0.11 |
| 554 | 1.2 | 95 | −8 | 26 | 1.59 |
| 555 | 1.2 | 95 | −20 | 24 | 1.55 |
| 556 | 1.2 | 95 | −25 | 22 | 1.56 |
| 557 | 1.2 | 95 | −4 | 24 | 1.5 |
| 558 | 1.2 | 95 | −8 | 22 | 1.4 |
| 559 | 1.2 | 95 | −25 | 18 | 0.57 |
| 560 | 1.2 | 95 | −4 | 18 | 0.51 |
| 561 | 1.2 | 95 | −20 | 22 | 1.51 |
| 562 | 1.2 | 95 | −15 | 24 | 1.52 |
| 563 | 1.2 | 95 | −4 | 26 | 1.46 |
| 564 | 1.2 | 95 | −15 | 21 | 1.41 |
| 565 | 1.2 | 95 | −2 | 26 | 1.08 |
| 566 | 1.2 | 95 | 0 | 20 | −0.07 |
| 567 | 1.2 | 95 | 0 | 24 | −0.07 |
| 568 | 1.2 | 95 | −20 | 26 | 1.77 |
| 569 | 1.2 | 95 | −15 | 20 | 1.37 |
| 570 | 1.2 | 95 | −6 | 26 | 1.54 |
| 571 | 1.2 | 95 | −6 | 22 | 1.41 |
| 572 | 1.2 | 95 | −8 | 24 | 1.49 |
| 573 | 1.2 | 95 | 0 | 22 | −0.03 |
| 574 | 1.2 | 95 | −6 | 24 | 1.5 |
| 575 | 1.2 | 95 | −20 | 18 | 0.54 |
| 576 | 1.2 | 95 | −4 | 20 | 1.16 |
| 577 | 1.2 | 95 | −25 | 24 | 1.64 |
| 578 | 1.2 | 95 | −10 | 20 | 1.3 |
| 579 | 1.2 | 95 | −6 | 21 | 1.26 |
| 580 | 1.2 | 95 | −6 | 18 | 0.54 |
| 581 | 1.2 | 95 | −25 | 20 | 1.44 |
| 582 | 1.2 | 95 | −4 | 21 | 1.23 |
| 583 | 1.2 | 95 | −15 | 22 | 1.47 |
| 584 | 1.2 | 95 | −4 | 22 | 1.36 |
| 585 | 1.2 | 95 | −15 | 26 | 1.72 |
| 586 | 1.2 | 95 | −10 | 18 | 0.54 |
| 587 | 1.5 | 90 | −6 | 21 | 0.77 |
| 588 | 1.5 | 90 | 0 | 24 | −0.14 |
| 589 | 1.5 | 90 | −4 | 26 | 2.42 |
| 590 | 1.5 | 90 | −2 | 20 | −0.1 |
| 591 | 1.5 | 90 | −25 | 20 | 0.79 |
| 592 | 1.5 | 90 | −25 | 24 | 1.82 |
| 593 | 1.5 | 90 | 0 | 18 | −0.06 |
| 594 | 1.5 | 90 | −10 | 21 | 0.96 |
| 595 | 1.5 | 90 | −2 | 18 | −0.07 |
| 596 | 1.5 | 90 | −2 | 22 | −0.13 |
| 597 | 1.5 | 90 | −4 | 18 | −0.12 |
| 598 | 1.5 | 90 | −20 | 26 | 3.46 |
| 599 | 1.5 | 90 | 0 | 20 | −0.09 |
| 600 | 1.5 | 90 | −25 | 18 | −0.14 |
| 601 | 1.5 | 90 | −6 | 24 | 1.47 |
| 602 | 1.5 | 90 | −2 | 24 | −0.22 |
| 603 | 1.5 | 90 | −15 | 20 | 0.71 |
| 604 | 1.5 | 90 | −15 | 18 | −0.19 |
| 605 | 1.5 | 90 | 0 | 21 | −0.1 |
| 606 | 1.5 | 90 | −6 | 22 | 0.9 |
| 607 | 1.5 | 90 | −4 | 20 | 0.58 |
| 608 | 1.5 | 90 | −8 | 20 | 0.61 |
| 609 | 1.5 | 90 | −8 | 18 | −0.19 |
| 610 | 1.5 | 90 | −20 | 21 | 1.05 |
| 611 | 1.5 | 90 | −20 | 22 | 1.08 |
| 612 | 1.5 | 90 | −20 | 18 | −0.16 |
| 613 | 1.5 | 90 | −15 | 26 | 3.37 |
| 614 | 1.5 | 90 | −8 | 22 | 0.99 |
| 615 | 1.5 | 90 | −8 | 26 | 3.19 |
| 616 | 1.5 | 90 | −10 | 26 | 3.25 |
| 617 | 1.5 | 90 | −6 | 26 | 3 |
| 618 | 1.5 | 90 | −4 | 22 | 0.76 |
| 619 | 1.5 | 90 | −25 | 26 | 3.5 |
| 620 | 1.5 | 90 | −10 | 22 | 1.02 |
| 621 | 1.5 | 90 | −2 | 26 | −0.16 |
| 622 | 1.5 | 90 | −15 | 21 | 1.01 |
| 623 | 1.5 | 90 | −20 | 20 | 0.75 |
| 624 | 1.5 | 90 | −8 | 21 | 0.82 |
| 625 | 1.5 | 90 | −25 | 22 | 1.12 |
| 626 | 1.5 | 90 | −10 | 18 | −0.22 |
| 627 | 1.5 | 90 | −25 | 21 | 1.09 |
| 628 | 1.5 | 90 | 0 | 22 | −0.12 |
| 629 | 1.5 | 90 | −6 | 18 | −0.17 |
| 630 | 1.5 | 90 | −6 | 20 | 0.59 |
| 631 | 1.5 | 90 | −10 | 24 | 1.65 |
| 632 | 1.5 | 90 | −15 | 24 | 1.75 |
| 633 | 0 | 90 | −2 | 22 | 0.6 |
| 634 | 0 | 90 | −15 | 24 | 2.57 |
| 635 | 0 | 90 | −15 | 21 | 0.62 |
| 636 | 0 | 90 | −15 | 22 | 0.67 |
| 637 | 0 | 90 | −2 | 24 | 2.5 |
| 638 | 0 | 90 | −4 | 20 | 0.18 |
| 639 | 0 | 90 | −6 | 24 | 2.55 |
| 640 | 0 | 90 | −6 | 26 | 2.32 |
| 641 | 0 | 90 | −6 | 22 | 0.68 |
| 642 | 0 | 90 | −25 | 24 | 2.61 |
| 643 | 0 | 90 | −15 | 18 | 0.02 |
| 644 | 0 | 90 | −6 | 18 | 0.05 |
| 645 | 0 | 90 | −10 | 24 | 2.54 |
| 646 | 0 | 90 | −4 | 18 | 0.07 |
| 647 | 0 | 90 | −25 | 22 | 0.67 |
| 648 | 0 | 90 | −8 | 22 | 0.67 |
| 649 | 0 | 90 | −20 | 26 | 2.4 |
| 650 | 0 | 90 | −10 | 21 | 0.62 |
| 651 | 0 | 90 | −8 | 24 | 2.54 |
| 652 | 0 | 90 | −20 | 20 | 0.15 |
| 653 | 0 | 90 | −20 | 18 | 0.02 |
| 654 | 0 | 90 | −2 | 20 | 0.17 |
| 655 | 0 | 90 | −15 | 20 | 0.15 |
| 656 | 0 | 90 | 0 | 21 | 0 |
| 657 | 0 | 90 | −4 | 21 | 0.64 |
| 658 | 0 | 90 | −20 | 24 | 2.59 |
| 659 | 0 | 90 | −6 | 21 | 0.63 |
| 660 | 0 | 90 | −2 | 21 | 0.58 |
| 661 | 0 | 90 | −25 | 18 | 0.02 |
| 662 | 0 | 90 | −8 | 18 | 0.03 |
| 663 | 0 | 90 | −6 | 20 | 0.17 |
| 664 | 0 | 90 | −25 | 26 | 2.41 |
| 665 | 0 | 90 | −4 | 26 | 2.31 |
| 666 | 0 | 90 | −25 | 20 | 0.24 |
| 667 | 0 | 90 | 0 | 20 | −0.01 |
| 668 | 0 | 90 | −15 | 26 | 2.37 |
| 669 | 0 | 90 | −8 | 20 | 0.16 |
| 670 | 0 | 90 | −8 | 21 | 0.63 |
| 671 | 0 | 90 | −25 | 21 | 0.62 |
| 672 | 0 | 90 | −20 | 22 | 0.67 |
| 673 | 0 | 90 | −20 | 21 | 0.62 |
| 674 | 0 | 90 | −10 | 22 | 0.67 |
| 675 | 0 | 90 | −4 | 24 | 2.56 |
| 676 | 0 | 90 | 0 | 26 | −0.06 |
| 677 | 0 | 90 | 0 | 18 | 0 |
| 678 | 0 | 90 | −2 | 26 | 2.22 |
| 679 | 0 | 90 | −4 | 22 | 0.69 |
| 680 | 0 | 90 | −10 | 18 | 0.03 |
| 681 | 1.5 | 95 | −4 | 18 | 0.02 |
| 682 | 1.5 | 95 | −10 | 26 | 1.89 |
| 683 | 1.5 | 95 | −6 | 20 | 0.65 |
| 684 | 1.5 | 95 | −8 | 26 | 1.83 |
| 685 | 1.5 | 95 | −2 | 20 | −0.1 |
| 686 | 1.5 | 95 | −20 | 24 | 1.81 |
| 687 | 0 | 85 | 0 | 22 | −0.02 |
| 688 | 0 | 85 | −15 | 26 | 0.74 |
| 689 | 0 | 85 | −20 | 18 | −0.01 |
| 690 | 0 | 85 | −6 | 26 | 0.68 |
| 691 | 0 | 85 | −2 | 20 | 0.03 |
| 692 | 0 | 85 | −4 | 21 | 0.25 |
| 693 | 0 | 85 | −4 | 22 | 0.3 |
| 694 | 0.3 | 95 | −2 | 20 | 1.2 |
| 695 | 0.3 | 95 | −15 | 22 | 1.2 |
| 696 | 0.3 | 95 | −6 | 20 | 1.17 |
| 697 | 0.3 | 95 | −25 | 18 | 0.78 |
| 698 | 0.3 | 95 | −2 | 24 | 1.01 |
| 699 | 0.3 | 95 | −8 | 26 | 1.36 |
| 700 | 0.3 | 95 | −8 | 22 | 1.18 |
| 701 | 0.3 | 95 | −4 | 24 | 1.23 |
| 702 | 0.3 | 95 | −25 | 21 | 1.21 |
| 703 | 0.3 | 95 | 0 | 24 | −0.09 |
| 704 | 0.3 | 85 | 0 | 22 | −0.02 |
| 705 | 0.3 | 85 | −2 | 18 | −0.03 |
| 706 | 0.3 | 85 | −4 | 26 | 1.13 |
| 707 | 0.3 | 85 | −2 | 20 | −0.05 |
| 708 | 0.3 | 85 | −2 | 26 | 1.03 |
| 709 | 0.3 | 85 | −15 | 21 | 0.15 |
| 710 | 0.3 | 85 | −20 | 21 | 0.16 |
| 711 | 0.3 | 85 | −20 | 24 | 0.91 |
| 712 | 0.3 | 85 | −10 | 20 | −0.11 |
| 713 | 0.5 | 95 | −20 | 26 | 1.5 |
| 714 | 0.5 | 95 | −10 | 21 | 1.18 |
| 715 | 0.5 | 95 | −8 | 26 | 1.43 |
| 716 | 0.5 | 95 | 0 | 26 | −0.05 |
| 717 | 0.5 | 95 | −8 | 24 | 1.39 |
| 718 | 0.5 | 95 | −8 | 22 | 1.35 |
| 719 | 0.5 | 95 | −15 | 20 | 1.01 |
| 720 | 0.5 | 95 | −6 | 22 | 1.36 |
| 721 | 0.5 | 95 | −6 | 18 | 0.54 |
| 722 | 1.2 | 90 | −15 | 26 | 2.93 |
| 723 | 1.2 | 90 | 0 | 24 | −0.06 |
| 724 | 1.2 | 90 | 0 | 26 | −0.07 |
| 725 | 1.2 | 90 | −10 | 22 | 0.63 |
| 726 | 1.2 | 90 | −8 | 18 | 0 |
| 727 | 1.2 | 90 | −25 | 24 | 1.54 |
| 728 | 1.2 | 90 | −20 | 20 | 0.36 |
| 729 | 1.2 | 90 | −15 | 21 | 0.68 |
| 730 | 1.2 | 90 | −8 | 22 | 0.62 |
| 731 | 1.2 | 90 | −6 | 20 | 0.42 |
| 732 | 1.2 | 90 | −20 | 21 | 0.7 |
| 733 | 1.2 | 90 | −6 | 18 | 0 |
| 734 | 1.5 | 85 | −25 | 20 | 0.4 |
| 735 | 1.5 | 85 | −10 | 22 | 0.9 |
| 736 | 1.5 | 85 | −25 | 24 | 1.34 |
| 737 | 1.5 | 85 | −8 | 21 | 0.31 |
| 738 | 1.5 | 85 | −20 | 22 | 1.05 |
| 739 | 1.5 | 85 | −2 | 26 | −0.08 |
| 740 | 1.5 | 85 | −15 | 22 | 1 |
| 741 | 1.5 | 85 | −25 | 26 | 1.93 |
| 742 | 0.5 | 85 | 0 | 24 | −0.02 |
| 743 | 0.5 | 85 | −8 | 18 | −0.23 |
| 744 | 0.5 | 85 | −15 | 22 | 0.23 |
| 745 | 0.5 | 85 | −4 | 20 | −0.18 |
| 746 | 0.5 | 85 | −15 | 24 | 0.98 |
| 747 | 0.5 | 85 | −4 | 22 | 0.27 |
| 748 | 0.5 | 85 | −20 | 18 | −0.23 |
| 749 | 0.5 | 85 | −4 | 26 | 1.31 |
| 750 | 0.5 | 85 | −10 | 22 | 0.24 |
| 751 | 0.5 | 85 | −2 | 26 | 0.57 |
| 752 | 0.5 | 90 | −20 | 21 | 0.94 |
| 753 | 0.5 | 90 | −15 | 22 | 0.93 |
| 754 | 0.5 | 90 | −4 | 26 | 1.37 |
| 755 | 0.5 | 90 | −4 | 24 | 0.94 |
| 756 | 0.5 | 90 | −15 | 24 | 1.03 |
| 757 | 0.5 | 90 | −20 | 24 | 1.05 |
| 758 | 0.5 | 90 | −10 | 20 | 0.39 |
| 759 | 0.5 | 90 | −2 | 21 | 0.53 |
| 760 | 0.5 | 90 | 0 | 20 | −0.03 |
| 761 | 0 | 95 | −6 | 22 | 2.07 |
| 762 | 0 | 95 | −2 | 22 | 1.98 |
| 763 | 0 | 95 | −4 | 26 | 2.02 |
| 764 | 0 | 95 | −20 | 26 | 2.13 |
| 765 | 0 | 95 | −8 | 22 | 2.07 |
| 766 | 0 | 95 | 0 | 18 | −0.02 |
| 767 | 0 | 95 | −2 | 20 | 1.66 |
| 768 | 0 | 95 | −4 | 24 | 2.5 |
| 769 | 0 | 95 | −25 | 24 | 2.54 |
| 770 | 0 | 95 | −20 | 22 | 2.1 |
| 771 | 1.2 | 85 | 0 | 22 | −0.02 |
| 772 | 1.2 | 85 | −25 | 26 | 1.81 |
| 773 | 1.2 | 85 | −20 | 24 | 1.05 |
| 774 | 1.2 | 85 | −4 | 24 | 0.94 |
| 775 | 1.2 | 85 | −20 | 21 | 0.17 |
| 776 | 1.2 | 85 | −15 | 21 | 0.17 |
| 777 | 1.2 | 85 | −25 | 24 | 1.19 |
| 778 | 1.2 | 85 | −20 | 20 | −0.17 |
| 779 | 0.3 | 90 | −6 | 26 | 1.23 |
| 780 | 0.3 | 90 | −25 | 26 | 1.31 |
| 781 | 0.3 | 90 | −25 | 24 | 0.84 |
| 782 | 0.3 | 90 | −15 | 24 | 0.83 |
| 783 | 1.2 | 95 | −20 | 21 | 1.43 |
| 784 | 1.2 | 95 | −25 | 21 | 1.54 |
| 785 | 1.2 | 95 | −8 | 21 | 1.27 |
| 786 | 1.2 | 95 | −15 | 18 | 0.54 |
| 787 | 1.2 | 95 | −10 | 26 | 1.64 |
| 788 | 1.2 | 95 | −8 | 18 | 0.54 |
| 789 | 1.2 | 95 | −10 | 24 | 1.49 |
| 790 | 1.2 | 95 | −2 | 20 | −0.11 |
| 791 | 1.2 | 95 | 0 | 18 | −0.07 |
| 792 | 1.2 | 95 | −6 | 20 | 1.24 |
| 793 | 1.2 | 95 | 0 | 26 | −0.03 |
| 794 | 1.2 | 95 | −10 | 21 | 1.3 |
| 795 | 1.2 | 95 | 0 | 21 | −0.04 |
| 796 | 1.2 | 95 | −25 | 26 | 1.95 |
| 797 | 1.5 | 90 | −4 | 21 | 0.64 |
| 798 | 1.5 | 90 | 0 | 26 | −0.12 |
| 799 | 1.5 | 90 | −15 | 22 | 1.07 |
| 800 | 1.5 | 90 | −4 | 24 | 1.34 |
| 801 | 1.5 | 90 | −20 | 24 | 1.8 |
| 802 | 1.5 | 90 | −8 | 24 | 1.61 |
| 803 | 1.5 | 90 | −10 | 20 | 0.63 |
| 804 | 1.5 | 90 | −2 | 21 | −0.11 |
| 805 | 0 | 90 | −10 | 26 | 2.32 |
| 806 | 0 | 90 | −2 | 18 | 0.09 |
| 807 | 0 | 90 | 0 | 22 | −0.02 |
| 808 | 0 | 90 | −10 | 20 | 0.16 |
| 809 | 0 | 90 | 0 | 24 | −0.04 |
| 810 | 0 | 90 | −8 | 26 | 2.32 |
References
- Zeng, G.; Zhang, M.; Li, Z.; Pei, W. Study of moisture migration and frost heave model of freezing saturated soil. Rock Soil Mech. 2015, 1085–1092. [Google Scholar] [CrossRef]
- Yin, X.; Liu, E.; Song, B.; Zhang, D. Numerical analysis of coupled liquid water, vapor, stress and heat transport in unsaturated freezing soil. Cold Reg. Sci. Technol. 2018, 155, 20–28. [Google Scholar] [CrossRef]
- She, W.; Cao, X.; Zhao, G.; Cai, D.; Jiang, J.; Hu, X. Experimental and numerical investigation of the effect of soil type and fineness on soil frost heave behavior. Cold Reg. Sci. Technol. 2018, 148, 148–158. [Google Scholar] [CrossRef]
- Bai, R.; Lai, Y.; Zhang, M.; Gao, J. Water-vapor-heat behavior in a freezing unsaturated coarse-grained soil with a closed top. Cold Reg. Sci. Technol. 2018, 155, 120–126. [Google Scholar] [CrossRef]
- Gao, J.; Lai, Y.; Zhang, M.; Feng, Z.; Gao, J.; Lai, Y.; Zhang, M.; Feng, Z.; Gao, J.; Lai, Y. Experimental study on the water-heat-vapor behavior in a freezing coarse-grained soil. Appl. Therm. Eng. 2018, 128, 956–965. [Google Scholar] [CrossRef]
- Kong, Y. Experimental Research on the Saline Soil Water-Salt Transport and Structure Evolution in Zhenlai Zone. Ph.D. Thesis, Jilin University, Jilin, China, 2017. [Google Scholar]
- Li, S.; Lai, Y.; Pei, W.; Zhang, S.; Zhong, H. Moisture–temperature changes and freeze–thaw hazards on a canal in seasonally frozen regions. Nat. Hazards 2014, 72, 287–308. [Google Scholar] [CrossRef]
- Yu, F.; Qi, J.; Zhang, M.; Lai, Y.; Yao, X.; Liu, Y.; Wu, G. Cooling performance of two-phase closed thermosyphons installed at a highway embankment in permafrost regions. Appl. Therm. Eng. 2016, 98, 220–227. [Google Scholar] [CrossRef]
- Tai, B.; Liu, J.; Li, X.; Yue, Z.; Shen, Y. Numerical model of frost heaving and anti-frost heave measures of high speed railway subgrade in cold region. China Railw. Sci. 2017, 1–9. [Google Scholar] [CrossRef]
- Wang, T.; Yue, Z. Influence of fines content on frost feaving properties of coarse grained soil. Rock Soil Mech. 2013, 34, 359–364, 388. [Google Scholar] [CrossRef]
- Gilpin, R.R. A model for the prediction of ice lensing and frost heave in soils. Water Resour. Res. 1980, 16, 918–930. [Google Scholar] [CrossRef]
- Sheng, D.; Axelsson, K.; Knutsson, S. Frost Heave due to Ice Lens Formation in Freezing Soils 1. Theory and Verification. Nord. Hydrol. 1995, 26, 125–146. [Google Scholar] [CrossRef]
- Sheng, D.; Zhang, S.; He, Z. Assessing frost susceptibility of soils. Chin. J. Rock Mech. Eng. 2014, 594–605. [Google Scholar] [CrossRef]
- Zheng, H.; Kanie, S. The application of Mixed Hybrid FEM in the frost heave prediction verified by FEM and indoor frost heave experiments. Cold Reg. Sci. Technol. 2017, 142, 85–92. [Google Scholar] [CrossRef]
- Singh, A.K.; Chaudhary, D.R. Evaluation of heat and moisture transfer properties in a frozen-unfrozen water-soil system. Int. J. Heat Mass Transf. 1995, 38, 2297–2303. [Google Scholar] [CrossRef]
- Zhang, X.; Zhang, M.; Lu, J.; Pei, W.; Yan, Z. Effect of hydro-thermal behavior on the frost heave of a saturated silty clay under different applied pressures. Appl. Therm. Eng. 2017, 117, 462–467. [Google Scholar] [CrossRef]
- Zhang, P.; Huang, X.; Yang, X.; Liu, Z.; Zhong, Z. Experiment on coupling effect of water and thermal field and salt-expansion deformation of salty soil. Rock Soil Mech. 2018, 1–6. [Google Scholar] [CrossRef]
- Wu, Q.; Zhu, Y. Experimental studies on salt expansion for coarse grain soil under constant temperature. Cold Reg. Sci. Technol. 2002, 34, 59–65. [Google Scholar] [CrossRef]
- Wan, X.-S.; Liao, M.-K.; Du, L.-Q. Experimental Study on the Influence of Temperature on Salt Expansion of Sodium Sulfate Saline Soil. J. Highw. Transp. Res. Dev. (Engl. Ed.) 2017, 11. [Google Scholar] [CrossRef]
- Zhang, X.; Wang, Q.; Huo, Z.; Yu, T.; Wang, G.; Liu, T.; Wang, W. Prediction of frost-heaving behavior of saline soil in western Jilin Province, China, by neural network methods. Math. Probl. Eng. 2017, 2017, 1–10. [Google Scholar] [CrossRef]
- Sun, D.; Wang, W.; Wang, Q.; Chen, J.; Niu, C.; Cao, C. Characteristics and prediction of frost heave of saline soil in western Jilin Province. Int. J. Heat Technol. 2016, 34, 709–714. [Google Scholar] [CrossRef]
- Bao, S.C. Frost Heaving Characteristic and PFC-3D Numerical Analysis of Saline Soil in Western Jilin Province. Ph.D. Thesis, Jilin University, Jilin, China, 2015. [Google Scholar]
- Montgomery, D. Design and Analysis of Experiments, 8th ed.111 River Street; John Wiley & Sons, Inc.: Hoboken, NJ, USA, 2012. [Google Scholar] [Green Version]
- He, Z.; Liang, Z. Experimental Design for Split-plot with Related Factors. Syst. Eng. Theory Pract. 2009, 29, 56–63. [Google Scholar] [CrossRef]
- Jones, B.; Nachtsheim, C.J. Split-Plot Designs: What, Why, and How. J. Qual. Technol. 2009, 41, 361. [Google Scholar] [CrossRef]
- Bingham, D.; Sitter, R.R. Fractional factorial split-plot designs for robust parameter experiments. Technometrics 2003, 45, 80–89. [Google Scholar] [CrossRef]
- Celikoglu, H.B. A Dynamic Network Loading Model for Traffic Dynamics Modeling. IEEE Trans. Intell. Transp. Syst. 2007, 8, 575–583. [Google Scholar] [CrossRef]
- Yu, T. Numerical Analysis of Coupled Water Heat Salt and Stress of Saline Soil in Western Jilin Province. Ph.D. Thesis, Jilin University, Jilin, China, 2016. [Google Scholar]
- Zhang, D.; Wang, S. Mechanism of freeze-thaw action in land salinization process—As an sample in west Jilin Province. Bull. Soil Water Conserv. 2000, 20, 14–17. [Google Scholar] [CrossRef]
- Bao, S.D. Soil Agro-chemistrical Analysis, 3rd ed.; China Agriculture Press: Beijing, China, 2008. [Google Scholar]
- StatEase. Design-Export. Available online: https://www.statease.com/ (accessed on 31 July 2019).
- Kenward, M.G.; Roger, J. Small sample inference for fixed effects from restricted maximum likelihood. Biometrics 1997, 53, 983–997. [Google Scholar] [CrossRef]
- Box, G.; Jones, S. Split-plot designs for robust product experimentation. J. Appl. Stat. 1992, 19, 3–26. [Google Scholar] [CrossRef]
- Specht, D.F. A general regression neural network. IEEE Trans. Neural Netw. 1991, 2, 568–576. [Google Scholar] [CrossRef]
- Chen, X.; Lu, G.; Zhu, J. Research on improvement of indoor frost-heave ratio experiment method. J. Northwest. Univ. (Nat. Sci. Ed.) 2010, 40, 145–149. [Google Scholar]
- Ma, W.; Wang, D. Studies on frozen soil mechanics in China in past 50 years and their prospect. Chin. J. Geotech. Eng. 2012, 34, 625–640. [Google Scholar]
- Zhou, G. Analysis of mechanism of rest raining soil freezing swelling by using intermission method. Coll. Civ. Archit. Eng. 1999, 28, 413–416. [Google Scholar] [CrossRef]
- Bao, S.; Wang, Q.; Bian, J. Indoor frost heaving experiment of saline soil in Da’an area, Jilin Province. J. Eng. Geol. 2018, 26, 1701–1707. [Google Scholar] [CrossRef]
- Konrad, J.M.; Morgenstern, N.R. Effects of applied pressure on freezing soils. Can. Geotech. J. 1982, 19, 494–505. [Google Scholar] [CrossRef]
- Takashi, T.; Masuda, M.; Yamamoto, H. Experimental study on the influence of freezing speed upon frost heave of soil under constant effective stress. J. Jpn. Soc. Snow Ice 1974, 36, 49–68. [Google Scholar] [CrossRef]
- Jia, L.; Hou, Z.; Wang, W. Swelling mechanism and restraining measures of sulphate salty soil under freeze-thawing condition. J. Anhui Agric. Sci. 2009, 37, 3330–3331, 3344. [Google Scholar] [CrossRef]
- Gong, L.; Liu, D.; Yang, N.; Wang, Y.; Zhang, Y. Field experimental study on frost heave of subgrade soil in Xige section of Qinghai—Tibet railway. Subgrade Eng. 2018. [Google Scholar] [CrossRef]
- Gong, L.; Liu, D.; Yang, N.; Wang, Y.; Zhang, Y. Comprehensive analysis on frost heave factors of subgrade soil in seasonally frozen ground region. Hydro-Sci. Eng. 2019, 28–34. [Google Scholar] [CrossRef]


| Depths (cm) | Granulometric Composition | Water Content (%) | CSS (%) | pH | Density (g/cm3) | ||
|---|---|---|---|---|---|---|---|
| Clay (%) | Silt (%) | Sand (%) | |||||
| 20 | 31.20 | 59.20 | 9.60 | 12.50 | 0.60 | 9.2 | 1.57 |
| 30 | 41.70 | 52.80 | 5.50 | 19.80 | 0.55 | 8.4 | 1.60 |
| 40 | 36.90 | 53.60 | 9.50 | 20.70 | 0.49 | 8.6 | 1.58 |
| 50 | 44.80 | 50.60 | 4.60 | 20.60 | 0.35 | 8.7 | 1.62 |
| 70 | 43.90 | 52.00 | 4.10 | 20.80 | 0.28 | 8.6 | 1.62 |
| 100 | 42.70 | 52.70 | 4.60 | 18.10 | 0.29 | 8.5 | 1.61 |
| Factors | Name | Change Type 1 | Low Level 2 | High Level 2 | Code Values 3 | |
|---|---|---|---|---|---|---|
| CSS | CSS (%) | Hard | 0.5 | 1.5 | −1 = 0.5 | 1 = 1.5 |
| C | Compactness (%) | Hard | 85.0 | 95.0 | −1 = 85.0 | 1 = 95.0 |
| T | Temperature (°C) | Easy | −25.0 | −4.0 | −1 = −25.0 | 1 = −4.0 |
| WC | Water content (%) | Easy | 18.0 | 26.0 | −1 = 18.0 | 1 = 26.0 |
| No. | Factors | Response | |||
|---|---|---|---|---|---|
| CSS (%) | Compactness (%) | Temperature (°C) | Water Content (%) | η (%) | |
| 1 | 1.5 | 95.0 | −4.0 | 26.0 | 1.38 |
| 2 | 1.5 | 95.0 | −25.0 | 18.0 | 0.11 |
| 3 | 1.5 | 85.0 | −4.0 | 18.0 | −0.47 |
| 4 | 1.5 | 85.0 | −25.0 | 26.0 | 1.93 |
| 5 | 1.5 | 85.0 | −25.0 | 18.0 | −0.60 |
| 6 | 1.5 | 85.0 | −4.0 | 26.0 | 1.79 |
| 7 | 1.5 | 95.0 | −25.0 | 26.0 | 2.10 |
| 8 | 1.5 | 95.0 | −4.0 | 18.0 | −0.02 |
| 9 | 0.5 | 85.0 | −25.0 | 26.0 | 1.43 |
| 10 | 0.5 | 85.0 | −4.0 | 18.0 | −0.23 |
| 11 | 0.5 | 85.0 | −25.0 | 18.0 | −0.23 |
| 12 | 0.5 | 85.0 | −4.0 | 26.0 | 1.29 |
| 13 | 0.5 | 95.0 | −25.0 | 26.0 | 1.51 |
| 14 | 0.5 | 95.0 | −4.0 | 18.0 | 0.54 |
| 15 | 0.5 | 95.0 | −25.0 | 18.0 | 0.66 |
| 16 | 0.5 | 95.0 | −4.0 | 26.0 | 1.38 |
| Factors | Levels |
|---|---|
| Compactness (%) | 85.0, 90.0, 95.0 |
| CSS (%) | 0.0, 0.3, 0.5, 1.2, 1.5 |
| Water content (%) | 18.0, 20.0, 21.0, 22.0, 24.0, 26.0 |
| Temperature (°C) | 0.0, −2.0, −4.0, −6.0, −8.0, −10.0, −15.0, −22.0, −25.0 |
| Factor | DF1 | Coefficient | F-Value | p-Value |
|---|---|---|---|---|
| CSS | 1 | −0.0081 | 0.084 | 0.7830 |
| Compactness | 1 | 0.1700 | 37.79 | 0.0017* |
| Temperature | 1 | −0.0780 | 7.81 | 0.0382* |
| Water content | 1 | 0.8200 | 851.09 | <0.0001* |
| CSS × C | 1 | −0.0570 | 4.14 | 0.0976 |
| CSS × WC | 1 | 0.2100 | 54.75 | 0.0007* |
| C × T | 1 | −0.0590 | 4.51 | 0.0871 |
| C × WC | 1 | −0.1800 | 41.74 | 0.0013* |
| T × WC | 1 | −0.0630 | 5.10 | 0.0735 |
| CSS × T × WC | 1 | −0.0440 | 2.52 | 0.1733 |
| Statistical Values | Granulometric Composition | Water Content (%) | CSS (%) | Density (g/cm3) | η (%) | ||
|---|---|---|---|---|---|---|---|
| Clay (%) | Silt (%) | Sand (%) | |||||
| Maximum | 53.46 | 49.89 | 8.18 | 24.80 | 0.92 | 1.90 | 3.50 |
| Minimum | 41.93 | 41.43 | 4.26 | 7.30 | 0.34 | 1.80 | −0.60 |
| Mean | 48.91 | 45.58 | 5.50 | 17.18 | 0.53 | 1.87 | 0.74 |
| Response | Factor | Correlation Coefficient | ||
|---|---|---|---|---|
| Pearson | Kendall | Spearman | ||
| η | CSS | 0.089* | 0.042 | 0.048 |
| Compactness | 0.338** | 0.293** | 0.373** | |
| Temperature | −0.289** | −0.255** | −0.351** | |
| Water content | 0.628** | 0.482** | 0.614** | |
| C × WC | 0.701** | 0.577** | 0.720** | |
| CSS × WC | 0.234** | 0.171** | 0.232** | |
| Statistical Indexes | Single-GRNN | Interact-GRNN | ||
|---|---|---|---|---|
| Training | Testing | Training | Testing | |
| R2 | 0.95 | 0.92 | 0.99 | 0.97 |
| RMSE | 0.2000 | 0.2370 | 0.1059 | 0.1373 |
© 2019 by the authors. Licensee MDPI, Basel, Switzerland. This article is an open access article distributed under the terms and conditions of the Creative Commons Attribution (CC BY) license (http://creativecommons.org/licenses/by/4.0/).
Share and Cite
Wan, H.; Bian, J.; Wu, J.; Sun, X.; Wang, Y.; Jia, Z. Prediction of Seasonal Frost Heave Behavior in Unsaturated Soil in Northeastern China Using Interactive Factor Analysis with Split-Plot Experiments and GRNN. Water 2019, 11, 1587. https://doi.org/10.3390/w11081587
Wan H, Bian J, Wu J, Sun X, Wang Y, Jia Z. Prediction of Seasonal Frost Heave Behavior in Unsaturated Soil in Northeastern China Using Interactive Factor Analysis with Split-Plot Experiments and GRNN. Water. 2019; 11(8):1587. https://doi.org/10.3390/w11081587
Chicago/Turabian StyleWan, Hanli, Jianmin Bian, Juanjuan Wu, Xiaoqing Sun, Yu Wang, and Zhuo Jia. 2019. "Prediction of Seasonal Frost Heave Behavior in Unsaturated Soil in Northeastern China Using Interactive Factor Analysis with Split-Plot Experiments and GRNN" Water 11, no. 8: 1587. https://doi.org/10.3390/w11081587