Determination of Budesonide and Sulfasalazine in Water and Wastewater Samples Using DLLME-SFO-HPLC-UV Method

Institute of Chemistry, University of Białystok, ul. Ciołkowskiego 1K, 15-245 Białystok, Poland
*
Author to whom correspondence should be addressed.
Water 2019, 11(8), 1581; https://doi.org/10.3390/w11081581
Submission received: 18 June 2019
/
Revised: 15 July 2019
/
Accepted: 29 July 2019
/
Published: 30 July 2019
(This article belongs to the Special Issue Removal of Organic Pollution in Water Environment)
Abstract
:Dispersive liquid–liquid microextraction based on solidification of floating organic droplet (DLLME-SFO) was applied to isolate budesonide (BUD) and sulfasalazine (SULF) from aqueous samples. The effects of different parameters on the efficiency on the extraction such as type of extrahent and dispersive solvent, ionic strength, pH of sample, and centrifugation time were investigated. Moreover, the influence of foreign substances on a studied process was tested. The calibration curves were recorded. The linearity ranges for BUD and SULF were 0.022–8.611 µg mL−1 and 0.020–7.968 µg mL−1 with the limit of detection (LOD) 0.011 µg mL−1 and 0.012 µg mL−1, respectively. The enrichment factors (EF) for two analytes were high: for BUD it was 145.7 and for SULF, 119.5. The elaborated procedure was applied for HPLC-UV determination of these analytes in water and wastewater samples.
1. Introduction
Increasing production and consumption of medicines contributes to the presence of biologically active substances in the environment and their concentration in surface waters. They affect negatively both the functioning of water reservoirs as well as living organisms despite the fact that pharmaceutical residues are present in very low concentration levels from ng L−1 to µg L−1. Surface waters are important raw water sources for drinking water treatment plants, and a few studies have shown that pharmaceuticals and/or their metabolites may pass the treatment process and end up even in drinking water. In connection with the above, an important task for analysts is to monitor the concentrations of residues of biologically active compounds in surface waters and wastewater. Among the medicines often found in water and wastewater samples are: antibiotics, analgesics, beta-blockers, anti-inflammatory, and antidepressants [1].
Budesonide (BUD) belongs to glucocorticoids with a strong anti-inflammatory and antiallergic activity. It is used for the prevention and treatment of bronchial asthma and chronic obstructive pulmonary disease [2]. The controlled-release tablets are intended for people with intestinal inflammation or Crohn's disease of mild to moderate severity. Moreover, it is frequently used in veterinary medicine for the treatment of canine respiratory and bowel inflammatory diseases [3].
Sulfasalazine (SULF) is a synthetic drug and a combination of antibiotic (sulfapyridine) and an anti-inflammatory agent (5-aminosalysilic acid) which is extensively used in the treatment of inflammatory bowel diseases such as rheumatoid arthritis, Crohn’s disease and ulcerative colitis [4].
There are several analytical methods available for the separate determination of BUD and SULF. BUD was determined in a variety of matrices using high-performance liquid chromatographic [5,6] and liquid chromatography–mass spectrometry (LC–MS or LC–MS/MS) [2,3,7,8,9]. Similarly, SULF was quantitated in a range of different matrices using high-performance liquid chromatography with diode array detection or ultraviolet detection (HPLC-DAD and HPLC-UV) [10,11,12], thin-layer chromatography densitometry [13], nuclear magnetic resonance (NMR) [14], spectroflourimetry [15] and liquid chromatography/positive-ion electrospray ionization mass spectrometry (LC-ESI(+)-MS/MS [16]. None of the above methods attempted the simultaneous analysis of BUD and SULF in the same sample.
The literature review shows that budesonide assays were made in biological samples [7,8,9], environmental samples [17,18], pharmaceutical formulations, and cosmetic products [19]. SULF was determined in pharmaceutical preparations [13,14,15], human plasma [10,16], water, and wastewater samples [20,21]. SULF was determined in river samples at the concentration of 15–76 ng L−1 and in wastewater samples at 65 ng L−1 (influent) and 266 ng L−1 (effluent) [20].
Traditionally, the sample treatment techniques used to isolate pharmaceuticals from water samples have been the liquid–liquid extraction (LLE) and the solid-phase extraction (SPE) [21]. LLE technique needs large volumes of toxic solvent, and the creation of emulsions is a common problem. However, SPE technique requires column conditioning and a process that is sometimes complicated and time-consuming. Therefore, the development of environmentally friendly pretreatment methods is necessary to overcome such disadvantages. Currently, microextraction techniques are often used to separate biologically active substances from aqueous solutions.
A novel dispersive liquid–liquid microextraction based on the solidification of floating organic drop (DLLME-SFO) was introduced by Leong et al. [22]. It involves the use of extraction solvent with a density lower than the density of water and freezing point near to the room temperature. The mixture of the dispersing and extracting solvent is injected into the water sample to form a turbid solution. After centrifugation, the tube is placed in an ice bath to solidify the extractant. The solidified drop is then collected and placed in a conical tube and allowed to melt. The liquid extract is analyzed by the appropriate instrumental technique. DLLME-SFO offers high analyte enrichment factors due to the use of small volumes of extractants compared to the volume of the water sample being tested. This method has gained recognition due to many advantages such as: simplicity of the procedure, high recovery, low cost, short extraction time, and the fact that it is not harmful to the environment.
On the ground of the review of literature, the use of the DLLME-SFO technique for the separation of organic [23,24,25,26], inorganic compounds and metal ions [27,28,29,30] was described in numerous publications presenting procedures for pretreatment of samples, e.g., tap water, water from the lake, human serum, urine, surficial sediments or beverage samples. A much smaller number of literature reports show the use of this technique for isolation of drugs. To the best of our knowledge, DLLME-SFO has not been applied for the isolation of BUD and SULF from water samples.
The aim of this study was to optimize the DLLME-SFO technique for isolating BUD and SULF from aqueous solutions. The effects of various experimental parameters such as a suitable extraction solvent and its volume, ionic strength, and centrifugation time were investigated. The simultaneous determination of these pharmaceuticals was performed by ultrahigh performance liquid chromatography-ultraviolet detection (HPLC-UV) method.
2. Experimental
2.1. Instrumentation
Thermo Separation chromatographic system with 2D Spectra System UV3000 (Panalytica, San Jose, CA, USA), a low-gradient pump P2000, a Rheodyne injector with 20-µL sample loop, and a vacuum membrane degasser SCM Thermo Separation were used (San Jose, California, CA, USA). The phase-separation process was accelerated by the centrifuge MPW-251 (MPW-Med.Instruments, Warsaw, Poland). A Hitachi U-1900 spectrophotometer (Panalytica, Tokyo, Japan) equipped with the deuterium discharge lamp and quartz cuvette was used for the measurements. Vibrating platform shaker (Heidolph, Vibramax 110, Schwabach, Germany) and magnetic stirrer hotplate (Heidolph MR3001K, Schwabach, Germany) were also applied.
2.2. Reagents and Standards
Budesonide (BUD, ≥99%, CAS 51333-22-3) and sulfasalazine (SULF, ≥98%, CAS 599-79-1) were bought from Sigma-Aldrich (Steinheim, Germany). Stock solutions of BUD or SULF containing 10−3 mol·L−1 of an analyte were prepared in methanol. Working solutions of these drugs were prepared freshly every day before analysis by diluting the standard solution with Milli-Q water and then it was stored in a dark bottle at room temperature.
Other chemicals at analytical grade used in experiments, like NaCl, KCl, CaCl2, MgCl2, KBr, Na2SO4, Fe(NO3)3, Na3PO4, and Na2CO3 (POCh, Gliwice, Poland), were prepared by dissolving an appropriate amount of salt in Milli-Q water. A working solution of HCl was prepared by successive dilutions of appropriate volumes of concentrated acid in Milli-Q water. Organic substances (studied interferences): diclofenac, ibuprofen, caffeine, acetylsalicylic acid, ascorbic acid, Levomepromazine, naproxen, and ranitidine were bought from Sigma Aldrich. Solvents such as acetonitrile and methanol at HPLC grade were purchased from J.T. Baker (USA).
2.3. Samples Preparation
The samples came from the Biała river, and the sewage was cleaned from the Municipal Sewage Treatment Plant in Białystok (Podlaskie Voivodeship, Poland). All samples were collected at the depth of 50 cm and were transferred to dark glass bottles. The total volume of each water and wastewater sample was 2 L. In the laboratory, samples were filtered through 0.22 µm pore size membrane filters to remove solid particles and analyzed within 24 h. The sample preparation was performed during the day in order to avoid the degradation of the analyte.
2.4. General DLLME-SFO Procedure
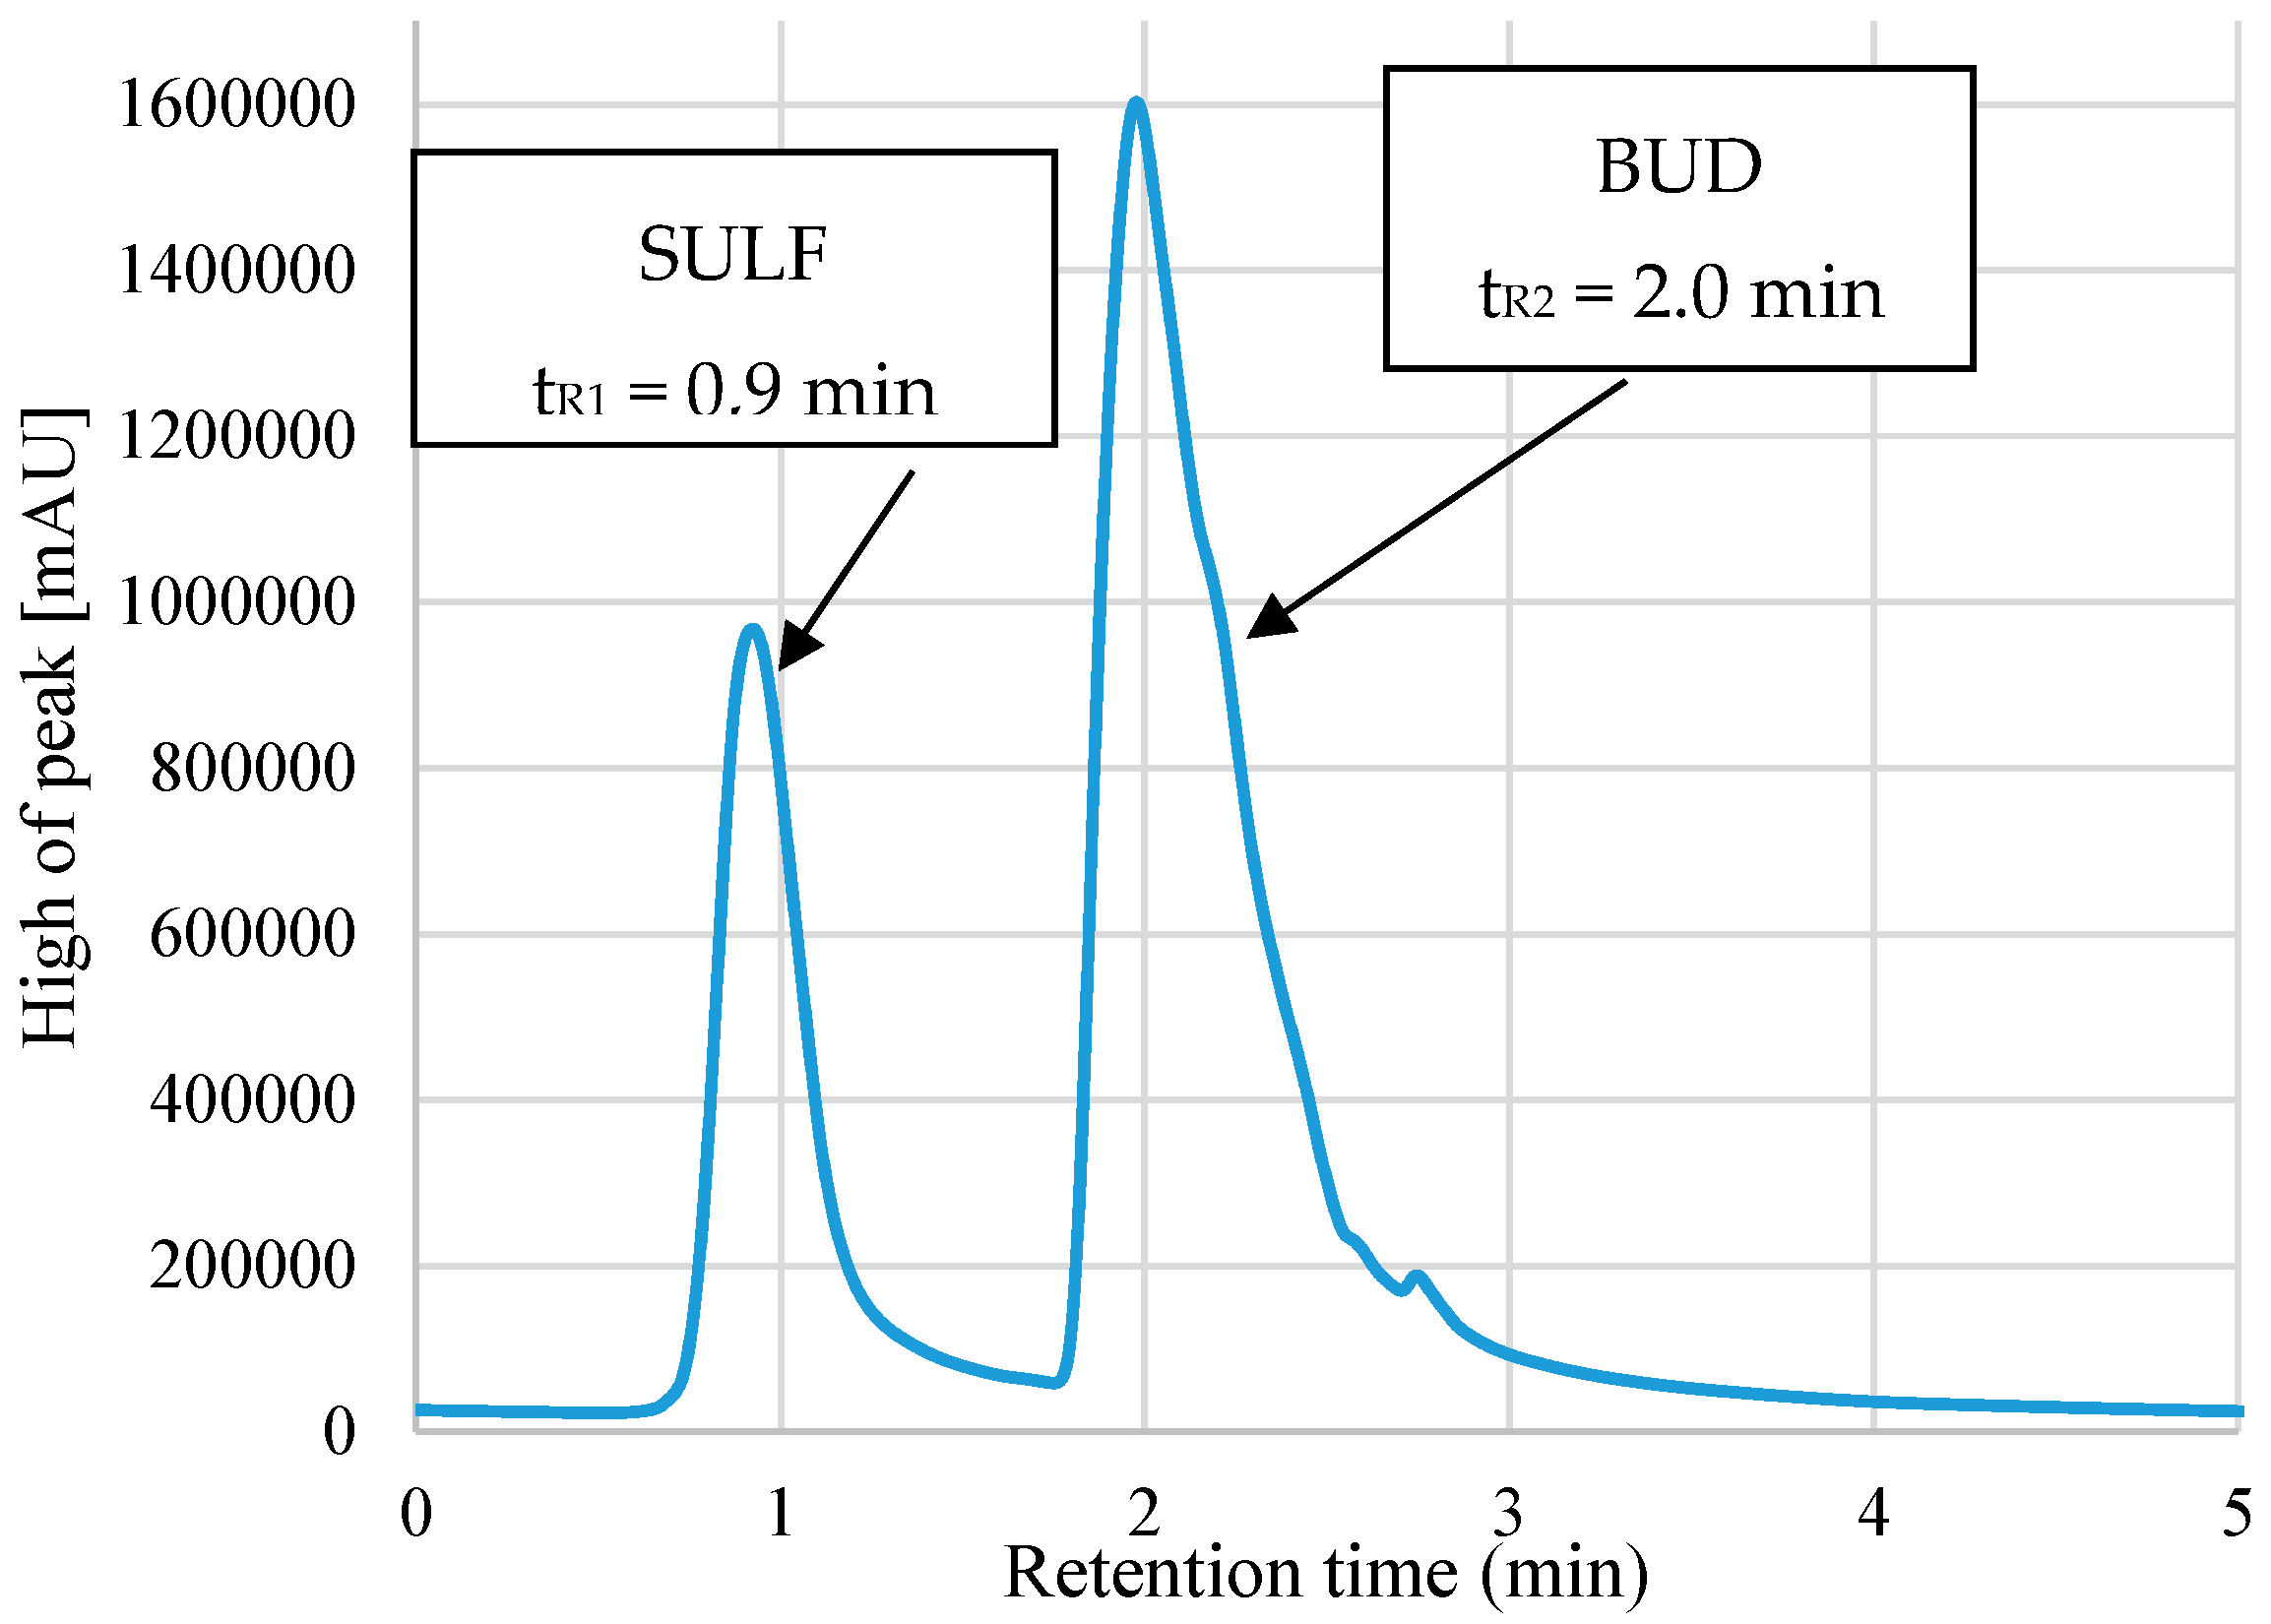
A mixture of methanolic solutions of BUD and SULF was introduced into 15 mL graduated tubes (the same concentration of both analytes). Subsequently, 50 μL of 3 mol L−1 HCl solution and 300 μL NaCl solution with a molar concentration of 1 mol L−1 were added. The tubes were supplemented with redistilled water to a volume of 10 mL. Mixtures of 1000 μL of ethanol (dispersant) and 100 μL of 1-undecanol (extractant) were prepared. In order to obtain a turbid solution, it was injected vigorously with a Pasteur pipette into the aqueous sample solution. The tubes were placed in a shaker (1500 rpm) for 10 min and then placed in a centrifuge to separate the organic phase from the aqueous and centrifuged for 15 min at 5000 rpm. The tubes were put into an ice bath for 10 minutes, the temperature of which was 3 °C. The solidified drop was collected and placed in another test tube for melting. The final volume of the extract was 70 ± 5 μL. The analysis was carried out using a high-performance liquid chromatograph with UV detection. Schematic diagram of DLLME-SFO extraction before HPLC-UV analysis was performed, as shown in Figure 1. The retention times for sulfasalazine and budesonide extracts are tR1 = 0.9 min (λ = 366 nm) and tR2 = 2.0 min (λ = 241 nm).
3. Results and Discussion
3.1. Primary Studies and HPLC Analysis
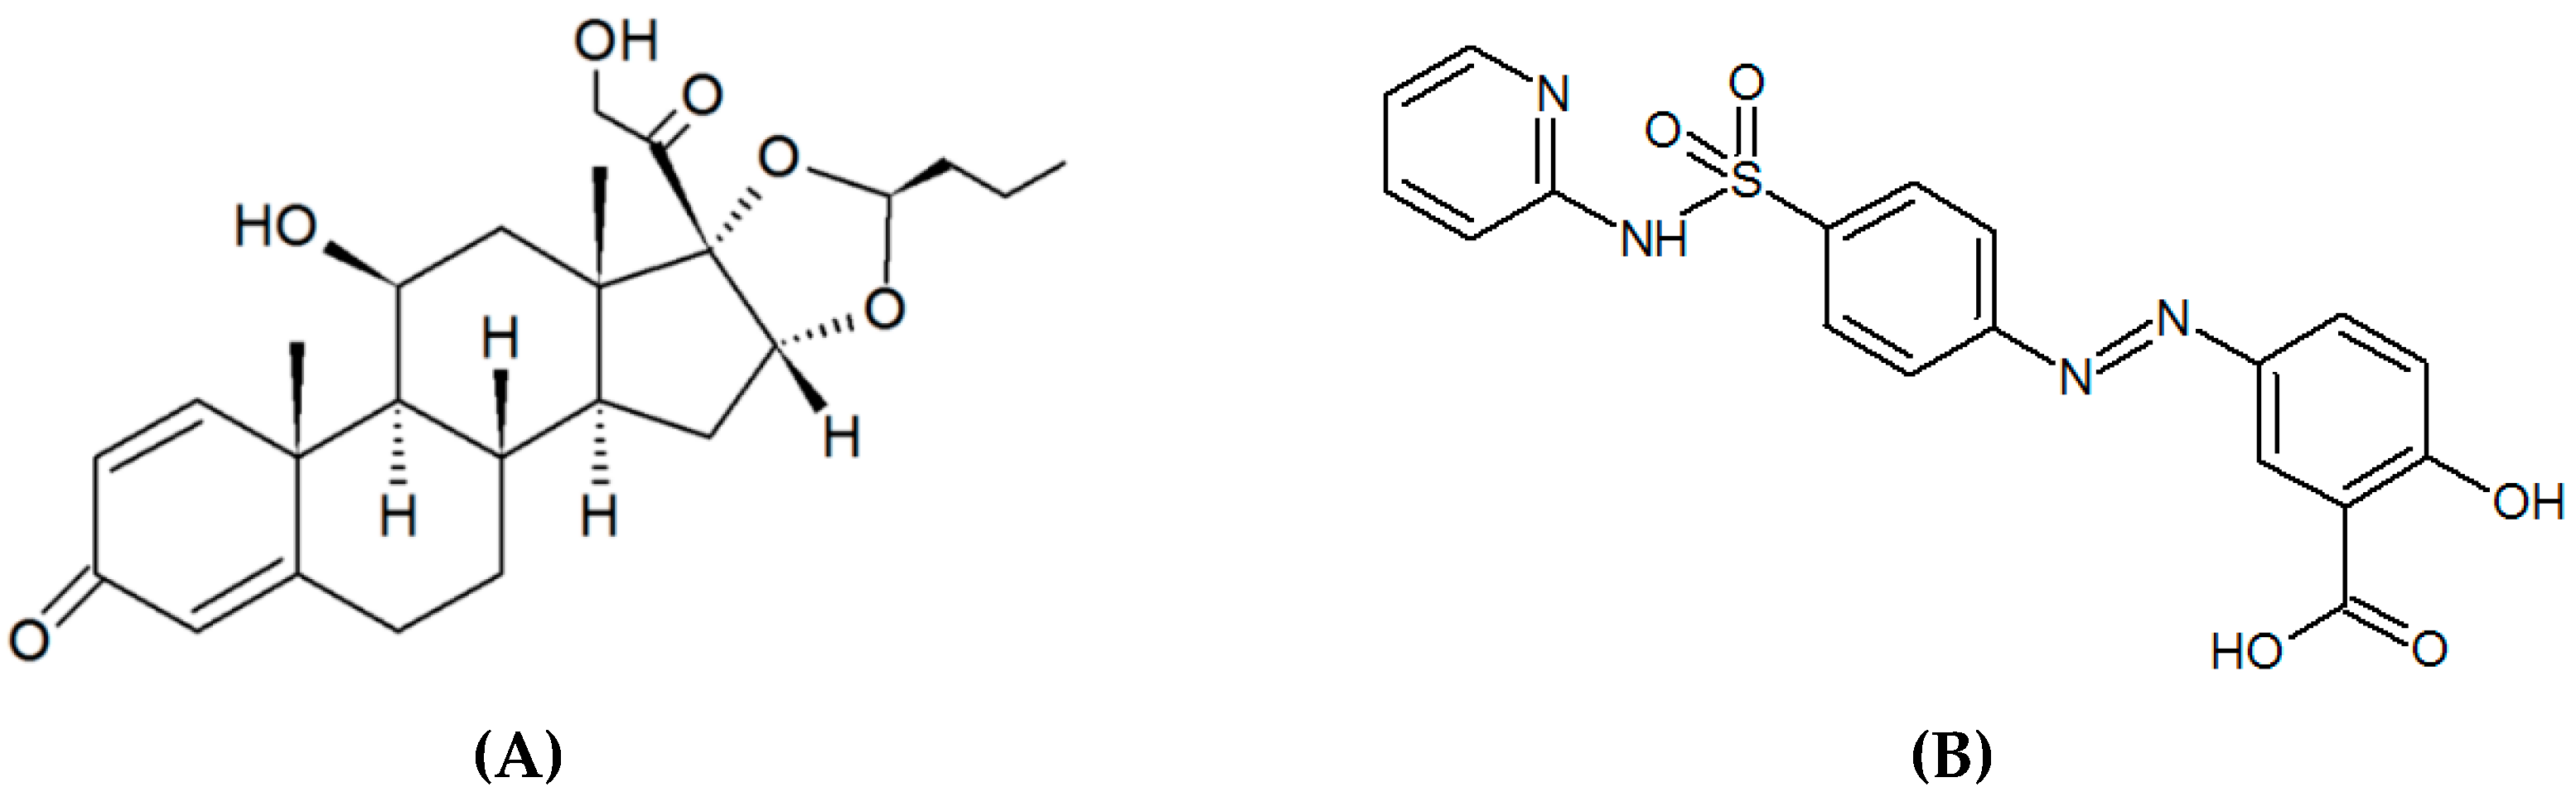
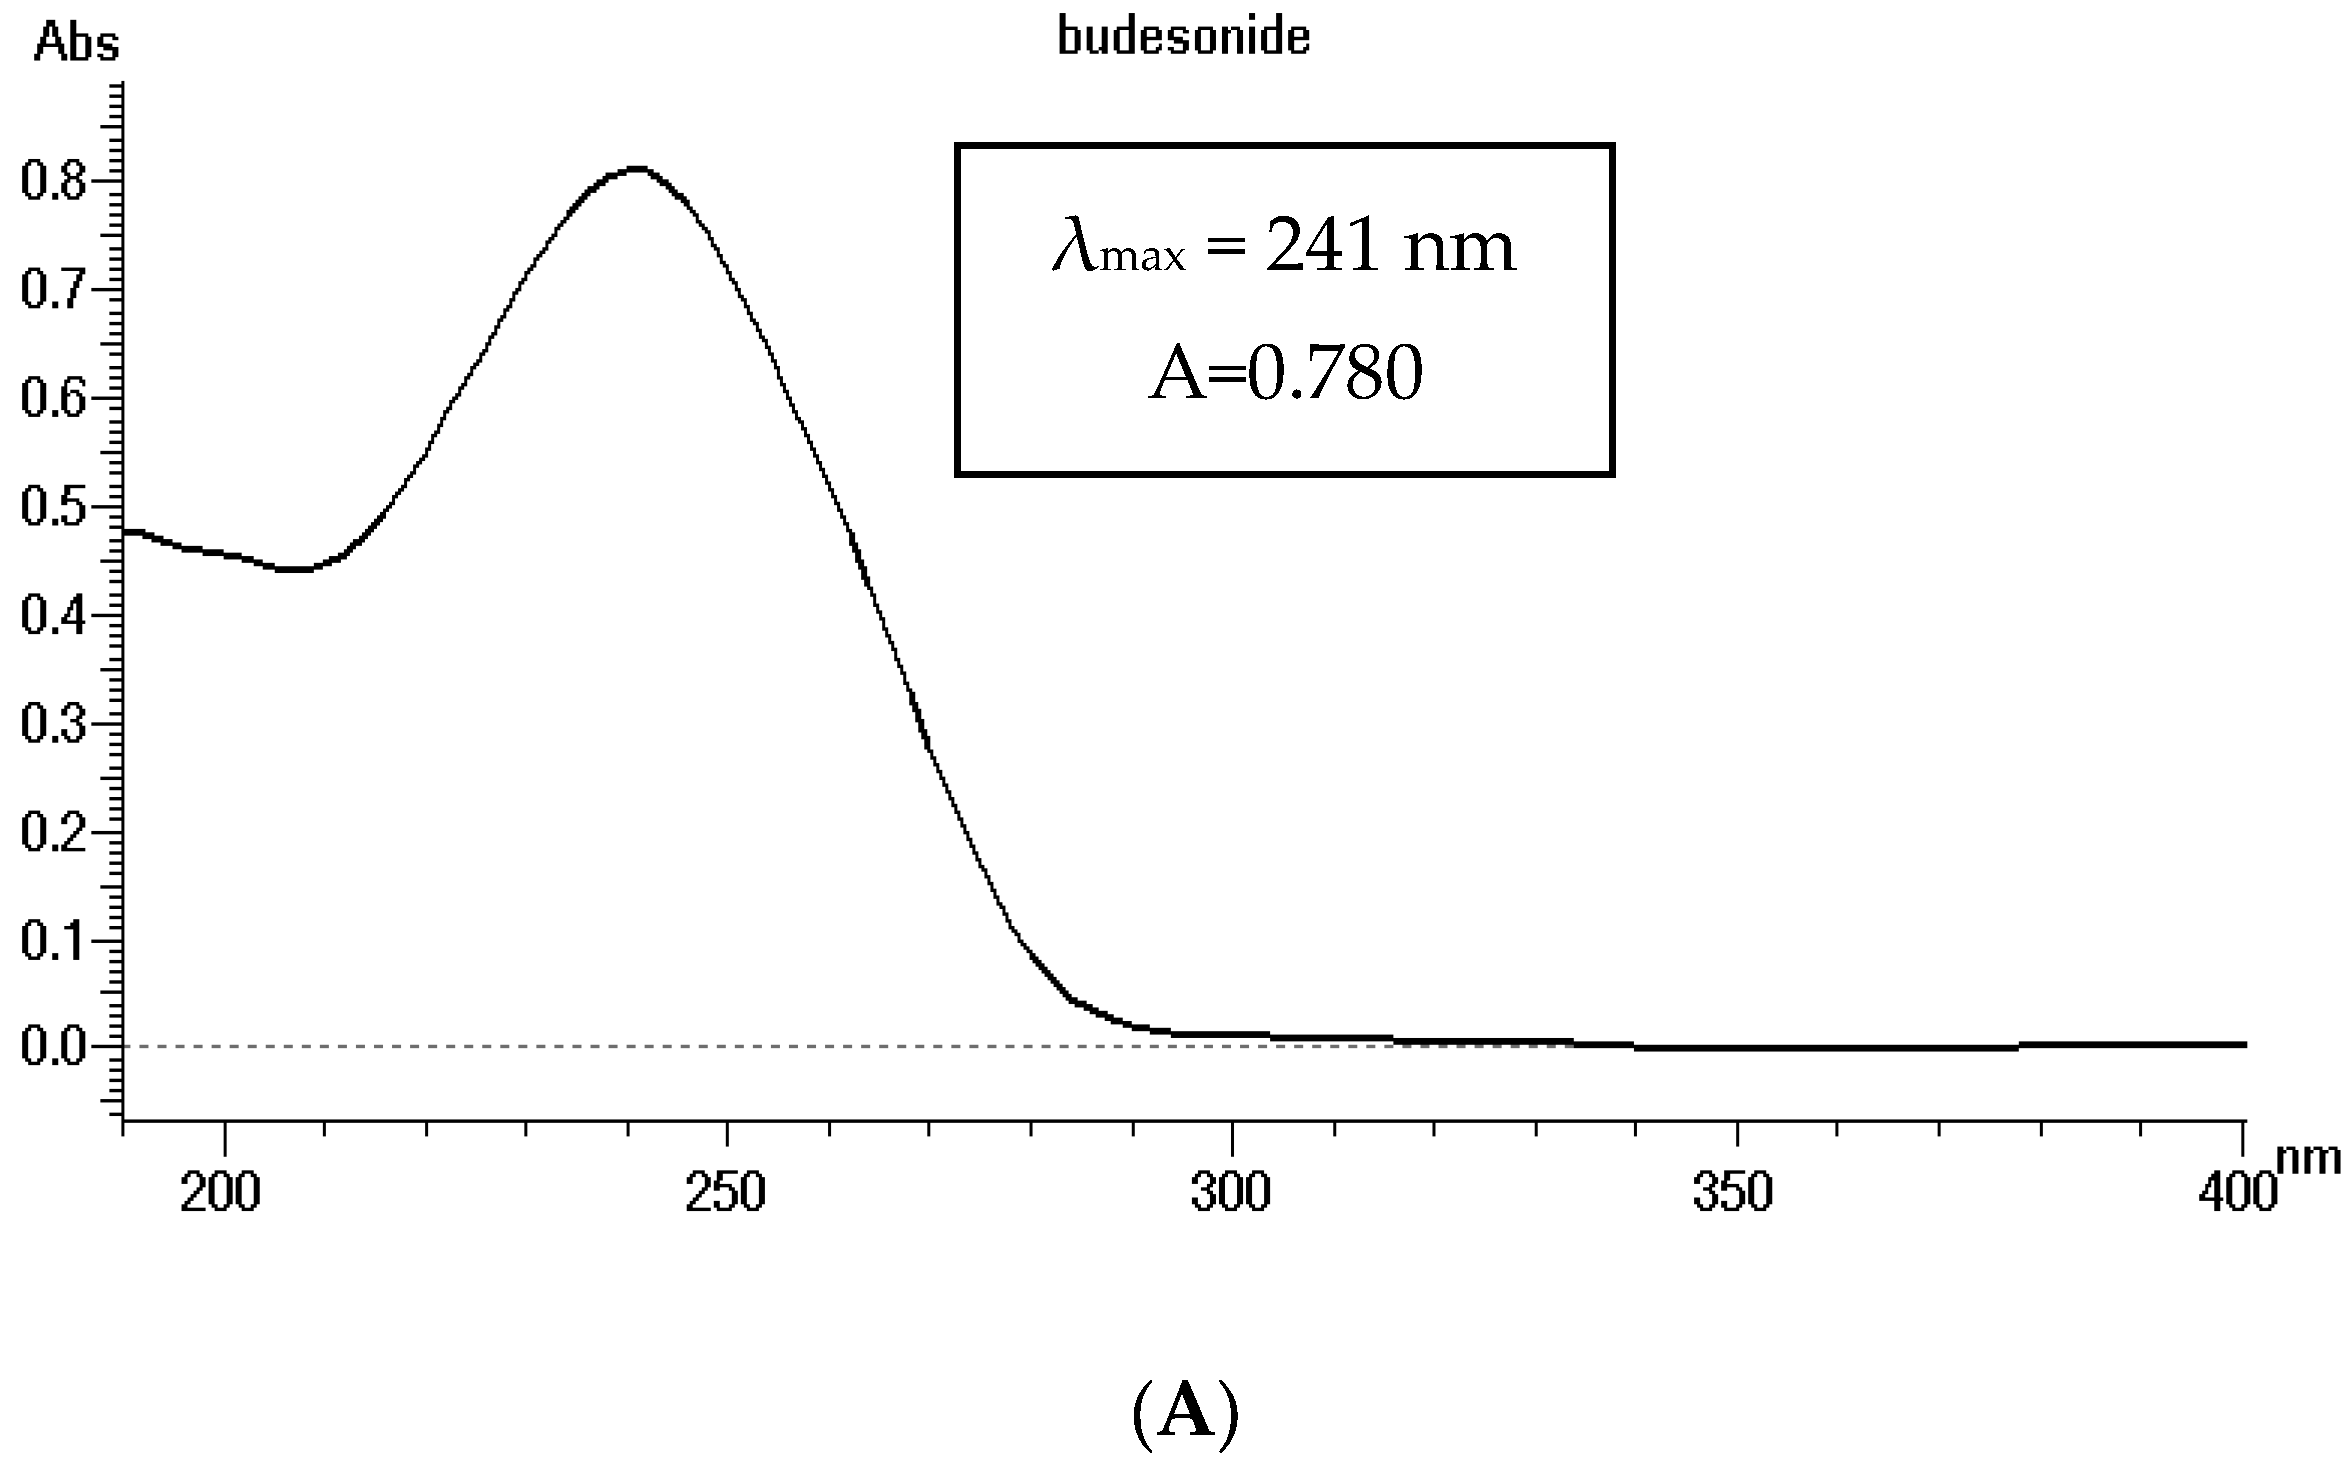
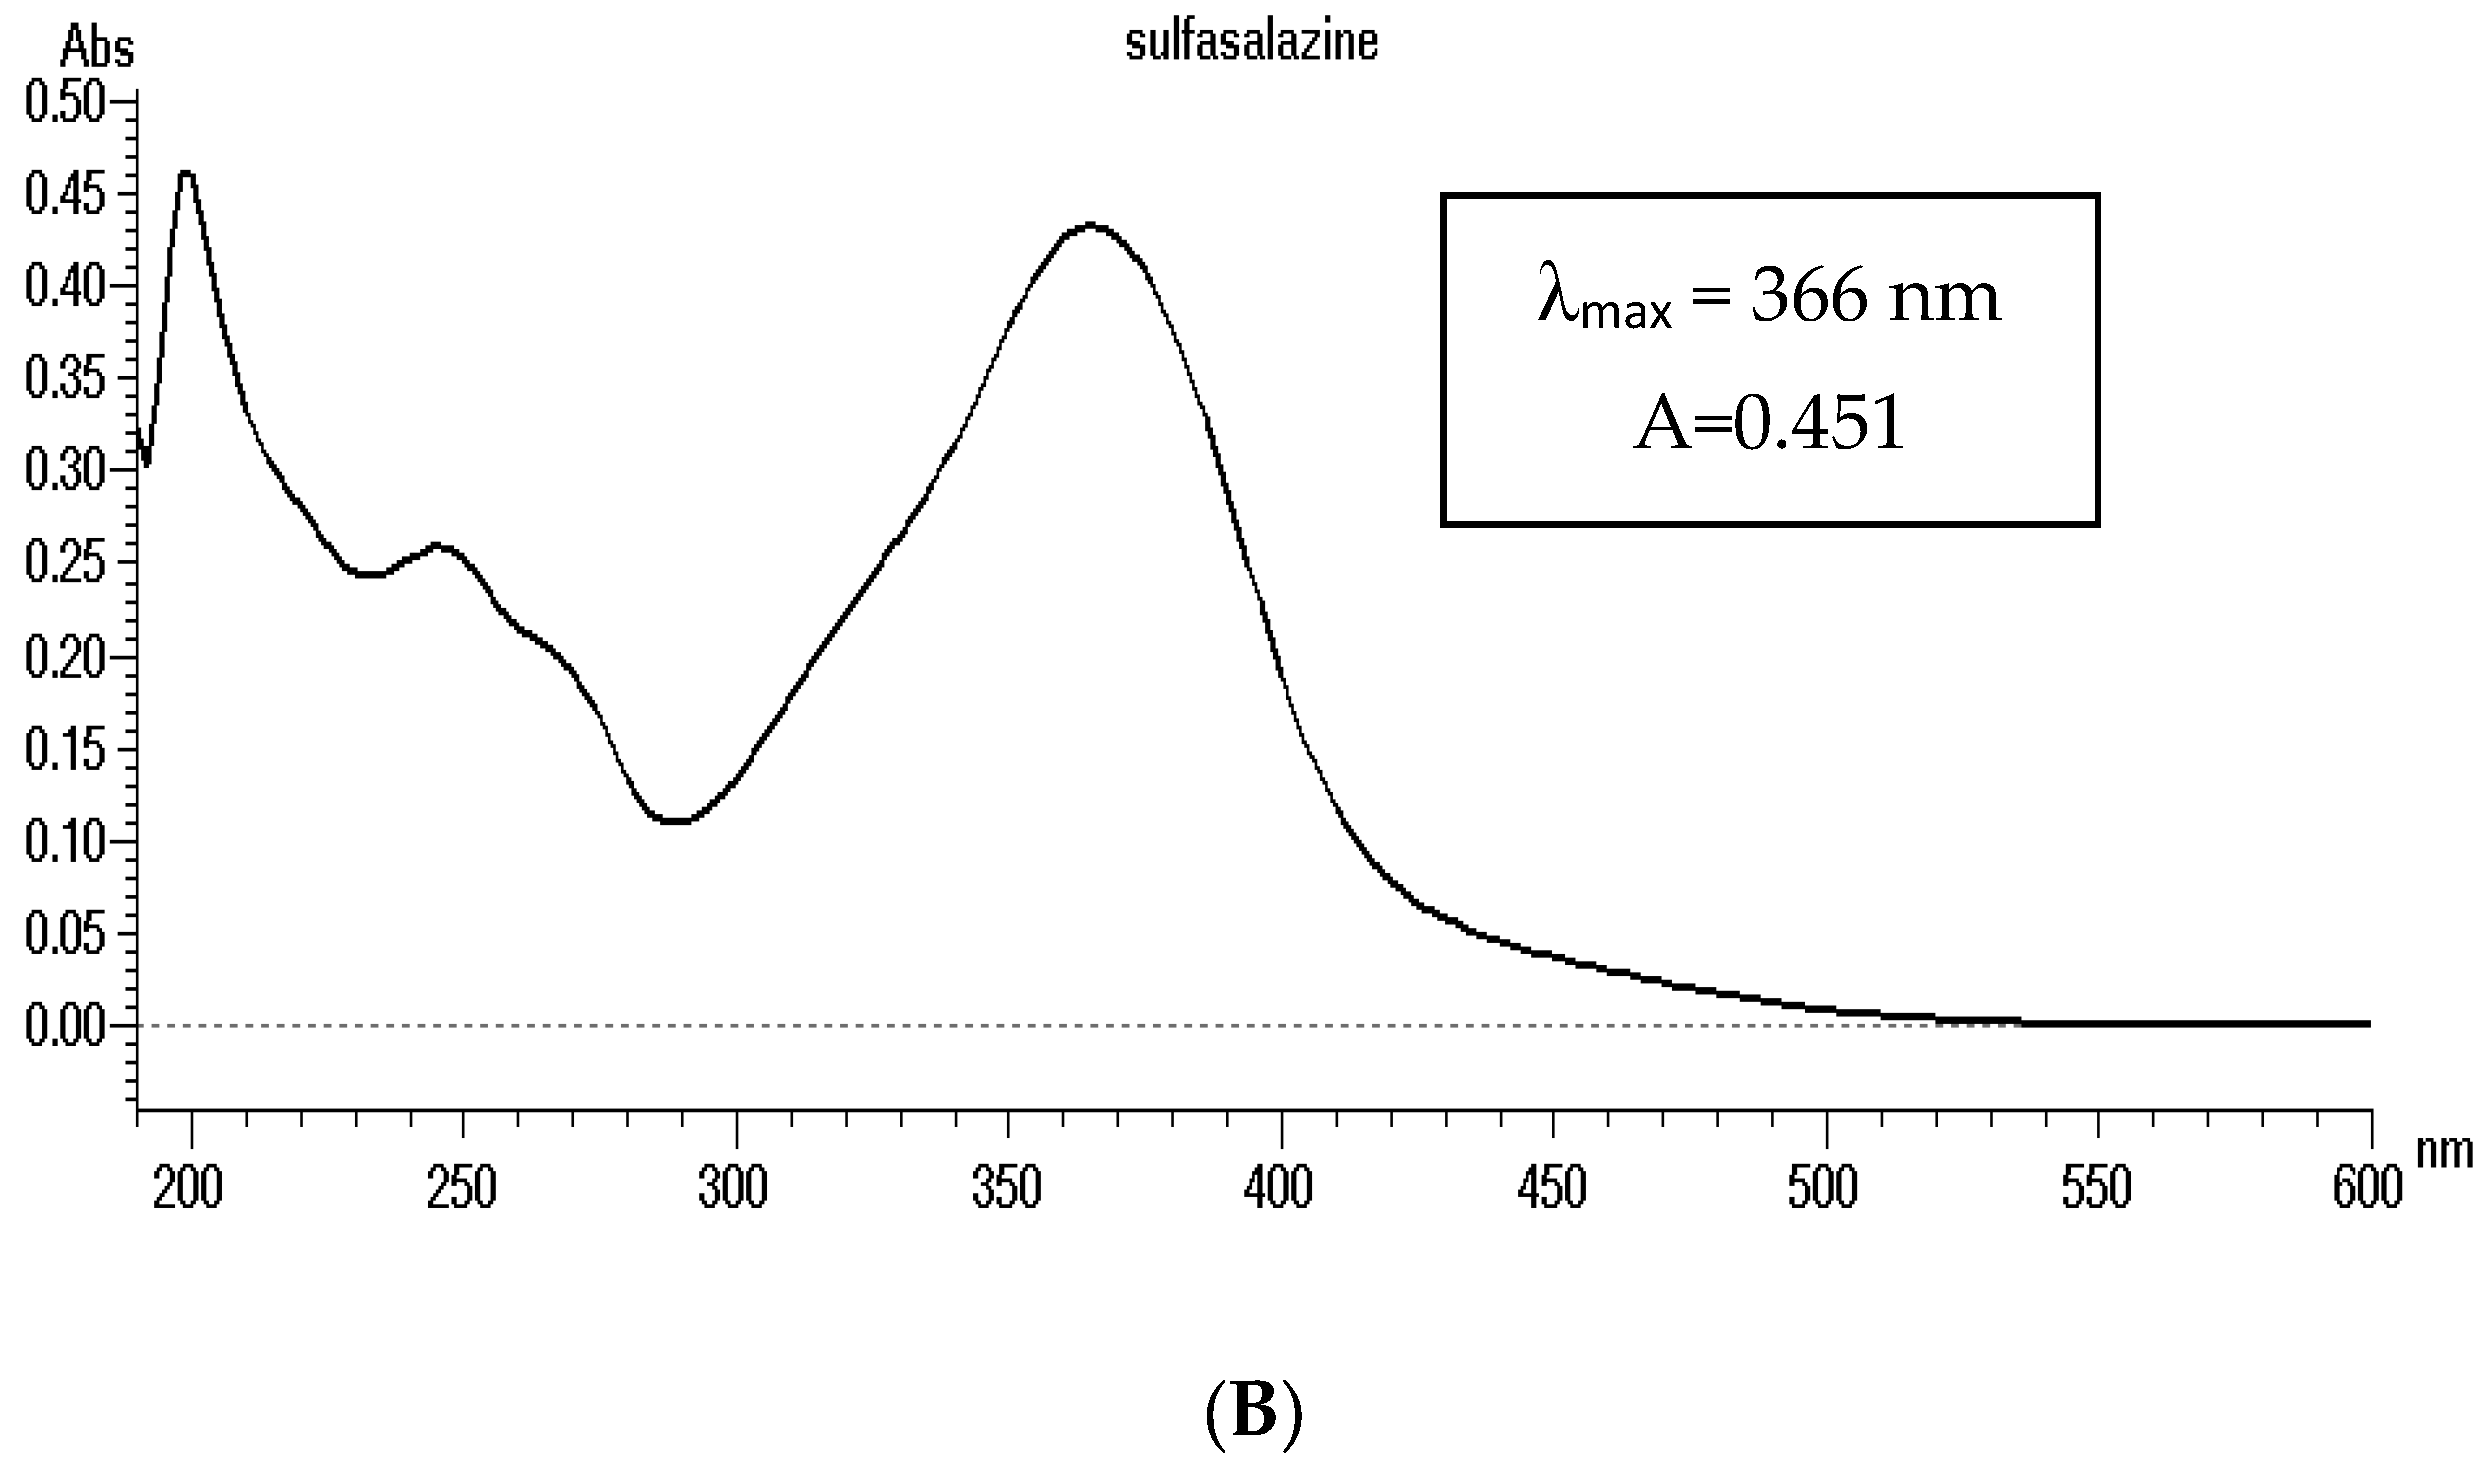
BUD (MW = 430.53 g mol−1, log Kow = 2.4–2.7) and SULF (MW = 398.39 g mol−1, log Kow = 3.7–4.8) are soluble substances in methanol (Figure 2). The absorption spectrum of the methanolic solution of these substances at a concentration of 5 × 10⁻⁵ mol L−1 were recorded. BUD has an absorption maximum at 241 nm and SULF at 366 nm (Figure 3).
The chromatographic separation was performed on a Lichrospher 100 RP-18 column (125 mm × 4.6 mm, 5 µm). In order to obtain optimal conditions for HPLC-UV chromatography analysis, a suitable mobile phase was chosen to ensure proper peaks in the chromatogram. The literature review shows that the following phases were used for the determination of BUD: acetonitrile–phosphate buffer (pH 3.2) (55:45, v/v) [5], methanol–water (80:20, v/v) [6], and for SULF: methanol–acetate buffer (48:52, v/v) [11], acetonitrile–acetate buffer (gradient elution) [12]. It was decided to check such phases as: methanol–water (70:30, v/v) and acetonitrile–water (50:50). The most symmetrical and highest peaks were obtained when the methanol–water phase was used. The selected mobile phase was also checked at various volumetric ratios of methanol and water. A flow rate of 1 mL min−1 was maintained. The injection volume was 50 µL. The typical chromatogram is presented in Figure 4.
3.2. Optimization of Extraction Parameters
The selection of appropriate DLLME-SFO extraction conditions is carried out in order to obtain the highest possible process efficiency. The following factors were optimized: solvent selection, electrolyte type and concentration, pH, and time and speed of shaking and centrifuging the sample.
3.2.1. Selection of Extraction Solvent and Its Volume
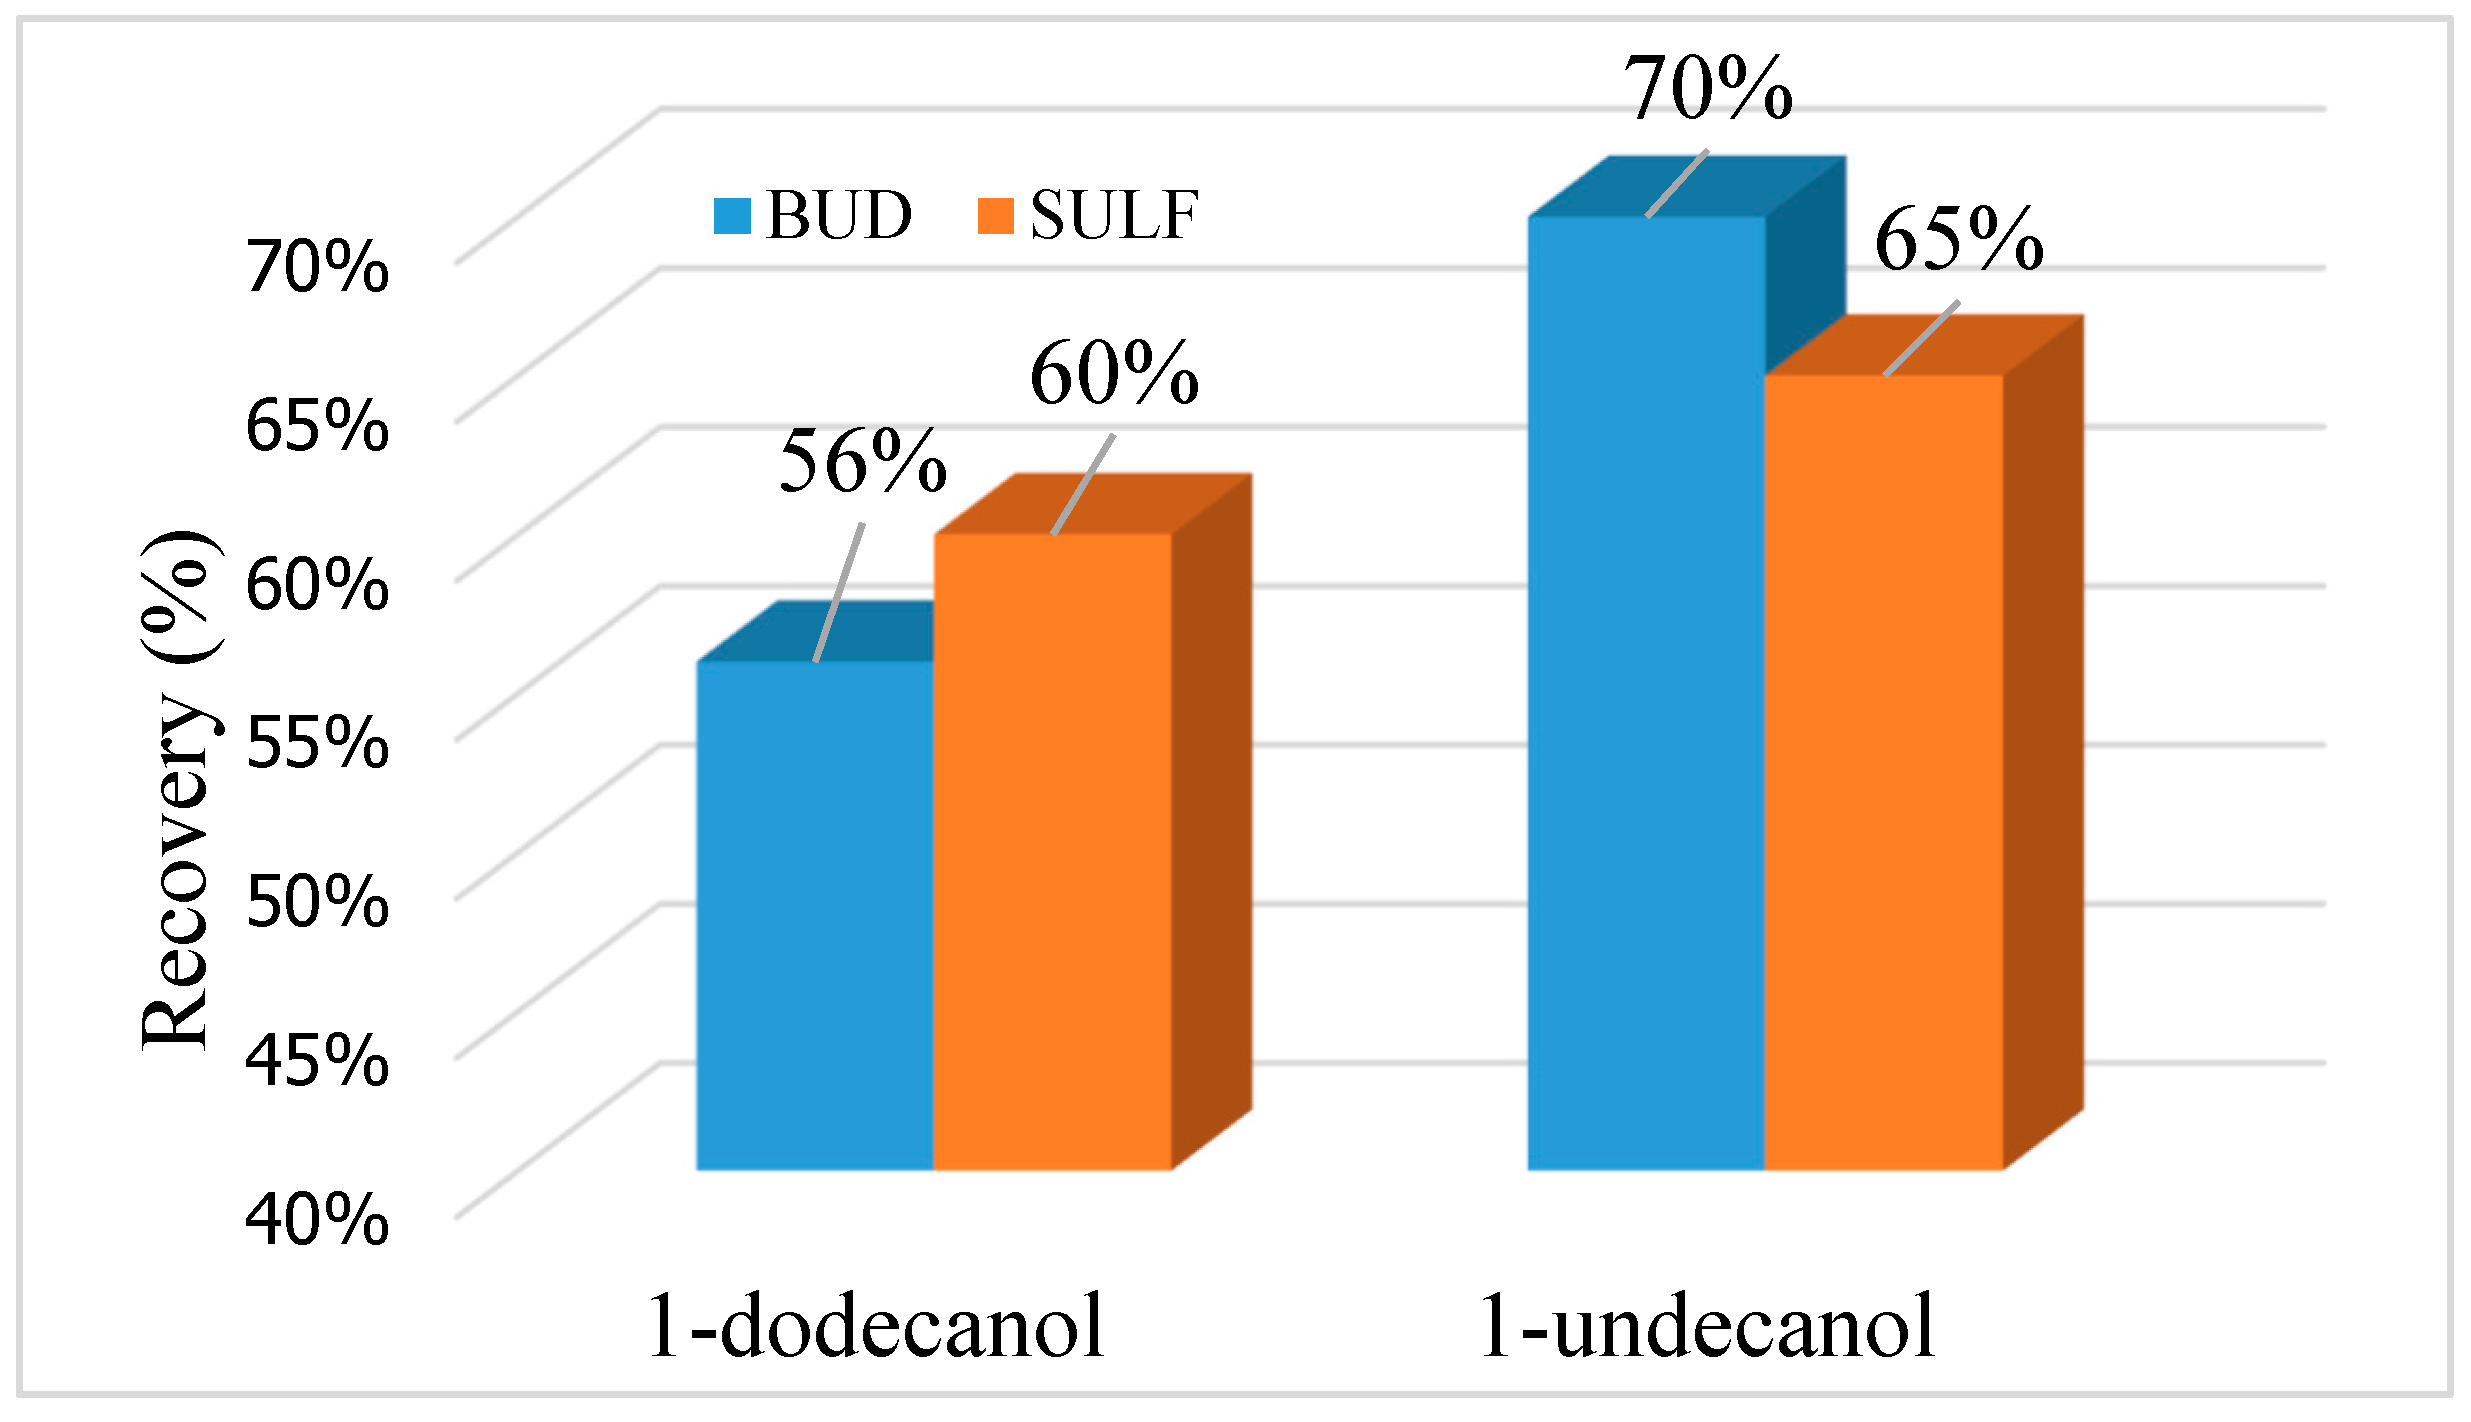
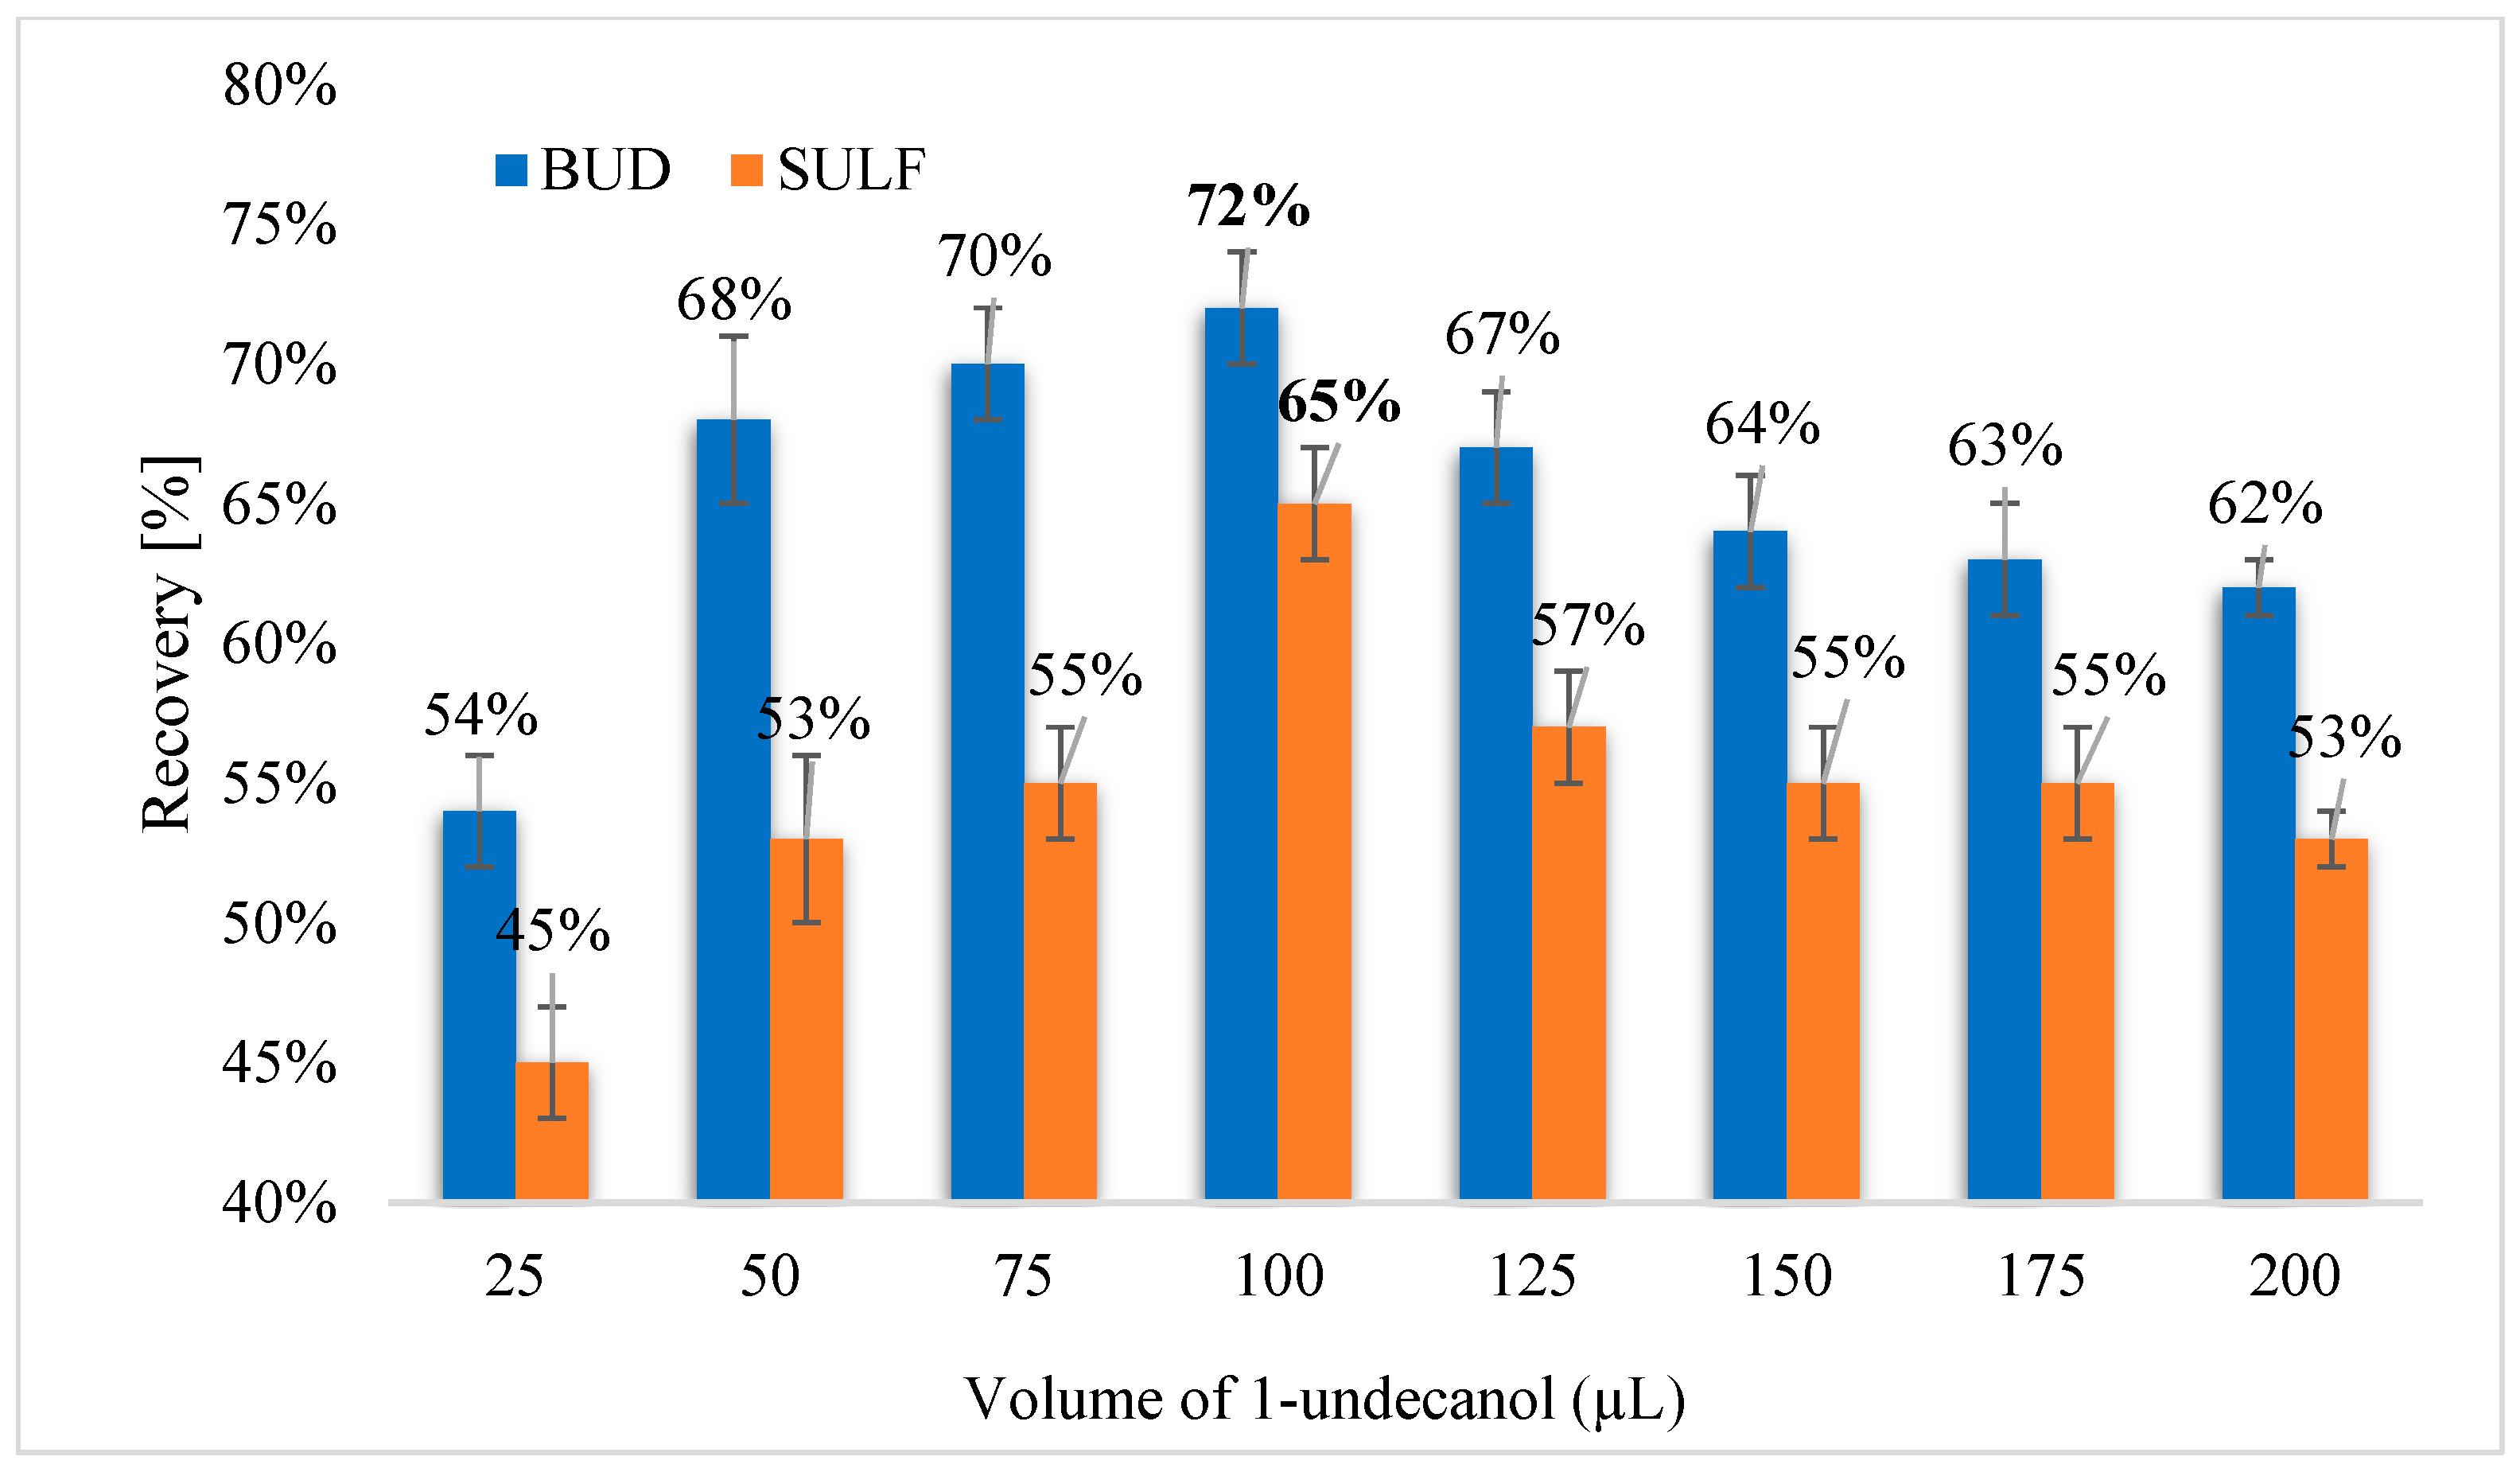
Optimizing solvents is critical for obtaining good extraction recoveries in DLLME-SFO method. The extraction solvent significantly influences the extraction efficiency. The selection of solvents for the isolation of BUD and SULF using the DLLME-SFO technique from aqueous solutions was checked. Solvents used for DLLME-SFO extraction have a density less than water and a freezing point close to room temperature (Table 1). The following solvents were used to isolate BUD and SULF: 1-dodecanol (C12H25OH) and 1-undecanol (C11H23OH). The density of these extractants is 0.83 g cm−3, and the pour point is 22–24 °C (1-dodecanol) and 13–15 °C (1-undecanol). It has been found that the extraction of selected analytes can be used for both 1-dodecanol and 1-undecanol, however, the highest extraction efficiency for BUD and SULF were obtained by using 1-undecanol (Figure 5). Recovery for BUD was 70%, whereas for SULF it was 65%. It was decided to check its volume in order to obtain high recoveries. The volume of 1-undecanol in the range of 25–200 μL was tested. A series of solutions were prepared and injected with 1 mL of the dispersant (methanol) and variable volumes of the extractant (Figure 6). The highest efficiency of DLLME-SFO extraction for both analytes was obtained using 100 μL of 1-undecanol. Increasing the volume of the extractant resulted in a decrease in recovery and a simultaneous increase in the volume of the extract.
3.2.2. Selection of Dispersant Solvent and its Volume
Choosing the right dispersant is an important element in optimizing the extraction conditions. The solvent must dissolve in both the organic and aqueous phase and cause the formation of a high extractant dispersion when the extraction and dispersing solvent is injected into the water sample. It should also allow the analyte to enter the organic phase. The volume of the dispersing solvent used is usually in the range of 0.5 to 2.5 mL or more. This affects the degree of dispersion in the sample, and therefore the extraction efficiency. Too large disperser volumes may reduce the extraction efficiency. This is due to the increased solubility of analytes in water as the dispersant volume increases.
The effect of such dispersants as acetonitrile, methanol and ethanol was checked. The highest efficiency of extraction was obtained using ethanol. The optimal dispersant volume was also checked. A series of solutions were prepared into which were injected mixtures of varying volumes of the dispersing solvent from 250 to 1500 μL and 100 μL 1-undecanol (extraction solvent). The tubes were then placed in a shaker and centrifuged at 5000 rpm for 10 minutes. The samples were sequentially placed in an ice bath to solidify the extractant. The optimal volume of ethanol was determined to be 1 mL (Figure 7). Too small volume of the dispersant makes it impossible to obtain a high dispersion of the extractant in the entire volume of the water sample. The reported decrease in the extraction efficiency as the volume of ethanol increased is due to the increase in the affinity of the analyte for the aqueous phase.
3.2.3. Effect of Ionic Strength
The addition of salt solution increases the efficiency of extraction because the ionic strength of the solution is increased and the salting out effect occurs, which promotes the separation of the two phases and reduces the loss of the extractant. The effect of the addition of 300 µL electrolyte solutions at a concentration of 1 mol L−1 of the following salts was tested: sodium chloride (NaCl), potassium chloride (KCl) and calcium chloride (CaCl2). The best extraction efficiency was observed using a sodium chloride solution (Table 2). After electrolyte selection, the concentration in the water sample was selected. A series of solutions were prepared to which variable volumes of NaCl solution with an initial concentration of 1 mol L−1 were added. It was found that the optimal concentration of NaCl for the extraction of both analytes is 3 × 10⁻² mol L−1. The effect of sodium chloride addition before and after injection of the dispersant and extractant mixture was also investigated. It has been found that the order of the electrolyte additive does not affect the efficiency of the extraction.
3.2.4. Influence of pH of Sample
The choice of pH on the efficiency of DLLME-SFO of BUD and SULF was checked. An aqueous sample containing BUD has a pH in the range of 5–6, and the water sample containing SULF has a pH of about 2–3. This parameter was changed in the range 2–12 by the addition of an appropriate volume of solutions of 3 mol L−1 of hydrochloric acid and 2 mol L−1 sodium hydroxide. The microextraction was performed by adding to the aqueous samples the optimized volume of the dispersant (1 mL of ethanol) and extractant (100 μL 1-undecanol) mixture. It was found that the addition of the NaOH solution significantly reduces the efficiency of extraction of both analytes, while the acidic environment causes an increase in the recovery value. The greatest value is observed with the addition of 50 μL 3 mol L−1 hydrochloric acid solution. The final pH of the sample was 2.4.
3.2.5. Effect of the Time and Speed of Shaking and Centrifugation
Another parameter optimized during DLLME-SFO was the time and speed of shaking the sample. This process results in thorough mixing of the sample components and determining the equilibrium in the solution. Samples were shaken successively for 5 and 10 min at four speeds ranging from 750 to 1500 rpm. The extraction efficiency without the sample shaking step was also checked. After optimizing, the samples were shaken in the further studies at 1500 rpm for 10 min.
The next stage of the DLLME-SFO procedure was the centrifugation of the solution in order to separate the organic phase from the aqueous one. The effect of spin time and speed was changed by changing individual centrifugation programs. They were centrifuged successively for 5, 10 and 15 min at three centrifugation speeds. It was found that the optimal spinning speed for both analytes is 5000 rpm for 15 minutes. Using this centrifugation program enables the highest efficiency of DLLME-SFO extraction. Too short a centrifugation time contributes to inaccurate phase separation. The use of too high spin speeds results in a lower extraction efficiency.
3.3. Selectivity
The selectivity of the DLLME-SFO procedure against other biologically active substances was studied. These substances were: diclofenac, ibuprofen, metronidazole, caffeine, acetylsalicylic acid, ascorbic acid, levomepromazine, naproxen, and ranitidine. These compounds belong to different therapeutic classes, e.g., anti-inflammatory, analgesic or neuroleptic drugs. There is a probability of occurrence of these compounds in water and wastewater samples, which is why they have been selected as potential interferents for the determination of BUD and SULF. Moreover, the influence of foreign ions present in water and wastewater samples such as Mg2+, Ca2+, Fe3+, SO42−, PO43−, and CO32− was investigated (Table 3). The tolerance limits were defined as the level of foreign substances causing an error of ±5% in determination of analytes. It was observed that DLLME-SFO procedure is tolerant to inorganic ions (acceptable excesses are usually in the range of 20–50) with the exception of iron ions. In the case of pharmaceuticals, the developed procedure is resistant to the presence of biological active compounds such as metronidazole or ranitidine. The literature review shows that selected chemical compounds have low octanol–water partition coefficients (log Kow), for caffeine it is −0.07, for acetylsalicylic acid 1.25 and for metronidazole −0.02. In the DLLME-SFO extraction, low polarity solvents like 1-undecanol cannot extract polar compounds.
In summary, the developed method allows to determine BUD and SULF in the presence of other compounds, so it is highly selective for selected chemical compounds.
3.4. Analytical Performance
The standard curves for the determination of BUD and SULF before and after the extraction were recorded (five replicates). Chromatograms of extracts were recorded in which the concentration of analytes ranged from 0.022–8.611 µg mL−1 and 0.020–7.968 µg mL−1 for BUD and SULF, respectively. The calibration graphs for both analytes were linear over these concentrations. Correlation coefficients of curves equal to 0.999 ± 0.004 were obtained. Limit of detection (LOD) and quantification (LOQ) were calculated using standard deviation values (s) from 10 independent samples and the slope value from the calibration graphs (a). The formulas: LOD = 3.3 s/a and LOQ = 10 s/a were used. Under the optimum experimental conditions, the limit of detection (LOD) equal to 0.011 µg mL−1 for BUD and 0.012 µg mL−1 for SULF was achieved.
The enrichment factor (EF) was obtained from the ratio of the calibration curve slopes with and without the preconcentration step. EFs were found to be 145.7 for BUD and 119.5 for SULF. The final amount of 1-undecanol after the DLLME-SFO process is 70 ± 5µL. Microextraction techniques allow the use of small volumes of extractants. As a result, high enrichment factors are obtained, which allows to reduce LOD and LOQ. The extraction recovery (R%) can be calculated as follows: R (%) = Vsed/Vaq × EF × 100 where Vsed and Vaq are the volumes of the sedimented phase (0.07 mL) and sample solution (10 mL), respectively [31]. High recovery rates were also obtained: 102% ± 7% and 84% ± 5% for BUD and SULF, respectively.
The statistical evaluation of the recorded standard curves of BUD and SULF determination after DLLME-SFO extraction was performed. The coefficient of variation of the method for both analytes does not exceed 5%, which proves the accuracy of the analytical procedure developed. The precision of DLLME-SFO-HPLC-UV was evaluated over 10 independent replicates at a concentration of 1 × 10⁻⁵ mol L−1 during 1 day (intraday) and within 3 days (interday). The relative standard deviation (RSD) of the measurements was less than 4%. The analytical characteristic data for the proposed method are summarized in Table 4.
In comparison with other techniques (Table 5), the developed method (DLLME-SFO-HPLC-UV) is characterized by high EFs values (in other methods, this parameter is skipped) and relatively low values of LOQ. Typically, the SPE technique is used to separate BUD and SULF from matrices using Oasis MCX or HLB sorbents. These sorbents can be repeatedly used, but the necessary step is the conditioning of the sorbent using relatively large amounts of solvents. The other microextraction techniques used to isolate these drugs are unknown. So, it is the first time that the microextraction technique (DLLME-SFO) which requires the low consumption of organic solvent is used for simultaneous isolation of BUD and SULF from environmental matrices. In addition, the LC-MS/MS method is a commonly used method that allows to achieve lower LOD and LOQ values, but requires the use of solvents of higher purity and consequently is more expensive in comparison with HPLC-UV.
3.5. Application to Natural Samples
The method was successfully applied for the determination of SULF and BUD in natural samples. Two types of water (river water and wastewater samples) were analyzed by HPLC-UV after the DLLME-SFO procedure. The samples came from the Biała river, and the wastewater samples from the Municipal Sewage Treatment Plant (Poland).
The samples were then spiked with analytes standard solutions at different levels to assess matrix effects and the corresponding relative recoveries. Three samples of river water and wastewater were prepared, to which known amounts of budesonide and sulfasalazine were added (the concentration of added analytes was 5 × 10⁻⁶ mol L−1). Subsequently, the DLLME-SFO extraction procedure and HPLC-UV measurement were carried out. The results are summarized in Table 6.
Based on the results, it can be concluded that the developed chromatographic procedure for the determination of BUD and SULF combined with dispersive liquid–liquid microextraction based on solidification of floating organic droplet is an appropriate method. BUD and SULF are not found in river water and wastewater samples in the range of concentrations tested.
4. Conclusion
A simple and practical preconcentration technique, dispersive liquid–liquid microextraction based on the solidification of a floating organic drop (DLLME-SFO) combined with HPLC-UV has been evaluated for simultaneous extraction and determination of BUD and SULF. This is the first time that the DLLME-SFO technique was introduced for isolating these analytes from water and wastewater samples. The effective experimental parameters on the extraction efficiency such as extraction and dispersive solvents, ionic strength, and pH were studied. Under the optimum experimental conditions, the enrichment factors of 145.7 and 119.5 for BUD and SULF were obtained, respectively.
The calibration curves were linear for BUD and SULF in the range of 0.022–8.611 µg mL−1 and 0.020 –7.968 µg mL−1 with the limit of detection (LOD) 0.011 µg mL−1 and 0.012 µg mL−1, respectively. To the best of our knowledge, no method of determination of BUD and SULF described so far is characterized by such high EF values. This is the main advantage of the described method. Moreover, high sensitivity, good isolation of analytes in less than 40 min method time and very low solvent consumption (volume of extrahent equals 100 µL) were achieved. Additionally, a significant reduction in the usage of the mobile phase was achieved (the total time of HPLC-UV analysis was 5 min), which further allowed the cost of analysis to be reduced. In conclusion, the HPLC-UV method was convenient, precise and reproducible.
The developed method gives the possibility of detection of the analytes at low levels of concentrations. The proposed method was successfully applied to the determination of BUD and SULF in water and wastewater samples. As a result of the research, BUD and SULF were not found in the analyzed samples.
Author Contributions
Conceptualization, B.S. and M.H.; methodology, B.S. and M.H.; software, M.H.; validation, M.H. and A.G.; formal analysis, A.G. and M.H.; investigation, A.G. and M.H.; resources, B.S.; data curation, M.H.; writing—original draft preparation, M.H.; writing—review and editing, B.S.; visualization, M.H. and A.G.; supervision, M.H.; project administration, B.S.; funding acquisition, B.S.
Conflicts of Interest
The authors declare no conflict of interest
References
- Semreen, M.H.; Shanableh, A.; Semerjian, L.; Alniss, H.; Mousa, M.; Bai, X.; Acharya, K. Simultaneous Determination of Pharmaceuticals by Solid-phase Extraction and Liquid Chromatography-Tandem Mass Spectrometry: A Case Study from Sharjah Sewage Treatment Plant. Molecules 2019, 24, 633. [Google Scholar] [CrossRef] [PubMed]
- Wang, Y.; Tang, Y.; Moellmann, H.; Hochhaus, G. Simultaneous quantification of budesonide and its two metabolites, 6beta-hydroxybudesonide and 16alpha-hydroxyprednisolone, in human plasma by liquid chromatography negative electrospray ionization tandem mass spectrometry. Biomed. Chromatogr. 2003, 17, 158–164. [Google Scholar] [CrossRef] [PubMed]
- Gazzotti, T.; Barbarossa, A.; Zironi, E.; Roncada, P.; Pietra, M.; Pagliuca, G. An LC-MS/MS method for the determination of budesonide and 16 alpha-hydroxyprednisolone in dog plasma. Methodsx 2016, 3, 139–143. [Google Scholar] [CrossRef] [PubMed]
- Graham, G.G.; Pile, K.D. Sulfasalazine and Related Drugs; Encyclopedia of Inflammatory Diseases; Springer: New York, NY, USA, 2014; pp. 1–5. [Google Scholar]
- Gupta, M.; Bhargava, H.N. Development and validation of a high-performance liquid chromatographic method for the analysis of budesonide. J. Pharm. Biomed. Anal. 2006, 40, 423–428. [Google Scholar] [CrossRef] [PubMed]
- Naikwade, S.R.; Bajaj, A.N. Development of a validated specific HPLC method for budesonide and characterization of its alkali degradation product. Can. J. Anal. Sci. Spectrosc. 2008, 53, 113–122. [Google Scholar]
- Deventer, K.; Mikulcikova, P.; Van Hoecke, H.; Van Eenoo, P.; Del-beke, F.T. Detection of budesonide in human urine after inhalation by liquid chromatography–mass spectrometry. J. Pharm. Biomed. Anal. 2006, 42, 474–479. [Google Scholar] [CrossRef]
- Nilsson, K.; Andersson, M.; Beck, O. Phospholipid removal combined with a semi-automated 96-well SPE application for determination of budesonide in human plasma with LC-MS/MS. J. Chrom. B-Anal. Technol. Biomed. Life Sci. 2014, 970, 31–35. [Google Scholar] [CrossRef]
- Szeitz, A.; Manji, J.; Riggs, K.W.; Thamboo, A.; Javer, A.R. Validated assay for the simultaneous determination of cortisol and budesonide in human plasma using ultra high performance liquid chromatography-tandem mass spectrometry. J. Pharm. Biomed. Anal. 2014, 90, 198–206. [Google Scholar] [CrossRef]
- Joseph, S.; Menon, S.; Khera, S. Simultaneous determination of methotrexate and sulfasalazine in plasma by HPLC-DAD. LC GC N. Am. 2015, 33, 122–138. [Google Scholar]
- Saini, B.; Bansal, G. Degradation study on sulfasalazine and a validated HPLC-UV method for its stability testing. Sci. Pharm. 2014, 82, 295–306. [Google Scholar] [CrossRef]
- Patil, A.; Raheja, V.; Damre, A. Simultaneous analysis of intestinal permeability markers, caffeine, paracetamol and sulfasalazine by reverse phase liquid chromatography: A tool for standardization of rat everted gut sac model. Asian J. Pharm. Clin. Res. 2010, 3, 204–207. [Google Scholar]
- Kwiecien, A.; Piatek, K.; Zmudzki, P.; Krzek, J. TLC-densitometric determination of sulfasalazine and its possible impurities in pharmaceutical preparations. Acta Chrom. 2015, 27, 623–635. [Google Scholar] [CrossRef]
- Su, F.; Sun, Z.Q.; Liang, X.R. Development and validation of a quantitative NMR method for the determination of the commercial tablet formulation of sulfasalazine. Curr. Pharm. Anal. 2019, 15, 39–44. [Google Scholar] [CrossRef]
- Ramezani, Z.; Dibaee, N. Determination of sulfasalazine in sulfasalazine tablets using silver nanoparticles. Iran. J. Pharm. Sci. 2012, 8, 129–134. [Google Scholar]
- Gu, G.Z.; Xia, H.M.; Pang, Z.Q.; Liu, Z.Y.; Jiang, X.G.; Chen, J. Determination of sulphasalazine and its main metabolite sulphapyridine and 5-aminosalicylic acid in human plasma by liquid chromatography/tandem mass spectrometry and its application to a pharmacokinetic study. J. Chrom. B 2011, 879, 449–456. [Google Scholar] [CrossRef] [PubMed]
- Grabic, R.; Fick, J.; Lindberg, R.H.; Fedorova, G.; Tysklind, M. Multi-residue method for trace level determination of pharmaceuticals in environmental samples using liquid chromatography coupled to triple quadrupole mass spectrometry. Talanta 2012, 100, 183–195. [Google Scholar] [CrossRef]
- Gineys, N.; Giroud, B.; Vulliet, E. Analytical method for the determination of trace levels of steroid hormones and corticosteroids in soil, based on PLE/SPE/LC-MS/MS. Anal. Bioanal. Chem. 2010, 397, 2295–2302. [Google Scholar] [CrossRef]
- Fiori, J.; Andrisano, V. LC-MS method for the simultaneous determination of six glucocorticoids in pharmaceutical formulations and counterfeit cosmetic products. J. Pharm. Biomed. Anal. 2014, 91, 185–192. [Google Scholar] [CrossRef]
- Kasprzyk-Hordern, B.; Dinsdale, R.M.; Guwy, A.J. Multiresidue methods for the analysis of pharmaceuticals, personal care products and illicit drugs in surface water and wastewater by solid-phase extraction and ultra performance liquid chromatography-electrospray tandem mass spectrometry. Anal. Bioanal. Chem. 2008, 391, 1293–1308. [Google Scholar] [CrossRef]
- Kasprzyk-Hordern, B.; Dinsdale, R.M.; Guwy, A.J. The effect of signal suppression and mobile phase composition on the simultaneous analysis of multiple classes of acidic/neutral pharmaceuticals and personal care products in surface water by solid-phase extraction and ultra performance liquid chromatography-negative electrospray tandem mass spectrometry. Talanta 2008, 74, 1299–1312. [Google Scholar]
- Leong, M.I.; Huang, S.D. Dispersive liquid-liquid microextraction method based on solidification of floating organic drop combined with gas chromatography with electron-capture or mass spectrometry detection. J. Chrom. A 2008, 1211, 8–12. [Google Scholar] [CrossRef]
- Ahmadi-Jouibari, T.; Fattahi, N.; Shamsipur, M. Rapid extraction and determination of amphetamines in human urine samples using dispersive liquid-liquid microextraction and solidification of floating organic drop followed by high performance liquid chromatography. J. Pharm. Biomed. Anal. 2014, 94, 145–151. [Google Scholar] [CrossRef]
- Rahimi, A.; Hashemi, P. Development of a dispersive liquid-liquid microextraction method based on solidification of a floating organic drop for the determination of beta-carotene in human serum. J. Anal. Chem. 2014, 69, 352–356. [Google Scholar] [CrossRef]
- Jian, Y.H.; Hu, Y.; Wang, T.; Liu, J.L.; Zhang, C.H.; Li, Y. Dispersive liquid-liquid microextraction based on solidification of floating organic drop with high performance liquid chromatography for determination of deca brominated diphenyl ether in surficial sediments. Chin. J. Anal. Chem. 2010, 38, 62–66. [Google Scholar] [CrossRef]
- Hou, F.; Deng, X.; Jiang, X.; Yu, J. Determination of parabens in beverage samples by dispersive liquid-liquid microextraction based on solidification of floating organic droplet. J. Chrom. Sci. 2014, 52, 1332–1338. [Google Scholar] [CrossRef]
- Yamini, Y.; Rezaee, M.; Khanchi, A.; Faraji, M. Dispersive liquid-liquid microextraction based on the solidification of floating organic drop followed by inductively coupled plasma-optical emission spectrometry as a fast technique for the simultaneous determination of heavy metals. J. Chrom. A 2010, 1217, 2358–2364. [Google Scholar] [CrossRef]
- Shamsipur, M.; Fattahi, N.; Assadi, Y.; Sadeghi, M.; Sharafi, K. Speciation of As(III) and As(V) in water samples by graphite furnace atomic absorption spectrometry after solid phase extraction combined with dispersive liquid-liquid microextraction based on the solidification of floating organic drop. Talanta 2014, 130, 26–32. [Google Scholar] [CrossRef]
- Moghadam, M.R.; Shabani, A.M.H.; Dadfarnia, S. Spectrophotometric determination of iron species using a combination of artificial neural networks and dispersive liquid-liquid microextraction based on solidification of floating organic drop. J. Hazard. Mater. 2011, 197, 176–182. [Google Scholar] [CrossRef]
- Li, Y.; Peng, G.; He, Q.; Zhu, H.; Al-Hamadani, S.M.Z.F. Dispersive liquid-liquid microextraction based on the solidification of floating organic drop followed by ICP-MS for the simultaneous determination of heavy metals in wastewaters. Spectrochim. Acta Part A-Mol. Biomol. Spectrosc. 2015, 140, 156–161. [Google Scholar] [CrossRef]
- Al-Saidi, H.M.; Emara Adel, A.A. The recent developments in dispersive liquid–liquid microextraction for preconcentration and determination of inorganic analytes. J. Saudi Chem. Soc. 2014, 18, 745–761. [Google Scholar] [CrossRef]
- Wang, H.M.; Jiang, X.H.; Lin, S.; Yi, H. Studies on determination of sulfasalazine and sulfapyridine in human plasma by HPLC and pharmacokinetics in human volunteers. Chin. J. Antibiot. 2013, 38, 223–226. [Google Scholar]
Figure 1.
Schematic diagram of DLLME-SFO extraction before HPLC-UV analysis.

Figure 2.
Molecule structure of: (A) budesonide (C25H34O6, MW = 430.53 g mol−1) and (B) sulfasalazine (C18H14N4O5S, MW = 398.39 g mol−1).
Figure 2.
Molecule structure of: (A) budesonide (C25H34O6, MW = 430.53 g mol−1) and (B) sulfasalazine (C18H14N4O5S, MW = 398.39 g mol−1).

Figure 3.
The absorption spectrum of budesonide (A) and sulfasalazine (B) solution in methanol (C = 5 × 10⁻⁵ mol L−1).
Figure 3.
The absorption spectrum of budesonide (A) and sulfasalazine (B) solution in methanol (C = 5 × 10⁻⁵ mol L−1).


Figure 4.
Chromatogram of extracts of BUD and SULF after DLLME-SFO.

Figure 5.
Recovery of analytes depending on the type of extractant.

Figure 6.
Recovery of analytes depending on the volume of 1-undecanol.

Figure 7.
Recovery of analytes depending on the volume of ethanol (dispersing solvent).


Table 1.
Extraction solvents used in DLLME-SFO.
| Extractant | Chemical Formula | Density (g cm−3) | Temperature of Solidification (°C) |
|---|---|---|---|
| n-hexadecane | CH3(CH2)14CH3 | 0.77 | 18 |
| 2-dodecanol | CH3(CH2)9CH(OH)CH3 | 0.80 | 17–18 |
| 1-decanol | CH3(CH2)9OH | 0.83 | 6.4 |
| 1-dodecanol | CH3(CH2)11OH | 0.83 | 22–24 |
| 1-undecanol | CH3(CH2)10OH | 0.83 | 13–15 |
| 1-chlorooctadecane | CH3(CH2)16CH2Cl | 0.85 | 20–24 |
| 1-bromohexadecane | CH3(CH2)15Br | 0.99 | 16–18 |
| 1,10-dichlorodecane | Cl(CH2)10Cl | 0.99 | 14–16 |
Table 2.
Influence of the type of electrolyte on the efficiency of analyte extraction.
| Type of Electrolyte | Recovery (%) | |
|---|---|---|
| BUD | NaCl | 90 |
| KCl | 57 | |
| CaCl2 | 72 | |
| SULF | NaCl | 78 |
| KCl | 64 | |
| CaCl2 | 73 |
Table 3.
The excess of interferences causes 5% error in HPLC-UV determination of BUD and SULF.
| Interferent | BUD (5 × 10⁻⁵ mol L−1) | SULF (5 × 10⁻⁵ mol L−1) |
|---|---|---|
| Diclofenac | 5 | 15 |
| Ibuprofen | 5 | 5 |
| Metronidazole | 10 | 15 |
| Caffeine | 10 | 10 |
| Acetylsalicylic acid | 20 | 3 |
| Ascorbic acid | 15 | 15 |
| Levomepromazine | 20 | 5 |
| Naproxen | 5 | 2 |
| Ranitidine | 20 | 10 |
| Mg2+ | 20 | 15 |
| Ca2+ | 20 | 20 |
| Fe3+ | 3 | 2 |
| SO42− | 30 | 30 |
| PO43− | 50 | 40 |
| CO32− | 30 | 30 |
Table 4.
Analytical characteristic of DLLME-SFO-HPLC-UV method.
| BUD | SULF | |
|---|---|---|
| Beer’s low range (mol L−1) | 5 × 10⁻⁸–2 × 10⁻⁵ | 5 × 10⁻⁸–2 × 10⁻⁵ |
| Beer’s low range (µg mL−1) | 0.022–8.611 | 0.020–7.968 |
| Equation of calibration graph (n = 5) | y = 1.09 × 10¹¹ x + 6 971 | y = 1.15 × 10¹¹ x − 6 390 |
| Slope ± standard deviation SD | 1.09 × 10¹¹ ± 0.88 × 10¹⁰ | 1.15 × 10¹¹ ± 0.98 × 10¹⁰ |
| Intercept ± standard deviation SD | 6 971 ± 1 102 | 6 390 ± 989 |
| Correlation coefficient R2 ± standard deviation SD | 0.999 ± 0.004 | |
| Precision—intraday RSD (n = 10, %) | 3.75 | 3.15 |
| Precision—interday RSD (n = 10, %) | 0.66 | 2.88 |
| Limit of detection LOD (mol L−1) | 2.67 × 10⁻⁸ | 2.92 × 10⁻⁸ |
| Limit of detection LOD (µg mL−1) | 0.011 | 0.012 |
| Limit of quantification LOQ (mol L−1) | 8.10 × 10⁻⁸ | 8.84 × 10⁻⁸ |
| Limit of quantification LOQ (µg mL−1) | 0.035 | 0.035 |
| Enrichment factor EF | 145.7 | 119.5 |
| Recovery ± standard deviation SD (%) | 102 ± 7 | 84 ± 5 |
| Volume of extract (µL) | 70 ± 5 | |
Table 5.
The comparison of elaborated procedure (DLLME-SFO-HPLC-UV) with other techniques.
| Sample | Isolation Technique | Determination Method | LOQ | EF | Lit. |
|---|---|---|---|---|---|
| BUD | |||||
| Surface water, wastewater | SPE | LC-MS/MS | 4.2–5.8 ng L−1 | nd | [17] |
| Soils | SPE (Oasis HLB sorbent) | LC-MS/MS | 2.84 ng g−1 | nd | [18] |
| Surface water, wastewater samples | DLLME-SFO | HPLC-UV | 0.035 µg mL−1 | 145.7 | This method |
| SULF | |||||
| Surface water | SPE | UPLC-MS/MS | 5 ng L−1 | nd | [21] |
| Surface water, wastewater | SPE (Oasis MCX sorbent) | UPLC-ESI/MS/MS | 1.5 ng L−1 | nd | [20] |
| Human serum | nd | HPLC-DAD | 0.1 ng µL−1 | nd | [10] |
| Human serum | nd | HPLC-UV | 0.5 µg mL−1 | nd | [32] |
| Surface water, wastewater | DLLME-SFO | HPLC-UV | 0.035 µg mL−1 | 119.5 | This method |
Nd - No data.
Table 6.
Results of BUD and SULF in Biała river and wastewater samples by the proposed chromatographic method with isolation by DLLME-SFO extraction.
Table 6.
Results of BUD and SULF in Biała river and wastewater samples by the proposed chromatographic method with isolation by DLLME-SFO extraction.
| Sample | Added Concentration of Analyte (mol L−1) | Concentration of Found Analyte (mol L−1) | Average Concentration of Found Analyte ± SD (n = 3) (mol L−1) | RSD (n = 3, %) | Average Recovery ± SD (%) |
|---|---|---|---|---|---|
| BUD | |||||
| Biała river | 5.00 × 10⁻⁶ | 4.68 × 10⁻⁶ | 5.11 × 10⁻⁶ ± 3.97 × 10⁻⁷ | 7.8 | 102.1 ± 7.7 |
| 5.16 × 10⁻⁶ | |||||
| 5.47 × 10⁻⁶ | |||||
| Wastewater | 5.84 × 10⁻⁶ | 5.85 × 10⁻⁶ ± 1.02 × 10⁻⁷ | 1.7 | 117.1 ± 1.7 | |
| 5.76 × 10⁻⁶ | |||||
| 5.96 × 10⁻⁶ | |||||
| SULF | |||||
| Biała river | 5.00 × 10⁻⁶ | 4.37 × 10⁻⁶ | 4.78 × 10⁻⁶ ± 4.03 × 10⁻⁷ | 8.4 | 95.5 ± 8.3 |
| 5.17 × 10⁻⁶ | |||||
| 4.79 × 10⁻⁶ | |||||
| Wastewater | 5.15 × 10⁻⁶ | 5.34 × 10⁻⁶ ± 3.06 × 10⁻⁷ | 5.7 | 106.7 ± 5.7 | |
| 5.69 × 10⁻⁶ | |||||
| 5.17 × 10⁻⁶ | |||||
© 2019 by the authors. Licensee MDPI, Basel, Switzerland. This article is an open access article distributed under the terms and conditions of the Creative Commons Attribution (CC BY) license (http://creativecommons.org/licenses/by/4.0/).
Share and Cite
MDPI and ACS Style
Hryniewicka, M.; Starczewska, B.; Gołębiewska, A. Determination of Budesonide and Sulfasalazine in Water and Wastewater Samples Using DLLME-SFO-HPLC-UV Method. Water 2019, 11, 1581. https://doi.org/10.3390/w11081581
AMA Style
Hryniewicka M, Starczewska B, Gołębiewska A. Determination of Budesonide and Sulfasalazine in Water and Wastewater Samples Using DLLME-SFO-HPLC-UV Method. Water. 2019; 11(8):1581. https://doi.org/10.3390/w11081581
Chicago/Turabian StyleHryniewicka, Marta, Barbara Starczewska, and Agnieszka Gołębiewska. 2019. "Determination of Budesonide and Sulfasalazine in Water and Wastewater Samples Using DLLME-SFO-HPLC-UV Method" Water 11, no. 8: 1581. https://doi.org/10.3390/w11081581
Note that from the first issue of 2016, this journal uses article numbers instead of page numbers. See further details here.