Article

Impact of the Biological Cotreatment of the Kalina Pond Leachate on Laboratory Sequencing Batch Reactor Operation and Activated Sludge Quality

Department of Biochemistry, Faculty of Biology and Environmental Protection, University of Silesia, Jagiellońska 28, 40-032 Katowice, Poland
*
Author to whom correspondence should be addressed.
Water 2019, 11(8), 1539; https://doi.org/10.3390/w11081539
Submission received: 10 July 2019 / Revised: 17 July 2019 / Accepted: 23 July 2019 / Published: 25 July 2019
(This article belongs to the Section Wastewater Treatment and Reuse)

Abstract

:
Hauling landfill leachate to offsite urban wastewater treatment plants is a way to achieve pollutant removal. However, the implementation of biological methods for the treatment of landfill leachate can be extremely challenging. This study aims to investigate the effect of blending wastewater with 3.5% and 5.5% of the industrial leachate from the Kalina pond (KPL) on the performance of sequencing batch reactor (SBR) and capacity of activated sludge microorganisms. The results showed that the removal efficiency of the chemical oxygen demand declined in the contaminated SBR from 100% to 69% and, subsequently, to 41% after the cotreatment with 3.5% and 5.5% of the pollutant. In parallel, the activities of the dehydrogenases and nonspecific esterases declined by 58% and 39%, and 79% and 81% after 32 days of the exposure of the SBR to 3.5% and 5.5% of the leachate, respectively. Furthermore, the presence of the KPL in the sewage affected the sludge microorganisms through a reduction in their functional capacity as well as a decrease in the percentages of the marker fatty acids for different microbial groups. A multifactorial analysis of the parameters relevant for the wastewater treatment process confirmed unambiguously the negative impact of the leachate on the operation, activity, and structure of the activated sludge.

Graphical Abstract

1. Introduction

Due to the improvement of socioeconomic levels resulting from rapid urbanization and industrial development, the generation of municipal and industrial wastes has increased considerably worldwide over the years. Moreover, despite the guidelines of the European Union Waste Framework Directive (2008/98/EC), landfilling still constitutes one of the most common methods of waste disposal in the middle-income countries. The major concern associated with landfilling is the generation of large amounts of leachate, which originates from the water percolated through the refuse. The leachate may contain a wide range of toxic, hazardous, and carcinogenic chemical contaminants. Moreover, its composition often varies significantly, both temporally and spatially [1]. Therefore, the arbitrary disposal of industrial and municipal waste in locations that are unprepared for landfilling may result in the uncontrolled migration of the leachate into the soil, sediments, surface water, and even groundwater.
The application of biological methods in the cotreatment of landfill leachate and domestic wastewater in urban sewage plants has become popular over the last decade [2,3,4,5]. However, there is scarce information on the impact of this combined treatment on the operation of the wastewater treatment process and, in particular, on the physiological and functional state of the activated sludge microorganisms.
Depending on their source, industrial and municipal waste are characterized by a variable composition, and may contain large quantities of organic and inorganic pollutants, such as phenols, polycyclic aromatic hydrocarbons, chloroform, sulfur compounds, cyanides, heavy metals, chloride, humic acids, and ammonia [6,7]. It is also well documented that the pollutant composition of the leachate may be much more complex than the landfilled waste itself due to the occurrence of the compounds that are formed during the processes of waste degradation [8,9]. Therefore, the difficulties in the biological treatment of the leachate originated from municipal and industrial waste are primarily related to its chemical load and changes in the important environmental parameters (e.g., pH, temperature, or salinity) during wastewater treatment.
Currently, the activated sludge process (ASP) has become dominant in biological wastewater treatment systems. In this technology, the contaminants are utilized by various microorganisms embedded with organic and inorganic particles within the extracellular polymeric substance matrix (EPS) [10]. Despite the fact that the activated sludge during wastewater treatment is often exposed to high concentrations of diverse chemicals, including inhibitory and recalcitrant ones, its autochthonous microorganisms may not be able to use them as carbon and energy sources. As a result, the abundance and activity of indigenous bacteria decrease [11,12]. Further reduction of the microbial capacity and diversity may weaken the biological wastewater treatment, or even be the cause of its complete breakdown [13,14,15,16].
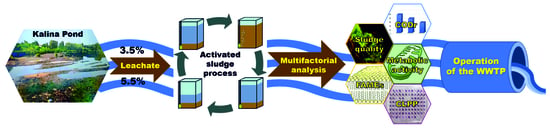
The objective of this study was to assess the impact of the KPL that are discharged into the wastewater treatment plant (WWTP) “Klimzowiec” along with the municipal effluents on the activated sludge microorganisms and the laboratory-scale SBR operation. Within the context of the combined treatment of the KPL and synthetic wastewater in activated sludge, the specific goals of this research were to (1) characterize and determine the acute toxicity of the KPL to the activated sludge microorganisms, (2) evaluate the changes in the operational parameters of the SBRs, (3) analyze the functional capacity and structural diversity of the microorganisms, (4) assess the structure of the activated sludge flocs, and (5) establish the relationships between the biological and physicochemical factors being studied. The special attention will be focused on the use of marker fatty acids to assess alterations in the structure of microbial communities under the KPL exposure because such studies have not been performed yet. The analyses that will be carried out enable any effects of the mixtures of the toxic contaminants on the activated sludge microorganisms and wastewater treatment process to be predicted in advance, and thus enable solutions that ensure the stable operation of the WWTP “Klimzowiec” and similar wastewater treatment units in the nearest future to be implemented.

2. Materials and Methods

2.1. Characteristics of the Object and Sample Collection

The Kalina pond in Świętochłowice (Upper Silesia, Poland, 50°16′49″ N, 18°55′38″ E) is considered to be a serious environmental problem of the Upper Silesia region and a pollution hotspot. It is highly contaminated with compounds originated from the effluents and precipitation of the waste dump of the Hajduki S.A. Chemical Plant in Chorzów. From 1888 to 1990 the increasing amount of toxic substances, including phenol and its derivatives benzene, toluene, and xylene isomers (BTEX), polycyclic aromatic hydrocarbons (PAHs), and heavy metals, has been accumulated in the dump. As a result, the basin is characterized by highly alkaline sediments that contain volatile phenols at concentrations that range from hundreds to even a couple of thousand mg/L, as well as chemical oxygen demand (COD) values of more than 10,000 mg O2/L [17]. In addition, the Kalina pond is also constantly polluted with landfill wastes that are disposed into the basin by local inhabitants. The disposal of contaminated wastewater from the Kalina pond into the urban WWTP “Klimzowiec” in Chorzów (Upper Silesia, Poland, 50°16′42″ N, 18°55′35″ E) began in 1998, simultaneously with the revitalization of the basin. The mechanic-biological WWTP “Klimzowiec” is one of the largest sewage plants in Poland with a purification capacity of 5600 m3/h. It collects wastewater from an agglomeration covering the following cities; Chorzów, Świętochłowice, Katowice, and Ruda Śląska, corresponding to a total catchment area of approximately 31.7 km2. The wastewater treatment is based on the activated sludge technology in Bardenpho system and consists of pre denitrification/dephosphatation zone, three denitrification reactors and five nitrification bioreactors with three independent aeration zones.
The samples of the bottom sediments from the Kalina pond were taken according to EN ISO 5667-13:2011 [18] and EN ISO 19458:2007P [19] at a distance of 2 m from the shore and a depth of 2 m, in the major point of entry of the effluents from waste dump into the pond. The samples were collected from April to May in 2017 after the completion of the revitalization process of the Kalina pond area.
The activated sludge (AS) inoculum was obtained directly from the aeration tank of the WWTP “Klimzowiec”, transferred to sequencing batch reactors (SBRs) and acclimatized to synthetic wastewater for three weeks prior to the start of the actual experiment [20].

2.2. Physicochemical and Microbial Characteristics of the KPL

The physicochemical characteristics of the Kalina pond leachate (KPL) included the chemical oxygen demand (COD), pH, phenolic index, and concentrations of N-NH4+, N-NO3, and N-NO2 (according to the Polish standards: PN-ISO 10390:1997 [21], PN-ISO 7150:1-2002 [22], PN-ISO 6439:1994 [23], PN-C-04576-4:1994 [24], PN-82/C-04576/08 [25], PN-73/C-04576/06 [26]). The short-term biochemical oxygen demand (BODst) was assessed using the respirometry method according to Hagman and Jansen [27]. The concentration of total suspended solids (TSS) in the KPL samples was measured according to the Standard Methods for the Examination of Water and Wastewater [28]. The values of the parameters were compared with the Order of the Minister of Environment laying down conditions for the introduction of sewage into water bodies or soil and laying down the list of substances particularly harmful to water environments [29].
The number of the selected groups of microorganisms was assessed via the indirect enumeration (EN ISO 8199:2010 [30]). Various differential media to cultivate the total heterotrophic bacteria, coliform bacteria, filamentous bacteria, Actinomycetes, and fungi were inoculated with 100 µL of serial 10-fold dilution of the KPL in 0.85% NaCl (100, 10−1, 10−2, 10−3). The inoculated plates were incubated at 23 ± 2 °C for 7 or 14 days, depending on the microorganisms. Furthermore, the detection and quantification of total coliform bacteria and fecal coliforms was performed using the membrane filtration reference method using 0.45 μm pore size filters (EN ISO 9308-1:2014-12/A1:2017-04) on the Lactose TTC Agar with Tergitol 7 medium and m-Endo Agar LES medium [31]. The number of fecal coliforms was expressed as the colony-forming units (CFU) in 100 mL of the KPL, whereas the total number of heterotrophic bacteria and other detected microorganisms was expressed as the CFU in 1 mL of the leachate.

2.3. Ecotoxicity of the KPL

The noninhibitory concentration (NIC), half-maximal inhibitory concentration (EC50), and minimal inhibitory concentration (MIC) values for microbial growth were estimated using GraphPad PRISM 6.05 software (GraphPad Software, San Diego, CA, USA). Microbial inoculum was cultivated in the synthetic wastewater (SW) supplemented with the KPL in a concentration range from 0 to 12.5%. The initial biomass of the activated sludge was 0.1 g/L. The synthetic wastewater (SW), which was characterized by a COD:N:P ratio of 100:10:1, was designed to mimic actual domestic wastewater discharged into the WWTP “Klimzowiec” (Table 1). After 24 h of incubation with shaking at 23 ± 2 °C, the growth of the microorganisms was measured by determining the concentration of the mixed liquor suspended solids (MLSS) in the sludge samples. The SW supplemented with the KPL in a concentration range of 0 to 12.5% without the addition of the activated sludge microorganisms was used as the negative control.

2.4. Experimental Set-Up and Batch Experiments

The study was conducted in an experimental model of the SBR, which was used as an alternative technology to the continuous flow process employed in the WWTP “Klimzowiec” due to its low area requirement as well as manpower for operation. The experimental set-up (Figure 1A) consisted of two activated sludge SBRs: the control SBR (SBRC), which was fed only with the SW, and the contaminated SBR (SBRKPL), which was fed with the SW and two concentrations of the KPL—3.5% of the influent for the first 32 days of the experiment (stage I) and 5.5% of the influent for the next 32 days (stage II). A lower concentration of the KPL reflected its average content in the wastewater discharged into the WWTP “Klimzowiec”, while a higher concentration of the KPL reflected its content in the effluent discharged into this sewage plant during the wet season.
The AS was mixed with the wastewater in order to obtain a biomass concentration of 3 g/L to maintain the average concentration of microorganisms desired for conventional activated sludge process. An even distribution of wastewater was ensured by aeration. The dissolved oxygen (DO) level was maintained at a range as in the WWTP “Klimzowiec” (not exceeding 4 g/L) and was monitored using an Elmetron COG-1 oxygen electrode (Elmetron®, Zabrze, Poland) [28]. The pH in the reactor chambers was not corrected during the experiment. The experiment was conducted for 64 days in order to reflect two months of the operation of the WWTP. After 32 days, and before the addition of 5.5% of the KPL, the concentration of the activated sludge biomass in the SBRC and the SBRKPL was once again brought to 3 g/L by discharging the excess sludge. The SBRs with a working volume of 9-L operated sequentially at 23 ± 2 °C within a 48-h cycle (Figure 1B), including 15 min of influent filling, 47 h of aeration, 30 min of settling, and 15 min of effluent discharging. Every second day, 58% of the effluent was removed and replaced by the same volume of the SW, with or without the addition of constant portions of the KPL in order to reflect the cycle of the wastewater treatment in the WWTP “Klimzowiec”.

2.5. Determination of the Selected Physicochemical Parameters of the AS and Microbial Counts

The COD, MLSS, mixed liquor volatile suspended solids (MLVSS), pH, and Mohlman sludge volume index (SVI) were measured in triplicate every four cycles of the SBRs operation as in reference [28].
The heterotrophic bacteria were extracted from the AS via the homogenization (20 mL aliquots on ice for 10 sec at 11,000 × g using a sterile IKA© Ultra-Turrax T-25 digital homogenizer (IKA® Works, Guangzhou, China) and enumerated according to PN-EN ISO 8199:2010 [30]. The number of bacteria was expressed as the CFU/g of the MLSS.

2.6. Enzymatic Activity of the AS

The AS activity was assayed via the quantification of selected sludge enzymes, which is routinely used to measure specific alterations in the presence of toxicants [32]. Dehydrogenases (EC.1.1.1) were used as the marker of the response of the microorganisms to environmental changes and as an indicator of the viable microorganisms in the sludge samples. Esterases (EC.3.1) are commonly used to assess the cell viability due to their direct relationship to bacterial membrane integrity. The activity of dehydrogenases (DHA) was determined according to Miksch [33], while the activity of nonspecific esterases (NSEA) was determined according to the protocol designed by Schumacher et al. [34].

2.7. Biolog® Community-Level Physiological Profiling (CLPP) of the AS and KPL

To study the functional capacity of the microorganisms in the AS and KPL, Biolog® 96-well EcoPlatesTM (BIOLOG Inc., Hayward, CA, USA) were inoculated with 120 µL of the aliquot collected after microbial extraction. To determine metabolic response for a comparable number of microorganisms, the aliquots obtained from the sludge and leachate were adjusted to 0.05–0.01 absorbance units (at λ = 590 nm) in order to avoid the dark brown color generated from the samples and to standardize the size of the inoculum at a level of 108 CFU/mL. The microplates were incubated at 23 ± 2 °C in the dark. The absorbance in each well was measured at 590 nm using a Biolog® MicrostationTM immediately after the inoculation of the plates, and then every 12 h until the value curve plateau of the average well color development (AWCD) or inflection point was reached. The data were collected using Microlog 4.01 software. The CLPP analysis of the KPL was performed before its addition to the bioreactor, whereas the CLPP analyses of the AS were conducted at the beginning (SBR0d), after 32 (SBRC32d and SBRKPL32d), and 64 days (SBRC64d and SBRKPL64d) of the experiment.
The specific rate of the increase in microbial activity—A(t), which is given as a function of time for the utilization of each carbon source in EcoPlateTM [35] was fitted to the nonlinear model described by Verhulst [36] with the four-parameter logistic function given by the equation
A ( t ) = A max 1 + be - kt 50
By fitting the Verhulst logistic equation to the empirical data obtained for each carbon source using the Levenberg–Marquadt algorithm implemented in the leastsq function of Python’s SciPy package [37], the following parameters were estimated; Amax represents the maximum microbial activity; t50 indicates the time at which the microbial activity has reached half of its maximum and k, which is related to the steepness slope of A(t) at t = t50; and b is the relative microbial activity increase in an arbitrary constant [35,38,39]. In this study, the time at which the total microbial activity increased at the fastest rate (Avt50) was determined separately for each sample and used to compare the samples from the different activated sludge treatments by calculating the functional capacity indices: average well color development (AWCD), metabolic richness index (S), Gini coefficient (G), and Shannon–Weaver diversity index (H’ECO) [40,41]. The Avt50 was calculated as follows
Avt 50 = i = 1 n ( ln b k ) N
The carbon sources in an EcoPlateTM were divided into seven groups according to Nowak and Mrozik [42]. Additionally, the carbon use index (C-USE), nitrogen use index (N-USE), and phosphorus use index (P-USE) were calculated as in reference [42].

2.8. Extraction and Analysis of the Fatty Acid Methyl Esters (FAMEs)

For the qualitative and quantitative analyses of the fatty acids in the AS, triplicate samples of the sludge (5 mL) were collected from the SBRs at the beginning (SBR0d), after 32 (SBRC32d and SBRKPL32d), and 64 days (SBRC64d and SBRKPL64d) of the experiment. Next, they were homogenized on ice for 10 sec at 11,000 rpm using a sterile IKA© Ultra-Turrax T-25 digital homogenizer. The biomass was pelleted via centrifugation at 4 °C, 5000× g, for 20 min. The fatty acids were extracted from the sludge samples according to the procedure described by Kozdrój [43] and identified using a Microbial Identification System (MIS, Microbial ID, Inc., Newark, DE, USA).
The similarity between the structures of the microbial communities, based on the FAME analysis, was calculated using Shannon–Weaver diversity index [42] and the weighted stack method [44] given by the formula
SIM ,   % = i = 1 n x i a + x i b 2 min   { x i a x i b , x i b x i a }
where, min is minimum, xi is the mole % of ith FAME, and the subscripts a and b are two compared activated sludge profiles.
To study the changes in the structure of microbial communities in the AS exposed to the KPL, the following FAME biomarkers were analyzed; 11:0 iso, 11:0 anteiso, 13:0 iso, 13:0 anteiso, 14:0 iso, 15:0 iso, 15:0 anteiso, 16:0 iso, 17:0 iso, 17:0 anteiso for Gram-positive bacteria (BG+) [45], 17:0 cy, 19:0 cy, 16:1 ω5c, 16:1 ω7c, 17:1 ω7c, 18:1 ω7c for Gram-negative bacteria (BG-) [45], 16:0 10Me, 17:0 10 Me, 18:0 10 Me for those of an actinomycete origin (Ac) [46], 18:1 ω9c, 18:2 ω6, 9c, 18:3 ω3c, 18:3 ω6c for fungi (F) [47], and 20:2 ω6, 9, 20:4 ω6, 9, 12, and 15c for protozoa (Pr) [48,49]. The sum of BG+, BG−, and Ac was selected to represent the total bacteria (TB) in the sludge samples.

2.9. Microscopic Analysis of the AS Flocs Structure

The internal structure of the activated sludge flocs was assessed in both SBRs at the end of the experiment. The visualization of the AS was carried out using a bright-field microscopy without staining and with acridine orange (AO) fluorescent staining using a Nikon Eclipse epifluorescence microscope (Nikon, Poland) with a 485 nm excitation laser and a 520 nm emission filter.

2.10. Statistical Analyses

All of the data presented in this paper were expressed as the mean and standard deviation and were analyzed using Microsoft Office Excel 2010, Statistica® 12.5 PL (TIBCO Software Inc., Palo Alto, CA, USA), GraphPad Prism 5, ScyPy, and R-Studio software. For the cluster analysis, all of the data were first subjected to min–max normalization according to the equation
ND = RD i RD max RD max RD min
Where, ND (normalized data)—all of the variables scaled to the range (0, 1); RDi—the initial raw data; RDmin—the minimal value of each parameter in a data set; and RDmax—the maximal value of each parameter in a data set.
The factors that might influence the changes between the SBRC and the SBRKPL during wastewater treatment were evaluated using principal component analysis (PCA) based on a Spearman correlation matrix.
The changes between the SBRC and the SBRKPL during wastewater treatment were determined using a one-way analysis of variance (ANOVA, post hoc test) and were followed by the separation of the treatments from the control, as well as among themselves, by applying the post hoc LSD at confidence intervals of 95% (p < 0.05). The values that are indicated by different lower case and upper case letters were statistically significant. If there are no letters, there were no statistically significant differences between the samples.
Bonferroni’s test for multiple comparisons was used to study the dissimilarities between the SBRC and the SBRKPL. The differences are indicated by asterisks (Bonferroni correction, p = ns ≥ 0.05 ≥ * > 0.01 ≥ ** > 0.001 ≥ *** > 0.001 ≥ ****) where ns, *, **, ***, and **** indicate no significant differences, significant differences, very significant differences, and extremely significant differences, respectively.

3. Results

3.1. Characteristics and Toxicity of the KPL

The KPL was a cloudy, black liquid that had a strong odor and a strongly alkaline pH (9.0). It was contaminated with organic pollutants and phenolic compounds as was indicated by its COD and phenolic index. The leachate was also characterized by moderately high concentrations of organic and inorganic matter (TSS) and a low BODst level. The most dominant source of nitrogen in the KPL was N-NH4, whereas the content of N-NO3 and N-NO2 were relatively low. Moreover, the leachate was rich in orthophosphates and had a high pollution index (Table 2).
Microbial analysis of the KPL showed a high abundance of heterotrophic microorganisms, including Actinomycetes and filamentous bacteria. However, the overall number of microscopic fungi and Gram-negative potential pathogens in the leachate was significantly lower (Table 3).
In order to analyze the metabolic functions of the KPL microbial communities, all of the EcoPlateTM substrates were grouped according to their biochemical guild. Microorganisms in the KPL were characterized by a low functional capacity confirmed by a low value of the AWCD (0.16) and metabolic richness index of 6.00 (Table 4). They were able to use merely 20% of the carbon sources available in an EcoPlateTM and they did not utilize any of the compounds belonging to the C and A guilds or the phosphorus-containing substrates. The microbial growth mainly appeared in the presence of specific carboxylic acids. The KPL microorganisms were also able to utilize all of the surfactants available in the EcoPlateTM with a very similar efficiency of 7% and 9.26% for Tween 40 and Tween 80, respectively. Furthermore, the microbial growth was significantly supported by 4-hydroxybenzoic acid, glycogen and L-asparagine. The unequal utilization of the carbon sources by the KPL microbial communities was confirmed by the high value of the Gini coefficient (G = 0.85) (Table 4).
Because the KPL has been discharged into the wastewater stream and cotreated in the WWTP “Klimzowiec” since 1998, it was particularly interesting to evaluate the ecotoxicity of the leachate. According to the data obtained from the wastewater treatment plant “Klimzowiec”, the concentrations of the leachate in the raw wastewater depend on the seasonal weather variations and they reach 1.5% and 5.5% during the dry and rainy season, respectively. Taking this into account, a wider concentration range of 0.5 to 12.5% was used in this study. As shown in Figure 2, a negligible inhibition of microbial growth in the presence of 3.45% (NIC value) of the KPL was observed. However, a significant toxic effect was achieved in the presence of 6.69% (IC50 value) of the pollutant. The exposure of the AS microorganisms to 11.26% (MIC value) of the KPL resulted in the complete inhibition of microbial growth.

3.2. Operational Parameters of the AS Bioreactor

Because 1.5% of the KPL was below the toxicity threshold, this study focused on assessing the long-term impact of 3.5% and 5.5% of the leachate in the wastewater on operational parameters of the AS in the SBR. A comparison of performance of the SBRC and SBRKPL (Figure 3) showed that the behavior of the AS was strongly affected by the quality of the wastewater. An increase in the KPL concentration in the effluent correlated with a gradual reduction in the removal efficiency of the chemical oxygen demand (CODr) in the SBRKPL. After 32 days of cotreatment with 3.5% of the KPL, the CODr decreased by 27%. However, a much more significant decline of this parameter by 57% occurred in the bioreactor after the combined treatment with 5.5% of the leachate. By comparison, the SBRC was characterized by a high level of the efficiency of wastewater treatment within a range of 83 to 96% (Figure 3A). The next crucial parameter used in the WWTP operation is the sludge volume index (SVI) that reflects the conditions of the sludge. The addition of the KPL into the sewage resulted in a significant reduction in the SVI value (Figure 3B) from 143 mL/g to 77 and 53 mL/g at the end of both stages of the wastewater treatment, respectively. In contrast, the SVI in the SBRC was fairly constant with no significant fluctuations in its value from 143 to 102 mL/g. Moreover, the pH value affected the rates and limited microbial growth in the AS and a gradual increase in this parameter from 7.6 to 8.1, and 8.1 to 9.3, was observed in the SBRKPL during both stages of the wastewater treatment, respectively (Figure 3C). Conversely, no significant changes in the pH value were found in the SBRC. Variations in the MLVSS to MLSS ratio (Figure 3D) denoted a change in the AS biomass. In this study, a slight increase in the MLVSS ratio from 0.83 to 0.98 was observed during the first 32 days of wastewater treatment in the SBRC and subsequently from 0.81 to 0.91 during the next 32 days. Conversely, the MLVSS/MLSS ratio in the AS polluted with 3.5% of the KPL was fairly constant (0.83–0.85). The increase in the leachate concentration to 5.5% resulted in a significant decrease of this parameter to 0.69.

3.3. Number of Heterotrophic Bacteria and Microbial Activity of the AS

An analysis of the total number of sludge heterotrophic bacteria (THB) indicated a slight decrease by 4% and 8% in the SBRC and SBRKPL after 8 days of the experiment, respectively (Figure 4). However, during the next 16 days, a further decrease in the THB count by 7% was observed in the SBRKPL treated with 3.5% of the KPL. At the same time, the THB count in the SBRC was similar to its initial value. The MLSS and MLVSS were used to determine the total mass and biomass in the SBR, respectively (Figure 4). A significant decrease in the MLVSS by 39% in the SBRKPL was found after 48 days of the KPL cotreatment, which correlated with a decrease in the THB number by 28%. After day 48, neither the MLVSS nor THB count in the polluted AS showed any further variations. By contrast, a gradual and significant increase in the MLVSS content by 38% was observed in the SBRC, while the THB number remained unchanged in this system. It was found that bioreactors varied significantly in respect to the noncellular suspended matter in the AS (Figure 4). In the SBRKPL, a gradual increase in the suspended matter by 92% was observed at the end of stage II of the wastewater treatment. By contrast, a decrease in this parameter in the SBRC by 91% and 31% was found at the beginning of both stages of the wastewater treatment, respectively.
The presence of the KPL in the wastewater extremely affected the activity of the dehydrogenases (DHA) (Figure 5A) and nonspecific esterases (NSEA) in the AS (Figure 5B). During the first 24 days of the wastewater treatment, a significant decrease in the DHA by 12% and in the NSEA by 20% was found in the SBRC. Subsequently, the respiratory activity began to increase and after reaching its initial value, it remained at a similar level in the control AS. By comparison, there was a sharp decrease in the NSEA and DHA by 51% and 40% in the SBR contaminated with 3.5% of the leachate, respectively. Moreover, the increase in the pollutant concentration in the wastewater stream from 3.5 to 5.5% resulted in a further decrease in the DHA by 70% and in the NSEA by 33%.
To compare the microbial activity of the unpolluted and contaminated AS in the SBRs, the EcoPlateTM indices were calculated (Table 5). It was found that the discharge of 3.5% of the KPL into the wastewater stream resulted in a sharp decrease from 27.67 to 19.33 in the metabolic richness index (S) for the sludge microbial communities.
An increase in the KPL concentration in the wastewater from 3.5 to 5.5% resulted in a decrease in the value of AWCD and metabolic richness to 0.24 and 10.67, respectively. Consistently, the microorganisms that had not been exposed to the leachate were characterized by a significant AWCD of 0.96 and a high metabolic richness of 29. Although the activity (AWCD) of the AS microorganisms in the SBRKPL was lower than in the SBRC, the microbial communities in both bioreactors achieved half of their overall maximal activity at the same time (t50) (Figure 6). In the SBRKPL, the microorganisms were able to utilize 64.44% of the carbon sources, whereas in the SBRC, the bacteria metabolized 82.22% of the EcoPlateTM substrates, which correlated with a metabolic richness index of 19.33 and 24.67, respectively. It was found that the long-term presence of the KPL in the wastewater significantly affected the relative abundance of the AS microorganisms, which was reflected by the almost 2-fold higher value of the Gini coefficient compared to the control sludge. The results of the H’ECO showed a decrease in the functional capacity of the microorganisms in the SBRKPL from 3.15 to 2.11 after 64 days of the KPL treatment. The H’ECO calculated for the SBRC was roughly stable (2.99 to 3.33).
In order to determine whether the type of activated sludge treatment affects the substrate utilization patterns of AS microorganisms, a similar analysis as for the KPL was performed. Compared to the SBRC, the presence of the KPL in the wastewater primarily affected the utilization efficiency of C and PA by 13% and 11%, and 25% and 68% after the cotreatment with 3.5% and 5.5% of the leachate, respectively. A higher concentration of the KPL primarily affected the CA, S and P utilization patterns, which was reflected by a decrease in the intensity of their usage from 19.41 to 7.83%, 7.33 to 4.61%, and 7.52 to 4.02%, respectively. The N-USE and P-USE indices were used to compare the microbial communities from the SBRC and SBRKPL in regard to their ability to utilize the nitrogen and phosphorus sources. It was shown that the microorganisms in the contaminated AS achieved a 23% higher N-USE index than the microorganisms that had not been exposed to the pollutant. Although the utilization of the phosphorus-containing compounds decreased in the SBRC over time, the microorganisms in the SBRKPL did not utilize any of the available phosphorus sources even after treatment with 3.5% of the leachate.

3.4. Structural Diversity of the Microbial Communities in the AS

Literature data indicates that the fatty acid patterns can be used to assess changes in the AS microbial communities when the WWTP is operated in a specific way [52]. Here, the participation of the FAME markers for BG− was the highest in both investigated SBRs (Table 6). However, their content in the contaminated AS gradually decreased from 33.2 to 18.56%, along with an increase in the concentration of the pollutant in the wastewater. Similarly, a decrease in the content of the F and Pr biomarkers in the SBRKPL from 7.49 to 2.95% and from 2.14 to 0.82% was confirmed, respectively. Over the 64 days, the contribution of the BG−, F, and Pr markers did not change in the SBRC where they constituted 29.64%, 6.82%, and 2.21%, respectively. The content of the FAME markers for BG+ and Ac increased over time in the SBRKPL from 5.97% and 0.30% to 12.27% and 2.79%, respectively, and significantly surpassed their values in the SBRC (5.90 and 0.31%). The increase in the content of BG+ markers in the contaminated AS correlated with the increase in the BG+/BG− ratio from 0.19 to 0.66. The fluctuations in the participation of the tested microbial groups in the contaminated AS resulted in a gradual decrease in its structural diversity as was indicated by an increase in the H’FAME index from 2.83 to 2.68 and 2.56 after 32 and 64 days of the treatment, respectively. Conversely, the structure of the microbial communities in the SBRC did not change significantly during the experiment. The impact of the KPL on the AS communities was reflected in an increase in the sat/unsat ratio from 0.89 to 1.73 and in the anteiso/iso ratio from 0.70 to 1.43, which also correlated with an increase in the abundance of the fatty acid precursors from 0.01 to 0.46 (Table 6).
An analysis of the distinct fatty acid groups indicated that the FAMEs were significantly affected by the type of AS treatment (Figure 7A). It was found that in the SBRKPL, the yield of hydroxylated and cyclopropane fatty acids increased almost 2-fold and 22-fold during stage I of the wastewater treatment, respectively. Moreover, after the exposure of the AS to the effluents loaded with 5.5% of the KPL, a further increase in the abundance of the cyclopropane fatty acids from 5.70 to 7.44% was observed. Simultaneously, an increase in the branched fatty acid content by 57% and a decrease in the straight chain and saturated fatty acid participation by 9% and 32% were observed, respectively. Conversely, the FAME profiles obtained for the uncontaminated AS did not undergo any significant changes over the experimental period. The similarity between the structures of the microbial communities in the SBRC and the SBRKPL, based on the FAME analysis, showed that the AS microorganisms changed in both types of operating conditions (Figure 7B). However, the most significant variations in the sludge operation were observed in the SBRKPL, where the value of the similarity coefficient (SIM) decreased by 36% and 45% after 32 and 64 days of the KPL treatment, respectively, compared to its value at the beginning of the experiment. Simultaneously, the SIM was 86% and 73% for the SBRC at that time.

3.5. Multifactorial Analysis of the Analyzed Parameters

In this study, wastewater quality was the factor that had an effect on the alterations in the AS. A cluster analysis of the studied biological units that was based on the operational parameters of wastewater treatment and AS quality, diversity, and functional capacity indices as well as significant fatty acids is presented in Figure 8A. This enabled two main separate clusters to be distinguished. One cluster included the N-USE index, selected fatty acids, pH, and the Gini coefficient, whereas the operational parameters of the wastewater treatment, diversity, and functional capacity indices, enzymatic activity, THB counts and the P-USE index were grouped in the second cluster. Moreover, this analysis separated the two clusters in terms of the SBRs treatment over time. In the first cluster, two subgroups were distinguished and grouped together. The first subgroup included the SBR0d, whereas SBRC32d and SBRC64d belonged to the second subgroup. The second cluster included only the SBRKPL. The values of the operational parameters of the wastewater treatment and the AS quality that were grouped in the first cluster were higher for the uncontaminated sludge compared to the polluted one. An opposite trend was observed in the case of the factors that were grouped in the second cluster. A cluster analysis of the SBRC and SBRKPL based on the ability of the microbial communities to utilize the various carbon sources is presented in Figure 8B. It enabled three main separate clusters to be distinguished. The first cluster included Tween 80, α-D-lactose, α-ketobutyric acid, and D-mannitol, whereas the third cluster included PA, L-arginine, L-asparagine, phenylethylamine, β-methyl-D-glucoside, and N-acetyl-D-glucosamine. In turn, CA, P, and the other available compounds belonged to the second largest cluster. A cluster analysis of the studied AS in terms of their treatment over time also distinguished two separate clusters with two subgroups in the first one. The first subgroup included SBR0d, SBRC64d, and SBRKPL64d, whereas SBRC32d and SBRKPL32d belonged to the second subgroup. Moreover, the second cluster included the AS cotreated with the 5.5% KPL. It was revealed that most of the substrates that belonged to the second subgroup were not utilized by the AS exposed to the leachate.

3.6. Microscopic Analysis of the AS

After 64 days of the experiment the microscopic observations of the uncontaminated and contaminated AS were performed. They revealed that flocs in the polluted AS were smaller with a much looser structure and a less regular shape (Figure 9A,B) compared to the flocs in the unpolluted AS (Figure 9I,J). Simultaneously, the abundance of filamentous bacteria that were attached to the sludge flocs in the SBRKPL was higher and the amount of extracellular polymeric substances was lower compared to their content in the SBRC. A bright-field microscopic observation of the AS confirmed the lower diversity of protozoan in the SBRKPL (Figure 9K–P) than in the SBRC, which were represented by ciliates (Figure 9K–M), suctorians (Figure 9O,P), and filamentous bacteria (Figure 9I,J,M). Additionally, numerous empty Arcella shells occurred in this bioreactor (Figure 9N). In SBRC, mainly rotifers (Figure 9E), ciliates (Figure 9G,H), live Arcella cells (Figure 9F), and Zooglea fingered in the gelatinous matrix (Figure 9C,D) were present.

4. Discussion

AS technology is considered to be the most efficient and economical approach for achieving the desired quality of wastewater mixed with landfill leachate [16]. Although the cotreatment of the landfill leachate in the WWTP may be appropriate under some circumstances [53], the inherent variability in the leachate composition necessitates a conservative strategy due to the increasingly stringent water quality emission limits that have been placed on the biological treatment units by the Urban Wastewater Directive (91/271/EEC; EEC, 1991) and the Water Framework Directive (2000/60/EC; EU, 2000). Despite the abundance of studies that have been performed on the cotreatment of the landfill leachate in sewage plants, knowledge about the long-term effect of its occurrence in the effluent on activated sludge ecosystem remains limited.
Among many parameters that enable the alternations in the leachate quality to be evaluated, the pH value is considered to be an indicator of its aggressiveness. The alkaline KPL used in this study can be classified according to El-Fadel et al. [54] as an old and stabilized leachate. It was also characterized by a moderately high strength of recalcitrant phenolic compounds, which had a concentration that surpassed the allowable limits [29] by more than three orders of magnitude. Moreover, the low BODst level of the KPL compared with its COD value confirmed a large amount of non-biodegradable organic matter. In addition, the LPI value of the KPL was more than 5-fold higher than the standard LPI value for the treated leachate disposal limit for inland surface water (7.378), which revealed its high pollution potential [55]. It was reported that a high concentration of N-NH4+ in the leachate can disrupt its biological treatment due to the toxicity of this compound [56,57]. Although the concentration of ammonium in the tested KPL was almost 40-fold higher than the limits [29], its content was near the lower limit reported for an old leachate (360 to 2150 mg/L) [54]. The performed analysis of specific microbial groups indicated that the investigated landfill leachate may be a sanitary and epidemiological hazard. The abundance of total coliforms as well as fecal indicator bacteria in the KPL could have been the result of the significant content of phosphates, which augmented their survival in the leachate [58]. Coliform bacteria have recently been recognized as one of the most problematic pollutants in an old leachate [59].
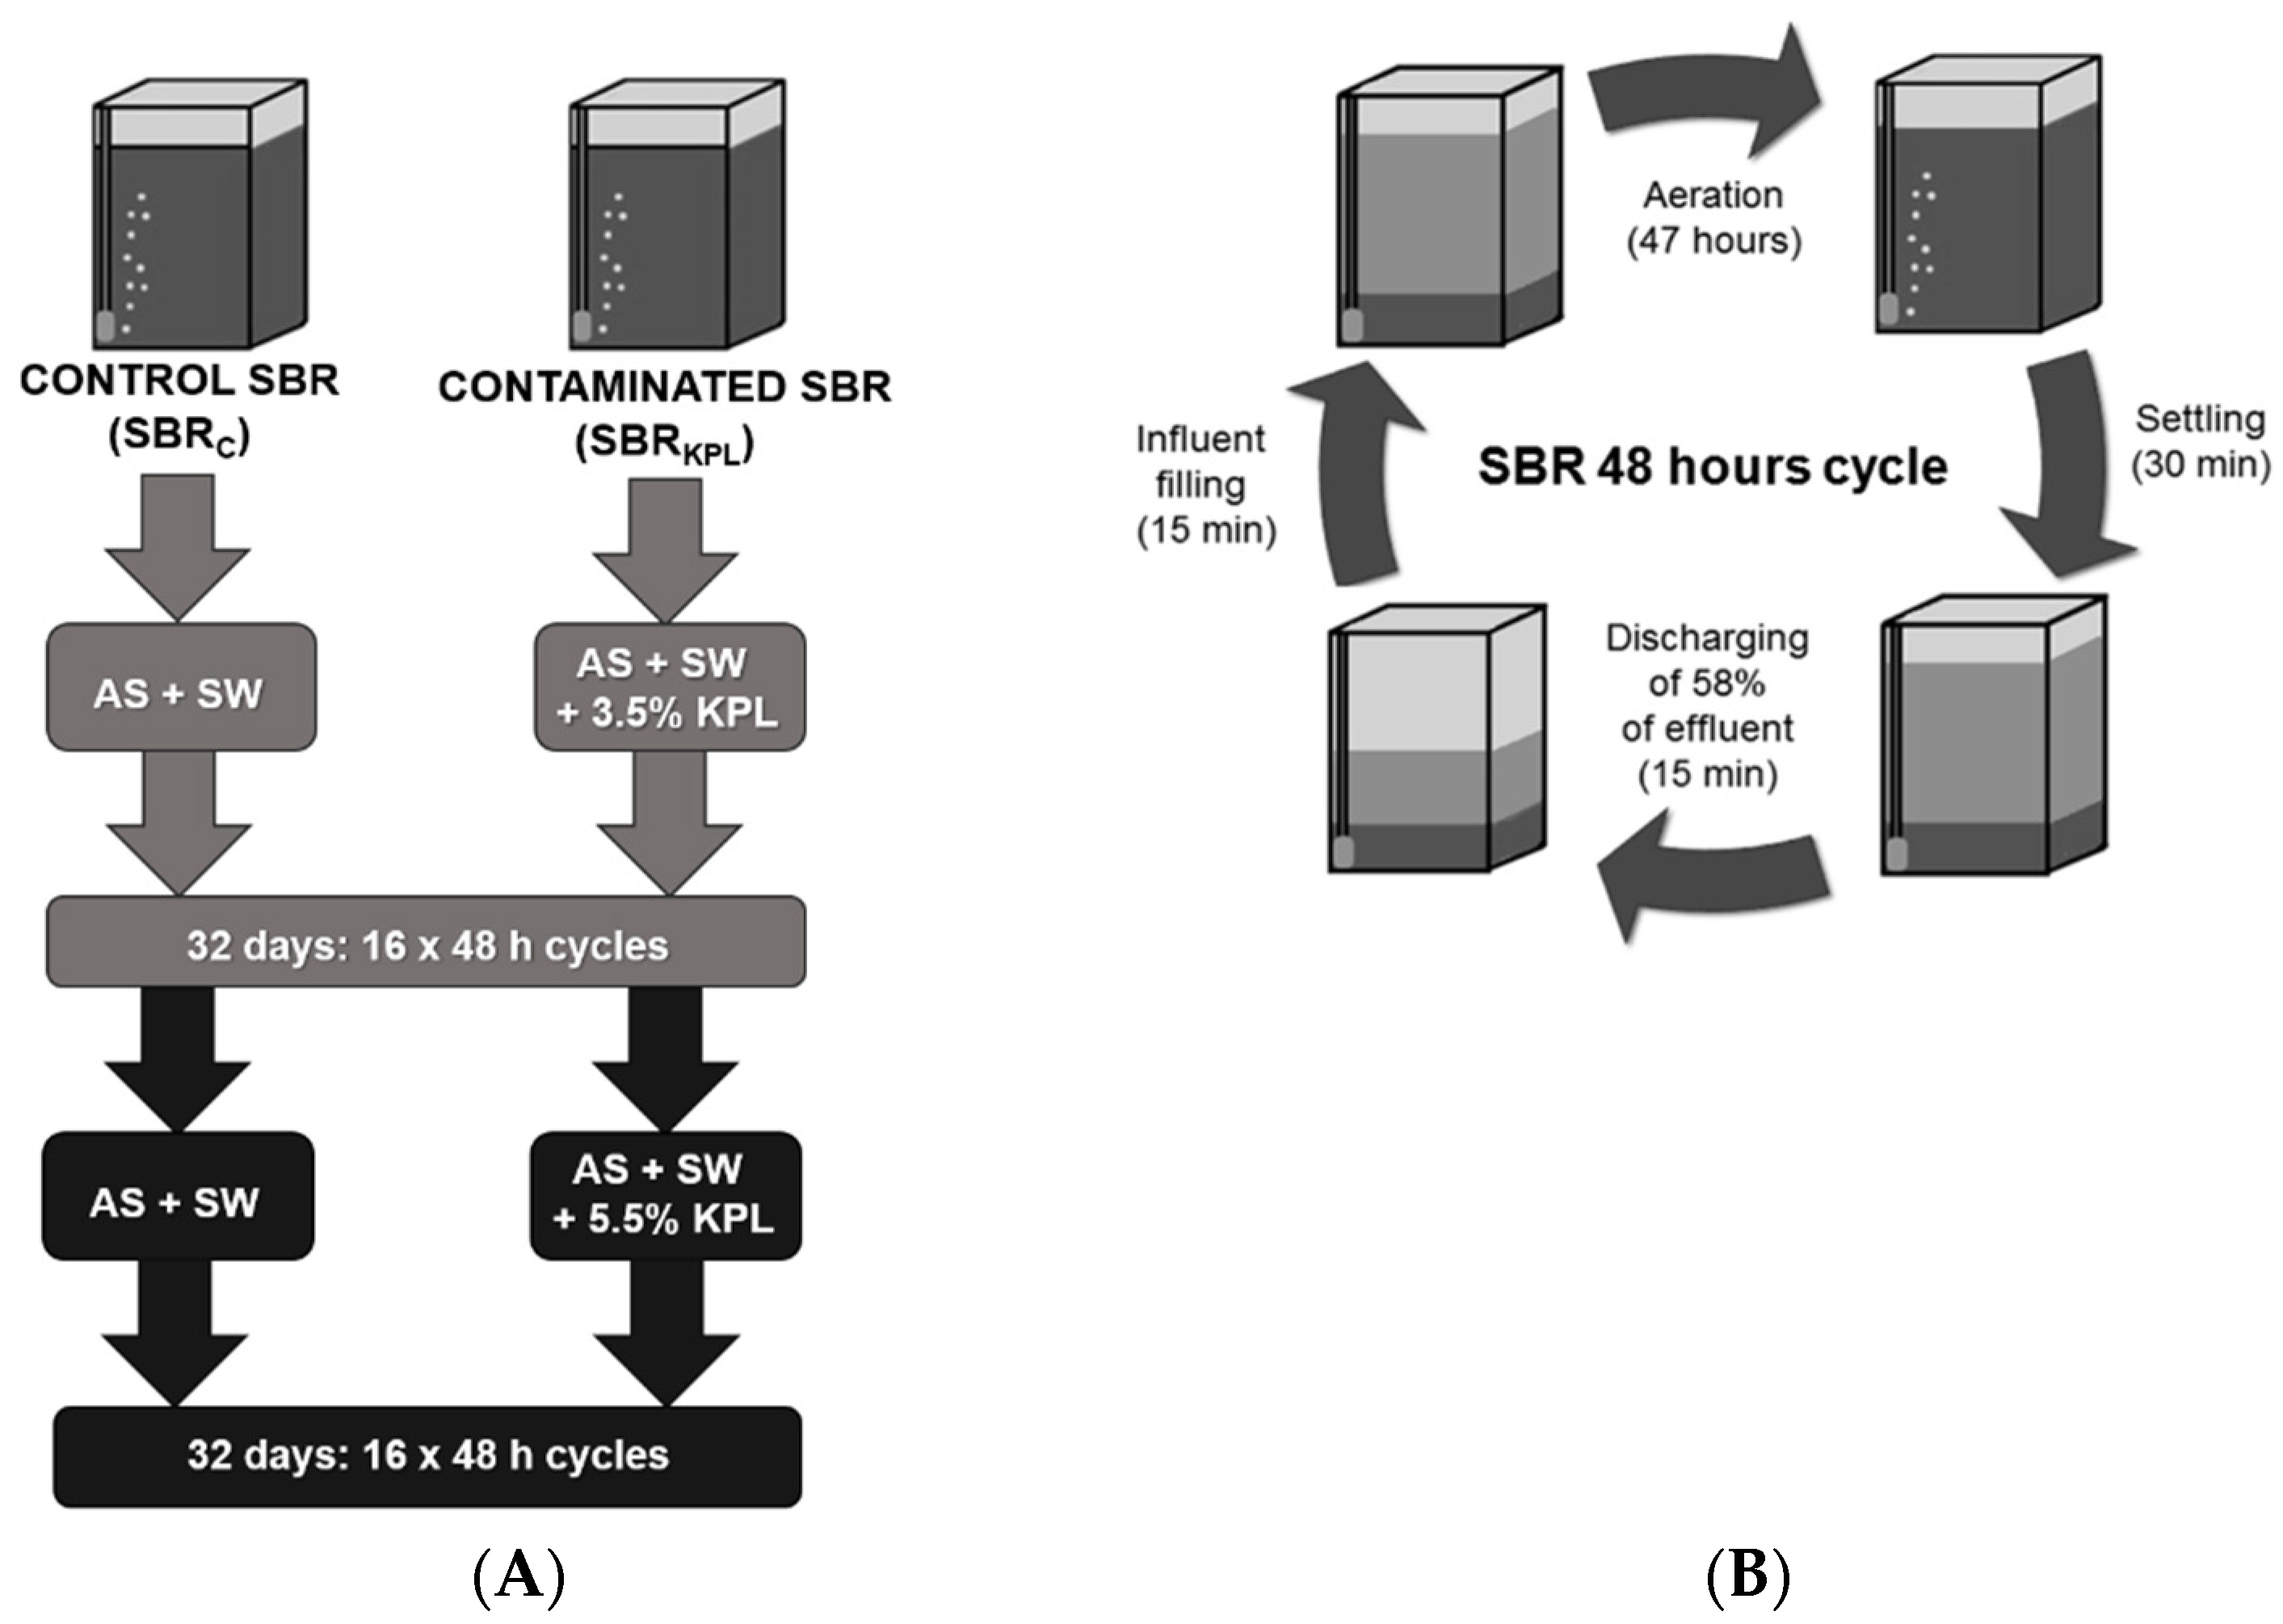
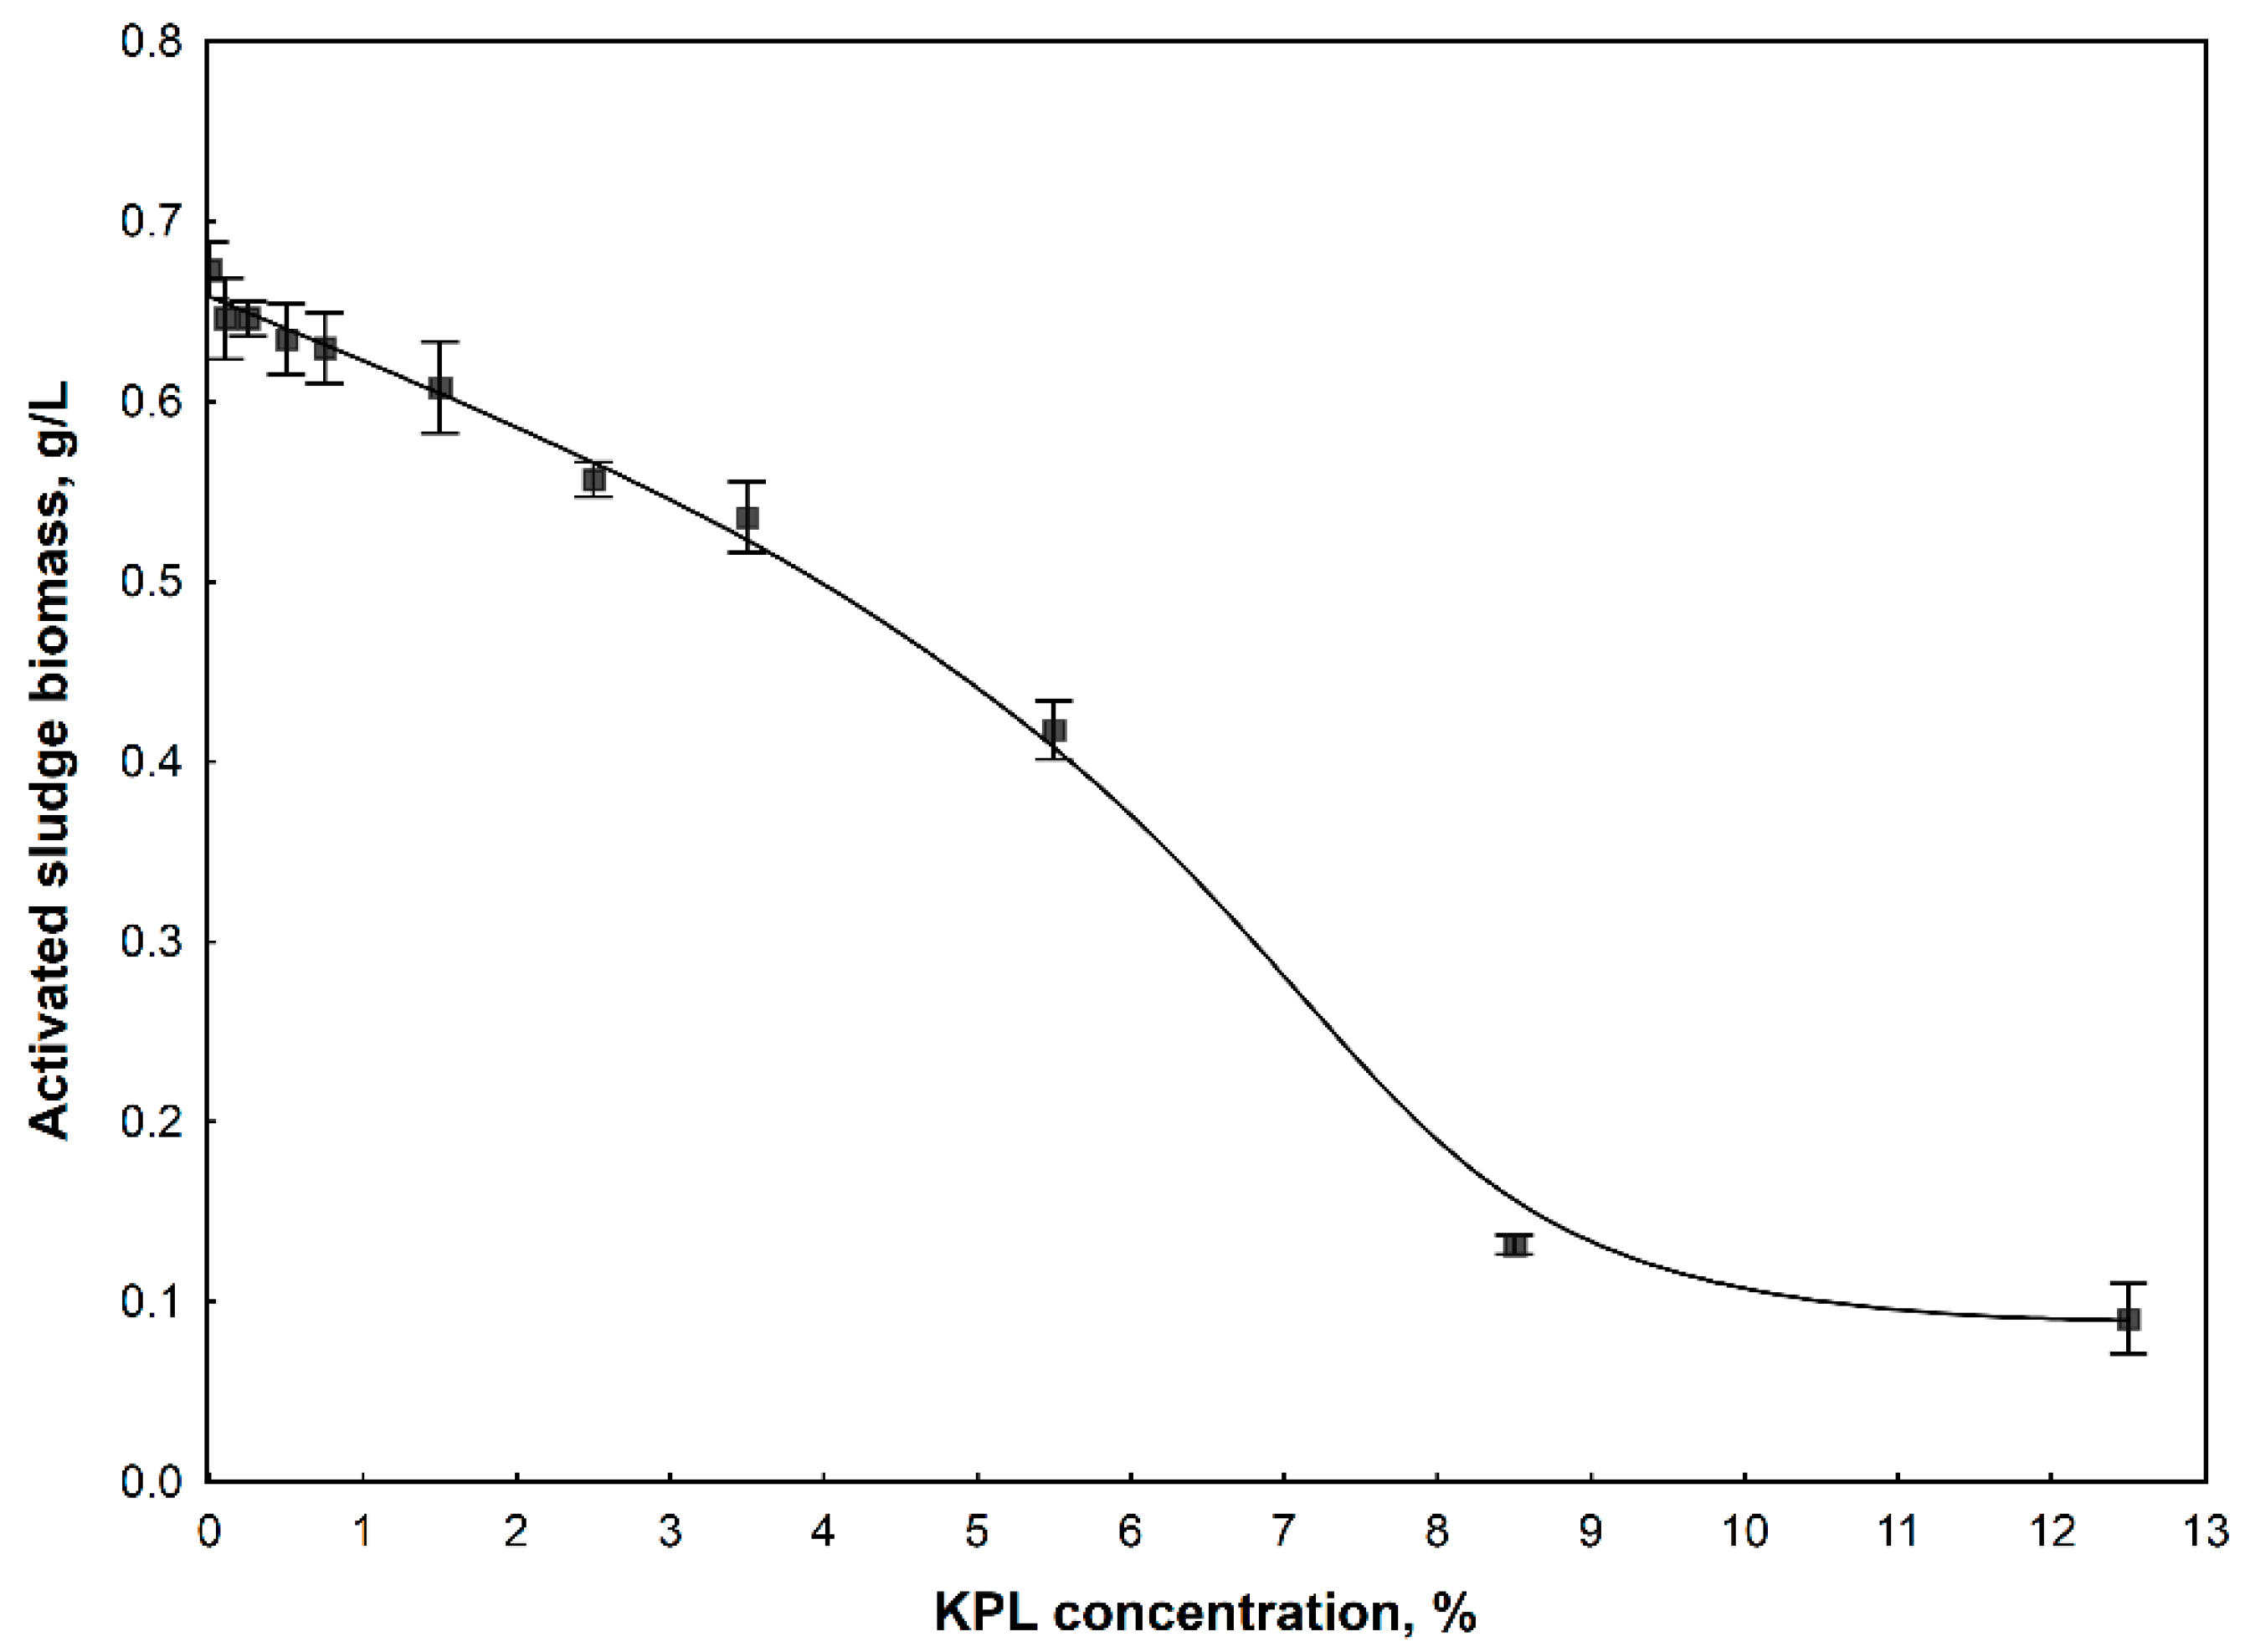
The AS process is often indicated as being a good solution for leachate treatment [53]. However, the information about the leachate toxicity towards the sludge microbial communities is very scarce. It is known that individual xenobiotics are toxic to microorganisms to a different extent [60]. However, the leachate toxicity is a result of the synergistic or antagonistic effects of various contaminants [61]. Therefore, the volumetric ratios of the leachate that is added to domestic wastewater usually do not exceed 10% [2,61,
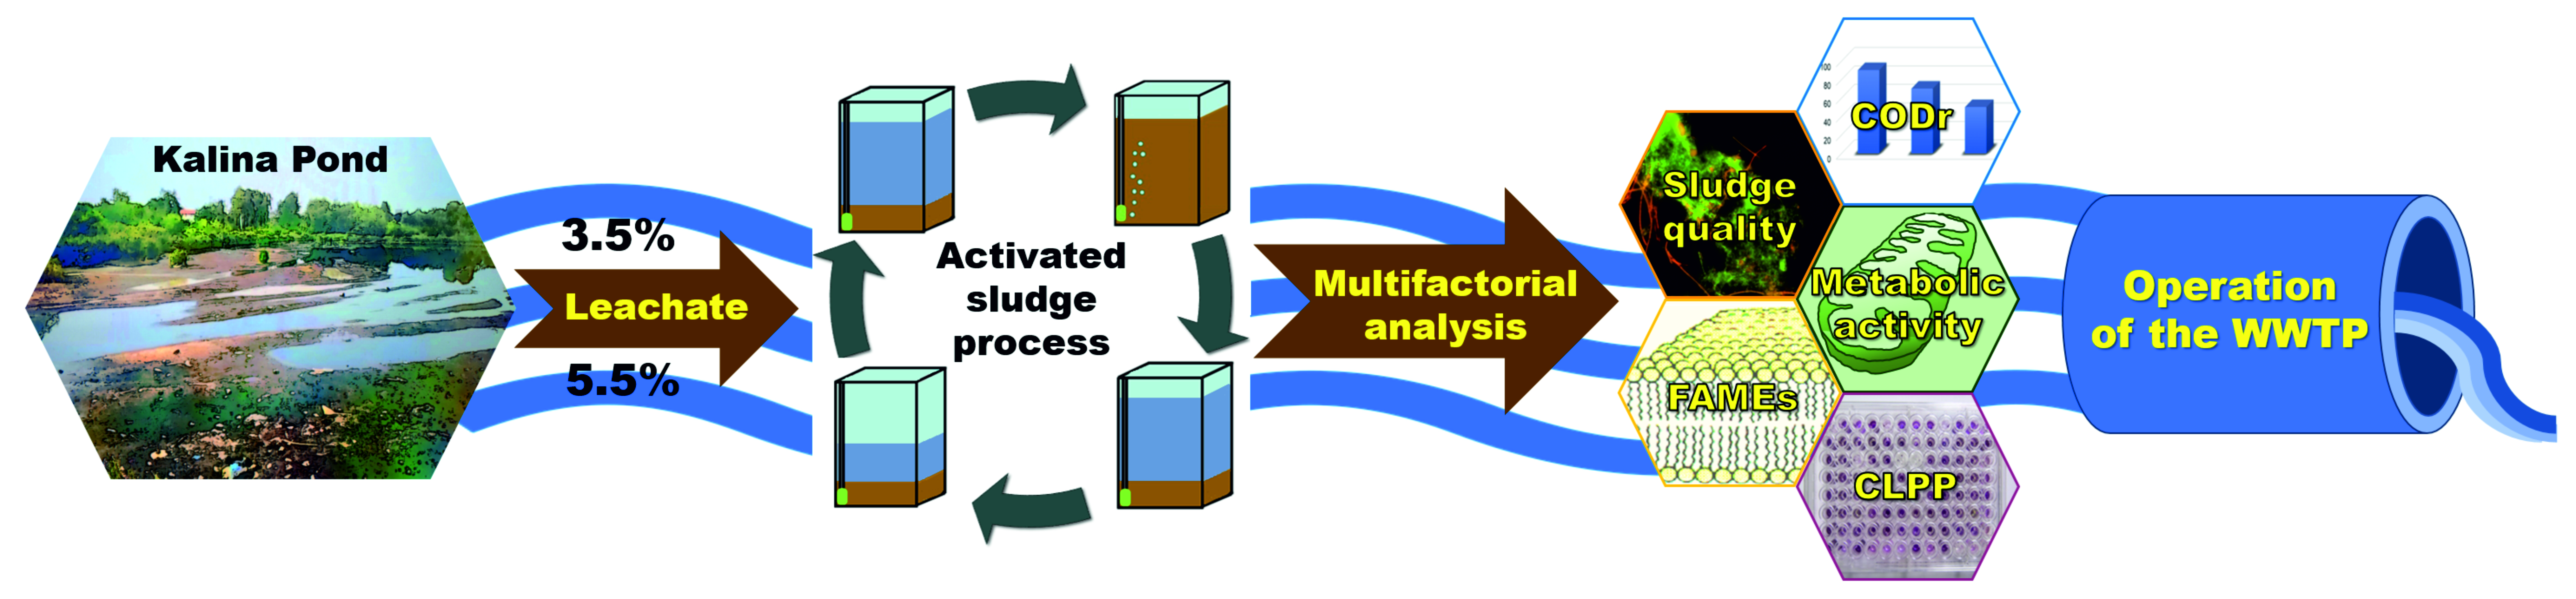
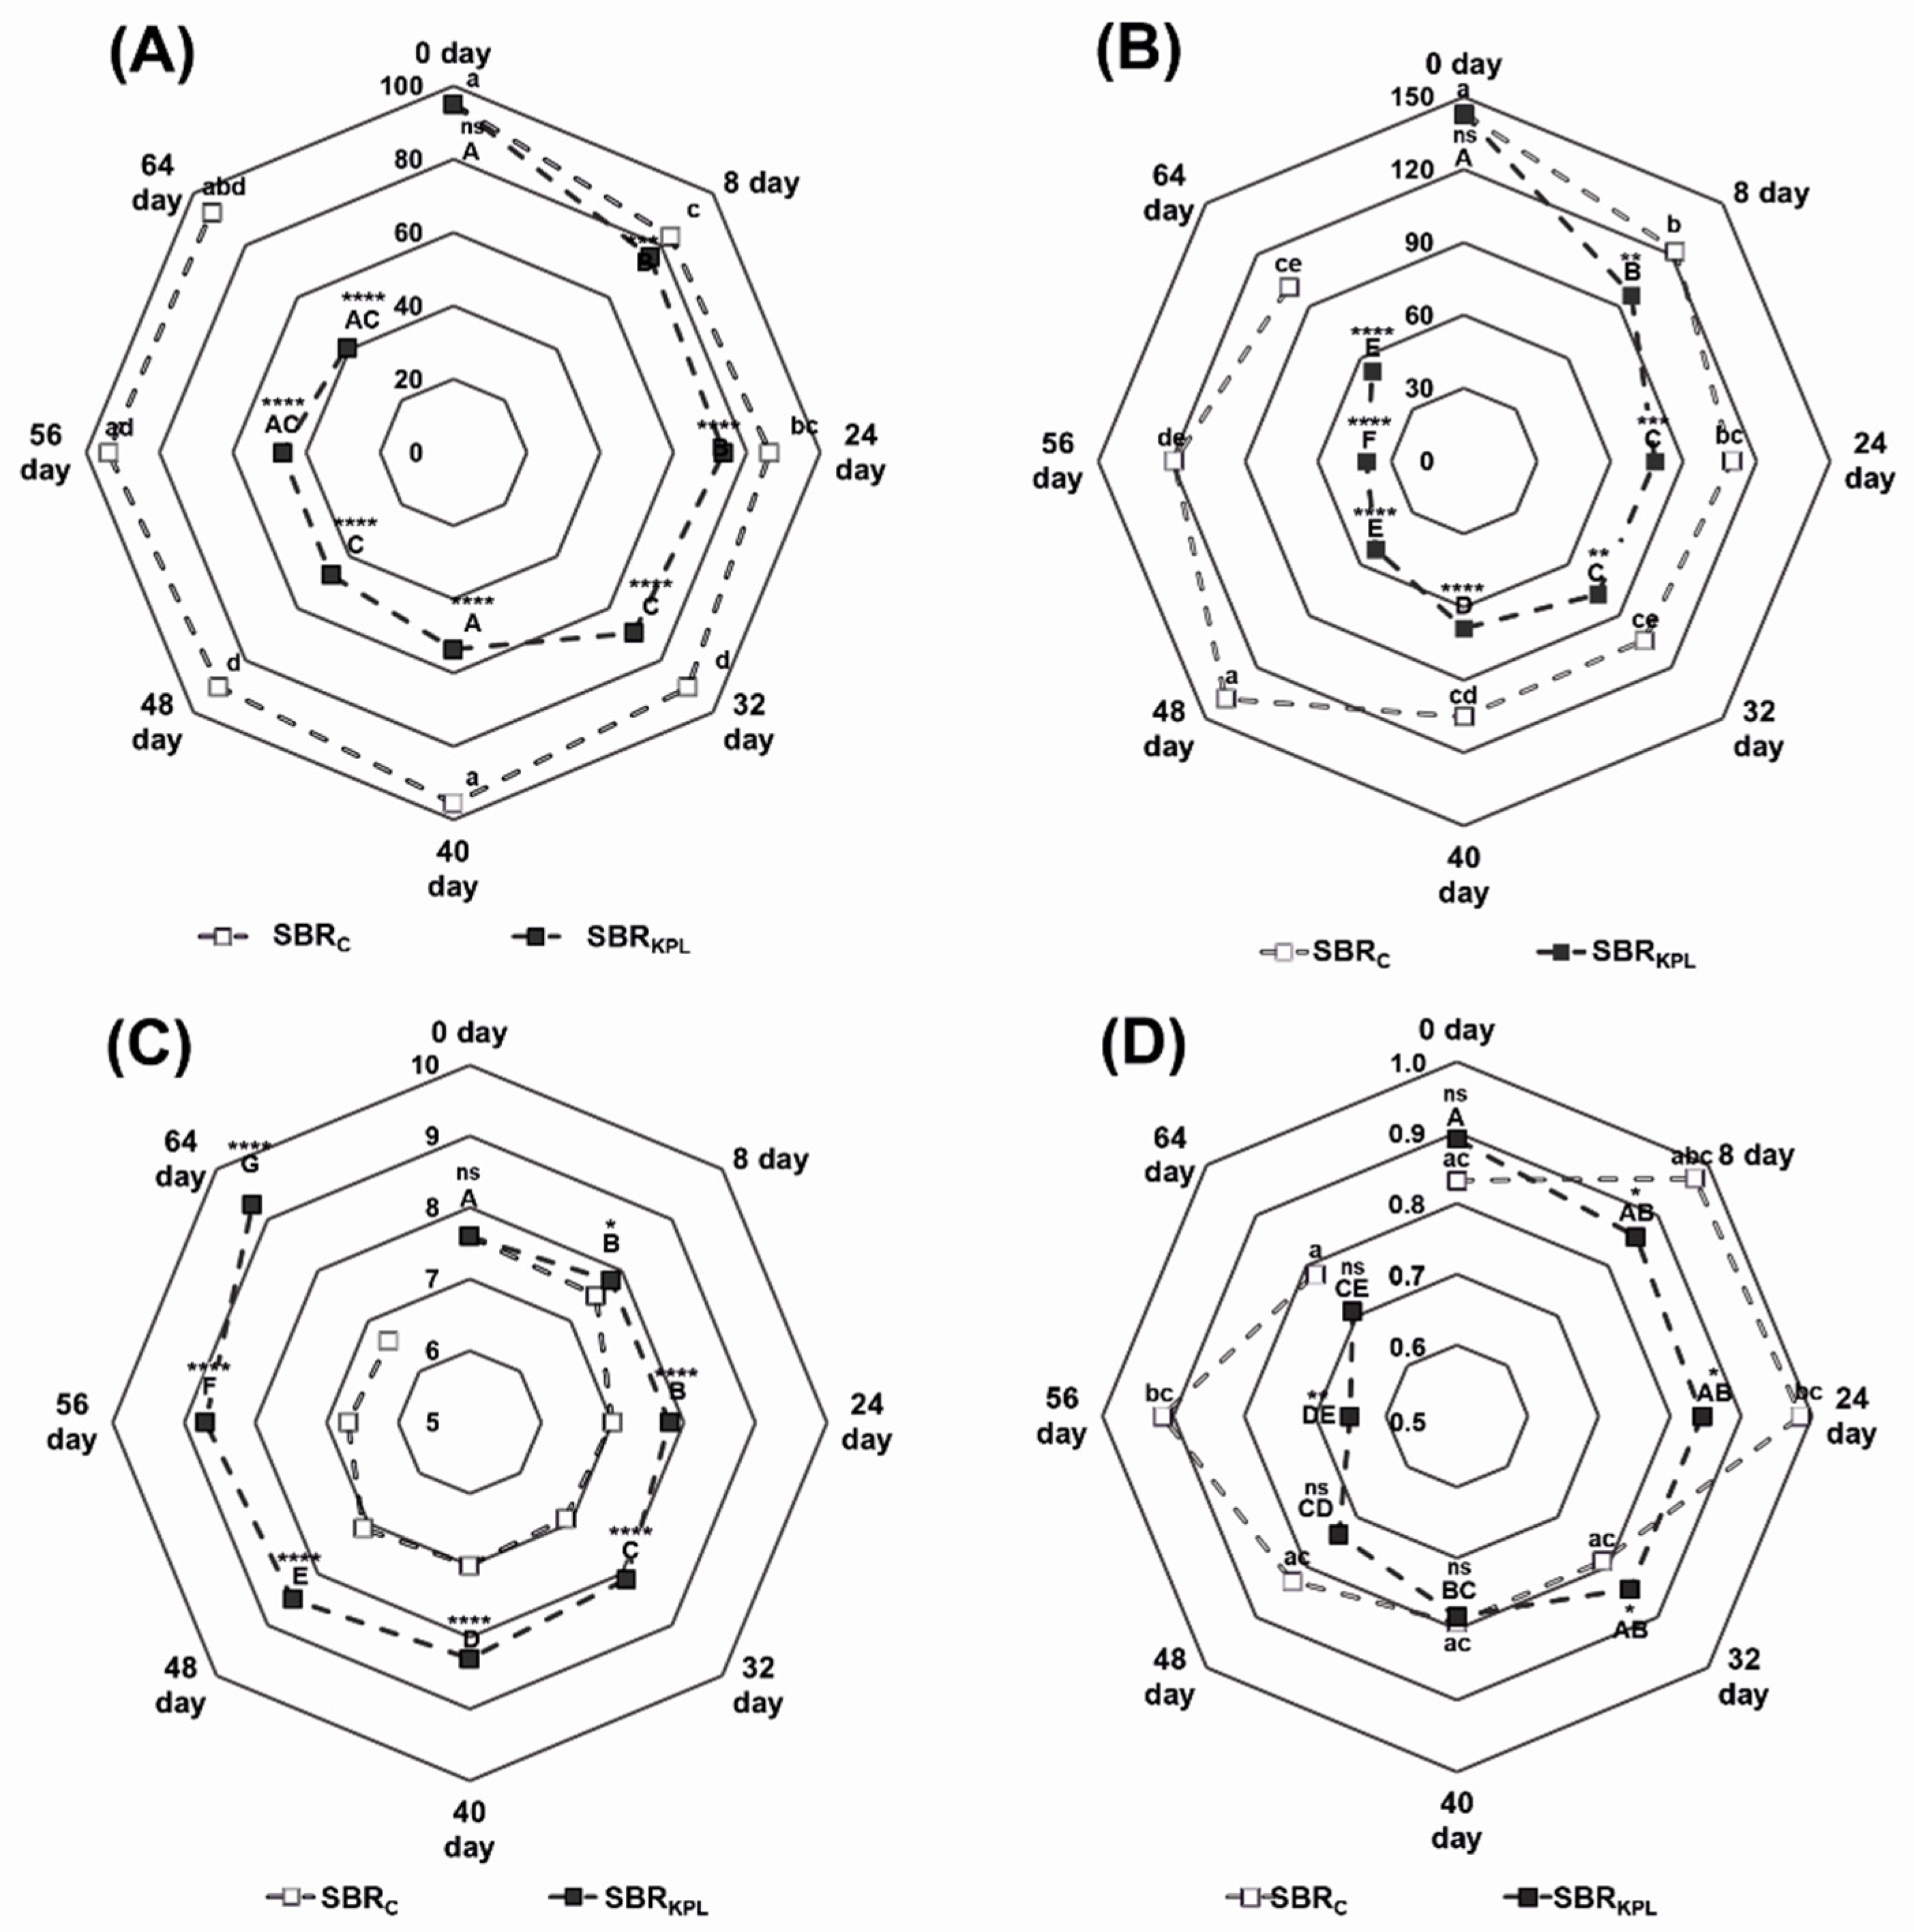
62]. This study showed that the KPL had an extremely detrimental effect on the AS microorganisms, even in the presence of 6.69%. The long-term presence of the KPL in the effluent significantly disrupted the biological treatment of the wastewater in the SBR by affecting its operational parameters. It was found that the poor quality of the leachate resulted in a gradual decrease in CODr in the SBRKPL from 95% to 69% and 41% during the cotreatment with 3.5% and 5.5% of the leachate, respectively. A similar phenomenon has been observed in the decrease in CODr from 90% to 70% and 51% in a bench scale reactor cotreated with 2% and 5% of the landfill leachate, respectively [4].
The appropriate pH is a crucial factor for the stable operation of a sewage plant because it affects the strength and surface charge of the AS flocs [63]. Extreme pH conditions can lead to an inhibition of the growth of the AS microorganisms [64]. In addition, the removal of xenobiotics, such as phenol and its derivatives, from the wastewater by the AS may also decrease with an increase in the effluent pH [65,66]. It can be concluded that a gradual increase in the pH value of more than 9.0 in the SBRKPL negatively affected the microbial biodegradation of the contaminants in the sewage. Two-fold and 3-fold decreases in the ability of AS to settle were observed with an increase in pH from 7.6 to 8.1 and 9.3 in the SBRKPL32d and SBRKPL64d, respectively. Similarly, Ghanizadeh and Sarrafpour [67] found that an increase in pH from 5.7 to 9.0 resulted in a significant decrease in the SVI from 96 to 44 mL/g. A considerable drop in the SVI from 90 and 80 mL/g to 30 and 20 mL/g was also observed with an increase in the concentration of leachate from a municipal solid waste dumpsite in wastewater from 2.5 to 15% and 40% in India and Poland, respectively [16,68]. An SVI below 70 mL/g may result in the turbid effluent associated with the dispersed growth of microorganisms and the formation of small pin flocs [69].
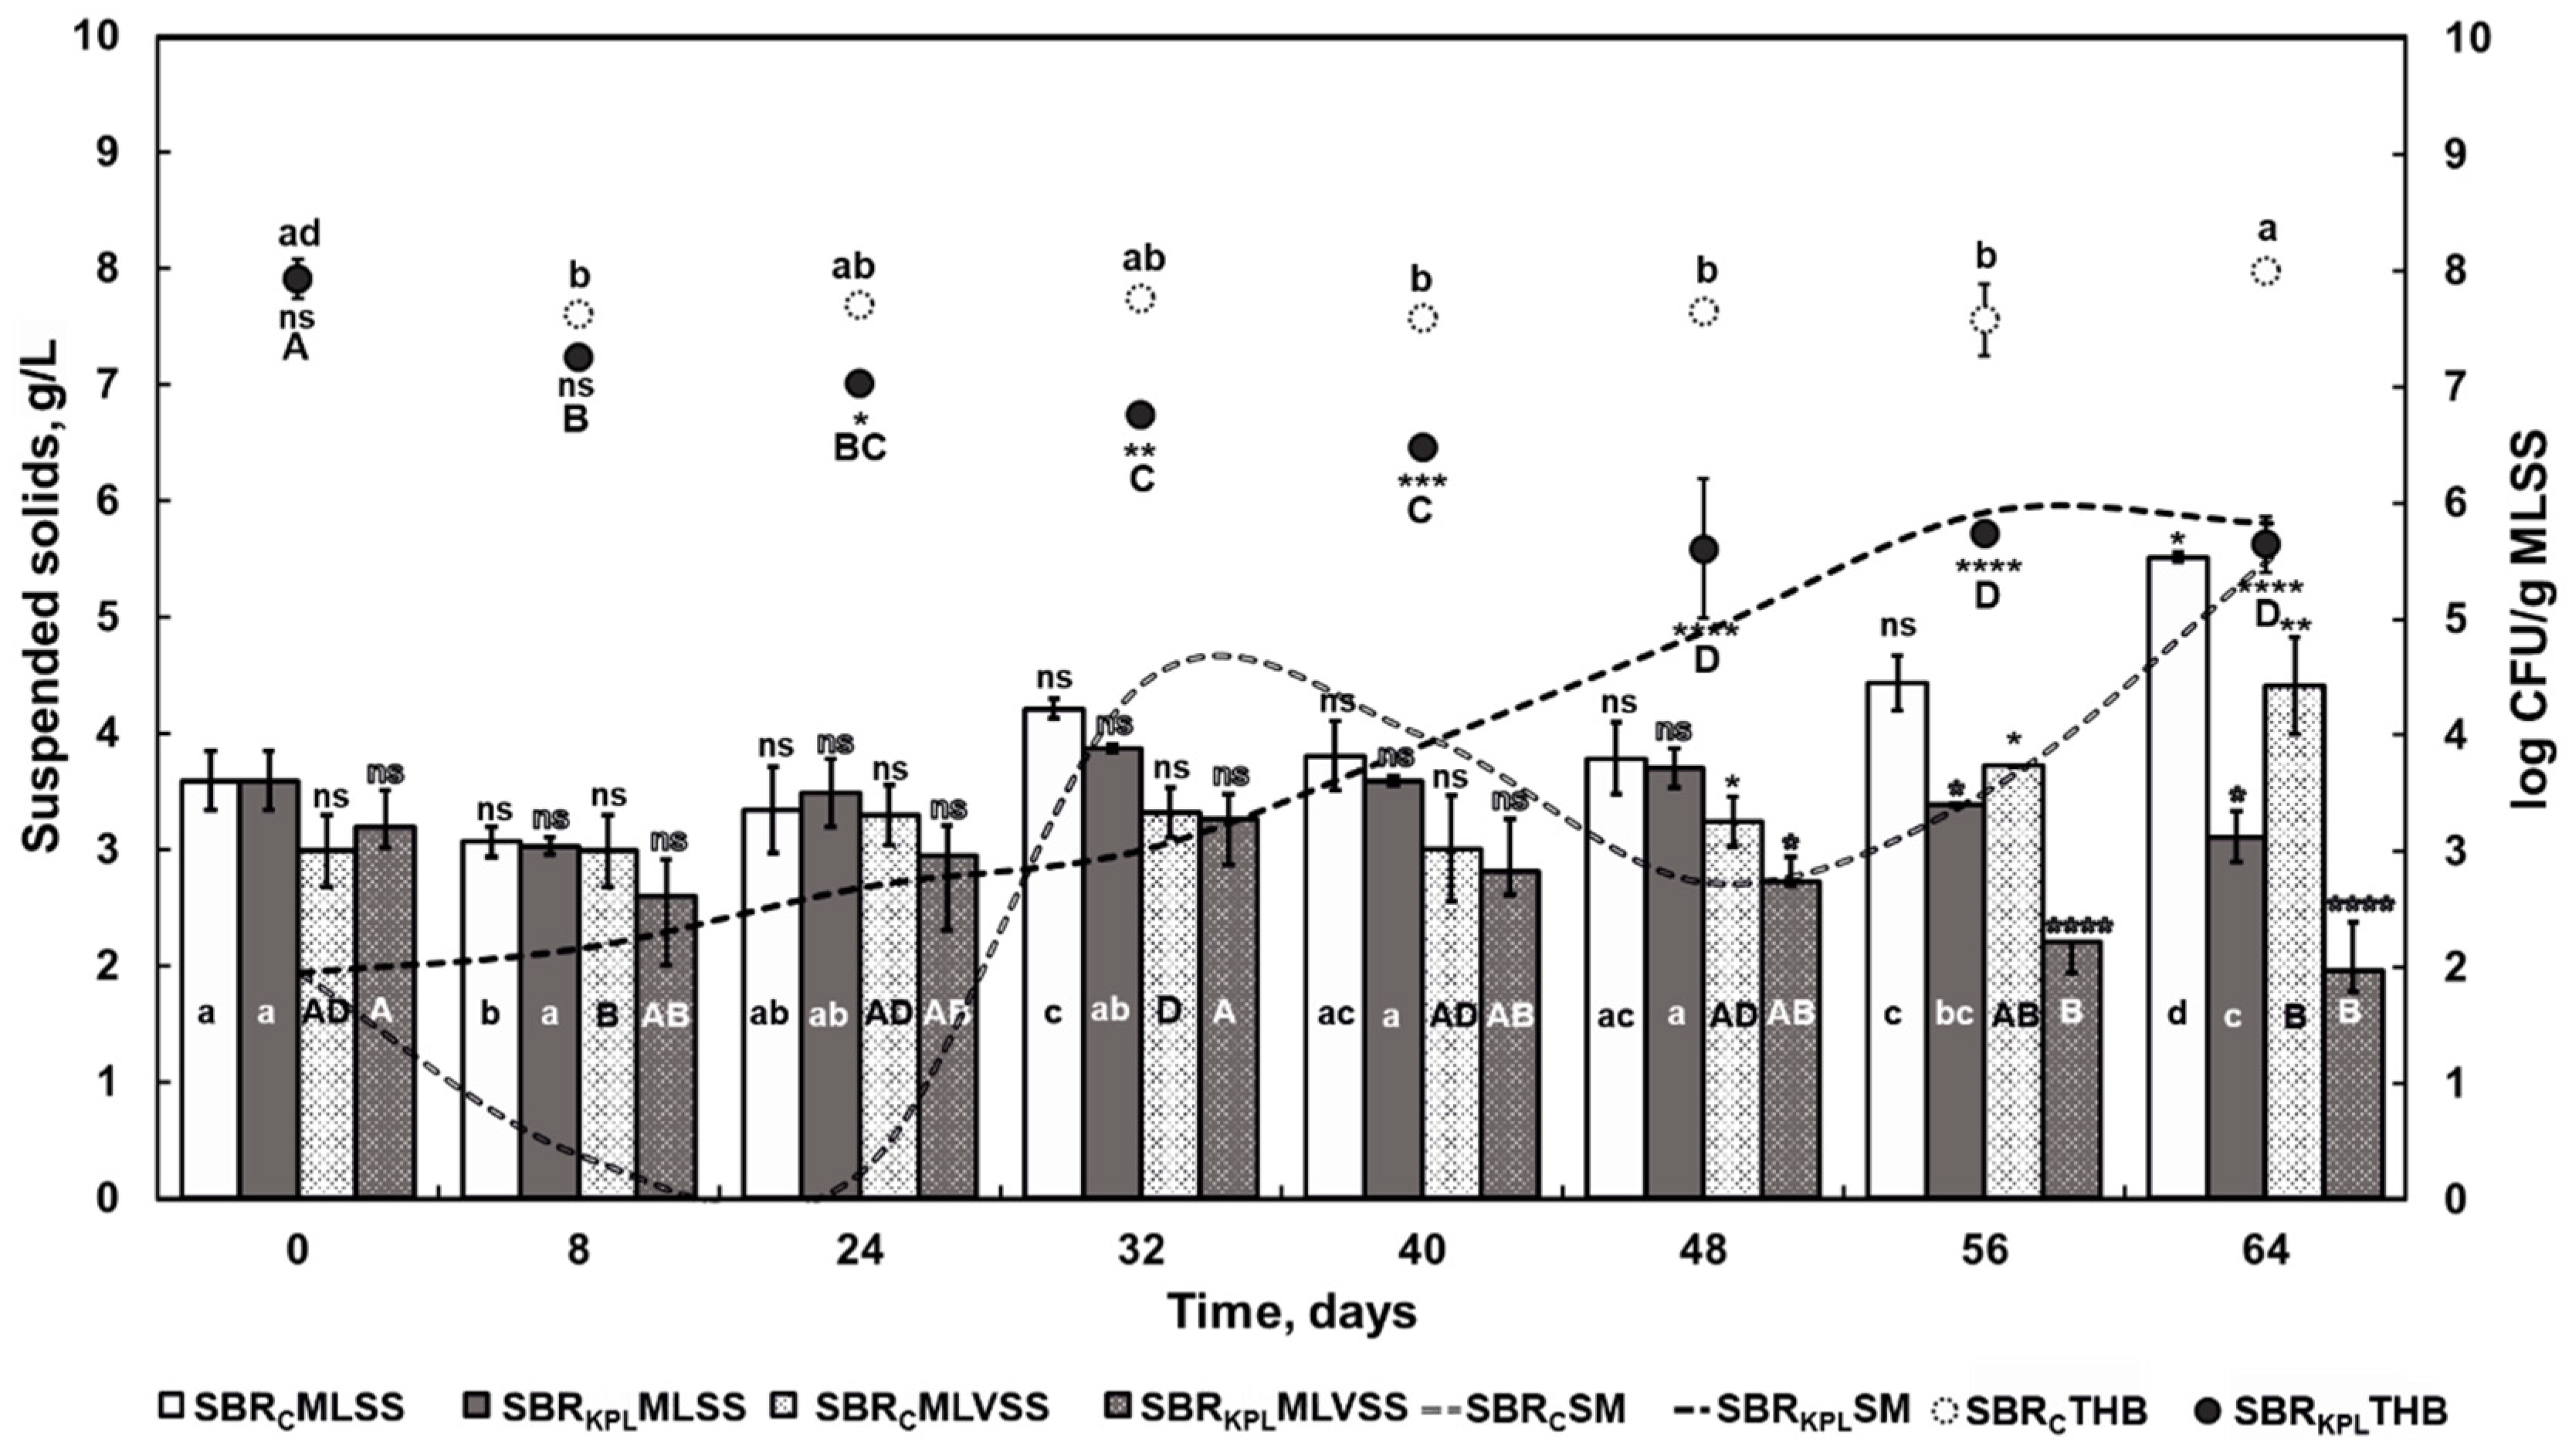
The next critical factor for ensuring the biological wastewater treatment process and thus the correct operational behavior in the sewage plants is AS concentration. In this study, the MVLSS in the SBRKPL64d constituted 63% of the MLSS concentration and was below the appropriate level for pollutant removal in the SBR system [70]. It can be concluded that the compounds present in the KPL may not be used for the maintenance and growth of the AS microorganisms. Moreover, their occurrence in the SBR may inhibit or slow down the utilization of the readily biodegradable components present in the sewage [71]. In this study, the inhibition of the utilization of 10 and 12 substrates in an EcoPlateTM was observed for SBRKPL after cotreatment with 3.5% and 5.5% KPL compared to SBRCTL, respectively. The microorganisms in the SBRCTL were able to use the ingested biodegradable matter in the wastewater to synthesize the new biomass, which resulted in an increase of the MVLSS and MLSS. The increase of suspended matter in the SBRC may be attributed to the increase in the amounts of the extracellular polymeric substances as a result of the presence of Zooglea sp. in the wastewater. A decrease in the microbial biomass in the SBR
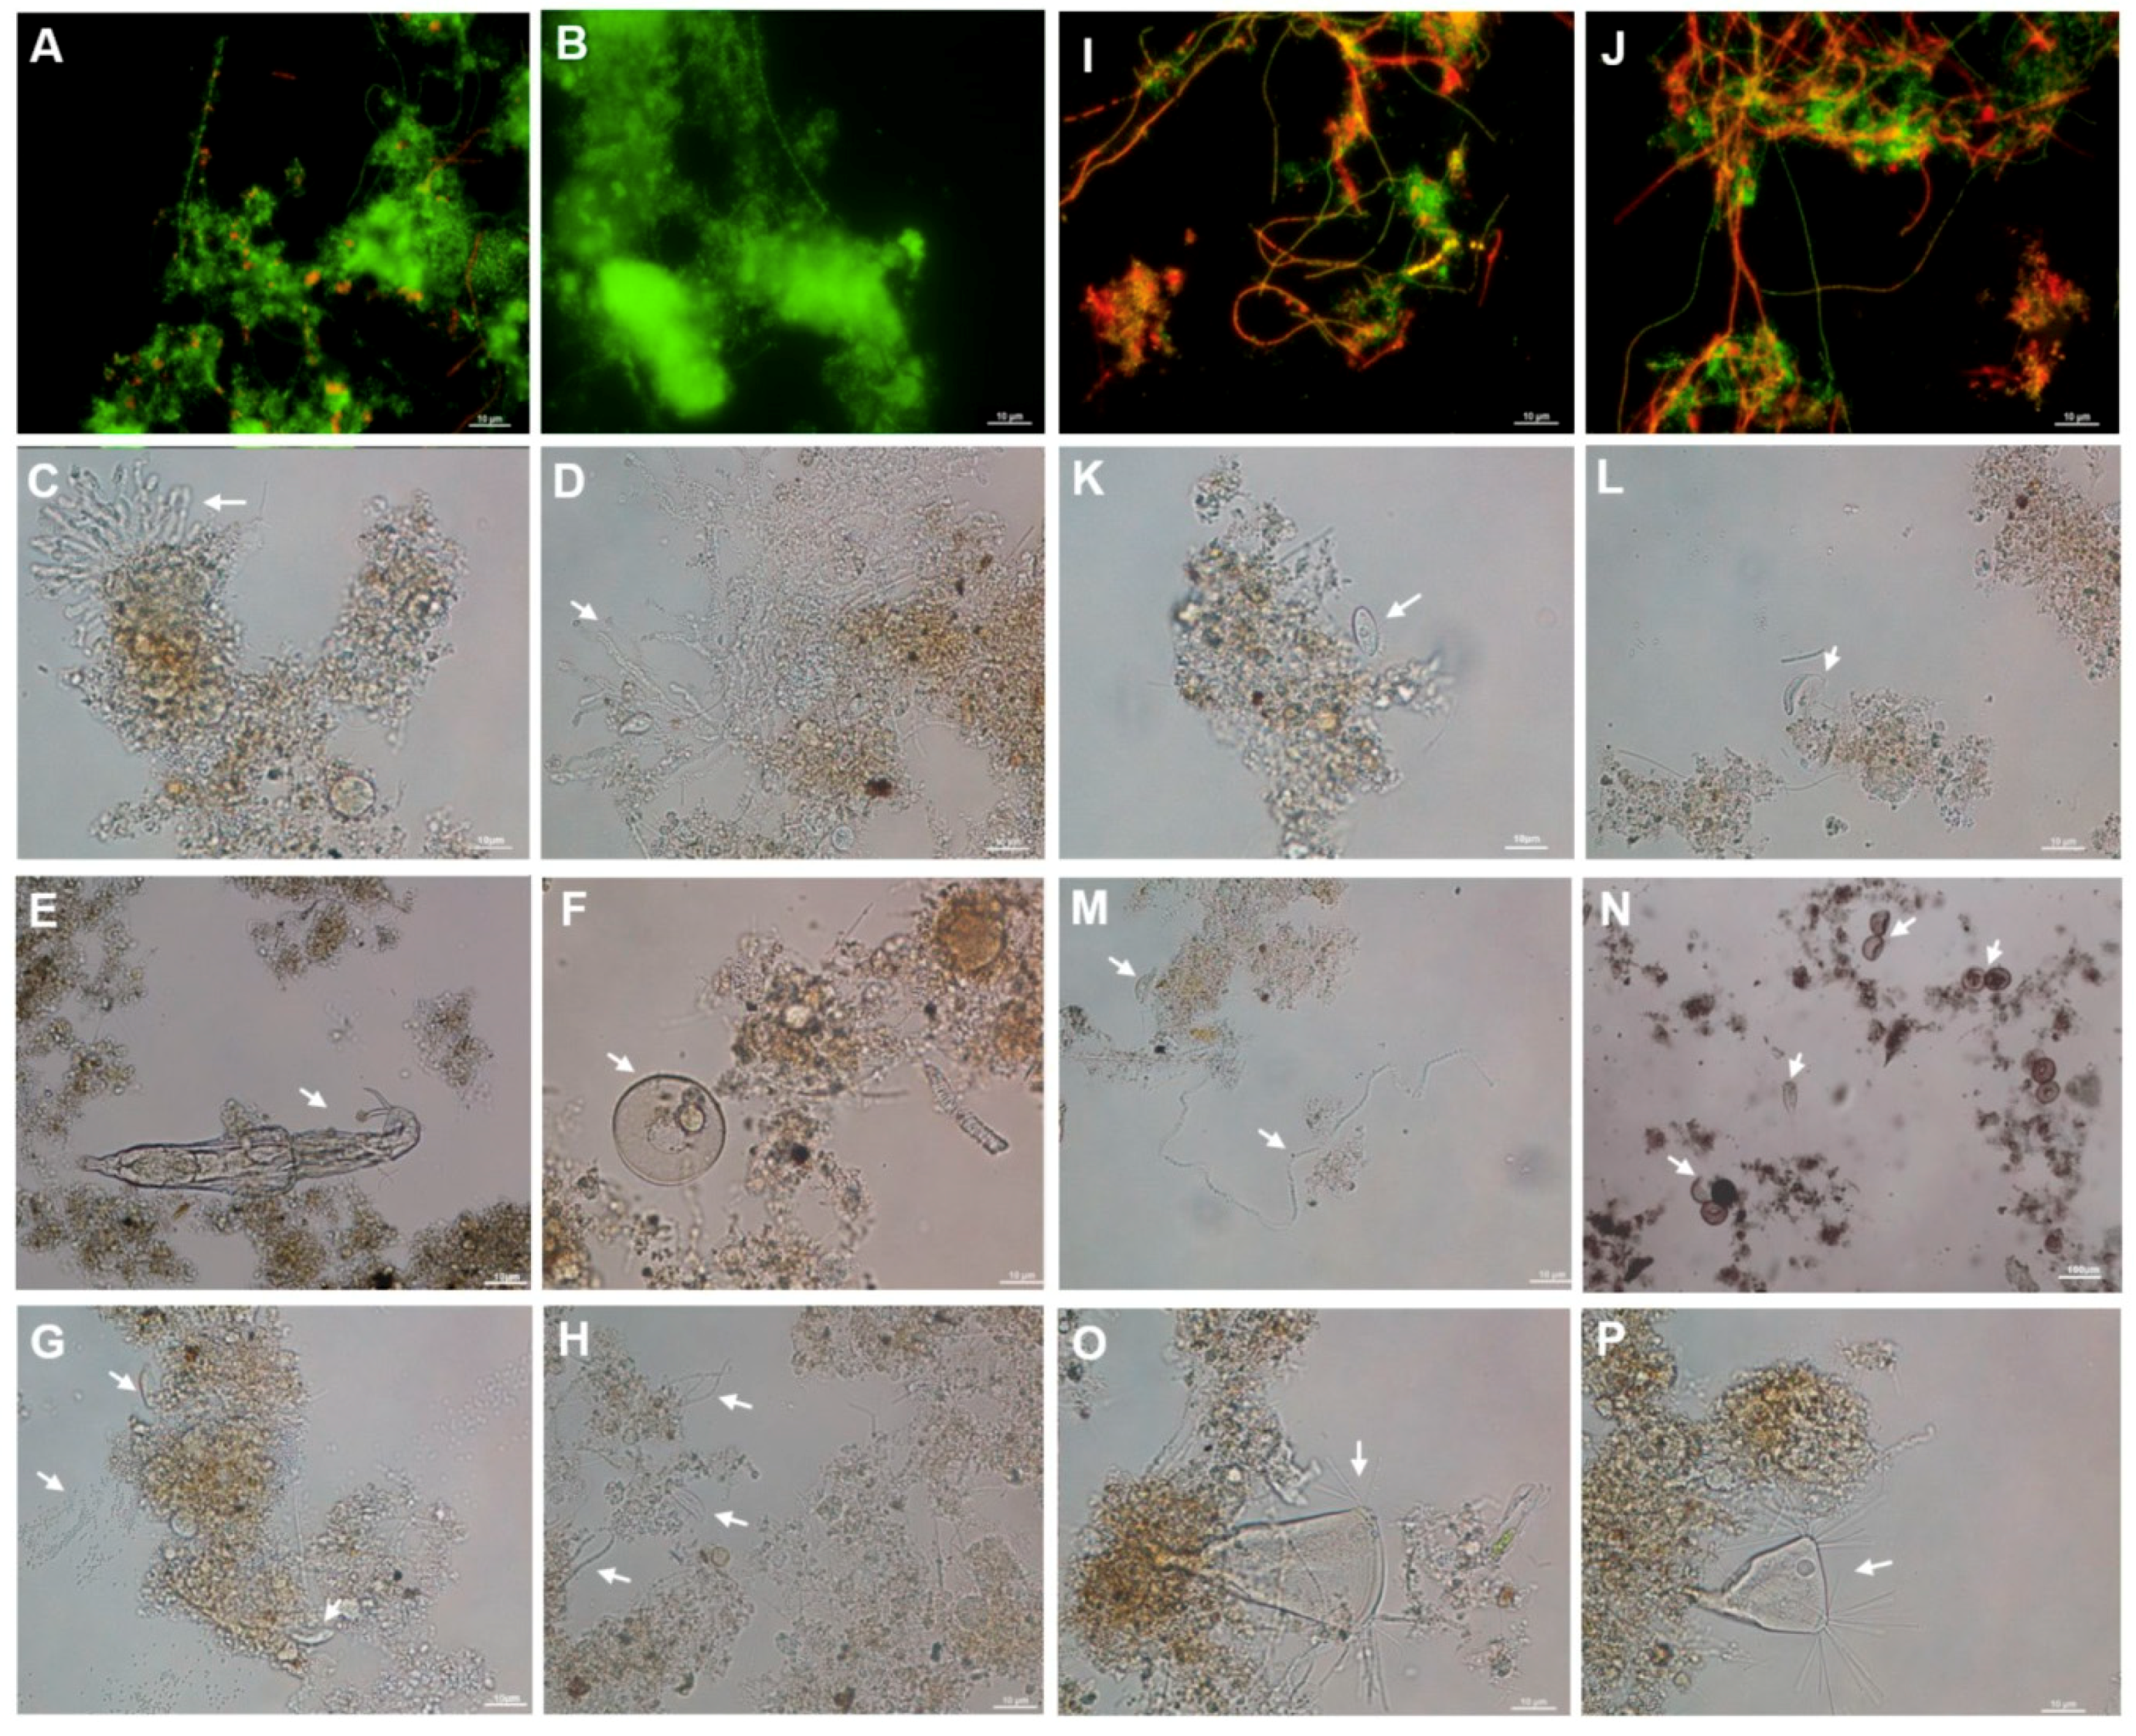
KPL directly affected the structure and quality of the AS flocs, which was manifested in a change in the size and shape of the aggregates, which became smaller, looser and more irregular than those in the SBRC. Similarly, Pieczykolan et al. [16] observed a gradual increase in the size of the small flocs when the concentration of the leachate exceeded 15%. The cotreatment with KPL also resulted in a decrease in the abundance of protozoan in the AS. The decrease in the number of Arcella, which was the most common genera in the AS, as well as the appearance of individuals from the Vorticella genus and a significant number of filamentous bacteria in the SBRKPL may be connected with the presence of leachate in the wastewater and may be correlated with a decrease in the effectiveness of the cotreatment. In the research by Czapluk et al. [72], more diverse protozoan and metazoan communities were observed in the WWTP in which domestic effluent predominated, while ciliates and metazoans did not occur or were found at very low densities in the AS that had primarily received industrial wastewater.
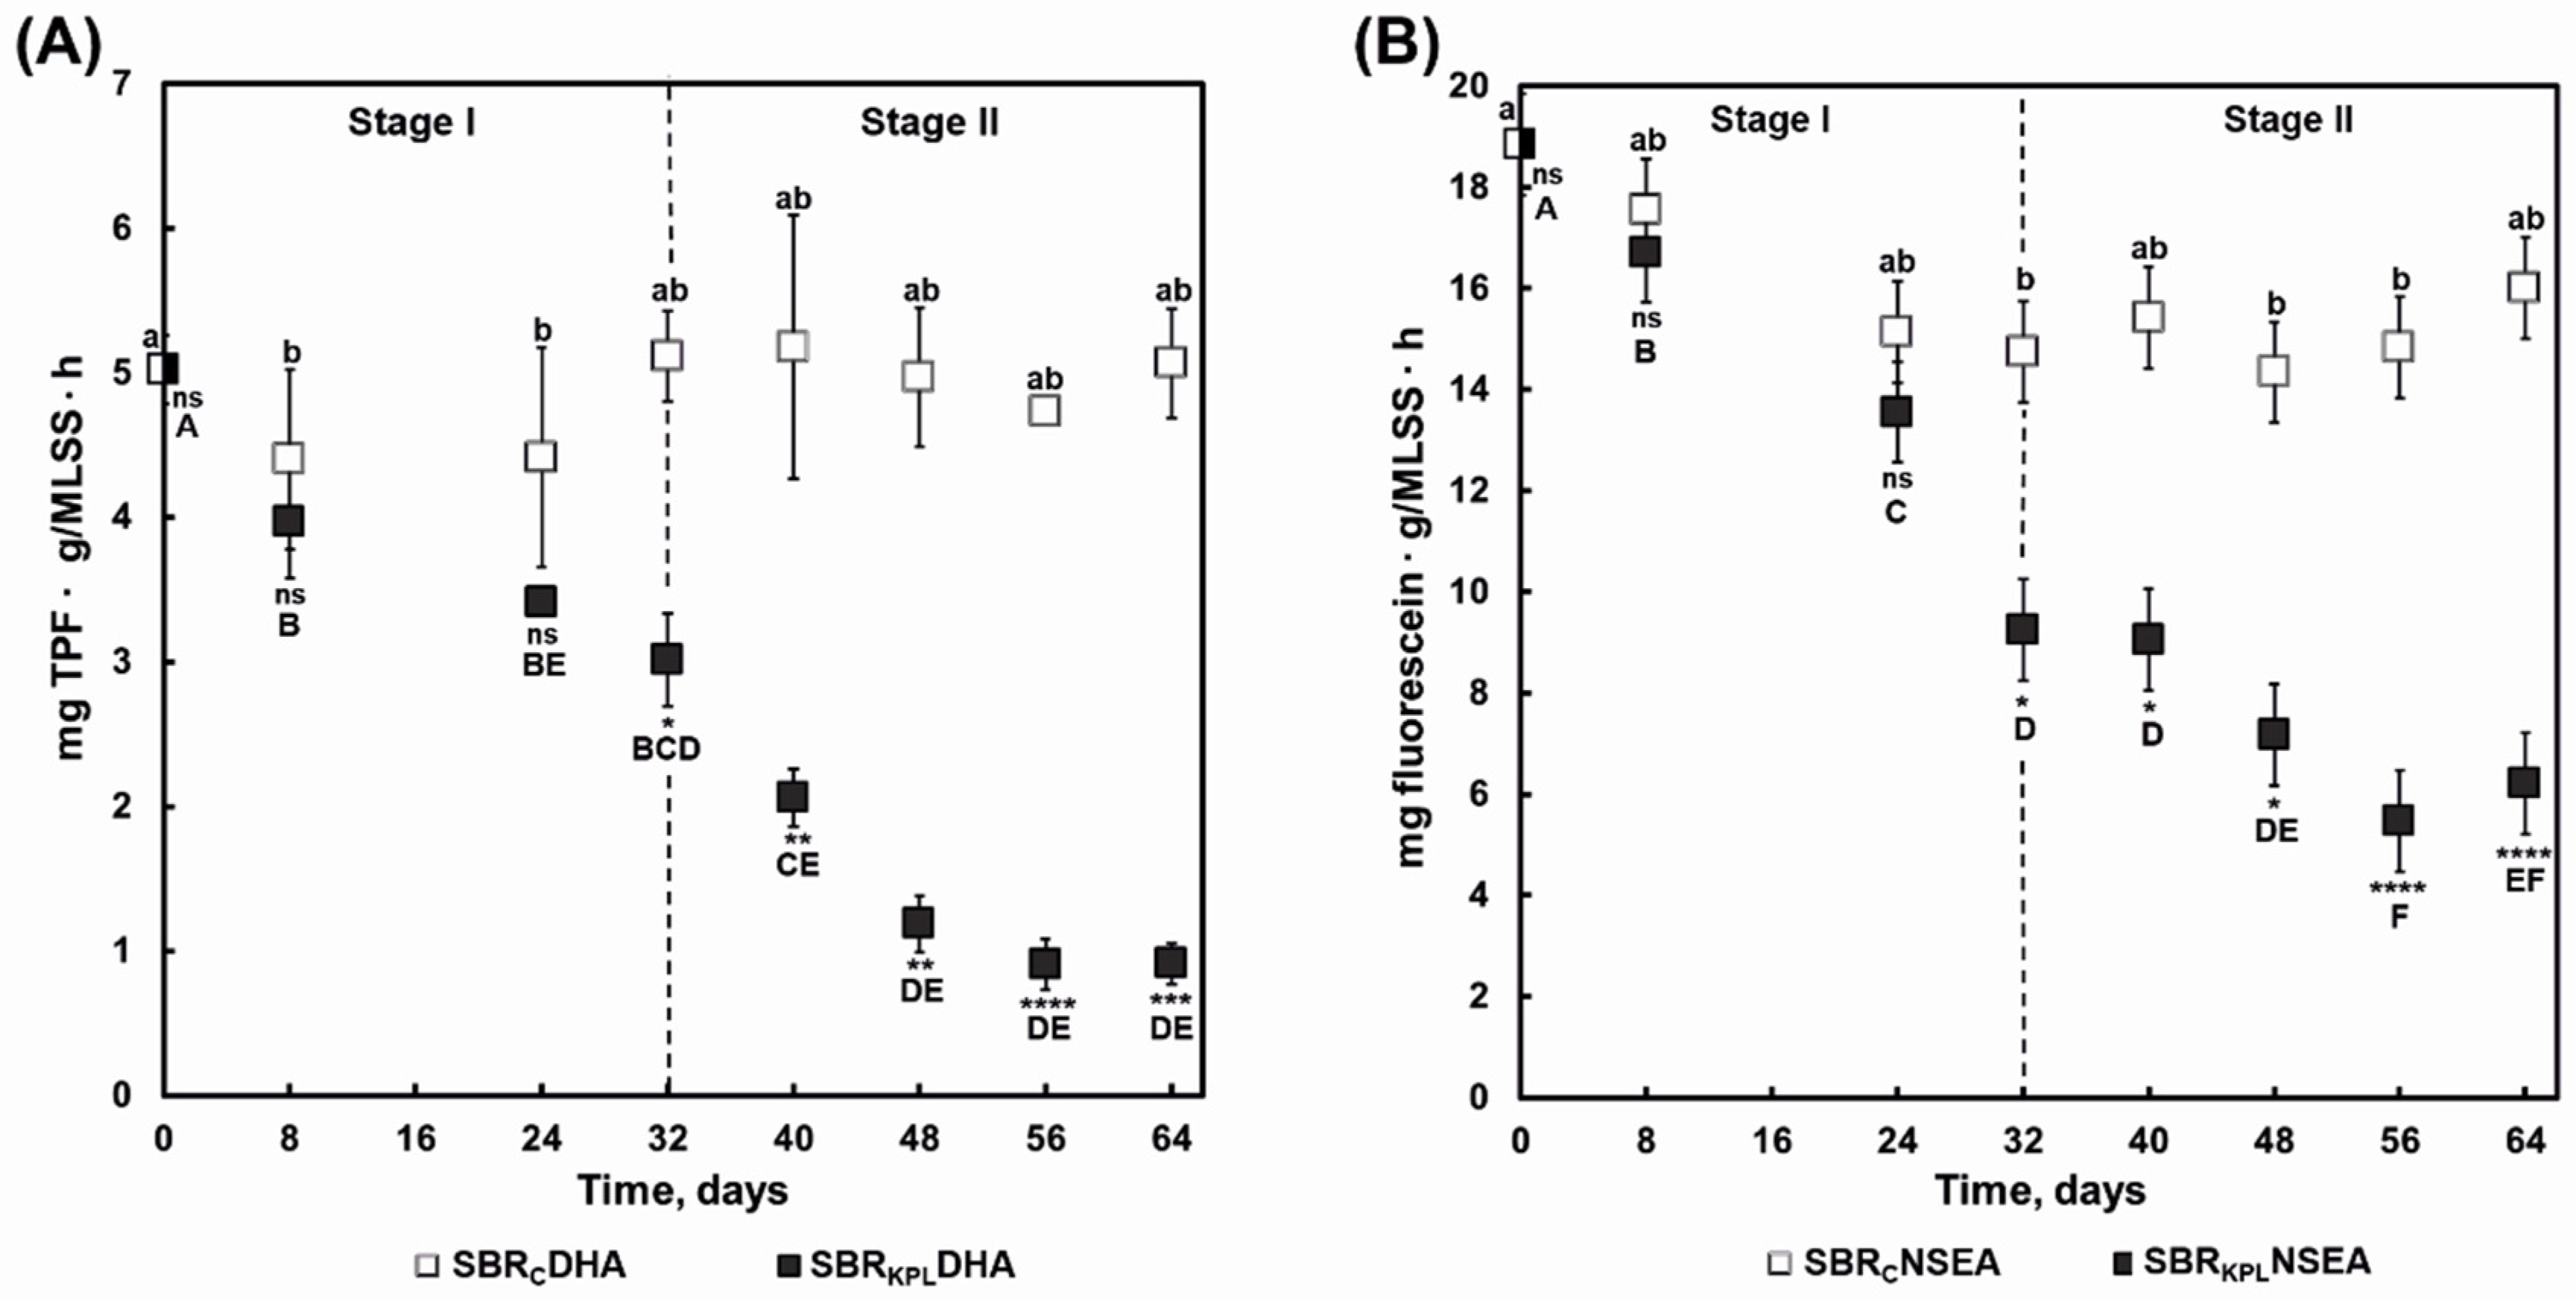
Because of their quick reaction to the changes in the ambient environment, the AS microorganisms are considered to be a sensitive bioindicator of the response of biological wastewater treatment units to various stress factors and perturbations [73]. The results presented in this study indicate that the addition of the KPL into the wastewater significantly reduced the enzymatic activity of the dehydrogenases and esterases in the AS, which could not recover after long-term exposure to the leachate. Previous literature indicated that the activity of esterases and dehydrogenases may decrease in the AS in the presence of the more complex contaminants occurred in the leachate [74,75,76]. Although the activity of the AS microorganisms is extremely important for appropriate functioning of this ecosystem, this parameter is hardly ever considered during the evaluation of the effect of a leachate on the WWTP functionality. The impact of different concentrations of the leachate from the WENT landfill (China) on dehydrogenase activity in an AS reactor was only described by Li and Zhao [56], who observed a decrease in the respiratory activity by 12, 16, 17, 32, and 47% in the presence of 1, 2, 4, 9, and 20% of the leachate, respectively.
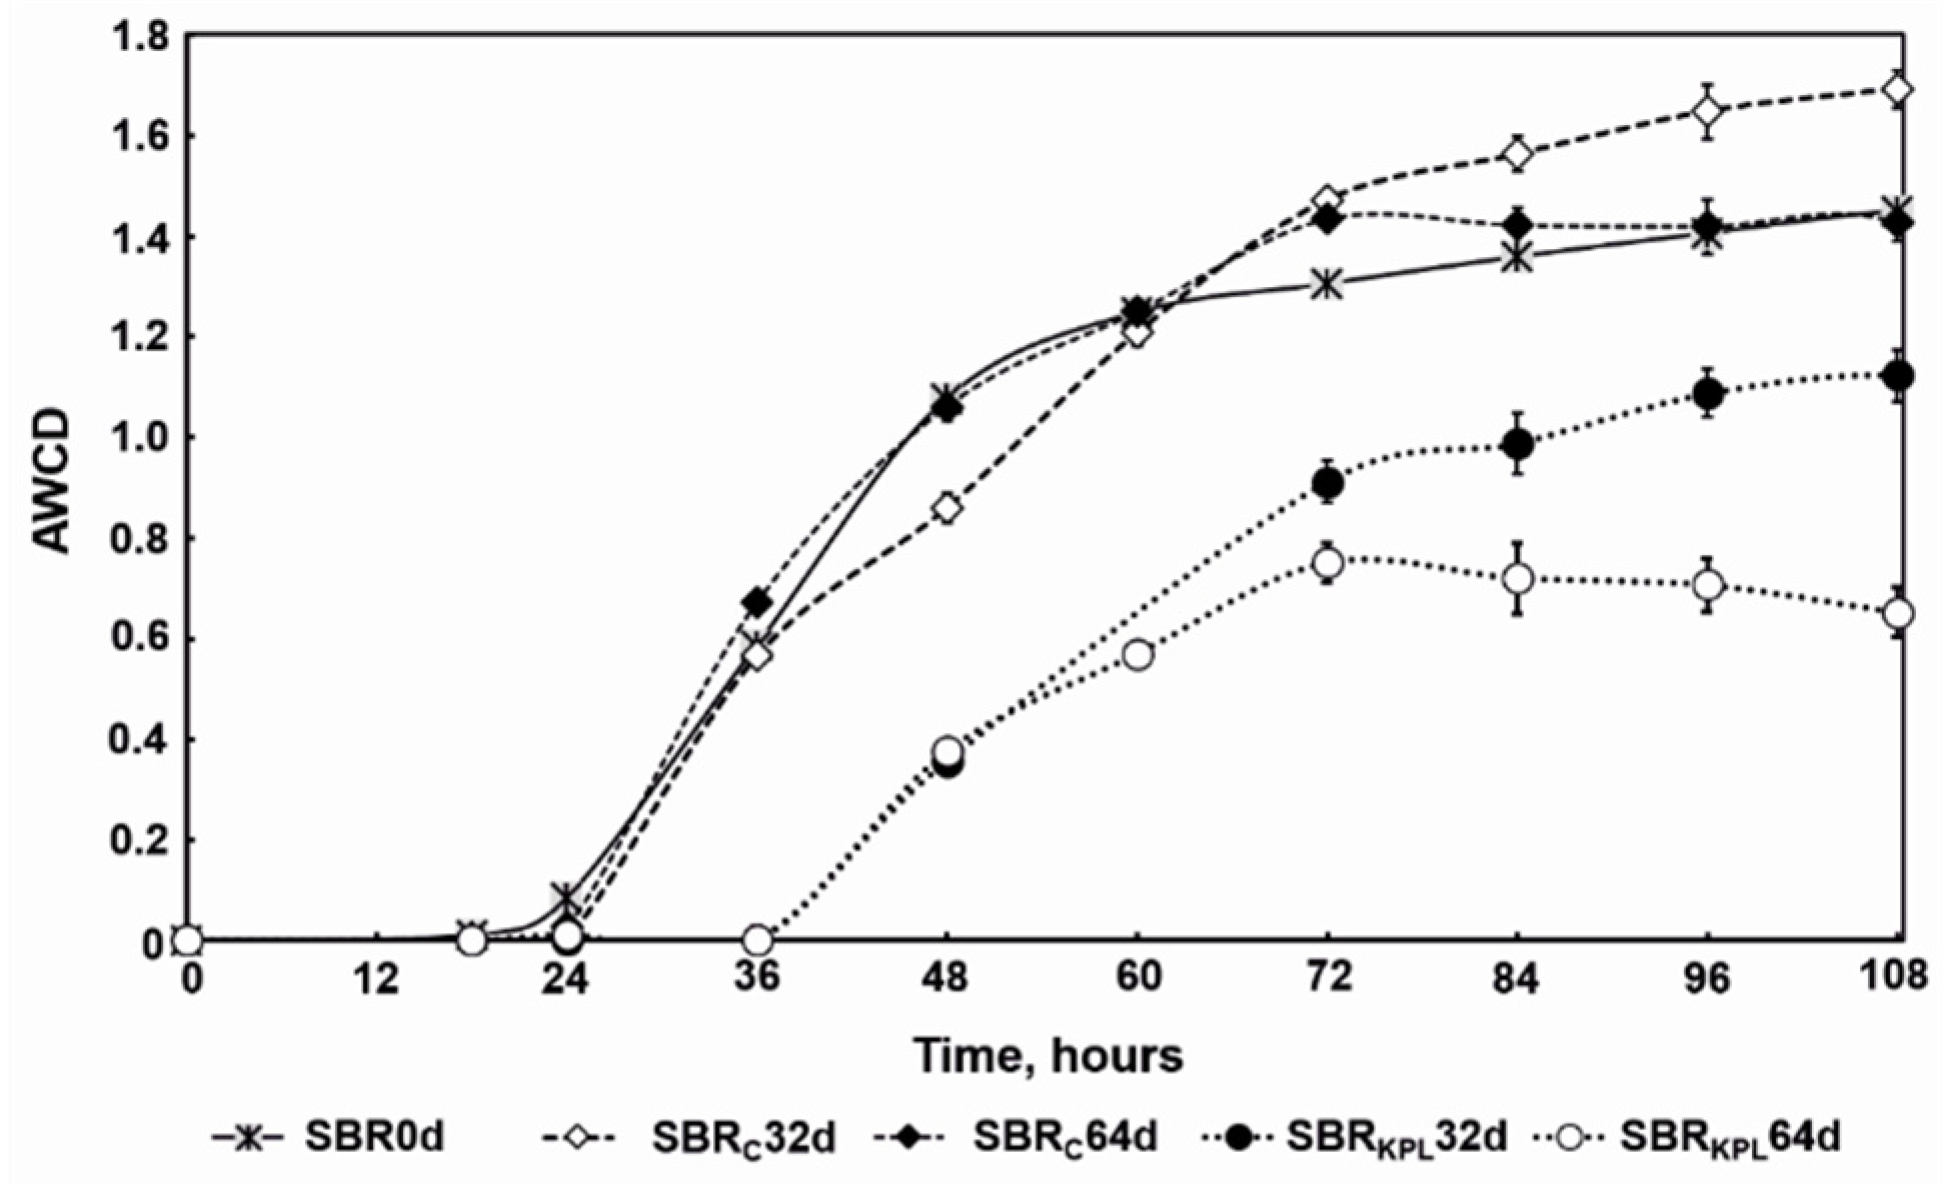
The high metabolic capacity of the AS microbial communities is considered to be a pivotal factor for efficient wastewater treatment in the biological units [77]. The microorganisms in the SBRKPL were less metabolically active than the bacteria in the SBRC. Although the leachate affected the microbial growth in the AS, thus contributing to an extension of the duration of the adaptation phase, the t50 did not change significantly. It can be assumed that the presence of the KPL in the wastewater had a toxic effect on the core populations in the AS. It was also shown that the low AS metabolic activity after contamination was correlated with a lack of the ability of its microbial communities to utilize specific compounds, in particular, the phosphorus sources. The changes in the CLPP patterns for the SBRKPL may suggest that the occurrence of the leachate in the wastewater led to the metabolic specialization of the AS microorganisms. The functional diversity of the AS microorganisms exposed to a landfill leachate is poorly documented in the literature. The research by Röling et al. [78] indicated that the microbial communities in an aquifer contaminated with the leachate from Banisveld landfill (Boxtel, The Netherlands) favored the aromatic substrates among the other carbon sources in an EcoPlateTM. Moreover, Taş et al. [79] showed a significant increase in the abundance of the genes that belong to the carbohydrate and xenobiotic metabolism categories in groundwater polluted with the same leachate. Similarly, in this study the microorganisms from the SBRKPL increased their metabolism in relation to the carbohydrates and phenolic compounds. The significant decrease in the microbial metabolic activity and the increase in the inequality of the bacterial abundance that was observed in the SBRKPL strongly correlated with a decrease in the functional capacity. This may indicate a loss of the functionally significant microorganisms such as phosphate-solubilizing bacteria in the AS during the leachate cotreatment. By contrast, the microbial populations in the SBRKPL metabolized the compounds containing nitrogen more intensively than the microorganisms in the SBRC. It may be suggested that the loss of phosphorus utilization as well as the increase in nitrogen metabolism in the SBRKPL may be related to the predominance of bacterial species originated from the leachate.
In this work, very interesting results regarding the alterations in the structural diversity of microorganisms in the AS were obtained. Over the course of the experiment the contribution of the microorganisms can be ordered as follows; BG− > F > BG+ > Pr > Ac and BG- > BG+ > F > Ac > Pr in the SBRC and SBRKPL, respectively. The prevalence of BG− over the other microbial groups was observed in both of the tested bioreactors. Due to their highly impermeable outer membrane, BG− have generally been recognized as being more tolerant than BG+ to the various hydrocarbons commonly found in landfill leachate [80,81]. Nonetheless, a gradual decrease in the content of the BG− biomarkers accompanied by a significant increase in the percentages of the FAME markers for BG+ was observed during the cotreatment with the KPL. Similar observations were made by Leal et al. [81], who found that the introduction of petrol into compost resulted in a significant decrease in the content of the FAME markers for BG− along with a simultaneous increase in the content of the biomarkers for BG+. It was reported that BG+ can exhibit a high metabolic capability towards various contaminants, which may result in their predominance in a contaminated environment [82]. Here, the decrease in the abundance of the BG− biomarkers in the SBRKPL was followed by a decrease in the distribution of the fungal and protozoan FAME markers. Although the abundance of fungi in the AS is rather low, they are involved in many important processes during wastewater treatment due to a versatile pollutant-degrading capacity [83]. Since the changes in the occurrence of fungi in the AS are mainly associated with pH fluctuations, it may be suggested that the gradual increase in wastewater pH during the KPL cotreatment may negatively have affected the fungal population in the SBRKPL, which contributed to the loss of important catabolic activity in this environment. Furthermore, the multiplication of the Actinomycetes in the SBRKPL may adversely affect the wastewater treatment process and the sludge quality [84].
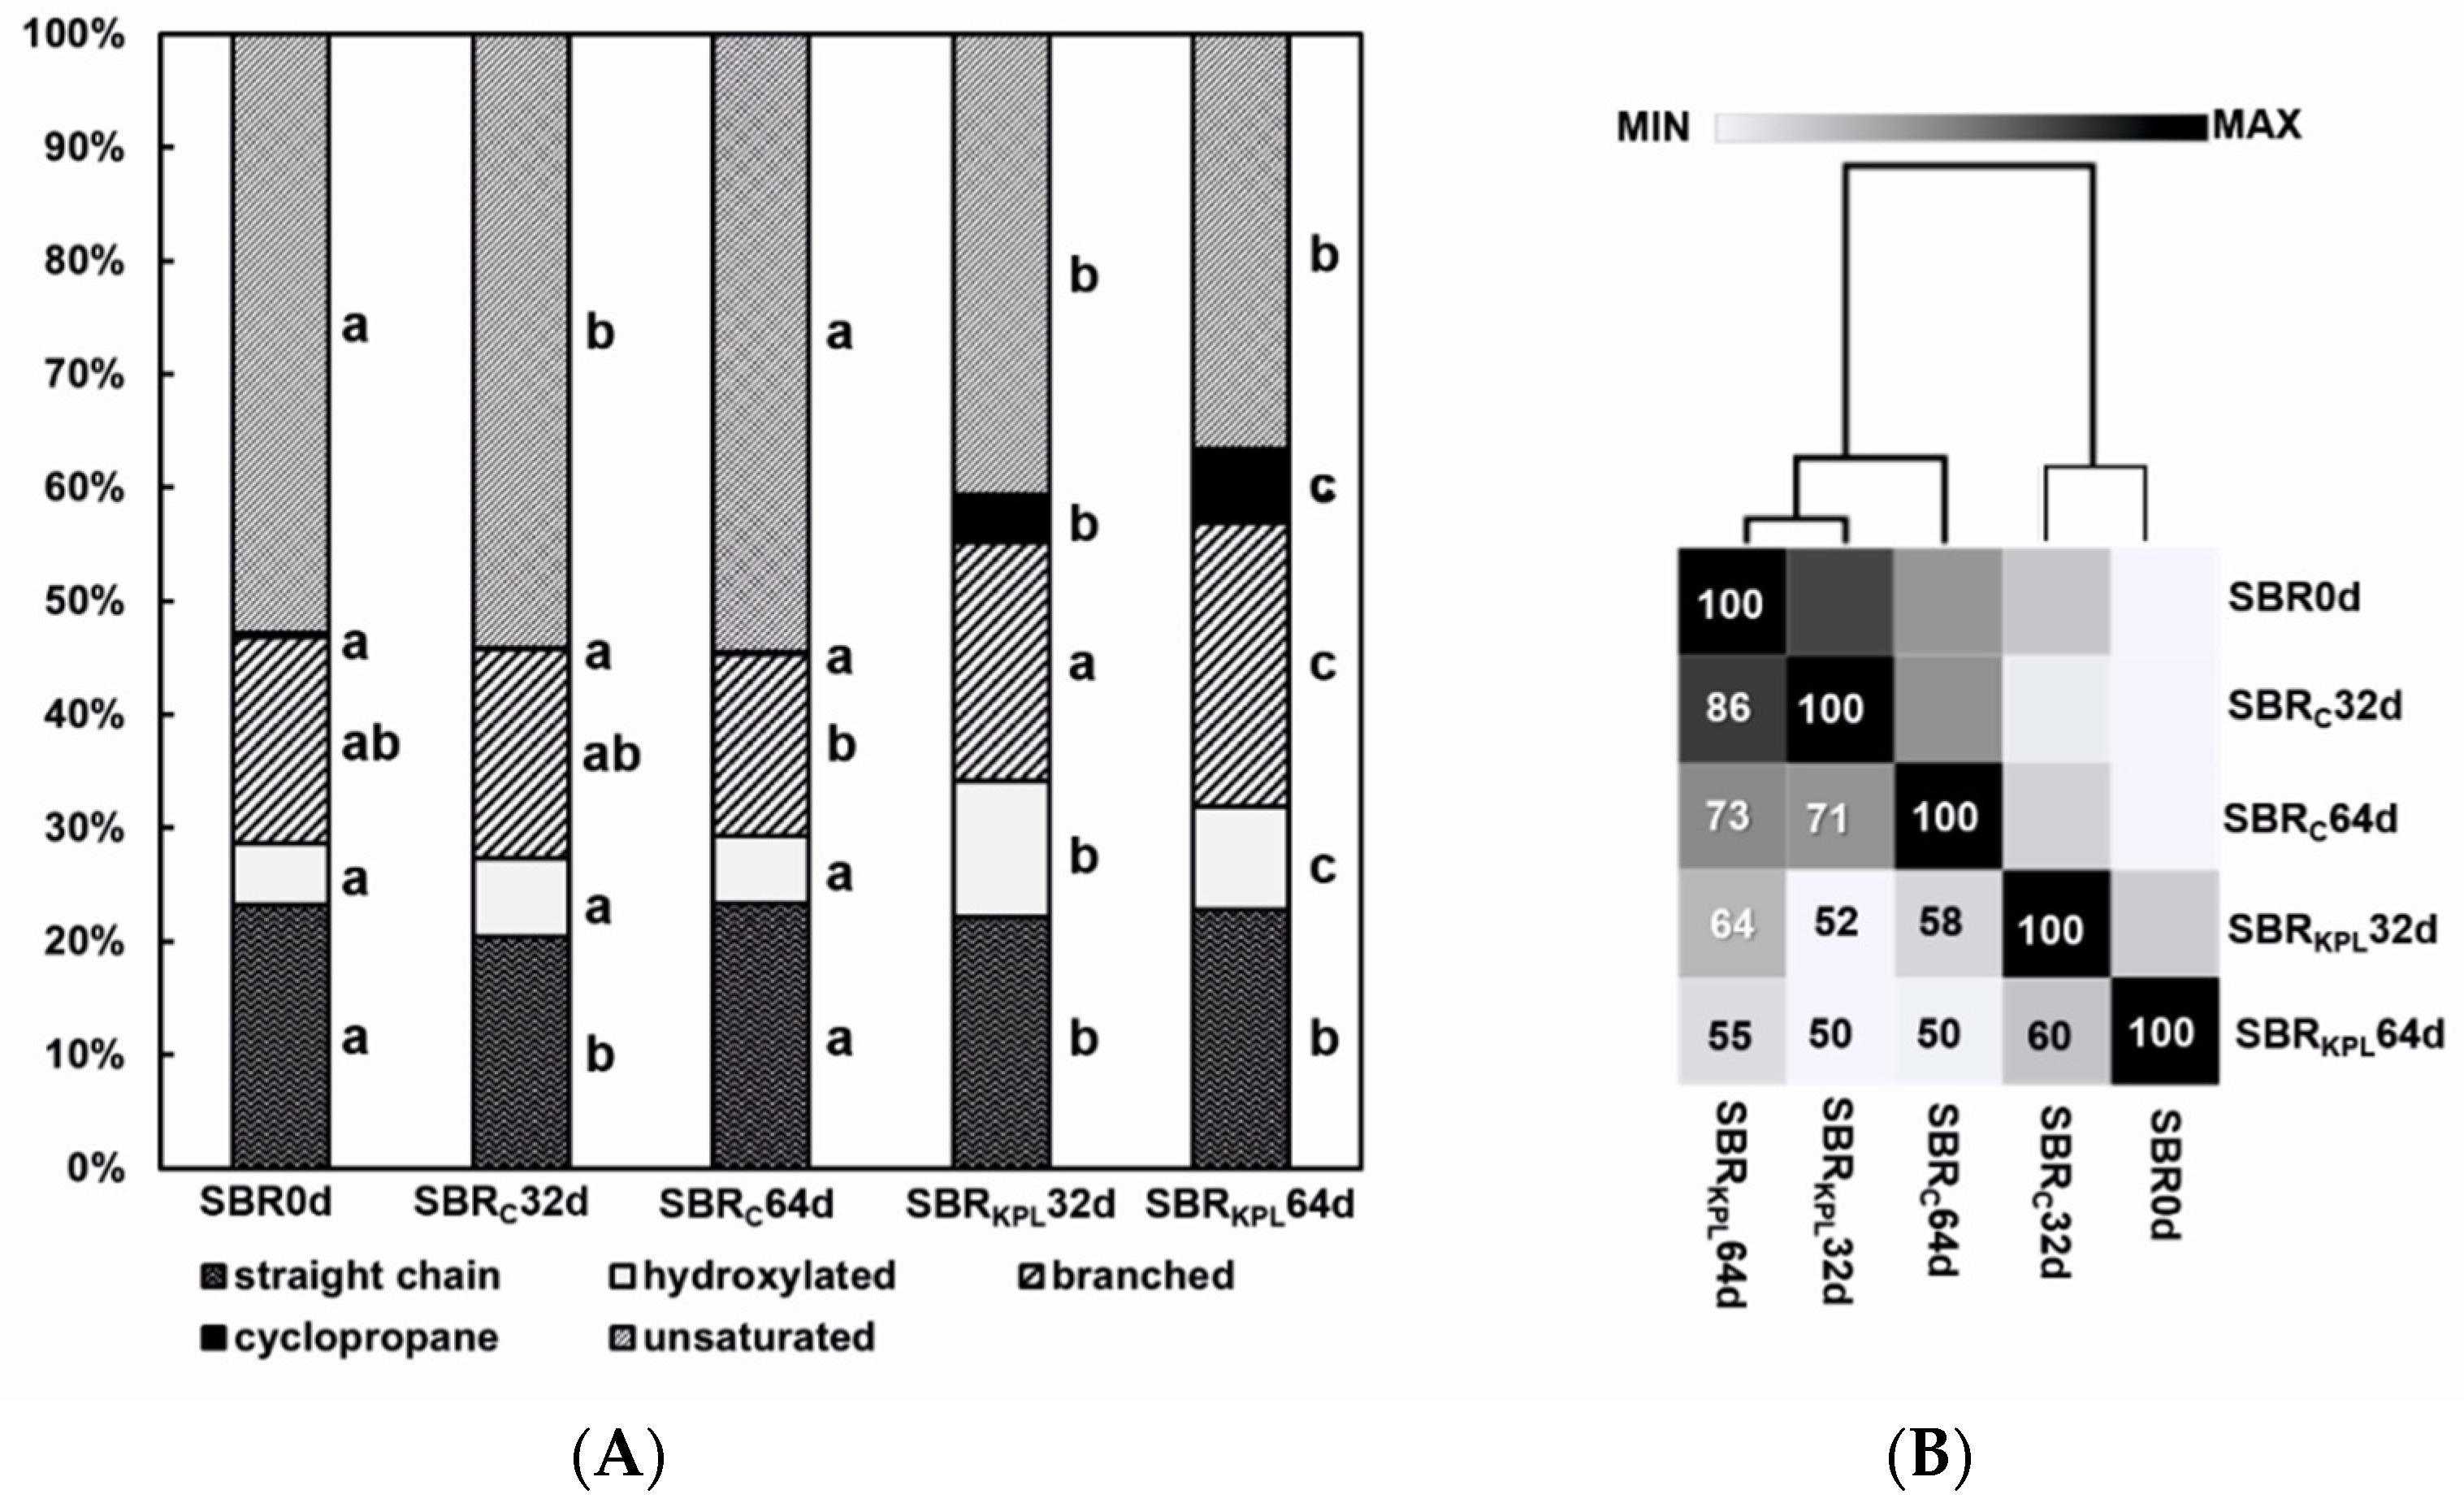
The identified changes in the FAME profiles of the AS indicated that the microorganisms were very sensitive to the contamination and exhibited adaptive mechanisms to the presence of the KPL in the wastewater. The essential changes in the bacteria FAME patterns were related to an increase in the content of the 16:0, 3-hydroxy, and 15:0 anteiso-branched fatty acids, which were responsible for rigidification of the cytoplasmic membrane. Furthermore, a gradual increase in the saturation of fatty acids in bacterial membrane along with an increase of pollutant concentration could be associated with the stimulation of cyclopropane fatty acid formation by some bacterial strains [85]. Interestingly, there was also a significant increase in the percentages of the anteiso-branched fatty acids in the FAME profiles under the KPL contamination. The branched fatty acids play an important role in the microbial tolerance to pH stress [86]. Therefore, it can be suggested that an increase in the yield of the anteiso/iso-branched fatty acids in the FAME patterns, which was observed in this study, may be a result of the microbial response to the pH stress resulted from the presence of the KPL in the wastewater.
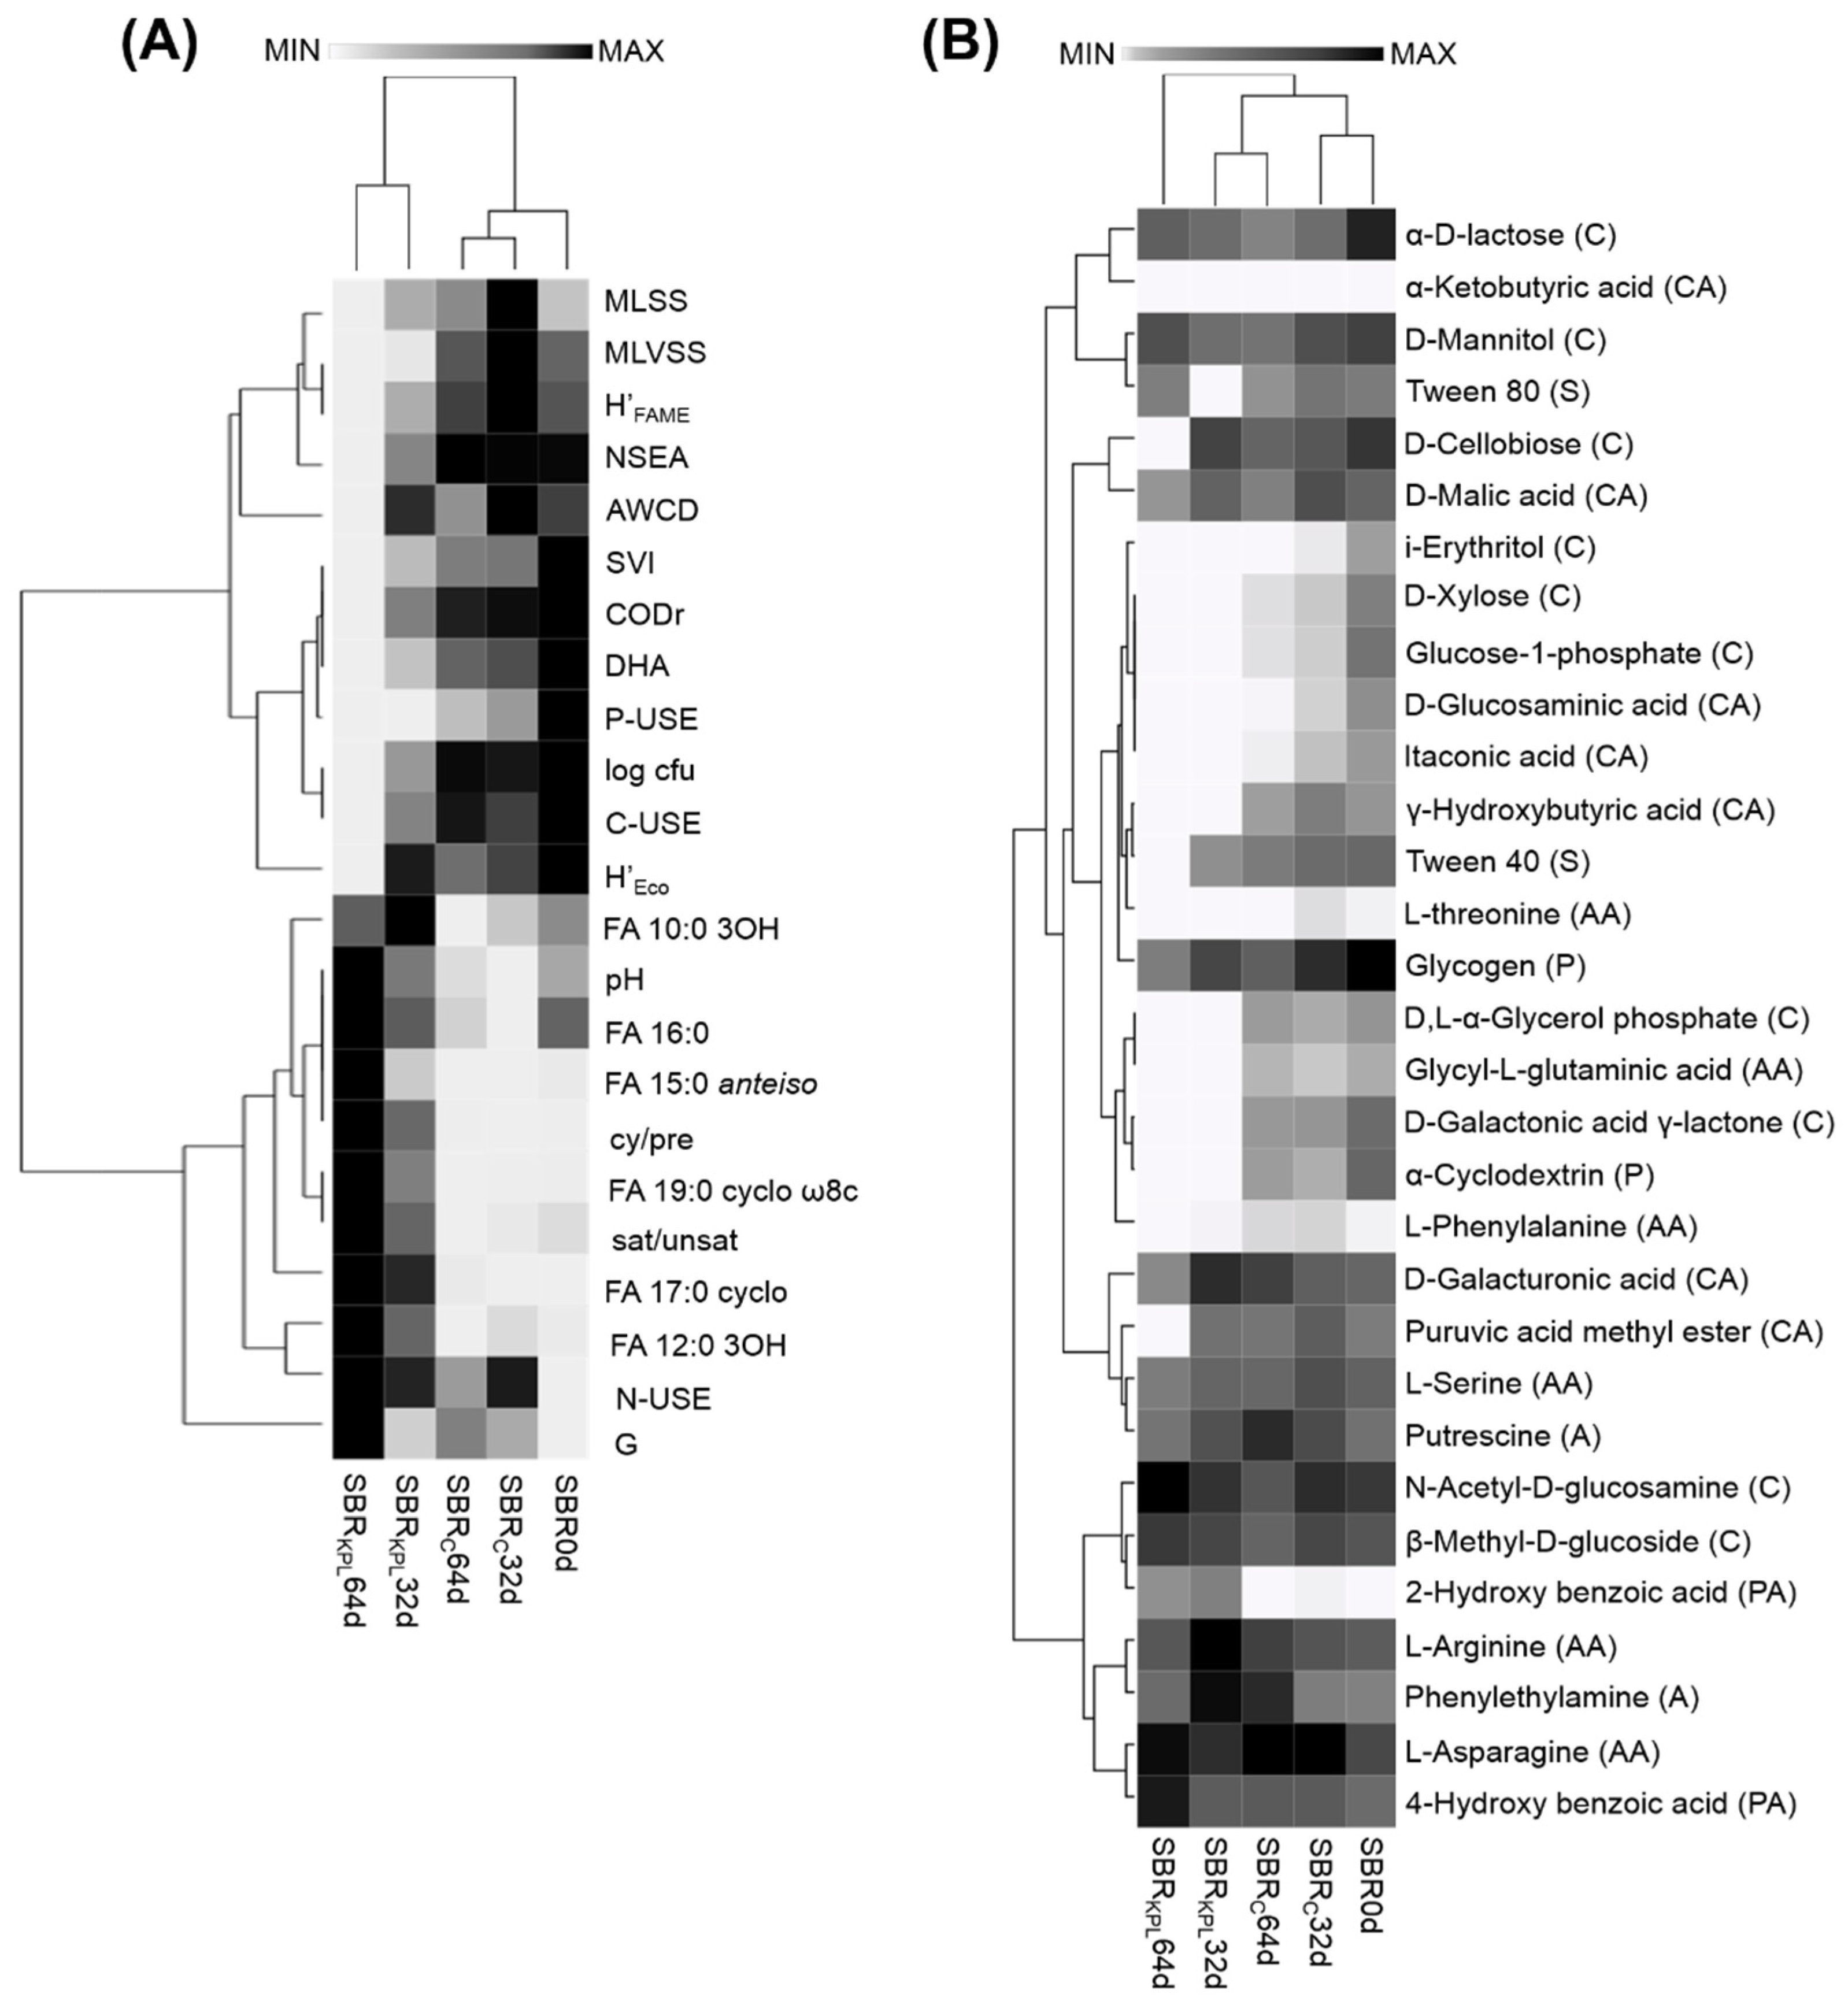
Multivariate analysis in this work allowed establishing of important relationships between operational parameters of wastewater treatment process and factors affecting activated sludge quality. It was found that the presence of the KPL in the wastewater was the main factor responsible for variations in the activated sludge. There was a close relationship between the microbial activity of the sludge, ability of the AS microorganisms to utilize carbon sources and important operational parameters of wastewater treatment process. The operation parameters of the reactor were positively correlated with enzymatic activity, metabolic capacity and structural diversity of microorganisms in the AS and negatively correlated with content of selected fatty acids. A significant decrease in the ability of microorganisms to utilize carbon, phosphorus and nitrogen sources may be a good indicator of weakening their metabolic functions. Interestingly, a multivariate analysis showed that the selected fatty acids can be used as indicators of structural diversity of microbial communities and xenobiotic degradation. A significant increase in the content of 3-hydroxy fatty acids and cyclopropane fatty acids in the presence of the KPL can be considered as useful biomarkers of stress condition [87]. Combining physicochemical and biological analyzes seems necessary to accurately identify the major factors affecting activated sludge operation and quality, especially when they achieve critical levels.

5. Conclusions

This work underscores the importance of effluent quality assessment in parallel with the analysis of the microbial enzymatic activity, functional capacity and structural diversity of activated sludge microorganisms to get knowledge and improve the operational conditions in sewage treatment systems. Among traditional methods for effluent analysis, the use of the Biolog EcoPlate technique as well as the FAME analysis proved to be very useful in getting a comprehensive insight into the microbiological process of wastewater treatment. Predicting the response of microorganisms to any disturbances caused by the leachate can be a promising tool in alleviating or even preventing the operational problems in large-scale WWTPs. The application of a multifactorial analysis of the parameters relevant to the wastewater treatment process in this study demonstrated that the presence of the leachate changed the conditions in the WWTP and led to disturbances associated with the structure and settling ability of the activated sludge. Additionally, the KPL significantly affected the enzymatic activity of this ecosystem. The obtained results clearly indicate that the microbial communities in the KPL were able to thrive in the presence of the various contaminants occurred in the leachate; however, they exhibited a low functional capacity. For this reason, they probably will not be capable of executing biological functions beginning with healthy agriculture and ending with ecosystem bioremediation. In conclusion, future studies will be focused on increasing the efficiency of the COD removal of the KPL contaminants in wastewater as well as on the implementation of new strategies that are designed to protect the structure and function of the activated sludge microbial communities against various xenobiotics.

Author Contributions

Conceptualization, J.M., A.M., and I.G.; formal analysis, J.M. and J.Ż.; data curation, J.M. and D.W.; writing—original draft preparation, J.M. and A.M.; writing—review and editing, A.M.; visualization, J.M.; supervision, A.M.; project administration, J.M. and A.M.; funding acquisition, J.M. and A.M.

Funding

The paper was prepared in connection with the work done under the project granted on the basis of decision DEC-2016/23/N/NZ9/00158 and financed by the National Science Centre (Poland).

Acknowledgments

The research was performed by the courtesy of the Chorzowsko-Świętochłowickie Municipal Water and Sewage Company LLC and the Head of Wastewater Treatment Plant MSc Piotr Banaszek. The authors are also very grateful to Paweł Franczak for advice on mathematical modeling of CLPP kinetic parameters.

Conflicts of Interest

The authors declare no conflicts of interest.

References

  1. EEA. Dangerous Substances in Waste. Technical Report No 38; European Environmental Agency: Copenhagen, Denmark, 2000. [Google Scholar]
  2. Yu, J.; Zhou, S.; Wang, W. Combined treatment of domestic wastewater with landfill leachate by using A2/O process. J. Hazard. Mater. 2010, 178, 81–88. [Google Scholar] [CrossRef]
  3. Brennan, R.B.; Healy, M.G.; Morrison, L.; Hynes, S.; Norton, D.; Clifford, E. Suitability of Municipal Wastewater Treatment Plants for the Treatment of Landfill Leachate. EPA Research Report (2013-W-FS-13); Environmental Protection Agency: Wexford, Ireland, 2017. [Google Scholar]
  4. De Albuquerque, E.M.; Pozzi, E.; Sakamoto, I.K.; Jurandyr, P. Treatability of landfill leachate combined with sanitary sewage in an activated sludge system. J. Water Process Eng. 2018, 23, 119–128. [Google Scholar] [CrossRef]
  5. Grosser, A.; Neczaj, E.; Madela, M.; Celary, P. Treatment of landfill leachate using ultrasound assisted SBR reactor. Proceedings 2018, 2, 648. [Google Scholar] [CrossRef]
  6. Pitchel, J. Waste Management Practices: Municipal, Hazardous, and Industrial, 2nd ed.; CRC Press: Boca Raton, FL, USA, 2015. [Google Scholar]
  7. Masoner, J.R.; Kolpin, D.W.; Furlong, E.T.; Cozzarelli, I.M.; Gray, J.L. Landfill leachate as a mirror of today’s disposable society: Pharmaceuticals and other contaminants of emerging concern in final leachate from landfills in the conterminous United States. Environ. Toxicol. Chem. 2016, 34, 906–918. [Google Scholar] [CrossRef] [PubMed]
  8. Slack, R.J.; Gronow, J.R.; Voulvoulis, N. Household hazardous waste in municipal landfills: Contaminants in leachate. Sci. Total Environ. 2004, 337, 119–137. [Google Scholar] [CrossRef] [PubMed]
  9. Toretta, V.; Katsoyiannis, I.A.; Tolkou, A.K.; Airoldi, M.; Ferronato, N. Novel and conventional technologies for landfill leachates treatment: A review. Sustainability 2016, 9, 9. [Google Scholar] [CrossRef]
  10. Willén, B.M.; Jin, B.; Lant, P. The influence of key chemical constituents in activated sludge on surface and flocculating properties. Water Res. 2003, 38, 3909–3919. [Google Scholar] [CrossRef]
  11. El Fantroussi, S.; Agathos, S.N. Is bioaugmentation a feasible strategy for pollutant removal and site remediation? Curr. Opin. Microbiol. 2005, 8, 268–275. [Google Scholar] [CrossRef]
  12. Sipma, J.; Osuna, M.B.; Emanuelsson, M.A.E.; Castro, P.M.L. Biotreatment of industrial wastewaters under transient-state conditions: Process stability with fluctuations of organic load, substrates, toxicants, and environmental parameters. Crit. Rev. Env. Sci. Technol. 2010, 40, 147–197. [Google Scholar] [CrossRef]
  13. Jiang, H.L.; Tay, J.H.; Tay, S.T.L. Changes in structure, activity and metabolism of aerobic granules as a microbial response to high phenol loading. Appl. Microbiol. Biotechnol. 2004, 63, 602–608. [Google Scholar] [CrossRef]
  14. Marrot, B.; Barrios-Martinez, A.; Moulin, P.; Roche, N. Biodegradation of high phenol concentration by activated sludge in an immersed membrane bioreactor. Biochem. Eng. J. 2006, 30, 174–183. [Google Scholar] [CrossRef]
  15. Siripattanakul-Ratpukdi, S. Phenolic based pharmaceutical contaminated wastewater treatment kinetics by activated sludge process. J. Clean Energ. Technol. 2014, 2, 150–153. [Google Scholar] [CrossRef]
  16. Pieczykolan, B.; Płonka, I.; Kosel, M. Changes of the quality of activated sludge during the biological treatment of landfill leachate. Environ. Prot. Eng. 2016, 42, 33–42. [Google Scholar] [CrossRef]
  17. Tkaczyk, A.M.; Pietrzak, M.; Kołak, G. Case of the environment reclamation in the region of Kalina Pond in Świętochłowice. Pol. Geol. Inst. Spec. Pap. 2005, 17, 77–83. [Google Scholar]
  18. EN ISO 5667-13:2011. Water Quality—Sampling—Guidance on Sampling of Sludges; International Organization for Standardization: Geneva, Switzerland, 2011. [Google Scholar]
  19. EN ISO 19458:2007P. Water Quality—Sampling for Microbiological Analysis; International Organization for Standardization: Geneva, Switzerland, 2007. [Google Scholar]
  20. Michalska, J.; Wojcieszyńska, D.; Greń, I. Investigation of functional diversity and activated sludge condition using Biolog® system. ACEE J. 2016, 1, 119–126. [Google Scholar] [CrossRef]
  21. PN-ISO 10390:1997. Soil Quality—pH Determining; Polish Committee for Standardization: Warsaw, Poland, 1997. (In Polish) [Google Scholar]
  22. PN-ISO 7150-1:2002. Water Quality—Determination of Ammonium Nitrogen—Part 1: Manual Spectrometric Method; Polish Committee for Standardization: Warsaw, Poland, 2002. (In Polish) [Google Scholar]
  23. PN-ISO 6439:1994. Water Quality—Determination of Phenol Index—4-Aminoantipyrine Spectrometric Methods after Distillation; Polish Committee for Standardization: Warsaw, Poland, 1994. (In Polish) [Google Scholar]
  24. PN-C-04576-4:1994. Water and Sewage—Studies on the Content of Nitrogen Compounds—Determination of Ammonium Nitrogen by Direct Nesslerization; Polish Committee for Standardization: Warsaw, Poland, 1994. (In Polish) [Google Scholar]
  25. PN-82/C-04576/08:1982. Water and Sewage—Studies on the Content of Nitrogen Compounds—Determination of Nitrate Nitrogen by the Colorimetric Method Using Sodium Salicylate; Polish Committee for Standardization: Warsaw, Poland, 1982. (In Polish) [Google Scholar]
  26. PN-73/C-04576/06:1973 Water and Sewage—Studies on the Content of Nitrogen Compounds—Determination of Nitrite Nitrogen by the Colorimetric Method Using Sulfanilic Acid and α-Naphthylamine; Polish Committee for Standardization: Warsaw, Poland, 1973. (In Polish)
  27. Hagman, M.; Jansen, J.L.C. Oxygen uptake rate measurements for application at wastewater treatment plants. Vatten 2007, 63, 131–138. [Google Scholar]
  28. APHA. Standard Methods for the Examination of Water and Wastewater; American Public Health Association, American Water Works Association, Water Environment Federation: Washington, DC, USA, 1999. [Google Scholar]
  29. ECOLEX. Order of the Minister of Environment Laying Down Conditions for the Introduction of Sewage Into Water Bodies or Soil and Laying Down the List of Substances Particularly Harmful to Water Environments. Poland, 2014. Available online: https://www.ecolex.org/details/legislation/regulation-laying-down-conditions-for-the-introduction-of-sewage-into-water-bodies-or-soil-and-laying-down-the-list-of-substances-particularly-harmful-to-water-environments-lex-faoc073889/ (accessed on 27 May 2019).
  30. EN ISO 8199:2010. Water Quality—General Requirements and Guidance for Microbiological Examinations by Culture; International Organization for Standardization: Geneva, Switzerland, 2010. [Google Scholar]
  31. EN ISO 9308-1:2014-12/A1:2017-04. Water Quality—Enumeration of Escherichia Coli and Coliform Bacteria—Membrane Filtration Method for Waters with Low Bacterial Background Flora; Polish Committee for Standardization: Warsaw, Poland, 2017. [Google Scholar]
  32. Molina-Muñoz, M.; Poyatos, J.M.; Rodelas, B.; Pozo, C.; Manzanera, M.; Hontoria, E.; González-López, J. Microbial enzymatic activities in a pilot scale MBR experimental plant under different working conditions. Bioresour. Technol. 2010, 101, 696–704. [Google Scholar] [CrossRef]
  33. Miksch, K. Aplication of dehydrogenase activity determinations in biodegradation of refinery sewage. Gas Water Civ. Technol. 1977, 51, 234–235. [Google Scholar]
  34. Schumacher, T.E.; Eynard, A.; Chintala, R. Rapid cost-effective analysis of microbial activity in soils using modified fluorescein diacetate method. Environ. Sci. Pollut. Res. 2015, 22, 4759–4762. [Google Scholar] [CrossRef]
  35. Caglar, M.U.; Teufel, A.I.; Wilke, C.O. Sicegar: R package for sigmoidal and double-sigmoidal curve fitting. PeerJ. 2008, 6, 1–16. [Google Scholar] [CrossRef]
  36. Peleg, M.; Corradini, M.G.; Normand, M.D. The Logistic (Verhulst) model for sigmoid microbial growth curves revisited. Food Res. Int. 2007, 40, 808–818. [Google Scholar] [CrossRef]
  37. Olyphant, T.E. Python for scientific computing. Comput. Sci. Eng. 2007, 9, 10–20. [Google Scholar] [CrossRef]
  38. Woźnica, A.; Nowak, A.; Beimfohr, C.; Karczewski, J.; Bernas, T. Monitoring structure and activity of nitrifying bacterial biofilm in an automatic biodetector of water toxicity. Chemosphere 2010, 78, 1121–1128. [Google Scholar] [CrossRef] [PubMed]
  39. Muñiz, S.; Lacarta, J.; Pata, M.P.; Jiménez, J.J.; Navarro, E. Analysis of the diversity of substrate utilization of soil bacteria exposed to Cd and earthworm activity using generalized additive models. PloS ONE 2014, 9, 1–10. [Google Scholar] [CrossRef] [PubMed]
  40. Yu, Z.; Hu, Y.; Dzakpasu, M.; Wang, C.X.; Ngo, H.H. Dynamic membrane bioreactor performance enhancement by powdered activated carbon addition: Evaluation of sludge morphological, aggregative and microbial properties. J. Environ. Sci. 2018, 75, 1–11. [Google Scholar] [CrossRef] [PubMed]
  41. Al-Mutairi, N.Z. Variable distributional characteristics of substrate utilization patterns in activated sludge plants in Kuwait. Bioresour. Technol. 2009, 100, 1524–1532. [Google Scholar] [CrossRef] [PubMed]
  42. Nowak, A.; Mrozik, A. Degradation of 4-chlorophenol and microbial diversity in soil inoculated with single Pseudomonas sp. CF600 and Stenotrophomonas maltophilia KB2. J. Environ. Manage. 2018, 215, 216–229. [Google Scholar] [CrossRef] [PubMed]
  43. Kozdrój, J. Microflora of technogeous wastes characterized by fatty acid profiling. Microb. Res. 2000, 155, 149–156. [Google Scholar] [CrossRef]
  44. Son, K.S.; Hall, E.R. Use of a similarity index based on microbial fatty acid (MFA) analysis to monitor biological wastewater treatment systems. Environ. Technol. 2003, 24, 1147–1155. [Google Scholar] [CrossRef] [PubMed]
  45. Moore-Kucera, J.; Dick, R.P. PLFA profiling of microbial community structure and seasonal shifts in soils of a Douglas-fir chronosequence. Microbiol. Ecol. 2008, 55, 500–511. [Google Scholar] [CrossRef]
  46. He, Y.; Ding, N.; Shi, J.; Wu, M.; Liao, H.; Xu, J. Profiling of microbial PLFAs: Implications for interspecific interactions due to intercropping which increase phosphorus uptake in phosphorus limited acidic soils. Soil Biol. Biochem. 2013, 57, 625–634. [Google Scholar] [CrossRef]
  47. Frostegård, Å.; Tunlid, A.; Bååth, E. Use and misuse of PLFA measurements in soils. Soil Biol. Biochem. 2011, 43, 1621–1625. [Google Scholar] [CrossRef]
  48. Zelles, L. Phospholipid fatty acid profiles in selected members of soil microbial communities. Chemosphere 1997, 35, 275–294. [Google Scholar] [CrossRef]
  49. Madan, R.; Pankhurst, C.; Hawke, B.; Smith, S. Use of fatty acids for identification of AM fungi and estimation of the biomass of am spores in soil. Soil Biol. Biochem. 2002, 34, 125–128. [Google Scholar] [CrossRef]
  50. Marczenko, Z. Spectrophotometric Determination of Elements; Scientific Publisher NPS: Warsaw, Poland, 1997. [Google Scholar]
  51. Kumar, D.; Alappat, B.J. Evaluating leachate contamination potential of landfill sites using leachate pollution index. Clean Techn. Environ. 2005, 7, 190–197. [Google Scholar] [CrossRef]
  52. Werker, A.G.; Becker, J.; Huitema, C. Assessment of activated sludge microbial community analysis in full-scale biological wastewater treatment plants using patterns of fatty acid isopropyl esters (FAPEs). Water Res. 2003, 37, 2162–2172. [Google Scholar] [CrossRef]
  53. Wang, K.; Lusheng, L.; Tan, F.; Wu, D. Treatment of landfill leachate using activated sludge technology: A review. Archaea 2018, 1–10. [Google Scholar] [CrossRef]
  54. El-Fadel, M.; Sleem, E.F.; Hashisho, J.; Saikaly, P.E.; Alameddine, I.; Ghanimeh, S. Impact of SRT on the performance of MBRs for the treatment of high strength landfill leachate. Waste Manag. 2017, 73, 166–180. [Google Scholar] [CrossRef]
  55. Kumar, D.; Alappat, B.J. Analysis of the leachate contamination potential of municipal landfill using lechate pollution index. Waste Manag. Res. 2003, 23, 230–239. [Google Scholar] [CrossRef]
  56. Li, X.Z.; Zhao, Q.L. Inhibition of microbial activity of activated sludge by ammonia in leachate. Environ. Int. 1999, 25, 961–968. [Google Scholar] [CrossRef] [Green Version]
  57. Deng, Y.; Englehardt, J.D. Electrochemical oxidation for landfill leachate treatment. Waste Manag. 2007, 27, 380–388. [Google Scholar] [CrossRef] [PubMed]
  58. Chudoba, E.A.; Mallin, M.A.; Cahoon, L.B.; Skrabal, S.A. Stimulation of fecal bacteria in ambient waters by experimental inputs of organic and inorganic phosphorus. Water Res. 2013, 47, 3455–3466. [Google Scholar] [CrossRef] [PubMed]
  59. Aziz, S.Q.; Aziz, H.A.; Yusoff, M.S.; Mohaheri, S. Removal of phenol and other pollutants from different landfill leachates using powdered activated carbon SBR supplemented technology. Environ. Monit. Assess. 2012, 184, 6147–6158. [Google Scholar] [CrossRef] [PubMed]
  60. Tobajas, M.; Verdugo, V.; Polo, A.M.; Rodriguez, J.J.; Mohedano, A.F. Assessment of toxicity and biodegradability on activated sludge of priority and emerging pollutants. Environ. Technol. 2016, 37, 713–721. [Google Scholar] [CrossRef] [PubMed]
  61. Kalka, J. Landfill leachate toxicity removal in combined treatment with municipal wastewater. Sci. World J. 2012, 1–7. [Google Scholar] [CrossRef] [PubMed]
  62. Campos, R.; Ferraz, F.M.; Viera, E.M.; Povinelli, J. Aerobic co-treatment of landfill leachate and domestic wastewater—Are slowly biodegradable organics removed or simply diluted. Water Sci. Technol. 2014, 70, 1941–1947. [Google Scholar] [CrossRef]
  63. Hong, E.; Yeneh, A.M.; Kayaalp, A.; Sen, T.K.; Ang, H.M.; Kayaalp, M. Rheorogical characteristic of municipal thickened excess activated sludge (TEAS): Impacts of pH, temperature, solid concentration and polymer dose. Res. Chem. Intermediat. 2016, 42, 6567–6585. [Google Scholar] [CrossRef]
  64. Bitton, G. Wastewater Microbiology, 3rd ed.; John Wiley and Sons: New York, NY, USA, 2005. [Google Scholar]
  65. Duan, Z. Microbial degradation of phenol by activated sludge in a batch reactor. Environ. Prot. Eng. 2011, 37, 53–63. [Google Scholar]
  66. Cozma, P.; Hilhor, R.M.; Apostol, L.C.; Diaconu, M.; Pogăcean, M.O.; Gavrilescu, M. Aerobic biodegradation of phenol by activated sludge in a batch reactor. Environ. Eng. Manag. J. 2012, 11, 2053–2058. [Google Scholar] [CrossRef]
  67. Ghanizadeh, G.; Sarrafpour, R. The effects of temperature and pH on the settleability of activated sludge flocs. Iran. J. Publ. Health 2001, 30, 139–142. [Google Scholar]
  68. Ranjan, K.; Chakraborty, S.; Verma, M.; Iqbal, J.; Kumar, R.N. Co-treatment of old landfill leachate and municipal wastewater in sequencing batch rector (SBR): Effect of landfill leachate concentration. Water Qual. Res. J. Can. 2016, 51, 377–387. [Google Scholar] [CrossRef]
  69. Palm, J.; Jenkins, D. Relationship between loading, dissolved oxygen concentration and sludge settleability in the completely mixed activated sludge process. J. Water Pollut. Control Fed. 1980, 52, 2484–2506. [Google Scholar]
  70. Wang, L.K.; Shammas, N.K.; Hung, J. Advanced Biological Treatment Processes; Humana Press: New York, NY, USA, 2010. [Google Scholar]
  71. Çeçen, F.; Tezel, U. Hazardous Pollutants in Biological Treatment Systems: Fundamentals and a Guide to Experimental Research; IWA Publishing: London, UK, 2018. [Google Scholar]
  72. Czapluk, B.; Rutkowski, R.; Rybak, J. Microfauna composition of activated sludge in domestic and industrial sewage activated sludge systems. Environ. Prot. Eng. 2018, 44, 153–166. [Google Scholar] [CrossRef]
  73. Griebe, T.; Schaule, G.; Wuertz, S. Determination of microbial respiratory and redox activity in activated sludge. J. Ind. Microbiol. Biotechnol. 1997, 19, 118–122. [Google Scholar] [CrossRef]
  74. Boczar, B.A.; Forney, L.J.; Begley, W.M.; Larson, R.J.; Fedler, T.W. Characterization and distribution of esterase activity in activated sludge. Water Res. 2001, 35, 4208–4216. [Google Scholar] [CrossRef]
  75. Yao, Y.; Lu, Z.; Min, H.; Gao, H.; Zhu, F. The effect of tetrahydrofuran on the enzymatic activity and microbial community in activated sludge from a sequencing batch reactor. Ecotoxicology 2012, 21, 56–65. [Google Scholar] [CrossRef]
  76. Feng, Q.; Xiao, Y.; Li, X.; Xue, Z.; Fang, F.; Cao, J. Using the dehydrogenase activity for alert of activated sludge system under different copper concentrations. Desalin. Water Treat. 2014, 57, 17836–17843. [Google Scholar] [CrossRef]
  77. Xia, Y.; Wen, X.; Zhang, B.; Yang, Y. Diversity and assembly patterns of activated sludge microbial communities: A review. Biotechnol. Adv. 2018, 36, 1038–1047. [Google Scholar] [CrossRef]
  78. Röling, W.F.; van Breukelen, B.M.; Braster, M.; van Verseveld, H.W. Linking microbial community structure to the pollution: Biolog-substrate utilization in and near a landfill leachate plume. Water Sci. Technol. 2000, 41, 47–53. [Google Scholar] [CrossRef]
  79. Taş, N.; Brandt, B.W.; Braster, M.; Van Breukelen, B.M.; Röling, W.F.M. Surface landfill leachate contamination affects metabolic potential and gene expression in the Banisveld aquifer. FEMS Microbiol. Ecol. 2018, 94, 1–12. [Google Scholar] [CrossRef]
  80. Lăzăroaie, M.M. Multiple response of gram-positive and gram-negative bacteria to mixture of hydrocarbons. Braz. J. Microbiol. 2010, 41, 649–667. [Google Scholar] [CrossRef] [PubMed]
  81. Leal, A.J.; Rodrigues, D.M.; de Cássia Rocha, R.; Fernandes, R.; Borges, A.C.; Lopes Júlio, A.D.; de Souza Freitas, F.; Tótola, M.R. Microbial inoculants development for bioremediation of gasoline and diesel contaminated soil. OALib. J. 2018, 5, 1–17. [Google Scholar] [CrossRef]
  82. Erdoğan, E.; Şahin, F.; Namlı, A. Phospholipid fatty acids analysis-fatty acid methyl ester (PLFA-FAME) changes during bioremediation of crude oil contamination soil. Afr. J. Biotechnol. 2013, 12, 6294–6301. [Google Scholar] [CrossRef] [Green Version]
  83. Peng, R.H.; Xiong, A.S.; Xue, Y.; Fu, X.Y.; Gao, F.; Zhao, W.; Tian, Y.S.; Yao, Q.H. Microbial degradation of polyaromatic hydrocarbons. FEMS Microbiol. Rev. 2008, 32, 927–955. [Google Scholar] [CrossRef] [PubMed]
  84. Bezak-Mazur, E.; Stoińska, R.; Rajca, J.; Łutasiewicz, B. Effect of the presence of Actinomycetes in the activated sludge on the quality of the treated wastewater. E3S Web Conf. 2017, 17, 1–8. [Google Scholar] [CrossRef]
  85. Murínová, S.; Dercová, K. Response mechanisms of bacterial degraders to environmental contaminants on the level of cell walls and cytoplasmic membrane. Int. J. Microbiol. 2014, 1–16. [Google Scholar] [CrossRef] [PubMed]
  86. Giotis, E.S.; McDowell, D.A.; Blair, I.S.; Wilkinson, B.J. Role of branched-chain fatty acids in pH stress tolerance in Listeria monocytogenes. Appl. Environ. Microbiol. 2007, 73, 997–1001. [Google Scholar] [CrossRef] [PubMed]
  87. Segura, A.; Bernal, P.; Pini, C.; Krell, T.; Daniels, C.; Ramos, J.L. Membrane composition and modifications in response to aromatic hydrocarbons in Gramnegative bacteria. In Handbook of Hydrocarbon and Lipid Microbiology; Timmis, K.N., McGenity, T.J., van der Meer, J.R., de Lorenzo, V., Eds.; Springer-Verlag: Berlin/Heidelberg, Germany, 2010; pp. 1595–1603. [Google Scholar]
Figure 1. Scheme of experimental setup (A) and operation of the sequencing batch reactor (SBR) (B).
Water 11 01539 g001
Figure 2. The growth inhibition of the activated sludge microorganisms in the presence of various concentration of the KPL. Estimated values of ecotoxicity of the leachate: NIC = 3.45 ± 0.01, EC50 = 6.69 ± 0.70, and MIC = 11.26 ± 0.35.
Water 11 01539 g002
Figure 3. The changes in removal efficiency of chemical oxygen demand (CODr) (A), sludge volume index (SVI) (B), pH value (C), and the ratio of MLVSS/MLSS (D) in the SBRC and SBRKPL during 64 days of wastewater treatment.
Water 11 01539 g003
Figure 4. The changes in the MLSS, MLVSS, suspended matter (SM), and number of heterotrophic bacteria (THB) in the SBRC and SBRKPL during 64 days of wastewater treatment.
Water 11 01539 g004
Figure 5. The changes in activity of dehydrogenases (A) and nonspecific esterases (B) in the SBRC and SBRKPL during 64 days of wastewater treatment.
Water 11 01539 g005
Figure 6. Comparison of average well color development (AWCD) of metabolized substrates in Biolog® EcoPlateTM (Biolog, Inc., Hayward, CA, USA) by the AS microorganisms at the beginning (0d) and after 32 and 64 days of wastewater treatment in the SBRC and SBRKPL.
Water 11 01539 g006
Figure 7. The percentages of distinct fatty acids isolated from the AS at the beginning (0d) and after 32 and 64 days of wastewater treatment in the SBRC and SBRKPL (A) and cluster display of the values of similarity coefficients (SIM) between the structure of microbial communities in the AS based on the FAME profile analysis (B).
Water 11 01539 g007
Figure 8. Heat map and cluster analysis based on significant Spearman’s rank correlation coefficients calculated for the operational parameters of the SBR, microbial activity, structural diversity, and functional capacity indices, significant fatty acids, and FAMEs biomarkers (A) and Biolog® EcoPlateTM carbon sources utilization patterns (B) at the beginning (0d) and after 32 and 64 days of wastewater treatment in the SBRC and SBRKPL. All data values were normalized and presented as a color scale ranging from white (MIN, 0) to black (MAX, 1).
Water 11 01539 g008
Figure 9. Structure of the AS flocs from the SBRC (A,B) and SBRKPL (H,I) after 64 days of wastewater treatment. The occurrences of selected microorganisms are marked with white arrows that indicated Zooglea fingered in gelatinous matrix (C,D), rotifers (E), Arcella (F), free bacteria (G), ciliate, and filamentous bacteria (G,H) in the SBRC, as well as ciliate (K,L,M), filamentous bacteria (M), empty Arcella shells (N), Vorticella (N), and suctorians (O,P) in the SBRKPL.
Water 11 01539 g009
Table 1. Composition and characteristics of the synthetic wastewater.
NutrientsCompoundg/L
Carbon sourceC6H12O60.285
CH3COONa0.690
Nitrogen sourceNH4Cl0.145
Phosphorus sourceKH2PO40.060
K2HPO40.040
MineralsNaCl0.069
CaCl20.026
KCl0.145
COD, mg O2/L554 ± 44
N, mg/L61.93 ± 6.54
P, mg/L5.90 ± 0.42
pH7.26 ± 0.1
Table 2. Selected physicochemical parameters of the Kalina pond (KPL).
Physicochemical ParameterValueValues According to Reference [29]Method/Source
pH8.98 ± 0.016.50–9.00[21]
TSS, g/L4.87 ± 0.400.035[28]
N-NH4+, mg/L398.93 ± 21.1610.00[22]
N-NO2, mg/L0.04 ± 0.001.00[23]
N-NO3, mg/L2.93 ± 0.2530.00[50]
P-PO42−, mg/L154.44 ± 15.812.00[24]
COD, mg O2/L2510.00 ± 21.60250[25]
Phenols, mg/L185.67 ± 4.511.00[26]
BODst, mg O2/TSS × h12.55 ± 0.99na[27]
Leachate pollution index (LPI)38.28na[51]
Average values of samples collected from April to May in 2017; na—data not available.
Table 3. Selected microbiological parameters of the KPL.
Microbiological ParameterValueMethod/Medium
Total heterotrophic bacteria, 106 × CFU/mL3.04 ± 0.83[30]
Coliform bacteria, 104 × CFU/100 mL1.06 ± 0.79[31]
Fecal coliform bacteria, 102 × CFU/100 mL6.50 ± 0.14[31]
Actinomycetes, 106 × CFU/mL1.25 ± 0.54Gauze’s Agar
Filamentous bacteria, 105 × CFU/mL5.68 ± 0.04Sabouraud Agar
Fungi, 103 × CFU/mL5.00 ± 3.00Dichloran Rose-Bengal Chloramphenicol Agar
Average values of samples collected from April to May in 2017.
Table 4. Biolog EcoPlate indices of the KPL sample.
IndiceValue
H’Eco1.66 ± 0.23 a
S6.00 ± 0.02 a
G0.85 ± 0.01 a
Amax0.40 ± 0.05 a
AWCD0.16 ± 0.03 a
Avt5056.94 ± 5.45 a
C, %0.00 ± 0.00 a
A, %0.00 ± 0.00 a
AA, %22.17 ± 6.85 a
CA, %35.17 ± 20.03 a
PA, %11.64 ± 4.72 a
S, %16.26 ± 10.18 a
P, %20.08 ± 1.99 a
C-USE, %20.00 ± 3.33 a
P-USE, %0.00 ± 0.00 a
N-USE, %22.17 ± 6.85 a
H’ECO—Shannon–Weaver diversity index; S—metabolic richness index; G—Gini coefficient; Amax—maximum microbial activity; AWCD—average well color development; Avt50—time at which the total microbial activity increased at the fastest rate; C—carbohydrates; A—amines; AA—amino acids; CA—carboxylic acids; PA—phenolic acids; S—surfactants; P—polymers; C-USE—carbon use index; P-USE—phosphorus use index; N-USE—nitrogen use index. Different letters indicate statistically significant at p < 0.05 differences among means.
Table 5. Values of functional capacity indices; kinetic parameters—Amax; Avt50; and usage of carbon substrate guilds for the untreated AS and treated with KPL.
TreatmentSBR0dSBRC32dSBRC64dSBRKPL32dSBRKPL64d
H’Eco3.15 ± 0.12 b2.99 ± 0.16 b3.33 ± 0.15 b2.82 ± 0.15 b2.11 ± 0.15 c
S27.67 ± 1.53 b24.67 ± 2.08 b29.00 ± 1.41 b19.33 ± 1.53 c10.67 ± 0.58 d
G0.36 ± 0.02 b0.51 ± 0.02 c0.43 ± 0.08 d0.58 ± 0.02e0.79 ±0.02 f
Amax1.38 ± 0.02 b1.65 ± 0.64 c1.35 ± 0.22 b1.07 ± 0.06 d0.70 ± 0.04 e
AWCD0.85 ± 0.04 b0.98 ± 0.05 c0.96 ± 0.12b c0.58 ± 0.04 d0.24 ± 0.04 a
Avt5041.35 ± 1.23 b52.05 ± 0.90 c41.95 ± 3.27 b55.06 ± 1.51 a,c39.82 ± 2.07 b
C, %38.92 ± 1.50 b25.45 ± 1.78 c29.52 ± 2.30 c28.61 ± 1.41 c39.27 ± 4.82 b
A, %5.66 ± 0.24 b15.68 ± 2.74 c8.81 ± 3.36 b,d14.93 ± 1.72 c10.14 ± 2.67 d
AA, %15.66 ± 1.70 b23.80 ± 0.51 a20.49 ± 1.64 a23.04 ± 2.30 a24.71 ± 1.72 a
CA, %17.92 ± 1.99 b16.59 ± 1.63 b19.41 ± 2.54 b18.20 ± 3.00 b7.83 ± 3.71 c
PA, %3.57 ± 0.88 b5.90 ± 0.52 c6.57 ± 1.48 c6.45 ± 1.48 c11.04 ± 0.24 a
S, %6.43 ± 0.52 b5.84 ± 1.79 b7.33 ± 0.12 b3.08 ± 0.12 b4.61 ± 0.31 b
P, %11.84 ± 0.40 b6.75 ± 0.28 c7.52 ± 1.16 c6.19 ± 2.09 c,d4.02 ± 0.00 d
C-USE, %92.22 ± 5.09 a82.22 ± 6.94 b88.89 ± 13.88 b64.44 ± 5.09 c35.52 ± 1.92 d
P-USE, %4.82 ± 0.37 b2.03 ± 0.07 b1.25 ± 0.62 b0.00 ± 0.00 a0.00 ± 0.00 a
N-USE, %29.47 ± 1.75 a45.72 ± 3.25 b38.82 ± 0.98 c45.34 ± 3.10 b47.06 ± 2.82 b
H’ECO—Shannon–Weaver diversity index; S—metabolic richness index; G—Gini coefficient; Amax—maximum microbial activity; AWCD—average well color development; Avt50—time at which the total microbial activity increased at the fastest rate; C—carbohydrates; A—amines; AA—amino acids; CA—carboxylic acids; PA—phenolic acids; S—surfactants; P—polymers; C-USE—carbon use index; P-USE—phosphorus use index; N-USE—nitrogen use index. Different letters indicate statistically significant at p < 0.05 differences among means.
Table 6. The percentages of distinct FAME markers, H’, sat/unsat, anteiso/iso, and cy/pre ratio for the untreated AS and treated with the KPL.
TreatmentSBR0dSBRC32dSBRC64dSBRKPL32dSBRKPL64d
TB37.99 ± 0.00 a37.09 ± 2.12 a35.53 ± 0.52 a26.14 ± 0.94 b30.83 ± 0.47 b
BG−33.20 ± 0.00 a31.33 ± 2.11 a,b29.64 ± 0.94 b20.00 ± 0.74 c18.56 ± 0.11 c
BG+5.97 ± 0.00 a5.75 ± 0.01 a5.90 ± 0.42 a5.94 ± 0.21 a12.27 ± 0.58 b
Ac0.30 ± 0.00 a0.24 ± 0.01 a0.31 ± 0.02 a2.42 ± 0.25 b2.79 ± 0.04 b
F7.49 ± 0.00 a7.19 ± 1.32 a6.82 ± 0.34 a3.94 ± 0.04 b2.95 ± 0.43 b
Pr2.14 ± 0.00 a1.98 ± 0.10 a2.21 ± 0.17 a1.09 ± 0.05 b0.82 ± 0.09 b
BG+/BG−0.19 ± 0.00 a0.18 ± 0.01 a0.20 ± 0.02 a0.27 ± 0.00 b0.66 ± 0.04 b
F/TB0.19 ± 0.00 a0.19 ± 0.03 a,b0.19 ± 0.02 ab0.16 ± 0.01 b0.09 ± 0.01 c
H’FAME2.83 ± 0.00 a2.91 ± 0.05 a2.85 ± 0.02 a2.68 ± 0.14 b2.56 ± 0.00 c
sat/unsat0.89 ± 0.00 a0.85 ± 0.05 a0.84 ± 0.08 a1.46 ± 0.07 b1.73 ± 0.03 b
anteiso/iso0.70 ± 0.00 a0.71 ± 0.09 a0.39 ± 0.03 b0.89 ± 0.20 c1.43 ± 0.10 d
cy/pre0.01 ± 0.00 a0.00 ± 0.00 a0.01 ± 0.00 a0.25 ± 0.00 b0.46 ± 0.03 b
TB—total bacteria; BG−—Gram-negative bacteria; BG+—Gram-positive bacteria; Ac—Actinomycetes; F—fungi; Pr—protozoa; H’FAME—Shannon–Weaver diversity index; sat—saturated fatty acids; unsat—unsaturated fatty acids; anteisoanteiso-branched saturated fatty acids; isoiso-branched saturated fatty acids; cy—cyclopropane fatty acids; pre—saturated fatty acid precursors. Different letters indicate statistically significant at p < 0.05 differences among means.

