Geomorphodynamics in Argan Woodlands, South Morocco
by
 ,
,
Mario Kirchhoff
1,*, 
Lars Engelmann
1,
Lutz Leroy Zimmermann
1,
Manuel Seeger
1, 
Irene Marzolff
2,
Ali Aït Hssaine
3 and
Johannes B. Ries
1 1
Department of Physical Geography, Trier University, DE-54286 Trier, Germany
2
Department of Physical Geography, Goethe University Frankfurt am Main, DE-60438 Frankfurt am Main, Germany
3
Department of Geography, Université Ibn Zohr, MA-80060 Agadir, Morocco
*
Author to whom correspondence should be addressed.
Water 2019, 11(10), 2193; https://doi.org/10.3390/w11102193
Submission received: 30 August 2019
/
Revised: 15 October 2019
/
Accepted: 16 October 2019
/
Published: 22 October 2019
(This article belongs to the Special Issue The Effect of Hydrology on Soil Erosion)
Abstract
:The endemic argan tree (Argania spinosa) populations in South Morocco are highly degraded due to their use as a biomass resource in dry years and illegal firewood extraction. The intensification and expansion of agricultural land lead to a retreat of the wooded area, while the remaining argan open woodlands are often overgrazed. Thus, canopy-covered areas decrease while areas without vegetation cover between the argan trees increase. In total, 36 rainfall simulation experiments as well as 60 infiltration measurements were conducted to investigate the potential difference between tree-covered areas and bare intertree areas. In addition, 60 soil samples were taken under the trees and in the intertree areas parallel to the contour lines. Significant differences using a t-test were found between tree and intertree areas for the studied parameters Ksat, Kh, pH, electric conductivity, percolation stability, total C-content, total N-content, K-content, Na-content, and Mg-content. Surface runoff and soil losses were not as conclusive but showed similar trends. The results showed that argan trees influence the soil underneath significantly, while the soil in intertree areas is less protected and more degraded. It is therefore reasonable to assume further degradation of the soil when intertree areas extend further due to lack of rejuvenation of argan trees.
1. Introduction
Soil erosion is a serious issue which endangers sustainable land use strategies, especially in arid and semiarid regions [1,2,3]. Water and wind as erosive factors degrade the land, their importance varies depending on the region [4,5]. In Morocco, water is often the crucial erosive force [5]. Most of the time only a few strong events are responsible for the majority of soil losses [6,7]. Due to the small amount of precipitation coupled with its great variability, rangeland is more common in these arid regions than farmland. Therefore, agrosilvopastoral systems are the most typical land uses. These forms of land use often become established in the dryland forests which occur naturally in these areas [3,7]. Forest degradation as a consequence of erosion and mismanagement is a common phenomenon in these dryland forests. It has been recorded all over the world (e.g., in Spanish dehesas [8], Algerian oak forests [9], Moroccan argan woodlands [3], and Mongolian forest steppes [10]). While the degradation dynamics are well understood in some regions, there is a lack of knowledge elsewhere. For example, in the Spanish dehesas, there are studies regarding the interrelations between rainfall intensity, vegetation cover, grazing and soil loss [6], the influence of vegetation on moisture conditions in the soil [7] and the connection between soil conditions, vegetation cover, and pasture production [2]. Furthermore, the influence of patchy vegetation on soil conditions beneath is highlighted around the world [11,12,13,14,15,16]. Typically, there is an enrichment of organic matter and nutrients under plants. Therefore the term “fertile islands” is often used for patchy vegetation in dry regions [14,15]. It is likely that these “fertile islands” are better protected against soil loss, because the input of organic matter in the soil is crucial for its resistance against erosion [17,18,19,20].
Corresponding studies for the Moroccan argan woodlands investigating the interaction between soil, vegetation, and erosion processes are missing, although protection of argan trees and land-use strategies around them have been stipulated by UNESCO since 2014. Reasons for this are the complex socioeconomic structures behind the argan economy and argan oil which is in growing demand around the world [21]. A massive decline of argan tree density from 27 to 15 trees ha−1 between 1970 and 2007 shows that protection of these dryland forests is necessary to preserve them [3]. Argania spinosa is endemic in southern Morocco and has a small dispersal area of ~950,000 ha [3] which is mostly limited to the Souss basin [22]. Although Argania spinosa is well adapted to the dry conditions of Morocco’s southwest, the population is endangered because it is the only source of forage in dry periods [3,22]. In consequence, there is a high pressure of use by the local population and their goat herds, as well as by nomadic tribes and their goat and dromedary herds [23]. In addition, the fruits of Argania spinosa are collected to produce argan oil, which is sold for cosmetic and culinary usage [3]. In other areas, access for animals is not permitted and speculative rainfed agriculture is practiced [23]. Especially overgrazing and deforestation lead to varying tree-crown sizes and growth forms, smaller numbers of trees per hectare, and a lower proportion of covered soil [23,24] (Figure 1). As a result, there is less protection against surface runoff, desiccation is smaller, soils become more degraded, young sprouts cannot grow, and thus, the vegetation cover further declines.
While various studies have investigated the degradation of argan trees [3,22,25,26], there is a lack of knowledge regarding the connection between vegetation degradation and soil degradation as well as soil loss. Other studies have already shown that there are strong erosive processes in the Souss valley [27]. Usage on the sites is not only limited to the area between the trees. The soil is often cultivated between the trees and under the tree crowns. Herds of goats, sheep, and dromedaries graze and browse the tree area most of all, thus possibly compacting the soil beneath the crown as was demonstrated by Mulholland and Fullen on loamy sands and Stavi et al. [28,29]. It is unknown if the soils beneath argan trees are already so degraded that, should the tree be removed, young sprouts would not be able to grow. If this is already the case in the intertree areas, a regeneration even by afforestation is unlikely to be successful. The main aim of this study is to analyze the interaction between argan trees and multiple soil parameters, such as C-content and N-content, as indicators for erosion stability. Our main hypothesis is that the soils in the tree area are more protected from rain, splash erosion, and surface wash and thus show less degraded soils than the unprotected intertree areas. Consequently, the securing of adequate tree density would be an important step towards sustainable land management in southern Morocco. Yet, the soils beneath the trees have been the subject of potentially degrading factors. If a difference between the soil parameters exists, the extent to which they differ is an important indicator for the degradation of soils in the intertree and tree areas. To test this hypothesis, measurements of erodibility and soil characteristics were taken under trees and in corresponding intertree areas at 30 test sites of 1 ha each and statistically analyzed.
2. Materials and Methods
2.1. Study Area
The study areas are located in the western part of the Souss basin in southwest Morocco (Figure 2).
The Souss basin, between 30° and 31° northern latitude and 9° and 7° western longitude, is contained by the High Atlas Mountains in the North, the Anti-Atlas Mountains in the South, and the connection of both mountain regions in the Siroua formation in the East and the Atlantic Ocean in the West. Its east–west extension stretches for about 200 km with a total catchment area of approximately 16,000 km2 [31], making it a transition zone between the Atlantic coastal landscape and the Sahara Desert [32]. Palaeozoic and Mesozoic structures of the High Atlas and Precambrian structures of the Anti-Atlas are separated by the Atlasic fault in the Siroua region. Igneous and metamorphic rocks crop out in the western and central Anti-Atlas (Siroua region). On the piedmont of the High Atlas, as well as in the Souss basin, a Cretaceous–Eocene succession is overlain by thick Pliocene and Quaternary deposits, including significant fluvial–lacustrine sequences [33], which again are overlain by coarse-grained, often carbonate-encrusted, alluvial deposits on the fans [34]. A precise geomorphological characterization of this area was published by Aït Hssaine and Bridgland [35] and a further detailed description of the geomorphological evolution of the foothills of the High Atlas near Taroudant was given by Aït Hssaine [36]. Intense morphodynamics are permanently reshaping the substrate. Mostly immature profound raw soils with mixed substrate and slow pedogenesis are found, with high proportions of fine sand, silt, and clay [37]. Ghanem [38] differentiated three different soil types using the French soil classification. According to the World Reference Base (IUSS-WRB 2015) they are classified as Fluvisols, Regosols as well as a mixture of the first soil type and Regosols—soils from different origins, phases, and soil associations—which contain a mixture of sand, silt, and clay [37,38]. Loams and sandy loams are found most often on the test sites.
Vegetation cover consists of subtropic, desert, and Mediterranean species. In addition to Argania spinosa, also Acacia, Euphorbia, Artemisia herba-alba, and Ziziphus are common in the south Moroccan bush and shrub landscape. Gramineous species include Dactylus glomerata, Cynodo dactylon, and Andropogon hirtus. In years with high precipitation Tamarix, Salicornia, and Salsola can also grow. For the last several decades, a highly dynamic land-use change in the Souss basin has been taking place, accompanied by labor migration [39]. Land use is dominated by citrus fruit and banana plantations which are irrigated by deep wells [37]. To use the percolating water efficiently, irrigated fields are often additionally surrounded by trees such as apple, walnut, almond, olives, and date palms [40].
The three study areas are all part of the Souss region. They are called Ida-Outanane, Taroudant, and Aït Baha. In these study areas, 30 test sites were chosen with an extent of 100 × 100 m. There are 6 in Ida-Outanane, 11 in Taroudant, and 13 in Aït Baha. Since argan trees grow in the High Atlas, as well as the Anti-Atlas, and in continental or maritime climate, the study areas were chosen to encompass these different settings. Ida-Outanane and Taroudant are both situated on the southern foothills of the High Atlas yet they differ in climate. In general, climate is characterized by a hot dry summer and a mild winter with short rain periods with high variability, as typical for B climates in the Köppen and Geiger climate classification [41]. Precipitation rates range from less than 300 mm y−1 in the center plains of the Souss basin to more than 500 mm y−1 toward the High-Atlas and the Siroua summits. Like rainfall intensities, the temperature range highly depends on the altitude with a mean annual temperature of 20 °C [31]. Ida-Outanane is influenced by a maritime climate with a mean annual temperature of 14 °C and nearly 400 mm precipitation annually, while Taroudant is further inland with a more continental climate and 20 °C annual temperature and 220 mm precipitation [42]. Aït Baha lies in the northern foothills of the Anti-Atlas. Although closer to the Atlantic Ocean than Taroudant it is also influenced by a more continental climate with 16 °C annual temperature and nearly 300 mm precipitation. This is accounted for by a higher dependence on altitude for precipitation and temperature rather than distance to the ocean as national meteorological data shows [43]. Precipitation varies unevenly in between years with the most chance of rainfall in the late autumn to early spring. Kirchhoff et al. showed precipitation data from 2011–2014 for the study site of Taroudant with varying rainfall [27]. To ensure comparability across the three study areas in spite of the differences in altitude, climate conditions, and soil types, land-use/environmental characteristics were included as classification parameters for grouping the test sites (see Figure 3; Table 1). These land-use/environmental attributes were used to differentiate two or three neighboring test sites by their principal characteristics. The attributes were cultivated (c; silvo-agricultural land use with recent or anterior signs of ploughing; 5 test sites), afforestation (a; 2 test sites), excluded (x; fenced, no grazing allowed; 3 test sites), browsed (b; excessive browsing leading to cone-shaped growth of trees/bushes; 1 test site), dense (d; dense growth due to large crowns or numerous trees; 2 test sites), gullies (g; site strongly incised by gullies; 1 test site), logged (l; once covered with argan trees, but now bare; 1 test site), rock fragment cover (r; high rock fragment cover >80%; 1 test site), steep slopes (s; steeper than 10°; 1 test site), terraced (t; 2 test sites), and nonspecific (n; silvopastoral land use; 11 test sites). It is important to stress that the test sites do not always conform to only one characteristic (e.g., some excluded test sites can also be situated on steep slopes), but the exclusion is important to differentiate between the two sites.
To test the hypothesis, rainfall simulation and infiltration experiments were conducted, and soil samples were taken in pairs (in tree and intertree areas). Each sample pair consists of one sample beneath an argan tree and one beyond this tree’s crown in the intertree area. The location for a tree sample was between the trunk and the canopy edge, while the intertree sample was taken halfway between the sample tree and its closest neighbor, parallel to the contour lines. The trees chosen for analysis were as representative as possible for the surrounding area regarding their size, degradation status, and the distance between the sampling tree and its neighbor. The intertree areas were mostly bare with a rather high stone cover, while the tree areas showed vegetation cover in various percentages.
2.2. Rainfall Simulations
A small modified nozzle-type rainfall simulator was used [44], for which a detailed description is available in Iserloh et al. [45]. The test plots were circular with a diameter of about 60 cm and the total area encompassed 0.28 m2. The plots were sprayed from a height of 2 m using a nozzle of the type Lechler 460.608. A rainfall intensity of 40 mm h−1 was calibrated and maintained during the experiment by managing the flow control. This rainfall intensity (including kinetic energy and drop size distribution) and calibration were described by Iserloh et al. [45,46] to obtain reproducible and comparable results to regions with differing natural rainfall intensities. Calibrations were carried out in the beginning and end of the experiment. The intensity needed to be constant (the difference should not exceed 5–10%) to qualify as a successful experiment. The duration of each experiment was 30 min. A total of 36 rainfall simulation experiments were carried out between October 2018 and February 2019; corresponding tree and intertree tests for any site were conducted on the same day to minimize changes in external conditions. Of the 30 test sites, 18 sloped test sites were chosen (>1°), since on the remaining 12 flat test sites with slopes from 0–1° surface runoff would not have moved downslope; rather small changes in roughness would have made measurement of surface runoff and soil erosion difficult and not representative of the test site. Simulating rainfall under trees the same way as on bare intertree areas was not possible, yet the results of the rainfall simulations give information about the erodibility of the soils underneath tree cover and in between trees.
Before the experiment, plot characteristics such as slope, vegetation, and stone cover, and antecedent soil moisture were measured. Soil surface roughness was measured with the chain method. To obtain the chain roughness (Cr) index, the following equation (Equation (1)) was used [47,48]:
where L1 (m) is the distance over the surface and L2 (m) is the distance from one end of the plot to the other measured with a ruler.
Cr = (1 − L2/L1) × 100,
The 30 min experiment was divided into 6 intervals of 5 min. The total runoff and eroded sediment were sampled in PE (polyethylene) bottles, which were changed at the start of every interval. The bottles were weighed in the laboratory, the runoff was calculated by subtracting the weight of the empty bottle and the weight of the sediment. Each bottle was filtered separately with circular fine-meshed filter papers to obtain the amount of eroded sediment for each interval.
2.3. Infiltration Measurements
In addition to the rainfall simulations, two different methods of infiltration measurements were used to obtain information about both infiltration rates [49] and hydraulic conductivity in saturated and unsaturated states. These measurements were carried out in the nearest possible distance and at the same time or directly before/after the rainfall simulations for a high comparability of soil properties. On 30 test sites 60 infiltration measurements with one constant-head single-ring infiltrometer and 480 hydraulic conductivity measurements with two tension-disc infiltrometers in total were conducted over two measurement periods of several weeks in autumn/winter 2018 and spring 2019.
2.3.1. Constant-Head Single-Ring Infiltrometer
The infiltrometer used (Figure 4a) consists of an iron ring with a diameter of 15 cm that is carefully inserted vertically at least 5 cm into the soil to minimize the disturbance of the plot. The ring is topped with a float assembly linked to a water column to assure a constant ponding height of 5 cm. The ponding height of 5 cm is generally the chosen height for infiltration measurements due to the required correction calculations (single-ring measurements overestimate actual infiltration rates primarily due to unaccounted lateral seepage) as given by Tricker [50]. The constant water output due to the float assembly differs from the commonly used single-ring infiltrometers after Hills [51]; a detailed description of this method is given by Link [52]. The experiment starts when the ponding height is reached and takes 60 min. The plot cover was recorded before (Figure 4b) and profile and soil samples were taken after the experiment (Figure 4c). Regular tap water was used. Measurements of the sinking water column were done in intervals differing between 5 s at the beginning to 5 min in the last 40 min of the experiment, as was done by Peter and Ries [49]. Steady-state flow rates were attained mostly within the first 10 min of the experiment. Knowing the amount of infiltrated water over the time intervals with the dimensions of the ring and water tank, infiltration rates can be easily calculated [53]. With these recorded infiltration rates the coefficient of permeability could be calculated using the method of Elrick and Reynolds [54].
2.3.2. Tension-Disc Infiltrometer
To measure the unsaturated hydraulic conductivity of the soils, the “minidisk” tension-disc infiltrometer by Decagon Devices, METER Group Inc. (METER Group Inc., Munich, Germany) was used (Figure 5a). The tube-shaped device is divided into two water chambers, the lower part ending in a sintered steel disc using the principle of a Mariotte’s bottle and the upper part or bubble chamber controls the negative pressure. By being able to adjust the pressure or suction it is possible to eliminate the effect of macropores with an air entry volume smaller than the suction. With the water under tension it does not enter the macropores, but rather flows deeper into the soil as determined by the hydraulic forces [55]. The sintered steel disc has a diameter of 4.5 cm, and the 20-cm high water reservoir can hold up to 135 mL water. Regular tap water was used as well. Other than single-ring measurements, an experiment with the minidisk infiltrometer just takes 15 min for one suction rate and uses a smaller amount of water; therefore, it was possible to carry out more runs in the same amount of time. A total of 480 measurements were recorded, with suctions of −4, −2, −1, and −0.5 cm on every plot. Two measurements were conducted for every plot and every suction for tree and intertree areas on all 30 test sites. It is worth mentioning that a thin layer of fine sand (Figure 5b) was added to level the plot underneath the disc and guarantee full contact and an optimal hydraulic connection to the soil surface (see also Perroux and White [56]). The change in water column was read every minute in the beginning to every 3 min at the end of the experiment. To determine the hydraulic conductivity from the collected data the method of Zhang [55] was chosen. It requires measuring cumulative infiltration versus time, which uses the slope of the curve of the cumulative infiltration versus the square root of time C1 divided by the van Genuchten parameter A [57] for the sampled soil:
The van Genuchten parameters for 12 different texture classes were obtained from Carsel and Parrish [58].
The single-ring infiltrometer measures maximum infiltration capacity and saturated hydraulic conductivity of the soil using a constant ponding head, pressing water into the soil in a three-dimensional way [49], while the tension-disk infiltrometer measures soil matric potential with a negative suction excluding the influence of macropores in an unsaturated state. With these methods it is possible to determine the unsaturated hydraulic conductivity from tension-disc infiltrometer data and thus to compare saturated and unsaturated hydraulic conductivities of the soils (see also Reynolds et al. [59]).
2.4. Soil Analyses
Disturbed paired soil samples were taken at the surface up to a depth of 5 cm. The soil samples were air-dried. Afterwards the fine soil was separated from the coarse soil by dry sieving to 2 mm. The soil material referred to in the following section is this separated fine fraction. The pH value was measured in a solution with 0.01 M CaCl2. For the determination of the electrical conductivity of each soil sample the method described in DIN ISO 11265:1997-06 [60] has been followed. The WTW Multi 3410 Set Tetra Con was used as a measuring device for the pH value and electrical conductivity. Furthermore, the particle size distribution of the fine fraction was determined, using the pipette analysis as described by Köhn [61].
The percolation stability was measured as proposed by Becher and Kainz [62] and described further by Auerswald [20] and Becher [63]: 10 g of air-dried, 1–2 mm aggregates were put in plexiglass tubes. Both ends of the tube were filled with a thin layer of sand. To ensure tight and homogenous packing, the tube was tapped 20 times from a height of 2 cm onto a hard surface. Demineralized water was used at a constant head of 20 hPa, which was maintained by a Mariotte bottle. This bottle sat on a balance, continuously measuring and sending data to a connected computer. With the inflow of water into the tube, inflow rates could be determined every 10 s for a total runtime of 10 min. When measuring a high throughflow the aggregates remained stable and maintained bigger pores; with low throughflow aggregates broke apart and started slaking, causing the water to only flow through the smallest pores [20,63]. Afterwards, the percolation stability was corrected for total sand as proposed by Mbagwu and Auerswald [64].
The total soil–carbon concentration and the nitrogen concentration were analyzed with the Euro CHNS Elemental Analyzer 3000 built by HEKAtech. The dry combustion took place in a concentrated oxygen atmosphere with the addition of helium as a carrier gas at 1010 °C. To ensure accurate results, each sample was measured twice and after 10 measurements, two standards with known carbonate content were measured to verify the calibration. Other studies have already shown a link between the presence of vegetation and the concentration of total carbonate and nitrogen (e.g., in Spanish and Chinese soils [15,65]). Considering random preliminary investigations, the determination of the organic carbon content was dispensed with in this paper. Most of the measured total carbonate has an organic origin; inorganic carbon ranged from 0%–13% of the total carbon.
The content of exchangeable cations was determined using the flame-emission spectrophotometer AA240 built by Varian. To measure the Ca2+, Mg2+, K+, and Na+ content, these exchangeable cations were replaced with NH4Cl. A determination of the exchangeable H+ ions did not take place. To ensure accurate results once again, each sample was measured twice and for each cation three blank values were determined. The cation-exchange capacity was calculated by summing up all cation contents.
2.5. Statistical Analyses
To find potential differences between the means for tree and intertree areas for each studied parameter, a t-test was used. Significant differences between the two areas are present when the p-value is <0.05. The t-test analysis was carried out using the software Microsoft Excel 2016 (Microsoft, Redmond, WA, USA).
Furthermore, a two-step cluster analysis was used to recognize potential patterns in the data. The software IBM SPSS Statistics 25 (IBM, Armonk, USA) was used to carry out this analysis. All data was scaled metrically. Since clustering of all the variables only resulted in one cluster, the results were split between rainfall simulation results and soil analysis/infiltration results. The variables were chosen in a way so that at least two clusters could be differentiated. To cluster the results of the rainfall simulations, the variables suspended sediment load, surface runoff, suspended sediment concentration and slope were used. For a cluster analysis of the soil and infiltration data, the variables total carbon content, total nitrogen content, corrected percolation stability, Ksat value, vegetation cover, stone cover, pH value, electrical conductivity, and cation concentrations of K, Mg, and Na were used. Each cluster was assigned a number (e.g., cluster 1 = 1, cluster 2 = 2) to facilitate further analysis and find the “explaining” variables for the differences between the clusters.
The results are represented by box plots which show the medians as a solid line, means as a dashed line, as well as outliers.
3. Results
3.1. Rainfall Simulations
3.1.1. Environmental Plot Characteristics
Several differences can be noted regarding the plot characteristics. In Table 2 tree and intertree areas are compared through slope, vegetation cover, stone cover, and soil moisture. The slope is quite similar in both tree-covered and bare intertree areas, as is the surface roughness. Vegetation cover on the ground (undergrowth for tree area) shows a significant difference in the means between tree and intertree areas with 36.8 ± 28.4% and 10.2 ± 14.1%, respectively. Stone cover is significantly different as well, with higher percentages in the intertree plots than tree plots. The soil moisture before the rainfall simulations varied between 14.6% and 0.1% for the tree areas and between 12.9% and 0.1% for the intertree areas, leading to a slightly higher soil moisture mean for the tree areas.
3.1.2. Soil Loss, Surface Runoff, and Sediment Concentration
The results of the 36 rainfall simulations are presented in Figure 6. They are shown as boxplots with the total averages as well as median and 5th/95th percentile for the tree (T) and intertree (IT) areas.
The rainfall simulations in the tree-covered areas show a total average suspended sediment load (SSL) of 16.35 g m−2 with a maximum value of 54.16 g m−2. The surface runoff (AO) shows a mean value of 5.86 L m−2 and the maximum runoff in the tree area is 14.75 L m−2. Therefore, the suspended sediment concentration (SSC) averages 2.18 g L−1, showing a maximum value of 5.48 g L−1. The mean runoff coefficient (RC) is 28.9% and the maximum value amounts to 76.1% of simulated rain on the plot as runoff. Thereby, the infiltration coefficient (IC) averages 71.1% and the minimum coefficient of infiltration shows only 23.9% of rainfall infiltrating into the soil under tree-covered areas.
The mostly bare intertree areas average suspended sediment loads of 43.25 g m−2 with a maximum value of 331.19 g m−2. The mean runoff is 7.69 L m−2 and the maximum runoff amounts to 15.72 L m−2. The mean SSC reaches 4.42 g L−1 and its maximum shows 22.65 g L−1. A mean of 39.08% of the simulated rainfall was collected as runoff while an average of 60.92% infiltrated into the soil. The maximum RC shows 78.44%, with the resulting IC at a minimum of 21.56%.
Over the 30 min experiment, six out of 36 simulations produced no runoff and suspended sediment, four of these were situated in tree-covered areas, while the remaining two were conducted in the intertree areas. A t-test was used to identify potential significant differences of SSL, AO, SSC, RC, and IC between tree and intertree areas. For none of the parameters was a p-value < 0.05 reached. A p-value < 0.1 was observed for SSC. Differences in the data can be observed visually, showing a wider range of data for the intertree areas compared to the tree areas especially for SSL and SSC (amplitudes for T SSL: 54.16 g m−2; IT SSL: 331.19 g m−2; T SSC: 5.48 g L−1; IT SSC: 22.65 g L−1). If the rainfall simulations of ABH2c (IT) and BOU1b (T) are removed as outliers, this difference in amplitudes is not as clearly distinguishable (amplitudes for T SSL: 42.90 g m−2; IT SSL: 100.99 g m−2; T SSC: 5.00 g L−1; IT SSC: 7.16 g L−1). Although not statistically significant, possibly due to inherent disparity of the study areas, a difference between each test site’s tree and intertree areas may be observed. Figure 7 shows each test site’s tree and intertree SSC. Out of 18 test sites, 12 showed higher SSC values in the intertree area, while five showed higher SSC values in the tree area. Only at test site AZR1c was no runoff and suspended sediment load, and thus no SSC, measured.
Figure 7 also arranges the test sites to each study area to show potential differences between test sites. Although the study area of Ida-Outanane does not show any SSC in half of the experiments, the other half show similar values as the other study areas. Aït Baha shows the highest SSC values, but otherwise does not differ much from the rest of the study areas. The mean and median values for Aït Baha are 4.22 g L−1 and 3.41 g L−1, for Taroudant 2.70 g L−1 and 2.66 g L−1, and for Ida-Outanane 1.73 g L−1 and 0.77 g L−1, respectively.
3.1.3. Cluster Analysis for Rainfall Simulations
The two-step cluster analysis for the rainfall simulations shows a good cluster quality with two clusters found out of the four variables used. The predictor influence ranges from 1.0 to 0.06. SSC is the most important predictor (1.0), followed by SSL (0.64), and AO (0.20). The predictor with the least influence is slope (0.06). Out of 36 test sites, 19 belong to the first cluster. As presented in Table 3, cluster 1 shows the lower values for all the variables. The last column (tree/intertree) indicates the relationship of tree or intertree area test sites in each cluster. Cluster 1 contains 15 tree areas and four intertree areas, while cluster 2, with higher values for SSC, SSL, AO and in parts slope, includes 14 intertree and three tree areas.
3.2. Infiltrations
The maximum or potential infiltration rates could be measured by means of the constant-head single-ring infiltrometer. In total, 60 infiltration measurements were carried out on all 30 test sites, one for the tree area and the other one for the intertree area. Mean infiltration rates were measured as 452.57 mm h−1 for tree areas and 229.56 mm h−1 for intertree areas. Minimum values did not differ greatly with 52.60 mm h−1 in the tree area (test site ABA1n) and 54.13 mm h−1 in the intertree area (test site ABH2c). Maximum values of 1556.14 mm h−1 were almost certainly outliers due to interflow activation on a steep gravelly slope. The maximum value for the intertree areas with 566.26 mm h−1 was measured on a slope of 0°, eliminating this possibility.
The saturated hydraulic conductivity (Ksat) measured with the single-ring infiltrometer is depicted in Figure 8a. Although the minimum and maximum values of the tree area are respectively lower and higher than any values in the intertree area, the tree areas (203.19 mm h−1) average a higher Ksat value than the intertree areas (144.39 mm h−1). In comparison to the amplitude of 410 mm h−1 in the tree areas, the intertree areas have a rather small amplitude of resulting Ksat values with 133.18 mm h−1. This high variability of Ksat has been noted in previous studies [66,67], yet it is only visible in tree areas. However, there is a significant difference of the means between tree and intertree area (p < 0.01).
In Figure 8b the differences between the study areas are shown. The study area Aït Baha displays the lowest Ksat values (mean: 166.43 mm h−1), followed by Taroudant (mean: 171.40 mm h−1), while Ida-Outanane displays the highest values (mean: 193.74 mm h−1) and the highest range (excluding outliers). All three have similar minimum values (Aït Baha 93.54 mm h−1, Taroudant 93.91 mm h−1, Ida-Outanane 106.60 mm h−1), yet Aït Baha shows the lowest mean and the lowest minimum, but the highest maximum with 503.64 mm h−1. Although there are differences between the means and the amplitudes of the Ksat values in the three study areas, these are not statistically significant for the means.
Figure 9 shows the unsaturated hydraulic conductivity values for the different suctions used. All four suctions were used on each test site as well as tree and intertree areas. As can be seen, the range of values (excluding outliers) in both the tree and intertree areas increases from higher to lower suctions. This increase in range is not too surprising, because of the differing soil material. While suctions on sandy soils should normally be lower and higher on clayey soils, high suctions on sandy soils lead to a higher throughflow during the infiltration experiments and thus to higher Kh values. The mean Kh values for suction −4 cm are 19.13 mm h−1 for tree areas and 15.81 mm h−1 for intertree areas. They are raised with increasing suction up to 28.89 mm h−1 for tree areas at suction −0.5 cm, at the same suction for intertree areas to 19.65 mm h−1. Significant differences between tree and intertree areas cannot be found for all applied suctions. At the suction −4 cm mean Kh values between tree and intertree areas did not differ significantly, yet at suctions −2 cm, −1 cm, and −0.5 cm these differences were statistically significant (p < 0.05).
Figure 10 displays the differences of the Kh values between the three study areas. As was the case for the Ksat values, the study area of Ida-Outanane shows the highest range and has the highest means. Unlike the Ksat values, the Kh values for Aït Baha are not the lowest but actually display higher means, minimums, and maximums than the study area of Taroudant. Although there are no significant differences in the means between Aït Baha and Taroudant at suctions −4 cm and −2 cm, there are at suctions −1 cm and −0.5 cm (p < 0.05). Significant differences occur between Ida-Outanane and the other two study areas (p < 0.01).
3.3. Soil Analyses
The results of the analyses for the different soil parameters (pH, electrical conductivity, percolation stability, N-content, total carbon (TC)-content, and mean grain size) are shown in Figure 11. The mean pH value for the tree and intertree areas is 7.41 and 7.32, respectively. The values range between 7.67 and 6.93 for tree and 7.58 and 6.85 for the intertree areas. Although the values do not seem to differ much, there is a significant difference in the means (p-value < 0.05). Significant differences between tree and intertree areas are also present for the parameters electrical conductivity (EC, p < 0.001), percolation stability (PS, p < 0.001), N-content (p < 0.001), and TC-content (p < 0.001). The mean grain size does not differ significantly between tree and intertree areas. The mean grain size of all test sites in the tree area is 0.22 mm; in the intertree area it is slightly lower with 0.18 mm. It is obvious that most of the analyzed soil parameters show a higher range of results in the tree area than in the intertree area. While this amplitude is not as pronounced for the mean grain size (0.34 mm and 0.27 mm for tree and intertree areas, respectively), the parameters EC, PS, N-content, and TC-content show a much higher amplitude of values. The EC results in the tree area range between 539 and 190 µS cm−1, while the intertree areas show maximum and minimum values of 283 and 169 µS cm−1, respectively. The values of the percolation stability show means of 183.69 mL 10 min−1 for the tree and 43.23 mL 10 min−1 for the intertree areas, while the amplitudes for tree and intertree areas are 392.27 and 147.43 mL 10 min−1, respectively. The N-content is on average 0.34% in the tree and 0.11% in the intertree areas, while maximum and minimum values are 0.79% and 0.14% for tree-covered areas and 0.42 and 0.05% for intertree areas. TC-content shows similar behavior one order of magnitude higher with a mean of 4.79% (T) and 1.77% (IT). The maximum TC-content in the tree areas is 10.57% and 6.43% in the intertree areas; minimum values are 1.58% and 0.53%, respectively.
The differences in the study areas are given in Table 4. The highest means of pH, EC, TC-content, and N-content are all found in the study area of Ida-Outanane, while Taroudant shows the highest PS and mean grain size. The study areas Aït Baha and Taroudant are similar regarding pH, EC, and mean grain size, yet Aït Baha shows much lower values in TC-content and N-content. Ida-Outanane shows significant differences in the means (p < 0.05) for pH values compared to the other two study areas and for EC, TC-content, and N-content compared to Aït Baha.
The concentrations of basic cations potassium (K), sodium (Na), magnesium (Mg), and calcium (Ca) are presented in Figure 12. The highest contents of the measured cations are found for Ca with mean values of 38.75 cmolc kg−1 for tree sites and 36.83 cmolc kg−1 for intertree sites. Significant differences between the means cannot be observed. However, in spite of smaller values, all other cations measured show significant differences between tree and intertree areas. The means for K are 5.40 and 4.36 cmolc kg−1 for tree and intertree areas, respectively. Na means are even lower with 1.12 cmolc kg−1 (T) and 0.76 cmolc kg−1 (IT). Mg shows similar values as K, with means for the tree area of 6.03 and 5.07 cmolc kg−1 for the intertree area. It is evident from Figure 12 that the amplitude excluding outliers of the intertree area is higher for K and Ca, while this is not as obvious the case for Na and Mg.
Table 5 structures the measured cation concentration contents according to their study area. The study area of Ida-Outanane shows the highest concentrations for K, Ca, and Na and the lowest for Mg. The concentrations of K, Ca, and Na are the lowest in the study area of Aït Baha, while the Mg concentration is highest in this study area. The cation concentrations in the study area of Taroudant are mostly similar to Aït Baha, but a little higher except for Mg. Significant differences (p < 0.05) between the study areas could only be found between Ida-Outanane and the two other areas for Ca, and also between Aït Baha and Ida-Outanane for K.
3.4. Cluster Analysis for Infiltration/Soil Analysis Results
The two-step cluster analysis for the infiltration and soil analysis results shows a medium cluster quality with two classified clusters out of 11 variables used. The predictor influence ranges from 1.0 to 0.13. The principal predictors for the clusters are TC-content (1.0), EC (0.98), and N-content (0.93). Vegetation cover and PS (both 0.75) follow, then Ksat (0.48), pH (0.39), and stone cover (0.25) are less important, while the cation concentrations are the least influential (Na (0.24), Mg (0.16), and K (0.13)). Table 6 shows the means of the inputs of the two clusters with an extra column indicating the relationship of tree or intertree area test sites in each cluster. The seven most influential variables are presented in Table 6. Two intertree areas and three tree areas cannot be attributed to either cluster. Cluster 1 shows the lower mean values for the variables, with six tree areas and 27 intertree areas being attributed to this cluster. Cluster 2 includes 22 tree areas and two intertree areas with the higher mean values for all predictors.
4. Discussion
A comparison between tree and intertree areas in argan woodlands was carried out using rainfall simulations, infiltration measurements, as well as soil analyses. Since this study did not focus on specific tree degradation stages but tried to encompass a multitude of different land uses as well as tree and soil degradation stages, the range of values is not surprising. Disturbance of vegetation, such as loss of herbaceous cover, can lead to an increase in sediment transport and erosion. This is especially true when there is a decrease in woody plant canopy cover from woodlands to shrublands [68], which is partly the case in the argan woodlands with different stages of degradation and a change in canopy cover due to overgrazing [69,70]. The argan woodlands have been degraded because of grazing pressure, rainfed agriculture in silvo-agricultural land uses, as well as fuelwood extraction [3,71], leading to a wider and more disturbed intertree area with less and wider spaced trees [3].
Although significant differences in the t-tests could not be found, most of the test sites showed lower SSC in the tree areas compared to the neighboring intertree areas. Other studies showed higher runoff and erosion rates on bare intercanopy patches compared to canopy-covered areas [72,73], whereas vegetated intercanopy patches showed medium rates of runoff and erosion [72]. Ceballos et al. obtained differing results, where vegetated grassy areas showed little runoff and erosion rates, yet tree-covered areas showed much higher rates due to soil hydrophobicity hindering infiltration [74]. Since rainfall simulations in our study were carried out the same way under trees as in the intertree areas, the rainfall intensity was much higher than under natural conditions, when rainfall may be reduced by 6.6% to 82.7% due to interception [75]. Nevertheless, splash erosion by throughfall drops may be 2.59 times higher than on open fields [76], so the rainfall simulations under the trees should not be equated with natural conditions. It is possible, however, to compare the erodibility [77,78] between tree and intertree areas. The cluster analyses in Table 3 and Table 6 show the tendency of clusters being attributed to tree or intertree areas. Intertree areas with lower SSC, SSL, and AO could all be assigned to active agricultural use with better infiltration potential due to ploughing. The three tree areas belonging to cluster 2 showed degraded tree areas with little to no vegetation cover or organic litter.
Other studies in Morocco, also in the study area of Taroudant, found mean suspended sediment concentrations on fallow land and orange plantations of 2.7 g L−1 [37] compared to lower tree area and higher intertree area means of 2.18 g L−1 and 4.42 g L−1, respectively. Ceballos et al. also showed suspended sediment concentrations for tree-covered areas in the Spanish dehesas which were lower both under dry (mean 0.37 g L−1) and wet conditions (mean 0.65 g L−1) than either tree or intertree areas. Even sheep trails showed lower average SSC (dry: 0.45 g L−1, wet: 0.76 g L−1) [74]. This indicates the higher erodibility of the soils in the Moroccan study areas, especially in the intertree areas that are not protected by vegetation or leaf litter. This extra layer has been found to strongly reduce runoff and sediment loss [79]; it is missing in some test sites such as MAO1n, where higher SSC was measured in the tree area (see Figure 7). Since some test sites are more disturbed and show little to no vegetation in the intertree and tree areas (undergrowth), there are cases where SSC can also be higher in tree areas. Ludwig et al. [80] showed higher runoffs and sediment yields on disturbed areas as compared to undisturbed or only slightly grazed areas. Wind erosion has not yet been studied in these regions, but due to a high crust cover and little loose sediment on the surface, it is assumed to be secondary.
Soil erodibility is, of course, also dependent on aggregate stability. The results differ significantly between the tree and intertree areas. This could also be due to the higher carbon contents in the tree areas, which can lead to the formation of larger aggregates [81,82]. Under agricultural use organic matter content and aggregate stability can decline [83]. This was the case on all test sites that were under agricultural use in the intertree areas, which partly explains the higher SSC on the intertree areas. In some cases, there was nearly no surface runoff until the end of the experiment, which was partly due to infiltration into the loosened soil or enhanced surface roughness by ploughing. As Mbagwu and Auerswald noted, high interrill erosion rates should be expected on soils with a PS <250 mL 10 min−1 [64]. The measured PS was mostly below this value in tree or intertree areas. This could explain the much higher SSC compared to the values of Ceballos et al. [74]. In comparison to the values published by Mbagwu and Auerswald the measured PS ranked very low in many of the studied test sites, with a mean of 43.23 mL 10 min−1 in the intertree area, which is just slightly higher than the minimum value published by the aforementioned authors. Their values for fallows, pastures or (secondary) forests (>250 mL 10 min−1) cannot be repeated in our measurements for most intertree and tree areas. Intertree areas are partly cultivated or unmulched plots which should show medium (250–150 mL 10 min−1) to low PS (<150 mL 10 min−1). They could also be compared to secondary forest subsoil with low PS (<150 mL 10 min−1), since topsoil could have been eroded, thus explaining the low percolation stabilities [64]. Goebel et al. [84] obtained similar results regarding higher aggregate stability in topsoil, and also found higher aggregate stabilities in forest soils than arable soils, which matches the results with higher aggregate stabilities under trees compared to the crusted and mostly eroded intertree areas. Since aggregate breakdown leads to crusting of soil, the infiltration rate decreases with lower aggregate stability and runoff, and sediment detachment occurs [85,86].
The infiltration measurements have shown a significant difference between tree and intertree areas for both unsaturated and saturated hydraulic conductivity, as well as infiltration rates, indicating a better infiltrability into the soil in vegetation patches [80,87]. Lichner et al. [88] noted high Ksat values in forest soils due to the greater presence of macropores, yet found the lowest Kh values for forest sites possibly due to a higher water repellency caused by the coating of soil particles by pine-needle waxes. A study conducted in the southern part of the study area of Taroudant found much lower infiltration rates than the values presented here with a mean of 84 mm h−1 and a maximum of 265 mm h−1 [49]. This study focused on cultivated and leveled landscapes with high soil-crust cover in contrast to the less crusted tree areas or the intertree areas with a higher stone-fragment cover on the surface. The influence of stone cover on infiltration rates may be either positive or negative, depending on the measurement context [89,90]. If the measurements occur between large shrubs, or in this case trees, the influence is positive, yet when shrub and intershrub are compared, the correlation with stone cover becomes negative since the finer sediments under shrubs have a positive effect on infiltration [89]. Thus, compared to the results of Peter and Ries [49], stone cover influences the infiltration in the intertree areas positively, yet tree area infiltration is still mostly higher. Although there are high percentages of sand, mostly in the coarse fraction, in both tree and intertree areas, differences in infiltration rates and hydraulic conductivities could also be due to the plant cover which could maintain macropores on the surface and conduct water into the soil [91], while in the intertree areas vegetation cover is rather low (10.17 ± 14.10%). A higher density of soil underneath the argan trees due to compaction by livestock was not measured in this study but would affect infiltration into the soil negatively [92]. Since the measured infiltration values are higher in the tree area, it suggests that the soil is rather stable against compaction by livestock. The grain size distribution for corresponding tree and intertree areas does not vary much, they are mostly classified as loam, sandy loam, or sandy clay loam.
With a higher vegetation cover and more leaf litter in the tree areas in most cases, the difference in the content of total carbon between tree and intertree areas can be explained. The same is true for the content of total nitrogen, which could also be influenced by the droppings of goats and sheep. During dry years the goats and sheep feed from the trees, which are the only biomass storage in these areas, and are shepherded from one tree to another. Thus, they spend most time in the tree area, possibly influencing the N-content in the soil. Soil microbial communities profit from the higher N-content under the plants [15]. Micro-, meso-, and macro-fauna are drawn to canopy-covered areas, since they are the places with the lowest temperatures in the daytime and the highest soil moisture, even in these very dry climates (see Table 2), and therefore the places where food is most abundant [13]. The higher carbon contents under the trees originate from the litter as well as the undergrowth. Tree or shrub litter has a positive influence on soil carbon as well as on aggregate stability, shear strength, as well as infiltration rates, which in turn leads to greater resistance against runoff and erosion [14,93]. The removal or absence of litter can therefore have a negative influence on the studied soil parameters.
The cluster analysis classifying soil parameters shows that an attribution of tree and intertree areas to specific clusters is in many cases possible. Since total carbon content is the most influential predictor, areas with low total carbon content are often classified into the cluster associated with lower values. On the other hand, agriculturally used intertree areas where organic litter was ploughed into the soil can be classed into the cluster with higher values. Yet, the majority of tree areas is classed into the cluster with generally higher values, while the majority of intertree sites can be associated with the cluster with lower values.
Many studies focus on shrubs and intershrub differences [14,15,94] where the shrub covers the soil well and there is no great distance between the soil surface and the leaf cover of the shrub. It can thus act as an obstacle for runoff and transported sediment. The distance between the canopy of trees and the soil surface is much higher though, resulting in splash erosion due to throughfall and interception, as noted. The influence of leaf litter can prevent soil erosion, yet without litter the canopy-covered area is unprotected against splash erosion as well as from runoff from further upslope, leading to a degradation of the soil in the tree area. Here, different degradation stages of the trees could show a high influence on the results. This depends on the tree architecture. Round, healthy-looking crowns (see Figure 1c) produce a lot of leaf litter, yet the thickness of the litter layer also depends on the height of the tree. The litter from higher trees might be scattered more widely by the wind and therefore not as concentrated as litter from lower trees. Rather low trees can lead to a greater number of sheep (and goats) that could erode the soil further with their hooves [95]. Since sheep do not climb the trees as goats do, they browse only the trees they can reach from the ground. With more open crowns throughfall is higher, while litter concentration is lower. In the case of the argan as a cushion-type shrub with a very dense network of branches and twigs (Figure 1e), the most degraded ‘tree’, the distance between canopy and soil surface is lowest, thus the litter and soil underneath are most protected, although only in a very small area.
Significant differences between tree and intertree areas were also observed for the cation concentrations of K, Mg, and Na. Berthrong et al. [96] noted decreases of Ca, Mg, and K as well as pH and an increase of Na in response to afforestation. For argan afforestation projects in Morocco this potential decrease should be kept in mind. Organic matter also increases the cation exchange capacity and thus the available cations [14].
However, another possible explanation for the differences could be due to coastal fog which is caught by the argan trees [97] and precipitates in the tree area. It is a major source of precipitation for the argan trees, since rainfall is very variable in the study areas [22]. Although fog has lower concentration of nutrients than rain, as shown by Azevedo and Morgan [98], it could still lead to a higher accumulation of cations in the tree area, since precipitation by rainfall influences both tree and intertree areas, but fog predominantly precipitates in the tree area. The occult deposition rates of nutrients by fog decrease with the distance from the ocean [99]. This is shown in the results. Ida-Outanane is the closest study area to the sea and has the highest cation concentrations for K, Ca, and Na. Although the study areas of Taroudant and Aït Baha are situated further from the ocean, fog can occur on the foothills of the High Atlas and Anti-Atlas and be collected by argan plants, as shown in Figure 13; this can therefore lead to a higher concentration of the cations K, Ca, and Na in the tree areas.
The differences in the pH between tree and intertree areas are potentially caused by the source of nitrogen in the soil. If a lot of nitrate (NO3−) is available, the plants will absorb more anions and thus the pH rises. If cations are absorbed the pH decreases in the vicinity of the roots [100,101].
Inter-plant soil properties such as pH, EC, and C:N ratio are all influenced by the adjacent vegetation [15]. This shows the importance of a closer distance between trees rather than an expanding intertree area. Since the distances between the studied trees and their intertree areas are all different depending on the tree density of each test site, variabilities in the values could stem from these differences. The reintroduction of specific tree species into the degraded intertree areas could lead to an increase in carbon and nutrients [102]. Afforestation projects are in process, yet only with limited success, since young argan sprouts need to be protected from grazing animals. This is mostly done by fenced exclusion areas, although the exclusion is in many cases not successful. Break-ins are punishable, but in dry years there is no other food source for the many herds. In addition, young sprouts need a lot of water for several years to develop their roots and be able to reach water deeper in the soil. Dry years often lead to withering of the sprouts, since planting companies are often only engaged for two to three years, which does not give the young sprouts enough time to grow.
5. Conclusions
Tree and intertree areas on 30 test sites covered by argan trees in three study areas in South Morocco were analyzed using rainfall simulations, infiltration measurements, and soil analyses. Significant differences could be found between tree and intertree areas for many soil parameters although the three study areas show (partly significantly) differing results. Two cluster analyses were conducted, one focusing on erosion parameters SSC, SSL, AO, and slope, the other focusing on the soil parameters total carbon content, total nitrogen content, corrected percolation stability, Ksat value, vegetation cover, stone cover, pH value, electrical conductivity, and the cation concentrations of K, Mg, and Na. Each resulted in two clusters which mostly include tree areas in one and intertree areas in the other. However, agriculturally used intertree areas show less erosion in one analysis or high carbon contents in the other and are thus classed into the ‘tree’ cluster, while more degraded tree areas are included in the ‘intertree’ cluster. There are several parameters, like Ksat value, pH, EC, PS, TC-content, N-content, K-content, Na-content, and Mg-content that show that tree and intertree areas in argan woodlands differ significantly, even under various usages and in different study areas. With an expanding intertree area due to overgrazing and expansion of agriculture among others, the soils in these argan woodlands face further degradation. Further research is needed on how different growth forms of the argan trees influence the soil as well as how far the influence of the tree area extends into the intertree area.
Author Contributions
Conceptualization, M.K., M.S., I.M., and J.B.R.; methodology, M.S., I.M., and J.B.R.; investigation, M.K., L.E., and L.L.Z.; resources, M.S., I.M., A.A.H., and J.B.R.; data curation, M.K., L.E., and L.L.Z.; writing—original draft preparation, M.K., L.E., and L.L.Z.; writing—review and editing, M.K. and I.M.; visualization, M.K. and L.L.Z.; supervision, M.S., I.M., A.A.H., and J.B.R.; project administration, I.M. and J.B.R.; funding acquisition, I.M. and J.B.R.
Funding
This research was funded by Deutsche Forschungsgemeinschaft (DFG), grant numbers RI 835/24-1 & MA 2549/6.
Acknowledgments
We hereby acknowledge the support of the laboratories of Trier University as well as of the Université Ibn Zohr Agadir. We also would like to thank Tobias Buchwald, Laura Kögler, Sabrina Reichelt, Robin Stephan, Stefan Weiss, and Nicole Weymann for their considerable help during data acquisition in the field.
Conflicts of Interest
The authors declare no conflicts of interest.
References
- Cerdan, O.; Govers, G.; Le Bissonnais, Y.; Van Oost, K.; Poesen, J.; Saby, N.; Gobin, A.; Vacca, A.; Quinton, J.; Auerswald, K.; et al. Rates and spatial variations of soil erosion in Europe: A study based on erosion plot data. Geomorphology 2010, 122, 167–177. [Google Scholar] [CrossRef]
- Pulido, M.; Schnabel, S.; Lavado Contador, J.F.; Lozano-Parra, J.; Gómez-Gutiérrez, Á. Selecting indicators for assessing soil quality and degradation in rangelands of Extremadura (SW Spain). Ecol. Indic. 2017, 74, 49–61. [Google Scholar] [CrossRef]
- Le Polain de Waroux, Y.; Lambin, E.F. Monitoring degradation in arid and semi-arid forests and woodlands: The case of the argan woodlands (Morocco). Appl. Geogr. 2012, 32, 777–786. [Google Scholar] [CrossRef]
- Breshears, D.D.; Whicker, J.J.; Johansen, M.P.; Pinder, J.E., III. Wind and water erosion and transport in semi-arid shrubland, grassland and forest ecosystems: Quantifying dominance of horizontal wind-driven transport. Earth Surf. Process. Landf. 2003, 28, 1189–1209. [Google Scholar] [CrossRef]
- Dahan, R.; Boughlala, M.; Mrabet, R.; Laamari, A.; Balaghi, R.; Lajouad, L. A Review of Available Knowledge on Land Degradation in Morocco; The International Center for Agricultural Research in the Dry Areas (ICARDA): Aleppo, Syria, 2012; pp. 10–11. [Google Scholar]
- Schnabel, S.; Gómez Gutiérrez, A.; Lavado Contador, J.F. Grazing and soil erosion in dehesas of SW Spain. In Advances in Studies on Desertification; Romero Diaz, A., Belmonte Serrato, F., Alonso Sarria, F., Lopez Bermudez, F., Eds.; Ediciones de la Universidad de Murcia: Murcia, Spain, 2009; pp. 725–728. [Google Scholar]
- Schnabel, S.; Lozano-Parra, J.; Gutiérrez, A.; Alfonso Torreño, A. Hydrological dynamics in a small catchment with silvopastoral land use in SW Spain. Cuadernos de Investigación Geográfica 2018, 44, 557–580. [Google Scholar] [CrossRef] [Green Version]
- Pulido, M.; Schnabel, S.; Lavado Contador, J.F.; Lozano-Parra, J.; González, F. The impact of heavy grazing on soil quality and pasture production in rangelands of SW Spain. Land Degrad. Dev. 2016, 29, 219–230. [Google Scholar] [CrossRef]
- Wojterski, T.W. Degradation stages of oak forests in the area of Algiers. Vegetatio 1990, 87, 135–143. [Google Scholar] [CrossRef]
- Chantsallkham, J.; Reid, S.; Fernandez-Gimenez, M.; Tsevlee, A.; Yadamsuren, B.; Heiner, M. Applying a dryland degradation framework for rangelands: The case of Mongolia. Ecol. Appl. 2018, 28, 1–21. [Google Scholar] [CrossRef]
- Bochet, E.; Rubio, J.L.; Poesen, J. Modified topsoil islands within patchy Mediterranean vegetation in SE Spain. Catena 1999, 38, 23–44. [Google Scholar] [CrossRef]
- Escudero, A.; Giménez-Benavides, L.; Iriondo, J.M.; Rubio, A. Patch Dynamics and Islands of Fertility in a High Mountain Mediterranean Community. Arctic Antarct. Alp. Res. 2004, 36, 518–527. [Google Scholar] [CrossRef] [Green Version]
- Garner, W.; Steinberger, Y. A proposed mechanism for the formation of ‘Fertile Islands’ in the desert ecosystem. J. Arid Environ. 1989, 16, 257–262. [Google Scholar] [CrossRef]
- Pérez, F.L. Plant Organic Matter Really Matters: Pedological Effects of Kūpaoa (Dubautia menziesii) Shrubs in a Volcanic Alpine Area, Maui, Hawai’i. Soil Syst. 2019, 3, 31. [Google Scholar] [CrossRef]
- Qu, L.; Wang, Z.; Huang, Y.; Zhang, Y.; Song, C.; Ma, K. Effects of plant coverage on shrub fertile islands in the Upper Minjiang River Valley. Sci. China Life Sci. 2018, 61, 340–347. [Google Scholar] [CrossRef]
- Schlesinger, W.H.; Pilmanis, A.M. Plant-soil interactions in deserts. Biogeochemistry 1998, 42, 169–187. [Google Scholar] [CrossRef]
- Aguiar, M.R.; Sala, O.E. Patch structure, dynamics and implications for the functioning of arid ecosystems. Trends Ecol. Evol. 1999, 14, 273–277. [Google Scholar] [CrossRef]
- Cerdà, A. Aggregate stability under different Mediterranean vegetation types. Catena 1998, 32, 73–86. [Google Scholar] [CrossRef]
- Cerdà, A. Aggregate stability against water forces under different climates on agriculture land and scrubland in southern Bolivia. Soil Tillage Res. 2000, 57, 159–166. [Google Scholar] [CrossRef]
- Auerswald, K. Percolation Stability of Aggregates from Arable Topsoils. Soil Sci. 1995, 159, 142–148. [Google Scholar] [CrossRef]
- UNESCO. Argan, Practices and Know-How Concerning the Argan Tree. 2015. Available online: www.unesco:Culture/ich/en/RL/00955 (accessed on 22 July 2019).
- Ehrig, F.R. Die Arganie. Charakter, Ökologie und wirtschaftliche Bedeutung eines Tertiärreliktes in Marokko. Petermanns Geographische Mitteilungen 1974, 118, 117–125. [Google Scholar]
- Müller-Hohenstein, K.; Popp, H. Marokko. Ein Islamisches Entwicklungsland mit Kolonialer Vergangenheit, 1st ed.; Klett: Stuttgart, Germany, 1990; pp. 860–862. [Google Scholar]
- Benabid, A. Forest Degradation in Morocco. In The North African Environment at Risk (State, Culture, and Society in Arab North Africa); Swearingen, W.D., Bencherifa, A., Eds.; Westview Press: Boulder, CO, USA, 1996; pp. 175–190. [Google Scholar]
- Culmsee, H. Vegetation und Weidenutzung im Westlichen Hohen Atlas (Marokko). Eine Nachhaltigkeitsbewertung aus geobotanischer Sicht. Dissertationes Botanicae 2004, 389, 1–244. [Google Scholar]
- McGregor, H.V.; Dupont, L.; Stuut, J.-B.W.; Kuhlmann, H. Vegetation change, goats, and religion: A 2000-year history of land use in southern Morocco. Quat. Sci. Rev. 2009, 28, 1434–1448. [Google Scholar] [CrossRef]
- Kirchhoff, M.; Peter, K.D.; Aït Hssaine, A.; Ries, J.B. Land use in the Souss region, South Morocco and its influence on wadi dynamics. Zeitschrift für Geomorphologie 2019, 62, 137–160. [Google Scholar] [CrossRef]
- Mulholland, B.; Fullen, M.A. Cattle trampling and soil compaction on loamy sands. Soil Use Manag. 1991, 7, 189–192. [Google Scholar] [CrossRef]
- Stavi, I.; Ungar, E.D.; Lavee, H.; Sarah, P. Livestock modify ground surface microtopography and penetration resistance in a semi-arid shrubland. Arid Land Res. Manag. 2009, 23, 237–247. [Google Scholar] [CrossRef]
- D’Oleire-Oltmanns, S.; Marzolff, I.; Peter, K.D.; Ries, J.B. Unmanned aerial vehicle (UAV) for monitoring soil erosion in Morocco. Remote Sens. 2012, 4, 3390–3416. [Google Scholar] [CrossRef]
- Elmouden, A.; Bouchaou, L.; Snoussi, M. Constraints on alluvial clay mineral assemblages in semiarid regions. The Souss Wadi Basin (Morocco, Northwestern Africa). Geologica Acta 2005, 3, 3–13. [Google Scholar] [CrossRef]
- Mensching, H. Marokko—Die Landschaften im Maghreb; Keysersche Verlagsbuchhandlung: Heidelberg, Germany, 1957; pp. 210–221. [Google Scholar]
- Ambroggi, R. Etude géologique du versant meridional du Haut-Atlas occidental et de la plaine du Souss. Notes et Mémoires du Service Géologique 1963, 157, 322. [Google Scholar]
- Bhiry, N.; Rognon, P.; Occhietti, S. Origine et diagénèsedes sédiments quaternaires de la vallée moyenne du Souss. Sciences Géologiques Mémoire 1989, 84, 135–144. [Google Scholar]
- Aït Hssaine, A.; Bridgland, D. Pliocene–Quaternary fluvial and aeolian records in the Souss Basin, southwest Morocco: A geomorphological model. Glob. Planet. Chang. 2009, 68, 288–296. [Google Scholar] [CrossRef]
- Aït Hssaine, A. Evolution géomorphologique du piémont sud-atlasique dans la région de Taroudant (SW-Maroc) au cours du Tertiaire et du Pléistocène inférieur. Bulletin de l’Institut Scientifique 2000, 22, 17–28. [Google Scholar]
- Peter, K.D.; d’Oleire-Oltmanns, S.; Ries, J.B.; Marzolff, I.; Aït Hssaine, A. Soil erosion in gully catchments affected by land-levelling measures in the Souss Basin, Morocco, analysed by rainfall simulation and UAV remote sensing data. Catena 2014, 113, 24–40. [Google Scholar] [CrossRef]
- Ghanem, H. Monographie pédologique de la plaine du Souss. Serv. Rech. Ecol. Direction de la Recherche Agronomique 1974, 5, 101. [Google Scholar]
- Rössler, M.; Kirscht, H.; Rademacher, C.; Platt, S. Demographic development in Southern Morocco: Migration, urbanization and the role of institutions in resource management. In Impacts of Global Change on the Hydrological Cycle in West and Northwest Africa; Speth, P., Christoph, M., Diekkrüger, B., Eds.; Springer: Berlin, Germany, 2010; pp. 305–314. [Google Scholar]
- Barrow, C.J.; Hicham, H. Two complimentary and integrated land uses of the western High Atlas Mountains, Morocco: The potential for sustainable rural livelihoods. Appl. Geogr. 2000, 20, 369–394. [Google Scholar] [CrossRef]
- Köppen, W.; Geiger, G. Handbuch der Klimatologie; Gebrüder Borntraeger: Berlin, Germany, 1930; pp. 176–184. [Google Scholar]
- Endlicher, W.; Weischet, W. Regionale Klimatologie: Die Alte Welt: Europa, Afrika, Asien; Teubner: Leipzig, Germany, 2000; pp. 200–202. [Google Scholar]
- Saidi, M.E. Contribution à L’hydrologie Profonde et Superficielle du Bassin du Souss (Maroc). Climatologie, Hydrologie, Crues et Bilans Hydrologiques en Milieu Sub-Aride. Ph.D. Thesis, Cadi Ayyad University, Sorbonne, Paris, France, 1995. [Google Scholar]
- Cerdà, A. Parent material and vegetation affect soil erosion in eastern Spain. Soil Sci. Soc. Am. J. 1999, 63, 362–368. [Google Scholar] [CrossRef]
- Iserloh, T.; Fister, W.; Seeger, M.; Willger, H.; Ries, J.B. A small portable rainfall simulator for reproducible experiments on soil erosion. Soil Tillage Res. 2012, 124, 131–137. [Google Scholar] [CrossRef]
- Iserloh, T.; Ries, J.B.; Cerdà, A.; Echeverría, M.T.; Fister, W.; Geißler, C.; Kuhn, N.J.; León, F.J.; Peters, P.; Schindewolf, M.; et al. Comparative measurements with seven rainfall simulators on uniform bare fallow land. Zeitschrift für Geomorphologie 2013, 57, 11–26. [Google Scholar] [CrossRef]
- Saleh, A. Soil roughness measurement: Chain method. J. Soil Water Conserv. 1993, 48, 527–529. [Google Scholar]
- Thomsen, L.M.; Baartman, J.E.M.; Barneveld, R.J.; Starkloff, T.; Stolte, J. Soil surface roughness: Comparing old and new measuring methods and application in a soil erosion model. SOIL 2015, 1, 399–410. [Google Scholar] [CrossRef]
- Peter, K.D.; Ries, J.B. Infiltration rates affected by land levelling measures in the Souss valley, South Morocco. Zeitschrift für Geomorphologie 2013, 57, 59–72. [Google Scholar] [CrossRef]
- Tricker, A.S. The infiltration cylinder: Some comments on its use. J. Hydrol. 1978, 36, 383–391. [Google Scholar] [CrossRef]
- Hills, R.C. The determination of the infiltration capacity of field soils using the cylinder infiltrometer. Br. Geomorphol. Res. Group Tech. Bull. 1970, 3, 1–24. [Google Scholar]
- Link, M. Das Einring-Infiltrometer mit schwimmergeregelter Überstauhöhe—Ein neues Gerät zur Messung von Infiltrationsraten in Böden. Geoöko 2000, 21, 121–132. [Google Scholar]
- Reynolds, W.D.; Elrick, D.E. Ponded Infiltration from a Single Ring: I. Analysis of Steady Flow. Soil Sci. Soc. Am. J. 1990, 54, 1233–1241. [Google Scholar] [CrossRef]
- Elrick, D.E.; Reynolds, W.D. Infiltration from Constant-Head Well Permeameters and Infiltrometers. In Advances in Measurement of Soil Physical Properties: Bringing Theory into Practice; Topp, C.G., Reynolds, W.D., Green, R.E., Eds.; SSSA Special Publication 30: Madison, WI, USA, 1992; pp. 1–24. [Google Scholar]
- Zhang, R. Determination of soil sorptivity and hydraulic conductivity from the disk infiltrometer. Soil Sci. Soc. Am. J. 1997, 61, 1024–1030. [Google Scholar] [CrossRef]
- Perroux, K.M.; White, I. Designs for disc permeameters. Soil Sci. Soc. Am. J. 1988, 52, 1205–1215. [Google Scholar] [CrossRef]
- Van Genuchten, M.T. A Closed-Form Equation for Predicting the Hydraulic Conductivity of Unsaturated Soils. Soil Sci. Soc. Am. J. 1980, 44, 892–898. [Google Scholar] [CrossRef]
- Carsel, R.F.; Parrish, R.S. Developing joint probability distributions of soil water retention characteristics. Water Resour. Res. 1988, 24, 755–769. [Google Scholar] [CrossRef] [Green Version]
- Reynolds, W.D.; Bowman, B.T.; Brunke, R.R.; Drury, C.F.; Tan, C.S. Comparison of Tension Infiltrometer, Pressure Infiltrometer, and Soil Core Estimates of Saturated Hydraulic Conductivity. Soil Sci. Soc. Am. J. 2000, 64, 478–484. [Google Scholar] [CrossRef]
- DIN ISO 11265:1997-06. Bodenbeschaffenheit—Bestimmung der Spezifischen Elektrischen Leitfähigkeit; Beuth Verlag: Berlin, Germany, 1997. [Google Scholar]
- Köhn, M. Korngrößenanalyse vermittels Pipettenanalyse. Tonindustrie-Zeitung 1929, 53, 729–731. [Google Scholar]
- Becher, H.H.; Kainz, M. Auswirkungen einer langjährigen Stallmistdüngung auf das Bodengefüge im Lößgebiet bei Straubing. Zeitschrift für Acker und Pflanzenbau 1983, 152, 152–158. [Google Scholar]
- Becher, H.H. Influence of long-term liming on aggregate stability of a loess-derived soil. Int. Agrophys. 2001, 15, 67–72. [Google Scholar]
- Mbagwu, J.S.C.; Auerswald, K. Relationship of percolation stability of soil aggregates to land use, selected properties, structural indices and simulated rainfall erosion. Soil Tillage Res. 1999, 50, 197–206. [Google Scholar] [CrossRef]
- Howlett, D.S.; Moreno, G.; Mosquera Losada, M.R.; Ramachandran Nair, P.K.; Nair, V.D. Soil carbon storage as influenced by tree cover in the Dehesa cork oak silvopasture of central-western Spain. J. Environ. Monit. 2011, 13, 1897–1904. [Google Scholar] [CrossRef] [PubMed] [Green Version]
- Aiello, R.; Bagarello, V.; Barbagallo, S.; Consoli, S.; Di Prima, S.; Giordano, G.; Iovino, M. An assessment of the Beerkan method to determine the hydraulic properties of a sandy loam soil. Geoderma 2014, 235–236, 300–307. [Google Scholar] [CrossRef]
- Alagna, V.; Di Prima, S.; Rodrigo-Comino, J.; Iovino, M.; Pirastru, M.; Keesstra, S.D.; Novara, A.; Cerdà, A. The Impact of the Age of Vines on Soil Hydraulic Conductivity in Vineyards in Eastern Spain. Water 2017, 10, 14. [Google Scholar] [CrossRef]
- Ravi, S.; Breshears, D.D.; Huxman, T.E.; D’Odorico, P. Land degradation in drylands: Interactions among hydrologic-aeolian erosion and vegetation dynamics. Geomorphology 2010, 116, 236–245. [Google Scholar] [CrossRef]
- Culmsee, H. Vegetation and pastoral use in the Western High Atlas Mountains (Morocco). An assessment of sustainability from the geobotanical perspective. In Pour une Nouvelle Perception des Fonctions des Montagnes du Maroc, Actes du 7eme Colloque Maroco-Allemand, Rabat, Morocco, 2004; Aït Hamza, M., Popp, H., Eds.; Publications de la Faculté des Lettres et des Sciences Humaines de Rabat. Série: Colloques et Séminaires, Rabat, Morocco, 2005; Volume 119, pp. 67–80. [Google Scholar]
- Kenny, L. Biologie de l’Arganier. In Atlas de l’Arganier, 1st ed.; Kenny, L., Ed.; Institut agronomique et vétérinaire Hassan II: Rabat, Morocco, 2007; pp. 43–44. [Google Scholar]
- Charrouf, Z.; Guillaume, D. Sustainable Development in Northern Africa: The Argan Forest Case. Sustainability 2009, 1, 1012–1022. [Google Scholar] [CrossRef] [Green Version]
- Reid, K.D.; Wilcox, B.P.; Breshears, D.D.; MacDonald, L. Runoff and Erosion in a Piñon-Juniper Woodland: Influence of Vegetation Patches. Soil Sci. Soc. Am. J. 1999, 63, 1869–1879. [Google Scholar] [CrossRef]
- Pierson, F.B.; Williams, C.J.; Hardegree, S.P.; Clark, P.E.; Kormos, P.R.; Al-Hamdan, O.Z. Hydrologic and Erosion Responses of Sagebrush Steppe Following Juniper Encroachment, Wildfire, and Tree Cutting. Rangel. Ecol. Manag. 2013, 66, 274–289. [Google Scholar] [CrossRef] [Green Version]
- Ceballos, A.; Cerdà, A.; Schnabel, S. Runoff production and erosion processes on a dehesa in western Spain. Geogr. Rev. 2002, 92, 333–353. [Google Scholar] [CrossRef]
- Sheng, H.; Cai, T. Influence of Rainfall on Canopy Interception in Mixed Broad-Leaved-Korean Pine Forest in Xiaoxing’an Moundains, Northeastern China. Forests 2019, 10, 248. [Google Scholar] [CrossRef]
- Geißler, C.; Kühn, P.; Böhnke, M.; Bruelheide, H.; Shi, X.; Scholten, T. Splash erosion potential under tree canopies in subtropical SE China. Catena 2012, 91, 85–93. [Google Scholar] [CrossRef]
- Ries, J.B.; Iserloh, T.; Seeger, M.; Gabriels, D. Rainfall simulations—Constraints, needs and challenges for a future use in soil erosion research. Zeitschrift für Geomorphologie 2013, 57, 1–10. [Google Scholar] [CrossRef]
- Kamphorst, A. A small rainfall simulator for the determination of soil erodibility. Neth. J. Agric. Sci. 1987, 35, 407–415. [Google Scholar]
- Bochet, E.; Poesen, J.; Rubio, J.L. Runoff and soil loss under individual plants of semi-arid Mediterranean shrubland: Influence of plant morphology and rainfall intensity. Earth Surf. Process. Landf. 2006, 31, 536–549. [Google Scholar] [CrossRef]
- Ludwig, J.A.; Wilcox, B.P.; Breshears, D.D.; Tongway, D.J.; Imeson, A.C. Vegetation Patches and Runoff-Erosion as Interacting Ecohydrological Processes in Semiarid Landscapes. Ecology 2005, 86, 288–297. [Google Scholar] [CrossRef]
- Gispert, M.; Emran, M.; Pardini, G.; Doni, S.; Ceccanti, B. The impact of land management and abandonment on soil enzymatic activity, glomalin content and aggregate stability. Geoderma 2013, 202–203, 51–61. [Google Scholar] [CrossRef]
- Plaza-Bonilla, D.; Cantero-Martínez, C.; Viñas, P.; Álvaro-Fuentes, J. Soil aggregation and organic carbon protection in a no-tillage chronosequence under Mediterranean conditions. Geoderma 2013, 193–194, 76–82. [Google Scholar] [CrossRef]
- Douglas, J.T.; Goss, M.J. Stability and organic matter content of surface soil aggregates under different methods of cultivation and in grassland. Soil Tillage Res. 1982, 2, 155–175. [Google Scholar] [CrossRef]
- Goebel, M.; Woche, S.K.; Bachmann, J. Quantitative analysis of a liquid penetration kinetics and slaking of aggregates as related to solid-liquid interfacial properties. J. Hydrol. 2012, 442–443, 63–74. [Google Scholar] [CrossRef]
- Le Bissonais, Y. Aggregate stability and assessment of soil crustability and erodibility: I. Theory and methodology. Eur. J. Soil Sci. 1996, 47, 425–437. [Google Scholar] [CrossRef]
- Nciizah, A.D.; Wakindiki, I.I.C. Soil sealing and crusting effects on infiltration rate: A critical review of shortfalls in prediction models and solutions. Arch. Agron. Soil Sci. 2015, 61, 1211–1230. [Google Scholar] [CrossRef]
- Guzmán, G.; Perea-Moreno, A.-J.; Gómez, J.A.; Cabrerizo-Morales, M.Á.; Martínez, G.; Giráldez, J.V. Water Related Properties to Assess Soil Quality in Two Olive Orchards of South Spain under Different Management Strategies. Water 2019, 11, 367. [Google Scholar] [CrossRef]
- Lichner, L.; Orfánus, T.; Nováková, K.; Šír, M.; Tesař, M. The Impact of Vegetation on Hydraulic Conductivity of Sandy Soil. Soil Water Res. 2007, 2, 59–66. [Google Scholar] [CrossRef]
- Abrahams, A.D.; Parsons, A.J. Relation between infiltration and stone cover on a semiarid hillslope, Southern Arizona. J. Hydrol. 1991, 122, 49–59. [Google Scholar] [CrossRef]
- Brakensiek, D.L.; Rawls, W.J. Soil containing rock fragments: Effects on infiltration. Catena 1994, 23, 99–110. [Google Scholar] [CrossRef]
- Eldridge, D.J.; Freudenberger, D. Ecosystem wicks: Woodland trees enhance water infiltration in a fragmented agricultural landscape in eastern Australia. Austral Ecol. 2005, 30, 336–347. [Google Scholar] [CrossRef]
- Castellano, M.J.; Valone, T.J. Livestock, soil compaction and water infiltration rate: Evaluating a potential desertification recovery mechanism. J. Arid Environ. 2007, 71, 97–108. [Google Scholar] [CrossRef]
- Jeddi, K.; Cortina, J.; Chaieb, M. Acacia Salicina, Pinus halepensis and Eucalyptus occidentalis improve soil surface conditions in arid southern Tunisia. J. Arid Environ. 2009, 73, 1005–1013. [Google Scholar] [CrossRef]
- Fu, H.; Pei, S.; Chen, Y.; Wan, C. Influence of Shrubs on Soil Chemical Properties in Alxa Desert Steppe, China. In Proceedings: Shrubland Dynamics—Fire and Water; Lubbock, USA, 10–12 August 2004; Sosebee, R.E., Wester, D.B., Britton, C.M., McArthur, E.D., Kitchen, S.G., Eds.; U.S. Department of Agriculture, Forest Service, Rocky Mountain Research Station: Fort Collins, CO, USA, 2007; pp. 117–122. [Google Scholar]
- Ries, J.B.; Andres, K.; Wirtz, S.; Tumbrink, J.; Wilms, T.; Peter, K.D.; Burczyk, M.; Butzen, V.; Seeger, M. Sheep and goat erosion—Experimental geomorphology as an approach for the quantification of underestimated processes. Zeitschrift für Geomorphologie 2014, 58, 23–45. [Google Scholar] [CrossRef]
- Berthrong, S.T.; Jobbágy, E.G.; Jackson, R.B. A global meta-analysis of soil exchangeable cations, pH, carbon, and nitrogen with afforestation. Ecol. Appl. 2009, 19, 2228–2241. [Google Scholar] [CrossRef] [PubMed] [Green Version]
- Alba-Sánchez, F.; López-Sáez, J.A.; Nieto-Lugilde, D.; Svenning, J.-C. Long-term climate forcings to assess vulnerability in North Africa dry argan woodlands. Appl. Veg. Sci. 2015, 18, 283–296. [Google Scholar] [CrossRef]
- Azevedo, J.; Morgan, D.L. Fog precipitation in coastal California forests. Ecology 1974, 55, 1135–1141. [Google Scholar] [CrossRef]
- Nyaga, J.M.; Neff, J.C.; Cramer, M.D. The Contribution of Occult Precipitation to Nutrient Deposition on the West Coast of South Africa. PLoS ONE 2015, 10, 1–21. [Google Scholar] [CrossRef]
- Cunningham, R.K. Cation-anion relationships in crop nutrition: III. Relationships between the ratios of sum of the cations: Sum of the anions and nitrogen concentrations in several plant species. J. Agric. Sci. 1964, 63, 109–111. [Google Scholar] [CrossRef]
- Riley, D.; Barber, S.A. Bicarbonate Accumulation and pH Changes at the Soybean (Glycine max (L.) Merr.) Root-Soil Interface. Soil Sci. Soc. Am. J. 1969, 33, 905–908. [Google Scholar] [CrossRef]
- Boulmane, M.; Oubrahim, H.; Halim, M.; Bakker, M.R.; Augusto, L. The potential of Eucalyptus plantations to restore degraded soils in semi-arid Morocco (NW Africa). Ann. For. Sci. 2017, 74, 57. [Google Scholar] [CrossRef]
Figure 1.
(a,b) Varying argan tree densities as seen in vertical aerial photographs (each image in (a) and (b) shows 1 ha) as well as different growth forms of Argania spinosa: (c) round crown; (d) umbrella-shaped crown with basal cushion; (e) cone-shaped cushion.
Figure 1.
(a,b) Varying argan tree densities as seen in vertical aerial photographs (each image in (a) and (b) shows 1 ha) as well as different growth forms of Argania spinosa: (c) round crown; (d) umbrella-shaped crown with basal cushion; (e) cone-shaped cushion.

Figure 2.
Study areas in the Souss basin (modified from d’Oleire-Oltmanns [30]).
Figure 2.
Study areas in the Souss basin (modified from d’Oleire-Oltmanns [30]).

Figure 3.
Examples for argan test sites with different land-use/environmental attributes of argan test sites. Vertical small-format aerial photography taken with an unmanned aerial vehicle from a height of 120 m (TLK: Tamaloukt; AOU: Aouarga; IRG: Irguitène).
Figure 3.
Examples for argan test sites with different land-use/environmental attributes of argan test sites. Vertical small-format aerial photography taken with an unmanned aerial vehicle from a height of 120 m (TLK: Tamaloukt; AOU: Aouarga; IRG: Irguitène).

Figure 4.
(a) Single-ring infiltrometer; (b) plot record before the experiment; (c) profile of the infiltration plot after experiment.
Figure 4.
(a) Single-ring infiltrometer; (b) plot record before the experiment; (c) profile of the infiltration plot after experiment.

Figure 5.
(a) Minidisk infiltrometer; (b) plot record after the experiment, with a thin layer of fine sand added for improved hydraulic connection.
Figure 5.
(a) Minidisk infiltrometer; (b) plot record after the experiment, with a thin layer of fine sand added for improved hydraulic connection.

Figure 6.
Total average of (a) suspended sediment load (SSL), (b) surface runoff (AO), and (c) suspended sediment concentration (SSC) (short dash: mean line, solid line: median, dots: outliers). Results for the tree-covered areas (left box) and intertree areas (right box).
Figure 6.
Total average of (a) suspended sediment load (SSL), (b) surface runoff (AO), and (c) suspended sediment concentration (SSC) (short dash: mean line, solid line: median, dots: outliers). Results for the tree-covered areas (left box) and intertree areas (right box).

Figure 7.
Suspended sediment concentration (SSC) for tree (T, black bars) and intertree areas (IT, grey bars) for each test site. Break between 10 and 20 g L−1 because of test site ABH2c.
Figure 7.
Suspended sediment concentration (SSC) for tree (T, black bars) and intertree areas (IT, grey bars) for each test site. Break between 10 and 20 g L−1 because of test site ABH2c.

Figure 8.
(a) Saturated hydraulic conductivity (Ksat, p < 0.05) for tree and intertree areas as well as (b) for the three study areas (short dash: mean line, solid line: median, dots: outliers).
Figure 8.
(a) Saturated hydraulic conductivity (Ksat, p < 0.05) for tree and intertree areas as well as (b) for the three study areas (short dash: mean line, solid line: median, dots: outliers).

Figure 9.
Unsaturated hydraulic conductivity (Kh) for different suctions (−4 to −0.5) and tree (T) and intertree (IT) areas (short dash: mean line, solid line: median, dots: outliers).
Figure 9.
Unsaturated hydraulic conductivity (Kh) for different suctions (−4 to −0.5) and tree (T) and intertree (IT) areas (short dash: mean line, solid line: median, dots: outliers).

Figure 10.
Unsaturated hydraulic conductivity (Kh) for different suctions (−4 to −0.5) for the three study areas (short dash: mean line, solid line: median, dots: outliers).
Figure 10.
Unsaturated hydraulic conductivity (Kh) for different suctions (−4 to −0.5) for the three study areas (short dash: mean line, solid line: median, dots: outliers).

Figure 11.
(a) pH (p < 0.05), (b) electrical conductivity (EC) (p < 0.05), (c) total carbon content (TC-content, p < 0.05), (d) nitrogen content (N-content, p < 0.05), (e) percolation stability (PS, p < 0.05), and (f) mean grain size (short dash: mean line, solid line: median, dots: outliers). Results for the tree-covered areas (left box) and intertree areas (right box).

Figure 12.
(a) Potassium (K) content (p < 0.05), (b) sodium (Na) content (p < 0.05), (c) magnesium (Mg) content (p < 0.05), and (d) calcium (Ca) content (short dash: mean line, solid line: median, dots: outliers). Results for the tree-covered areas (left box) and intertree areas (right box).
Figure 12.
(a) Potassium (K) content (p < 0.05), (b) sodium (Na) content (p < 0.05), (c) magnesium (Mg) content (p < 0.05), and (d) calcium (Ca) content (short dash: mean line, solid line: median, dots: outliers). Results for the tree-covered areas (left box) and intertree areas (right box).

Figure 13.
Collection of fog precipitation by the argan tree.


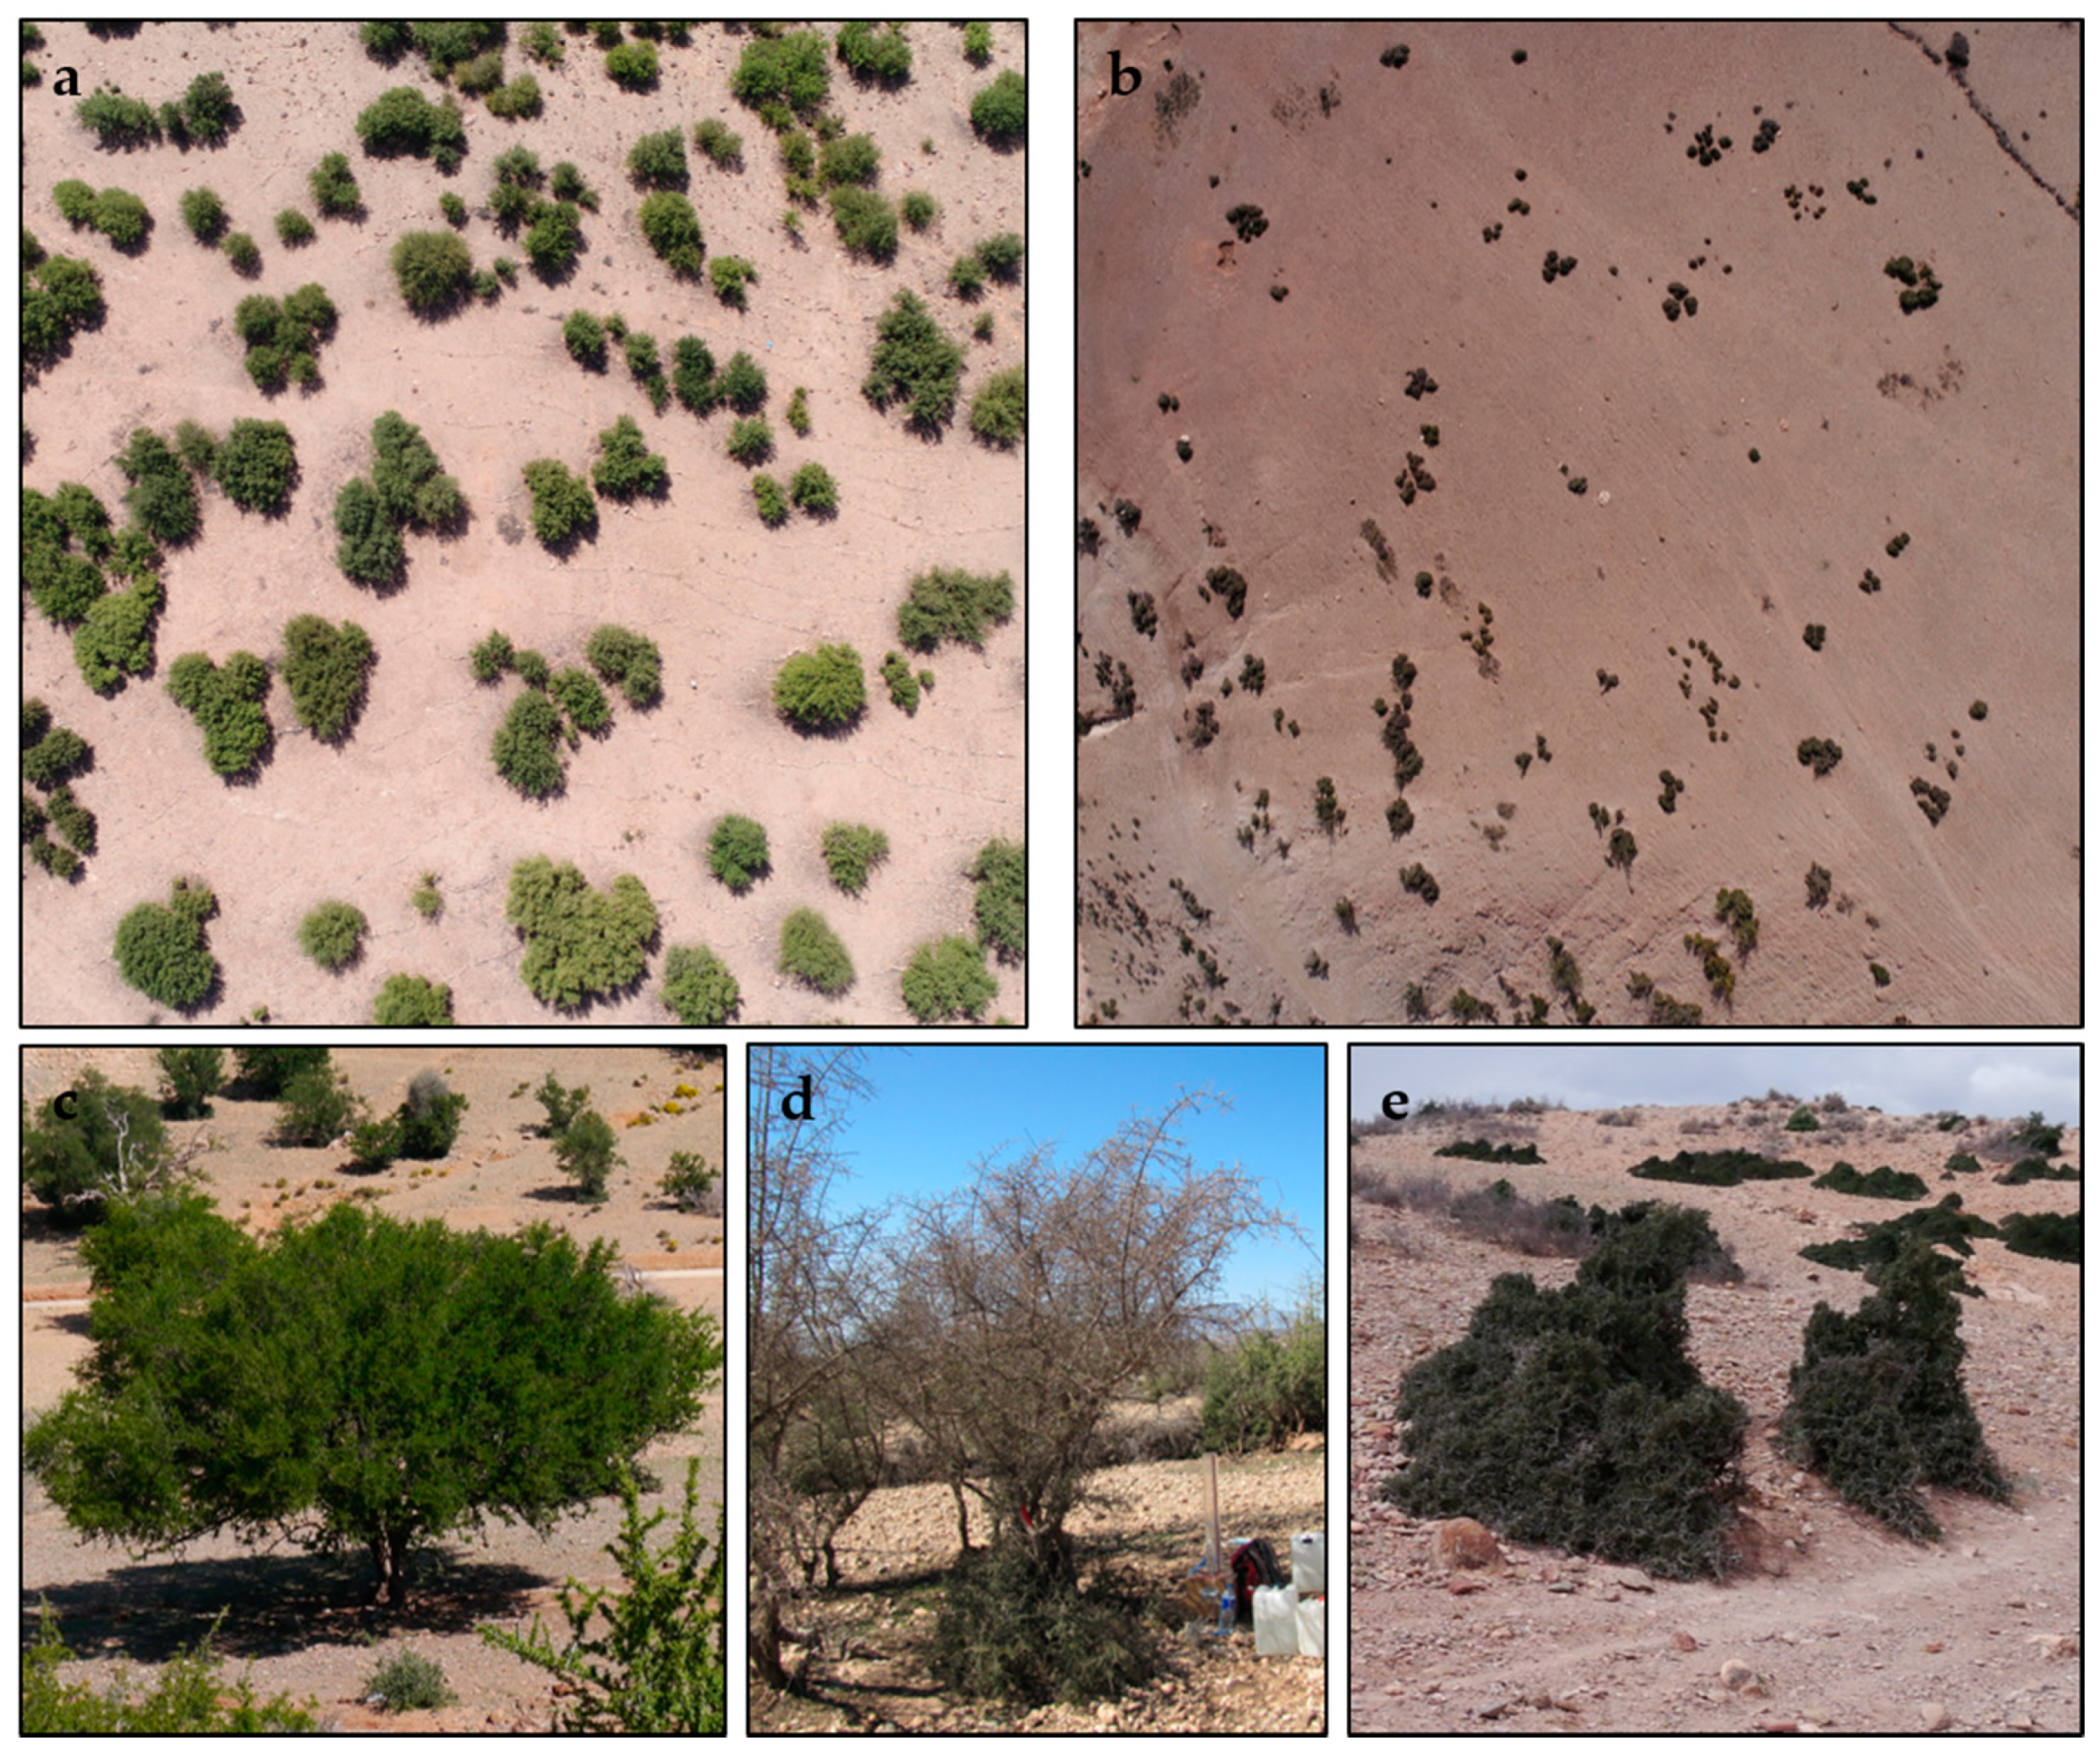
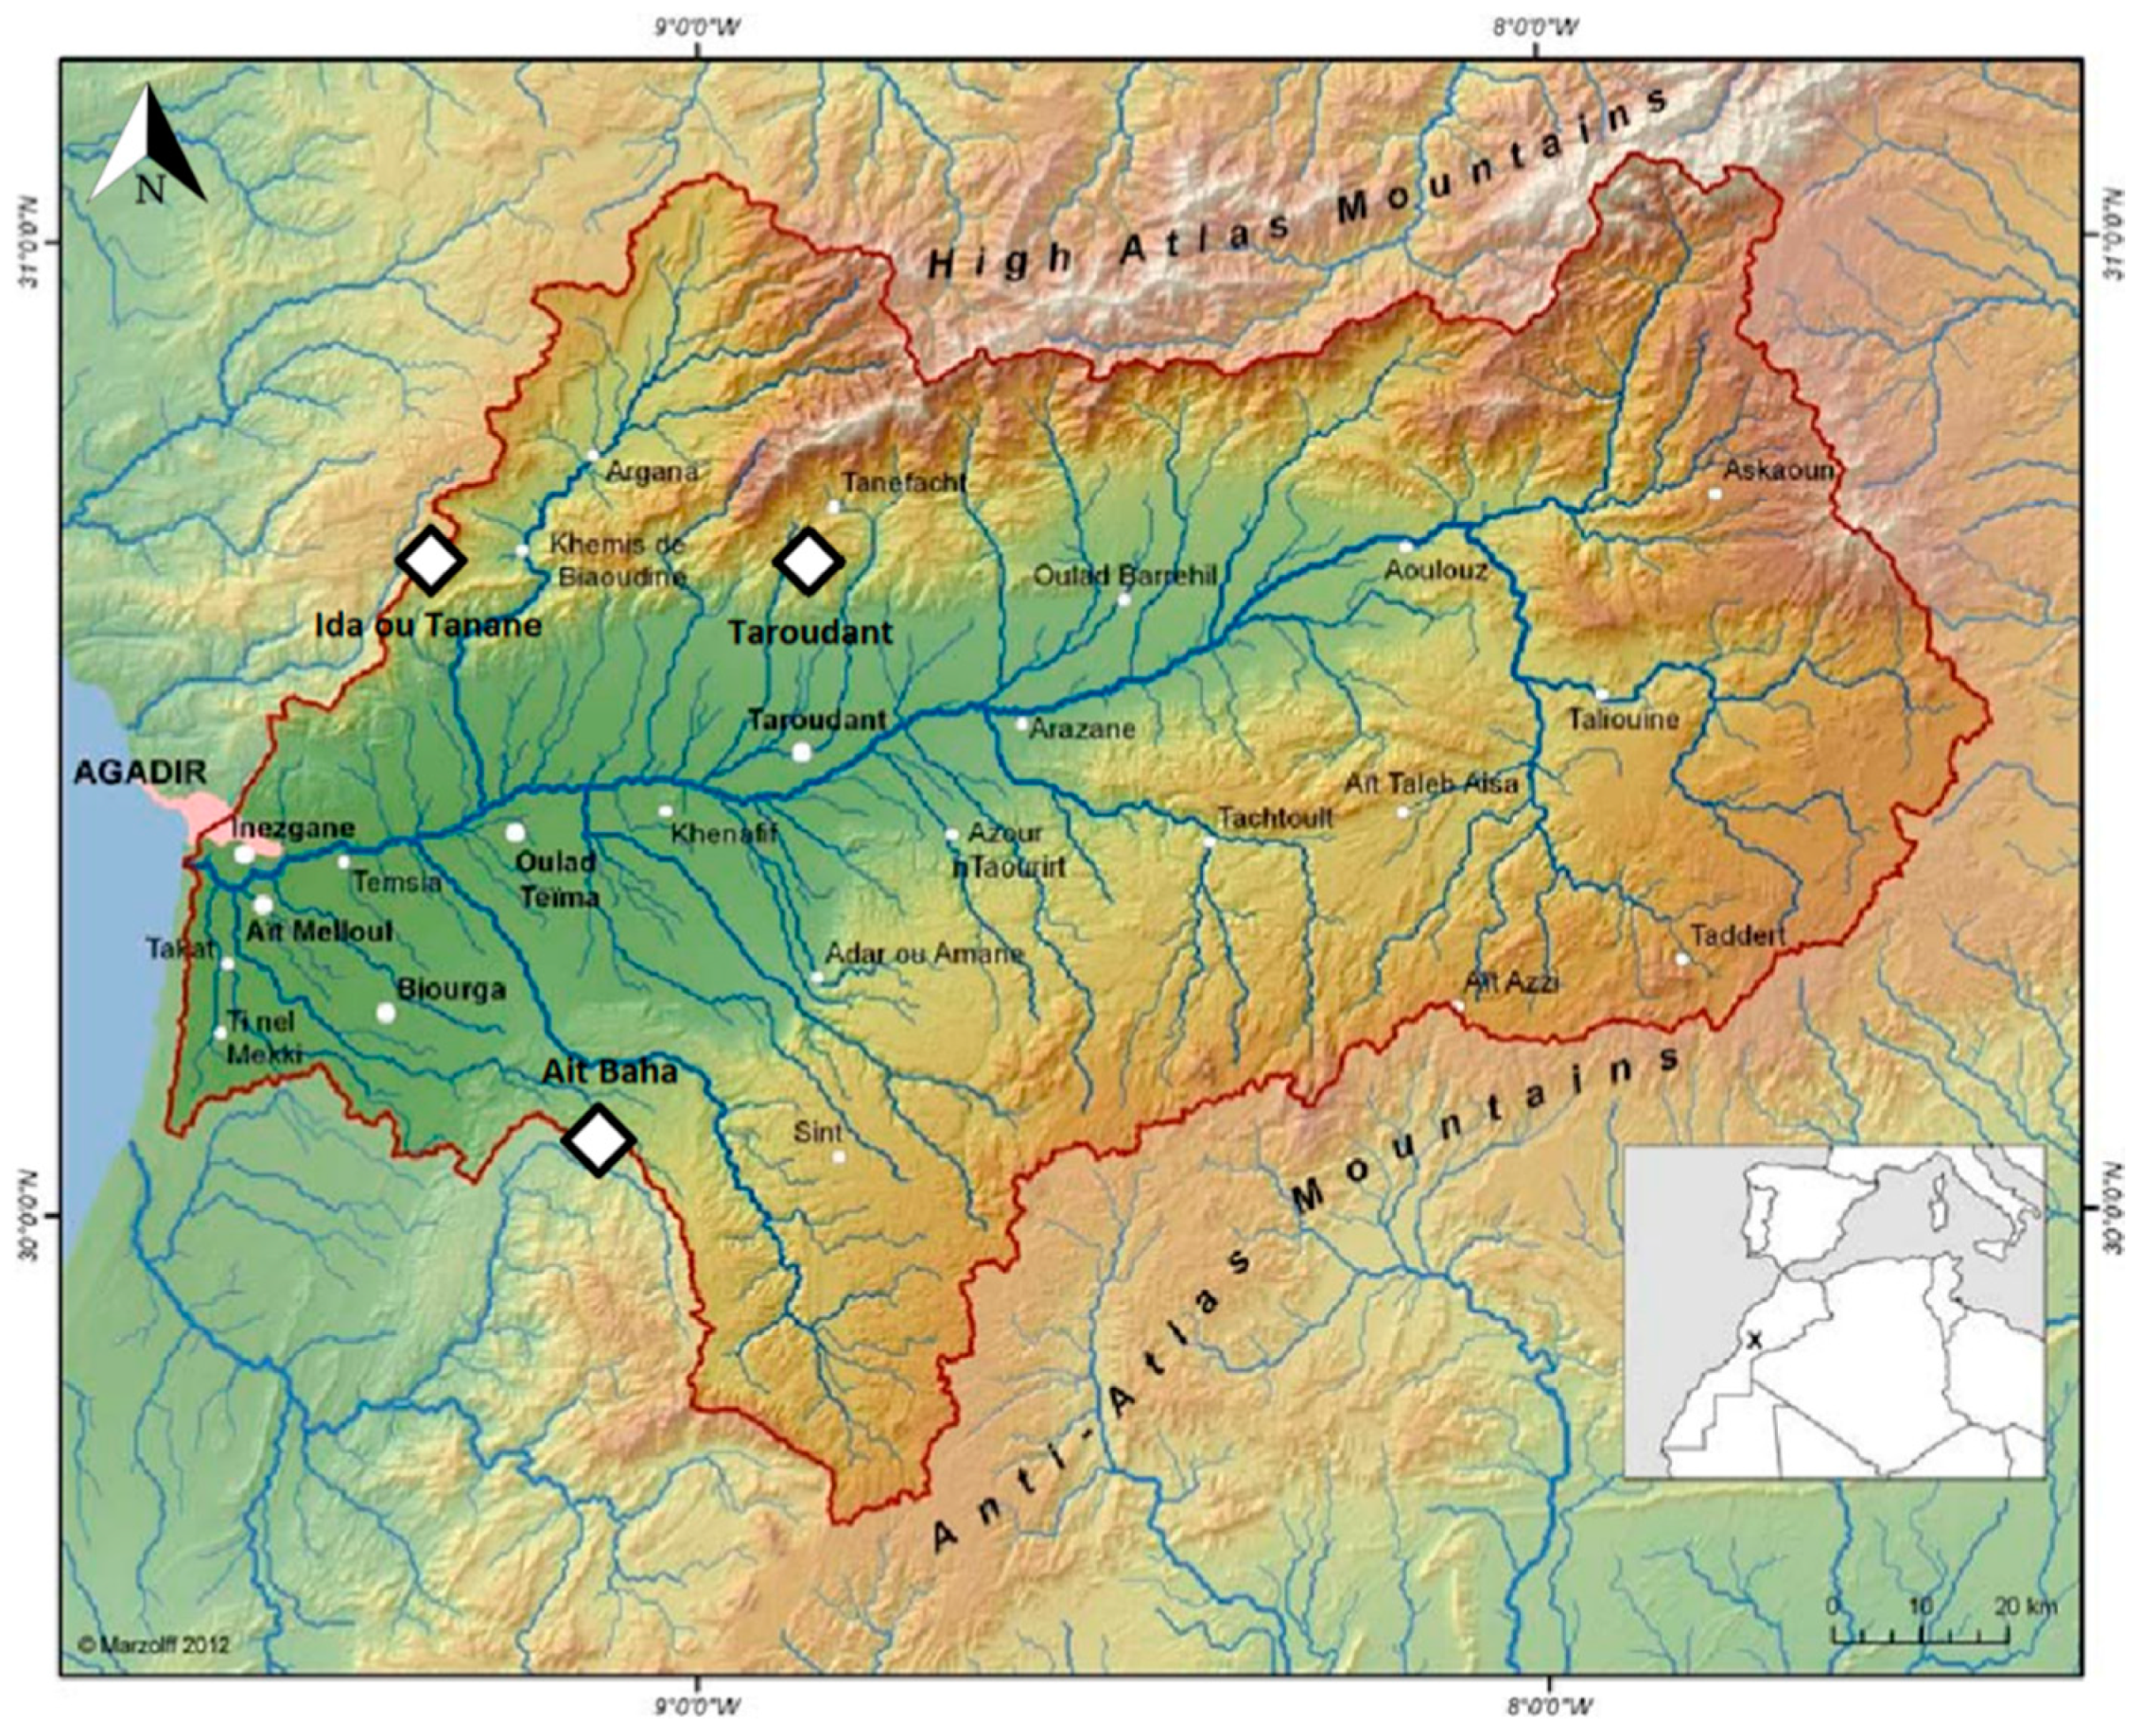
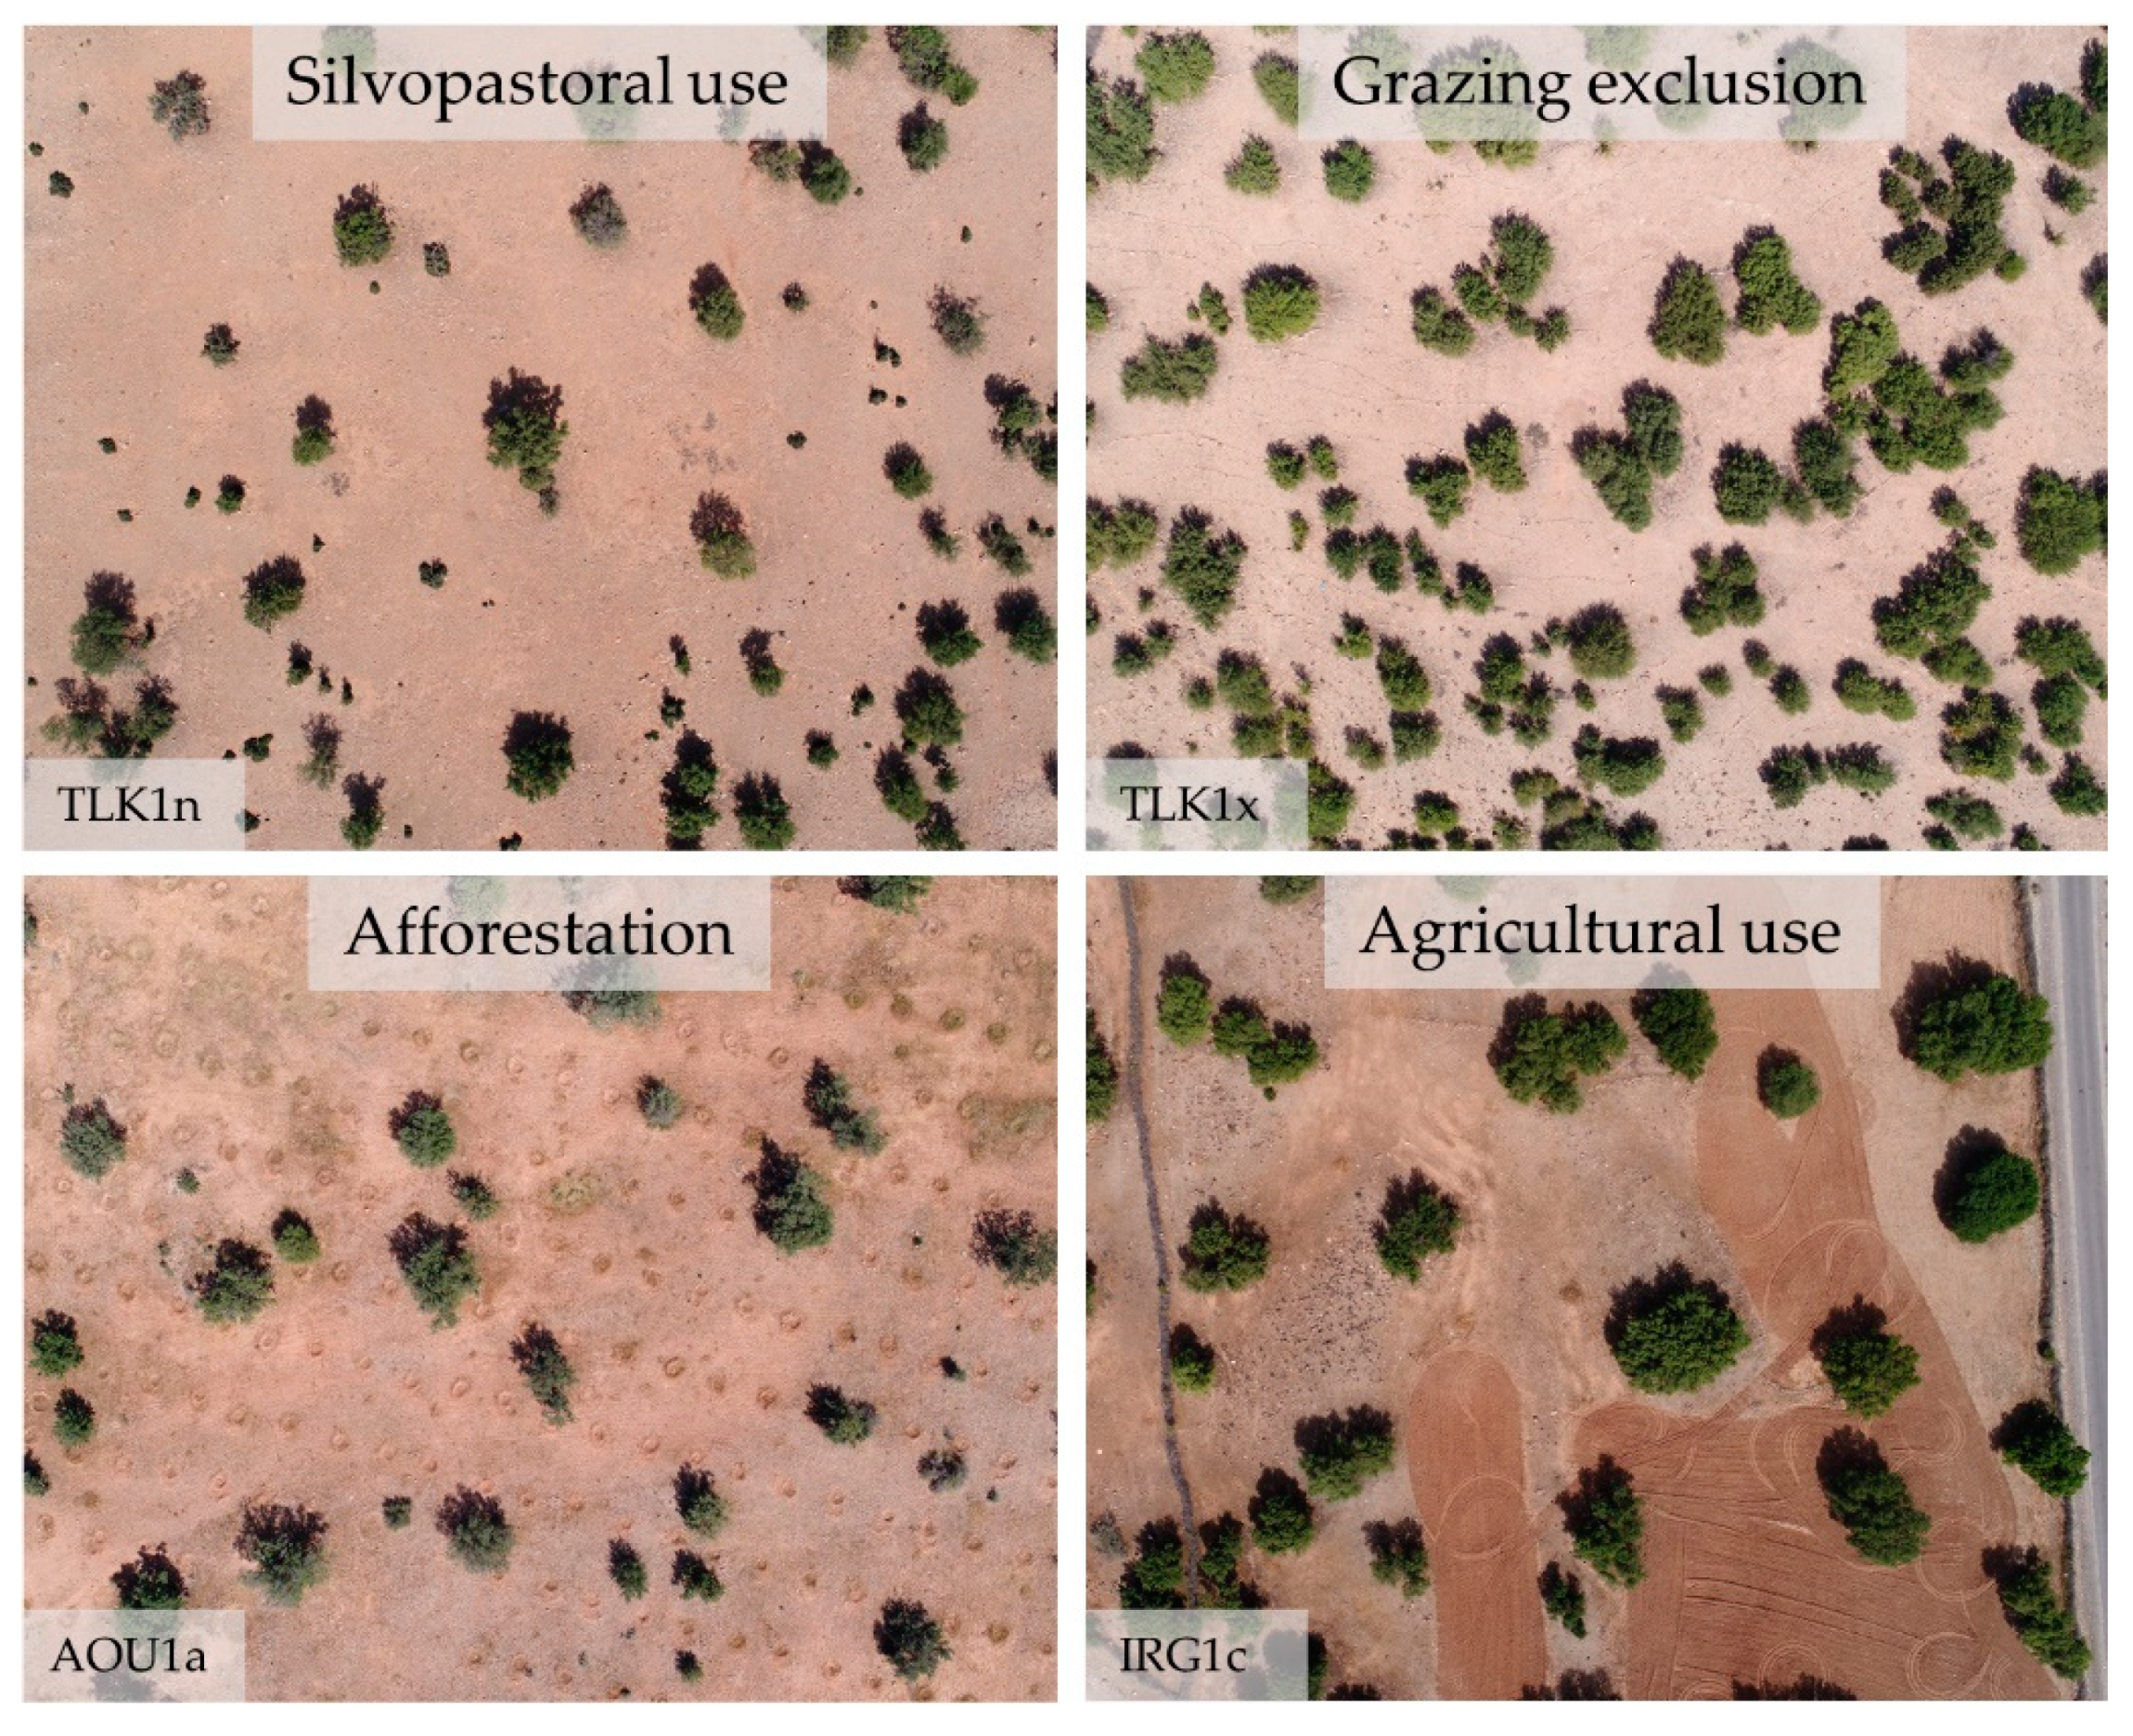
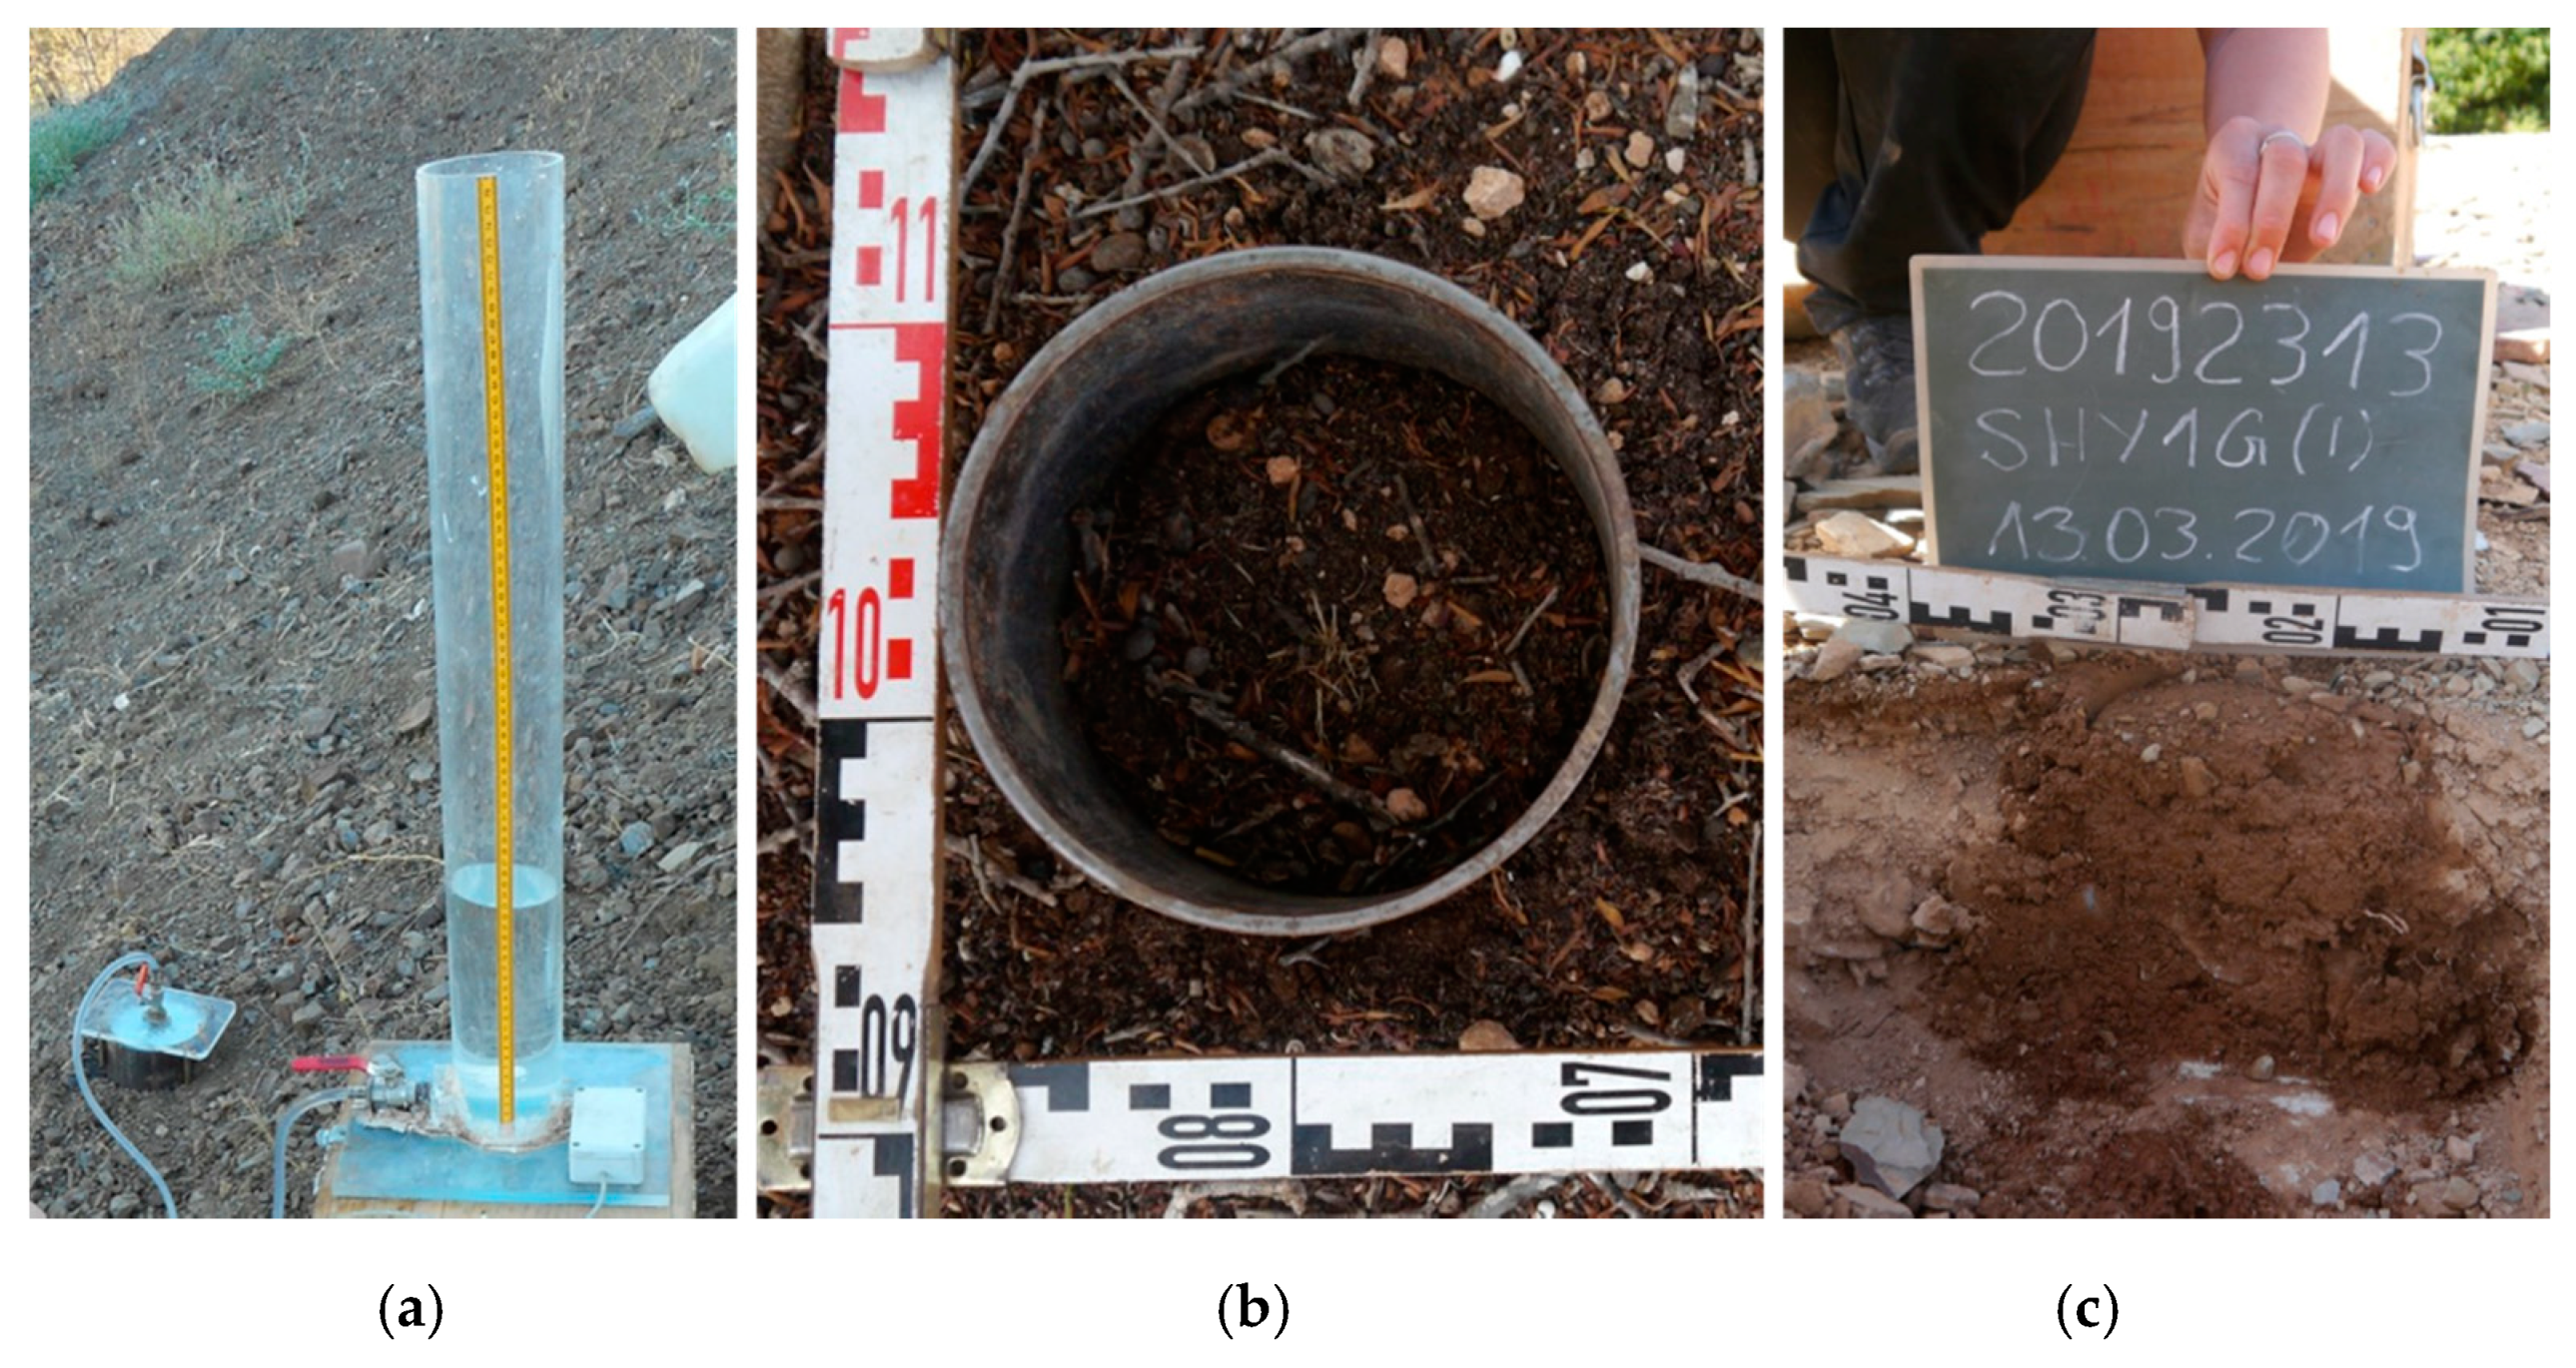
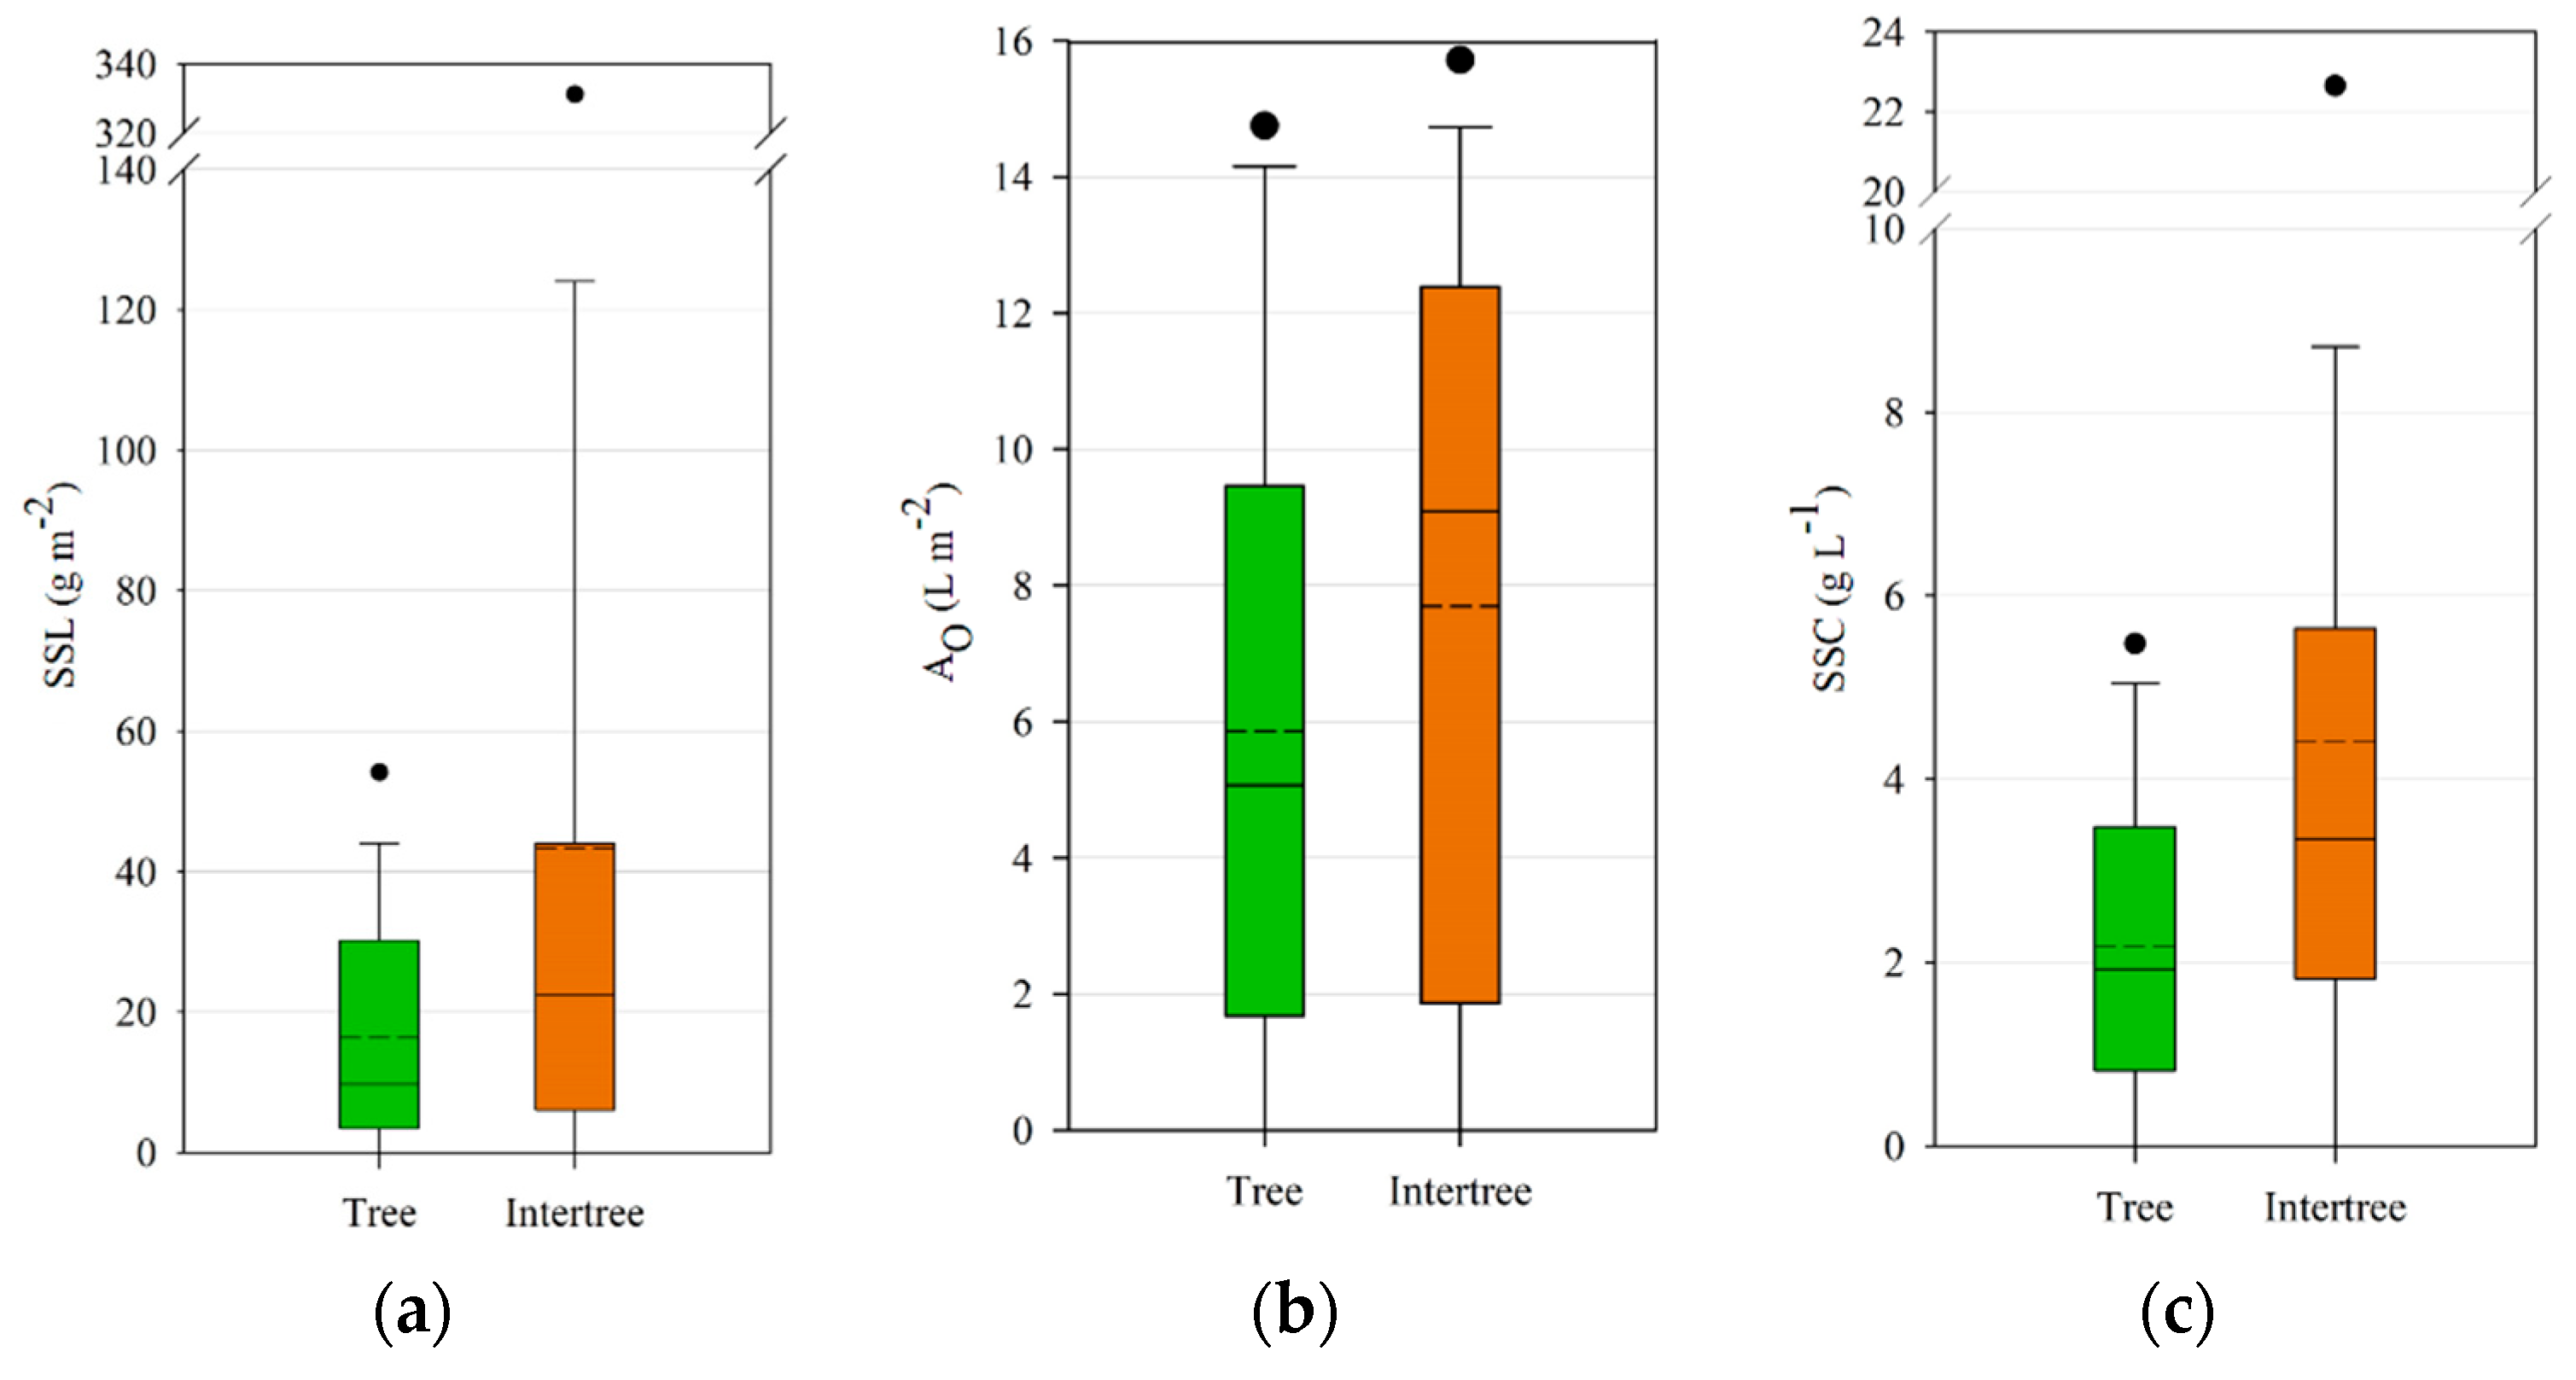
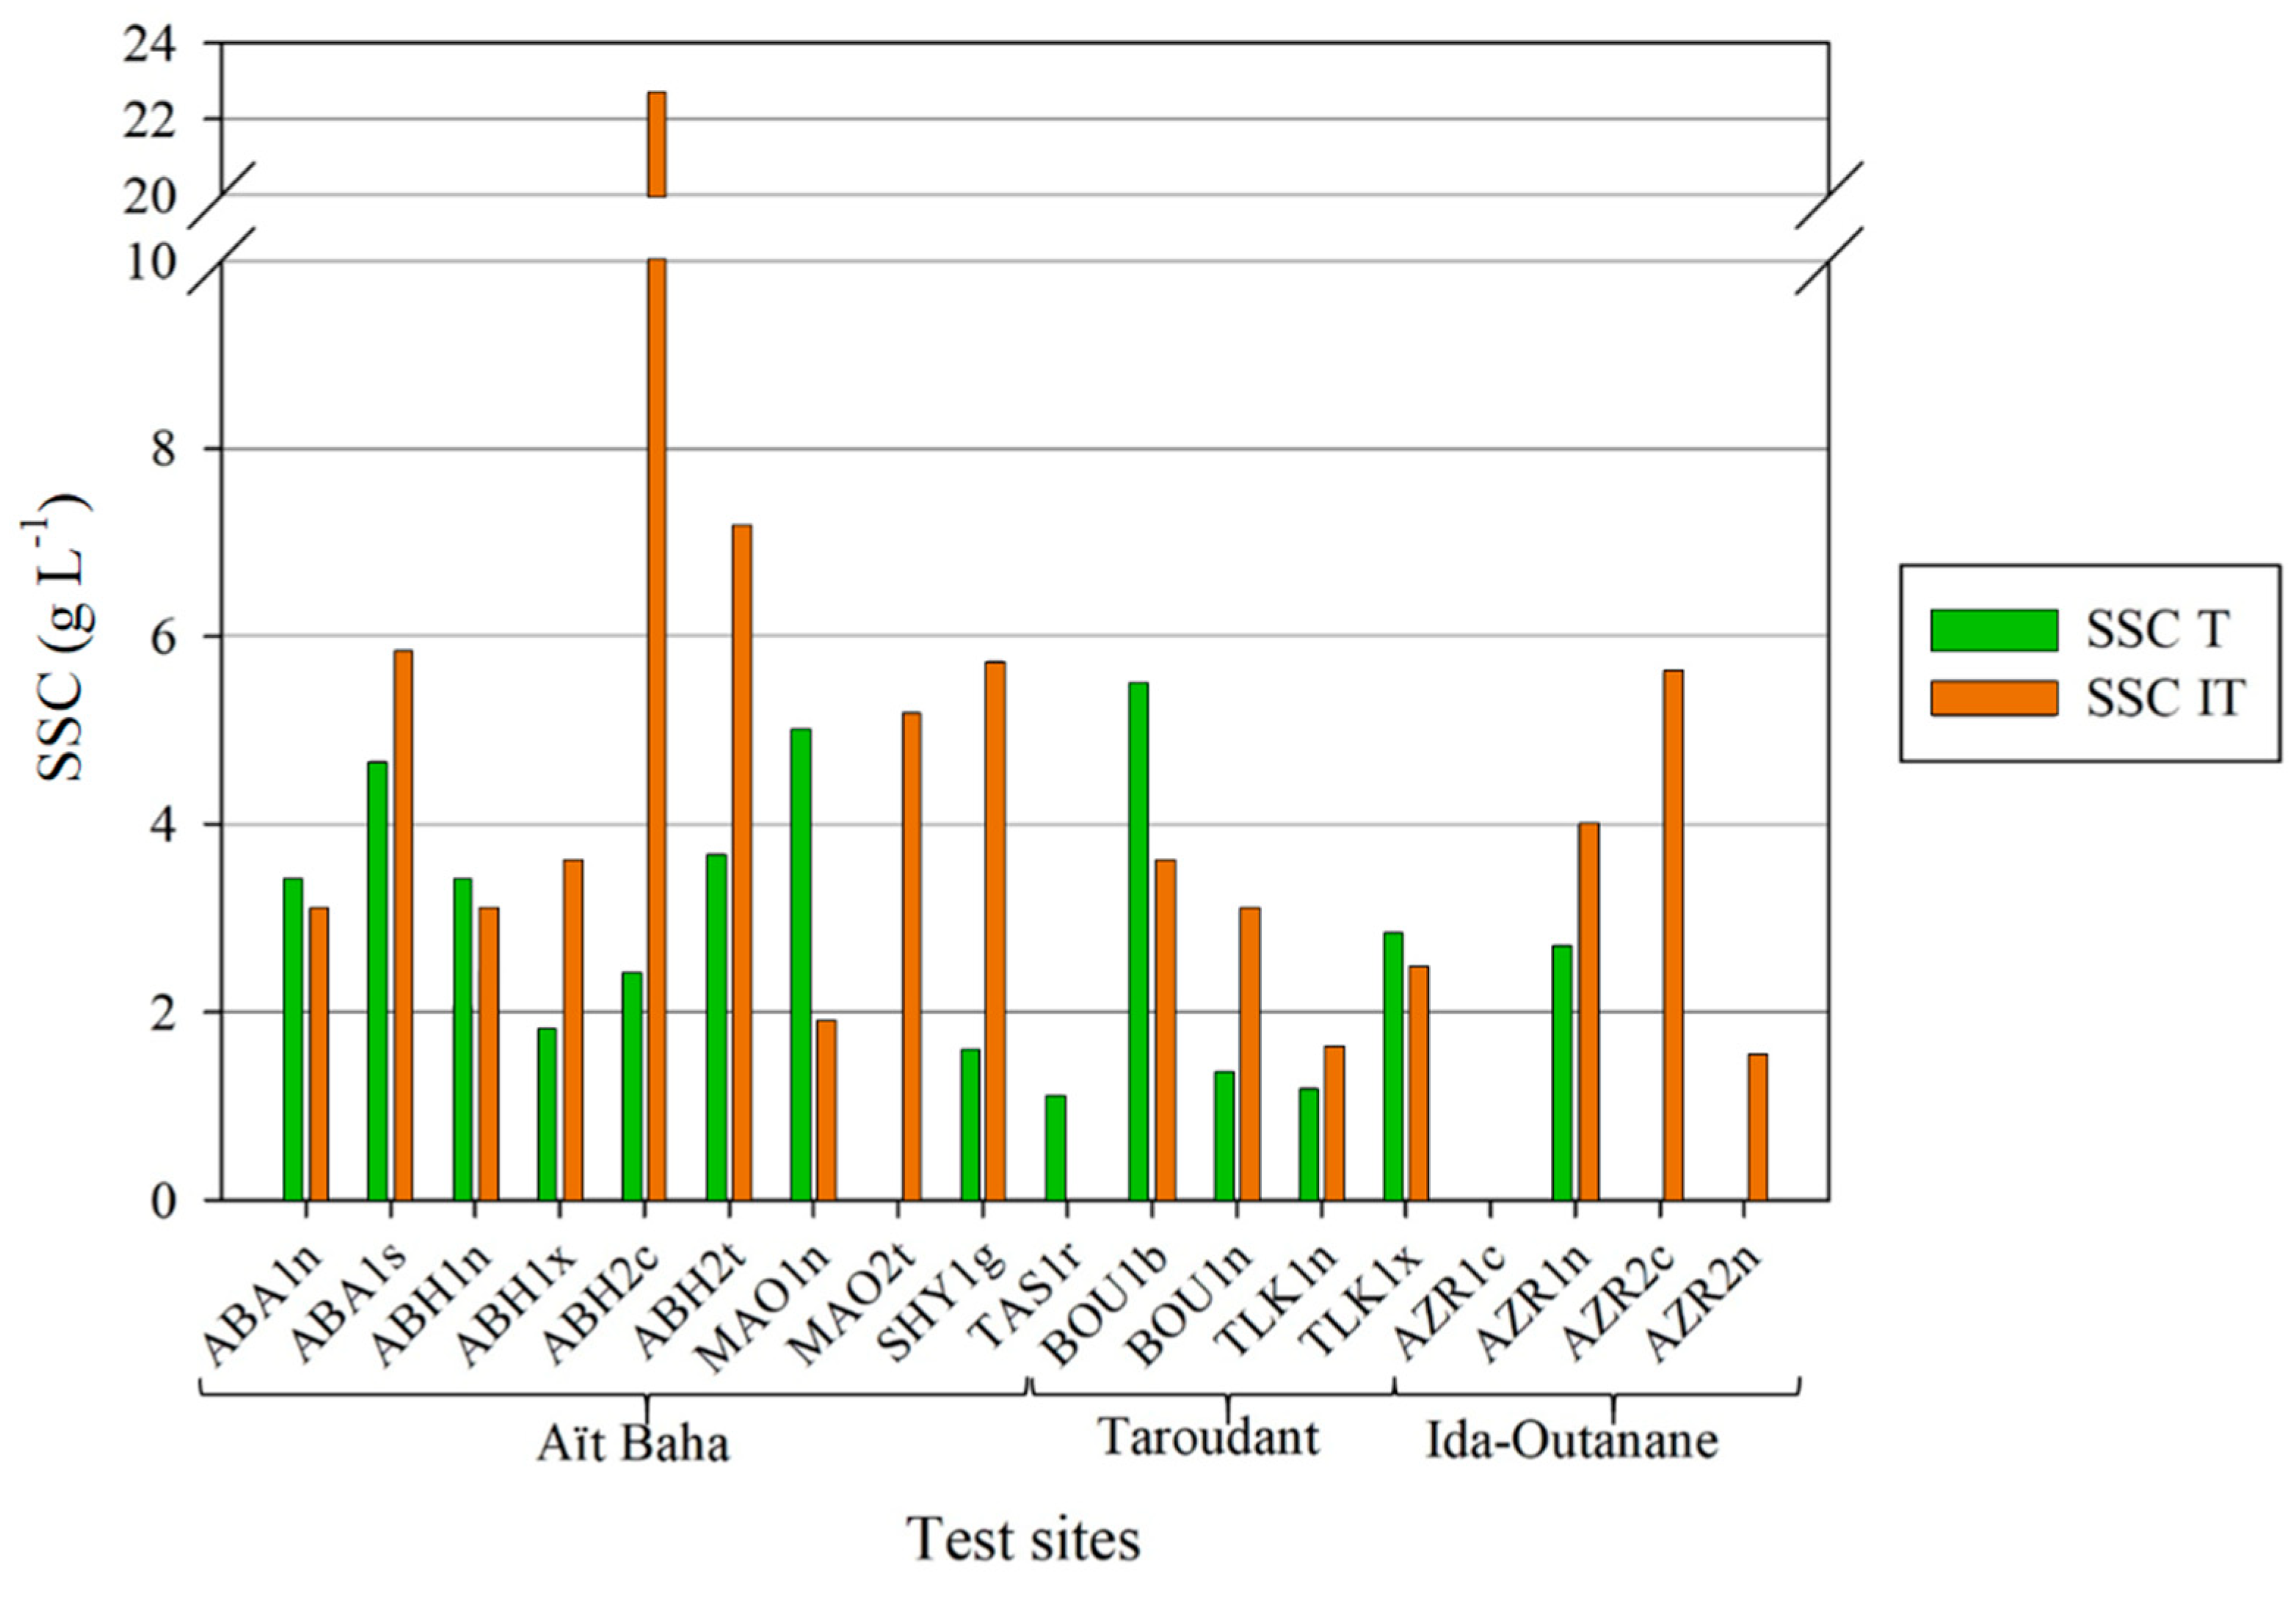
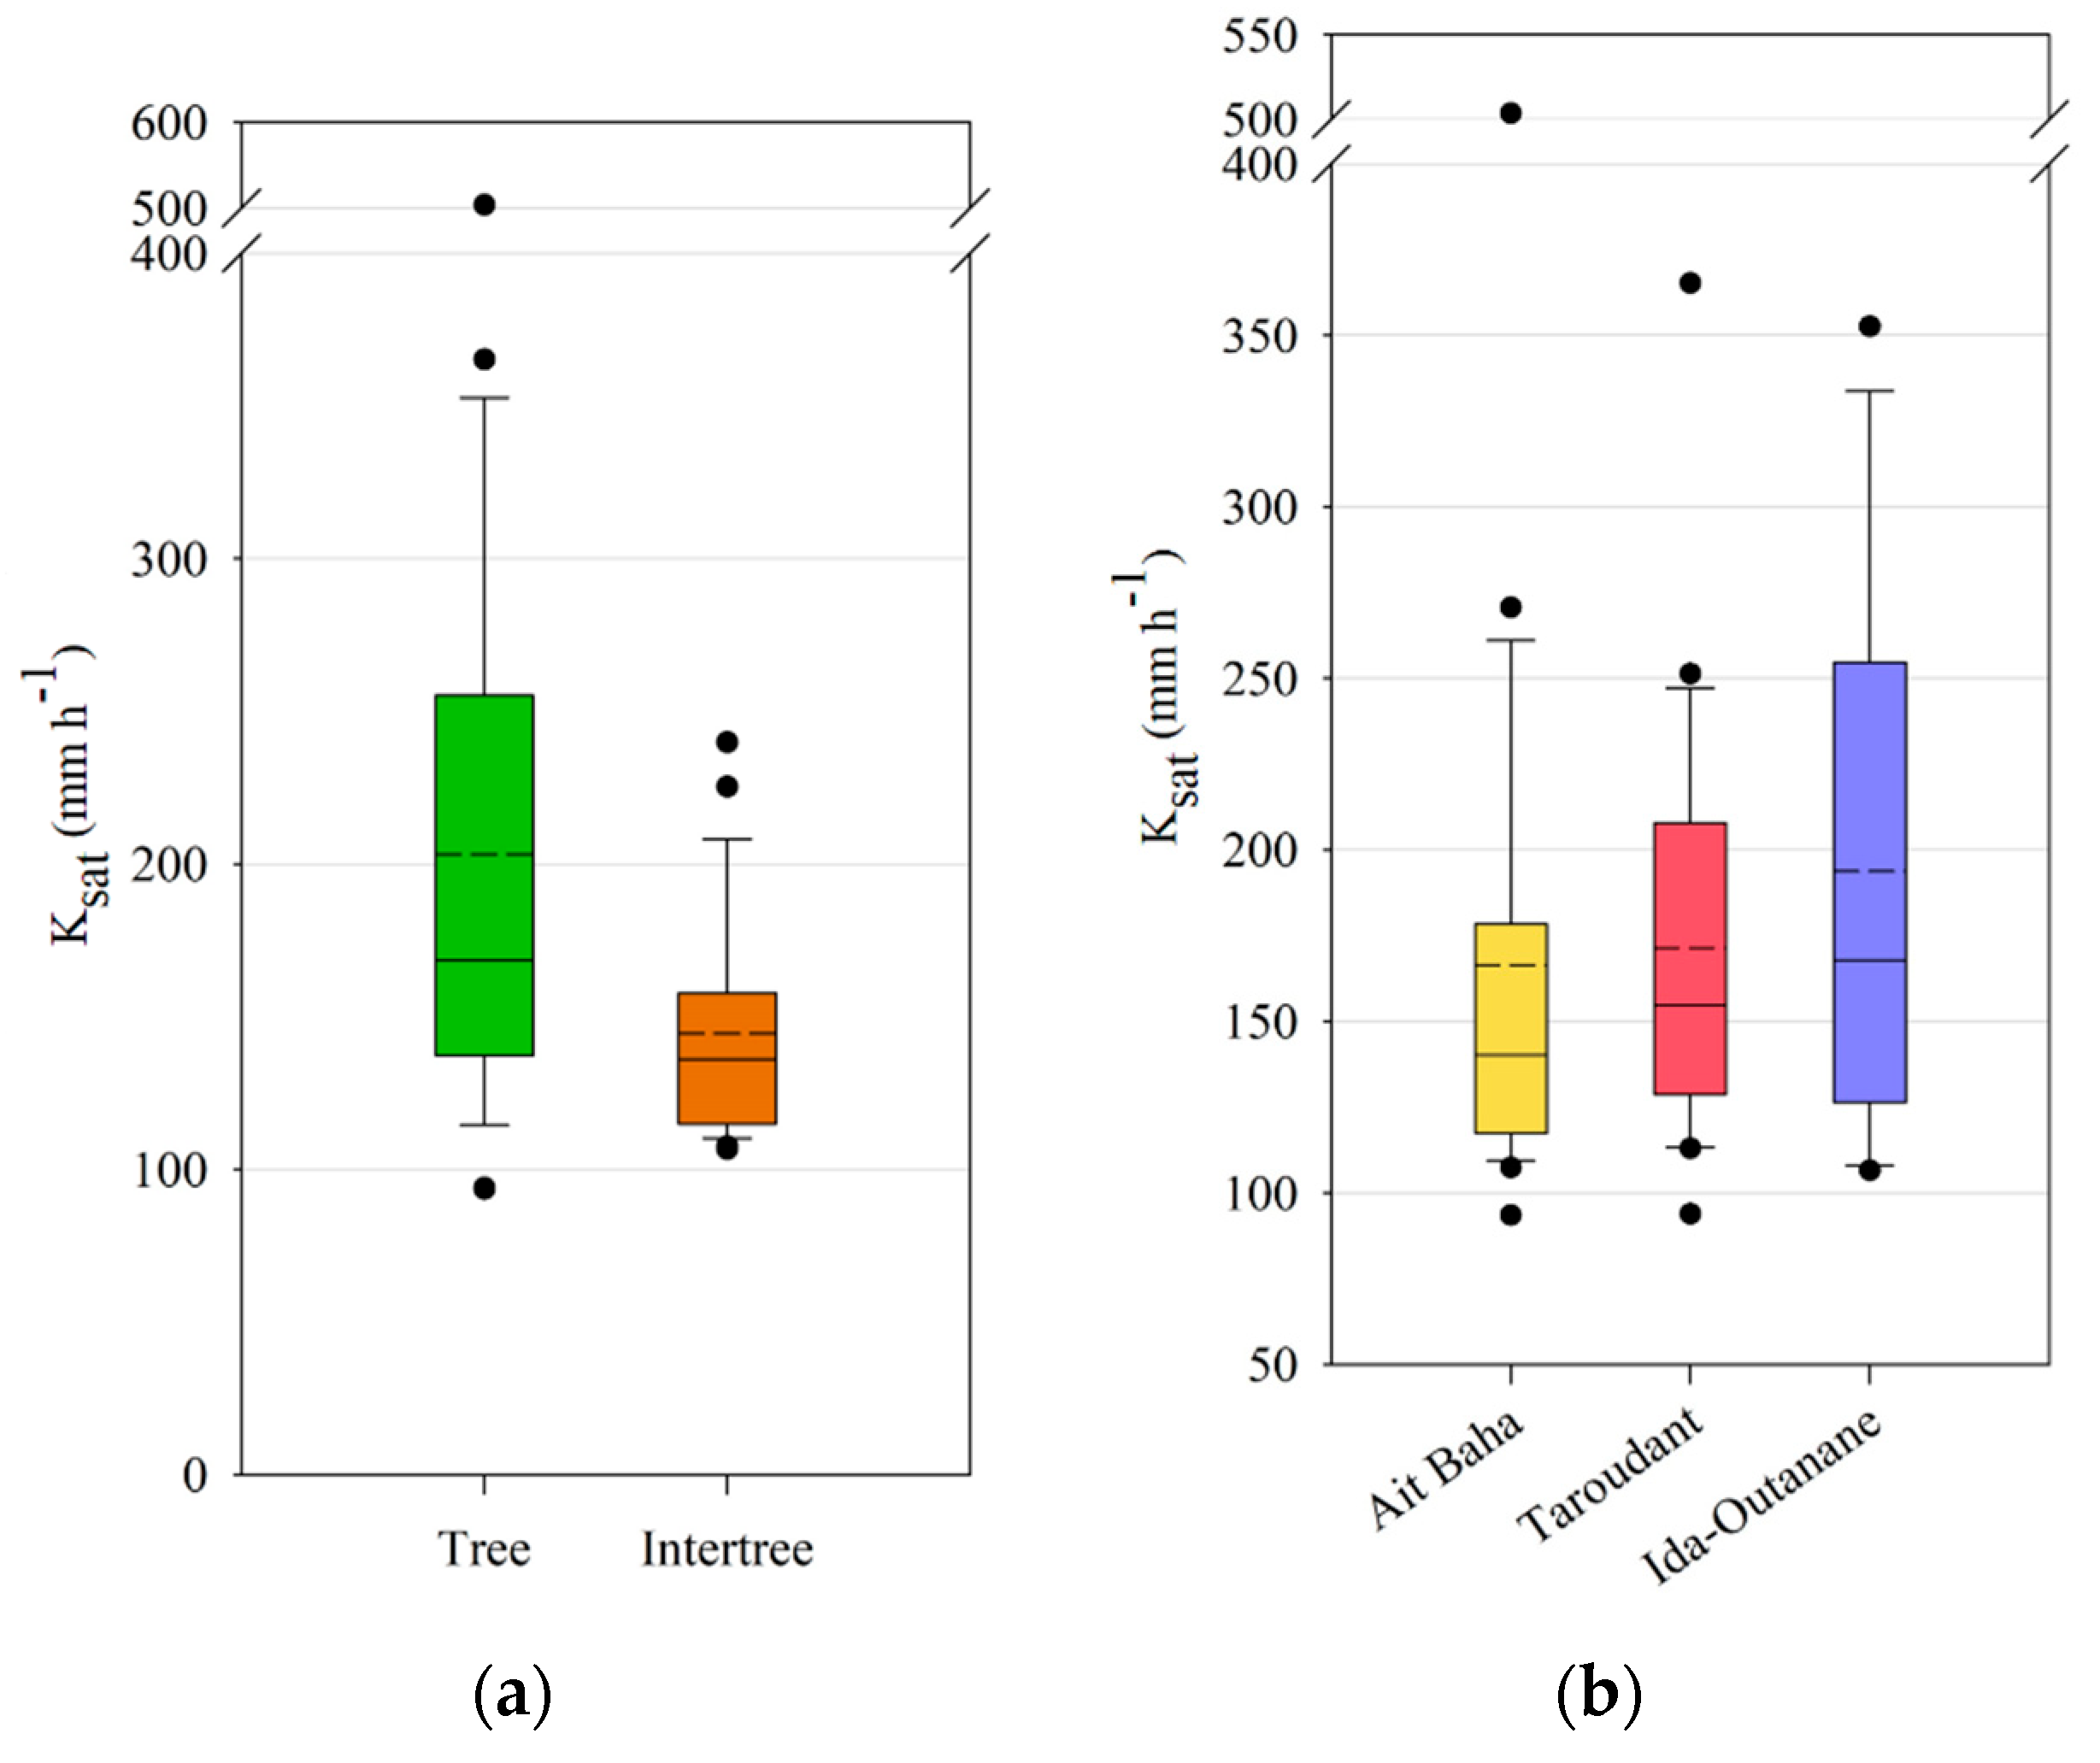
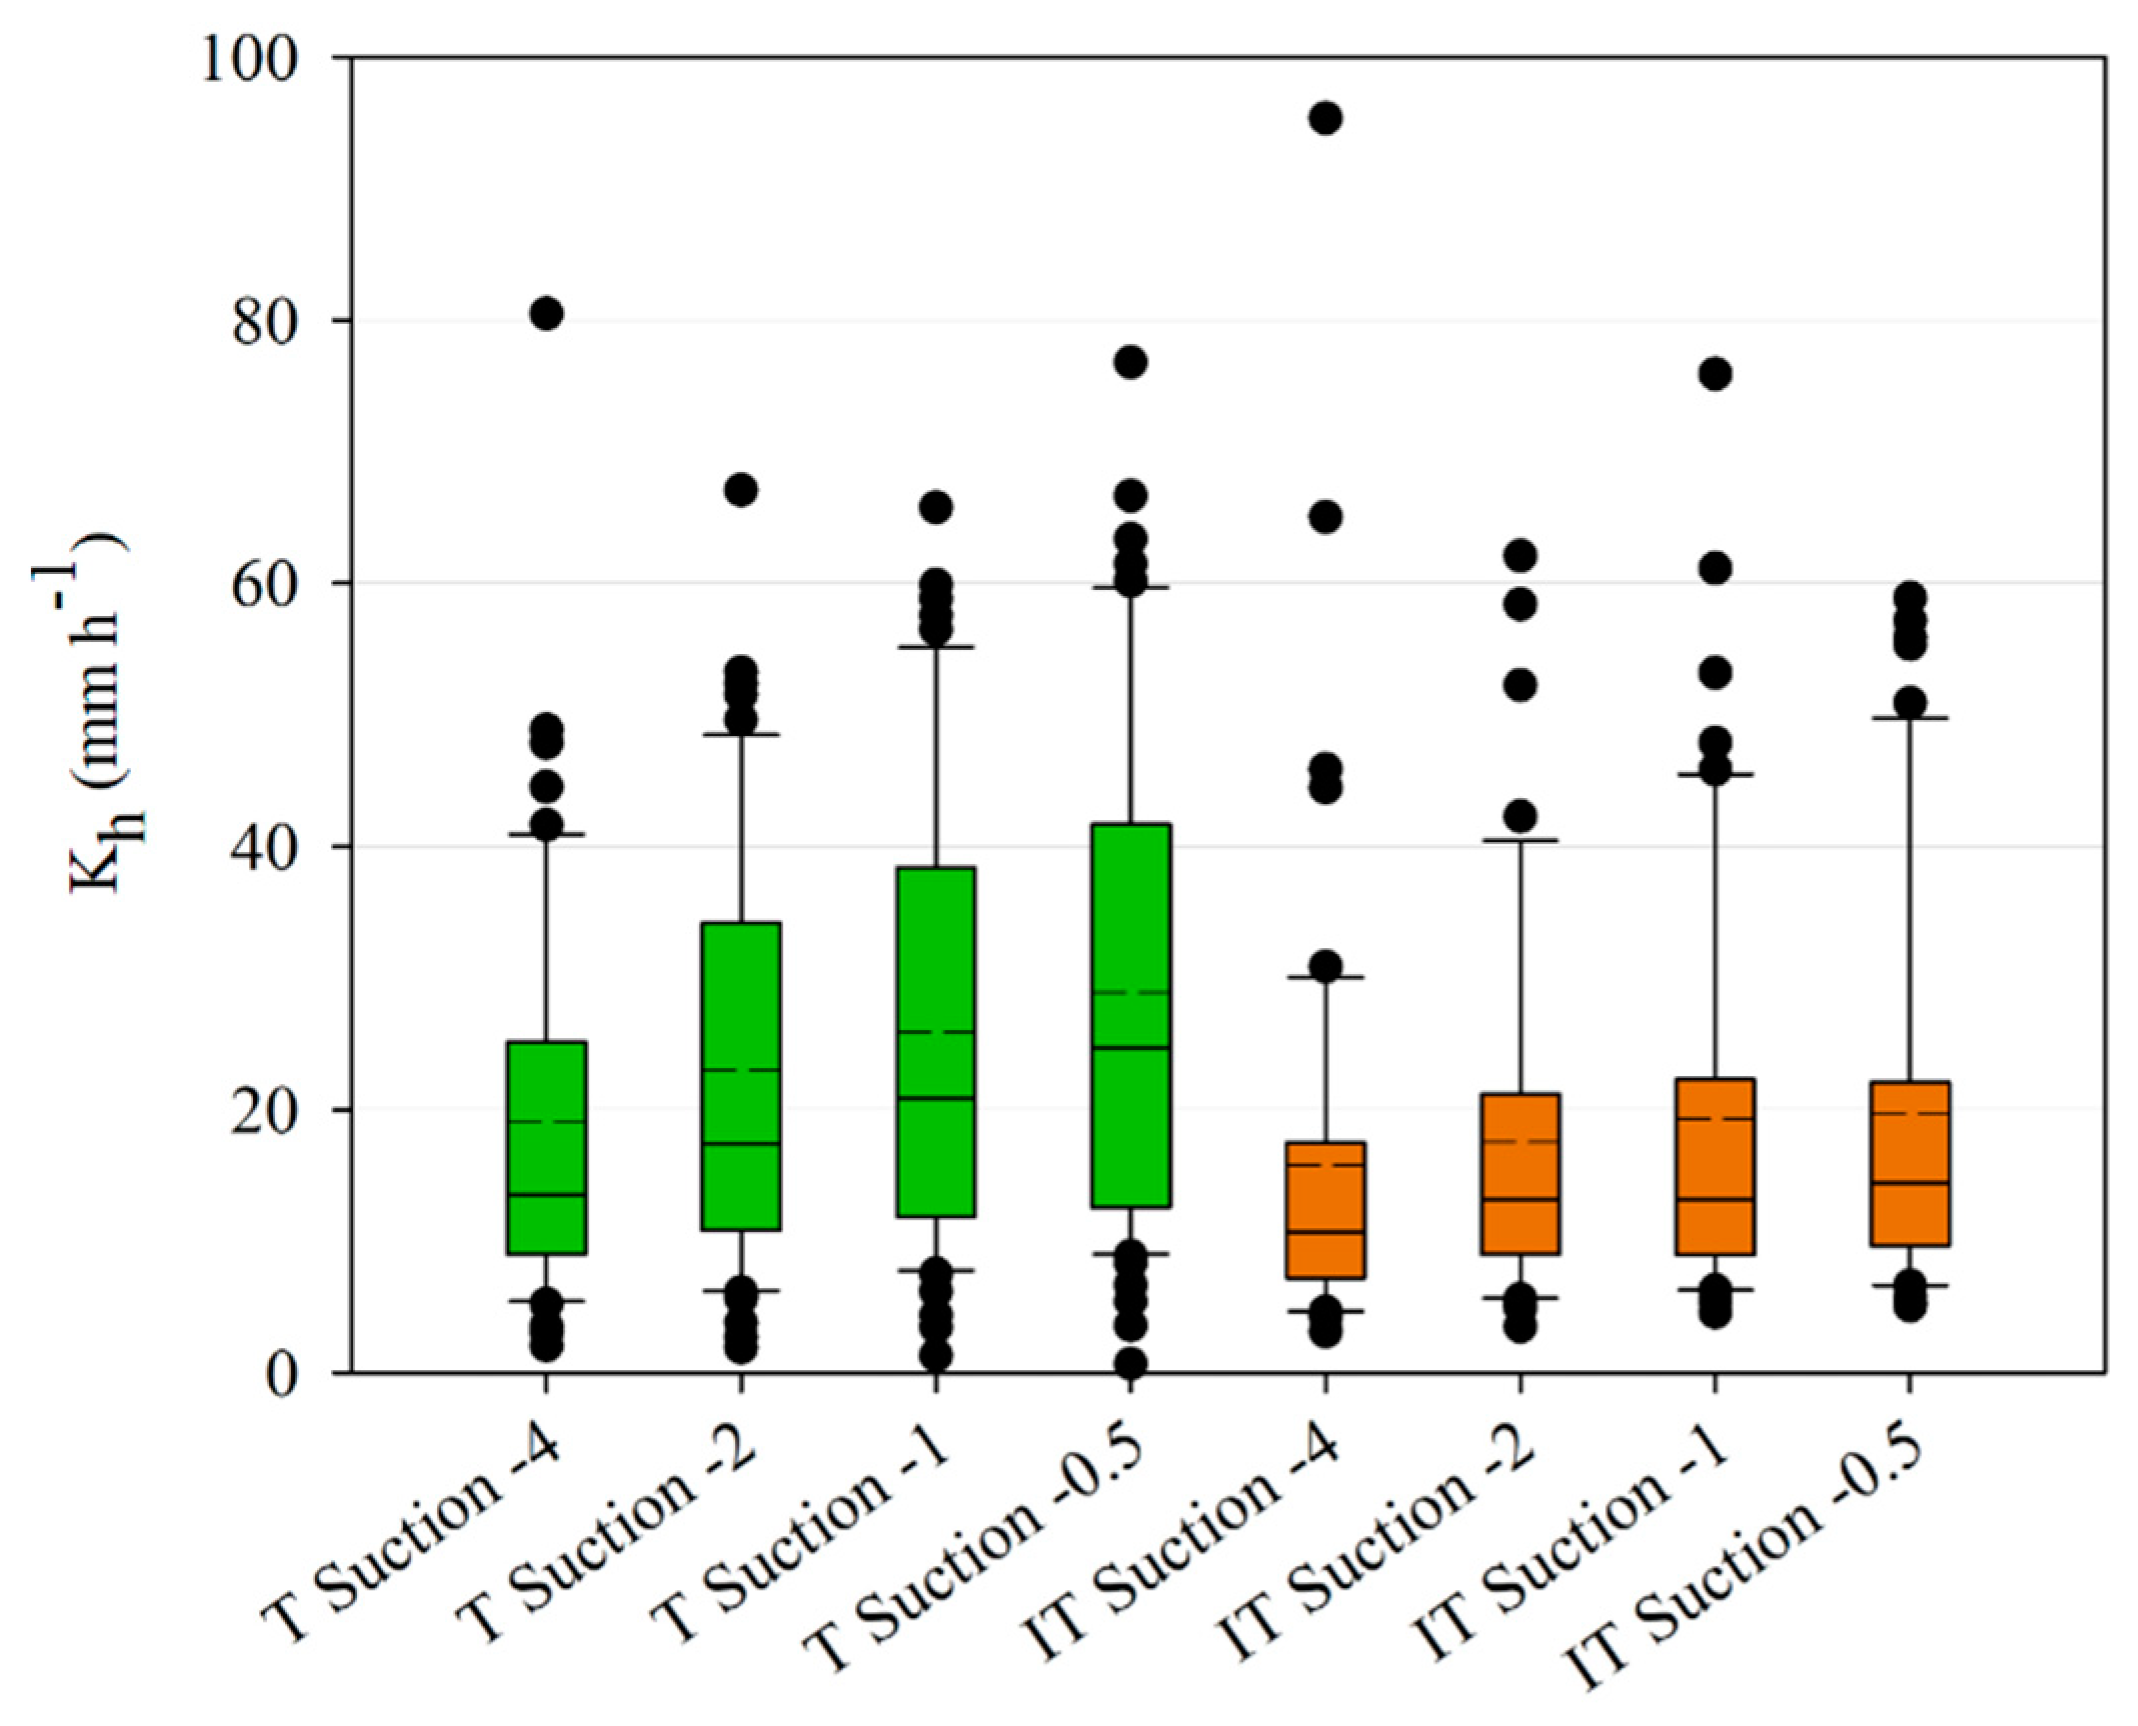
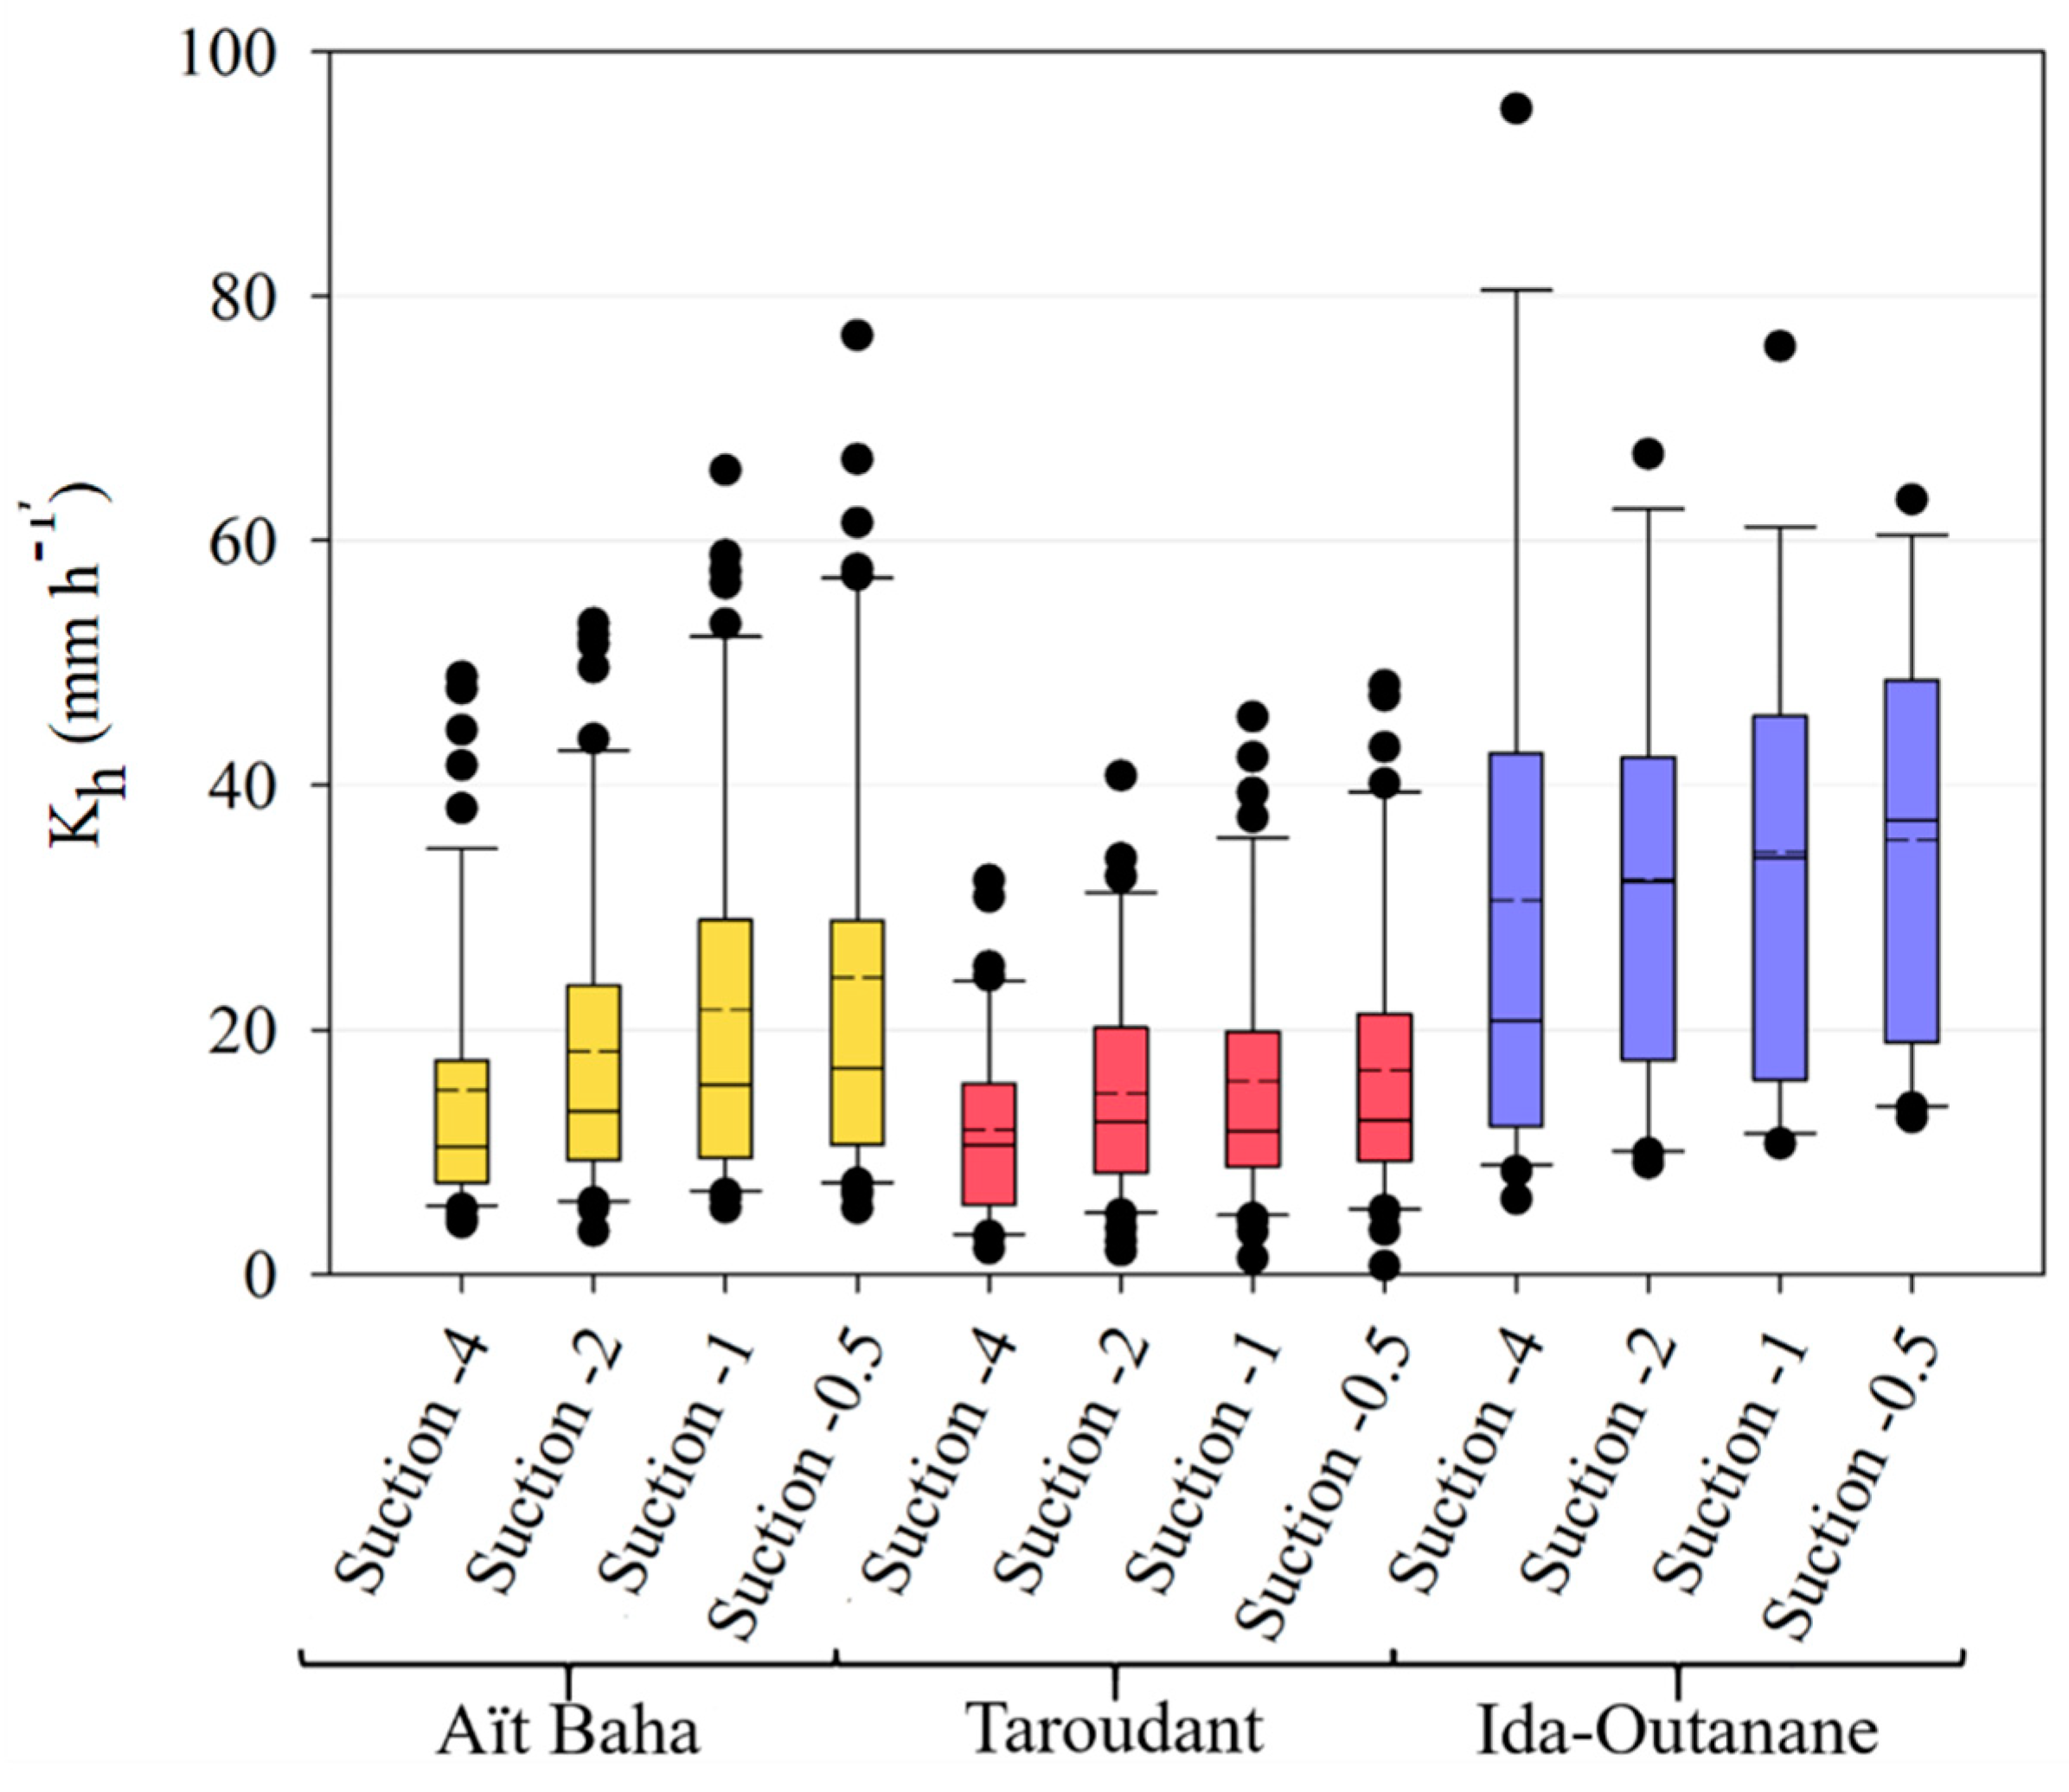
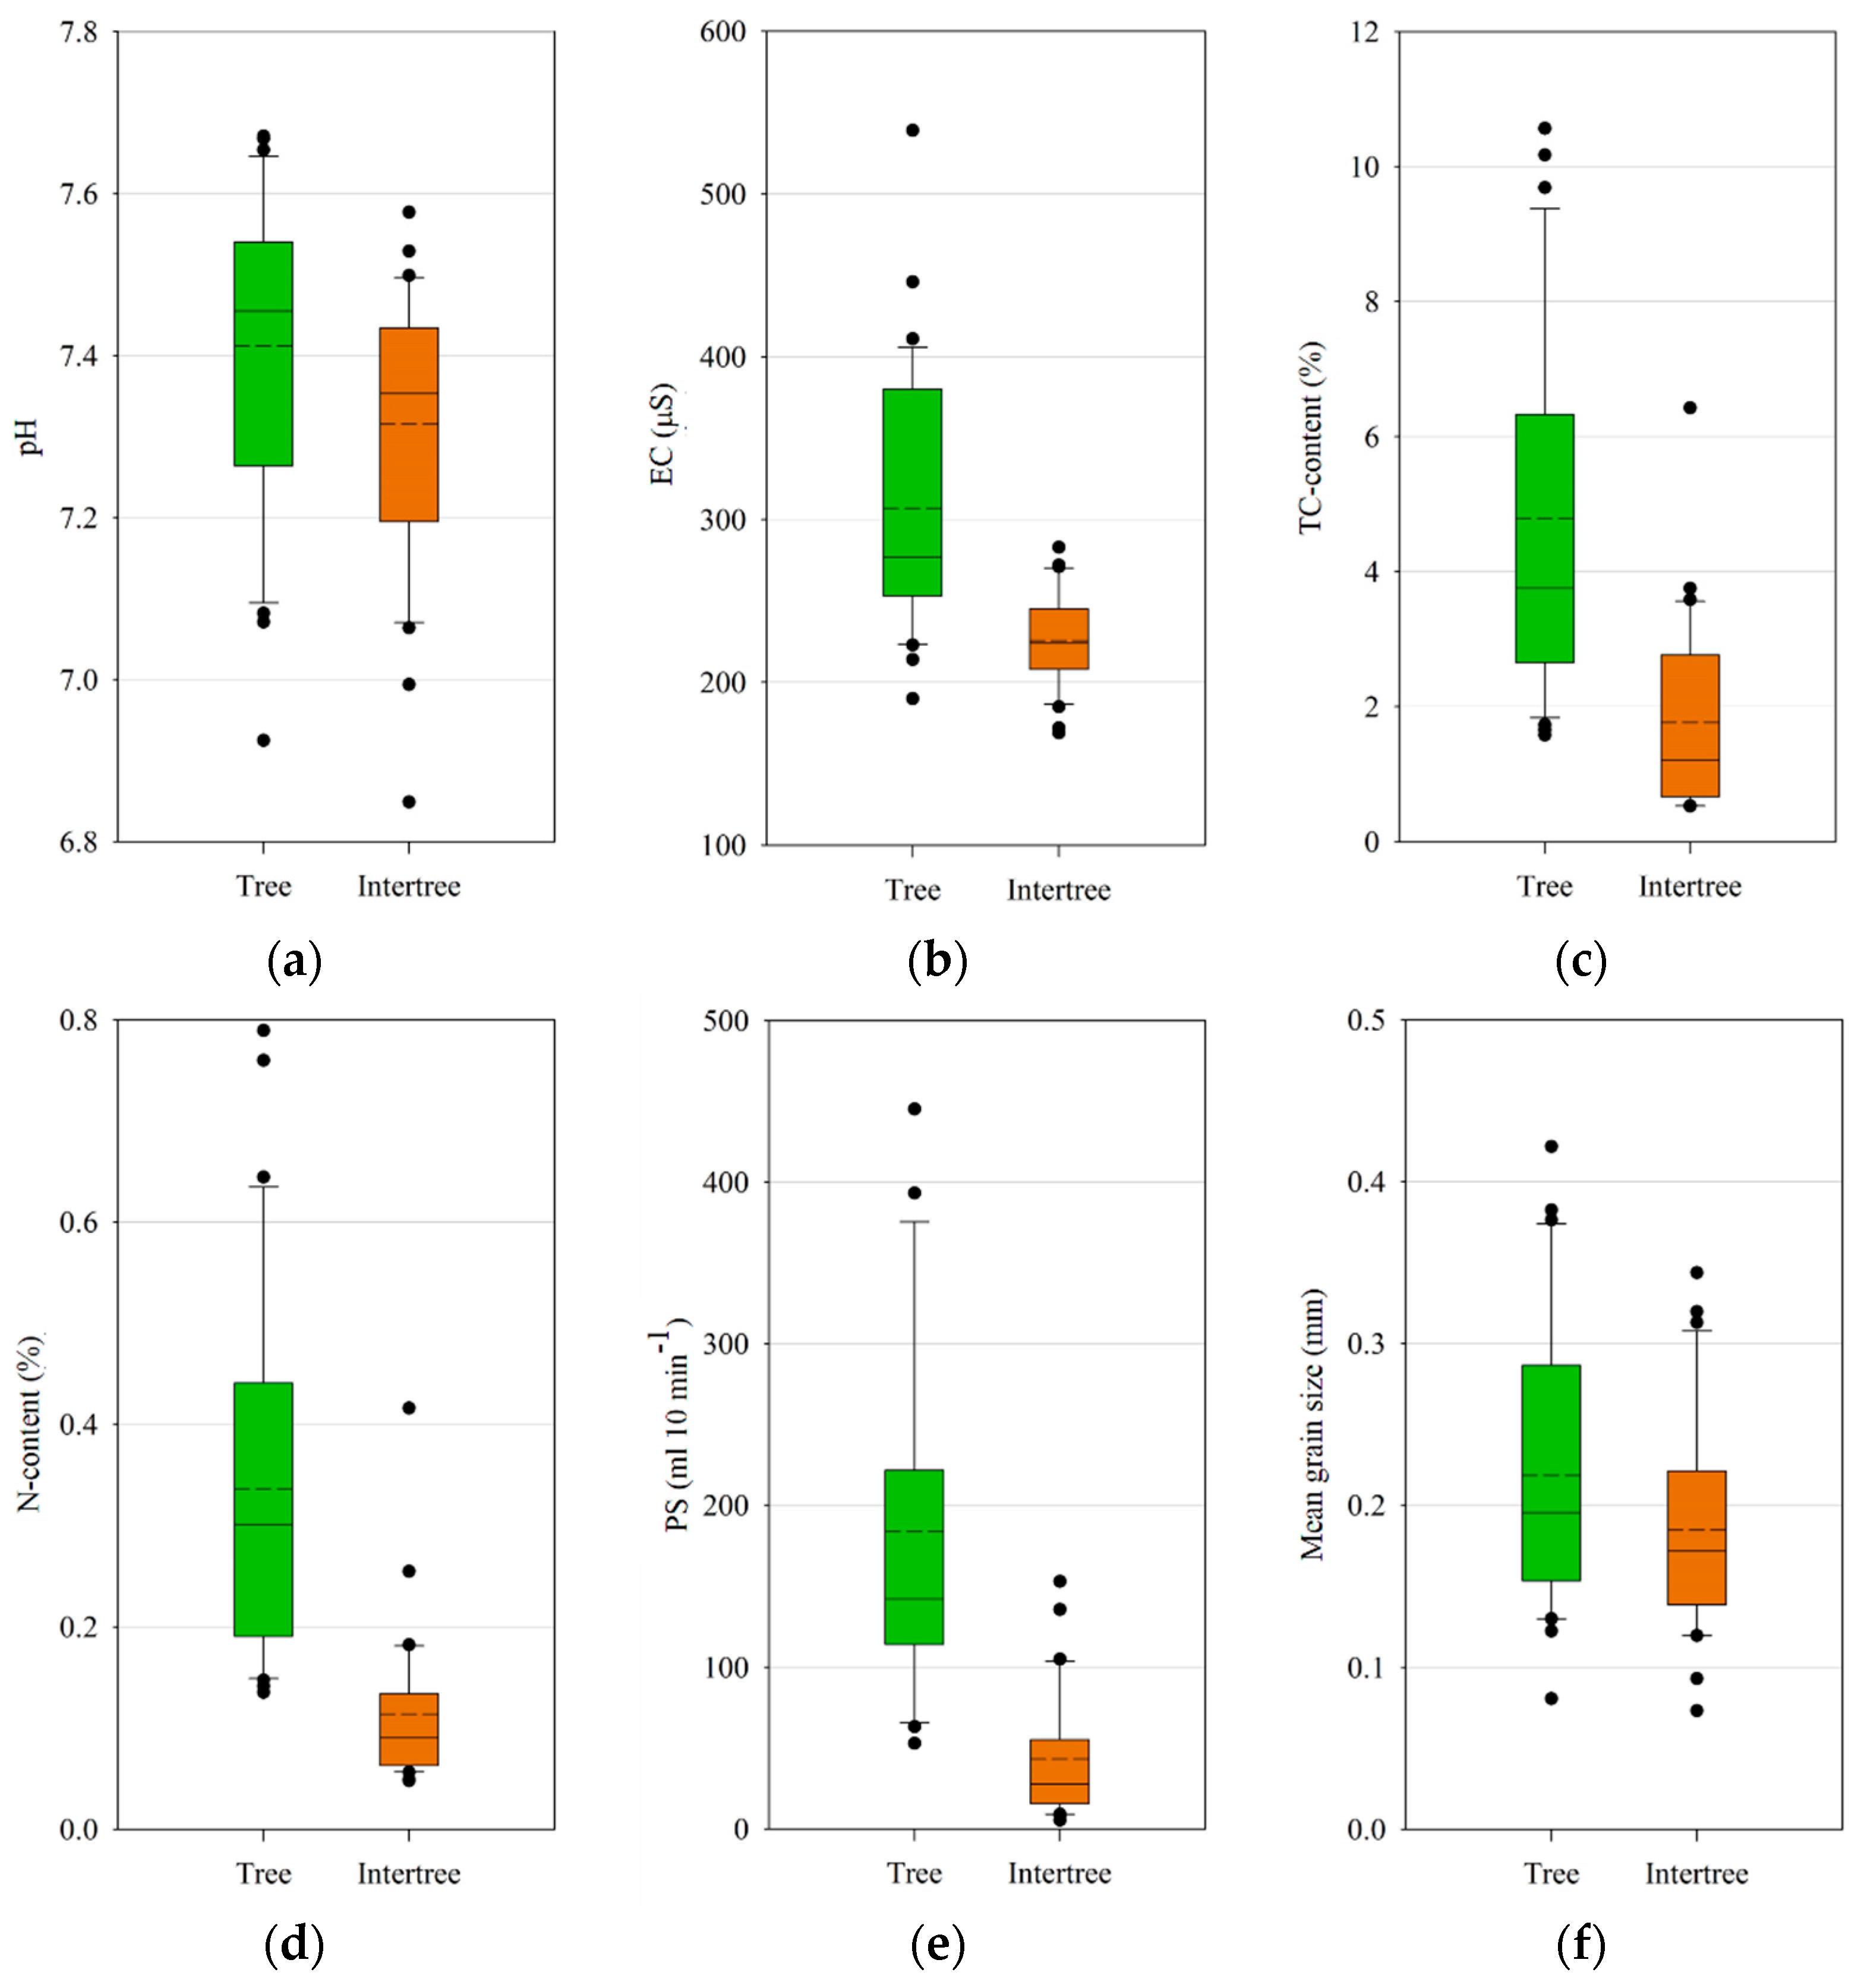
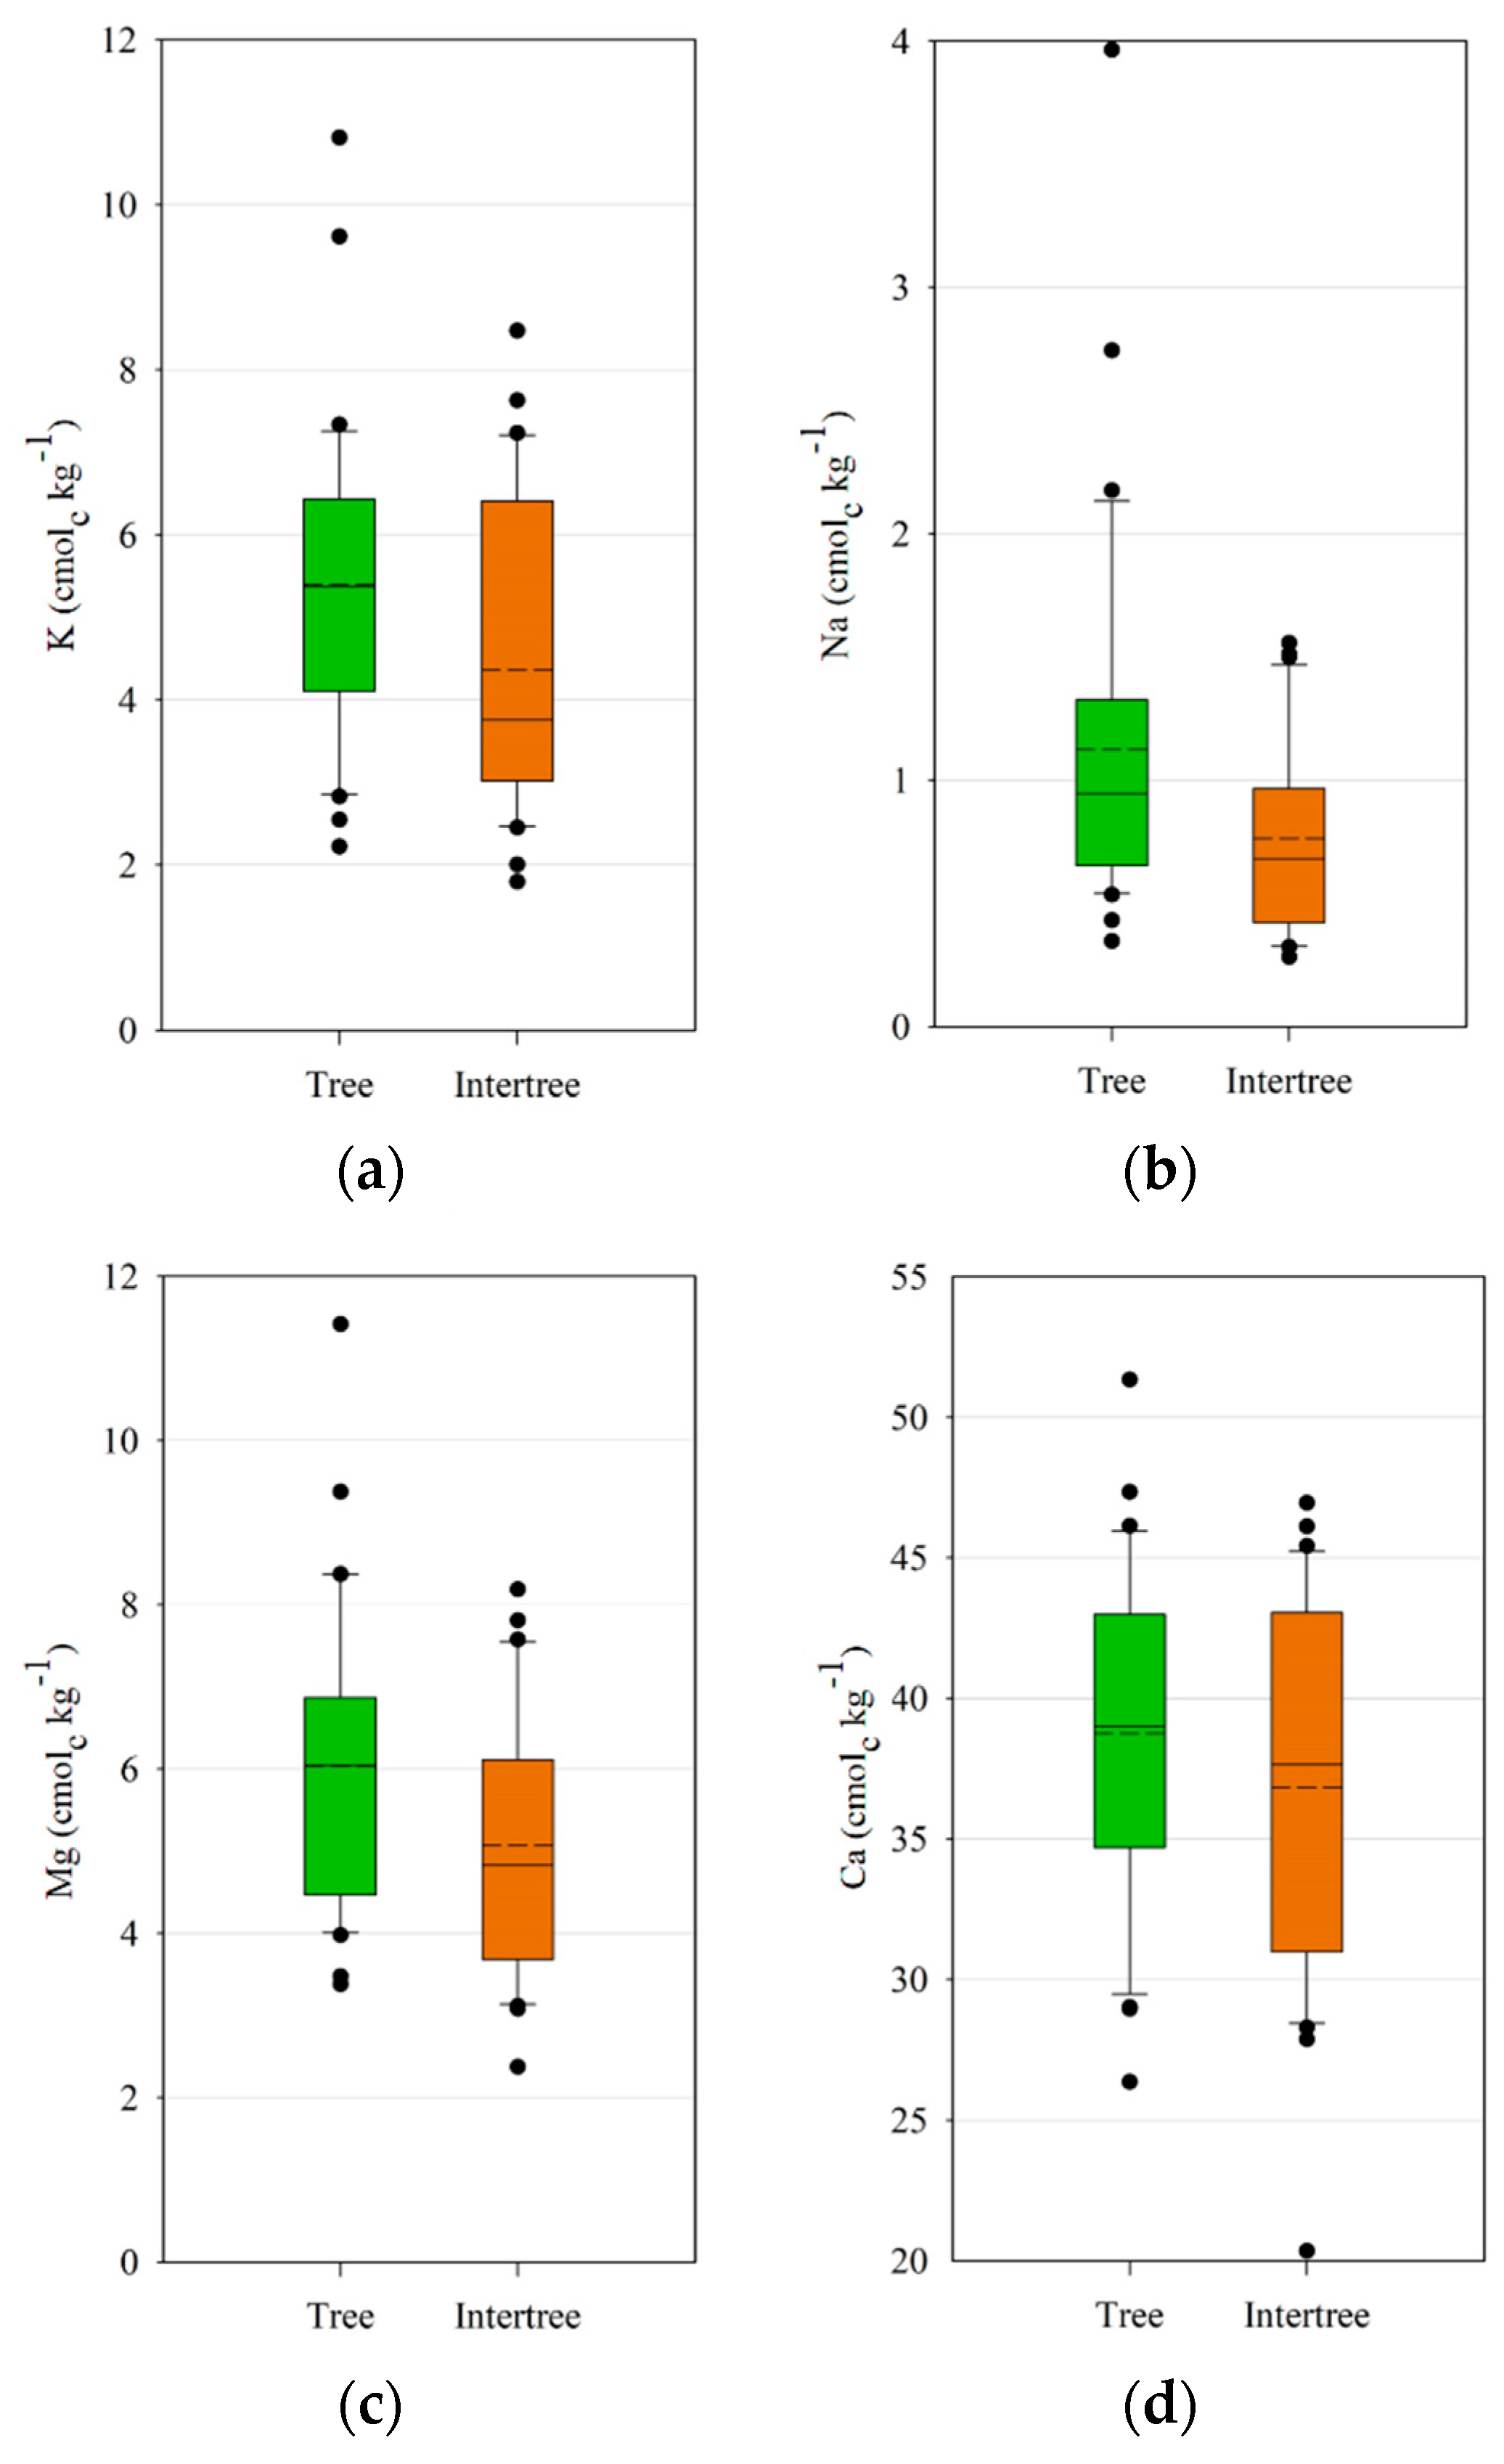
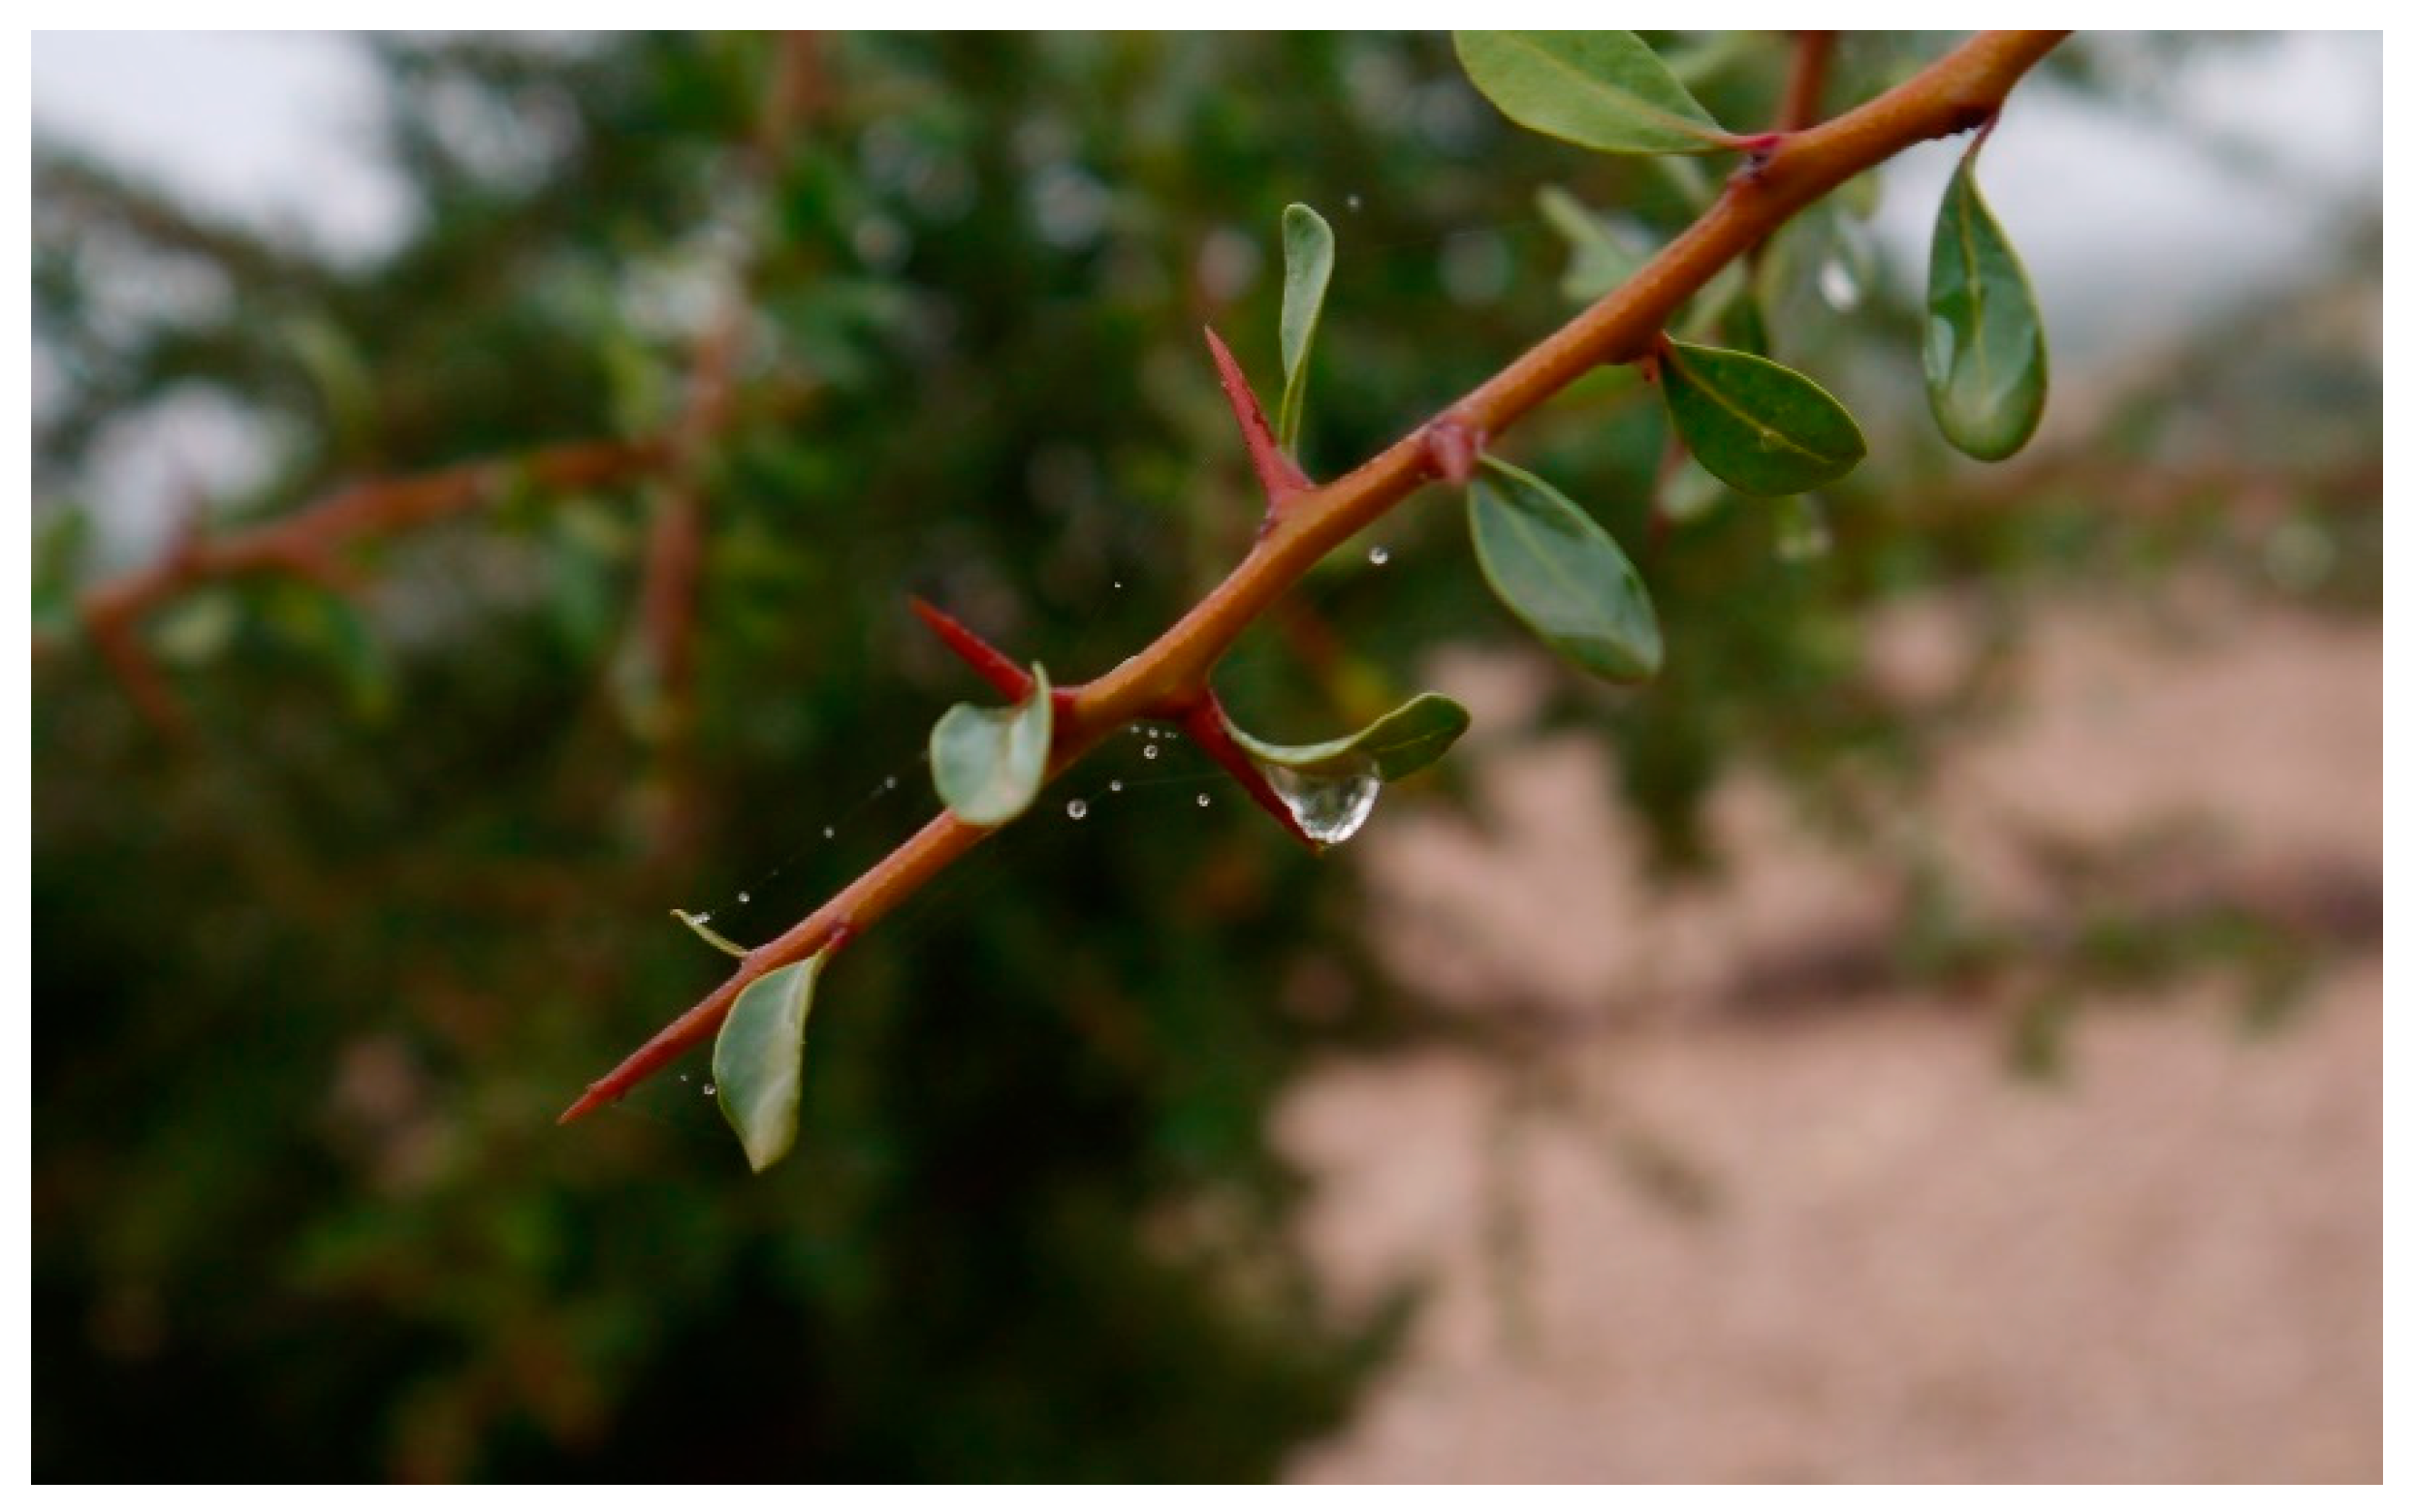
Table 1.
Test sites, principal attributes, and measurements on test sites (ABA: Aït ben Ali; ABH: Aït Baha; AOU: Aouarga; MAO: Maouriga; SHY: Sidi el Haij Yahia; TAS: Tasakat; BOU: Boulaajlate; IRG: Irguitène; TLK: Tamaloukt; AZR: Azrarag; OUF: Tamaït Oufella, X: method was applied to site).
Table 1.
Test sites, principal attributes, and measurements on test sites (ABA: Aït ben Ali; ABH: Aït Baha; AOU: Aouarga; MAO: Maouriga; SHY: Sidi el Haij Yahia; TAS: Tasakat; BOU: Boulaajlate; IRG: Irguitène; TLK: Tamaloukt; AZR: Azrarag; OUF: Tamaït Oufella, X: method was applied to site).
| Site | Principal Attribute | Study Area | Rainfall Simulations | Infiltration Measurements | Soil Analysis |
|---|---|---|---|---|---|
| ABA1n | silvopastoral | Aït Baha | X | X | X |
| ABA1s | steep slope >10° | Aït Baha | X | X | X |
| ABH1n | silvopastoral | Aït Baha | X | X | X |
| ABH1x | grazing exclusion | Aït Baha | X | X | X |
| ABH2c | cultivated | Aït Baha | X | X | X |
| ABH2t | terraced | Aït Baha | X | X | X |
| AOU1a | afforestation | Aït Baha | X | X | |
| AOU2a | afforestation | Aït Baha | X | X | |
| AOU2x | grazing exclusion | Aït Baha | X | X | |
| MAO1n | silvopastoral | Aït Baha | X | X | X |
| MAO2t | terraced | Aït Baha | X | X | X |
| SHY1g | gullies | Aït Baha | X | X | X |
| TAS1r | rock fragment cover | Aït Baha | X | X | X |
| BOU1b | browsed | Taroudant | X | X | X |
| BOU1n | silvopastoral | Taroudant | X | X | X |
| IRG1c | cultivated | Taroudant | X | X | |
| IRG1n | silvopastoral | Taroudant | X | X | |
| IRG2d | dense | Taroudant | X | X | |
| IRG2n | silvopastoral | Taroudant | X | X | |
| IRG3c | cultivated | Taroudant | X | X | |
| IRG3l | logged | Taroudant | X | X | |
| IRG3n | silvopastoral | Taroudant | X | X | |
| TLK1n | silvopastoral | Taroudant | X | X | X |
| TLK1x | grazing exclusion | Taroudant | X | X | X |
| AZR1c | cultivated | Ida-Outanane | X | X | X |
| AZR1n | silvopastoral | Ida-Outanane | X | X | X |
| AZR2c | cultivated | Ida-Outanane | X | X | X |
| AZR2n | silvopastoral | Ida-Outanane | X | X | X |
| OUF1d | dense | Ida-Outanane | X | X | |
| OUF1n | silvopastoral | Ida-Outanane | X | X |
Table 2.
Environmental plot characteristics of tree and intertree areas (* significant difference between tree and intertree area with p-value < 0.05).
Table 2.
Environmental plot characteristics of tree and intertree areas (* significant difference between tree and intertree area with p-value < 0.05).
| Type | Slope (°) | Roughness (Cr) | Vegetation Cover (%) | Stone Cover (%) | Soil Moisture (%) |
|---|---|---|---|---|---|
| Tree | 4.3 ± 4.4 | 6.8 ± 4.4 | 36.8 ± 28.4 * | 35.0 ± 21.4 * | 4.4 ± 4.5 |
| Intertree | 4.2 ± 4.2 | 7.5 ± 4.0 | 10.2 ± 14.1 * | 51.9 ± 20.5 * | 3.4 ± 3.8 |
Table 3.
Means of the inputs for the two-step cluster analysis in order of predictor influence. A tree/intertree column was separately added to indicate potential cluster predominance by tree or intertree area. Parameters are suspended sediment concentration (SSC), suspended sediment load (SSL), surface runoff (AO), and slope.
| Cluster | SSC (g L−1) | SSL (g m−2) | AO (L m−2) | Slope (°) | Tree/Intertree |
|---|---|---|---|---|---|
| Cluster 1 | 1.35 | 13.73 | 4.55 | 6.26 | 15/4 |
| Cluster 2 | 8.95 | 53.26 | 46.91 | 7.38 | 3/14 |
Table 4.
Statistical summary of soil parameters pH, electric conductivity (EC), total carbon content (TC-content), nitrogen content (N-content), percolation stability (PS), and mean grain size for each study area (bold values show significant differences (p < 0.05) between one study area compared to the other two; italic values show significant differences between two study areas).
| Study Area | pH | EC (µS cm−1) | TC-Content (%) | N-Content (%) | PS (mL 10 min−1) | Mean Grain Size (mm) |
|---|---|---|---|---|---|---|
| Aït Baha | 7.34 ± 0.21 | 250.42 ± 73.01 | 2.33 ± 1.67 | 0.17 ± 0.13 | 108.77 ± 104.47 | 0.20 ± 0.09 |
| Taroudant | 7.33 ± 0.17 | 264.00 ± 64.87 | 3.73 ± 3.17 | 0.25 ± 0.22 | 121.39 ± 119.43 | 0.21 ± 0.06 |
| Ida-Outanane | 7.47 ± 0.11 | 299.14 ± 70.53 | 4.32 ± 2.48 | 0.28 ± 0.16 | 102.32 ± 71.86 | 0.17 ± 0.09 |
Table 5.
Statistical summary of cation concentrations for potassium (K), sodium (Na), magnesium (Mg); and calcium (Ca) for each study area (bold values show significant differences (p < 0.05) between one study area compared to the other two; italic values show significant differences between two study areas).
| Study Area | K (cmolc kg−1) | Na (cmolc kg−1) | Mg (cmolc kg−1) | Ca (cmolc kg−1) |
|---|---|---|---|---|
| Aït Baha | 4.27 ± 1.63 | 0.80 ± 0.40 | 5.66 ± 1.57 | 35.76 ± 5.58 |
| Taroudant | 4.95 ± 2.04 | 0.98 ± 0.48 | 5.57 ± 1.67 | 36.45 ± 6.52 |
| Ida-Outanane | 5.87 ± 1.96 | 1.15 ± 1.01 | 5.32 ± 2.23 | 43.66 ± 3.66 |
Table 6.
Means of the inputs for the two-step cluster analysis in order of predictor influence. A tree/intertree column was separately added to indicate potential cluster predominance by tree or intertree area.
Table 6.
Means of the inputs for the two-step cluster analysis in order of predictor influence. A tree/intertree column was separately added to indicate potential cluster predominance by tree or intertree area.
| Cluster | TC (%) | EC (µS cm−1) | N (%) | Vegetation Cover (%) | PS (mL 10 min−1) | Ksat (mm h−1) | pH | Tree/Intertree |
|---|---|---|---|---|---|---|---|---|
| Cluster 1 | 1.74 | 223.42 | 0.12 | 5.88 | 60.10 | 141.19 | 7.30 | 6/27 |
| Cluster 2 | 5.20 | 315.46 | 0.36 | 34.29 | 186.03 | 211.17 | 7.46 | 22/2 |
© 2019 by the authors. Licensee MDPI, Basel, Switzerland. This article is an open access article distributed under the terms and conditions of the Creative Commons Attribution (CC BY) license (http://creativecommons.org/licenses/by/4.0/).
Share and Cite
MDPI and ACS Style
Kirchhoff, M.; Engelmann, L.; Zimmermann, L.L.; Seeger, M.; Marzolff, I.; Aït Hssaine, A.; Ries, J.B. Geomorphodynamics in Argan Woodlands, South Morocco. Water 2019, 11, 2193. https://doi.org/10.3390/w11102193
AMA Style
Kirchhoff M, Engelmann L, Zimmermann LL, Seeger M, Marzolff I, Aït Hssaine A, Ries JB. Geomorphodynamics in Argan Woodlands, South Morocco. Water. 2019; 11(10):2193. https://doi.org/10.3390/w11102193
Chicago/Turabian StyleKirchhoff, Mario, Lars Engelmann, Lutz Leroy Zimmermann, Manuel Seeger, Irene Marzolff, Ali Aït Hssaine, and Johannes B. Ries. 2019. "Geomorphodynamics in Argan Woodlands, South Morocco" Water 11, no. 10: 2193. https://doi.org/10.3390/w11102193
Note that from the first issue of 2016, this journal uses article numbers instead of page numbers. See further details here.