A Study on the Response of the Hydrodynamic Environment to the Morphology of Radial Sand Ridges in the Coastal Waters of Jiangsu


Abstract
:1. Introduction
1.1. Cause of RSR Formation
1.2. Formation Time of Radiation Sandbanks
1.3. Relationship between RSRs and the Radial Tidal Current Field
1.4. Hydrodynamic Characteristics of the RSRs
1.5. Development and Use of the RSRs
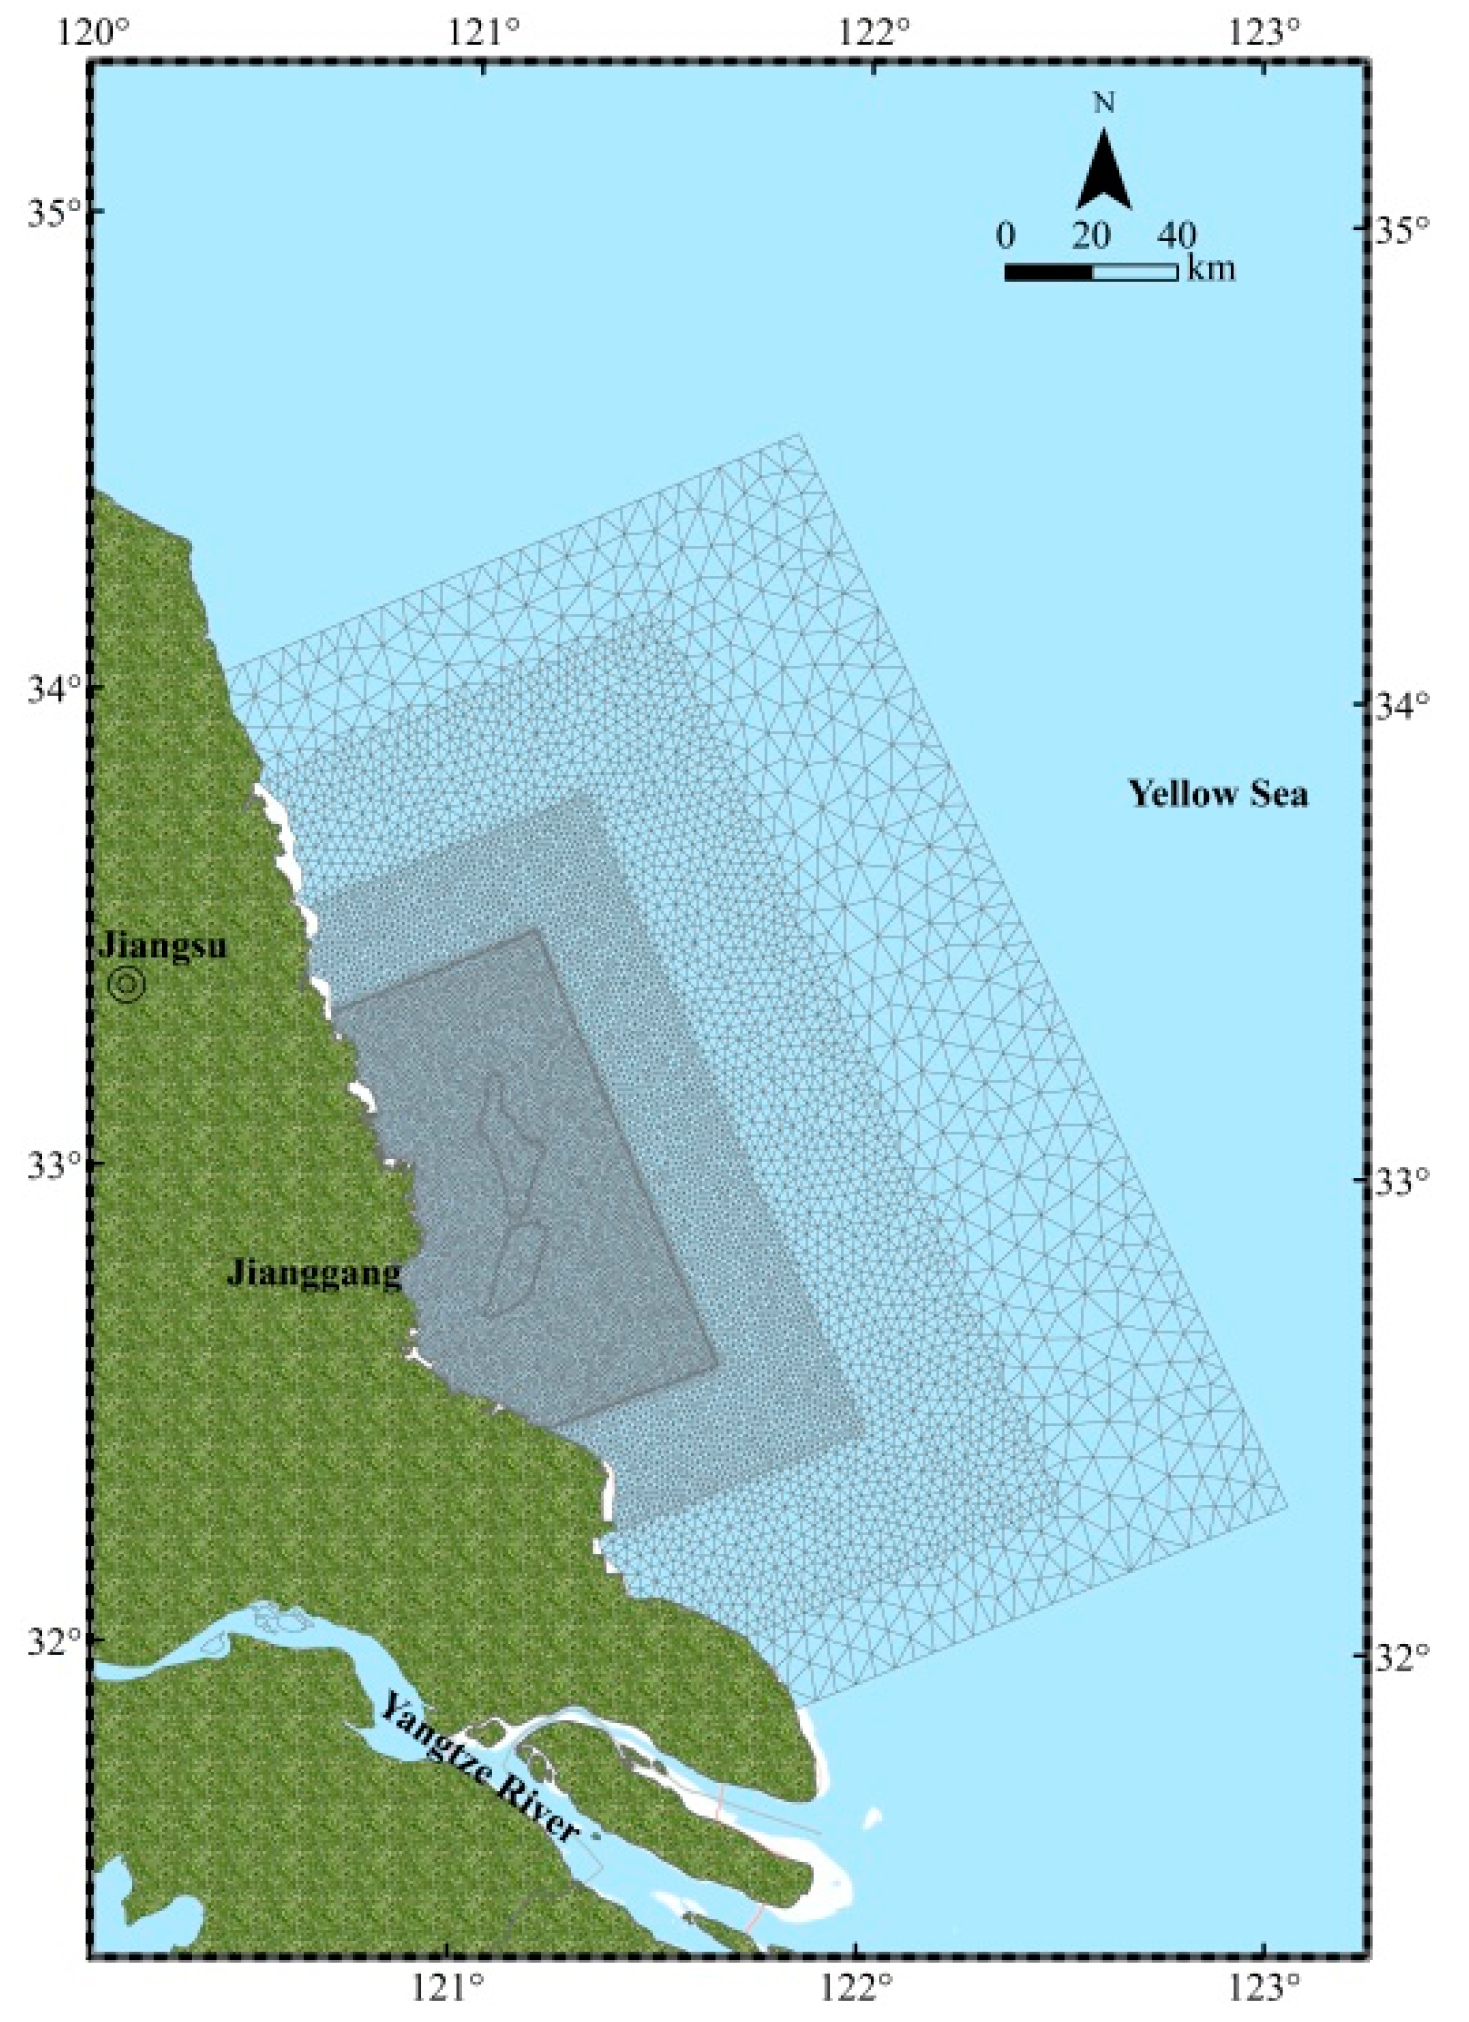
2. Study Area
3. Research Methods
3.1. Mathematical Model
3.2. Grid and Bathymetry
3.2.1. Grid
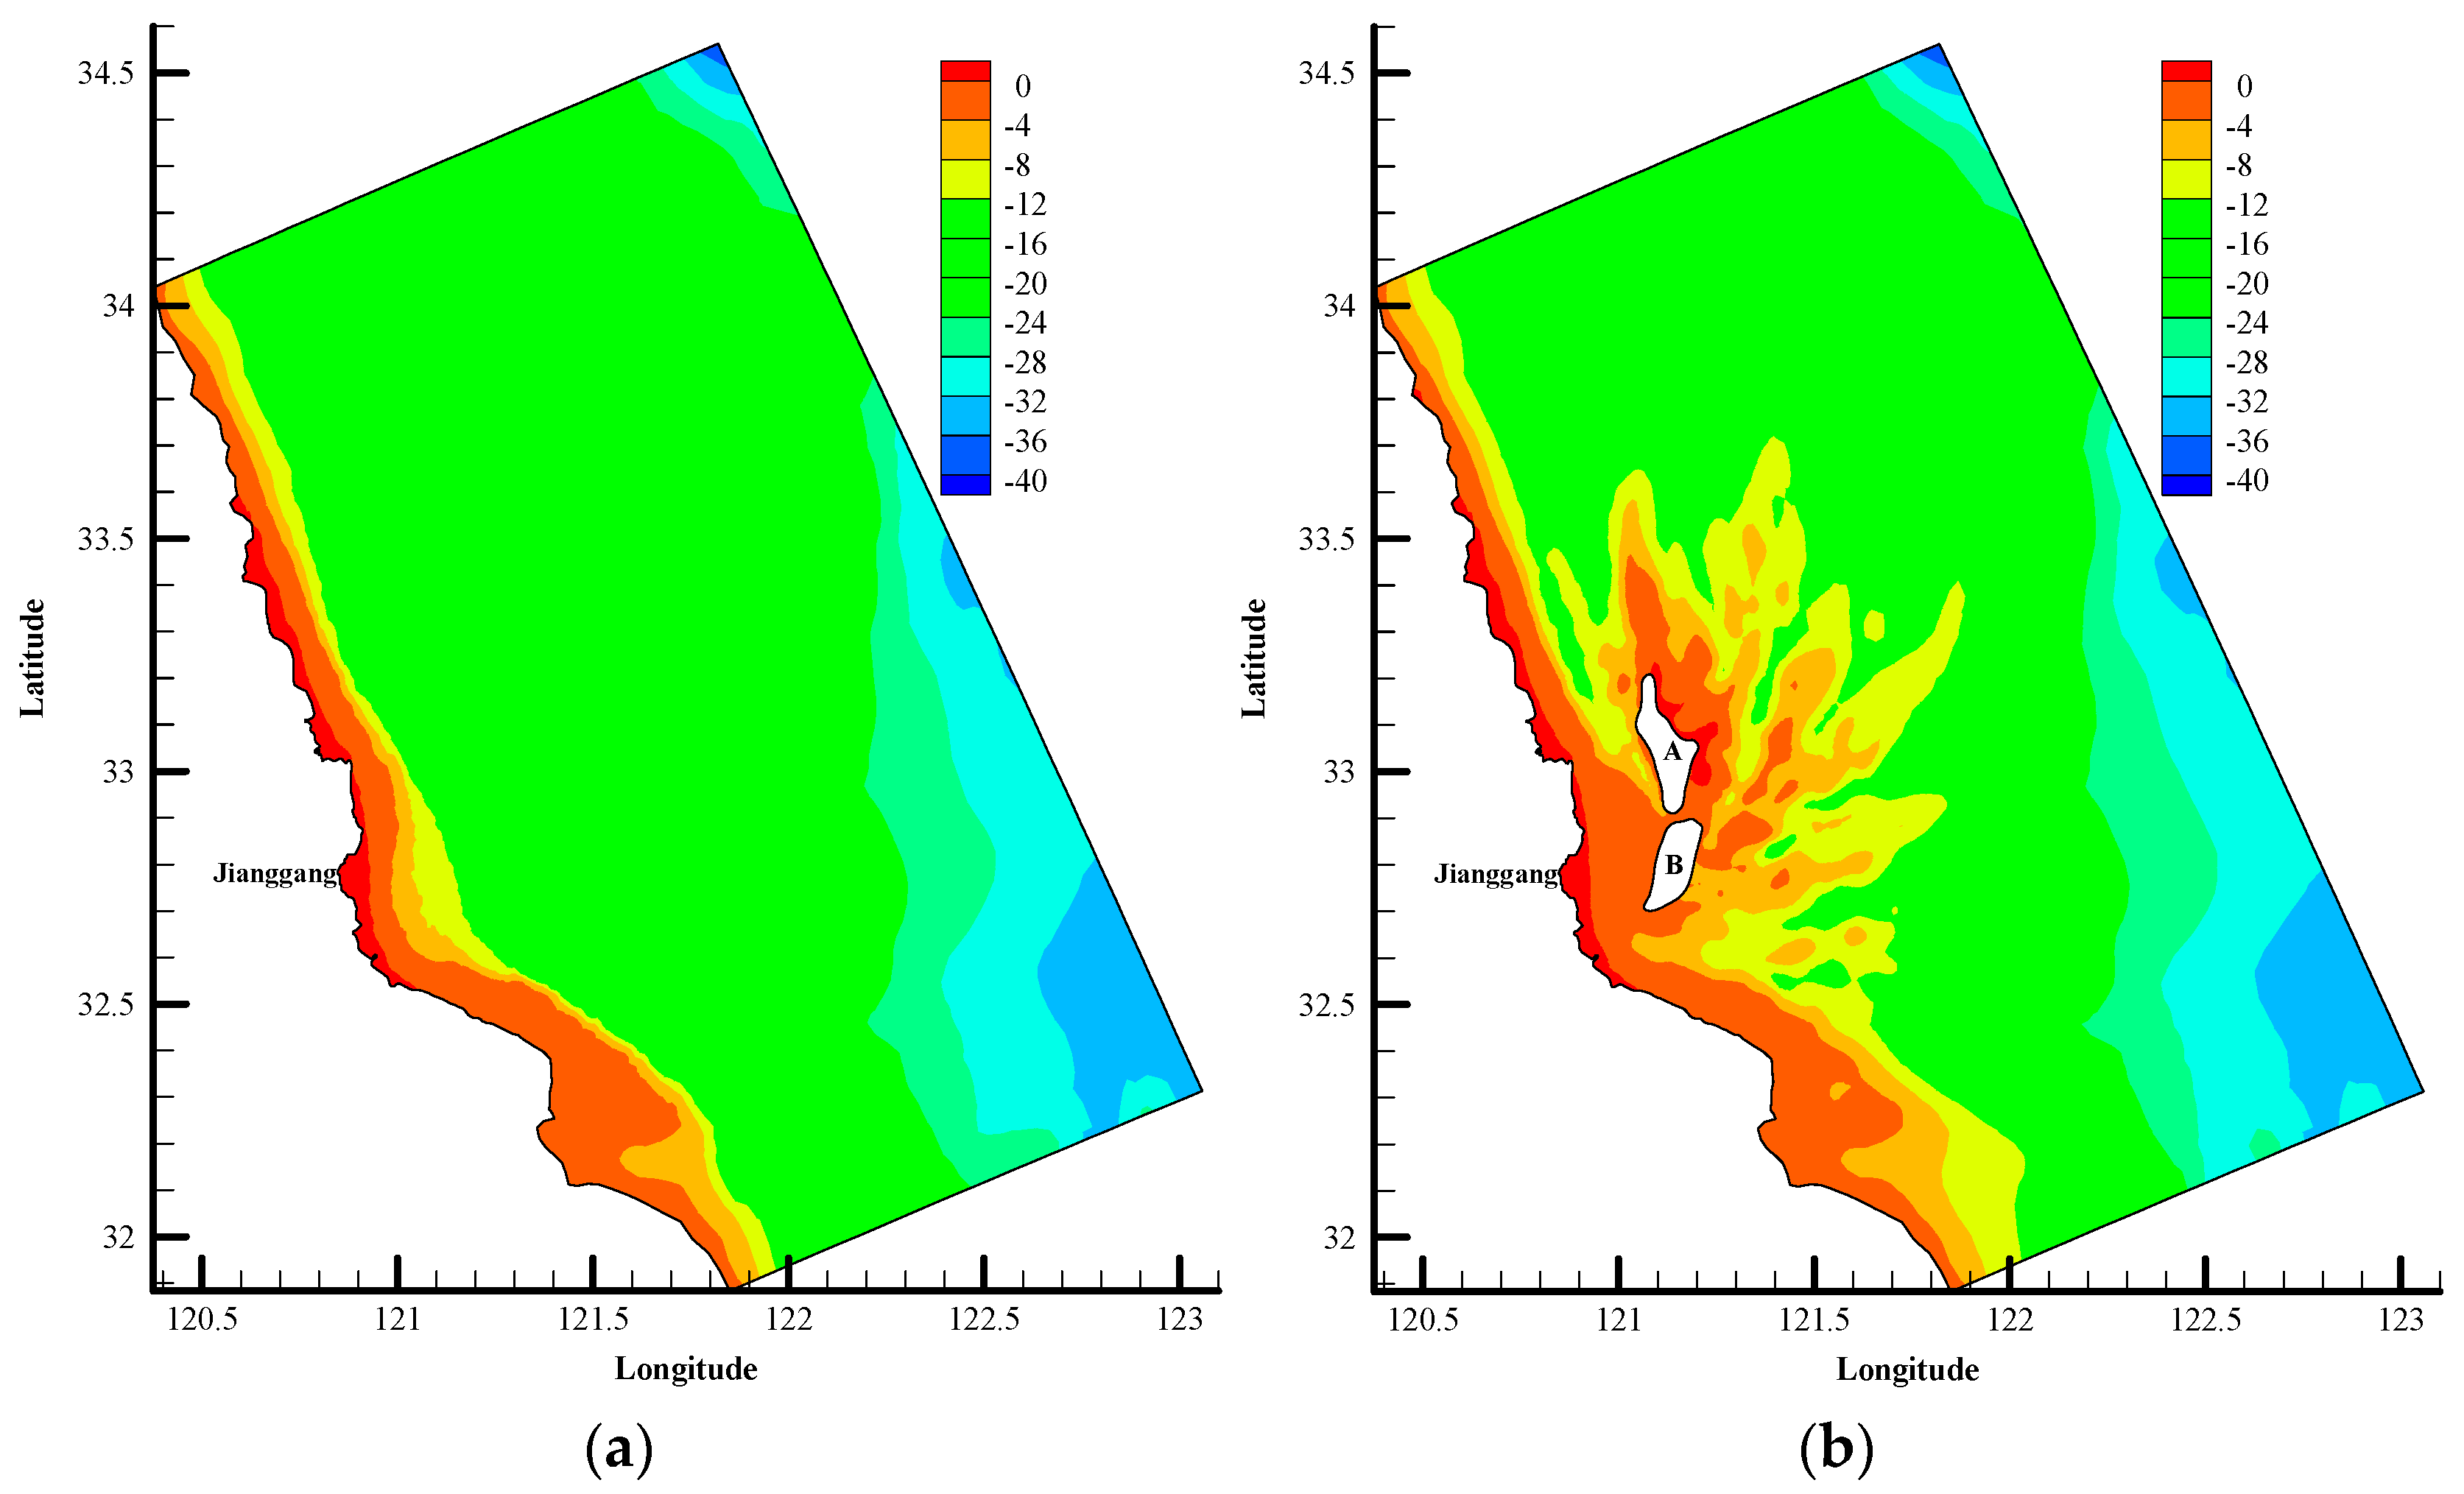
3.2.2. Bathymetry
3.3. Boundaries and Initial Conditions
3.3.1. Open Boundaries
3.3.2. Moving Boundaries
3.4. Calculation Conditions
4. Results
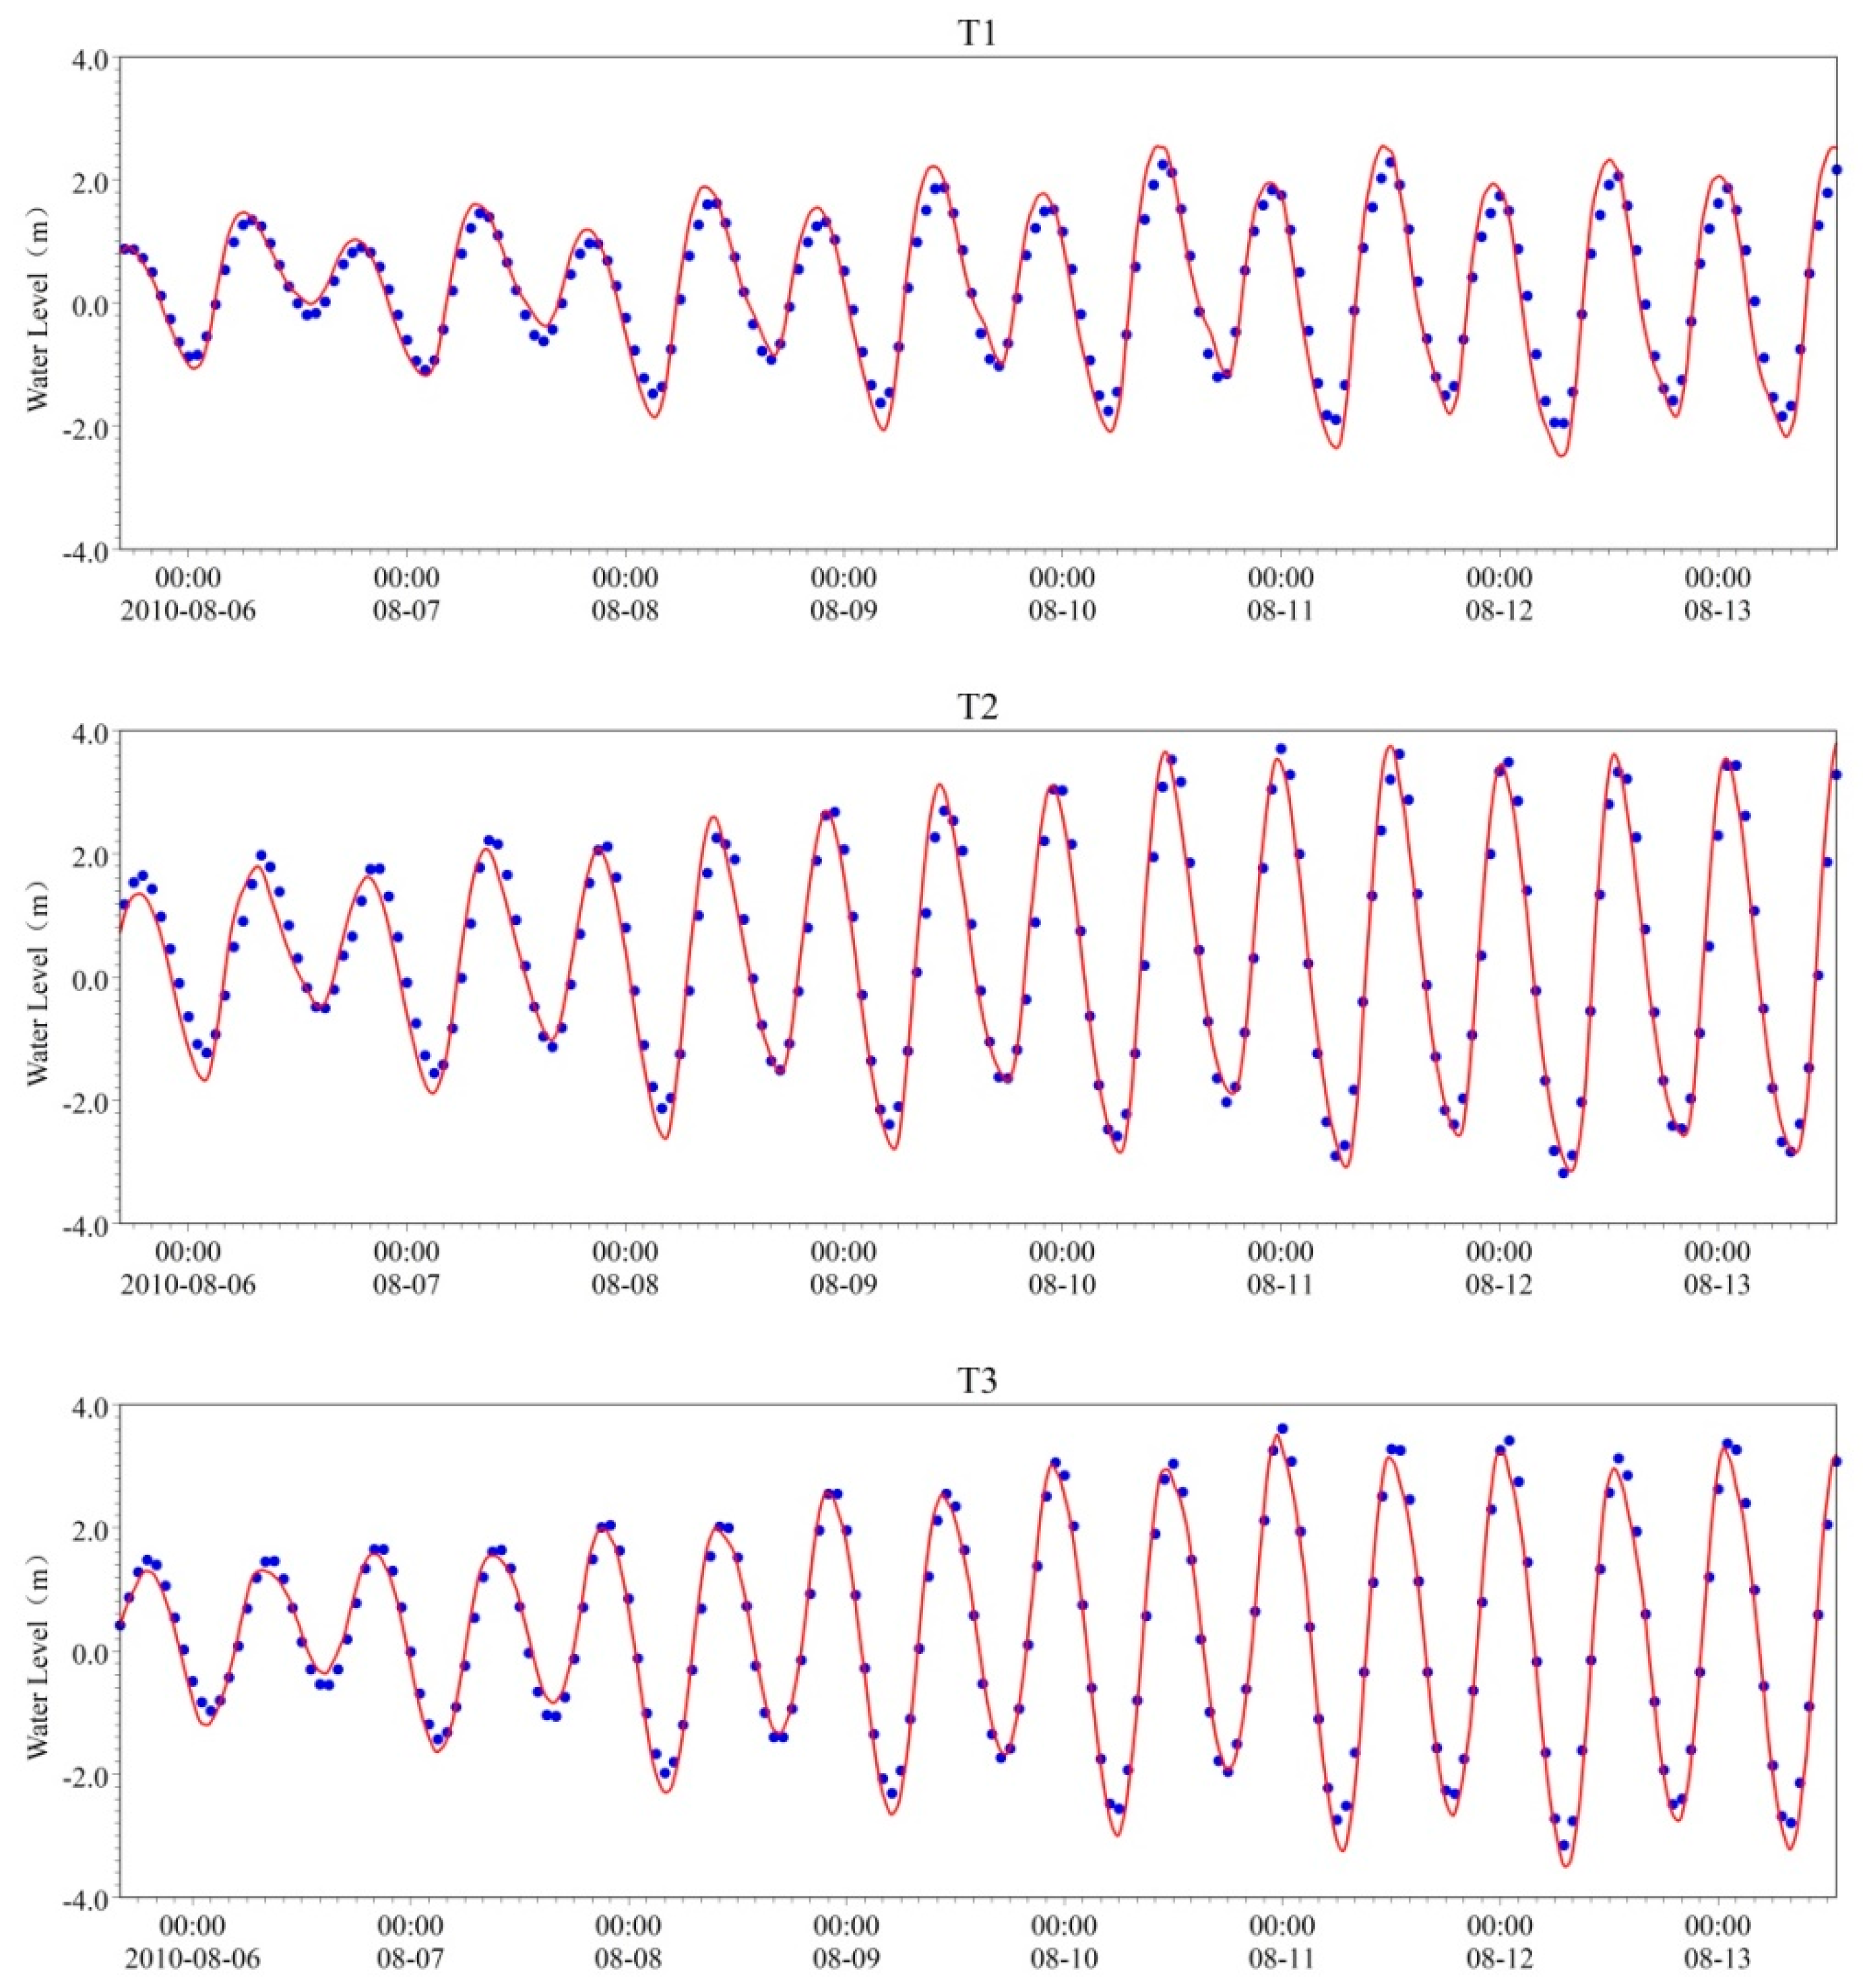
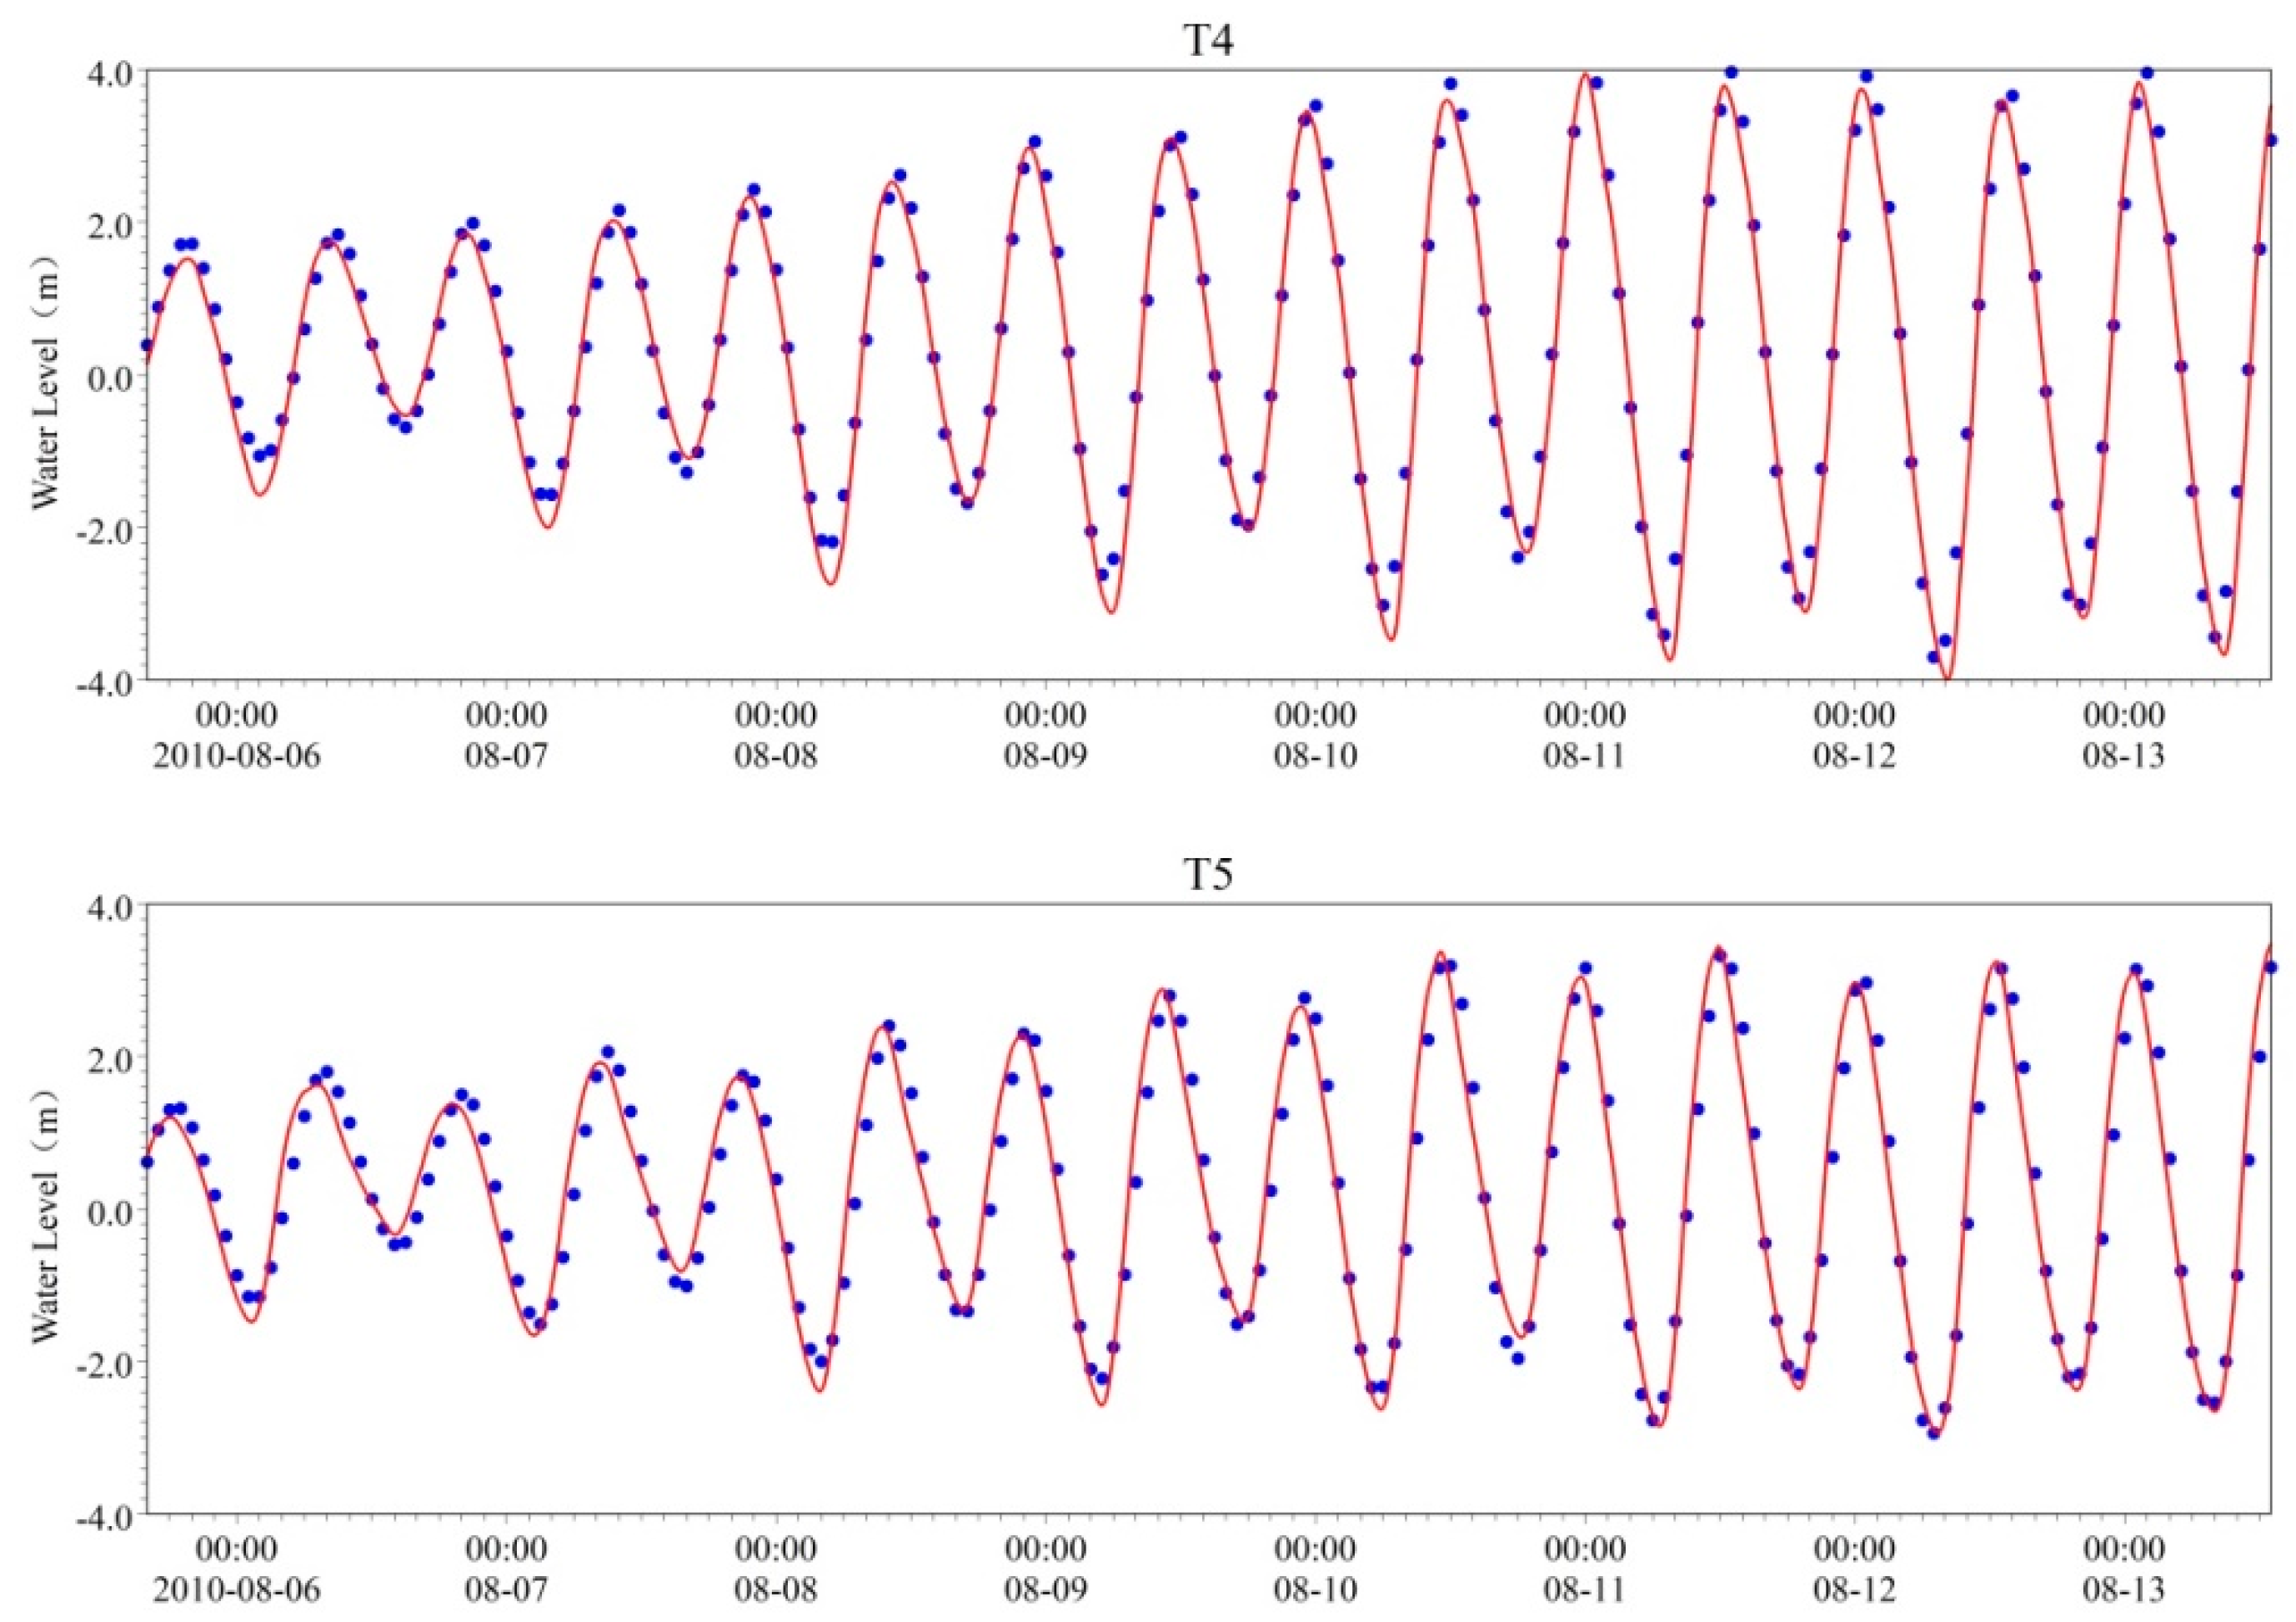
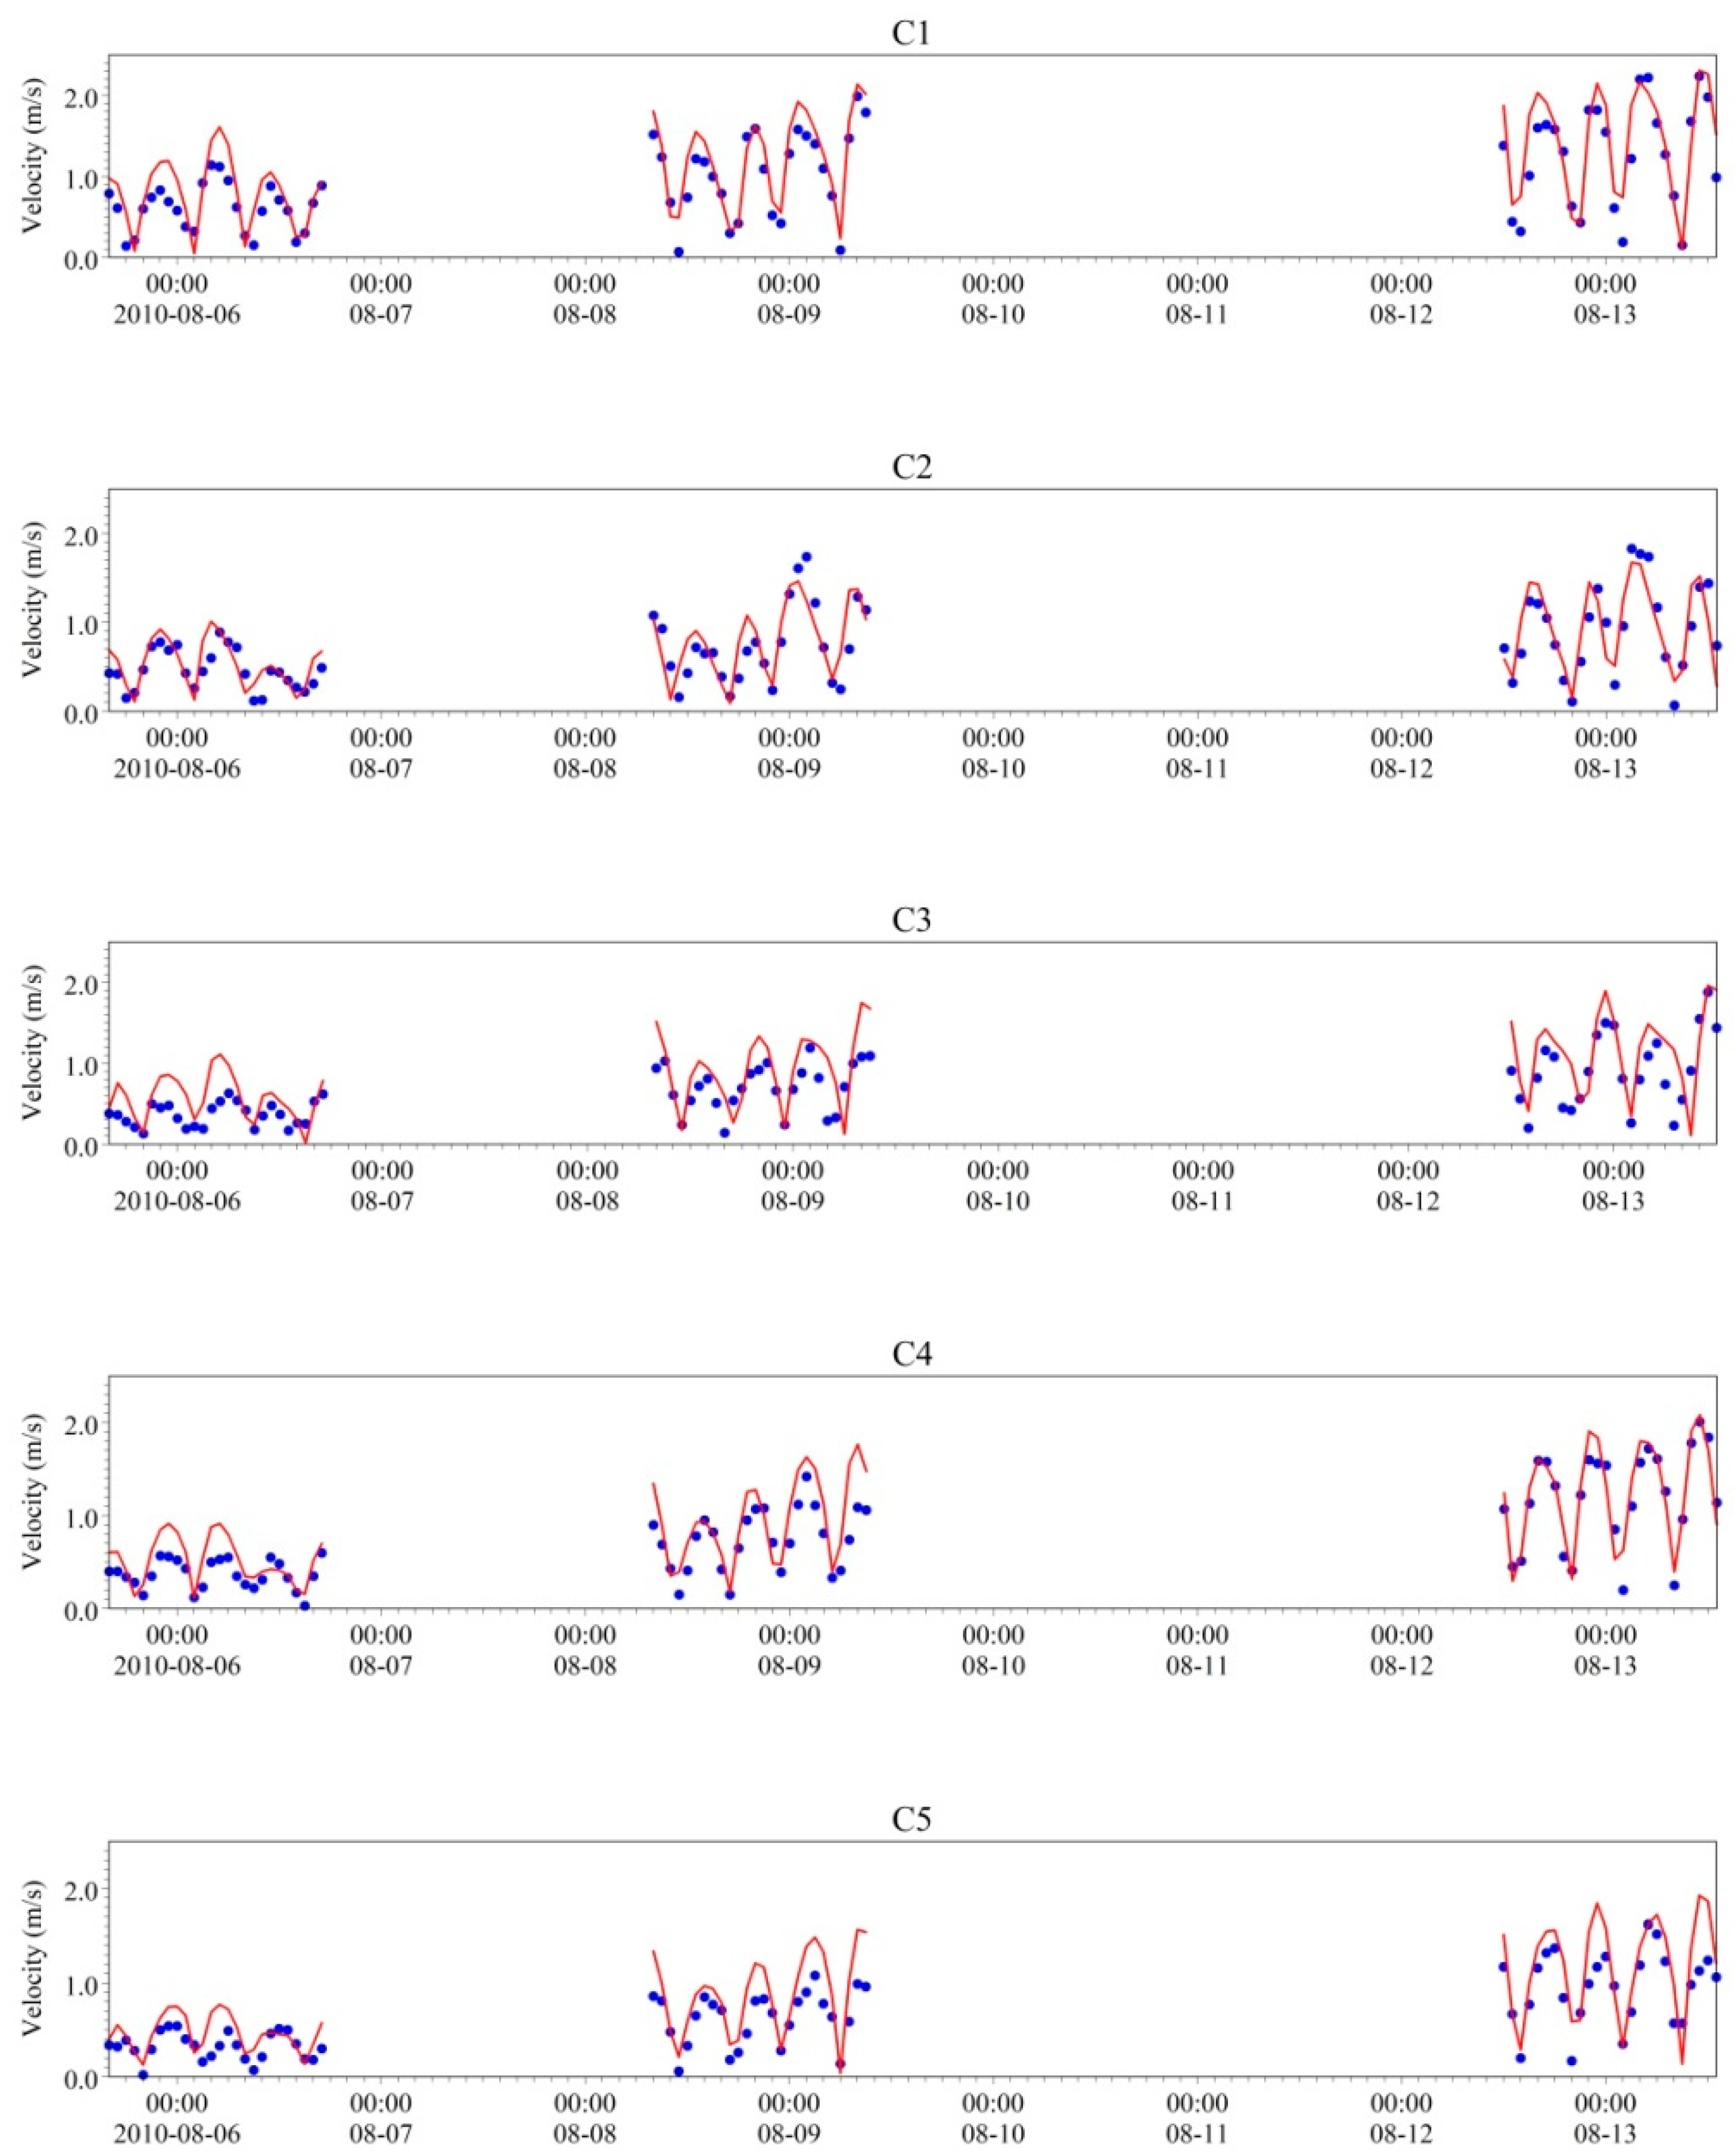
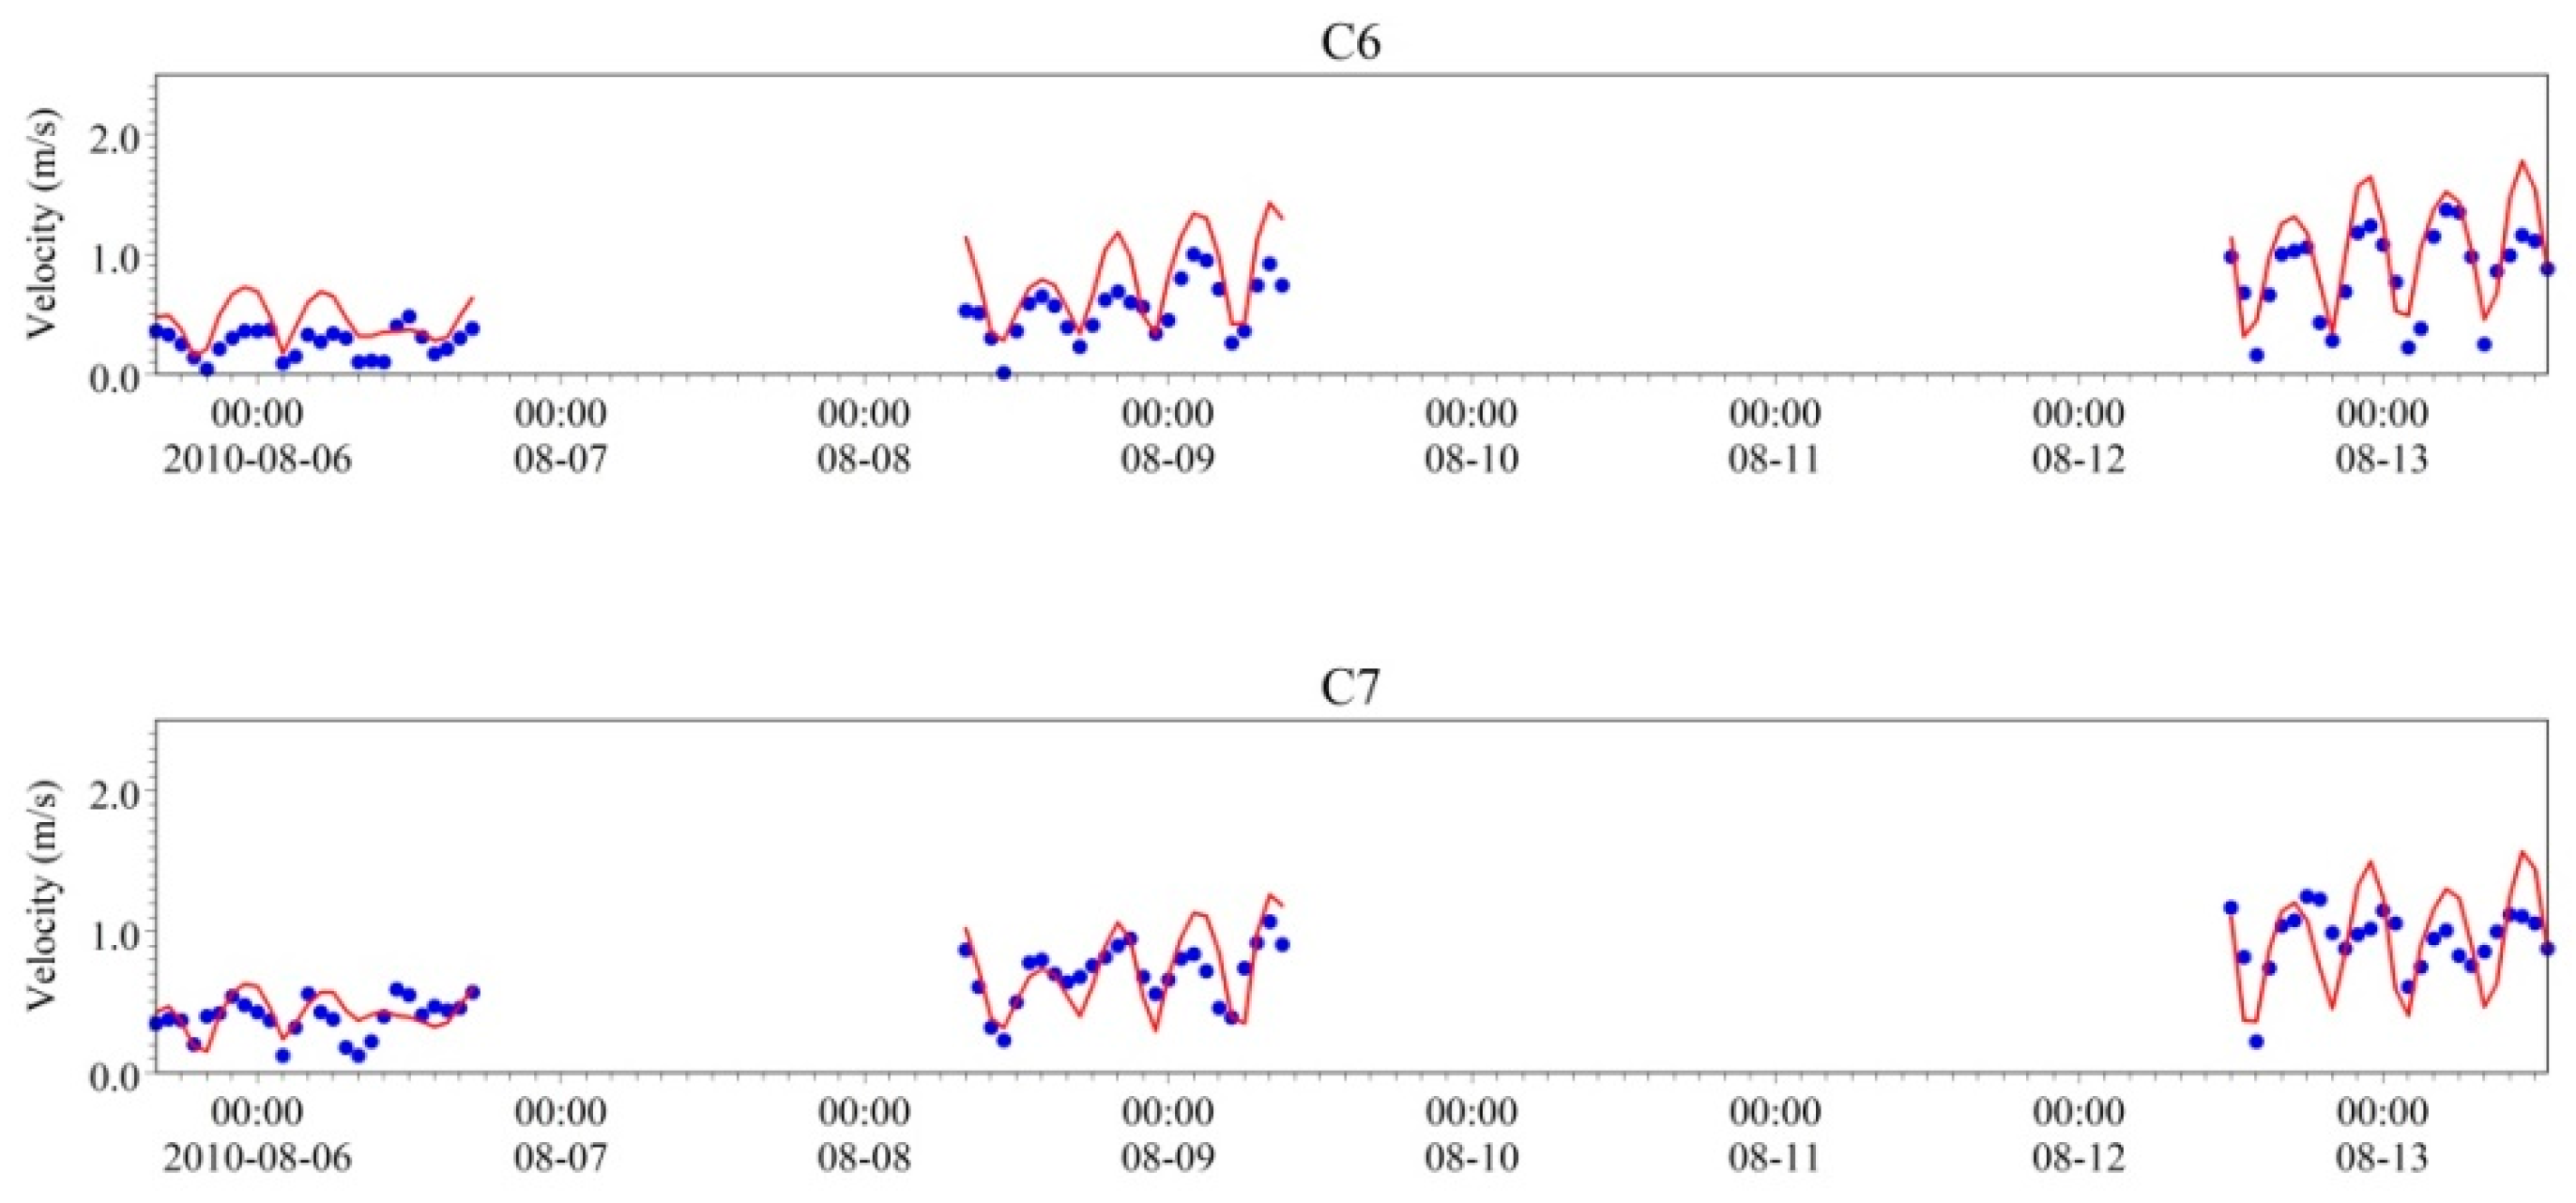
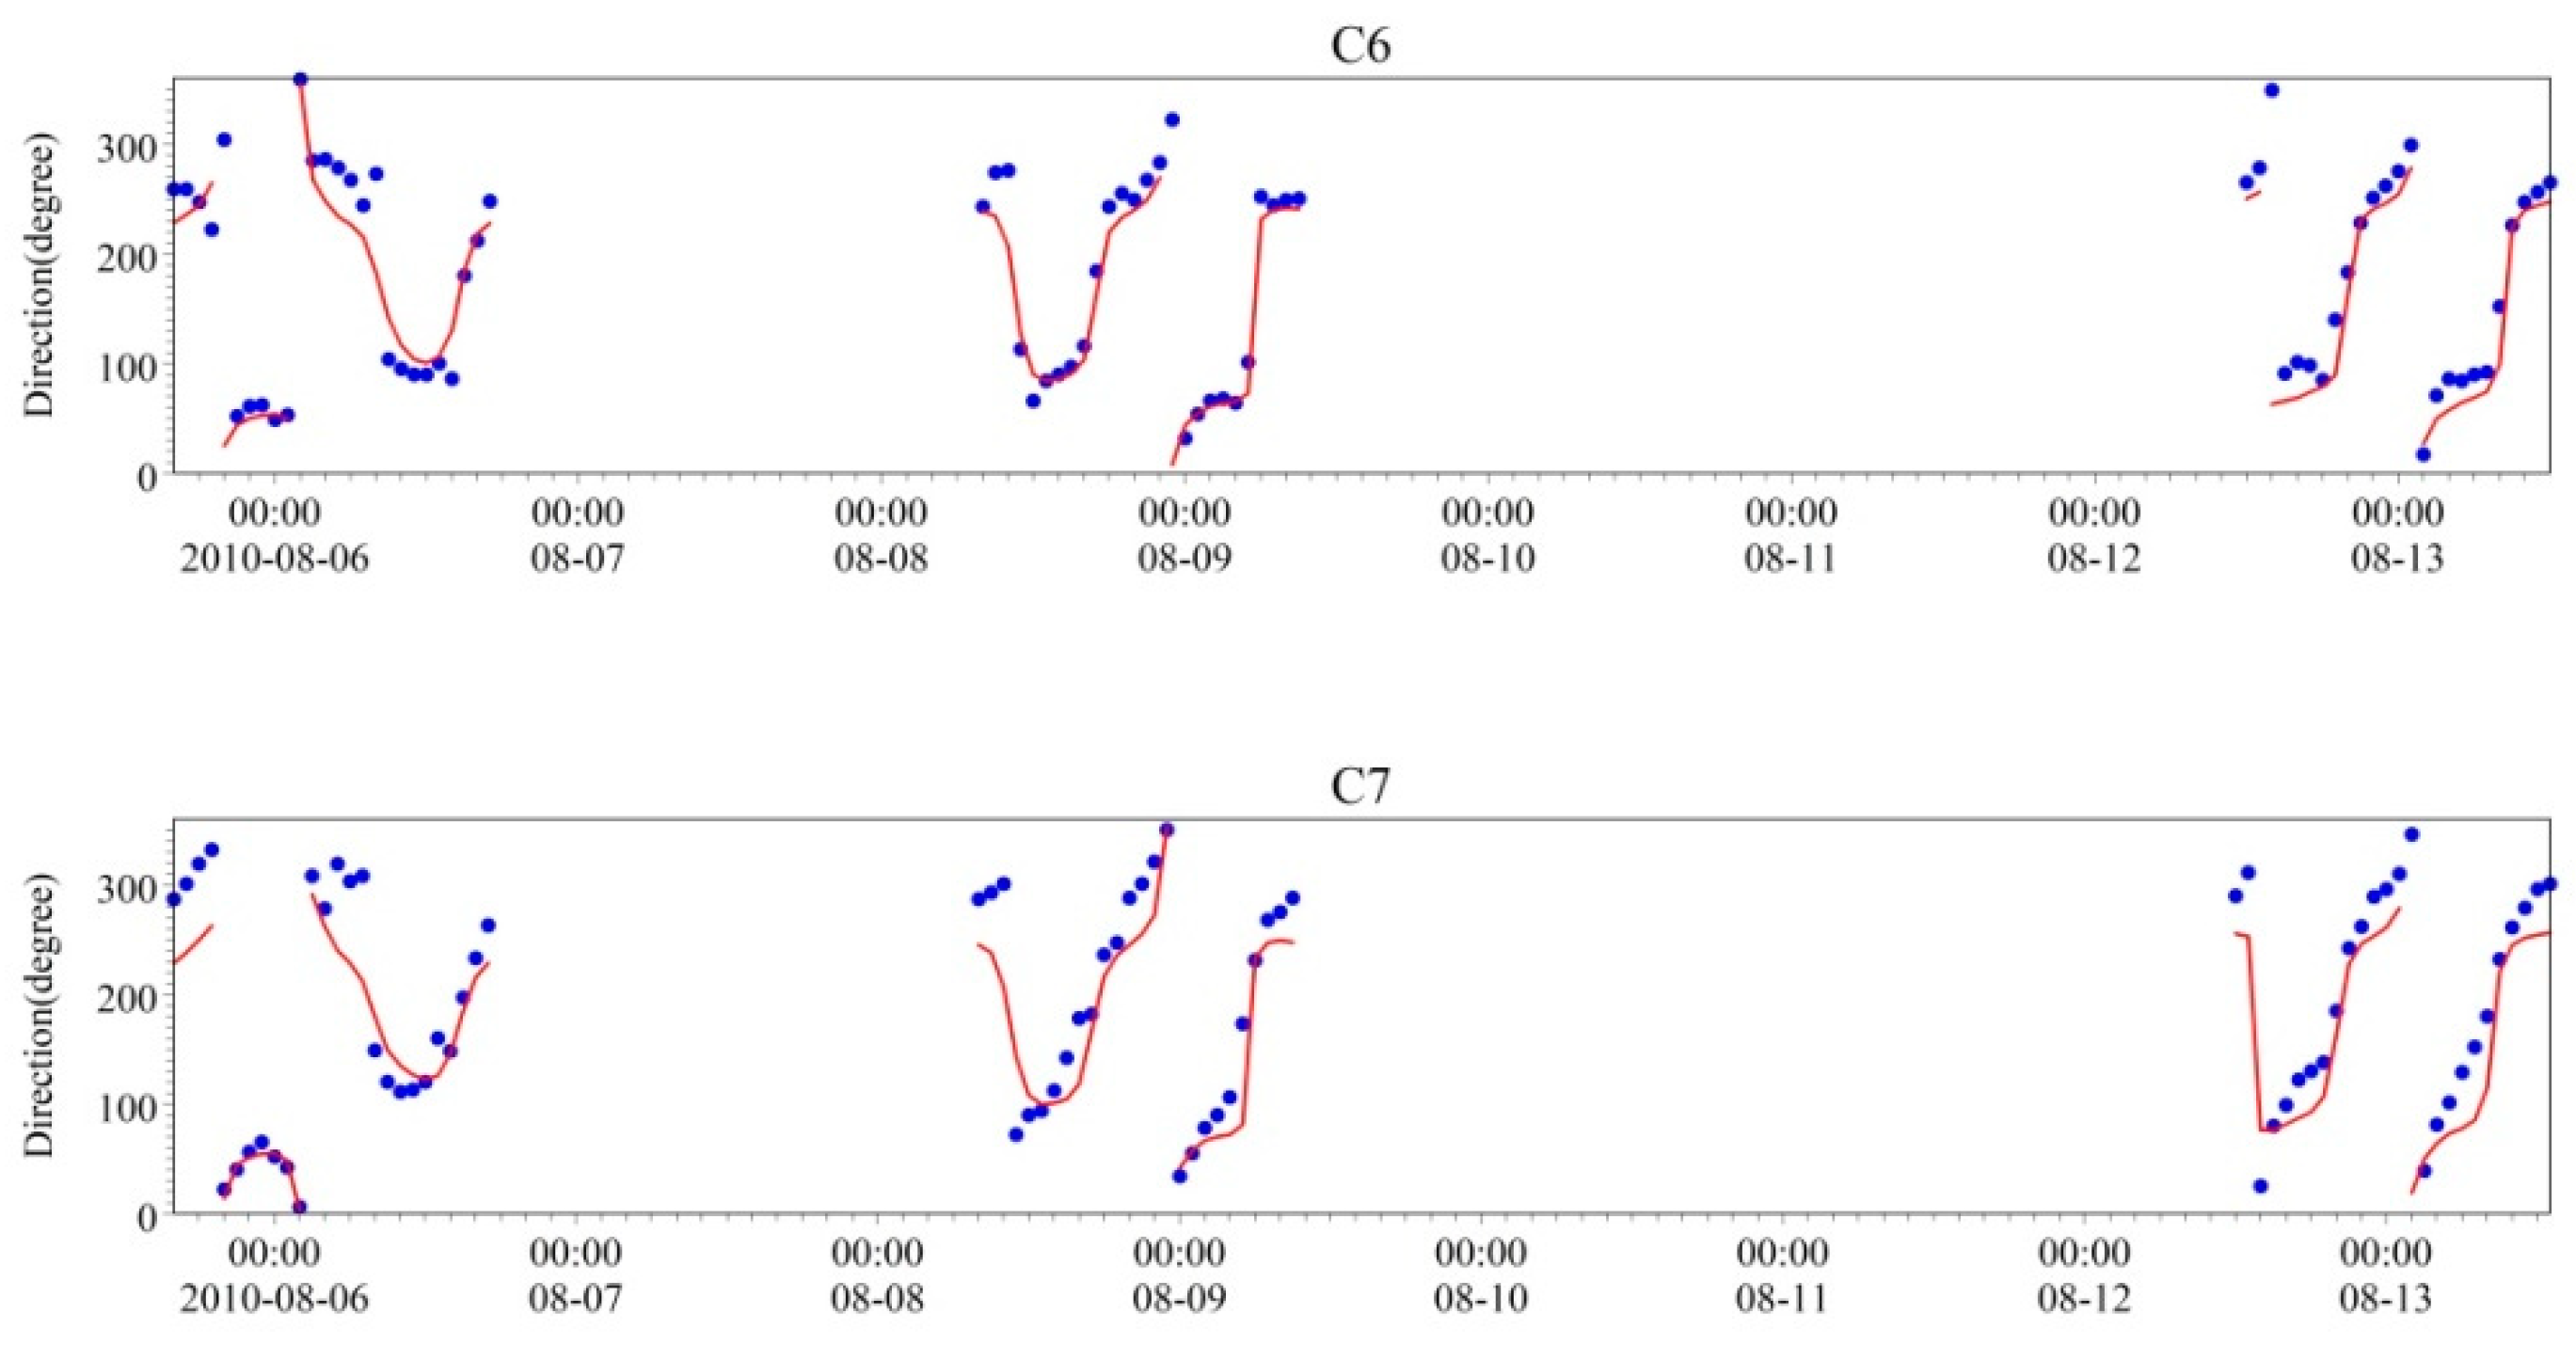
4.1. Model Validation
4.1.1. Validation Data
4.1.2. Validation Results
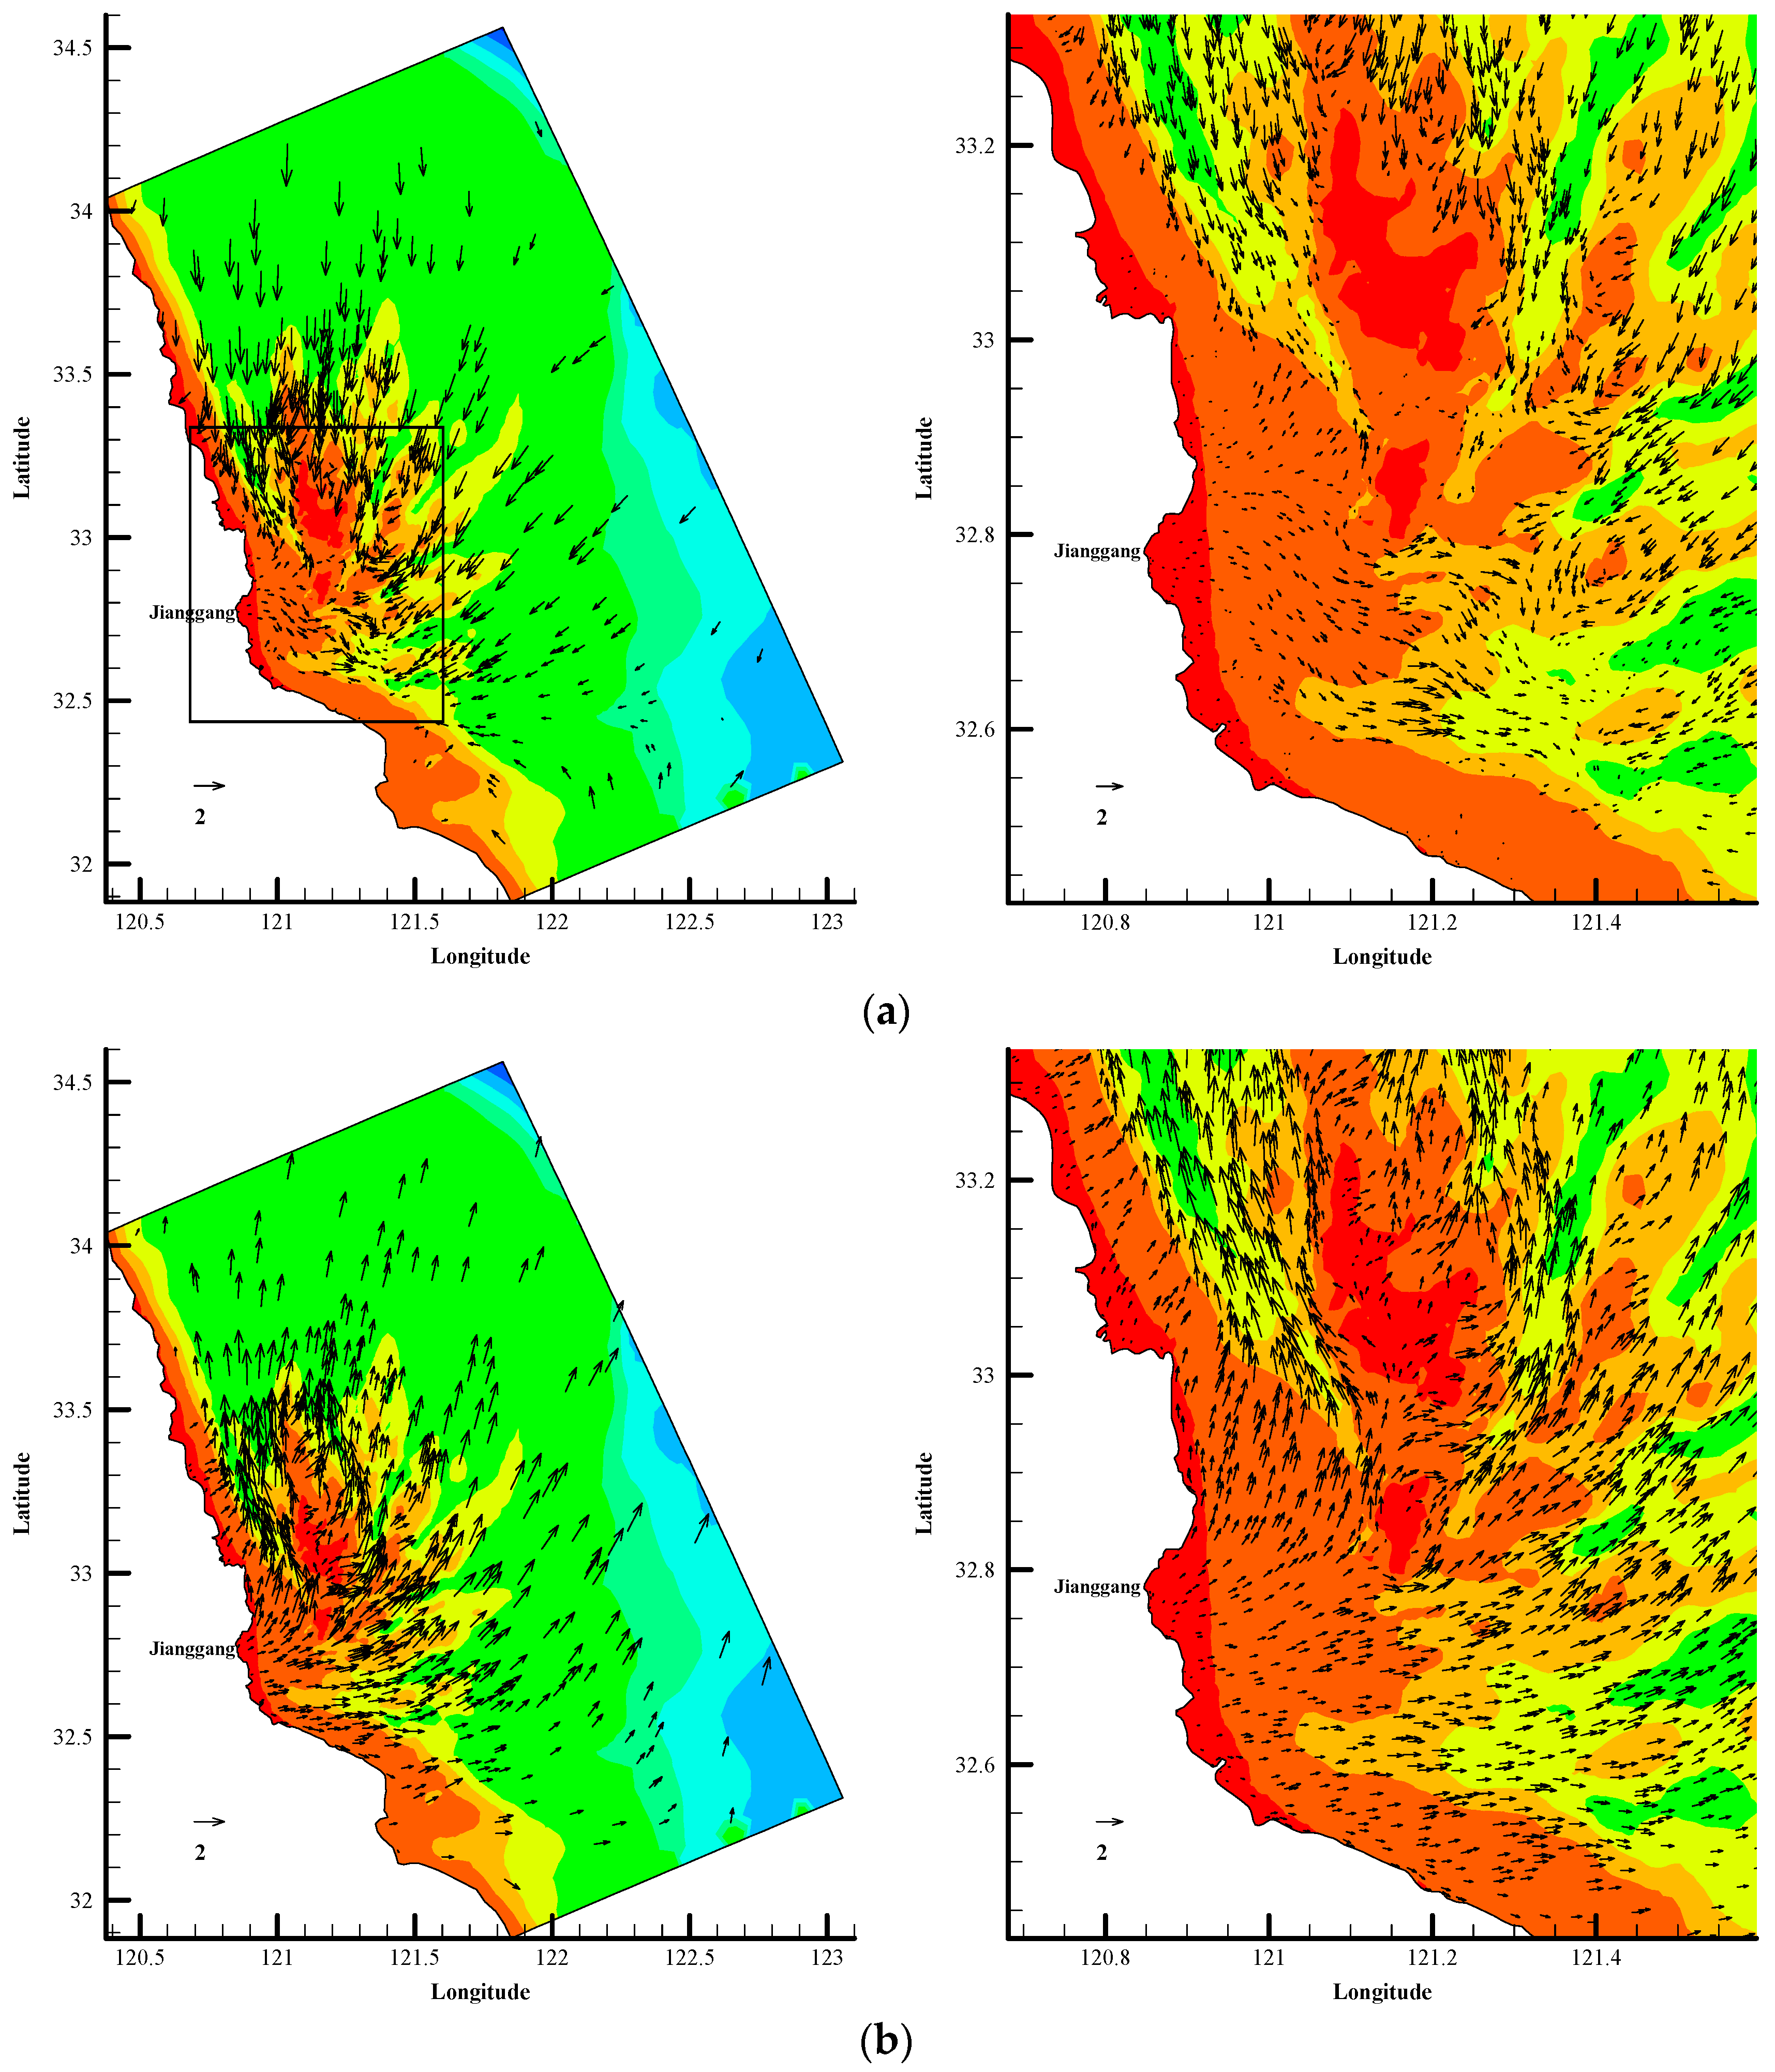
4.2. Tidal Current Field Analysis
4.2.1. Tidal Current Field in the Natural RSR Area
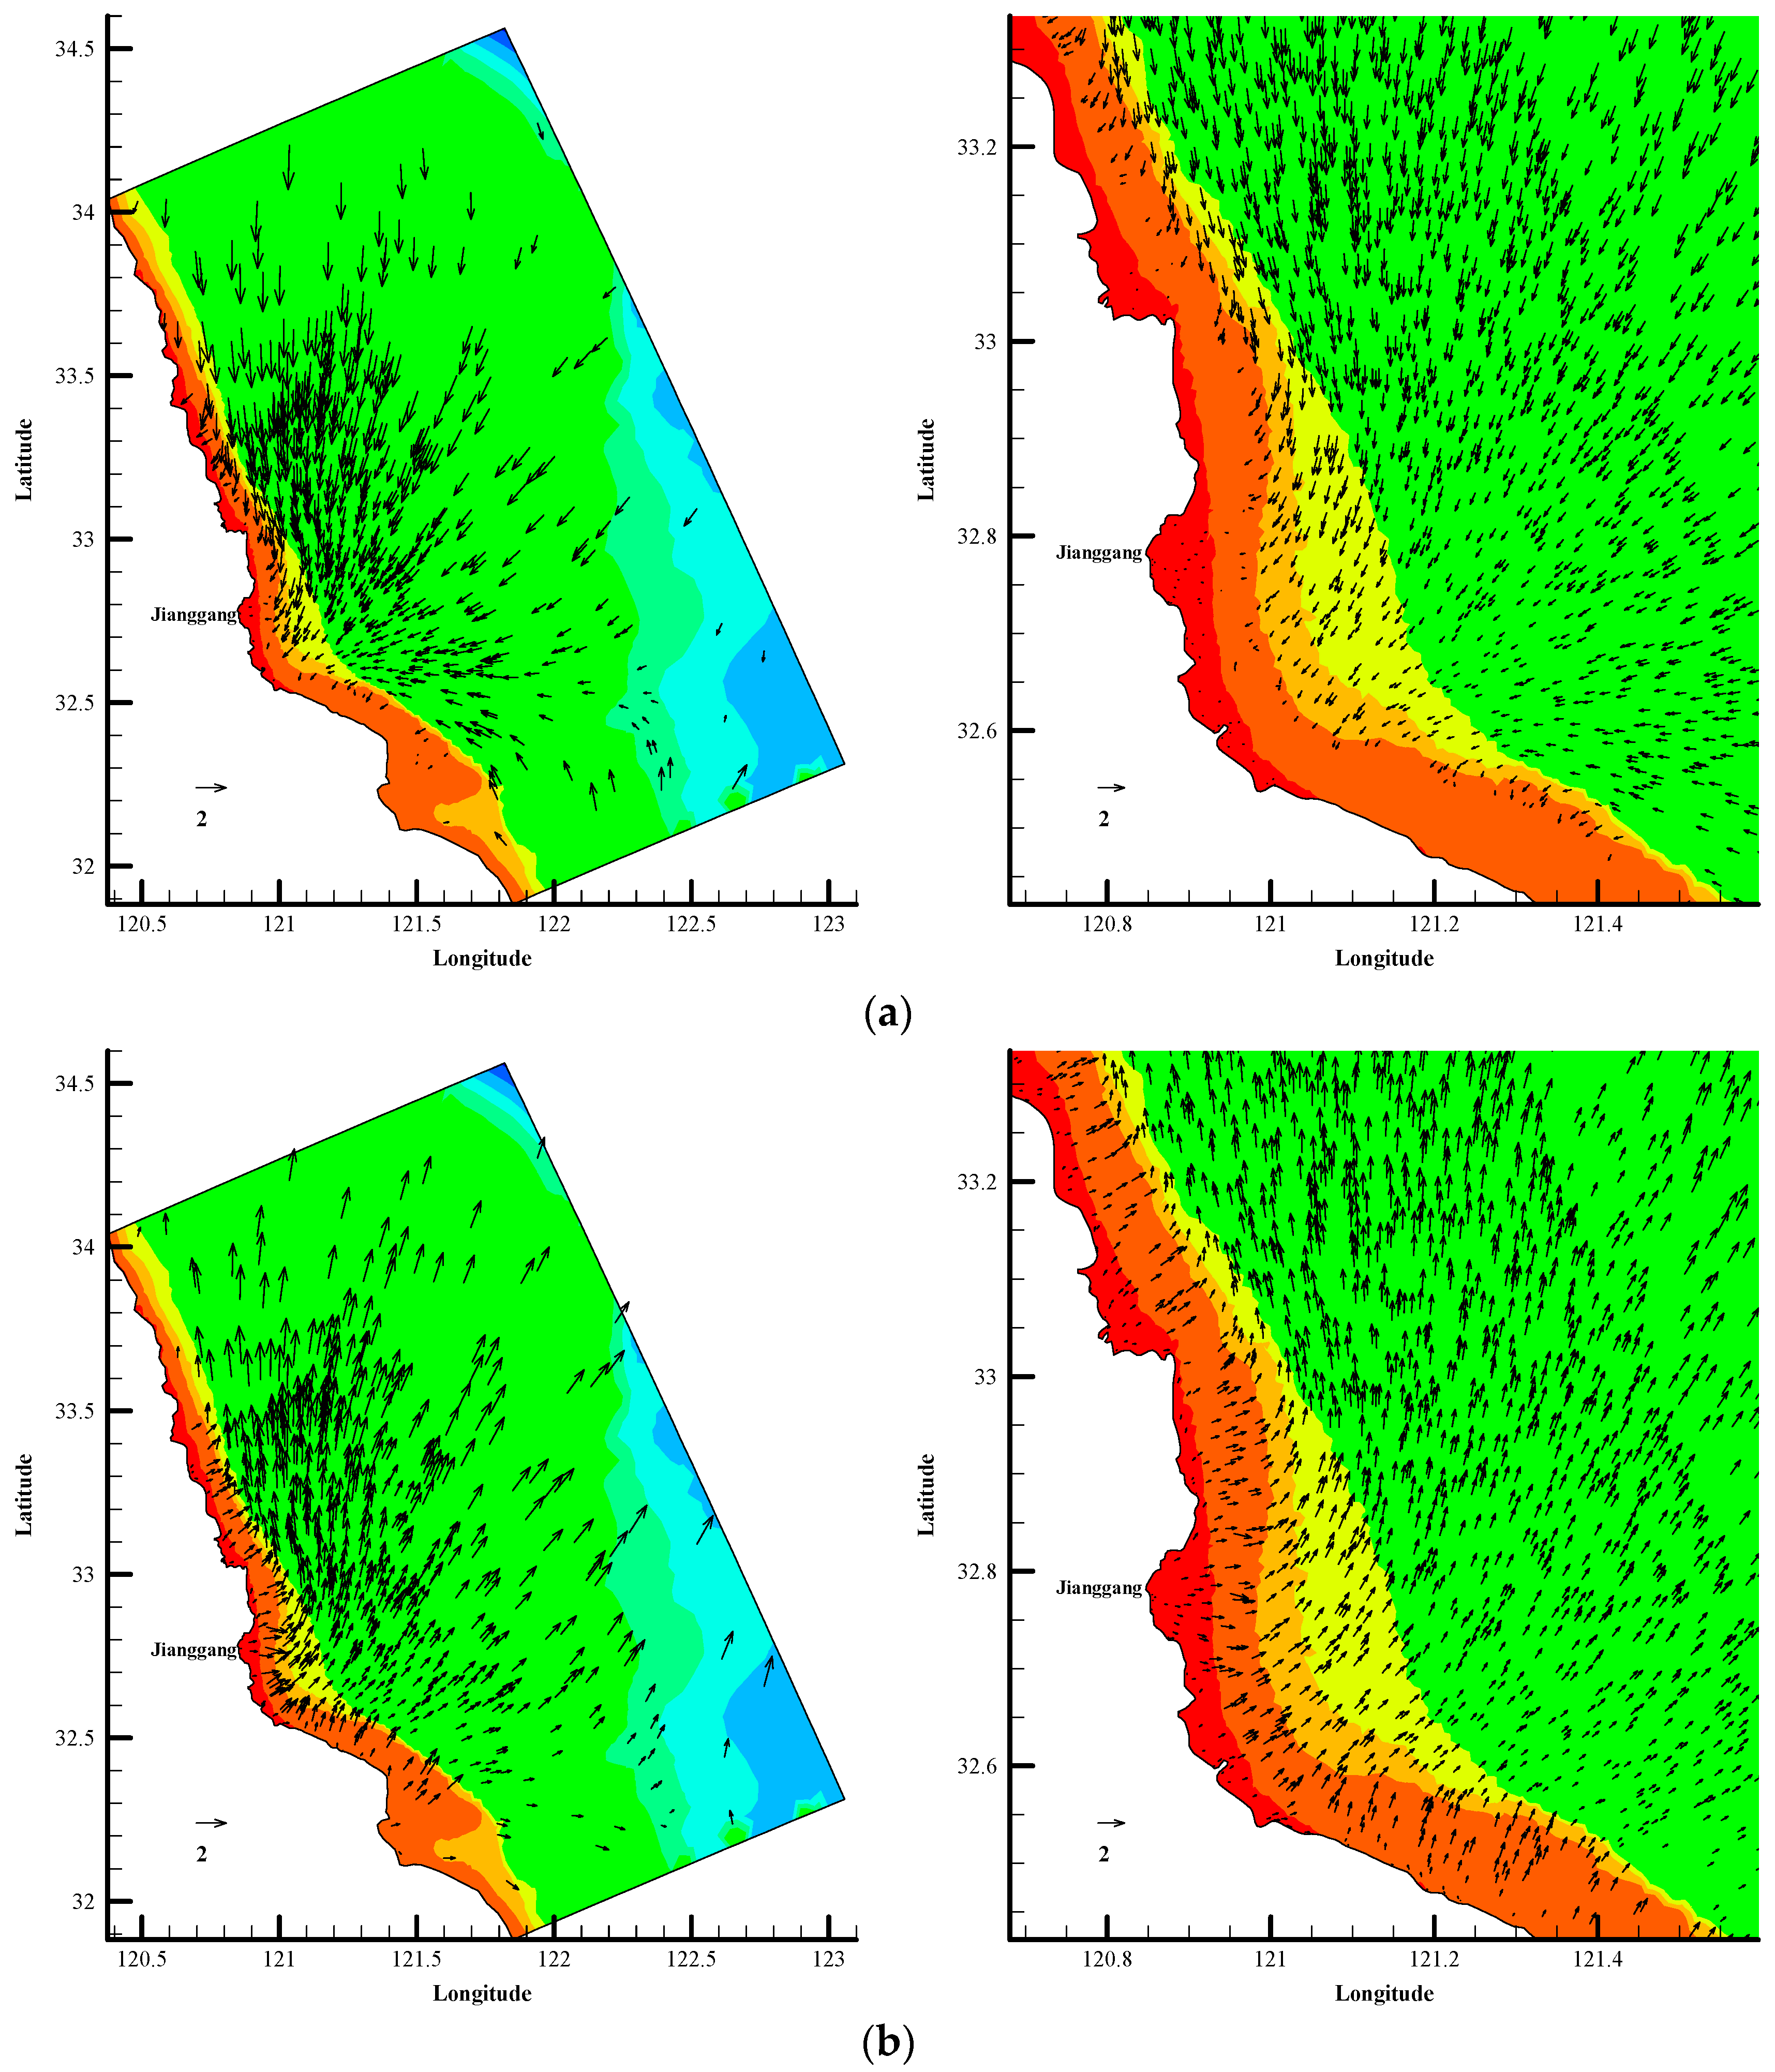
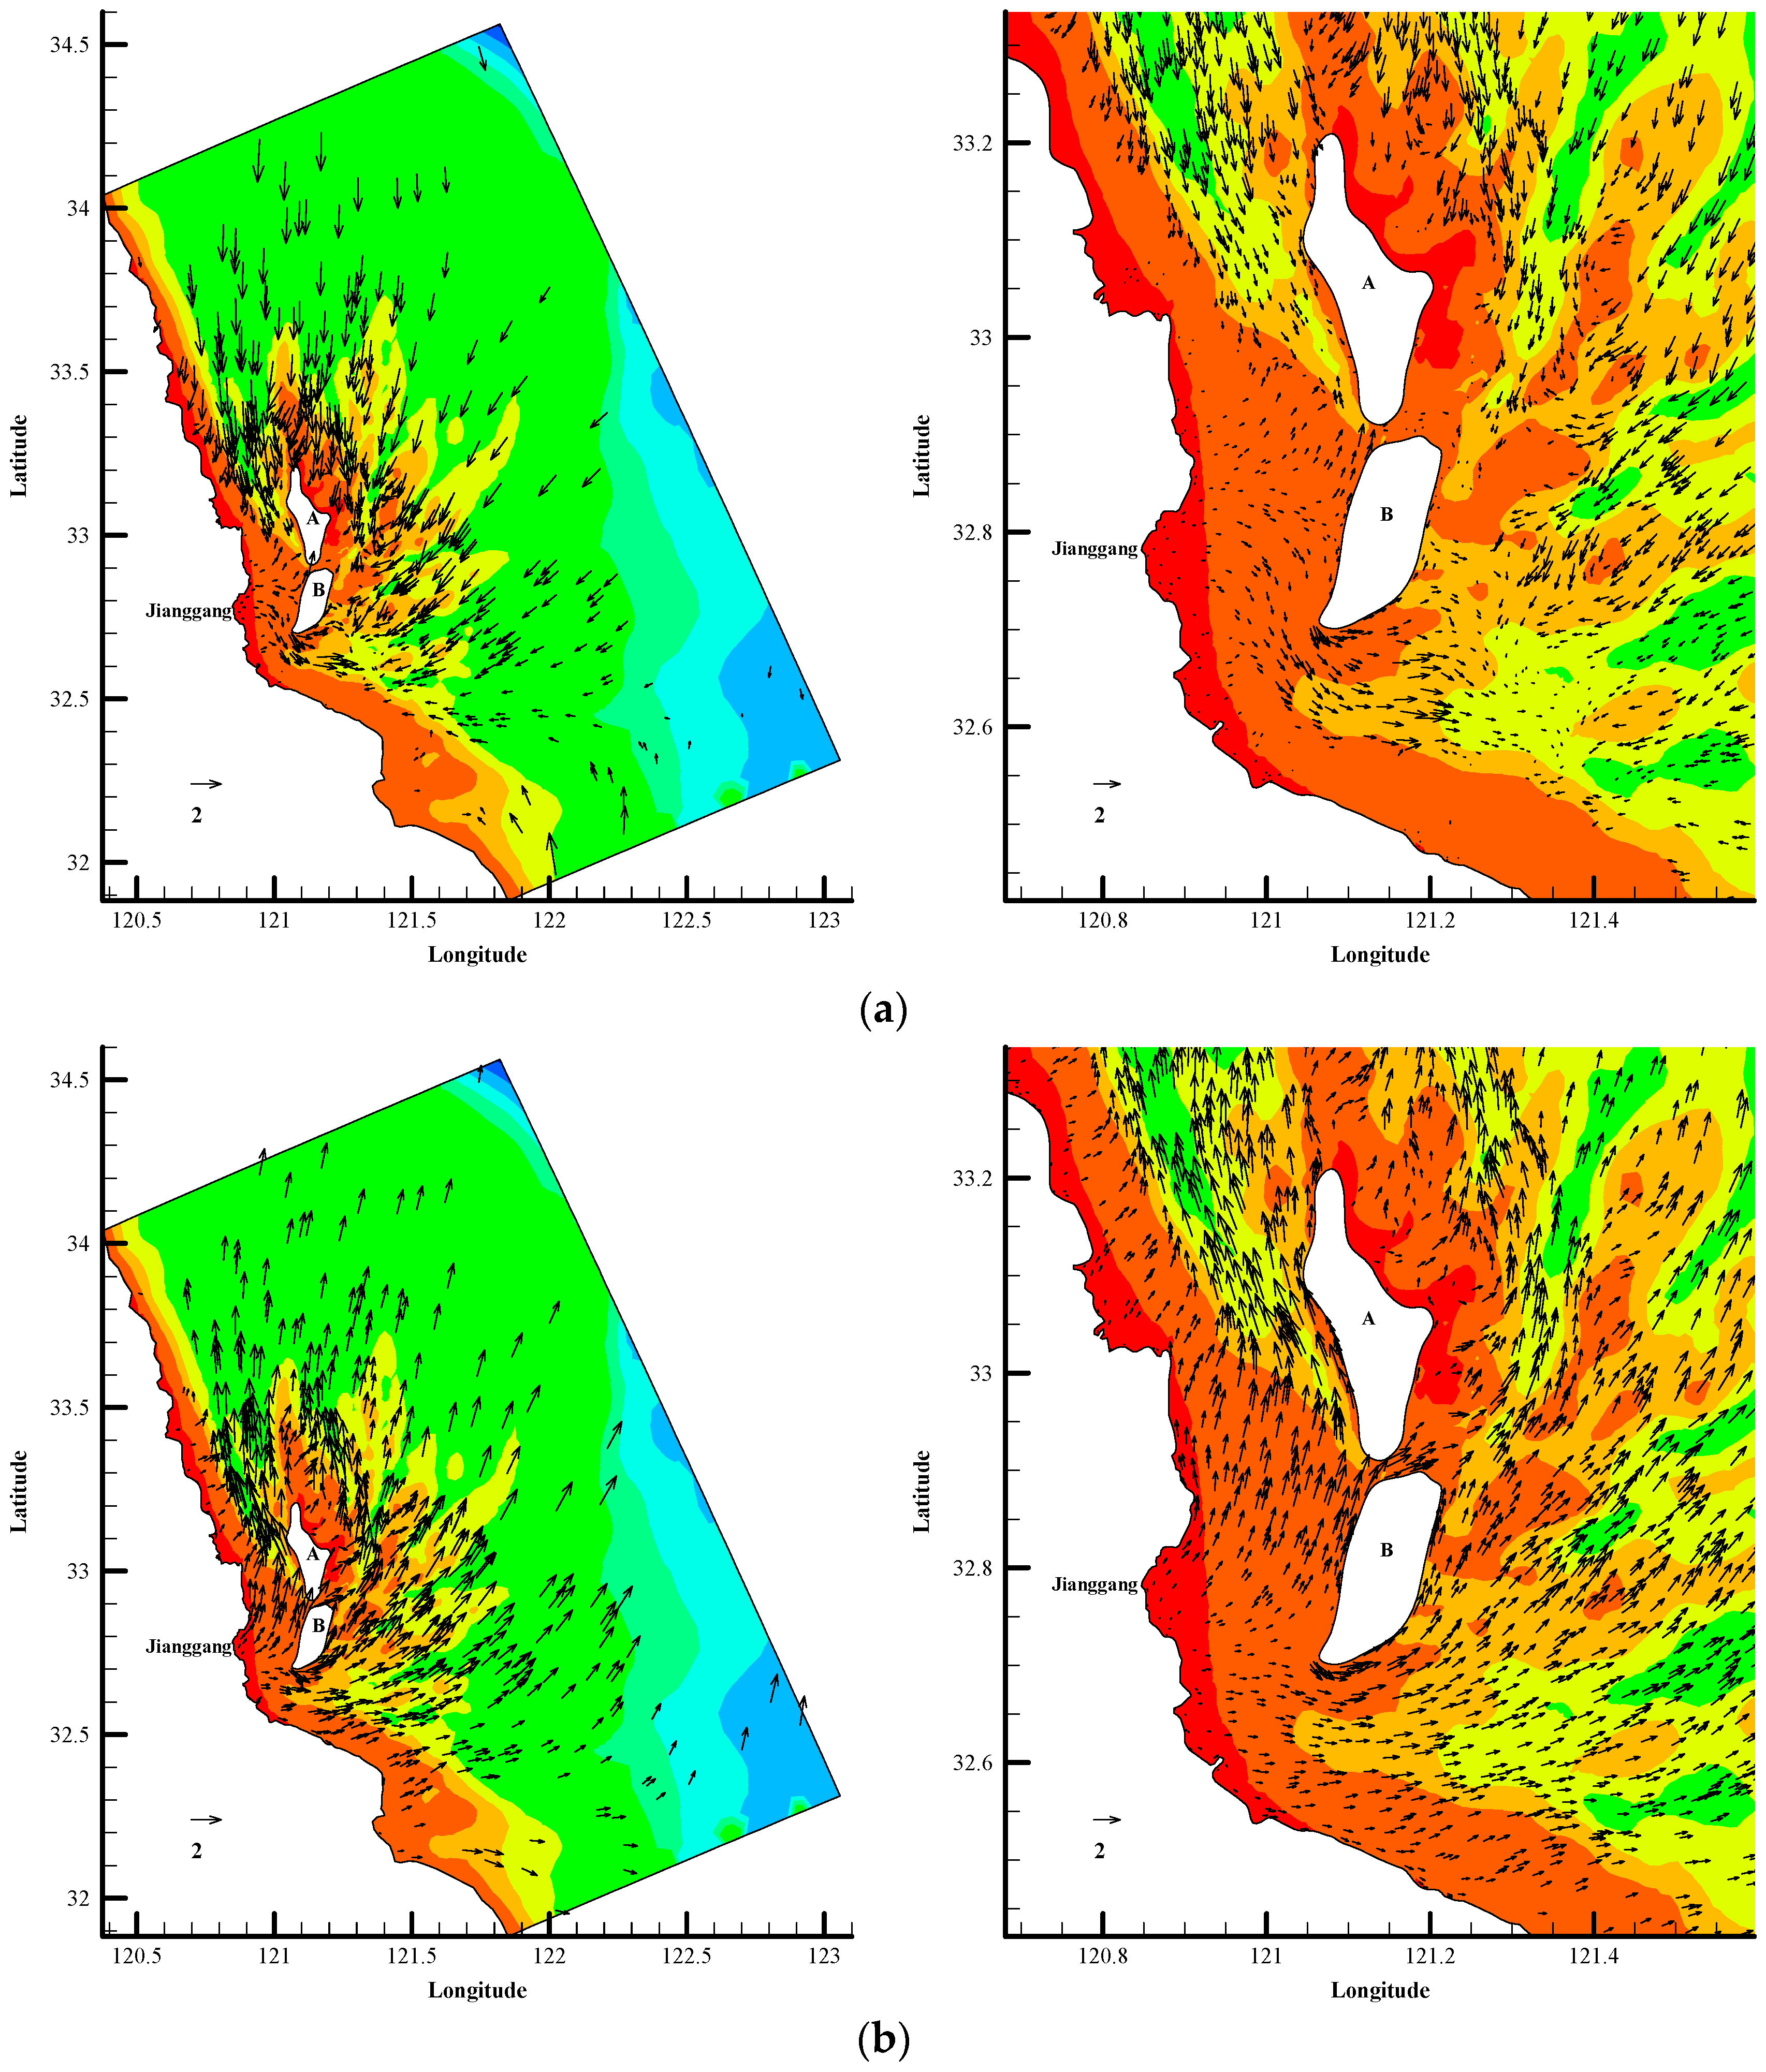
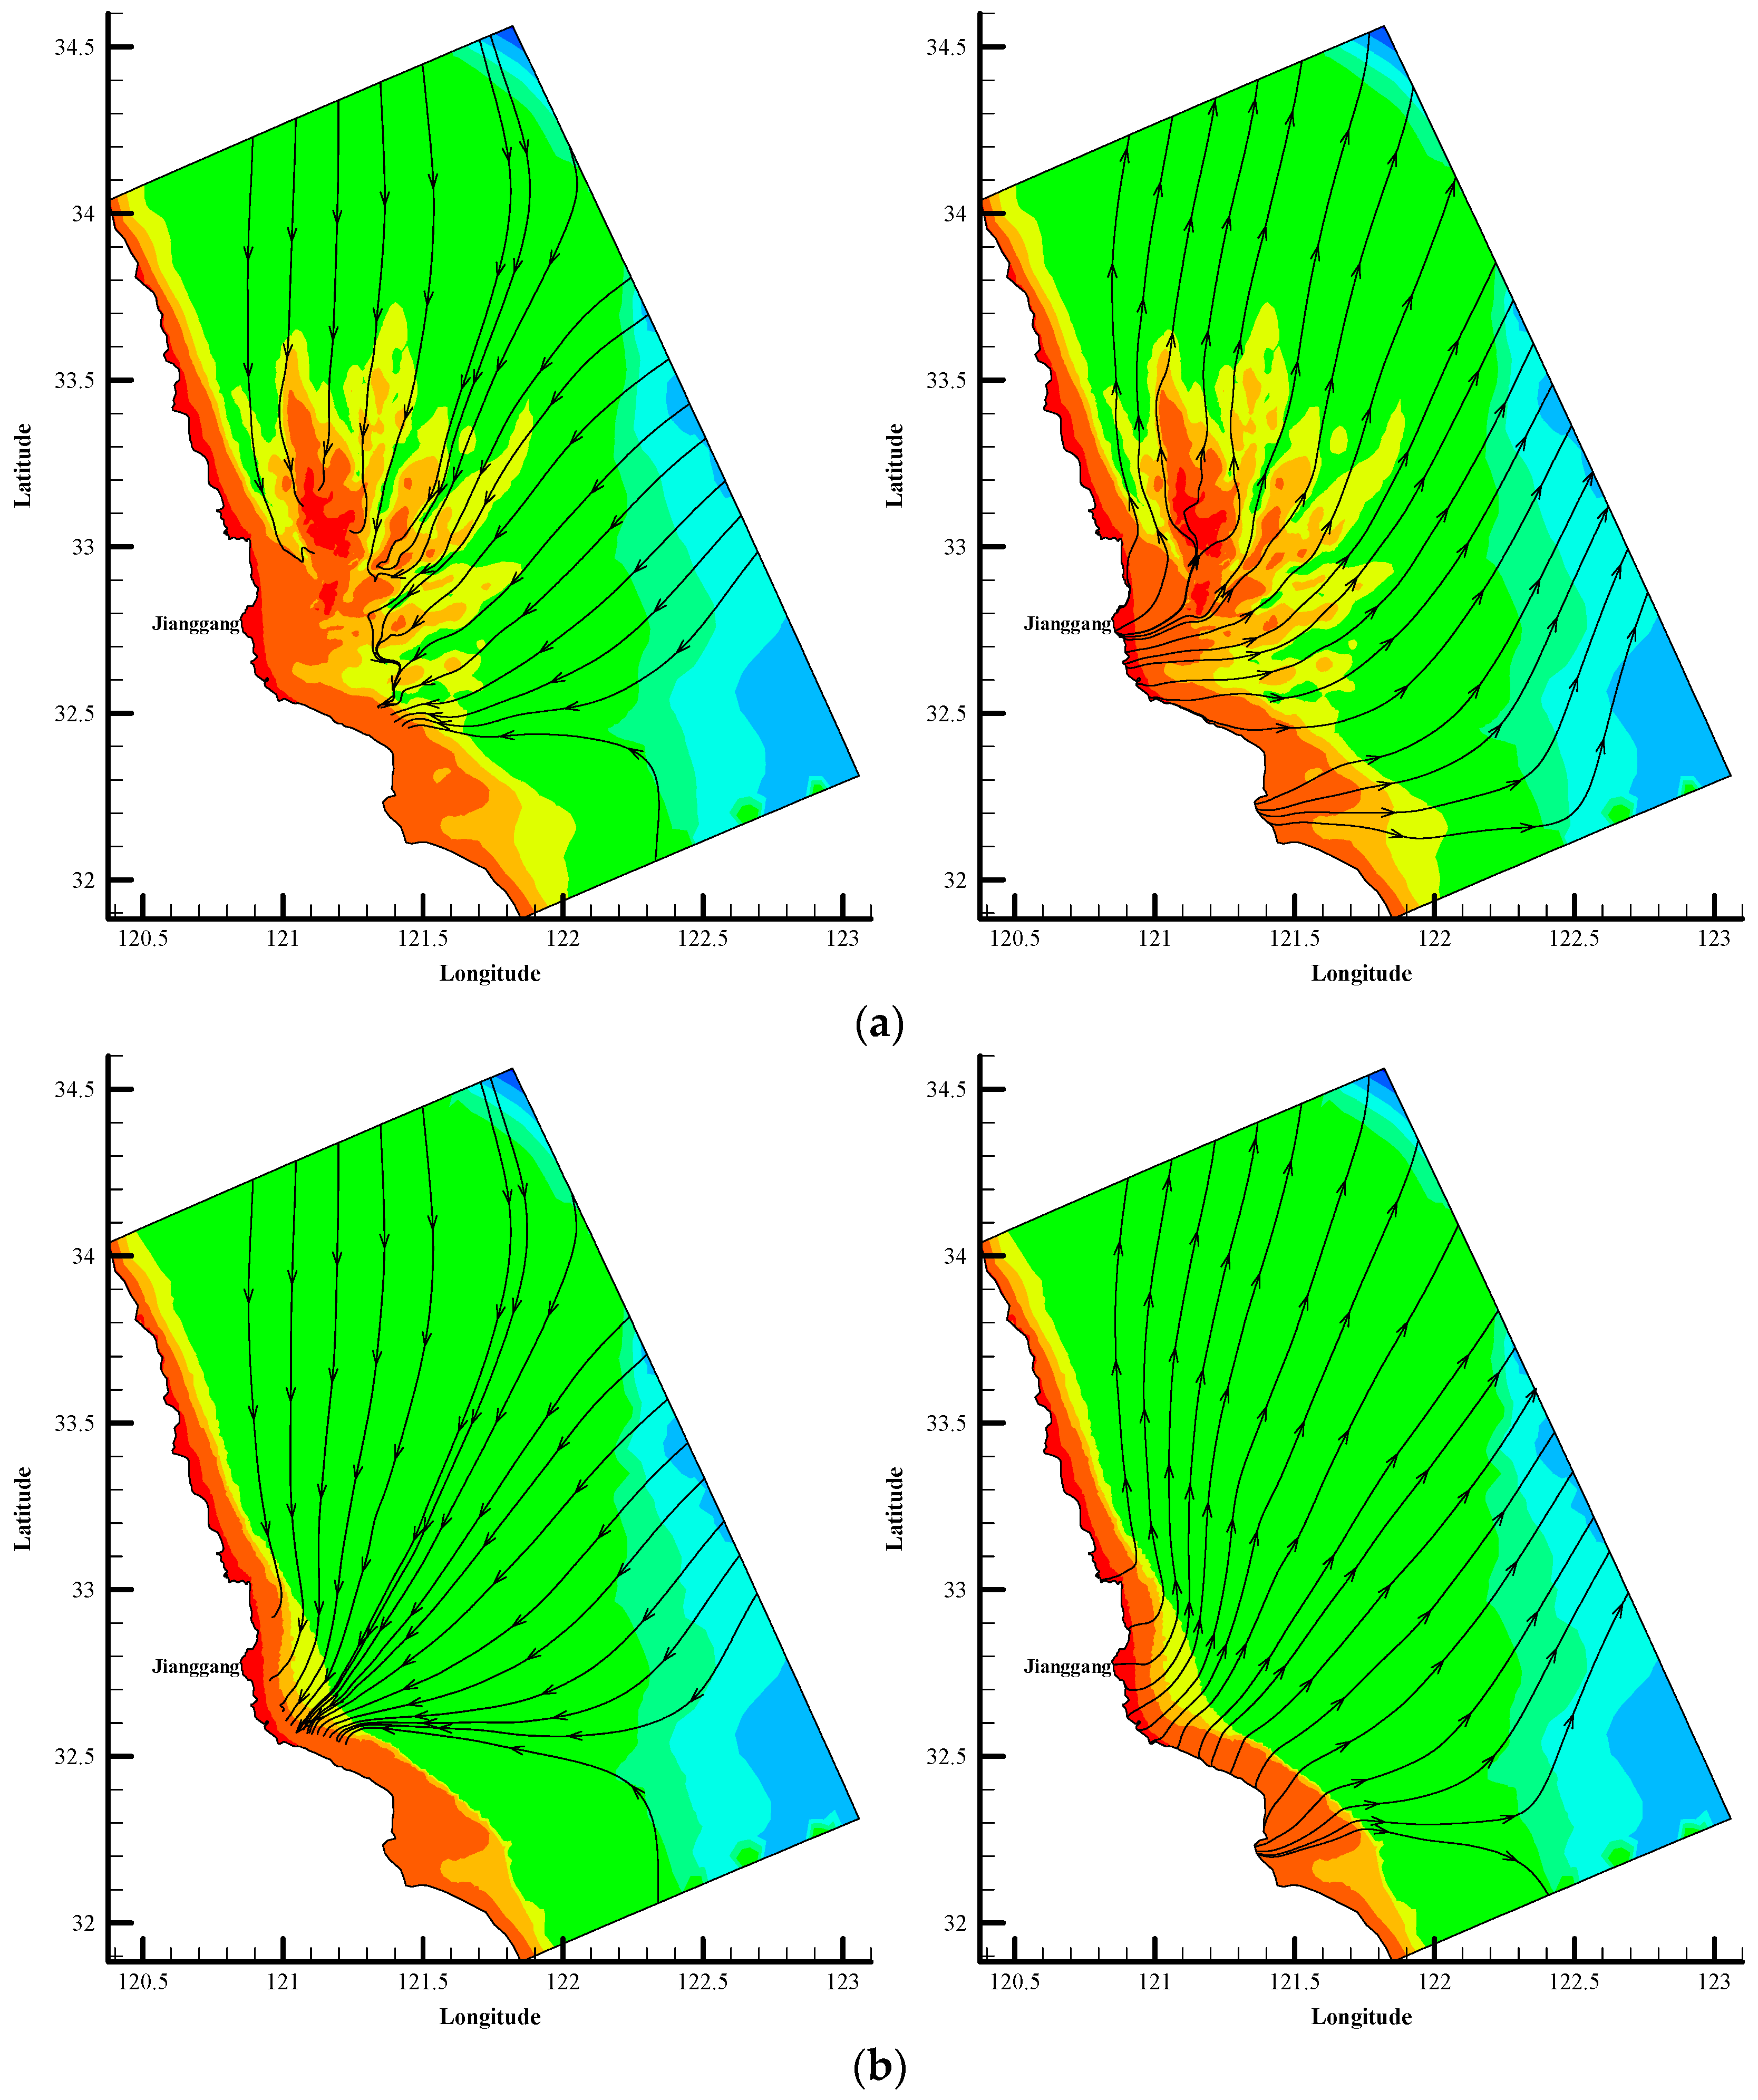
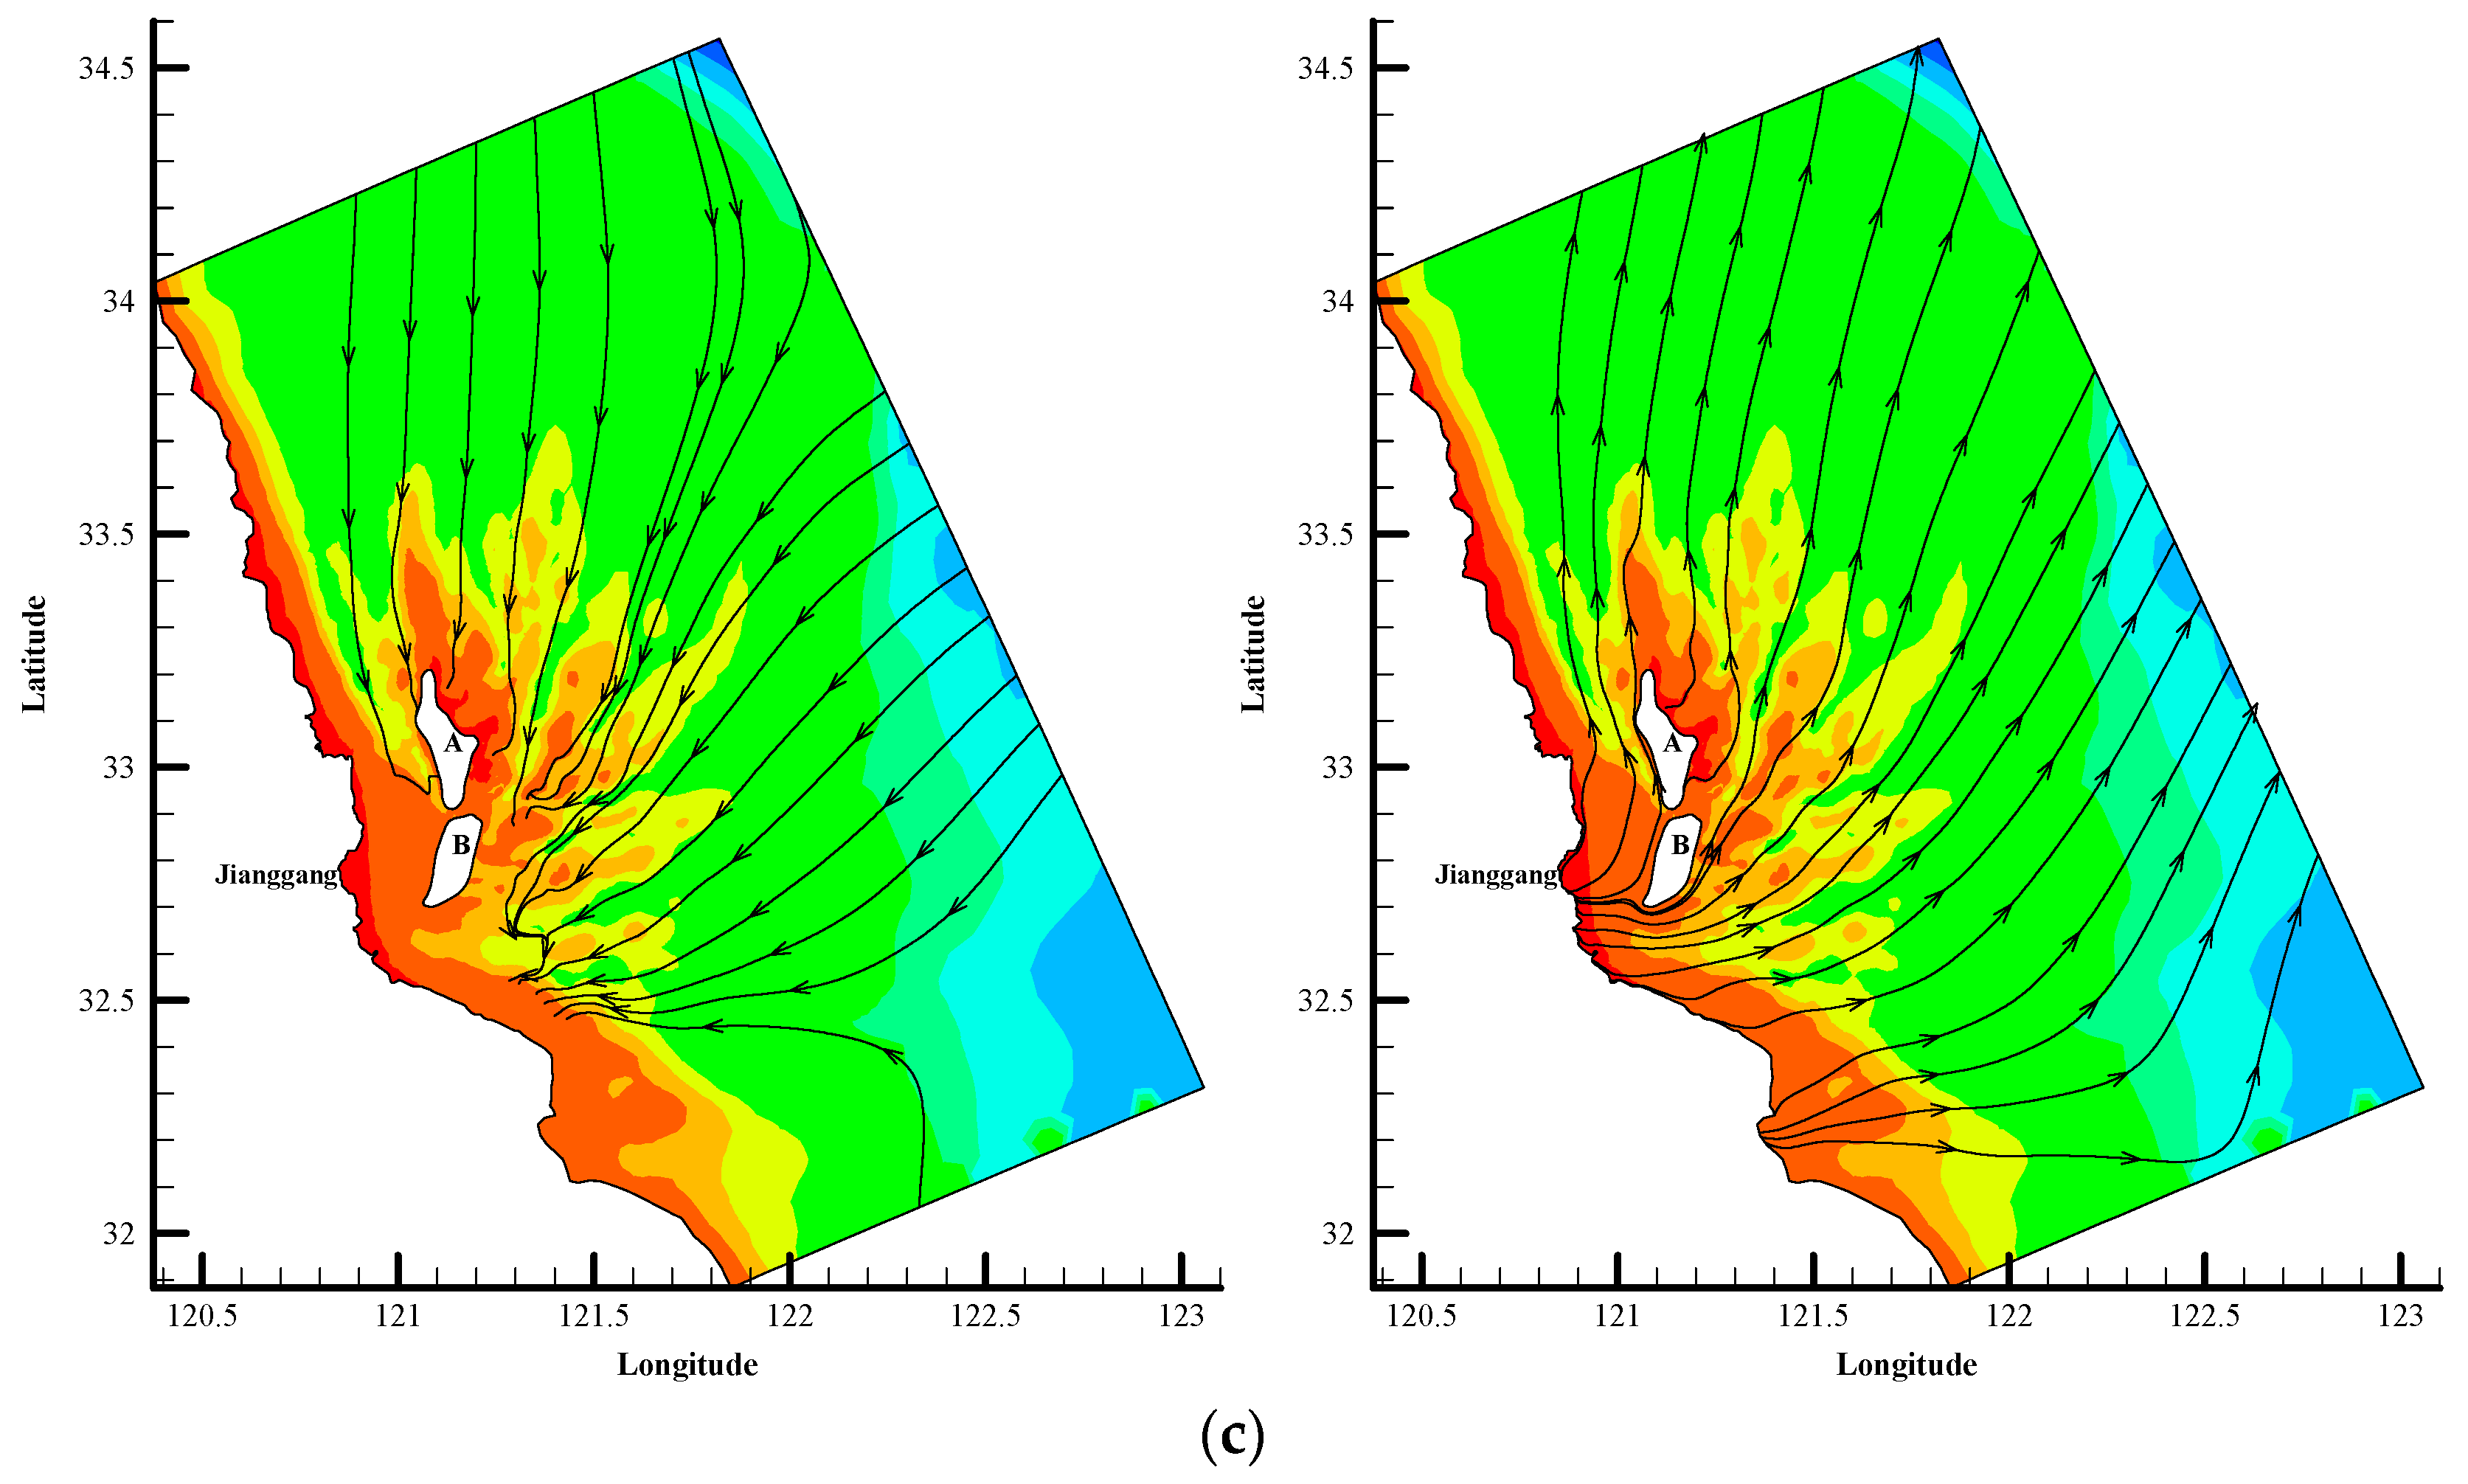
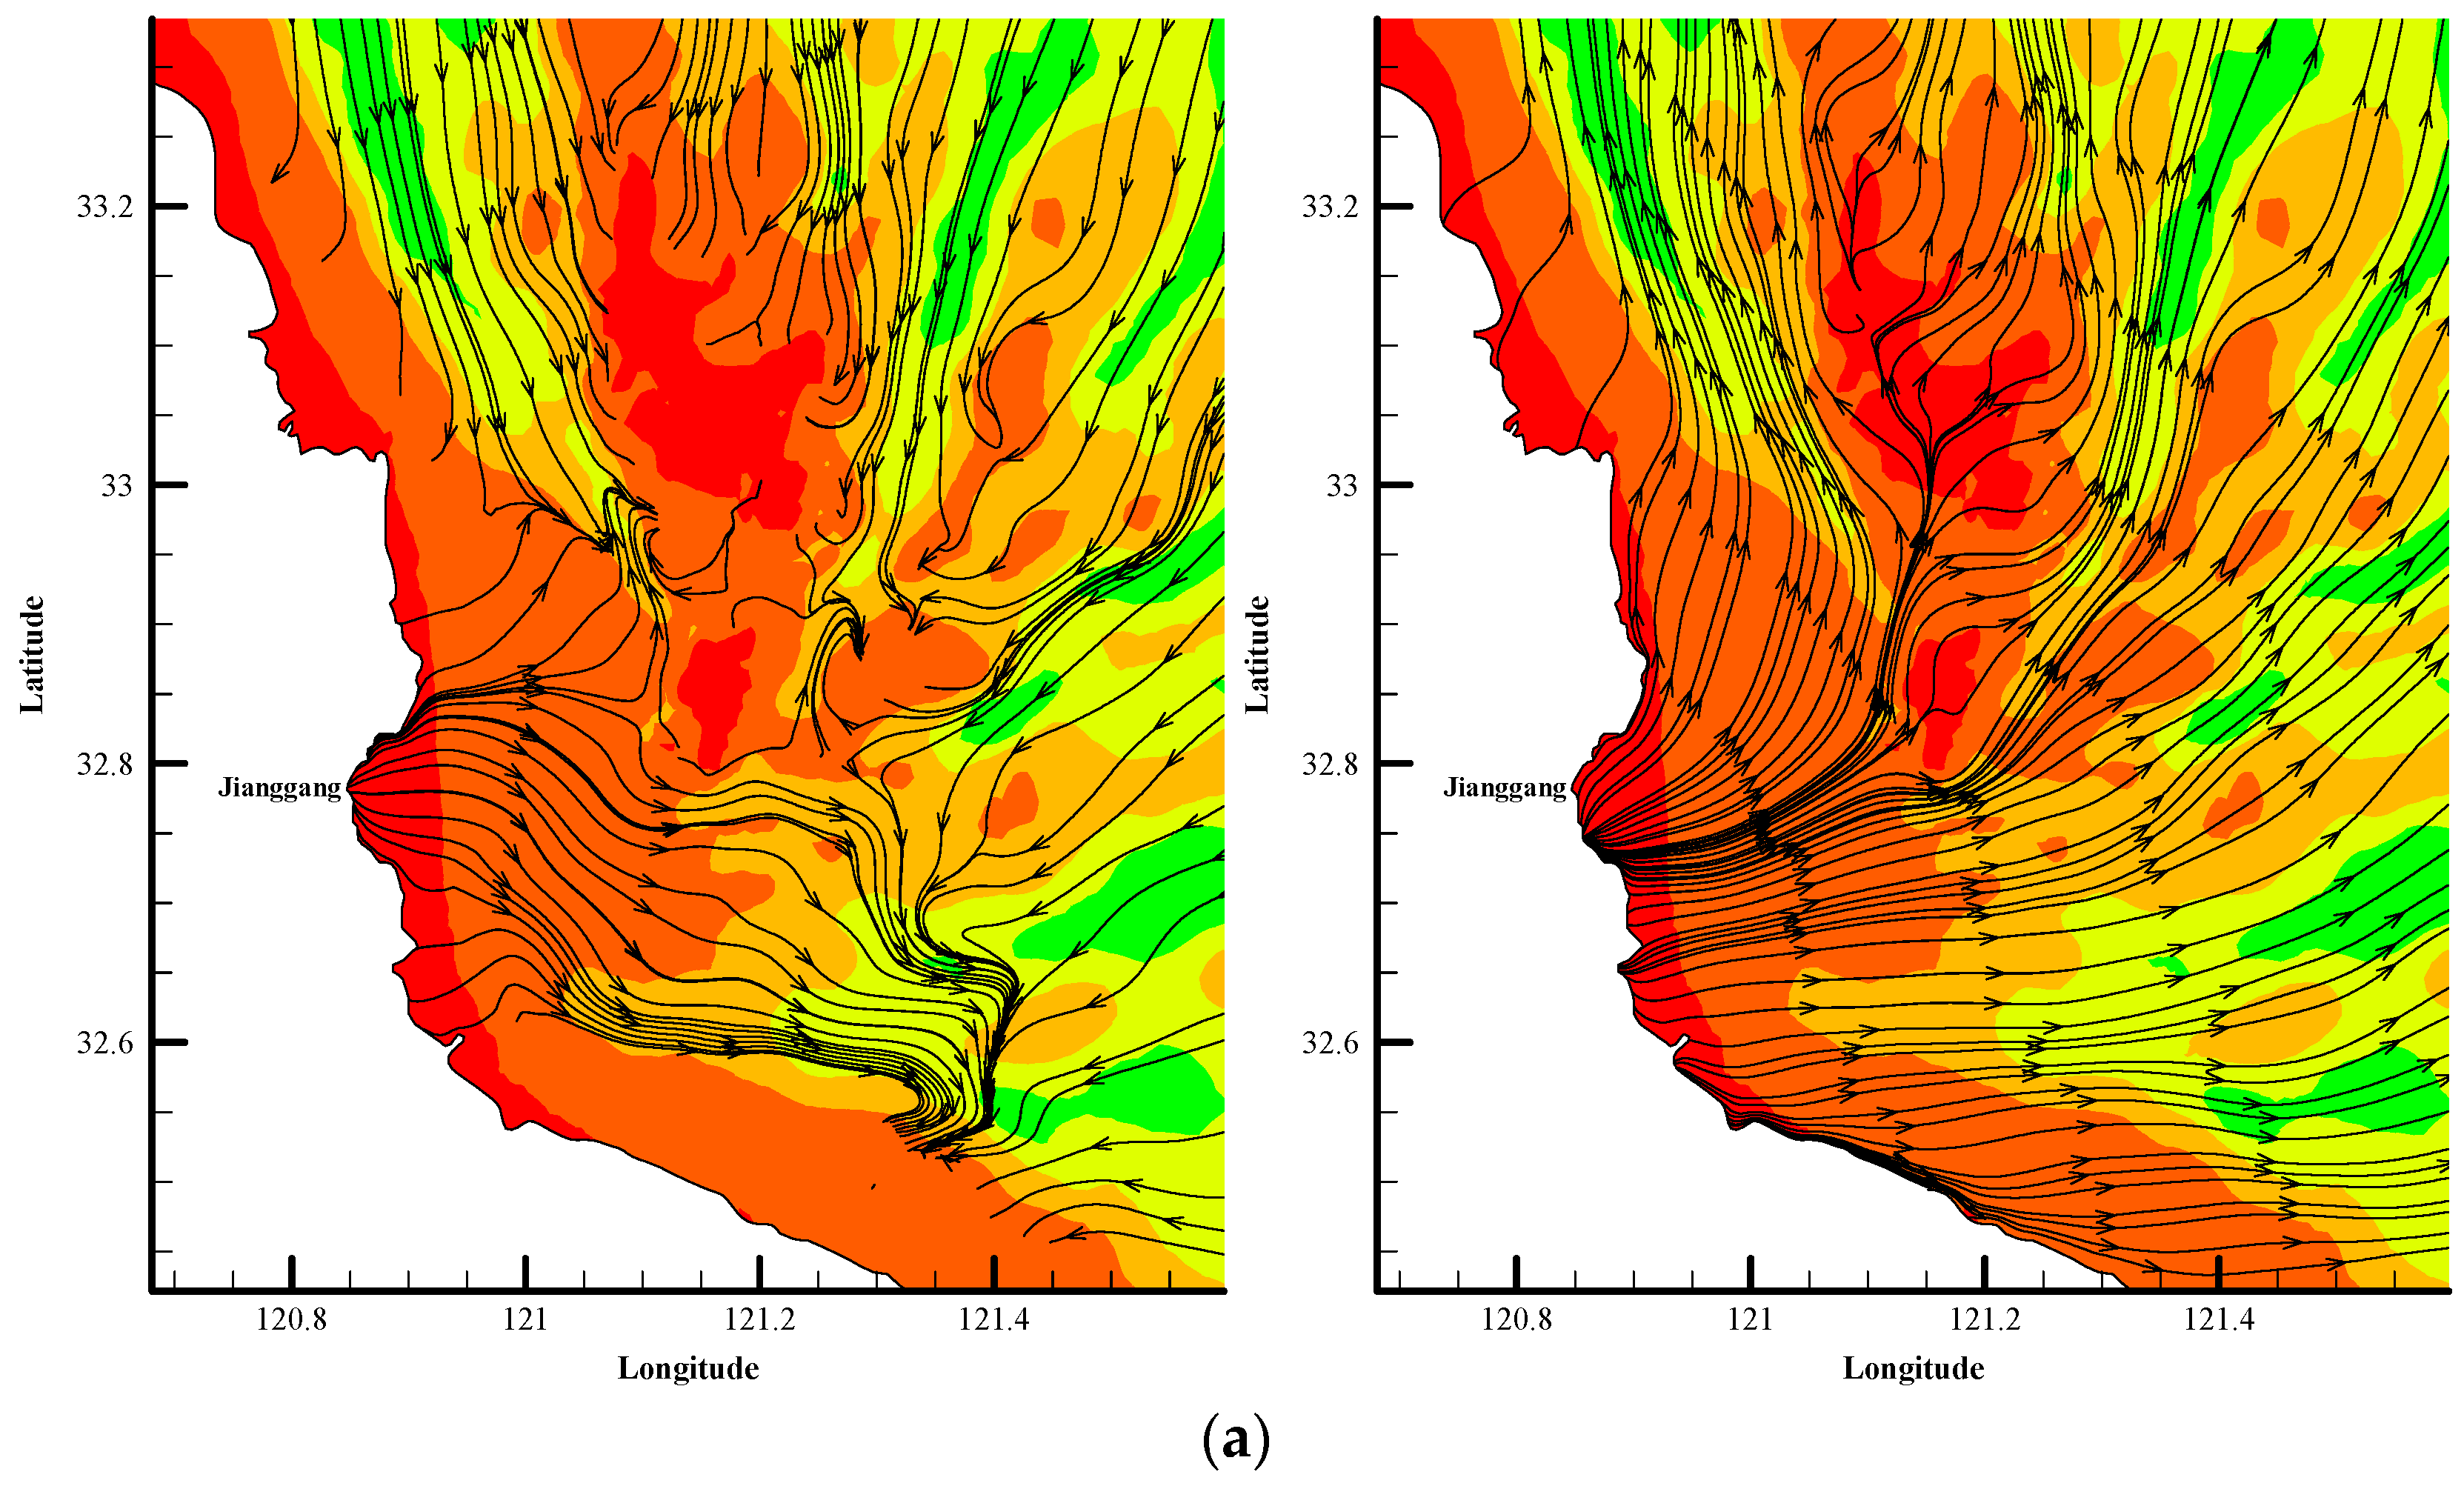
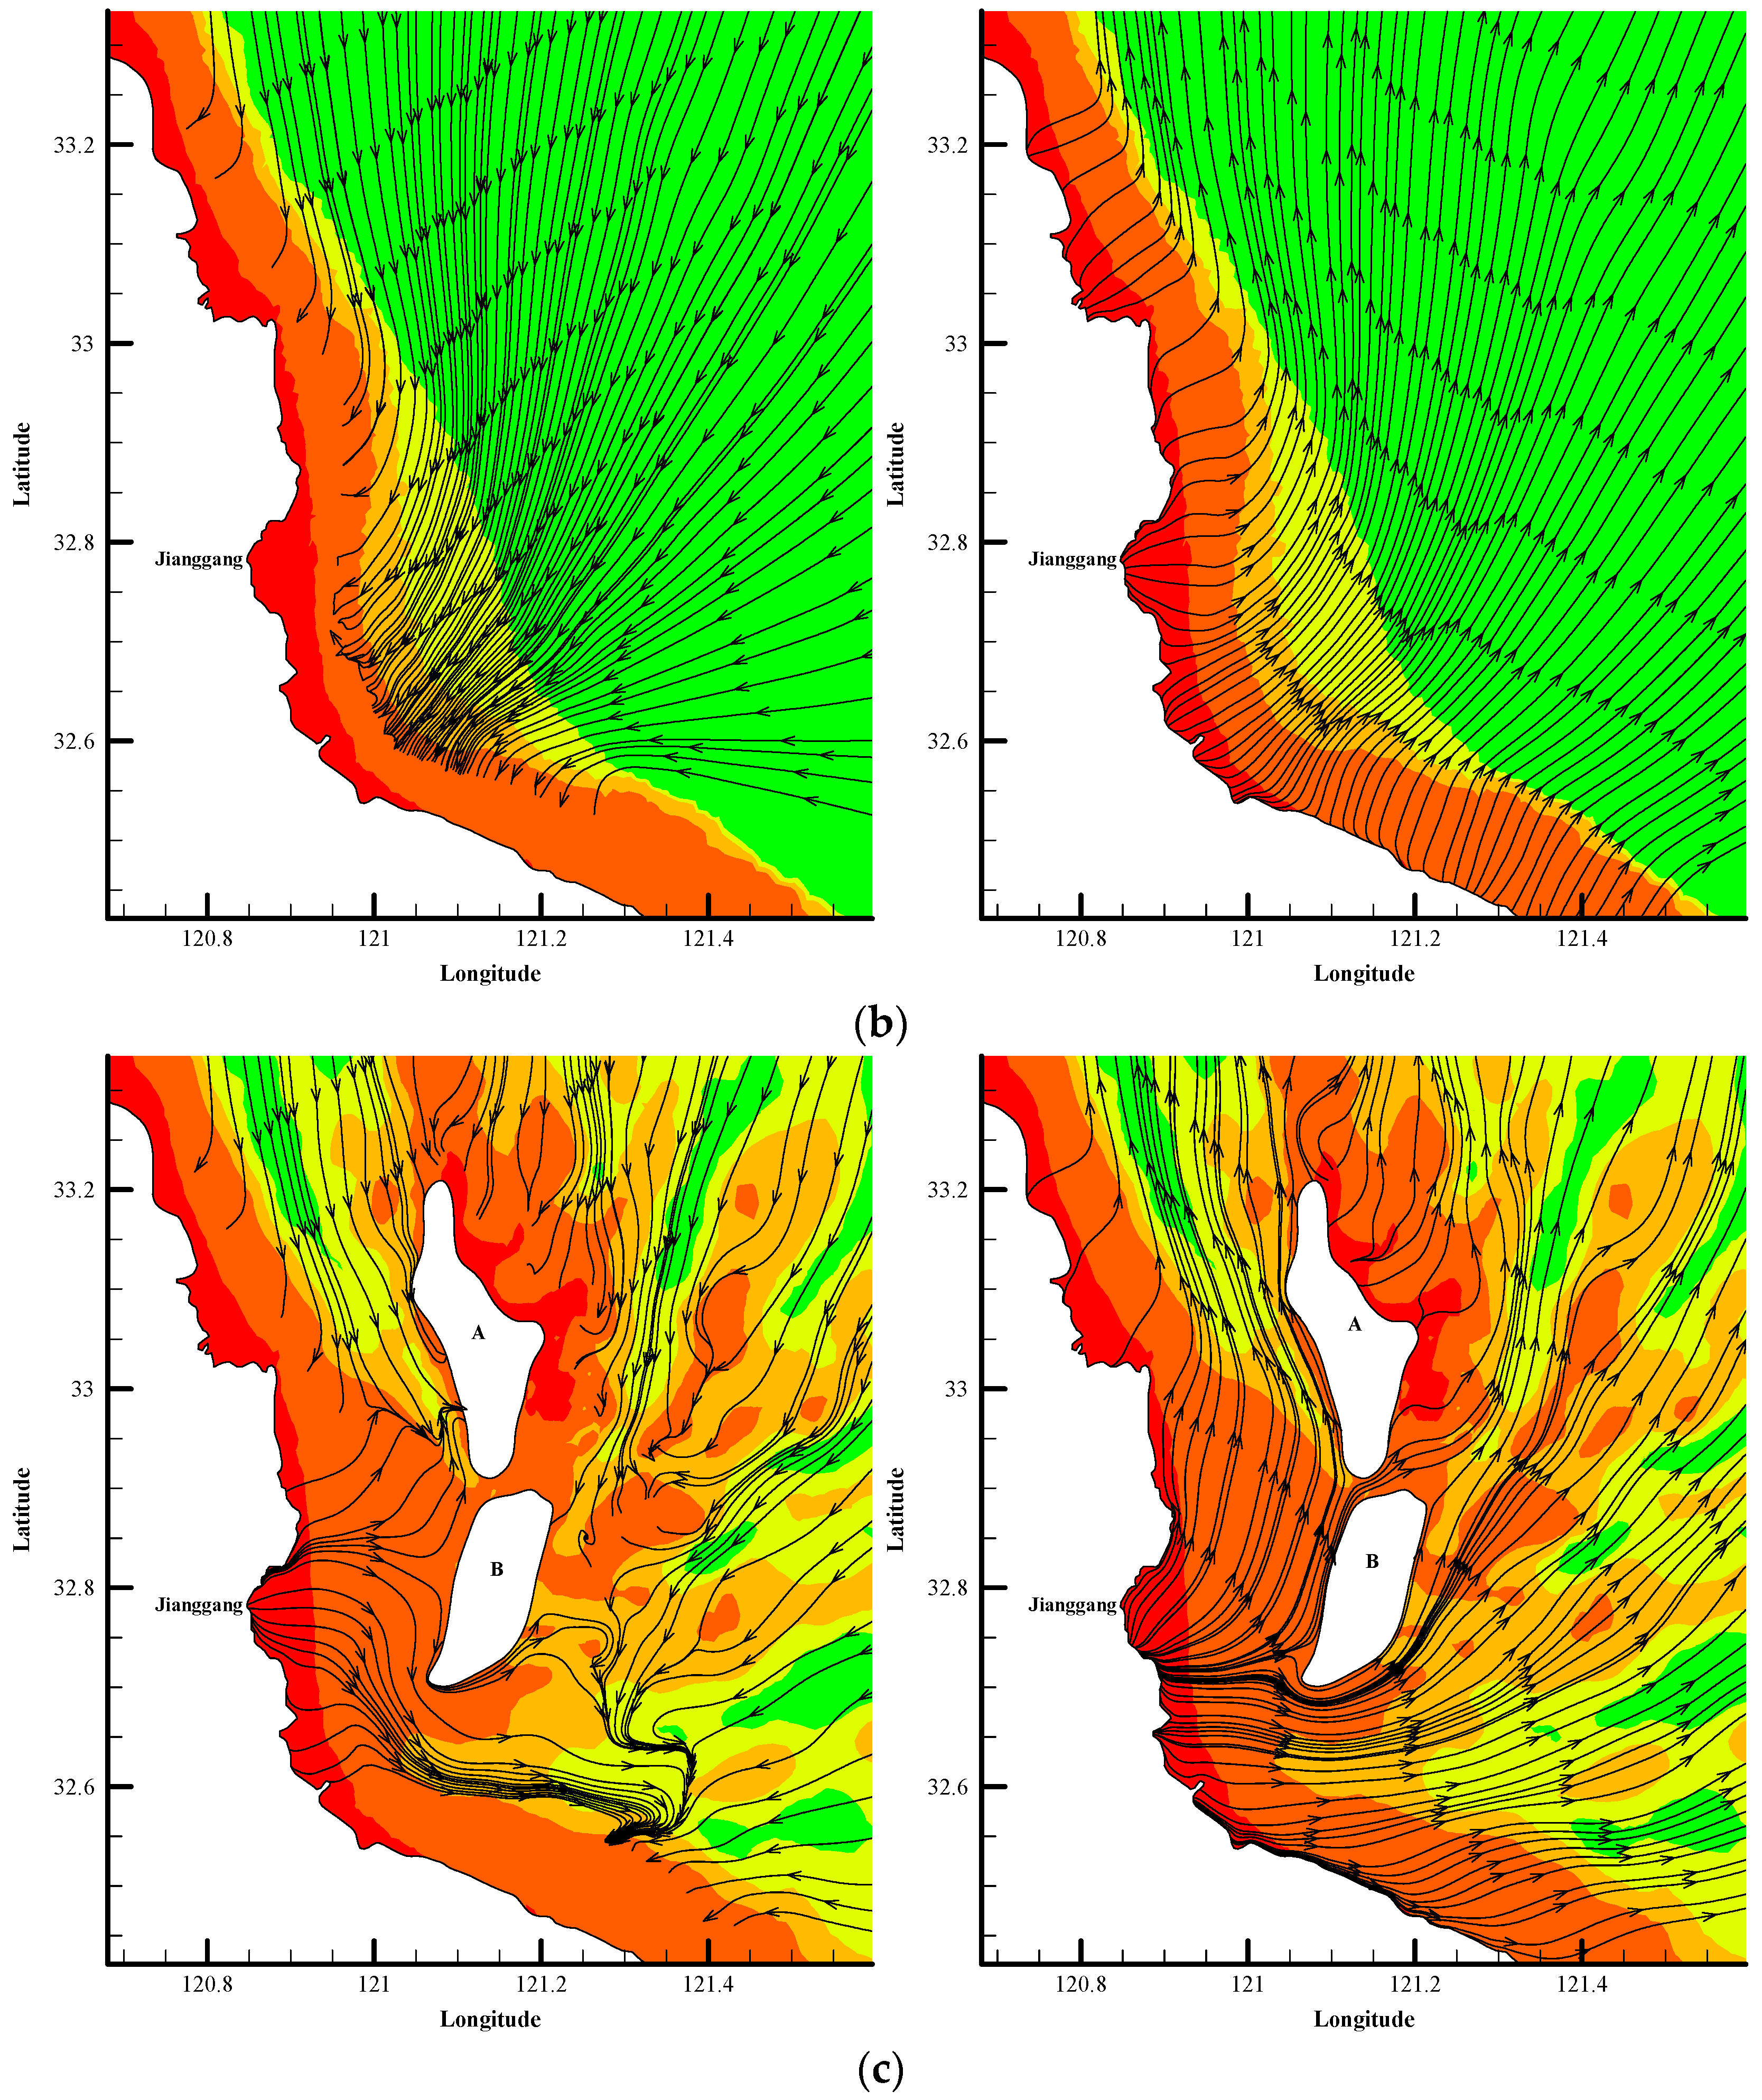
4.2.2. Current Field in Different Topographic Conditions
4.3. Analysis of the Response of the Tidal Current Field to the RSRs
5. Discussion
6. Conclusions
- (1)
- The tidal current is the main driving force for the formation and development of radiant sandbars and plays an important role in the formation of sand ridges.
- (2)
- The timing of the formation of radiant sandbars is different and the previous research results have been shown to be mostly in the order of thousands of years.
- (3)
- When simulating the tidal field under three different terrain conditions, the radial tidal field in the radiated sandbar area is stable and is not controlled by the radiant sandbar form.
- (4)
- The topographical change does not change the distribution pattern of the radial tidal field, but it will have a certain impact on the local flow field. Under the conditions of natural RSRs and partially reclaimed RSRs, the streamline bends and flows around the sand ridge or the reclamation area. Due to the topography blocking, the flow rate on the upstream face of the reclamation area decreases and the flow rate on both sides of the reclamation area increases.
Author Contributions
Funding
Conflicts of Interest
References
- Li, M. Progress of research and development of radial sand ridges. J. Waterw. Harb. 2011, 32, 229–243. [Google Scholar]
- Off, T. Rhythmic linear sand bodies caused by tidal currents. Am. Assoc. Pet. Geol. Bull. 1963, 43, 324–327. [Google Scholar]
- Xia, D.; Liu, Z. The submarine sand ridges in China waters. J. Oceanogr. Huanghai Bohai Seas 1983, 1, 45–56. [Google Scholar]
- Liu, Z.; Xia, D. A preliminary study of tidal current ridges. Oceanol. Limnol. Sin. 1983, 14, 286–296. [Google Scholar]
- Cheng, J.; Gao, S.; Wang, Y.; Min, F. Grain size characteristics of surficial sediments and their response to hydrodynamics over the coastal waters of northern Jiangsu Province. Mar. Geol. Quat. Geol. 2009, 29, 7–12. [Google Scholar] [CrossRef]
- Xia, D.; Liu, Z. Formation mechanism and development conditions of tidal current ridges. Acta Oceanol. Sin. 1984, 6, 361–367. [Google Scholar]
- Zhu, Y.; Chang, R. Explanation of the cause of formation of radial sand ridges in the southern Yellow Sea through numerical simulation of tidal currents. J. Ocean Univ. Qingdao 1997, 2, 90–96. [Google Scholar]
- Zhang, D.; Junlun Zhang, J.; Zhang, C.; Wang, Z. Creation of tidal currents–destruction by storms–restoration of tidal currents—A preliminary explanation for the dynamic mechanism of formation and evolution of the submarine radial sand ridge group in the Yellow Sea. Sci. China 1998, 5, 394–402. [Google Scholar]
- Zhu, Y.; Yan, Y.; Xue, H. A study on the hydrodynamic mechanism of formation and development of radial sand ridges in the southern Yellow Sea—I. Planar characteristics of tidal current movement. Sci. China 1998, 5, 403–410. [Google Scholar]
- Song, Z.; Yan, Y.; Xue, H.; Mao, L. A study on the hydrodynamic mechanism of formation and development of radial sand ridges in the southern Yellow Sea—II. Sectional characteristics of tidal current movement. Sci. China 1998, 5, 411–417. [Google Scholar]
- Zhu, Y.; Chang, R. Sediment dynamics study on the origin of the radial sand ridges in the southern Yellow Sea. Studia Mar. Sin. 2001, 43, 38–50. [Google Scholar]
- Huang, Y.; Wang, W. A study on the dynamic mechanism of the radial sand ridge group off the coast of Jiangsu. Acta Oceanol. Sin. 1987, 9, 209–215. [Google Scholar]
- Liu, Z.; Berné, S.; Saito, Y.; Yu, H.; Trentesaux, A.; Uehara, K.; Wang, X. Internal architecture and mobility of tidal sand ridges in the East China Sea. Cont. Shelf Res. 2007, 27, 1820–1834. [Google Scholar] [CrossRef] [Green Version]
- Yang, C. A study on the cause of formation of radial sand ridges off the coast of Jianggang. Mar. Geol. Quat. Geol. 1985, 3, 35–44. [Google Scholar]
- Zhang, G.W. Formation and evolution of sand ridges in the south Huanghai Sea Shelf. Mar. Geol. Quat. Geol. 1991, 11, 25–35. [Google Scholar]
- Qian, X.; Chen, Y.; Zhang, C.; Pan, Y.; Das, H. Radial tidal current field in a semi-enclosed rectangular basin: formation and evolution. Chin. J. Oceanol. Limnol. 2015, 33, 1085–1099. [Google Scholar] [CrossRef]
- Li, C.; Wang, J.; Li, P. A preliminary study on the sedimentary facies of the Yangtze River Delta. J. Tongji Univ. 1979, 2, 1–14. [Google Scholar]
- Yang, C.S. On the origin of Jianggang radial sand ridges in Yellow Sea. Mar. Geol. Quat. Geol. 1985, 5, 35–44. [Google Scholar]
- Li, C.; Li, B. A study on the cause of formation of ocean banks along the northern coast of Jiangsu. Oceanol. Limnol. Sin. 1981, 4, 321–331. [Google Scholar]
- Zhou, C.; Sun, J. Discussion on the cause of formation of shoals off the northern coast of Jiangsu. Mar. Geol. Res. 1981, 1, 83–91. [Google Scholar]
- Li, M.; Yang, S.; Han, X. On hydro-dynamic sediment problems in the development of deepwater port in radial sandbanks. Port Waterw. Eng. 2011, 4, 1–8. [Google Scholar]
- Zhang, C.; Zheng, J.; Liu, G.; Huang, H. Characteristics of hydrodynamics in the coastal waters of Jiangsu and its response to reclamation projects. J. Econ. Water Resour. 2012, 30, 6–9. [Google Scholar]
- Zhang, C.; Chen, X. Offshore environmental changes and countermeasures in response to large-scale tidal flat reclamation. J. Hohai Univ. 2015, 43, 424–430. [Google Scholar]
- Li, M.; Shi, Z. Numerical modeling study of tidal flow for construction of an artificial island on Xitaiyangsha Shoal at Rudong, Jiangsu Province. China Harb. Eng. 2006, 3, 1–4. [Google Scholar]
- Chen, K.; Lu, P.; Wang, Y. Influence of construction of artificial island in Rudong, Jiangsu upon hydrodynamics, erosion and siltation in surrounding water areas. China Harb. Eng. 2008, 1, 8–12. [Google Scholar]
- Guo, L.; Yang, S. Influence of artificial island construction on hydrodynamics in waters around Rudong. J. Waterw. Harb. 2009, 30, 342–346. [Google Scholar]
- Qi, C.; Liao, Q.; Dong, H.; Yang, J.; Li, J. Analysis of the effects of the wind power plant in the intertidal zone in the offshore radial sand ridge area of Jiangsu on the marine hydrodynamic field. Environ. Pollut. Control 2011, 33, 69–74. [Google Scholar]
- Xing, F.; Wang, Y.P.; Wang, H.V. Tidal hydrodynamics and fine-grained sediment transport on the radial sand ridge system in the southern Yellow Sea. Mar. Geol. 2012, 291, 192–210. [Google Scholar]
- Chen, J.; Zhang, R. Remote sensing of radiate sandbanks dynamics in Jiangsu (China). Mar. Sci. 2004, 28, 77–80. [Google Scholar]
- Chen, L.; Zhang, Y. Analysis of the evolution on tidal flat and their reasons in Dongsha based on remote sensing. In Proceedings of the 2011 IEEE International Conference on Spatial Data Mining and Geographical Knowledge Services, Fuzhou, China, 29 June–1 July 2011; pp. 557–561. [Google Scholar]
- Qi, C.; Wu, W.; Jiang, X.; Wang, Q. Numerical simulation of the impact for offshore wind farm on marine hydrodynamic filed in Xiangshui of Jiangsu. China Harb. Eng. 2014, 4, 6–9. [Google Scholar]
- Tao, J.; Zhang, C.; Yao, J. Effect of large-scale reclamation of tidal flats on tides and tidal currents in offshore areas of Jiangsu Province. J. Hohai Univ. 2011, 39, 225–230. [Google Scholar]
- Tao, J.; Zhang, C. Numerical simulation of water environment for radial sandy ridge area of the Yellow Sea. J. Hohai Univ. 2005, 4, 472–475. [Google Scholar]
- Martyr-Koller, R.C.; Kernkamp HW, J.; van Dam, A.; van der Wegen, M.; Lucas, L.V.; Knowles, N.; Fregoso, T.A. Application of an unstructured 3D finite volume numerical model to flows and salinity dynamics in the San Francisco Bay-Delta. Estuar. Coast. Shelf Sci. 2017, 192, 86–107. [Google Scholar] [CrossRef]
- Richard, A.; Davis, J.K.; Pliny, J. Sedimentology and stratigraphy of tidal sand ridges Southwest Florida inner shelf. J. Sediment. Res. 1993, 63, 91–104. [Google Scholar]
- Huthnance, J.M. On one mechanism forming linear sand banks. Estuar. Coast. Shelf Sci. 1982, 14, 79–99. [Google Scholar] [CrossRef]
- Huthnance, J.M. Tidal current asymmetries over the Norfolk Sandbanks. Estuar. Coast. Mar. Sci. 1973, 1, 89–99. [Google Scholar] [CrossRef]
- Caston, V.N.D. Linear sand banks in the southern North Sea. Sedimentology 1972, 18, 63–78. [Google Scholar] [CrossRef]
- Berne, S.; Lericolais, G.; Marsset, T.; Bourillet, J.F.; De Batist, M. Erosional offshore sand ridges and lowstand shorefaces; examples from tide- and wave-dominated environments of France. J. Sediment. Res. 1998, 68, 540–555. [Google Scholar] [CrossRef]


 signify the measured values;
  signify the simulated values).
signify the measured values; signify the simulated values).
signify the simulated values).
signify the measured values; signify the simulated values).
 signify the measured values; signify the simulated values).
signify the measured values; signify the simulated values).
signify the measured values; signify the simulated values).
 signify the measured values; signify the simulated values).
signify the measured values; signify the simulated values).
signify the measured values; signify the simulated values).


| Tidal Constituent | Point 1 (Lon: 121.82; Lat: 34.56) | Point 2 (Lon: 123.06; Lat: 32.31) | ||
|---|---|---|---|---|
| Amplitude | Phase | Amplitude | Phase | |
| M2 | 0.20 | 119.97 | 1.29 | 86.52 |
| S2 | 0.11 | 162.52 | 0.57 | 114.85 |
| K1 | 0.12 | 256.94 | 0.16 | 50.98 |
| O1 | 0.10 | 196.09 | 0.09 | 26.74 |
| N2 | 0.05 | 115.03 | 0.24 | 67.44 |
| P1 | 0.04 | 252.20 | 0.05 | 46.78 |
| K2 | 0.03 | 164.33 | 0.15 | 117.58 |
| Q1 | 0.02 | 162.30 | 0.01 | 51.32 |
| Verification Error | T1 | T2 | T3 | T4 | T5 |
|---|---|---|---|---|---|
| Measured mean square error | 1.35 | 1.80 | 1.71 | 1.96 | 1.65 |
| Calculated value mean square error | 1.62 | 1.84 | 1.75 | 2.01 | 1.65 |
| Measured value and calculated value correlation coefficient | 0.96 | 0.98 | 0.99 | 0.99 | 0.97 |
| Verification Error | C1 | C2 | C3 | C4 | C5 | C6 | C7 |
|---|---|---|---|---|---|---|---|
| Measured mean square error | 0.57 | 0.44 | 0.39 | 0.50 | 0.38 | 0.35 | 0.29 |
| Calculated value mean square error | 0.61 | 0.42 | 0.47 | 0.52 | 0.50 | 0.42 | 0.35 |
| Measured value and calculated value correlation coefficient | 0.93 | 0.84 | 0.80 | 0.92 | 0.92 | 0.90 | 0.78 |
| Verification Error | C1 | C2 | C3 | C4 | C5 | C6 | C7 |
|---|---|---|---|---|---|---|---|
| Measured mean square error | 90.79 | 101.62 | 86.28 | 98.65 | 101.79 | 94.29 | 101.56 |
| Calculated value mean square error | 92.41 | 97.38 | 94.79 | 85.86 | 90.78 | 87.39 | 86.41 |
| Measured value and calculated value correlation coefficient | 0.80 | 0.71 | 0.74 | 0.70 | 0.92 | 0.80 | 0.89 |
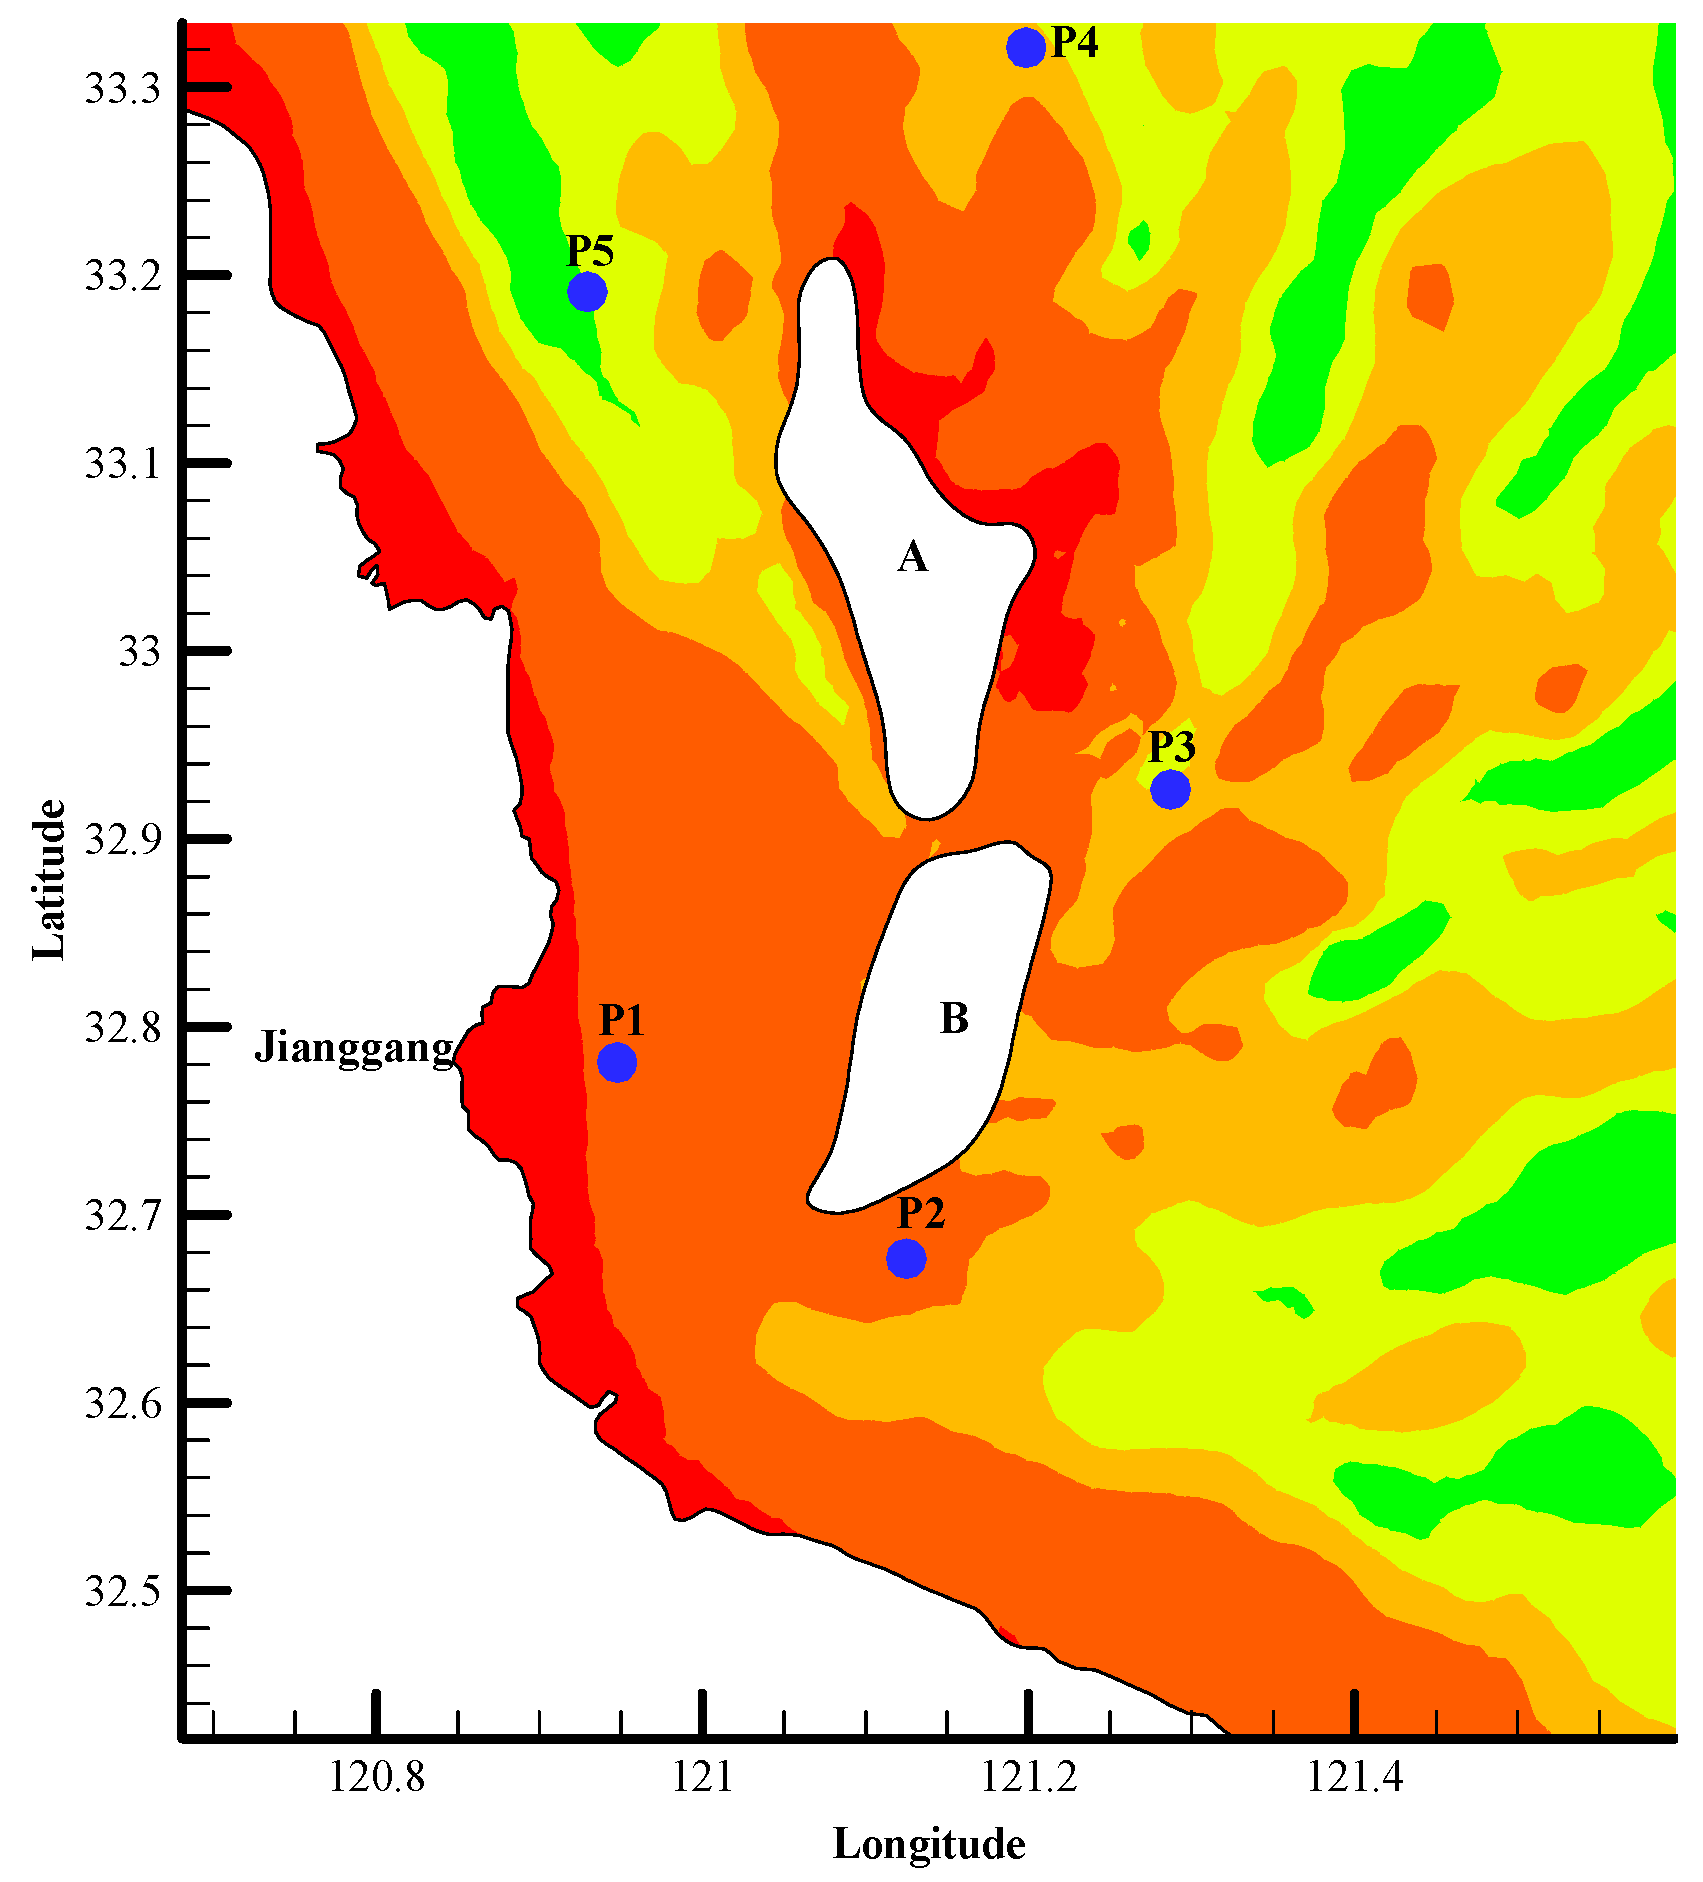
| Point | Natural RSRs | No RSRs | Partially Reclaimed RSRs | |||
|---|---|---|---|---|---|---|
| Maximum Ebb | Maximum Flood | Maximum Ebb | Maximum Flood | Maximum Ebb | Maximum Flood | |
| P1 | 0.65 | 0.36 | 1.15 | 0.43 | 0.55 | 0.38 |
| P2 | 1.04 | 0.74 | 0.83 | 0.62 | 1.38 | 0.82 |
| P3 | 1.66 | 0.76 | 1.07 | 0.93 | 1.34 | 0.66 |
| P4 | 1.50 | 1.85 | 1.65 | 1.60 | 1.40 | 1.81 |
| P5 | 2.29 | 1.39 | 1.34 | 1.45 | 2.08 | 1.40 |
© 2019 by the authors. Licensee MDPI, Basel, Switzerland. This article is an open access article distributed under the terms and conditions of the Creative Commons Attribution (CC BY) license (http://creativecommons.org/licenses/by/4.0/).
Share and Cite
Qi, C.; Ma, L.; Wang, Q.; Zhai, Y.; Li, J.; Zhang, H. A Study on the Response of the Hydrodynamic Environment to the Morphology of Radial Sand Ridges in the Coastal Waters of Jiangsu. Water 2019, 11, 2190. https://doi.org/10.3390/w11102190
Qi C, Ma L, Wang Q, Zhai Y, Li J, Zhang H. A Study on the Response of the Hydrodynamic Environment to the Morphology of Radial Sand Ridges in the Coastal Waters of Jiangsu. Water. 2019; 11(10):2190. https://doi.org/10.3390/w11102190
Chicago/Turabian StyleQi, Changjun, Lejun Ma, Qinggai Wang, Yuan Zhai, Jixuan Li, and Hanwen Zhang. 2019. "A Study on the Response of the Hydrodynamic Environment to the Morphology of Radial Sand Ridges in the Coastal Waters of Jiangsu" Water 11, no. 10: 2190. https://doi.org/10.3390/w11102190